
Second Quarter 2008
Financial and Operating Results
For the period ended June 30, 2008
Conseco, Inc.

Forward-Looking Statements
Cautionary Statement Regarding Forward-Looking Statements. Our statements, trend analyses and other information contained in these
materials relative to markets for Conseco’s products and trends in Conseco’s operations or financial results, as well as other statements, contain
forward-looking statements within the meaning of the federal securities laws and the Private Securities Litigation Reform Act of 1995. Forward-
looking statements typically are identified by the use of terms such as “anticipate,” “believe,” “plan,” “estimate,” “expect,” “project,” “intend,”
“may,” “will,” “would,” “contemplate,” “possible,” “attempt,” “seek,” “should,” “could,” “goal,” “target,” “on track,” “comfortable with,” “optimistic” and
similar words, although some forward-looking statements are expressed differently. You should consider statements that contain these words
carefully because they describe our expectations, plans, strategies and goals and our beliefs concerning future business conditions, our results
of operations, financial position, and our business outlook or they state other ‘‘forward-looking’’ information based on currently available
information. Assumptions and other important factors that could cause our actual results to differ materially from those anticipated in our forward-
looking statements include, among other things: (i) general economic, market and political conditions, including the performance and
fluctuations of the financial markets which may affect our ability to raise capital or refinance our existing indebtedness; (ii) our ability to obtain
adequate and timely rate increases on our supplemental health products including our long-term care business; (iii) mortality, morbidity, the
increased cost and usage of health care services, persistency, the adequacy of our previous reserve estimates and other factors which may
affect the profitability of our insurance products; (iv) changes in our assumptions related to the cost of policies produced or the value of policies
inforce at the Effective Date; (v) the recoverability of our deferred tax asset and the effect of potential tax rate changes on its value; (vi) changes
in accounting principles and the interpretation thereof; (vii) our ability to achieve anticipated expense reductions and levels of operational
efficiencies including improvements in claims adjudication and continued automation and rationalization of operating systems; (viii) performance
and valuation of our investments, including the impact of realized losses (including other-than-temporary impairment charges); (ix) our ability to
identify products and markets in which we can compete effectively against competitors with greater market share, higher ratings, greater
financial resources and stronger brand recognition; (x) the ultimate outcome of lawsuits filed against us and other legal and regulatory
proceedings to which we are subject; (xi) our ability to remediate the material weakness in internal controls over the actuarial reporting process
that we identified at year-end 2006 and to maintain effective controls over financial reporting; (xii) our ability to continue to recruit and retain
productive agents and distribution partners and customer response to new products, distribution channels and marketing initiatives; (xiii) our
ability to achieve eventual upgrades of the financial strength ratings of Conseco and our insurance company subsidiaries as well as the potential
impact of rating downgrades on our business; (xiv) the risk factors or uncertainties listed from time to time in our filings with the Securities and
Exchange Commission; (xv) our ability to continue to satisfy the financial ratio and balance requirements and other covenants of our debt
agreements; (xvi) regulatory changes or actions, including those relating to regulation of the financial affairs of our insurance companies, such
as the payment of dividends to us, regulation of financial services affecting (among other things) bank sales and underwriting of insurance
products, regulation of the sale, underwriting and pricing of products, and health care regulation affecting health insurance products; (xvii)
changes in the Federal income tax laws and regulations which may affect or eliminate the relative tax advantages of some of our products; and
(xviii) the receipt of regulatory approval and consummation of the plan to transfer Conseco Senior Health Insurance Company to an independent
trust. Other factors and assumptions not identified above are also relevant to the forward-looking statements, and if they prove incorrect, could
also cause actual results to differ materially from those projected. All written or oral forward-looking statements attributable to us are expressly
qualified in their entirety by the foregoing cautionary statement. Our forward-looking statements speak only as of the date made. We assume
no obligation to update or to publicly announce the results of any revisions to any of the forward-looking statements to reflect actual results,
future events or developments, changes in assumptions or changes in other factors affecting the forward-looking statements.
2

Non-GAAP Measures
This presentation contains the following financial measures that differ from the comparable measures
under Generally Accepted Accounting Principles (GAAP): operating earnings measures; book value
excluding accumulated other comprehensive income (loss) per diluted share; operating return measures;
earnings before net realized investment gains (losses) and corporate interest and taxes; debt to capital
ratios, excluding accumulated other comprehensive income (loss); and interest-adjusted benefit ratios.
Reconciliations between those non-GAAP measures and the comparable GAAP measures are included
in the Appendix, or on the page such measure is presented.
While management believes these measures are useful to enhance understanding and comparability of
our financial results, these non-GAAP measures should not be considered substitutes for the most
directly comparable GAAP measures.
Additional information concerning non-GAAP measures is included in our periodic filings with the
Securities and Exchange Commission that are available in the “Investor – SEC Filings” section of
Conseco’s website, www.conseco.com.
3

Q2 2008 Summary
4
CNO
Announced plan to execute most significant element of
strategic alternatives: separation of CSHI LTC Block
All four segments profitable, with each improving over Q1 2008
$85.6 million quarterly sales for CNO
Bankers sales excluding PFFS up 9% over Q2 2007
Strong Colonial Penn sales growth of 29%
CIG sales down, but specified disease up 29%
Continued improved performance in LTC Closed Block
Bankers results disappointing
PFFS and Medicare Supplement
LTC

Q2 2008 Summary
5
CNO
Investment portfolio earned yields meeting expectations and
impairment losses consistent with industry trends and market
conditions
Results continue to stabilize
No significant out-of-period adjustments
No extraordinary DAC or VOBA (intangibles) charges
Fourth consecutive stable quarter in LTC Closed Block
Completed Chicago facilities consolidation in Q2; pre-tax
charge of approximately $9.6 million, vs $15 million original
estimate
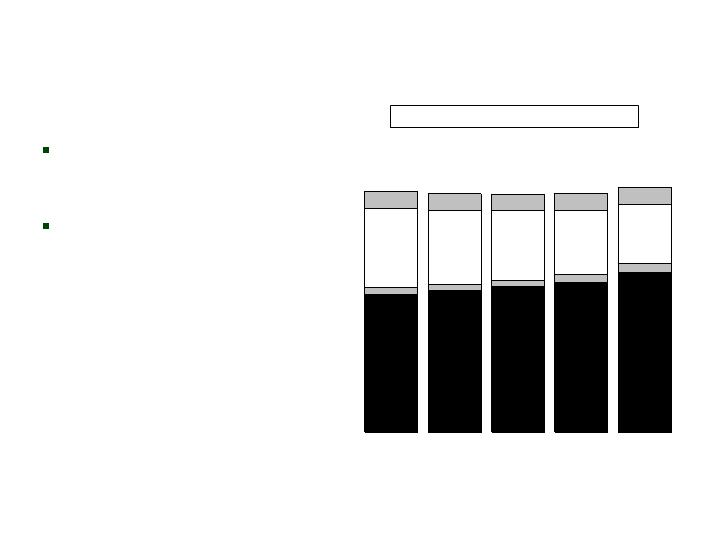
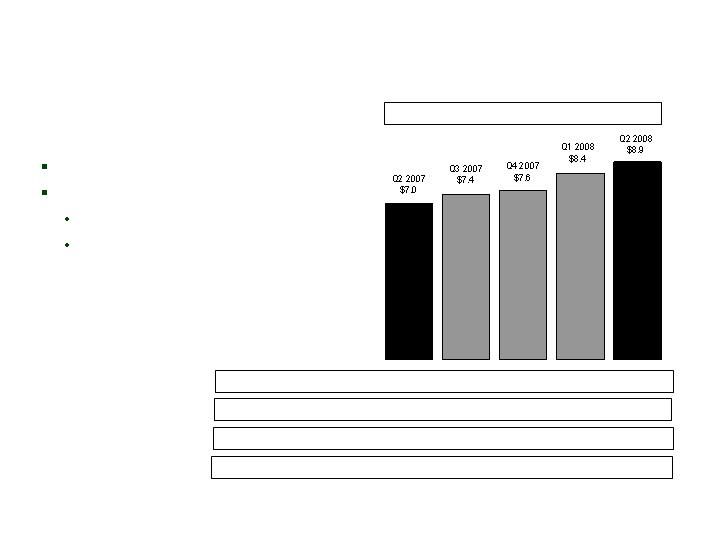
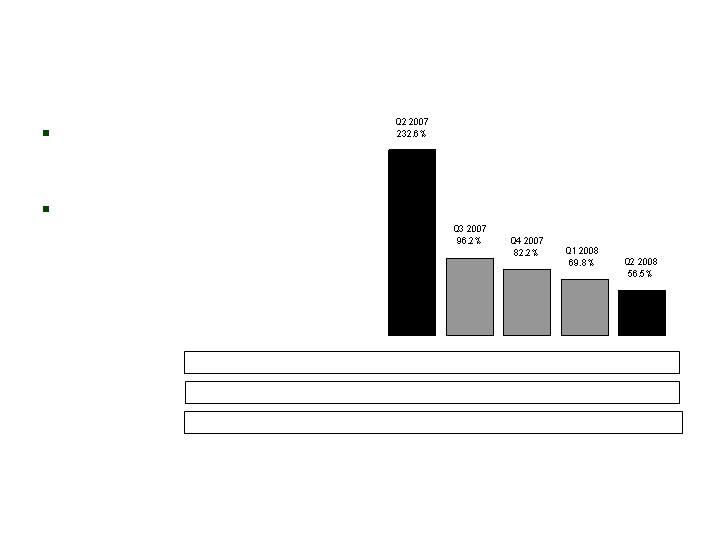
Collected Premiums
6
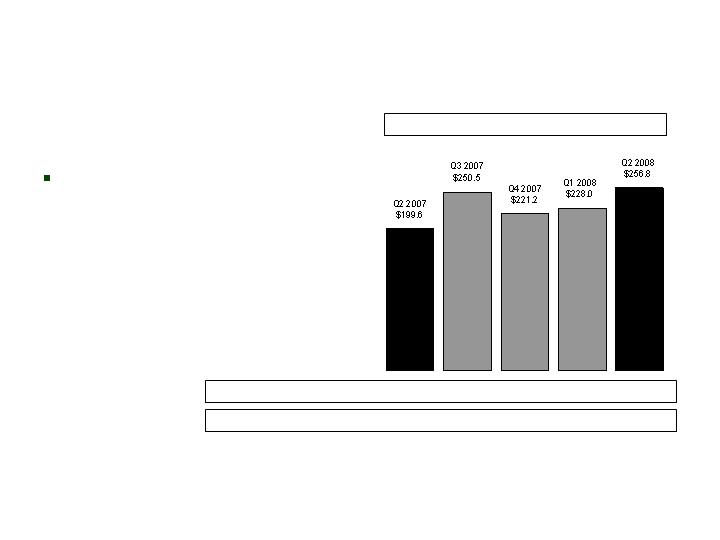
CNO
Strong, consistent
growth in Bankers
and Colonial Penn
Decline in CIG due
to focus on more
profitable business
BLC
Q2 2007
$4,366.8
Q3 2007
$4,315.1
Q4 2007
$4,314.1
Q1 2008
$4,322.3
($ millions)
CP
CIG
Run-Off
Collected Premiums-Trailing 4 Quarters
Q2 2008
$4,428.4

Bankers Life
Colonial Penn
Conseco Insurance Group
LTC Run-off Block
Corporate and interest expense
Income before net realized investment losses**
Net realized investment losses
Total
Earnings before net realized investment loss
and valuation allowance for deferred tax assets,
per diluted share (a non-GAAP measure)***
Q2 2008
Summary of Results
7
CNO
$34.6
8.3
30.0
12.2
(32.4)
52.7
(231.6)
$(178.9)
Pre-Tax
After Tax*
EPS*
($ millions, except per share amounts)
$(336.6)
(150.5)
$(487.1)
$(1.82)
(0.82)
$(2.64)
$0.18
*Income tax expense includes $370 million ($2.00 per diluted share) increase in deferred tax valuation allowance.
**Management believes that an analysis of earnings before net realized investment gains (losses) and taxes (a
non-GAAP financial measure) provides an alternative measure of the operating results of the company
because it excludes net realized gains (losses) that are unrelated to the company’s underlying fundamentals.
The chart above provides a reconciliation to the corresponding GAAP measure.
***See Appendix for a reconciliation to the corresponding GAAP measure.

Q2 2008: Impact of
CSHI Transaction
8
CNO Consolidated
($ millions, except per share amounts)
EBIT
Net income
(loss) as
reported
Impact of CSHI
transaction
Net realized
investment
losses
Net operating
earnings before
valuation
allowance for
deferred tax
assets
Bankers Life
34.6
$
34.6
$
Colonial Penn
8.3
8.3
Conseco Insurance Group
30.0
30.0
Other Business in Run-off
12.2
12.2
Corporate operations, excluding corporate interest expense
(18.5)
(18.5)
Total EBIT
66.6
66.6
Corporate interest expense
(13.9)
(13.9)
Income before net realized investment losses and taxes
52.7
52.7
Tax expense on period income
19.3
19.3
Net income before net realized investment losses and
33.4
33.4
valuation allowance for deferred tax assets
Valuation allowance for deferred tax assets
370.0
(370.0)
-
Net operating income (loss)
(336.6)
370.0
33.4
Net realized investment losses, net of related amortization and taxes
(150.5)
133.7
16.8
-
Total
(487.1)
$
503.7
$
16.8
$
33.4
$
Impact on fully diluted EPS
(2.64)
$
2.73
$
0.09
$
0.18
$

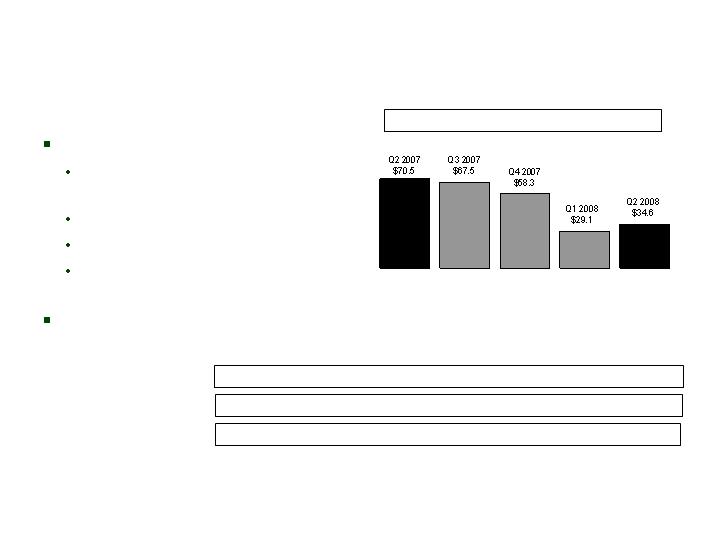
Q2 Earnings
9
CNO Consolidated
*Management believes that an analysis of earnings before net realized investment gains (losses) and corporate
interest and taxes (“EBIT,” a non-GAAP financial measure) provides an alternative measure to compare the
operating results of the company quarter-over-quarter because it excludes: (1) corporate interest expense; and
(2) net realized gains (losses) that are unrelated to the company’s underlying fundamentals. The chart above
provides a reconciliation of EBIT to net income applicable to common stock.
($ millions)
Q2 2007
(Restated)
Q1 2008
Q2 2008
Bankers Life
$70.5
$29.1
$34.6
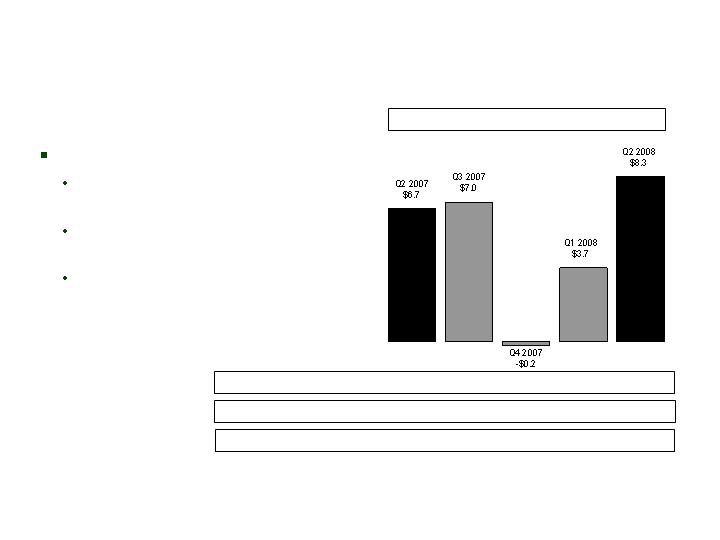
Colonial Penn
6.7
3.7
8.3
Conseco Insurance Group
43.3
23.3
30.0
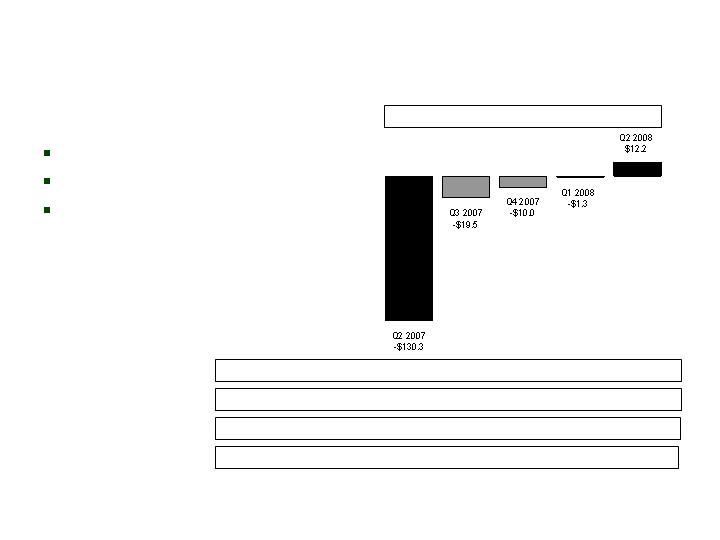
Other Business in Run-Off
(130.3)
(1.3)
12.2
Corporate operations, excluding interest expense
(8.0)
(6.7)
(18.5)
EBIT, excluding costs related to a litigation settlement
(17.8)
48.1
66.6
Costs related to a litigation settlement
(35.0)
0.0
0.0
Total EBIT*
(52.8)
48.1
66.6
Corporate interest expense
(16.9)
(16.4)
(13.9)
Income (loss) before net realized investment losses and taxes
(69.7)
31.7
52.7
Tax expense (benefit) on period income
(24.6)
11.0
19.3
Net income (loss) before net realized investment losses and
valuation allowance for deferred tax assets
(45.1)
20.7
33.4
Preferred stock dividends
(4.6)
0.0
0.0
Net operating income (loss) before net realized investment losses
and valuation allowance for deferred tax assets
(49.7)
20.7
33.4
Valuation allowance for deferred tax assets
0.0
0.0
370.0
Net operating income (loss)
(49.7)
20.7
(336.6)
Net realized investment losses, net of related amortization and taxes
(10.1)
(26.5)
(150.5)
Net income (loss) applicable to common stock
($59.8)
($5.8)
($487.1)

Operating ROE
10
CNO
Operating ROE*, Trailing 4 Quarters
Operating ROE (Before Litigation Settlement Charges,
Coinsurance Transaction and Tax Valuation Allowance)**,
Trailing 4 Quarters
*Operating return excludes net realized
investment gains (losses). Equity excludes
accumulated other comprehensive income
(loss) and the value of net operating loss
carryforwards, and assumes conversion of
preferred stock. See Appendix for
corresponding GAAP measure.
**Operating return, as calculated and defined
on the left side of this page, but before: (1) Q2
2006 charge related to the litigation settlement
and refinements to such estimates recognized
in subsequent periods; (2) Q3 2007 charge
related to a coinsurance transaction; and (3) Q4
2007 and Q2 2008 valuation allowance for
deferred tax assets. See Appendix for
corresponding GAAP measure.
Conseco’s goal is to improve Operating ROE to 11% in 2009

Q2 Pro Forma
ROE Calculation
11
CNO Consolidated
*Earnings impact $1,157.3
Unrealized losses (AOCI) (129.9)
Equity impact $1,027.4
*
Total expected
Transaction
Before transaction
transaction
Pro forma as if
As reported
charges recorded
charges recorded
charges
the transactions
in Q2 2008
in Q2 2008
in Q2 2008
to equity
had been completed
Net income
(487.1)
503.7
16.6
16.6
Adjustments to determine operating earnings
Net realized losses (gains)
150.5
(133.7)
16.8
16.8
Increase to tax valuation allowance
370.0
(370.0)
0.0
0.0
Operating earnings before increase to deferred
tax valuation allowance
33.4
0.0
33.4
33.4
Equity
3,382.1
373.8
3,755.9
(1,027.4)
2,728.5
Annualized ROE
4.0%
3.6%
4.9%
Adjustments
Accumulated other comprehensive loss (income)
639.2
129.9
769.1
(129.9)
639.2
Net operating loss carryforwards included in
deferred tax assets
(1,137.2)
(298.0)
(1,435.2)
298.0
(1,137.2)
Adjusted equity
2,884.1
205.7
3,089.8
(859.3)
2,230.5
Annualized Adjusted ROE
4.6%
4.3%
6.0%
Change
0.3%
1.7%
Operating EPS (Diluted)
12
CNO
Operating EPS (Before Litigation Settlement
Charges, Coinsurance Transaction and Tax
Valuation Allowance)**
**Operating earnings per share, before: (1) Q2
2006 charge related to the litigation settlement and
refinements to such estimates recognized in
subsequent periods; (2) Q3 2007 charge related to
a coinsurance transaction; and (3) Q4 2007 and Q2
2008 valuation allowance for deferred tax assets.
See Appendix for corresponding GAAP measure.
Operating EPS*
*Operating earnings per share exclude net
realized investment gains (losses). See Appendix
for corresponding GAAP measure.

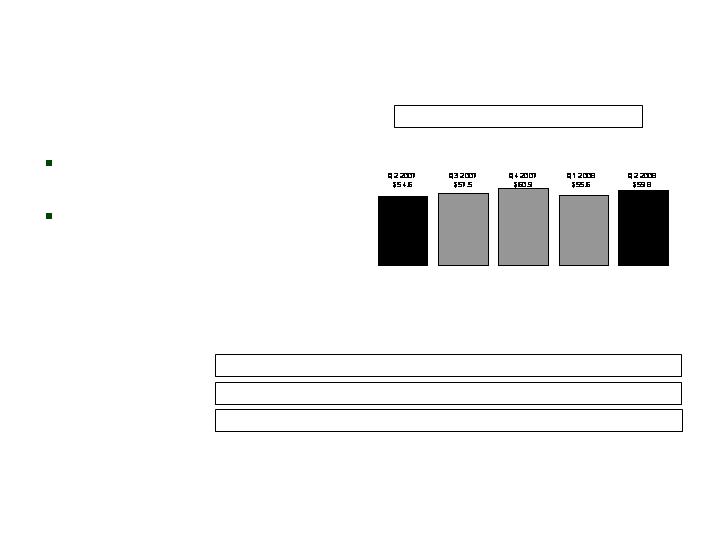
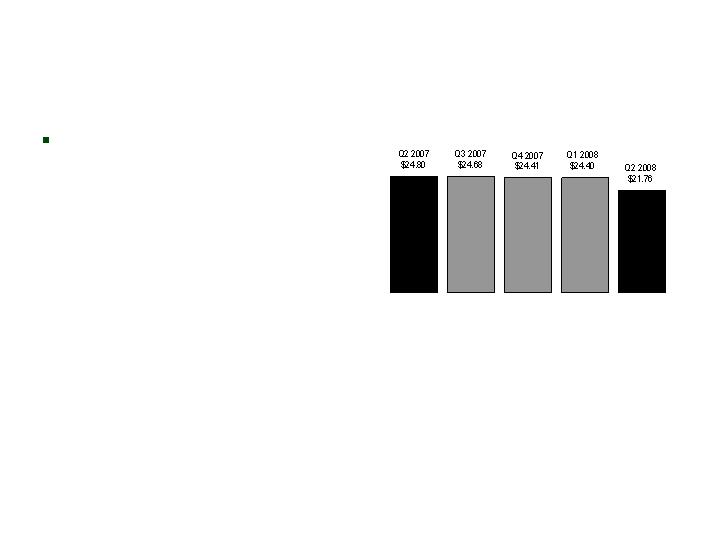
Book value per diluted share (excluding accumulated other comprehensive loss)
$21.76 at 6/30/08 vs $24.41 at 12/31/07
Pro forma $18.22 at 6/30/08**
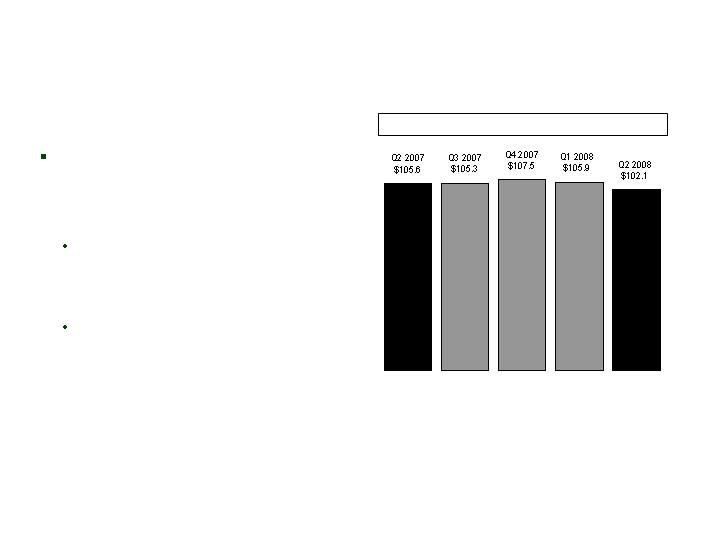
Debt to total capital ratio (excluding accumulated other comprehensive loss)
23% at 6/30/08 vs 21% at 12/31/07
Pro forma 28% at 6/30/08**
Consolidated RBC ratio
271% at 6/30/08 vs 296% at 12/31/07
Pro forma RBC is expected to increase by approximately 10 percentage points**
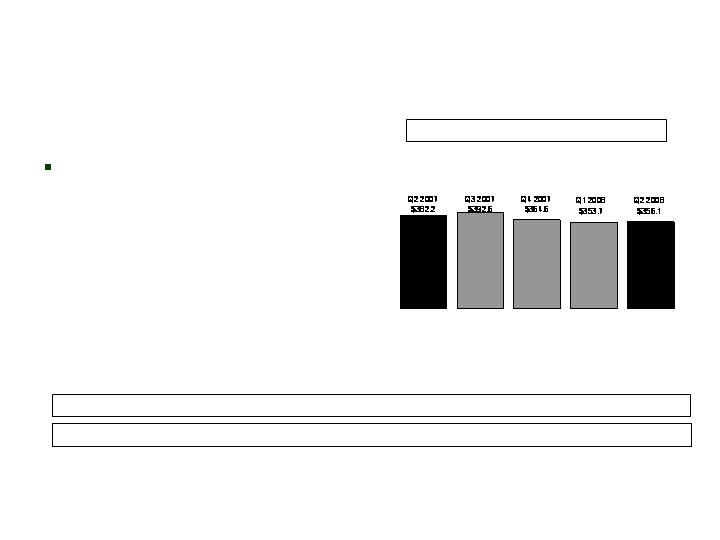
Investments
Key indicators consistent with expectations
$356.1 million of investment income in Q2 2008
Earned yield of 5.82% in Q2 2008
94% of bonds investment grade at 6/30/08***
Gross unrealized losses of $1,214.3 million at 6/30/08 reflects widened credit spreads in numerous
markets***
Financial Indicators*
13
CNO
*See appendix for detail on these indicators, including notes describing non-GAAP measures.
**Pro forma indicators are calculated as if the proposed transaction to transfer CSHI to an Independent Trust
was completed at June 30, 2008.
***Excludes investments from consolidated variable interest entity.
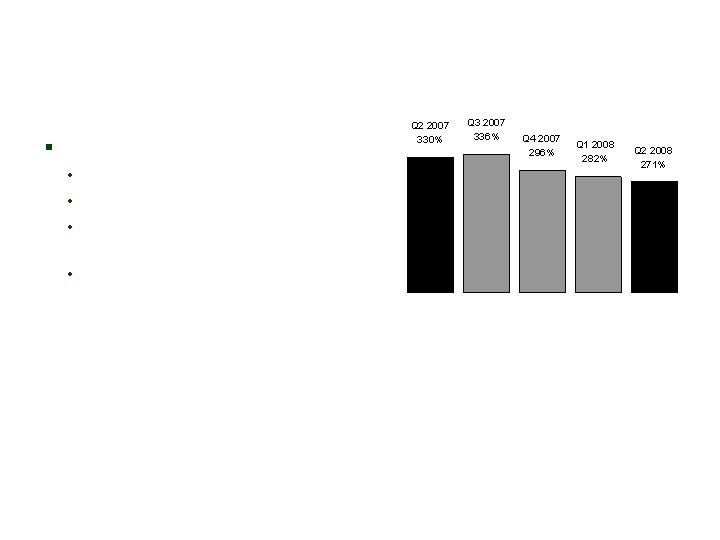
Consolidated RBC Ratio*
14
CNO
Decrease due primarily to:
Business growth
Statutory reserve pivoting
Changes in interest rate
environment
Impairments
*Risk-Based Capital (“RBC”) requirements provide a tool for insurance regulators to determine the levels of
statutory capital and surplus an insurer must maintain in relation to its insurance and investment risks. The
RBC ratio is the ratio of the statutory consolidated adjusted capital of our insurance subsidiaries to RBC.

Corporate liquidity
Available holding company liquidity in excess of $104 million at 6/30/08,
plus $80 million revolver
Sources of and uses of funds, excluding insurance subsidiary dividends
Liquidity: Holding Company
Sources and Uses of Funds
15
CNO
($ millions)
Sources:
Interest on Surplus Debentures
Net Fees for Services Provided Under Intercompany Agreements
Uses:
Interest Expense on Corporate Debt
Operating Expenses
Net Impact
2007
$69.9
92.9
(72.3)
(42.9)
$47.6
YTD 2008
$28.7
43.1
(30.3)
(33.8)
$7.7

Earnings disappointing, although improved over Q1 2008
Q2 2008 earnings negatively affected by:
Increase in interest-adjusted benefit ratio on LTC policies, driven by
increased frequency leading to higher claim expenses
Changes to prior period claim estimates for PFFS quota share
Slight increase in Medicare supplement loss ratio
FAS 133 accounting treatment for embedded liability option in EIAs
Strong Q2 2008 sales (excluding PFFS)
Up 9% vs Q2 2007; strong annuity, Medicare supplement and life sales
Total Q2 2008 NAP of $53 million, 30% below year-earlier quarter
primarily due to 2Q 2007’s extended PFFS open enrollment period
Q2 Summary
16
Bankers

Holistic, strategic approach to this important product line
In force pricing
Claims management
Underwriting and risk selection
New product design and pricing
LTC: Challenges Being Addressed
17
Bankers

New round (Round Three) of re-rate filings underway on
largest (legacy) block
Filing for additional 35% rate increase (35% increase filed in 2006)
Rate increases on 155,000 policies
Expect to submit filings for increases totaling approximately $100
million and receive about $70 million of approvals, with expected
annual financial impact of approximately $50 million
Filings began 8/1/08; expect to complete filings in Q3 2008 and begin
implementation in Q4 2008
Current round of re-rates (Round Two)
Continue to pursue over $10 million on existing filings
LTC: Re-Rate Actions
18
Bankers

Strong focus on claims management
Organizational re-alignment and transfer of two key operational people
from Closed Block
Protocol changes: 90-day project underway, supported by LTCG
Process changes
Underwriting
New products with updated underwriting guidelines
Expand use of cognitive impairment test (EMST) on Home Health Care
beginning in October
New products
Revised version of current products ready in early 2009
LTC/annuity combo product to be released in mid-2009
LTC:
Claims/Underwriting/Products
19
Bankers

Equity-index annuity SEC proposal
Bankers is positioned to handle securities sales through our Registered
Representatives currently in nearly all our branches
Nearly 50% of annuity sales are fixed annuity products not subject to
SEC proposal
Do not expect an impact on total annuity sales
Upcoming Medicare changes
New marketing guidelines already incorporated into sales model
Coventry anticipates that networks will be available for upwards of 80%
of current PFFS enrollees (an additional 8-12% are in rural areas where
new network requirement may not apply)
Expanding PPO/HMO relationships
Developing strategies for new Medicare supplement plans to go into
effect in mid-2010 as part of MIPPA legislation
Industry Developments
20
Bankers

Sales (excluding PFFS) are up 9% vs Q2 2007
Strong sales of annuities (+30%), Medicare Supplement (+16%), and life (+8%),
partially offset by lower LTC sales (-16%)
Fundamentals of agent productivity and agent force growth remain
strong
4,680 agents at 6/30/08, up 5% vs 6/30/07
8% YTD growth in new agents
8% YTD growth in productive agents*
Economic slowdown has not impacted Bankers’ ability to recruit and
retain agents
During Q2 2008, we added another PFFS group case (not reflected in
NAP results) that is expected to contribute an estimated $130 million
in premium for 2008
Q2 2008 Sales and
Distribution Results
21
Bankers
*Agents who have sold 4+ policies or earned $2,000+ in commissions per month during the most recent 12
months.
NAP Growth
Continued strong sales
momentum (excluding PFFS)
Agent force fundamentals
remain intact
Bankers
22
($ millions)
Quarterly NAP-Excluding PFFS
NAP-Quarterly: $76.8 $56.6 $58.3 $114.6 $53.4
PFFS NAP-Quarterly: $22.2 $(0.9) $(2.6) $59.0 $(6.4)
Non-PFFS NAP-Quarterly: $54.6 $57.5 $60.9 $55.6 $59.8

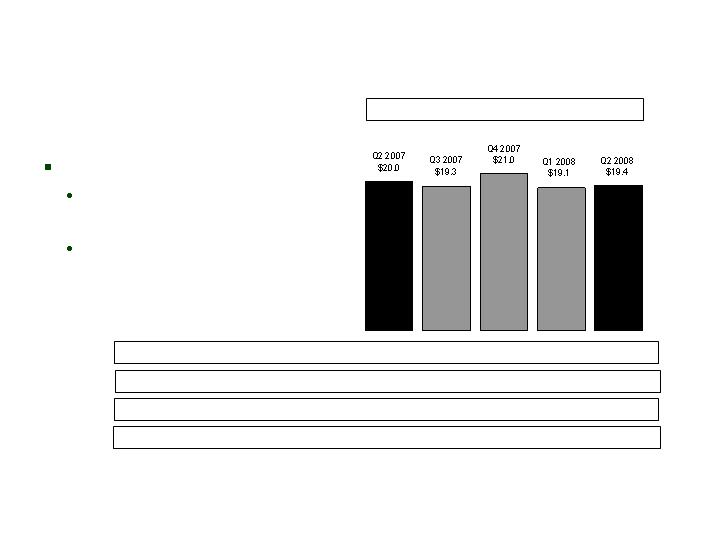
Q2 Earnings
23
Bankers
Management believes that an analysis of income (loss) before net realized investment gains (losses), net of
related amortization (a non-GAAP financial measure), is important to evaluate the financial performance of our
business, and is a measure commonly used in the life insurance industry. Management uses this measure to
evaluate performance because realized gains or losses can be affected by events that are unrelated to a
company’s underlying fundamentals. The chart on Page 9 reconciles the non-GAAP measure to the
corresponding GAAP measure. See Appendix for a reconciliation of the return on equity measure to the
corresponding GAAP measure.
Trailing 4 Quarter Operating Return on Equity: 8.1%
($ millions)
Q2 2007
(Restated)
Q1 2008
Q2 2008
Insurance policy income
$424.0
$497.0
$543.4
Net investment income
155.1
129.3
135.2
Fee revenue and other income
2.7
1.6
2.1
Total revenues
581.8
627.9
680.7
Insurance policy benefits
338.2
438.5
497.2
Amounts added to policyholder account balances
58.6
41.2
37.2
Amortization related to operations
69.2
75.0
66.6
Other operating costs and expenses
45.3
44.1
45.1
Total benefits and expenses
511.3
598.8
646.1
Income before net realized investment gains (losses), net of
related amortization and income taxes
$70.5
$29.1
$34.6

Q2 2008 NAP of $14 million, 29% above Q2 2007
Earnings up 24% from Q2 2007
Higher life margins, net of DAC/VOBA amortization, arising from
recapture of mod-co treaty in Q4 2007
Higher life margins, net of DAC amortization, arising from sales
expansion efforts
Partially offset by higher life claims volumes in 2008
Q2 Summary
24
Colonial Penn

Q2 Earnings
25
Colonial Penn
Management believes that an analysis of income (loss) before net realized investment gains (losses), net of
related amortization (a non-GAAP financial measure), is important to evaluate the financial performance of our
business, and is a measure commonly used in the life insurance industry. Management uses this measure to
evaluate performance because realized gains or losses can be affected by events that are unrelated to a
company’s underlying fundamentals. The chart on Page 9 reconciles the non-GAAP measure to the
corresponding GAAP measure. See Appendix for a reconciliation of the return on equity measure to the
corresponding GAAP measure.
Trailing 4 Quarter Operating Return on Equity: 9.6%
($ millions)
Q2 2007
Q1 2008
Q2 2008
Insurance policy income
$29.4
$44.4
$47.5
Net investment income
9.4
9.2
10.1
Fee revenue and other income
0.1
0.3
0.5
Total revenues
38.9
53.9
58.1
Insurance policy benefits
23.9
35.0
35.5
Amounts added to policyholder account balances
0.3
0.3
0.3
Amortization related to operations
4.9
7.4
7.4
Other operating costs and expenses
3.1
7.5
6.6
Total benefits and expenses
32.2
50.2
49.8
Income before net realized investment gains (losses) and
income taxes, net of related amortization
$6.7
$3.7
$8.3

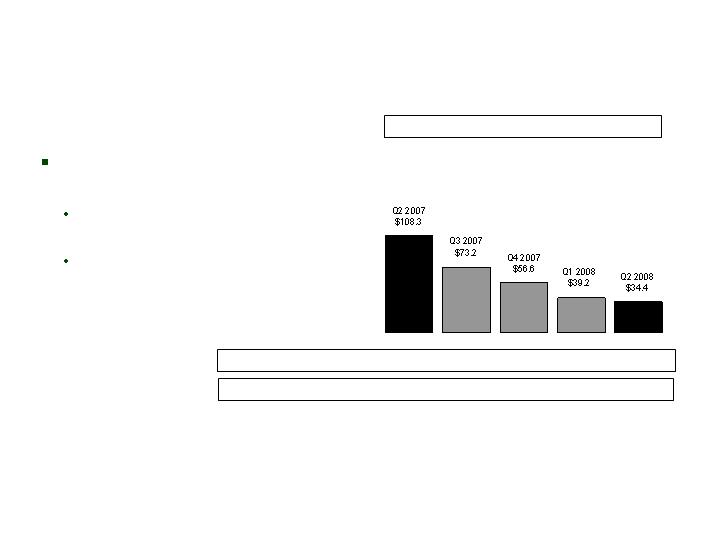
Q2 2008 NAP of $18 million, 9% less than Q2 2007
Strong sales gains in specified disease, up 29% from Q2 2007
Decreases in Medicare supplement and annuities, consistent with CIG’s focus on more
profitable business
Q2 2008 pre-tax operating earnings up 29% vs Q1 2008:
Improved mortality in traditional life business
Lower expenses
Q2 2008 earnings down 31% vs Q2 2007:
Continued increase in benefit ratios on specified disease products driven by higher
incurred claims
Lower Medicare supplement margins driven by decline in premium and higher incurred
claims
Lower expense primarily due to decreased litigation costs and reduced expenses in agent
care and marketing
Loss of annuity profits from block coinsured in October 2007
Q2 Summary
26
CIG

Q2 Earnings
27
CIG
Management believes that an analysis of income (loss) before net realized investment gains (losses), net of
related amortization (a non-GAAP financial measure), is important to evaluate the financial performance of our
business, and is a measure commonly used in the life insurance industry. Management uses this measure to
evaluate performance because realized gains or losses can be affected by events that are unrelated to a
company’s underlying fundamentals. The chart on Page 9 reconciles the non-GAAP measure to the
corresponding GAAP measure. See Appendix for a reconciliation of the return on equity measure to the
corresponding GAAP measure.
Trailing 4 Quarter Operating Return on Equity: 2.2%
($ millions)
Q2 2007
(Restated)
Q1 2008
Q2 2008
Insurance policy income
$236.3
$234.3
$229.7
Net investment income
202.5
129.3
131.3
Fee revenue and other income
0.1
0.7
0.4
Total revenues
438.9
364.3
361.4
Insurance policy benefits
188.9
196.6
195.8
Amounts added to policyholder account balances
87.0
43.6
37.1
Amortization related to operations
47.0
30.1
31.0
Interest expense on investment borrowings
4.2
5.8
5.5
Other operating costs and expenses
68.5
64.9
62.0
Total benefits and expenses
395.6
341.0
331.4
Income before net realized investment gains (losses),
net of related amortization and income taxes, and excluding
costs related to the litigation settlement
$43.3
$23.3
$30.0
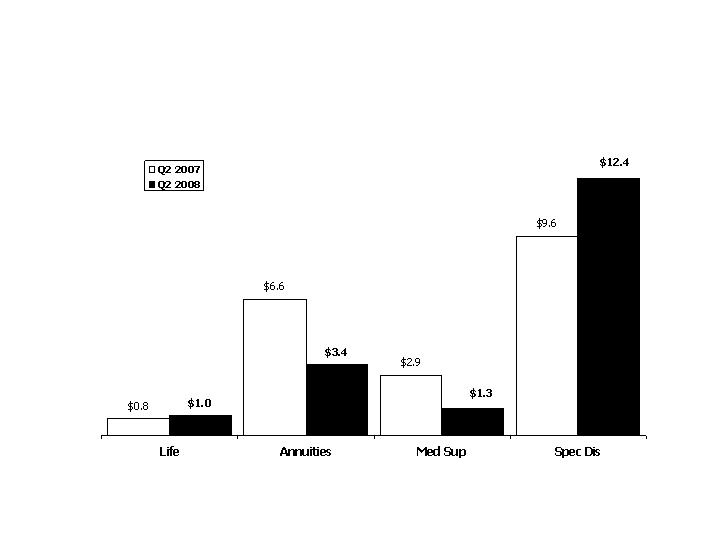
NAP: Q2 2007 vs Q2 2008
CIG
28
($ millions)

Announced plan to transfer Conseco Senior Health Insurance
Company to independent trust
Accounts for 86% of LTC Closed Block liabilities
Fourth consecutive stable quarter
Earnings above breakeven for quarter and year to date
Q2 results reflect
Continued reserve adequacy
Higher terminations
Impact of turnaround program
Q2 Summary
29
LTC Closed Block
Segment Performance
30
LTC Closed Block
*Operating earnings exclude net realized gains (losses). See Appendix for corresponding GAAP measure of
our consolidated results of operations.
Continued reserve stability
Higher terminations
Impact from improvement
initiatives
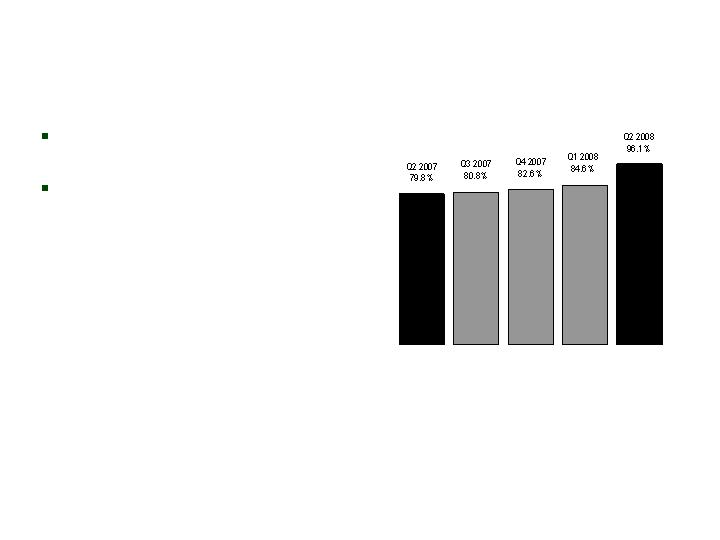
PTOI-Trailing 4 Quarters: $(213.3) $(221.0) $(185.9) $(161.1) $(18.6)
Revenues-Quarterly: $125.8 $126.1 $127.9 $126.1 $127.2
Pre-Tax Operating Income*
Revenues -Tr. 4 Quarters: $508.4 $506.4 $506.4 $505.9 $507.3
($ millions)
Collected Premiums-Quarterly: $76.2 $75.7 $75.0 $76.3 $74.1

Q2 Earnings
31
LTC Closed Block
Management believes that an analysis of income (loss) before net realized investment gains (losses), net of
related amortization (a non-GAAP financial measure), is important to evaluate the financial performance of our
business, and is a measure commonly used in the life insurance industry. Management uses this measure to
evaluate performance because realized gains or losses can be affected by events that are unrelated to a
company’s underlying fundamentals. The chart on Page 9 reconciles the non-GAAP measure to the
corresponding GAAP measure. See Appendix for a reconciliation of the return on equity measure to the
corresponding GAAP measure.
($ millions)
Q2 2007
(Restated)
Q1 2008
Q2 2008
Insurance policy income
$78.1
$75.5
$75.5
Net investment income
47.6
50.5
51.6
Fee revenue and other income
0.1
0.1
0.1
Total revenues
125.8
126.1
127.2
Insurance policy benefits
228.4
102.6
93.6
Amortization related to operations
6.1
5.4
5.6
Other operating costs and expenses
21.6
19.4
15.8
Total benefits and expenses
256.1
127.4
115.0
Income (loss) before net realized investment gains (losses)
and income taxes
($130.3)
($1.3)
$12.2

Form A filed to separate 86% of LTC Closed Block liabilities
from CNO – August 11
Publication in the Pennsylvania Bulletin expected August 23
Public comment period expected to last through September;
at discretion of Pennsylvania Insurance Department
Pennsylvania Insurance Department approves Form A (Q4
2008)
Consummate transaction (Q4 2008)
Next Steps
32
LTC Closed Block
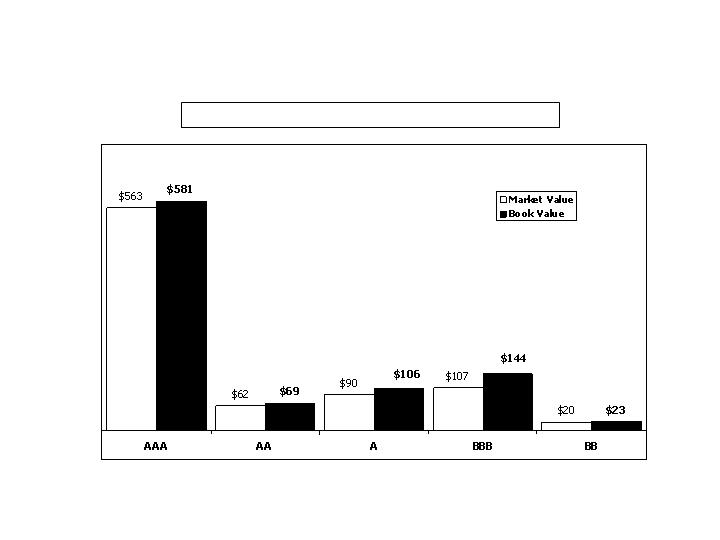
Investment Quality*
33
CNO
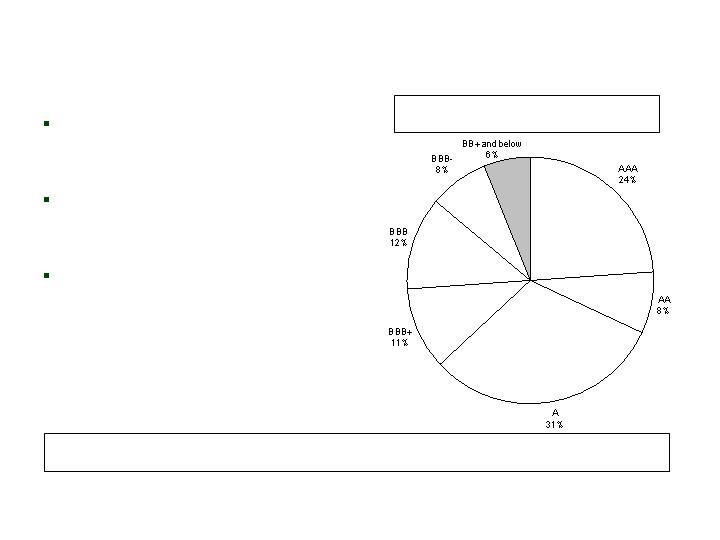
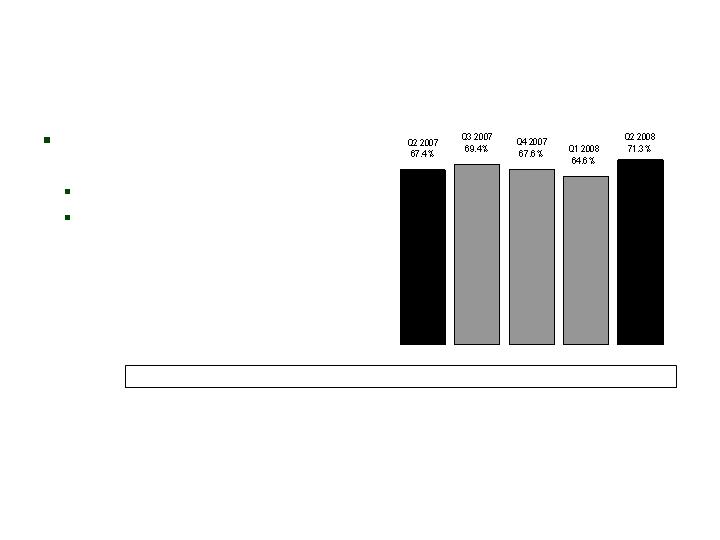
Below-investment grade
securities represent 6% of total
portfolio
Limited new money allocation to
below-investment grade
securities
Some drift upward in below-
investment grade ratio due to
credit cycle-related ratings
migration
Actively Managed Fixed Maturities by Rating at
6/30/08 (Market Value)
6/30/08
94%
3/31/08
95%
12/31/07
94%
9/30/07
94%
6/30/07
94%
% of Bonds which are Investment Grade:
*Excludes investments from a variable interest entity which we consolidate under GAAP (though the related
liabilities are non-recourse to Conseco).

Q2 2008
Other-than-Temporary Impairments
34
CNO
Total Q2 2008 gross realized losses included impairments of $231.7
million
$205.7 million related to Conseco Senior Health Insurance Company transaction
as a result of our intent not to hold such investments for a period of time sufficient
to allow for any anticipated recovery in value
$7.0 million (27%) in mortgage securities, including subprime ABS, home equity
ABS, Alt-A’s
$19.0 million (73%) in Corporate Bonds, including $2.7 million (10%) in VIE
consolidated for GAAP purposes
Substantial Q2 spread widening across numerous credit markets,
with most significant impact on structured securities, including
CMBS, and on financials
Elevated level of impairments may persist through 2008; overall
portfolio quality expected to be resilient in the long term

CNO substantially hedges its current-year exposure to equity volatility (with future
periods subject to product repricing)
Hedge positions periodically adjusted for terminations
Terminations tend to result in modestly long position
Financial impact based on market performance
Income statement impact approximately $1 million in Q2 2008
Accounting
FAS 157 fair value measurement adopted during Q1 2008
Liabilities include present value of future option credits, which are not hedged in the
current period
Fluctuation in financial results due to liability revaluation under FAS 133, not hedge or
asset performance
$4.2 million income statement impact in Q2 2008 ($3.3 million in Bankers and $0.9
million in CIG)
Fluctuation will continue over time – differences are temporary and balance out over
the life of the contracts
Equity Indexed Products
35
CNO

Structured securities
represent 24% of total actively
managed fixed maturity
securities
Over 89% AAA rated
Over 40% Agency CMOs
11% Alt-A’s (99% AAA
rated)
No exposure to Agency
(FRM/FRE) preferred or
common
Predominantly “Level Two”
FAS 157 pricing
Structured Securities at 6/30/08
CNO
36
(Market value in millions)
Pass-throughs, sequentials and
equivalent securities
$1,940.6
40.1%
Planned amortization class, target
amortization class, and accretion-
directed bonds
$1,667.7
34.4%
Commercial
mortgage-backed
securities
$836.1
17.3%
Other
$31.5
0.6%
Asset-backed
securities
$369.4
7.6%
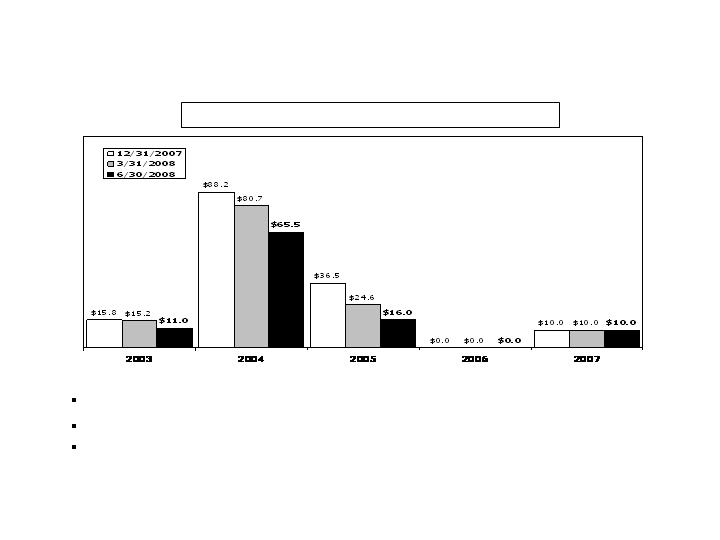
Sub-Prime Home Equity ABS
CNO
37
Exposure reduced by 32% since 12/31/07
Market value represents 0.37% of invested assets at 6/30/08, compared to 0.52% at 12/31/07
Despite challenging market conditions, current collateral performance trends and credit
support suggest adequate protection
Exposure by Vintage Year (Book Value in millions)

Sub-Prime Home Equity ABS
at 6/30/08
CNO
38
AAA
AA
A
Total
$29.1
$33.3
$22.2
$84.6
$35.3
$39.7
$27.5
$102.5
34.4%
39.4%
26.2%
100.0%
0.13%
0.14%
0.10%
0.37%
Market
Value (mil.)
Book
Value (mil.)
% of
Subprime*
% of
Portfolio*
Rating
Only $22.2 million (market value) A category or lower (0.10% of invested assets)
No exposure to “affordability products” – negative amortization, option ARM
collateral, etc.
Rising delinquency roll rates reflect market conditions
Remaining portfolio generally reflects satisfactory margin for adverse collateral
performance
641
647
648
645
Avg.
FICO
30.6%
23.3%
20.8%
25.2%
Avg.
Support
11.8%
8.1%
8.0%
9.4%
Avg. 60+
Delinq.
*% of market value.
CMBS Exposure Summary*
at 6/30/08
CNO
39
Exposure by Rating Category (in millions)
$842
$923
*Includes exposure held in our trading portfolios.

CNO Summary
40
Separation of CSHI from Conseco
The most significant strategic move we will make
CSHI, owned by a Trust operating for the benefit of policyholders, will be
better able to get rate increases than CSHI, owned by CNO
Continued strong growth in new business
Bankers Life – continuing to grow at about 10%
Colonial Penn – growth in excess of 20%
CIG – producing more economic value from refocused sales efforts
Improved earnings stability
CIG profitability restored
LTC Run-off block through break-even

Questions and Answers
41

Appendix
42
Book Value Per Diluted Share*
43
CNO
*Book value excludes accumulated other comprehensive income (loss). Shares outstanding assumes:
(1) conversion of convertible securities; and (2) the exercise of outstanding stock options and vesting of restricted
stock (each calculated using the treasury stock method). See Appendix for corresponding GAAP measure.
Decrease primarily driven by
net loss in Q2 2008

Ratio of Debt to Total Capital*
44
CNO
Increase primarily driven by
net loss in Q2 2008
Q2 2007
20.4%
*Excludes accumulated other comprehensive income (loss). See Appendix for corresponding GAAP measure.
Q3 2007
20.6%
Q4 2007
20.9%
Q1 2008
20.9%
Q2 2008
22.8%

In compliance with all
financial covenants
Key Debt Covenants
45
CNO
Q2 2008*
($ millions)
Q4 2007
Q4 2006
25.0%
16.2%
2.00X
2.06X
$1,270
$1,747
245%
358%
Q4 2005
30.0%
17.4%
2.00X
2.06X
$1,270
$1,734
250%
357%
30.0%
21.0%
2.00X
3.34X
$1,270
$1,497
250%
296%
30.0%
22.8%
2.00X
3.44X
$1,270
$1,466
250%
271%
Debt/Capital Ratio
Covenant Maximum
Actual
Interest Coverage**
Covenant Minimum
Actual
Statutory Capital
Covenant Minimum
Actual
RBC Ratio
Covenant Minimum
Actual
*Preliminary calculations.
**Q405 and Q406 reflect fixed charge coverage, as required under prior bank agreement.
Net Investment Income
46
CNO
($ millions)
Yield unchanged from Q2 2007
Net investment income from the prepayment of securities: $1.1 $0.6 $5.0 $1.5 $1.7
General Account Investment Income
5.82%
5.82%
5.94%
5.87%
5.80%
Yield:
Expenses
47
CNO
($ millions)
Adjusted Operating Expenses*
*Adjusted operating expenses exclude primarily acquisition costs, capitalization of software development costs,
initial PFFS marketing costs, costs related to the R-factor litigation settlement, and contractual vacancy charges
related to exiting the Merchandise Mart in Chicago. This measure is used by the Company to evaluate its
progress in reducing operating expenses.
Back-office consolidation when
completed expected to produce run-
rate savings of $25 million annually
by YE 2008
Approximately $11 million in savings
realized in 2007; additional $9 million
expected in 2008; remaining $5 million
expected in 2009
Q1 2008 expenses reflect increased
investment in business growth at
Bankers and Colonial Penn
Segment Performance
48
Bankers
*Operating earnings exclude net realized gains (losses). See Appendix for corresponding GAAP measure of
our consolidated results of operations.
Lower earnings driven by:
Lower margins as a result of
higher LTC claims frequency
FAS 133 volatility
IBNR true-up in PFFS
Increased claims in Medicare
Supplement
Continued strong revenue
growth
PTOI-Trailing 4 Quarters: $257.9 $251.0 $241.8 $225.4 $189.5
Revenues-Quarterly: $581.8 $621.6 $606.8 $627.9 $680.7
Pre-Tax Operating Income*
Revenues -Tr. 4 Quarters: $2,196.1 $2,291.8 $2,364.3 $2,438.1 $2,537.0
($ millions)
Premiums –
Medicare Supplement
49
Bankers
(in millions)
Q2 2008 vs Q2 2007:
First-year premiums
down slightly
NAP up 15%
Medicare Supplement – First-Year Premiums
Med. Supp. First-Year Prems.-Tr. 4 Qtrs: $90.7 $86.8 $82.5 $79.4 $78.8
Med. Supp. Total Premiums-Quarterly: $153.8 $152.9 $162.4 $159.9 $150.6
Med. Supp. NAP-Quarterly: $14.7 $16.1 $23.0 $17.1 $17.0
Med. Supp. NAP-Trailing 4 Quarters: $63.1 $63.9 $68.5 $70.9 $73.2
Premiums –
PDP/PFFS
50
Bankers
(in millions)
Q2 2007 to Q2 2008 growth driven
by continued growth in in-force
policies and addition of two group
cases
Q1 2008 to Q2 2008 growth reflects
start of new group case
Q2 2007
$25.9
PDP
PFFS
PDP/PFFS – First-Year Premiums
Q3 2007
$78.5
Q4 2007
$86.0
$76.2
Q1 2008
$70.4
Q2 2008
$116.1
$23.8
$84.0
$68.8
$113.5
PDP NAP-Quarterly: $0.7 $0.8 $0.6 $3.6 $0.9
PFFS NAP-Quarterly: $22.2 $(0.9) $(2.6) $59.1 $(6.4)
Premiums –
Long-Term Care
51
Bankers
($ millions)
Quarterly first-year premium
tracks decline in NAP
NAP decline attributable to three
main factors:
Overall industry sales decline
Agent force shift toward life and
annuity sales
Tightened underwriting
First-Year Prems.-Tr. 4 Qtrs: $47.7 $47.4 $47.0 $46.4 $44.8
Total Premiums-Quarterly: $155.4 $154.5 $154.3 $156.6 $155.2
Long-Term Care – First-Year Premiums
NAP-Quarterly: $12.7 $11.7 $10.8 $9.4 $10.7
NAP-Trailing 4 Quarters: $47.9 $47.1 $46.9 $44.6 $42.6

LTC Premium Re-rates
(as of 7/31/08)
52
Bankers
Round 2 Results (2007 Round – issues from 2002-2005)
Submitted: $45.6 million (100% of goal)
Approved: $20.2 million (63% of goal)
Implemented: $20.2 million (63% of goal)
Financial impact: $17.6 million (62% of goal)
Round 3 Goals (2008 Round – issues prior to 2002)
Submitted: $103.0 million
Approved: $70.8 million
Implemented: $70.8 million
Financial impact: $50 million
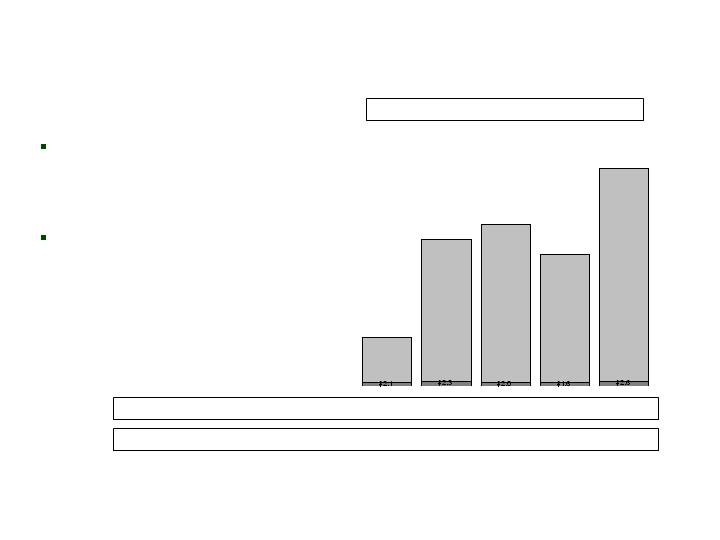
Premiums –
Life Insurance
53
Bankers
($ millions)
Fluctuations in first-year
premiums primarily reflect
variance in sales of single-
premium policies
Non-SPWL NAP up 14% over
Q1 2008 and flat vs Q2 2007
First-Year Prems.-Tr. 4 Qtrs: $93.0 $89.8 $89.2 $86.3 $83.5
Total Premiums-Quarterly: $52.1 $49.1 $50.7 $48.0 $53.8
Life – First-Year Premiums
NAP-Quarterly: $14.5 $13.8 $13.1 $11.7 $15.7
NAP-Trailing 4 Quarters: $51.5 $52.4 $54.1 $53.1 $54.3
Q2 2007
$25.3
Q3 2007
$21.2
Q4 2007
$21.3
Q1 2008
$18.5
Q2 2008
$22.5
SPWL
Non-
SPWL
$9.4
$12.1
$9.1
$9.3
$7.0
$13.2
$12.1
$12.0
$11.5
$13.1
Premiums –
Annuity
54
Bankers
($ millions)
Fixed annuities have become
more attractive due to stock
market volatility
First-Year Prems.-Tr. 4 Qtrs: $935.8 $909.0 $882.7 $899.3 $956.5
Total Premiums-Quarterly: $200.5 $250.9 $221.9 $229.1 $257.8
Annuity – First-Year Premiums
Benefit Ratio* –
Medicare Supplement
55
Bankers
Trailing 4 Quarter Avg.: 65.7% 66.6% 67.2% 67.3% 68.2%
*We calculate benefit ratios by dividing insurance policy benefits by insurance policy income.
Q2 2008 ratio negatively
impacted by:
Premium refund adjustments
Higher incurred claims

Premiums lower by $2.6 million:
$1.4 million premium adjustment
Terminations slightly higher than plan (although slightly improved from
Q1 and Q2 2007)
Claims higher by $4.4 million:
Increase in $ paid for Exhaust claims (low-frequency, high-amount
claims which vary significantly from quarter to quarter)
Slightly higher trends in hospital claims and small uptick in skilled
nursing facility care claims, consistent with some other carriers
Medicare Supplement Summary
56
Bankers
Benefit Ratio* – PDP
57
Bankers
PDP ratio continues to trend as
expected, factoring in seasonal
fluctuations and settlement of
prior contract year
*We calculate benefit ratios by dividing insurance policy benefits by insurance policy income.
Benefit Ratio* –
PFFS Individual Business
58
Bankers
Q2 2008 reflects IBNR
adjustment
Overall ratio within pricing
*We calculate benefit ratios by dividing insurance policy benefits by insurance policy income.
Benefit Ratio* –
PFFS Group Business
59
Bankers
Lower expense levels allow
group PFFS to operate at a
higher benefit ratio than
individual business, with
similar margin expectations
*We calculate benefit ratios by dividing insurance policy benefits by insurance policy income.
Interest-Adjusted Benefit Ratio* –
Long Term Care
60
Bankers
*We calculate interest-adjusted benefit ratios by dividing insurance policy benefits less interest income on
the accumulated assets backing the insurance liabilities by insurance policy income.
Q2 2008 negatively impacted by:
Higher frequency of incurred claims
Began implementation of premium re-
rates (Round Two) in Q3 2007 on more
recent business not previously re-rated;
expect additional $10 million in in-force
premium
Began filing for premium re-rates
(Round Three) on 8/1/08 on legacy
block; expect $50 million annual
financial impact
Trailing 4 Quarter Avg.: 66.2% 71.0% 70.8% 72.5% 76.7%
Qtrly. non-int. adjusted: 95.4% 106.5% 103.3% 111.6% 114.7%
Segment Performance
61
Colonial Penn
*Operating earnings exclude net realized gains (losses). See Appendix for corresponding GAAP measure of
our consolidated results of operations.
Q2 2007 to Q2 2008 earnings
Improved due to Q4 2007
recapture
Improved due to organic growth
initiatives
Partially offset by higher life
claims in 2008
PTOI-Trailing 4 Quarters: $21.3 $23.7 $18.1 $17.2 $18.8
Revenues-Quarterly: $38.9 $42.1 $44.3 $53.9 $58.1
Pre-Tax Operating Income*
Revenues -Tr. 4 Quarters: $157.7 $161.4 $164.3 $179.2 $198.4
($ millions)
Premiums –
Life Insurance
62
Colonial Penn
($ millions)
Continued strong sales growth
Trailing four quarters data:
NAP grew 28%
First-year premium grew 27%
First-Year Prems.-Tr. 4 Qtrs: $25.4 $27.0 $28.7 $30.4 $32.3
Total Premiums-Quarterly: $26.0 $29.3 $31.7 $42.9 $43.8
Life – First-Year Premiums
NAP-Quarterly: $11.2 $11.4 $9.3 $12.7 $14.5
NAP-Trailing 4 Quarters: $37.4 $40.5 $42.3 $44.6 $47.9
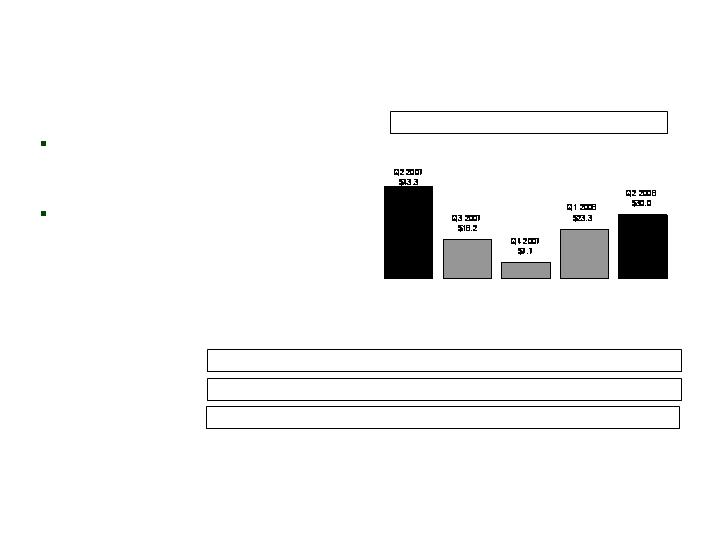
Segment Performance
63
CIG
*Operating earnings exclude: (1) net realized gains (losses); (2) the Q2 2006 charge related to the
litigation settlement and refinements to such estimates recognized in subsequent periods; and (3) the Q3
2007 charge related to a coinsurance transaction. See Appendix for corresponding GAAP measure of our
consolidated results of operations.
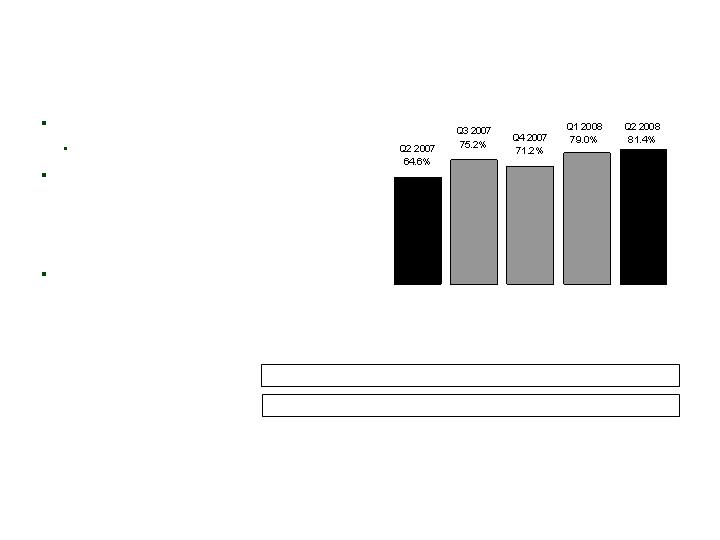
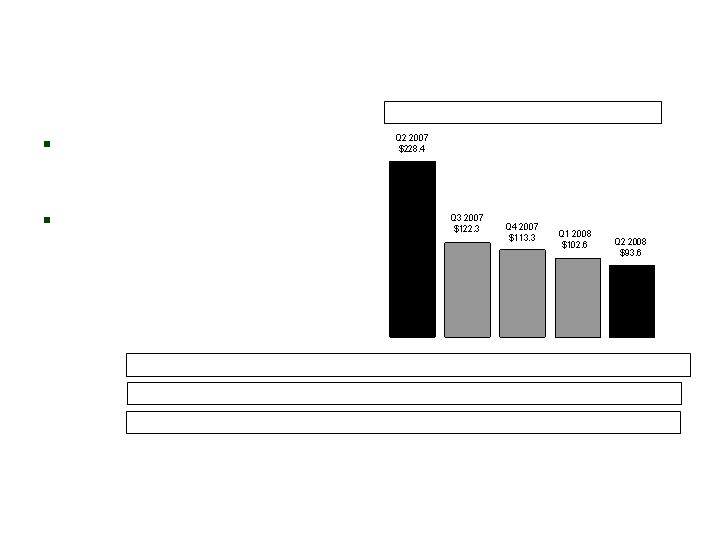
Improving life margins on our
traditional life block, primarily due
to favorable mortality of $3.5 million
Favorable expenses of $2.8 million
PTOI-Trailing 4 Quarters: $161.3 $122.9 $102.7 $92.5 $79.2
Revenues-Quarterly: $438.9 $420.0 $362.7 $364.3 $361.4
Pre-Tax Operating Income*
Revenues-Tr. 4 Quarters: $1,738.2 $1,722.2 $1,639.2 $1,585.9 $1,508.4
($ millions)
Premiums -
Medicare Supplement
64
CIG
($ millions)
NAP down 55% from Q2 2007:
We continue to focus on the
profitability of this business rather
than increased sales
First-Year Prems.-Tr. 4 Qtrs: $26.2 $23.9 $19.4 $15.6 $12.7
Total Premiums-Quarterly: $56.1 $54.8 $55.2 $53.1 $49.6
Medicare Supplement – First-Year Premiums
NAP-Quarterly: $2.9 $1.9 $3.5 $2.3 $1.3
NAP-Trailing 4 Quarters: $20.4 $16.1 $13.2 $10.6 $9.0
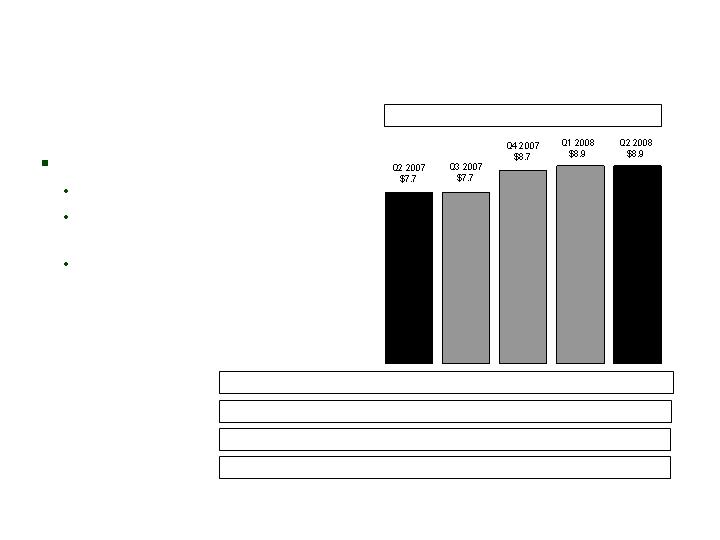
Premiums –
Specified Disease
65
CIG
($ millions)
NAP up 29% from Q2 2007:
New products
Increased PMA focus on
specified disease products
Recruitment of Health IMOs
First-Year Prems.-Tr. 4 Qtrs: $28.9 $29.8 $31.4 $33.0 $34.2
Total Premiums-Quarterly: $89.1 $88.7 $89.3 $93.6 $91.5
Specified Disease – First-Year Premiums
NAP-Quarterly: $9.6 $10.3 $11.3 $9.6 $12.4
NAP-Trailing 4 Quarters: $33.7 $36.3 $39.0 $40.8 $43.6
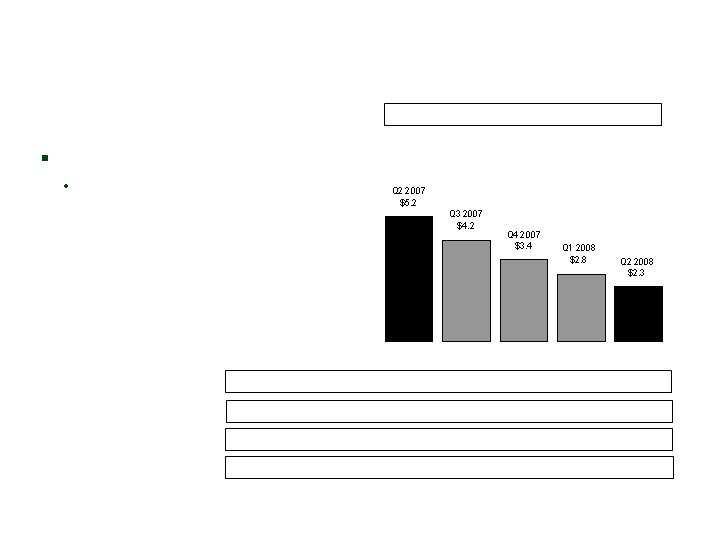
Premiums –
Annuity
66
CIG
($ millions)
Collections down 49% from
Q2 2007:
Discontinuance of products due
to coinsurance transaction
Focus on profitable products
First-Year Prems.-Tr. 4 Qtrs: $521.5 $415.9 $354.4 $277.3 $203.4
Total Premiums-Quarterly: $113.0 $77.5 $58.0 $41.6 $37.1
Annuity – First-Year Premiums
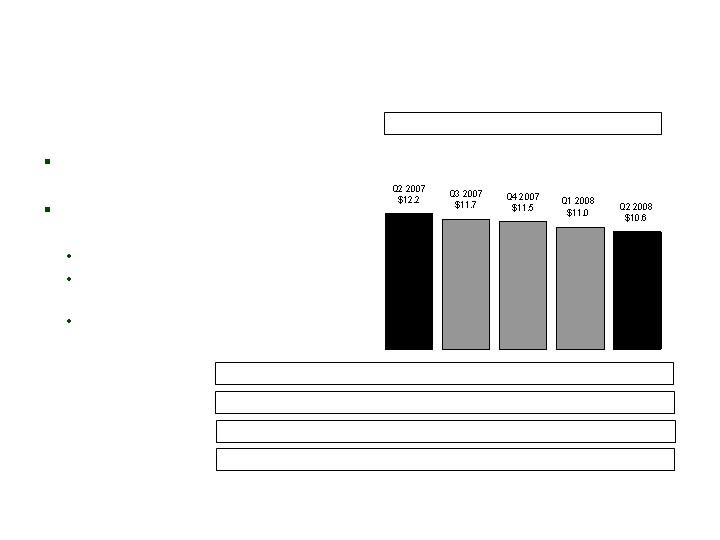
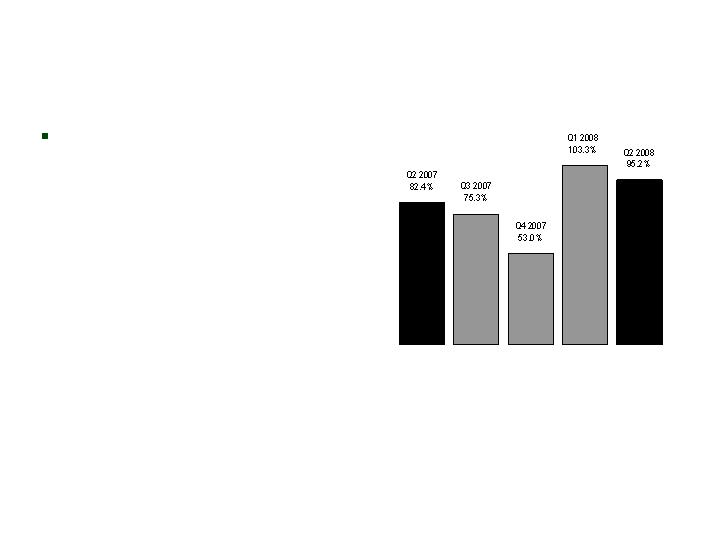
Benefit Ratio* –
Medicare Supplement
67
CIG
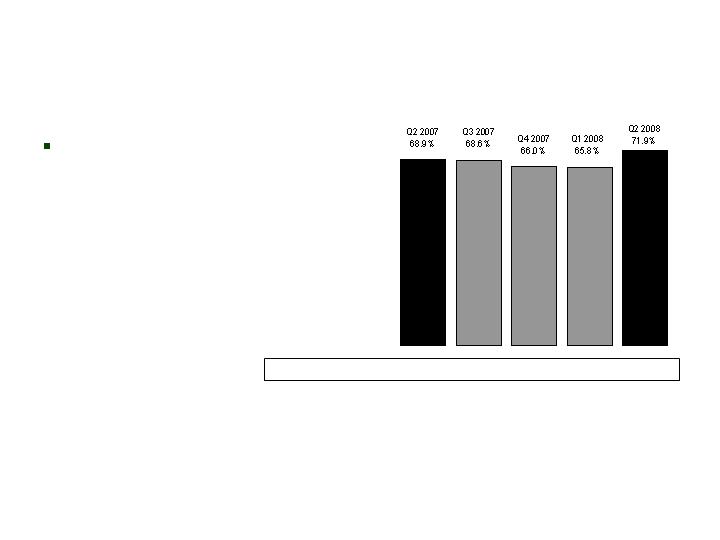
Recognized higher incurred
claims in Q2 2008
Trailing 4 Quarter Avg.: 66.6% 67.1% 67.6% 67.4% 68.0%
*We calculate benefit ratios by dividing insurance policy benefits by insurance policy income.
Interest-Adjusted Benefit Ratio* –
Specified Disease
68
CIG
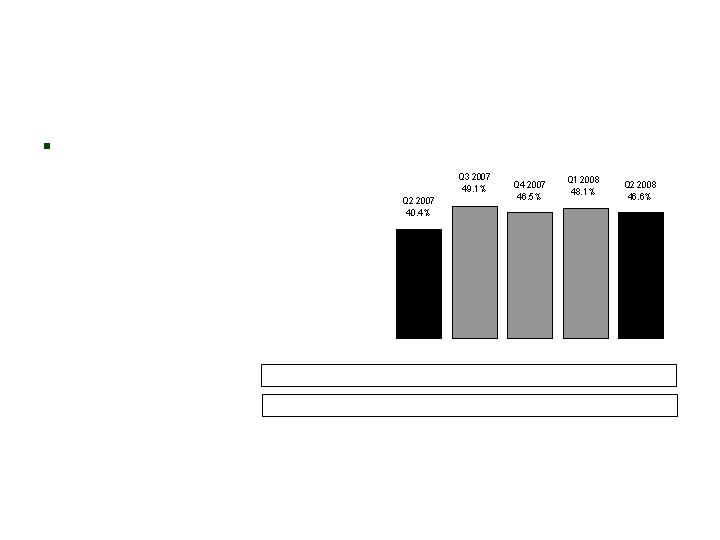
Trailing 4 Quarter Avg.: 41.8% 43.2% 44.7% 46.0% 47.6%
Qtrly. non-int. adjusted: 73.2% 81.9% 80.6% 81.9% 80.8%
*We calculate interest-adjusted benefit ratios by dividing insurance policy benefits, less interest income on
the accumulated assets backing the insurance liabilities, by insurance policy income.
Primarily driven by slight
increase in incurred claims

Balance Sheet Detail
Continued stability since reserve strengthening in Q2 2007
LTC Closed Block
69
($ millions)
Insurance Liabilities and Intangible Assets, Net of Reinsurance
Reserve for Future Benefits
Claim Reserve
Insurance Acquisition Costs
Net Liability
Percent Change
Q3 2007
$2,402.3
954.3
(153.9)
$3,202.7
0.0%
Q2 2007
$2,409.0
952.6
(159.5)
$3,202.1
4.1%
Q4 2007
$2,392.7
962.1
(156.8)
$3,198.0
-0.1%
Q1 2008
$2,394.4
957.2
(151.4)
$3,200.2
0.1%
Q2 2008
$2,373.6
960.8
(145.9)
$3,188.5
-0.4%
Benefit Detail
Fourth consecutive stable
quarter; continued reserve
adequacy
Q2 2007 total benefits and
incurred claims reflect $110
million claim reserve
strengthening
Total benefits equal incurred claims plus increase in reserve for future benefits. Verified basis incurred claims
adjust all periods for claim reserve redundancies and deficiencies.
Increase in Reserves for Future Benefits $(6.3) $9.4 $(6.4) $1.6 $(20.8)
Verified Basis Incurred Claims $111.5 $112.6 $125.9 $113.6 $114.0
LTC Closed Block
Total Benefits
($ millions)
70
Incurred Claims $234.7 $112.9 $119.8 $100.9 $114.4
Interest-Adjusted
Benefit Ratio*
71
Fourth consecutive stable
quarter; continued reserve
adequacy
Q2 2007 benefit ratio reflects
$110 million claim reserve
strengthening
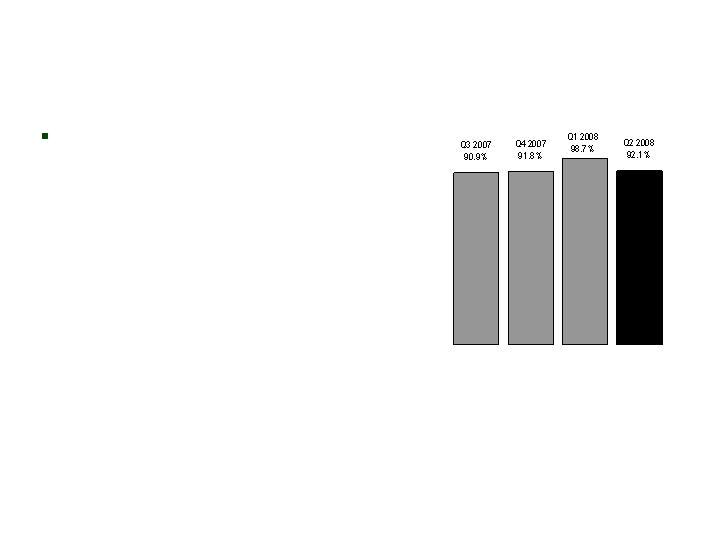
Trailing 4 Quarter Avg.: 134.1% 138.8% 127.5% 120.8% 76.3%
Qtrly. non-int. adjusted: 292.4% 158.4% 146.6% 135.8% 123.9%
LTC Closed Block
*We calculate interest-adjusted benefit ratios by dividing insurance policy benefits less interest income on
the accumulated assets backing the insurance liabilities by insurance policy income.
Qtrly. Verified Basis non-int. adjusted: 141.7% 145.9% 162.7% 150.4% 151.1%

Q2 2007 claims reserving actions generated stability in the remainder of 2007 and Q1 2008:
Favorable prior-period development continues
Verified claims for all periods stable
Verified Incurred
Development*
72
*Excludes waiver-of-premium and return-of-premium benefits.
LTC Closed Block
Reported Claims
Prior Period Development
Ver. Claims as of Rep. Date
Ver. Claims Dev. through:
12/31/04
12/31/05
12/31/06
3/31/07
6/30/07
9/30/07
12/31/07
3/31/08
6/30/08
($ millions)
Q3 2007
$100.7
3.3
104.0
104.0
102.3
101.9
100.5
Q2 2007
$212.0
(109.7)
102.3
102.3
103.0
107.1
103.9
97.3
Q1 2007
$119.7
(34.9)
84.7
84.7
104.2
103.6
106.3
101.4
100.8
2006
$433.3
(72.2)
361.1
361.1
375.1
418.3
414.4
412.2
408.2
408.0
2005
$396.0
(58.9)
337.2
337.2
365.0
368.8
389.2
388.7
391.0
390.8
392.4
2004
$370.8
(44.2)
326.6
326.6
326.0
337.7
344.2
356.5
356.6
356.6
361.0
361.6
Developed
Deficiencies
in Periods
Prior to 2004
$0.0
0
0
44.2
103.7
136.4
147.1
161.4
162.3
165.0
162.2
165.6
Q4 2007
$104.7
1.8
106.5
106.5
104.9
108.5
Q1 2008
$89.1
12.8
101.9
101.9
101.8
Q2 2008
$102.3
(0.3)
102.0
102.0

Higher claims paid in Q2 2008 related to inventory reduction and slightly higher experience
Claimant and in force policy counts in line with trends for past two years
Increase in Q2 2008 termination rate driven by timing
Operating Data
73
LTC Closed Block
Claims Paid (mils.)
Open Claimant Counts
In Force Policy Counts
Ann. Termination Rates
Q2 2006
$101.2
12,536
194,080
6.9%
Q3 2006
$96.1
12,228
190,134
7.9%
Q4 2006
$81.6
12,048
187,123
6.2%
Q1 2007
$102.0
11,870
183,655
7.2%
Q2 2007
$96.8
12,424
179,952
7.8%
Q3 2007
$97.7
12,121
175,685
8.9%
Q4 2007
$104.9
12,338
172,222
7.7%
Q1 2008
$93.6
11,783
168,799
7.7%
Q2 2008
$99.2
12,237
164,865
9.0%

Premium Re-rates
(as of 8/7/08)
74
LTC Closed Block
Round 1 results - exceeded each goal:
Submitted: $64.0 million (115% of goal)
Approved: $47.0 million (113% of goal)
Implemented: $46.7 million (112% of goal)
Financial impact: $39.2 million (112% of goal)
Round 2 results – on track to achieve goals:
Submitted: $42.9 million (100% of goal)
Approved: $22.7 million (88% of goal)
Implemented: $22.1 million (86% of goal)
Financial impact: $17.7 million (86% of goal)
Round 3 goals:
Submitted: $76.2 million
Approved: $39.6 million
Implemented: $39.6 million
Financial impact: $31.7 million

Information Related to Certain Non-GAAP Financial Measures
The following provides additional information regarding certain non-GAAP measures used in this presentation. A non-GAAP measure is a
numerical measure of a company’s performance, financial position, or cash flows that excludes or includes amounts that are normally excluded or
included in the most directly comparable measure calculated and presented in accordance with GAAP. While management believes these
measures are useful to enhance understanding and comparability of our financial results, these non-GAAP measures should not be considered as
substitutes for the most directly comparable GAAP measures. Additional information concerning non-GAAP measures is included in our periodic
filings with the Securities and Exchange Commission that are available in the “Investor – SEC Filings” section of Conseco’s website,
www.conseco.com.
Operating earnings measures
Management believes that an analysis of net income applicable to common stock before net realized gains or losses (“net operating income”, a
non-GAAP financial measure) is important to evaluate the performance of the Company and is a key measure commonly used in the life insurance
industry. Management uses this measure to evaluate performance because realized investment gains or losses can be affected by events that
are unrelated to the Company’s underlying fundamentals.
In addition, our results were affected by unusual and significant charges related to: (i) a litigation settlement in Q2 2006 and refinements to such
estimates recognized in subsequent periods; (ii) a Q3 2007 charge related to a coinsurance transaction; and (iii) a Q4 2007 and Q2 2008 valuation
allowance for deferred tax assets. Management does not believe that similar charges are likely to recur within two years, and there were no
similar charges recognized within the prior two years. Management believes an analysis of operating earnings before these charges is important
to evaluate the performance of the Company prior to the effect of these unusual and significant charges.
75

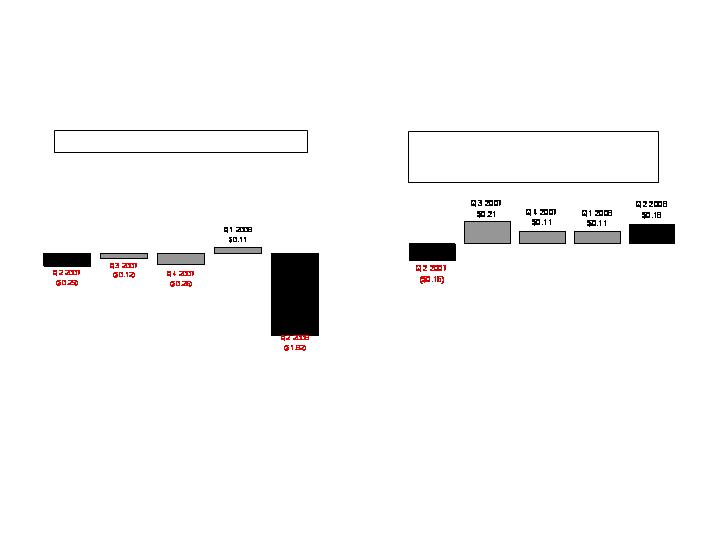
Information Related to Certain Non-GAAP Financial Measures
A reconciliation of net income applicable to common stock to the net operating income, excluding: (i) Q2 2006 charge related to the litigation settlement and
refinements to such estimates recognized in subsequent periods; (ii) a Q3 2007 charge related to a coinsurance transaction; and (iii) a Q4 2007 and Q2 2008
valuation allowance for deferred tax assets (and related per share amounts) is as follows (dollars in millions, except per share amounts):
76
Q2 2007
Q3 2007
Q4 2007
Q1 2008
Q2 2008
Net income (loss) applicable to common stock
(59.8)
$
(52.7)
$
(71.5)
$
(5.8)
$
(487.1)
$
Net realized investment losses, net of related amortization and taxes
10.1
31.0
23.0
26.5
150.5
Net operating income (loss) (a non-GAAP financial measure)
(49.7)
(21.7)
(48.5)
20.7
(336.6)
Q2 2006 charge related to the litigation settlement and refinements to such
estimates recognized in subsequent periods, net of taxes
22.8
10.6
-
-
-
Q3 2007 charge related to a coinsurance transaction, net of taxes
-
49.7
-
-
��
-
Q4 2007 and Q2 2008 valuation allowance for deferred tax assets
-
-
68.0
-
370.0
Net operating income before: (i) Q2 2006 charge related to the
litigation settlement and refinements to such estimates recognized
in subsequent periods; (ii) a Q3 2007 charge related to a coinsurance
transaction; and (iii) a Q4 2007 and Q2 2008 valuation allowance
for deferred tax assets (a non-GAAP financial measure)
(26.9)
$
38.6
$
19.5
$
20.7
$
33.4
$
Per diluted share:
Net income (loss)
(0.35)
$
(0.28)
$
(0.38)
$
(0.03)
$
(2.64)
$
Net realized investment losses, net of related amortization and taxes
0.06
0.16
0.12
0.14
0.82
Net operating income (loss) (a non-GAAP financial measure)
(0.29)
(0.12)
(0.26)
0.11
(1.82)
Q2 2006 charge related to the litigation settlement and refinements to such
estimates recognized in subsequent periods, net of taxes
0.13
0.06
-
-
-
Q3 2007 charge related to a coinsurance transaction, net of taxes
-
0.27
-
-
-
Q4 2007 and Q2 2008 valuation allowance for deferred tax assets
-
-
0.37
-
2.00
Net operating income before: (i) Q2 2006 charge related to the
litigation settlement and refinements to such estimates recognized
in subsequent periods; (ii) a Q3 2007 charge related to a coinsurance
transaction; and (iii) a Q4 2007 and Q2 2008 valuation allowance
for deferred tax assets (a non-GAAP financial measure)
(0.16)
$
0.21
$
0.11
$
0.11
$
0.18
$

Information Related to Certain Non-GAAP Financial Measures
77
Book value, excluding accumulated other comprehensive income, per diluted share
This non-GAAP financial measure differs from book value per diluted share because accumulated other comprehensive income has been
excluded from the book value used to determine the measure. Management believes this non-GAAP financial measure is useful because it
removes the volatility that arises from changes in accumulated other comprehensive income. Such volatility is often caused by changes in the
estimated fair value of our investment portfolio resulting from changes in general market interest rates rather than the business decisions made
by management.

Information Related to Certain Non-GAAP Financial Measures
78
A reconciliation from book value per diluted share to book value per diluted share, excluding accumulated other comprehensive income (loss) is
as follows (dollars in millions, except per share amounts):
Q2 07
Q3 07
Q4 07
Q1 08
Q2 08
Total shareholders' equity
4,356.1
$
4,285.5
$
4,235.9
$
3,939.7
$
3,382.1
$
Less accumulated other comprehensive income (loss)
(329.9)
(316.0)
(273.3)
(565.6)
(639.2)
Total shareholders' equity excluding
accumulated other comprehensive income (loss)
(a non-GAAP financial measure)
4,686.0
$
4,601.5
$
4,509.2
$
4,505.3
$
4,021.3
$
Diluted shares outstanding for the period
188,962,041
186,472,069
184,708,727
184,681,243
184,792,300
Book value per diluted share
23.05
$
22.98
$
22.93
$
21.33
$
18.30
$
Less accumulated other comprehensive income (loss)
(1.75)
(1.70)
(1.48)
(3.07)
(3.46)
Book value, excluding accumulated other
comprehensive income (loss), per diluted share
(a non-GAAP financial measure)
24.80
$
24.68
$
24.41
$
24.40
$
21.76
$

Information Related to Certain Non-GAAP Financial Measures
79
Operating return measures
Management believes that an analysis of return before net realized gains or losses (“net operating income”, a non-GAAP financial measure) is
important to evaluate the performance of the Company and is a key measure commonly used in the life insurance industry. Management uses
this measure to evaluate performance because realized investment gains or losses can be affected by events that are unrelated to the
Company’s underlying fundamentals.
In addition, our returns were affected by unusual and significant charges related to: (i) the litigation settlement in Q2 2006 and refinements to
such estimates recognized in subsequent periods; (ii) a Q3 2007 charge related to a coinsurance transaction; and (iii) a Q4 2007 and Q2 2008
valuation allowance for deferred tax assets. Management does not believe that similar charges are likely to recur within two years, and there
were no similar charges recognized within the prior two years. Management believes an analysis of return before these charges and subsequent
refinements is important to evaluate the performance of the Company prior to the effect of these unusual and significant charges.
This non-GAAP financial measure also differs from return on equity because accumulated other comprehensive income (loss) has been excluded
from the value of equity used to determine this ratio. Management believes this non-GAAP financial measure is useful because it removes the
volatility that arises from changes in accumulated other comprehensive income (loss). Such volatility is often caused by changes in the
estimated fair value of our investment portfolio resulting from changes in general market interest rates rather than the business decisions made
by management.
In addition, our equity includes the value of significant net operating loss carryforwards (included in income tax assets). In accordance with
GAAP, these assets are not discounted, and accordingly will not provide a return to shareholders (until after it is realized as a reduction to taxes
that would otherwise be paid). Management believes that excluding this value from the equity component of this measure enhances the
understanding of the effect these non-discounted assets have on operating returns and the comparability of these measures from period-to-
period. Equity in all periods assumes the conversion of our 5.5% Class B Mandatorily Convertible Preferred Stock (which occurred in May 2007).
Operating return measures are used in measuring the performance of our business units and are used as a basis for incentive compensation.
All references to segment operating return measures assume a 25% debt to total capital ratio at the segment level. Additionally, corporate
expenses have been allocated to the segments.

Information Related to Certain Non-GAAP Financial Measures
80
A reconciliation of return on common equity to operating return (less: (i) Q2 2006 charge related to the litigation settlement and refinements to such
estimates recognized in subsequent periods; (ii) a Q3 2007 charge related to a coinsurance transaction; and (iii) a Q4 2007 and Q2 2008 valuation
allowance for deferred tax assets) on common equity (excluding accumulated other comprehensive income (loss) and net operating loss
carryforwards) is as follows (dollars in millions, except per share amounts):
(continued on next page)
Q2 07
Q3 07
Q4 07
Q1 08
Q2 08
Net income (loss) applicable to common stock
(59.8)
$
(52.7)
$
(71.5)
$
(5.8)
$
(487.1)
$
Net realized investment (gains) losses, net of related amortization and taxes
10.1
31.0
23.0
26.5
150.5
Net operating income (loss) (a non-GAAP financial measure)
(49.7)
(21.7)
(48.5)
20.7
(336.6)
Q2 2006 charge related to the litigation settlement and refinements
to such estimates recognized in subsequent periods, net of taxes
22.8
10.6
-
-
-
Q3 2007 charge related to a coinsurance transaction, net of taxes
-
49.7
-
-
-
Q4 2007 and Q2 2008 valuation allowance for deferred tax assets
-
-
68.0
-
370.0
Add preferred stock dividends, assuming conversion
4.6
-
-
-
-
Net operating income before: (i) Q2 2006 charge related to the
litigation settlement and refinements to such estimates recognized
in subsequent periods; (ii) a Q3 2007 charge related to a coinsurance
transaction; and (iii) a Q4 2007 and Q2 2008 valuation allowance for
deferred tax assets (a non-GAAP financial measure)
(22.3)
$
38.6
$
19.5
$
20.7
$
33.4
$
Common shareholders' equity
4,356.1
$
4,285.5
$
4,235.9
$
3,939.7
$
3,382.1
$
Less accumulated other comprehensive income (loss)
(329.9)
(316.0)
(273.3)
(565.6)
(639.2)
Common shareholder's equity, excluding accumulated other comprehensive
income (loss) (a non-GAAP financial measure)
4,686.0
4,601.5
4,509.2
4,505.3
4,021.3
Less net operating loss carryforwards
1,349.8
1,386.7
1,426.7
1,435.1
1,137.2
Common shareholders' equity, excluding accumulated other comprehensive income
(loss) and net operating loss carryforwards (a non-GAAP financial measure)
3,336.2
$
3,214.8
$
3,082.5
$
3,070.2
$
2,884.1
$

Information Related to Certain Non-GAAP Financial Measures
81
(continued from previous page)
Q2 07
Q3 07
Q4 07
Q1 08
Q2 08
Average common shareholders' equity
4,194.2
4,320.8
4,260.7
4,087.8
3,660.9
Average common shareholders' equity, excluding accumulated other
comprehensive income (loss) and net operating loss carryforwards (a
non-GAAP financial measure)
3,372.0
3,275.5
3,148.7
3,076.4
2,977.2
Return on equity ratios:
Return on common equity
-5.7%
-4.9%
-6.7%
-0.6%
-53.2%
Operating return (less: (i) Q2 2006 charge related to the
litigation settlement and refinements to such estimates
recognized in subsequent periods; (ii) the Q3 2007 charge
related to a coinsurance transaction; and (iii) the Q4 2007
and Q2 2008 valuation allowance for deferred tax assets)
on common equity, excluding accumulated other comprehensive
income (loss) and net operating loss carryforwards
(a non-GAAP financial measure)
-2.6%
4.7%
2.5%
2.7%
4.5%

Information Related to Certain Non-GAAP Financial Measures
82
A reconciliation of pretax operating earnings (a non-GAAP financial measure) to segment operating income (loss) and consolidated net income
(loss) for the six months ended June 30, 2008, is as follows (dollars in millions):
(Continued on next page)
Other Business
CIG
Bankers
Colonial Penn
in Run-off
Corporate
Total
Pretax operating earnings (a non-GAAP financial measure)
53.3
$
63.7
$
12.0
$
10.9
$
(55.5)
$
84.4
$
Allocation of interest expense, excess capital and corporate
expenses
(9.5)
(7.9)
(0.7)
(1.5)
19.6
-
Income tax (expense) benefit
(19.1)
(22.9)
(4.3)
(3.9)
19.9
(30.3)
Segment operating income (loss)
24.7
$
32.9
$
7.0
$
5.5
$
(16.0)
$
54.1
Q2 2008 valuation allowance for deferred tax assets
(370.0)
Net realized investment losses, net of related amortization and taxes
(177.0)
Net income
(492.9)
$

Information Related to Certain Non-GAAP Financial Measures
83
A reconciliation of common shareholders’ equity, excluding accumulated other comprehensive income (loss) and net operating loss
carryforwards (a non-GAAP financial measure) to common shareholders’ equity is as follows (dollars in millions):
(Continued from previous page)
(Continued on next page)
Other Business
CIG
Bankers
Colonial Penn
in Run-off
Corporate
Total
December 31, 2007
Common shareholders' equity, excluding accumulated other
comprehensive income (loss) and net operating loss carryforwards
(a non-GAAP financial measure)
1,394.4
$
1,299.8
$
109.7
$
191.7
$
86.9
$
3,082.5
$
Net operating loss carryforwards
1,426.7
-
-
-
-
1,426.7
Accumulated other comprehensive income (loss)
(106.7)
(106.7)
(4.1)
(42.2)
(13.6)
(273.3)
Allocation of capital
464.7
433.3
36.5
63.9
(998.4)
-
Common shareholders' equity
3,179.1
$
1,626.4
$
142.1
$
213.4
$
(925.1)
$
4,235.9
$
June 30, 2008
Common shareholders' equity, excluding accumulated other
comprehensive income (loss) and net operating loss carryforwards
(a non-GAAP financial measure)
1,624.4
$
1,307.0
$
115.0
$
96.0
$
(258.3)
$
2,884.1
$
Net operating loss carryforwards
1,137.2
-
-
-
-
1,137.2
Accumulated other comprehensive income (loss)
(323.9)
(277.2)
(18.1)
(2.5)
(17.5)
(639.2)
Allocation of capital
541.4
435.7
38.3
32.0
(1,047.4)
-
Common shareholders' equity
2,979.1
$
1,465.5
$
135.2
$
125.5
$
(1,323.2)
$
3,382.1
$

Information Related to Certain Non-GAAP Financial Measures
84
(Continued from previous page)
A reconciliation of average common shareholders’ equity, excluding accumulated other comprehensive income (loss) and net operating loss
carryforwards (a non-GAAP financial measure) to average common shareholders’ equity at June 30, 2008, is as follows (dollars in millions):
Other Business
CIG
Bankers
Colonial Penn
in Run-off
Corporate
Total
Average common shareholders' equity, excluding accumulated
other comprehensive income (loss) and net operating loss
carryforwards (a non-GAAP financial measure)
1,449.4
$
1,302.3
$
111.6
$
167.5
$
(4.0)
$
3,026.8
$
Average net operating loss carryforwards
1,358.5
Average accumulated other comprehensive income (loss)
(510.9)
Average common shareholders' equity
3,874.4
$
Return on equity ratios:
Return on equity
-25.4%
Operating return (less the Q2 2006 charge related to the
litigation settlement and refinements to such estimates
recognized in subsequent periods, the Q3 2007 charge
related to a coinsurance transaction, the Q4 2007 and
Q2 2008 valuation allowance for deferred tax assets) on
common equity, excluding accumulated other compre-
hensive income (loss) and net operating loss carry-
forwards (a non-GAAP financial measure)
3.4%
5.1%
12.5%
6.6%
NM
3.6%

Information Related to Certain Non-GAAP Financial Measures
85
Debt to capital ratio, excluding accumulated other comprehensive income (loss)
This non-GAAP financial measure differs from the debt to capital ratio because accumulated other comprehensive income has been excluded
from the value of capital used to determine this measure. Management believes this non-GAAP financial measure is useful because it removes
the volatility that arises from changes in accumulated other comprehensive income. Such volatility is often caused by changes in the estimated
fair value of our investment portfolio resulting from changes in general market interest rates rather than the business decisions made by
management.

Information Related to Certain Non-GAAP Financial Measures
86
A reconciliation of the debt to capital ratio to debt to capital, excluding accumulated other comprehensive loss is as follows (dollars in millions):
Q2 07
Q3 07
Q4 07
Q1 08
Q2 08
Corporate notes payable
1,197.8
$
1,195.7
$
1,193.7
$
1,191.7
$
1,189.7
$
Total shareholders' equity
4,356.1
4,285.5
4,235.9
3,939.7
3,382.1
Total capital
5,553.9
5,481.2
5,429.6
5,131.4
4,571.8
Less accumulated other comprehensive loss
329.9
316.0
273.3
565.6
639.2
Total capital, excluding accumulated other
comprehensive loss
(a non-GAAP financial measure)
5,883.8
$
5,797.2
$
5,702.9
$
5,697.0
$
5,211.0
$
Corporate notes payable
1,197.8
$
1,195.7
$
1,193.7
$
1,191.7
$
1,189.7
$
Corporate notes payable to capital ratios:
Corporate debt to total capital
21.6%
21.8%
22.0%
23.2%
26.0%
Corporate debt to total capital, excluding
accumulated other comprehensive loss
(a non-GAAP financial measure)
20.4%
20.6%
20.9%
20.9%
22.8%