
Conseco, Inc.
Investment Portfolio
As of June 30, 2008

Due to the current economic environment and the various questions we have received about our investment portfolio, we are
providing this report on Conseco’s Investment Portfolio as of June 30, 2008.
On August 18, 2008, Conseco, Inc. (the “Company”) filed a Form 8-K to report the issuance of additional financial information
related to the Company’s Investment Portfolio as of June 30, 2008.
The information contained under Item 7.01 in the Report on Form 8-K (including Exhibit 99.1) is furnished and shall not be deemed “filed” for the purposes
of Section 18 of the Securities and Exchange Act of 1934, as amended (the “Exchange Act”), or otherwise subject to the liabilities of that Section. The
information contained in the Report on Form 8-K shall not be incorporated by reference into any registration statement or other document pursuant to the
Securities Act of 1933, as amended, or the Exchange Act, except as shall be expressly set forth by specific reference in any such filing.
Conseco, Inc.’s insurance companies help protect working American families and seniors from financial adversity: Medicare
supplement, long-term care, cancer, heart/stroke and accident policies protect people against major unplanned expenses;
annuities and life insurance products help people plan for their financial futures. For more information, visit Conseco’s web site
at www.conseco.com.
Conseco, Inc. Investment Portfolio as of June 30, 2008

Summary
Our goal is stable and predictable investment performance
Diversified and liquid investment portfolio
Portfolio migration and MTM trends consistent with credit cycle and overall
credit market
Risk controls include credit policy, asset liability management, hedging, and
compliance
Experienced investment professionals (including 14 CFA Charterholders, 2
CPAs, 9 MBAs, and 2 JDs) - diverse fixed income disciplines
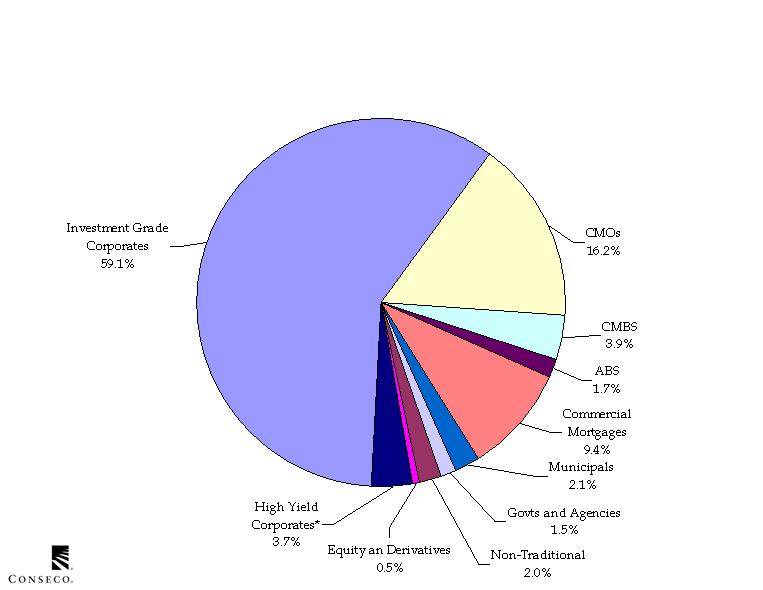
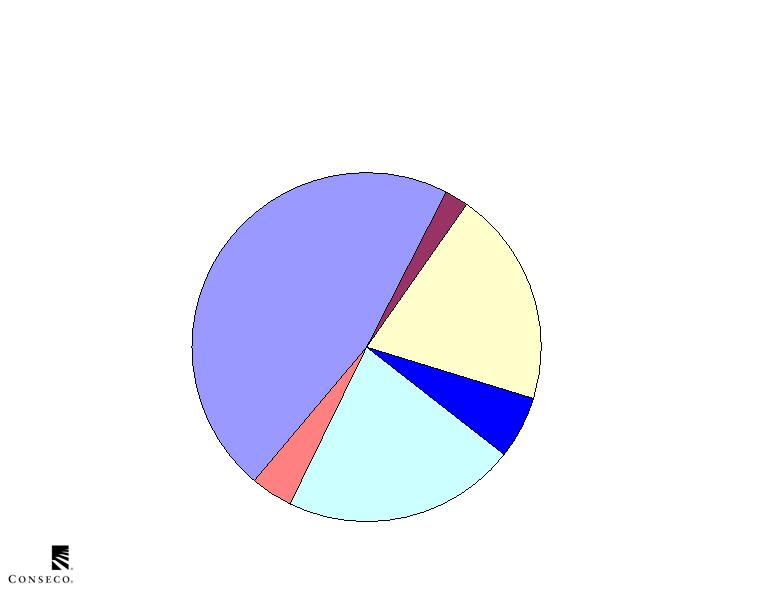
Asset Allocation
*Excludes variable interest entity
As of 6/30/2008
(Allocations based on book values)
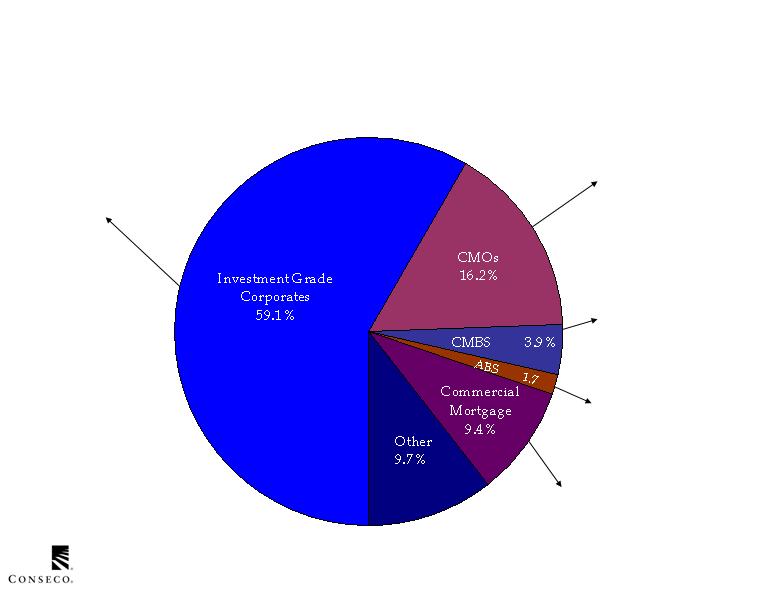
Our diversified investment portfolio allocation emphasizes traditional insurance sectors

Asset Allocation
As of 6/30/2008
$Millions
Qualitative and MTM trends are consistent with expectations and credit cycle
*Excludes variable interest entity
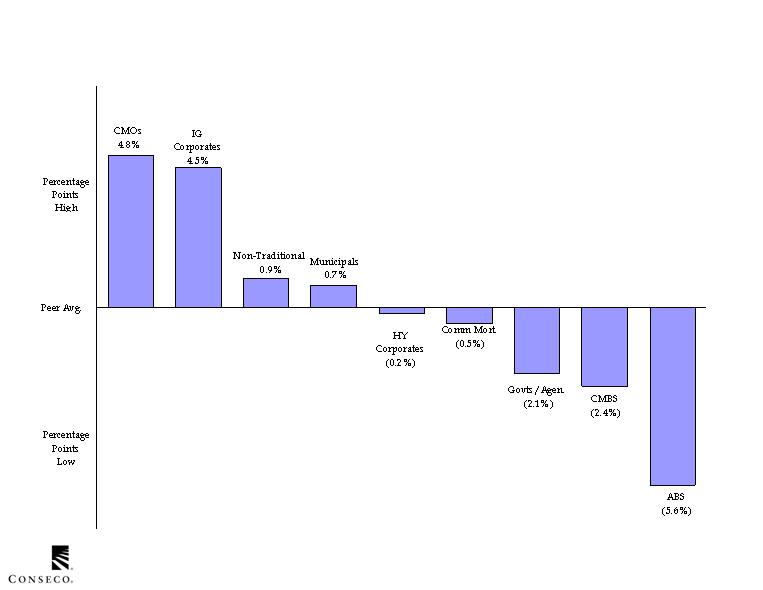
Asset Allocation
As of 6/30/2008
Peer averages comprised of Genworth, Lincoln, Principal, Phoenix, Protective Life, and Reinsurance Group of America
Relative portfolio allocations vs. peer averages
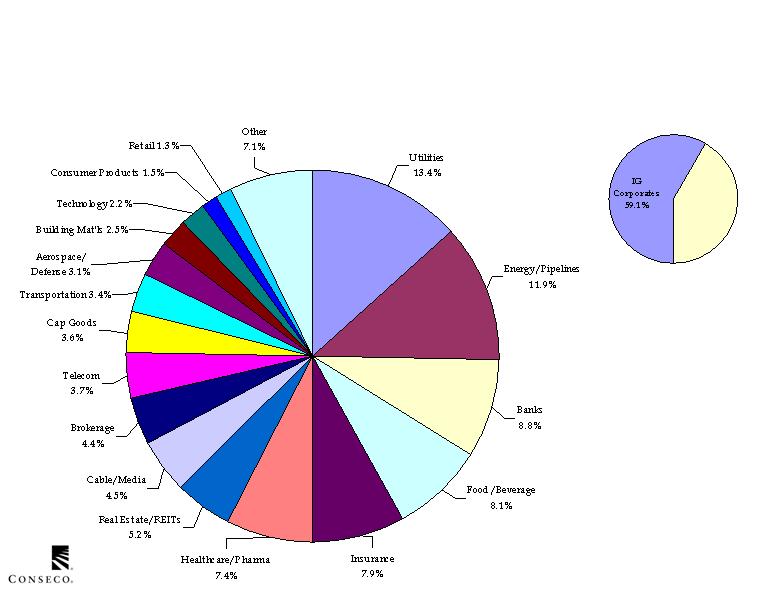
Investment Grade Corporates
As of 6/30/2008
Our IG Corporate allocation is diversified and emphasizes
traditionally less cyclical sectors

High Yield Corporates
As of 6/30/2008
Our HY Corporate allocation is diversified and is weighted away from cyclicals
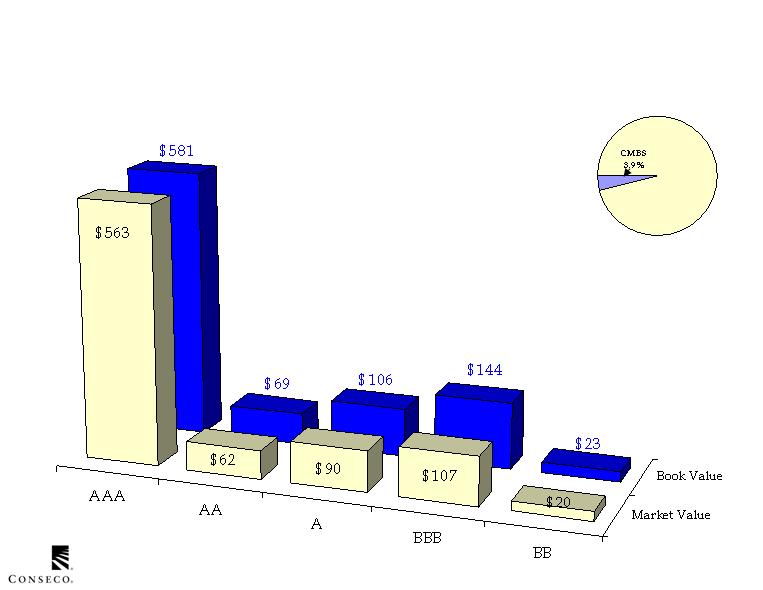
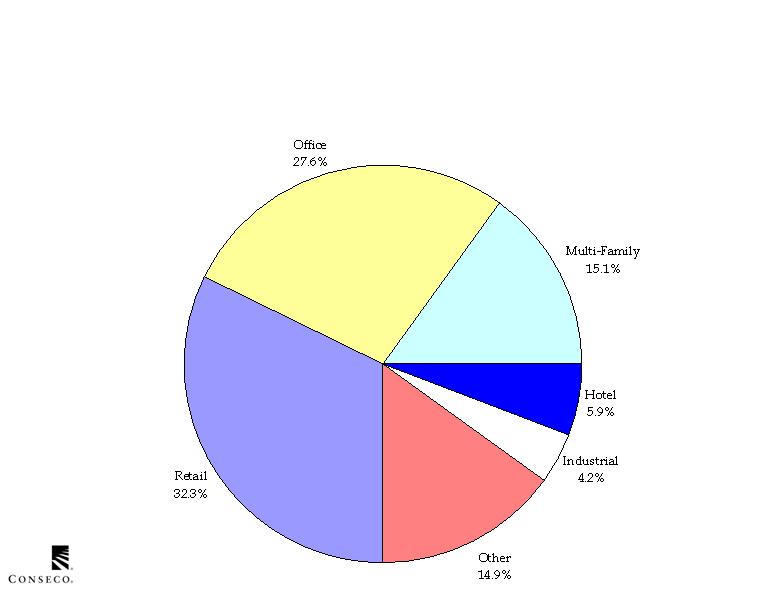
CMBS
As of 6/30/2008
$Millions
Our CMBS exposure emphasizes AAA and AA categories (more than 70%)

CMBS
As of 6/30/2008
Our CMBS exposure is heavily weighted toward older vintages
with stronger qualitative characteristics and seasoning
Our CMBS are backed by a diverse pool of underlying collateral –
$90 billion, from more than 7,700 commercial mortgage loans
CMBS
As of 4/30/2008

CMBS
South
Atlantic
19.2%
New
England
4.0%
East South
Central
2.0%
West South
Central
7.6%
Pacific
18.1%
Middle
Atlantic
19.4%
Mountain
7.0%
As of 6/30/2008
West North
Central
2.6%
East North
Central
8.4%
Underlying collateral is geographically diverse
Multiple
Regions
11.7%
CMBS
Collateral
DSCR
LTV
Occupancy
Cap rate
Rent rolls
Geographic distribution
Industry distribution
Collateral rating/credit grade
distribution
IO loans
NOI trends
TI/LC reserves
Sponsor
Structure
Surveillance
Property/company and
management overview
Origination practices
Underwriting
Monitoring and collection
process
Quality control
Trust structure
Cash flow allocation
Mechanics of credit/
enhancement/protection
Servicer
Stress tests
Rating
Term/Yield/Duration vs.
portfolio
Prepayment projections
Monitor rating versus
performance
Identify underperforming
assets/transactions which could
lead to rating change
Projections on defaults
delinquencies, and recoveries
Projected cash flows and credit
support levels
Stress tests
We track our CMBS using a robust underwriting and surveillance process
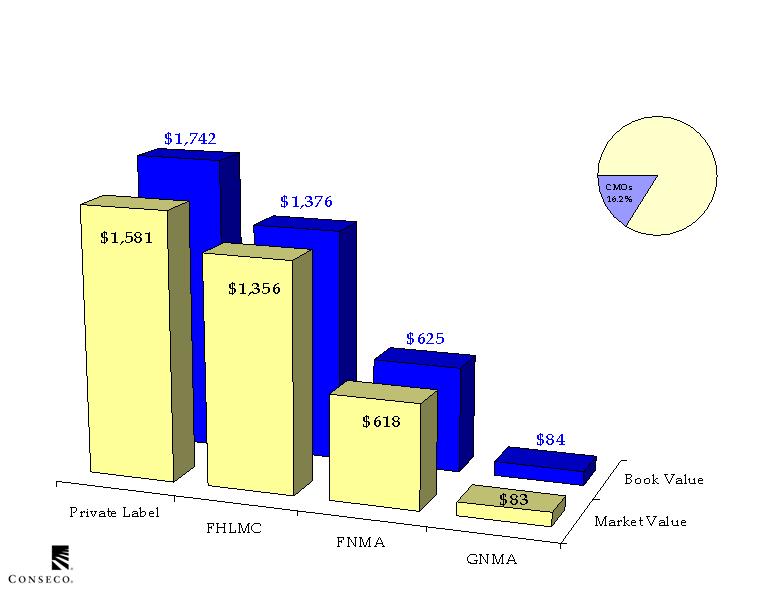
CMOs
As of 6/30/2008
$Millions
Our CMO portfolio is approximately 50% GSE guaranteed
and is more than 99% AAA rated
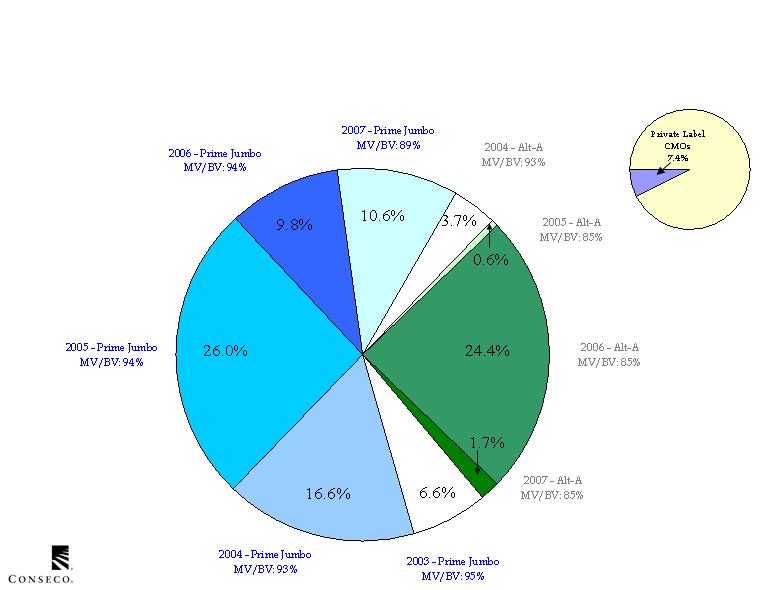
CMOs
As of 6/30/2008
$Millions
Our private label CMOs are diversified by type
and vintage and are more than 98% AAA rated
As of 6/30/2008
CMOs
Sequential
46.5%
Eff. Duration: 7.18
Convexity: (0.83)
Pass Through
3.9%
Eff. Duration: 4.95
Convexity: (0.90)
NAS
21.8%
Eff. Duration: 8.82
Convexity: 0.16
TAC/Accretion Directed
5.7%
Eff. Duration: 7.36
Convexity: (0.20)
PAC
19.8%
Eff. Duration: 8.81
Convexity: 0.10
Z-Tranche
2.3%
Eff. Duration: 16.7
Convexity: (1.77)
Our CMO portfolio has moderate cash flow volatility
As of 6/30/2008
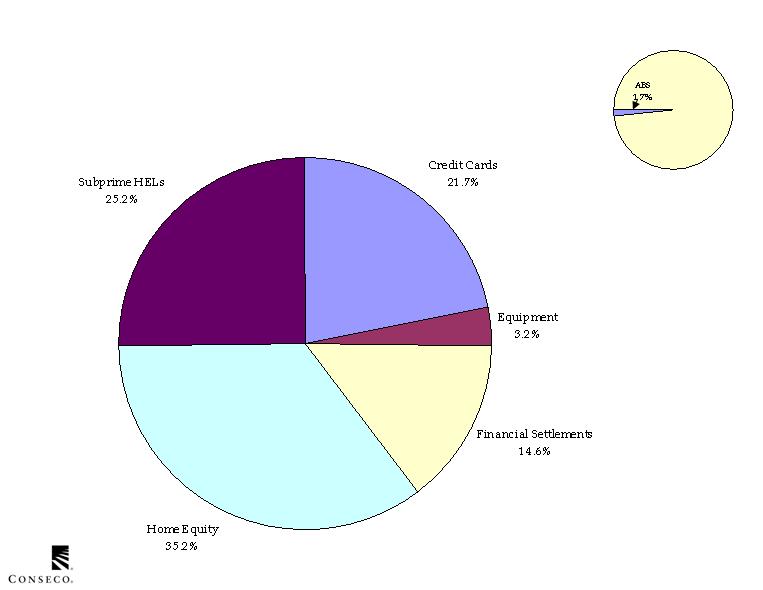
Asset Backed Securities
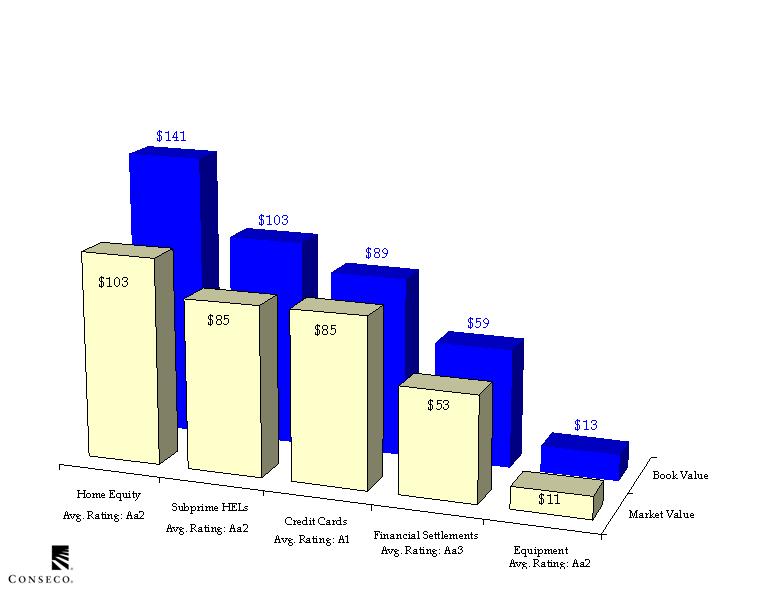
Asset Backed Securities
As of 6/30/2008
$Millions
Subprime HEL and HELOC valuations reflect challenging MTM
environment for mortgage securities
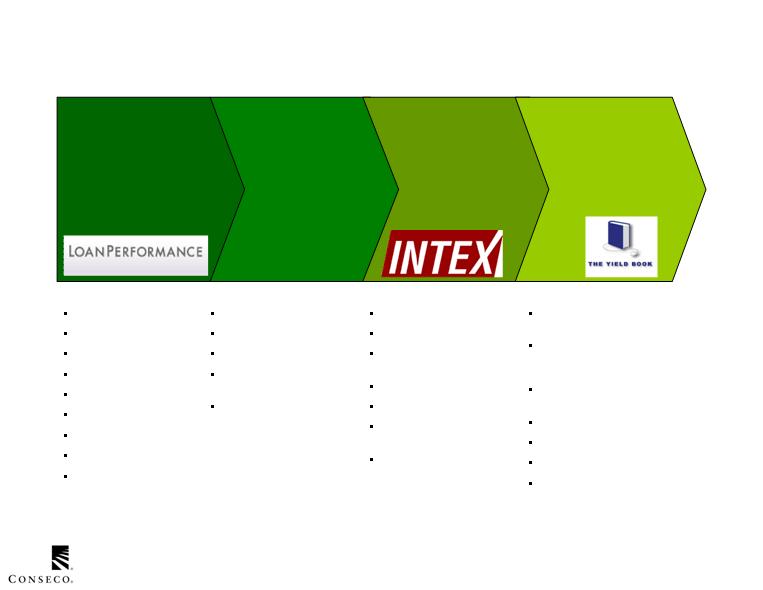
ABS/CMO
Collateral
Debt-to-Income
Loan-to-Value
Occupancy type
Geographic distribution
Credit score
IO loans
Documentation
Loan tapes
Loan Performance Platform
Sponsor
Structure
Surveillance
Origination practices
Underwriting practices
Servicer quality
Monitoring and collection
process
Quality control
Trust structure
Cash flow allocation
Mechanics of credit/
enhancement/protection
Stepdowns
Rating
Term/Yield/Duration vs.
portfolio
Intex Platform
Collateral performance review:
variance attribution
Stochastics on defaults,
delinquencies, recoveries,
prepayments, and cash flows
Trends in credit support relative
to delinquencies and losses
Projected cash coverages
Principal payment windows
Projected collateral writedowns
Yield Book Platform
We have a robust analytical process for residential mortgage securities
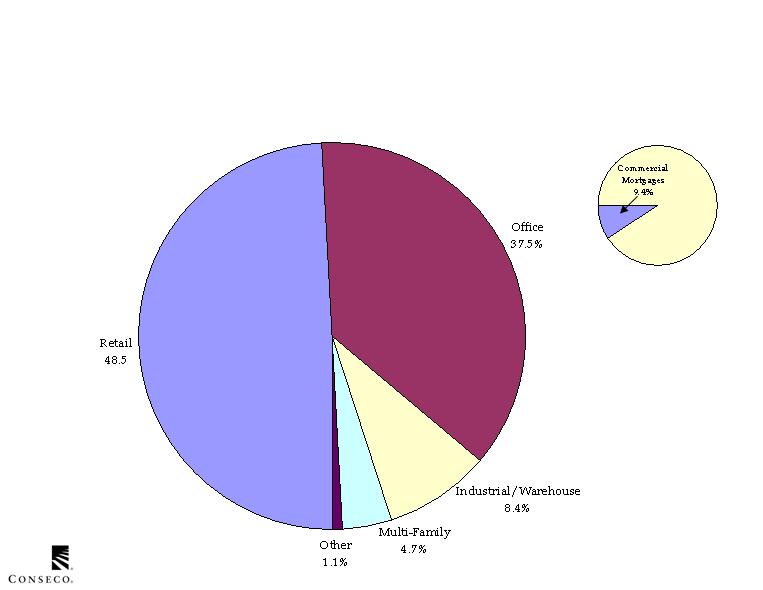
Commercial Mortgages
As of 6/30/2008
Our commercial mortgage loan allocation includes credit tenant loans

Commercial Mortgages
South
Atlantic
21.7%
New
England
9.1%
East South
Central
5.4%
West South
Central
5.9%
Pacific
6.8%
Middle
Atlantic
8.1%
Mountain
10.2%
As of 6/30/2008
West North
Central
13.5%
East North
Central
19.3%
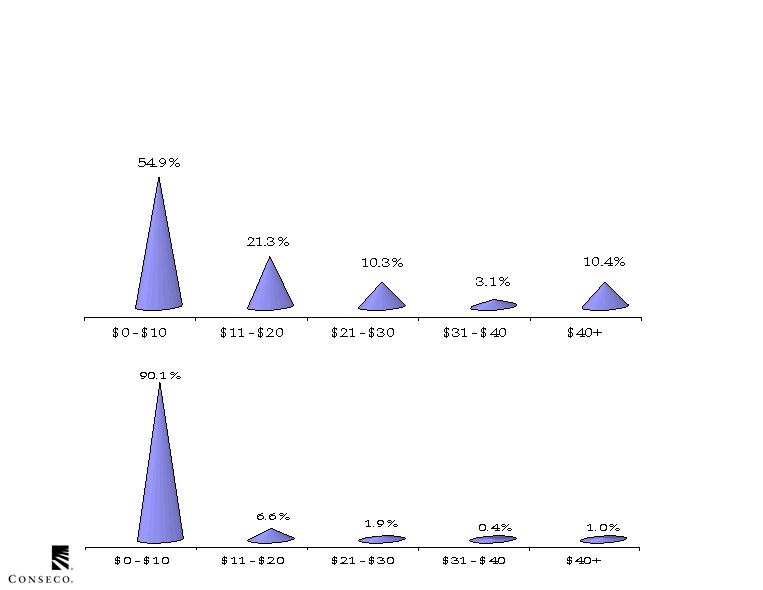
Commercial Mortgages
As of 6/30/2008
$Millions
Loan Balance
Number of Loans
Our portfolio tends toward a large number of loans
with few large exposures
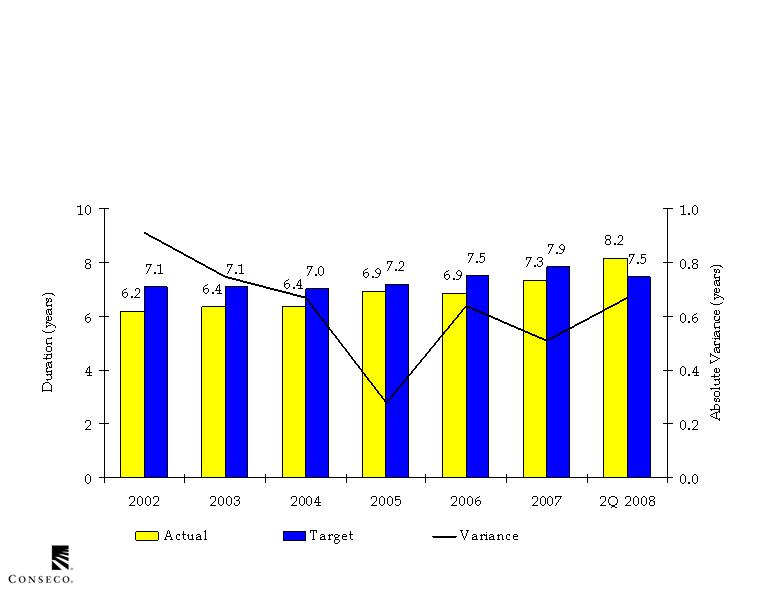
Our asset portfolio has lengthened to better
match our insurance liabilities
Asset Liability Management
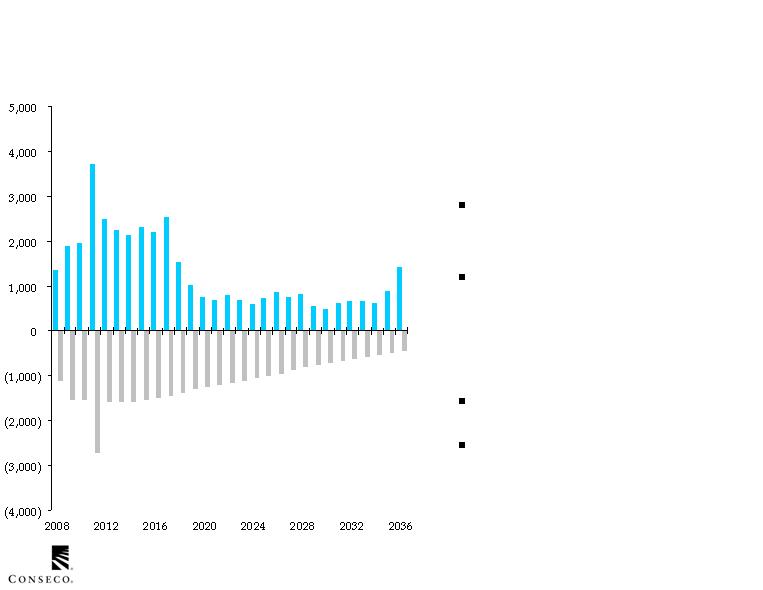
Asset Liability Management
We use projections of Asset and Liability cash flows to
articulate opportunities and risks
Simulation analysis,
including cash flow testing
Portfolio gap analysis,
including maturity analysis
and interest rate sensitivity
analysis
Optimization analysis
Investment and mitigation
strategies
$Millions

Metrics
Uses / Results
Duration
Convexity
Yield
Projected cash flow
Investment income
Surplus
Product management
Planning
Income
Capital
Surplus management
Cash flow testing
Asset Liability Management
Statutory
Portfolios
Life
Annuity
Spec. Disease
LTC
Asset segmentation focuses on product segment needs
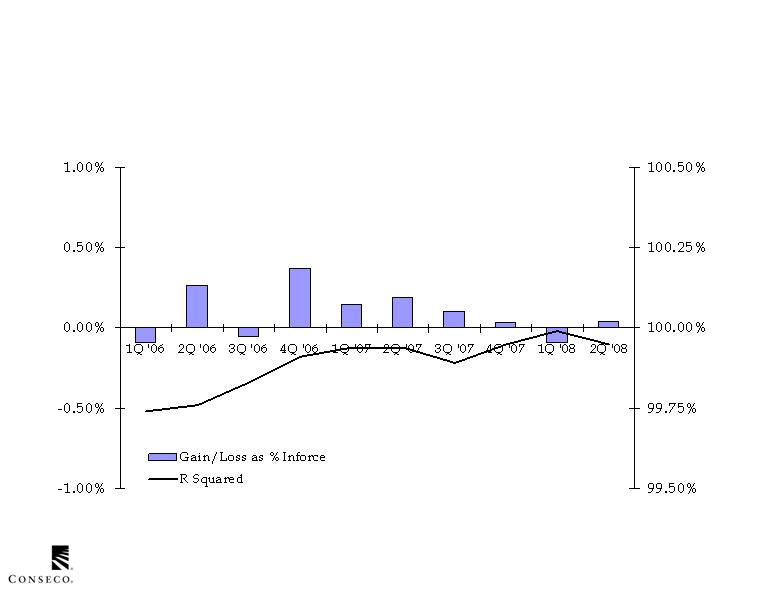
Asset Liability Management
% Inforce
Our EIA hedging process demonstrates effective results
R Squared

Risk Management
Systemic risks we closely monitor
Widening of general credit spreads
Volatility of interest rates
Directional movements in prices and volatilities of equity indices
Changes in the level of the yield curve
Changes in asset valuations
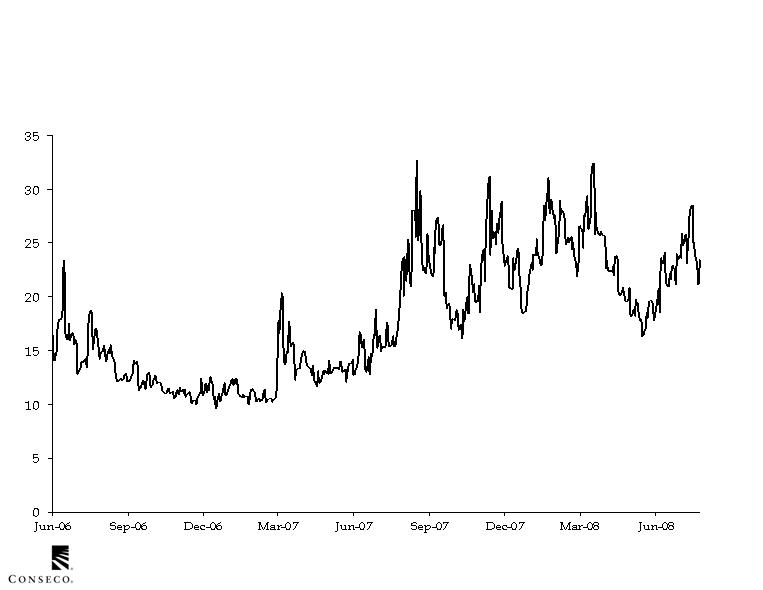
Risk Management
Equity Volatility
(VIX)
Vix
Source: Bloomberg
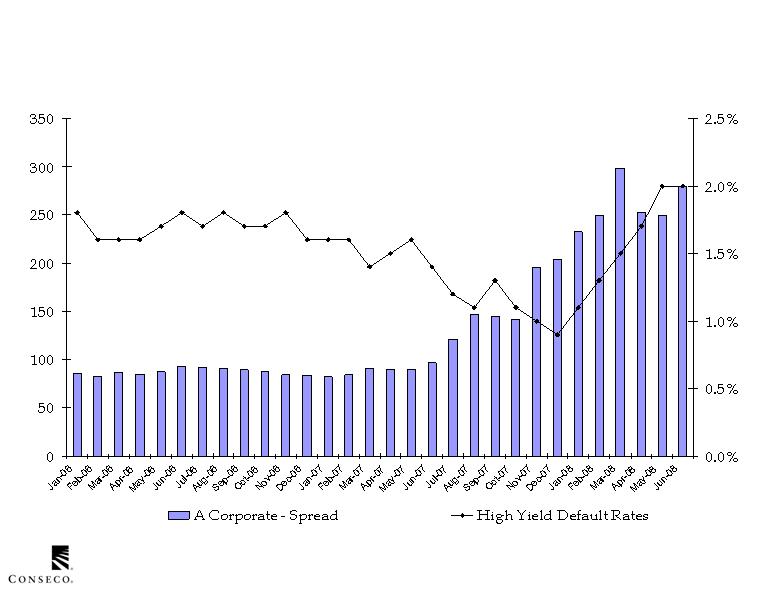
Risk Management
Corporate Spreads and
Default Rates
Source: Lehman and Moody’s
Spread
Default
Rate
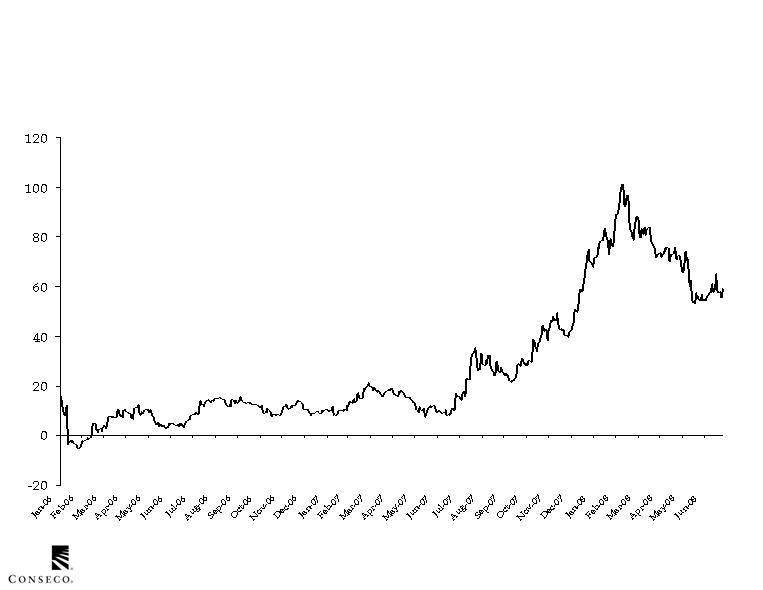
Risk Management
10 Year vs. 30 Year Treasuries
Source: Lehman
Spread

Risk Management
Home Prices
(Year-Over-Year Change)
Source: S&P/Case-Shiller

Proactive approach to controlling key risks
Documented guidelines for risk policies and risk capacity
Monitoring and enforcing adherence to our risk policies
Measuring quantifiable risks using proven methodologies and market-consistent
values
Fundamental credit surveillance
Senior oversight of capital commitments involving less liquid assets
Extensive use of third parties to value invested assets
Independent data integrity function
Risk Management
Subprime allocation reflects
severe market discount and
high delinquencies in 2006
and 2007 vintages
HEL allocation reflects market
stresses
As of 6/30/2008
Risk Management
Overall mark-to-market and
credit migration consistent
with credit cycle
Pressure on financials
Highly rated, highly liquid
Satisfactory performance, with
some pressure on ALT-A’s
Low, but rising delinquency trends
Seasoned portfolio
Pricing pressure on BBB exposure
bears careful surveillance
Increases in delinquencies could
result from slowing economy
Active surveillance and portfolio
management
Managing through the credit cycle by emphasizing long-term
assessments of value and quality
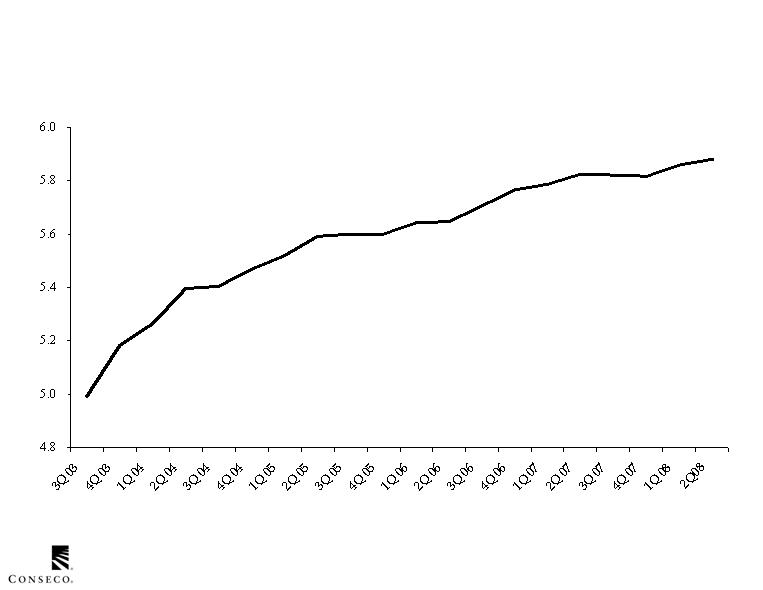
Performance
Yield*
Our investment yield has trended favorably in recent periods
* Gross yields before investment expenses

Conseco, Inc.
Investment Portfolio
As of June 30, 2008