
Third Quarter 2008
Financial and Operating Results
For the period ended September 30, 2008
Conseco, Inc.

Forward-Looking Statements
Cautionary Statement Regarding Forward-Looking Statements. Our statements, trend analyses and other information contained in these
materials relative to markets for Conseco’s products and trends in Conseco’s operations or financial results, as well as other statements, contain
forward-looking statements within the meaning of the federal securities laws and the Private Securities Litigation Reform Act of 1995. Forward-
looking statements typically are identified by the use of terms such as “anticipate,” “believe,” “plan,” “estimate,” “expect,” “project,” “intend,”
“may,” “will,” “would,” “contemplate,” “possible,” “attempt,” “seek,” “should,” “could,” “goal,” “target,” “on track,” “comfortable with,” “optimistic” and
similar words, although some forward-looking statements are expressed differently. You should consider statements that contain these words
carefully because they describe our expectations, plans, strategies and goals and our beliefs concerning future business conditions, our results
of operations, financial position, and our business outlook or they state other ‘‘forward-looking’’ information based on currently available
information. Assumptions and other important factors that could cause our actual results to differ materially from those anticipated in our forward-
looking statements include, among other things: (i) general economic, market and political conditions, including the performance and
fluctuations of the financial markets which may affect our ability to raise capital or refinance our existing indebtedness; (ii) our ability to obtain
adequate and timely rate increases on our supplemental health products including our long-term care business; (iii) mortality, morbidity, the
increased cost and usage of health care services, persistency, the adequacy of our previous reserve estimates and other factors which may
affect the profitability of our insurance products; (iv) changes in our assumptions related to the cost of policies produced or the value of policies
inforce at the Effective Date; (v) the recoverability of our deferred tax asset and the effect of potential tax rate changes on its value; (vi) changes
in accounting principles and the interpretation thereof; (vii) our ability to achieve anticipated expense reductions and levels of operational
efficiencies including improvements in claims adjudication and continued automation and rationalization of operating systems; (viii) performance
and valuation of our investments, including the impact of realized losses (including other-than-temporary impairment charges); (ix) our ability to
identify products and markets in which we can compete effectively against competitors with greater market share, higher ratings, greater
financial resources and stronger brand recognition; (x) the ultimate outcome of lawsuits filed against us and other legal and regulatory
proceedings to which we are subject; (xi) our ability to remediate the material weakness in internal controls over the actuarial reporting process
that we identified at year-end 2006 and to maintain effective controls over financial reporting; (xii) our ability to continue to recruit and retain
productive agents and distribution partners and customer response to new products, distribution channels and marketing initiatives; (xiii) our
ability to achieve eventual upgrades of the financial strength ratings of Conseco and our insurance company subsidiaries as well as the potential
impact of rating downgrades on our business; (xiv) the risk factors or uncertainties listed from time to time in our filings with the Securities and
Exchange Commission; (xv) our ability to continue to satisfy the financial ratio and balance requirements and other covenants of our debt
agreements; (xvi) regulatory changes or actions, including those relating to regulation of the financial affairs of our insurance companies, such
as the payment of dividends to us, regulation of financial services affecting (among other things) bank sales and underwriting of insurance
products, regulation of the sale, underwriting and pricing of products, and health care regulation affecting health insurance products; (xvii)
changes in the Federal income tax laws and regulations which may affect or eliminate the relative tax advantages of some of our products; and
(xviii) the receipt of regulatory approval and consummation of the plan to transfer Senior Health Insurance Company of Pennsylvania to an
independent trust. Other factors and assumptions not identified above are also relevant to the forward-looking statements, and if they prove
incorrect, could also cause actual results to differ materially from those projected. All written or oral forward-looking statements attributable to us
are expressly qualified in their entirety by the foregoing cautionary statement. Our forward-looking statements speak only as of the date
made. We assume no obligation to update or to publicly announce the results of any revisions to any of the forward-looking statements to reflect
actual results, future events or developments, changes in assumptions or changes in other factors affecting the forward-looking statements.
2

Non-GAAP Measures
This presentation contains the following financial measures that differ from the comparable measures
under Generally Accepted Accounting Principles (GAAP): operating earnings measures; book value
excluding accumulated other comprehensive income (loss) per diluted share; operating return measures;
earnings before net realized investment gains (losses) and corporate interest and taxes; debt to capital
ratios, excluding accumulated other comprehensive income (loss); and interest-adjusted benefit ratios.
Reconciliations between those non-GAAP measures and the comparable GAAP measures are included
in the Appendix, or on the page such measure is presented.
While management believes these measures are useful to enhance understanding and comparability of
our financial results, these non-GAAP measures should not be considered substitutes for the most
directly comparable GAAP measures.
Additional information concerning non-GAAP measures is included in our periodic filings with the
Securities and Exchange Commission that are available in the “Investor – SEC Filings” section of
Conseco’s website, www.conseco.com.
3

Q3 2008 Summary
4
CNO
All four segments profitable, with total Q3 2008 EBIT exceeding
$100 million
Improved results at Bankers
Key driver was improvement in LTC results
$97.0 million quarterly sales for CNO, up 13% over Q3 2007
Bankers sales up 16%
Colonial Penn sales up 6%
CIG sales up 5%
Separation of Senior Health* expected to occur in Q4 2008
*Senior Health Insurance Company of Pennsylvania, formerly known as Conseco Senior Health Insurance
Company prior to its name change in October 2008.

Q3 2008 Summary
5
CNO
Investment portfolio earned yields meeting expectations and
impairment losses consistent with industry trends and market
conditions
Net realized investment losses of $85.9 million (including $50
million of impairment losses)
Accumulated other comprehensive loss increased from $0.6
billion at 6/30/08 to $1.1 billion at 9/30/08, driven by wider credit
spreads
Company is in compliance with all covenants of bank facility

Why CNO is Different
6
Not ratings-dependent
Virtually no variable business
Focus on protection products
Small average policy sizes
No significant investments in exotic securities
No dynamic hedging
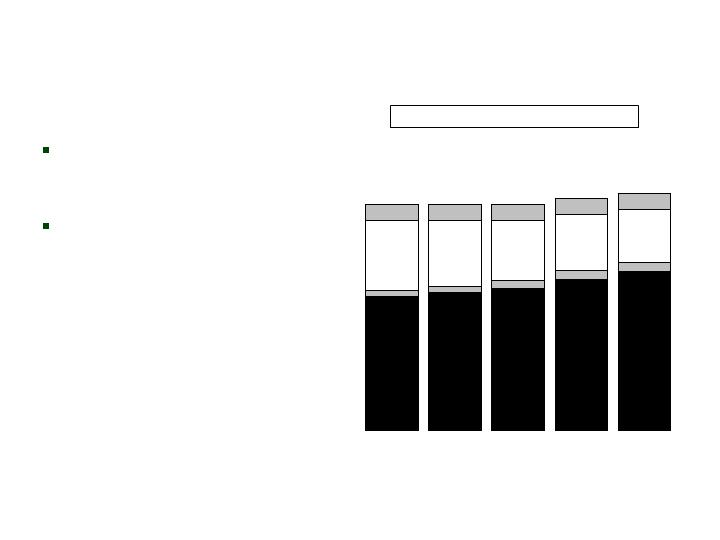
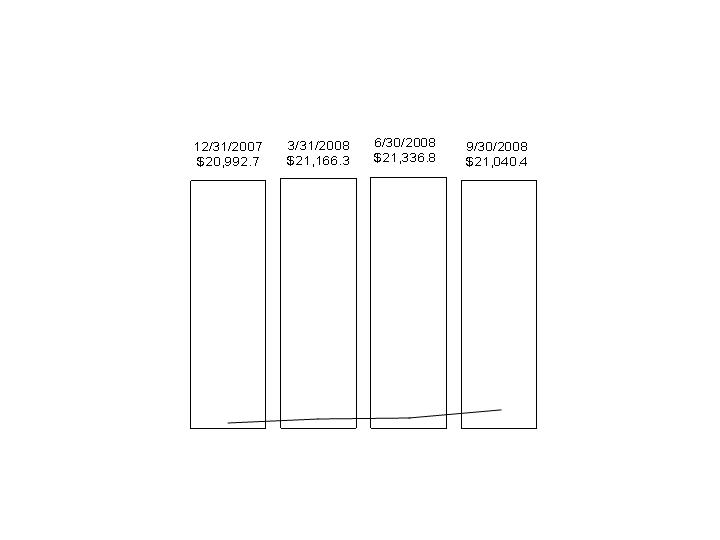
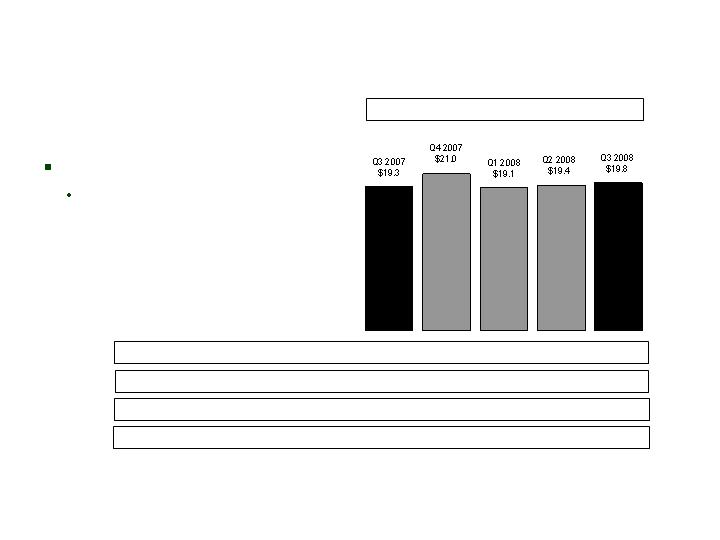
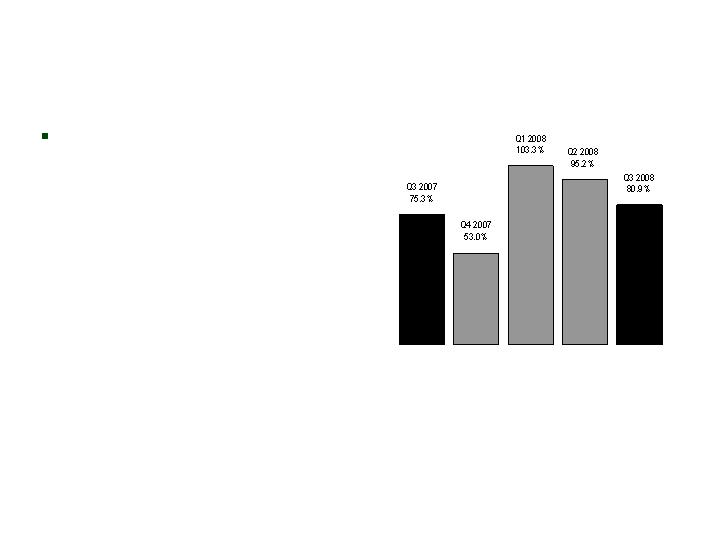
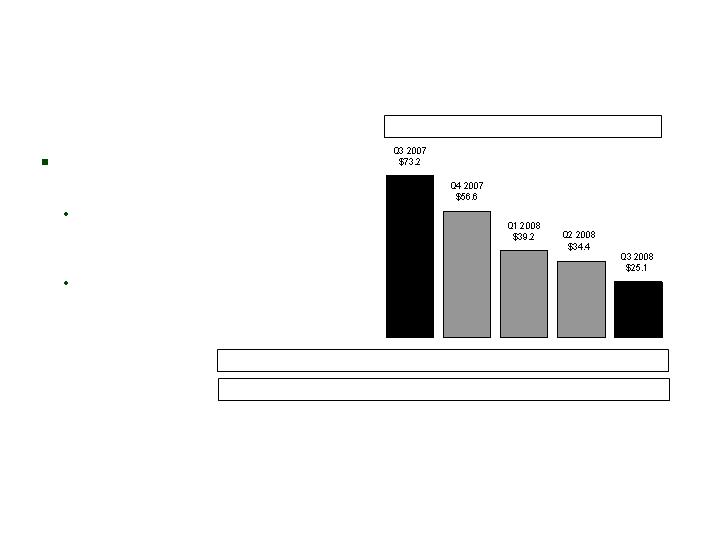
Collected Premiums
7
CNO
Strong, consistent
growth in Bankers
and Colonial Penn
Moderating decline
in CIG due to focus
on more profitable
business
BLC
Q3 2007
$4,315.1
Q4 2007
$4,314.1
Q1 2008
$4,322.3
($ millions)
CP
CIG
Run-Off
Collected Premiums-Trailing 4 Quarters
Q2 2008
$4,428.4
Q3 2008
$4,527.6

Bankers Life
Colonial Penn
Conseco Insurance Group
LTC Run-off Block
Corporate and interest expense
Income before net realized investment losses*
Net realized investment losses
Losses related to the transfer of Senior Health
Total
Q3 2008
Summary of Results
8
CNO
$67.8
6.5
36.1
2.9
(20.4)
92.9
(85.9)
(144.2)
$(137.2)
Pre-Tax
After Tax
EPS
($ millions, except per share amounts)
$58.9
(85.9)
(155.0)
$(182.0)
$0.32
(0.46)
(0.84)
$(0.98)
*Management believes that an analysis of earnings before net realized investment gains (losses) (including losses
related to the transfer of Senior Health to an independent trust) and taxes (a non-GAAP financial measure) provides
an alternative measure of the operating results of the company because it excludes net realized gains (losses) that
are unrelated to the company’s underlying fundamentals. The table above provides a reconciliation to the
corresponding GAAP measure.
**See Appendix for a reconciliation to the corresponding GAAP measure.
**

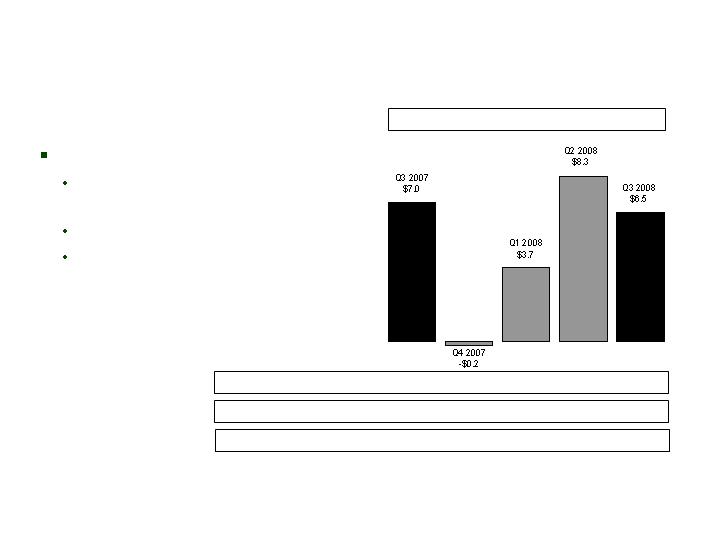
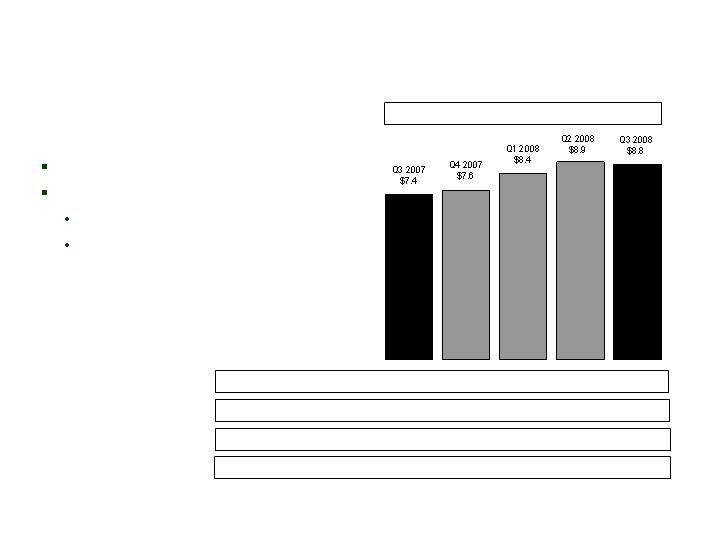
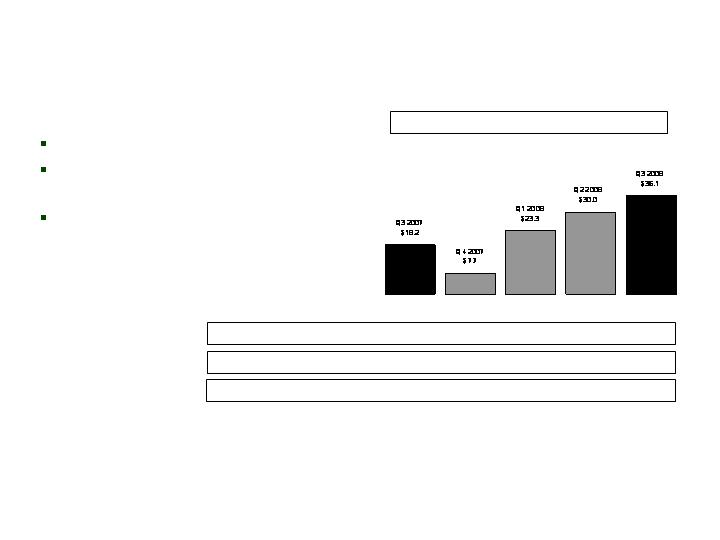
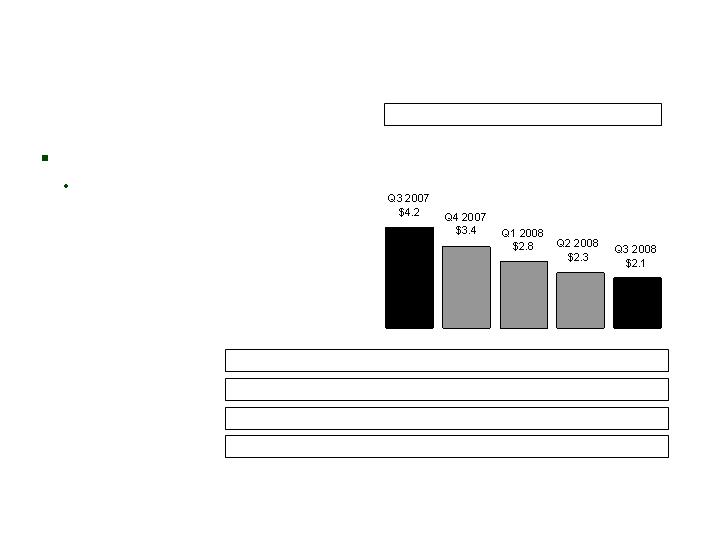
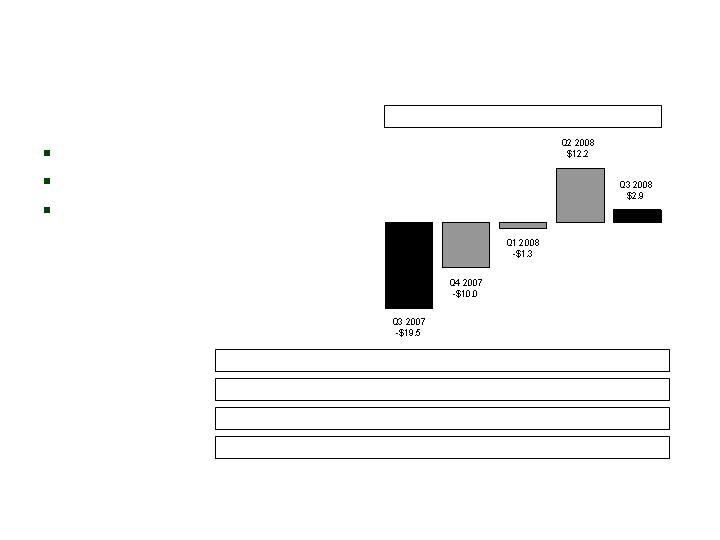
Q3 Earnings
9
CNO Consolidated
*Management believes that an analysis of earnings before net realized investment gains (losses) (including losses
related to the transfer of Senior Health to an independent trust) and corporate interest and taxes (“EBIT,” a non-
GAAP financial measure) provides an alternative measure to compare the operating results of the company
quarter-over-quarter because it excludes: (1) corporate interest expense; and (2) net realized gains (losses) that
are unrelated to the company’s underlying fundamentals. The table above provides a reconciliation of EBIT to net
income applicable to common stock.
($ millions)
Q3 2007
(Restated)
Q1 2008
Q2 2008
Q3 2008
Bankers Life
$67.5
$29.1
$34.6
$67.8
Colonial Penn
7.0
3.7
8.3
6.5
Conseco Insurance Group
18.2
23.3
30.0
36.1
Other Business in Run-Off
(19.5)
(1.3)
12.2
2.9
Corporate operations, excluding interest expense
2.3
(6.7)
(18.5)
(6.7)
EBIT, excluding costs related to a litigation settlement
and the loss related to an annuity coinsurance transaction
75.5
48.1
66.6
106.6
Costs related to a litigation settlement
(16.4)
0.0
0.0
0.0
Loss related to an annuity coinsurance transaction
(76.5)
0.0
0.0
0.0
Total EBIT*
(17.4)
48.1
66.6
106.6
Corporate interest expense
(20.2)
(16.4)
(13.9)
(13.7)
Income (loss) before net realized investment losses and taxes
(37.6)
31.7
52.7
92.9
Tax expense (benefit) on period income
(15.9)
11.0
19.3
34.0
Net operating income (loss)
(21.7)
20.7
33.4
58.9
Net realized investment losses, net of related amortization and taxes
(31.0)
(26.5)
(16.8)
(85.9)
Net loss applicable to common stock before losses related
to the transfer of Senior Health to an independent trust
(52.7)
(5.8)
16.6
(27.0)
Recognition of losses related to the transfer of Senior Health
to an independent trust
0.0
0.0
(503.7)
(155.0)
Net loss applicable to common stock
($52.7)
($5.8)
($487.1)
($182.0)

Q3 2008 Results at Favorable End
of Preliminary Ranges
10
CNO Consolidated
Operating results ($ in millions)
Total EBIT
Corporate interest expense
Income before net realized investment losses and
taxes
Tax expense on period income
Net operating income
Net realized investment losses*
Net loss applicable to common stock before losses
related to the proposed transfer of Senior Health to
an independent trust
Recognition of losses related to the proposed transfer
of Senior Health to an independent trust
Net loss applicable to common stock
*Excluding the increase in unrealized losses on investments expected to be transferred to an
independent trust and net of related amortization and taxes and the establishment of a valuation
allowance for deferred tax assets related to such losses.
$95.0 - $105.0
(13.7)
81.3 – 91.3
28.3 – 32.3
53.0 – 59.0
(100.0) – (80.0)
(47.0) – (21.0)
(155.0)
$(202.0) - $(176.0)
$106.6
(13.7)
92.9
34.0
58.9
(85.9)
(27.0)
(155.0)
$(182.0)
Preliminary
Release
Final
Release
Three Months Ended 9/30/08
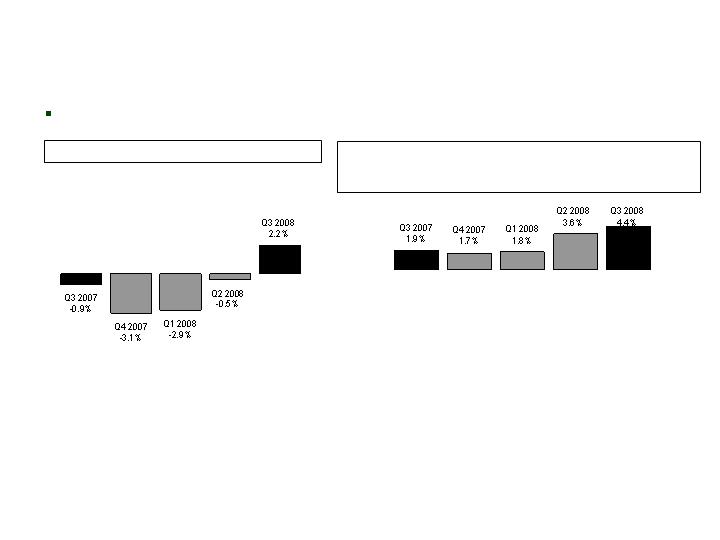
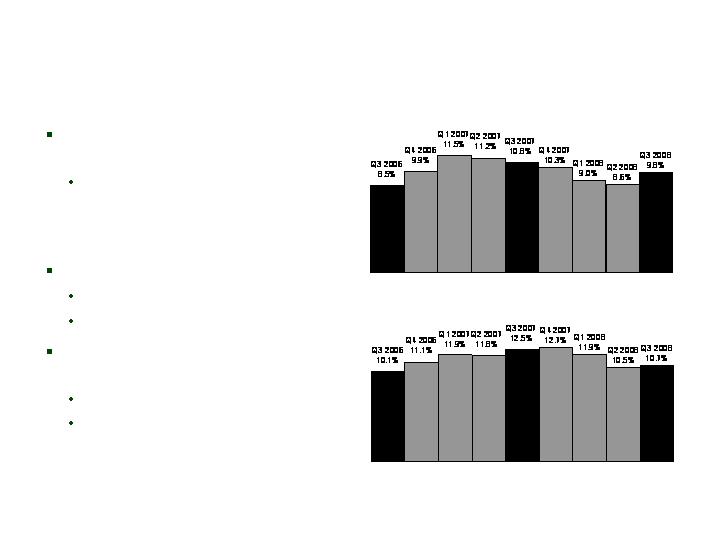
Operating ROE
11
CNO
Operating ROE*, Trailing 4 Quarters
Operating ROE (Before Litigation Settlement Charges, Annuity
Coinsurance Transaction and Tax Valuation Allowance)**,
Trailing 4 Quarters
*Operating return excludes net realized
investment gains (losses) and losses related to
the proposed transfer of Senior Health to an
independent trust. Equity excludes
accumulated other comprehensive income
(loss) and the value of net operating loss
carryforwards, and assumes conversion of
preferred stock. See Appendix for
corresponding GAAP measure.
**Operating return, as calculated and defined on the left side
of this page, but before: (1) Q2 2006 charge related to the
litigation settlement and refinements to such estimates
recognized in subsequent periods; (2) Q3 2007 charge
related to an annuity coinsurance transaction; and (3) Q4
2007 valuation allowance for deferred tax assets. See
Appendix for corresponding GAAP measure.
Conseco’s goal is to improve Operating ROE to 11% in 2009
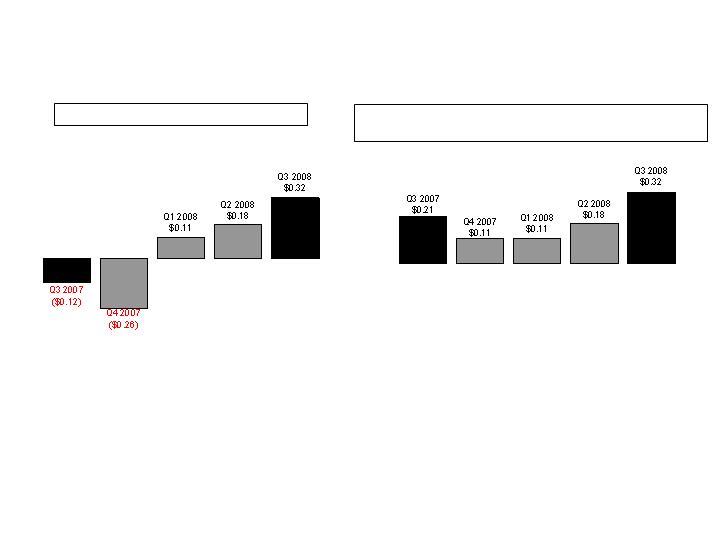
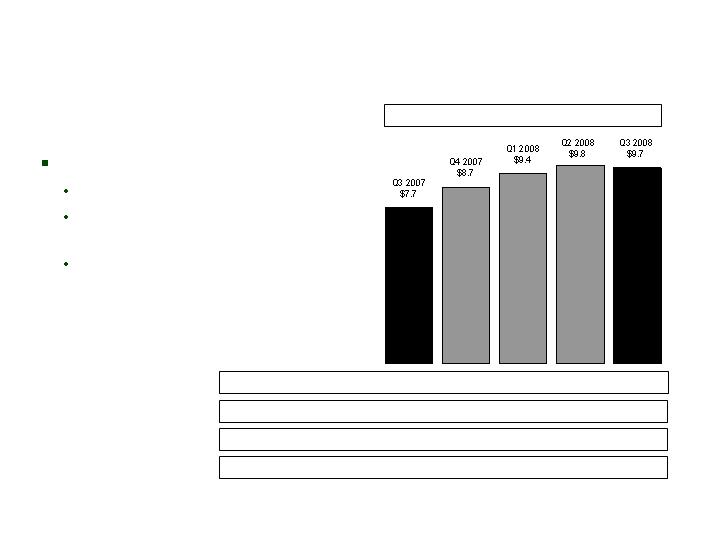
Operating EPS (Diluted)
12
CNO
Operating EPS (Before Litigation Settlement Charges, Annuity
Coinsurance Transaction and Tax Valuation Allowance**
**Operating earnings per share, before: (1) Q2 2006
charge related to the litigation settlement and
refinements to such estimates recognized in
subsequent periods; (2) Q3 2007 charge related to
an annuity coinsurance transaction; and (3) Q4 2007
valuation allowance for deferred tax assets. See
Appendix for corresponding GAAP measure.
Operating EPS*
*Operating earnings per share exclude net
realized investment gains (losses) and losses
related to the proposed transfer of Senior Health
to an independent trust. See Appendix for
corresponding GAAP measure.

Corporate liquidity
Available holding company liquidity in excess of $140 million at 9/30/08,
including revolver
Repurchased $37 million of our convertible debentures during October
2008 for $16 million, resulting in $21 million gain
Drew down $75 million on revolver during October 2008, which confirmed
the availability of these funds
Sources of and uses of funds, excluding insurance subsidiary dividends
Liquidity: Holding Company
Sources and Uses of Funds
13
CNO
($ millions)
Sources:
Interest on Surplus Debentures
Net Fees for Services Provided Under Intercompany Agreements
Uses:
Interest Expense on Corporate Debt
Operating Expenses
Net Impact
2007
$69.9
92.9
(72.3)
(42.9)
$47.6
YTD 2008
$41.5
63.8
(44.0)
(44.6)
$16.7

Senior Health Separation Transaction Update
Changed CSHI’s name to Senior Health Insurance Company of
Pennsylvania (Senior Health)
At closing, transferring Senior Health to an independent trust
(Senior Health Care Oversight Trust), into which the Transition
Trust will merge following regulatory approval
Contributing into Trust:
Senior Health, including its LTC business and its $121 million of
total adjusted statutory capital
$175 million of additional capital
Public comment period closed – responses to public comments
filed
Transaction expected to close in Q4 2008
14

Separation Transaction and
Related Charges
Charges recognized in Q2 2008
Recognition of unrealized losses on investments to be transferred
Increase in deferred tax valuation allowance
Charges recognized in Q2 2008
Charges recognized in Q3 2008
Recognition of change in unrealized losses on investments to be transferred
Net gain on Gen Re recapture
Charges recognized in Q3 2008
Charges expected to be recognized upon completion of transaction
Write off Senior Health GAAP shareholders’ equity and transaction costs
Additional capital contribution
Charges to be recognized upon completion of transaction
Total expected charges
$205.7
298.0
503.7
174.8
(19.8)
155.0
325.0
175.0
500.0
$1,158.7
$ in millions
15

In compliance with all
financial covenants
Convertible repurchase
improves debt-to-capital
ratio by 0.4%
Key Debt Covenants
16
CNO
Q3 2008*
($ millions)
Q4 2007
30.0%
21.0%
2.00X
3.34X
$1,270
$1,497
250%
296%
30.0%
23.6%
2.00X
2.64X
$1,270
$1,433
250%
257%
Debt/Capital Ratio
Covenant Maximum
Actual
Interest Coverage
Covenant Minimum
Actual
Statutory Capital
Covenant Minimum
Actual
RBC Ratio
Covenant Minimum
Actual
*Preliminary calculations.
**Pro forma indicators are calculated as if the proposed transaction to transfer Senior Health to an independent
trust was completed at September 30, 2008.
Pro Forma
Q3 2008**
30.0%
28.2%
2.00X
2.64X
$1,270
$1,314
250%
276%

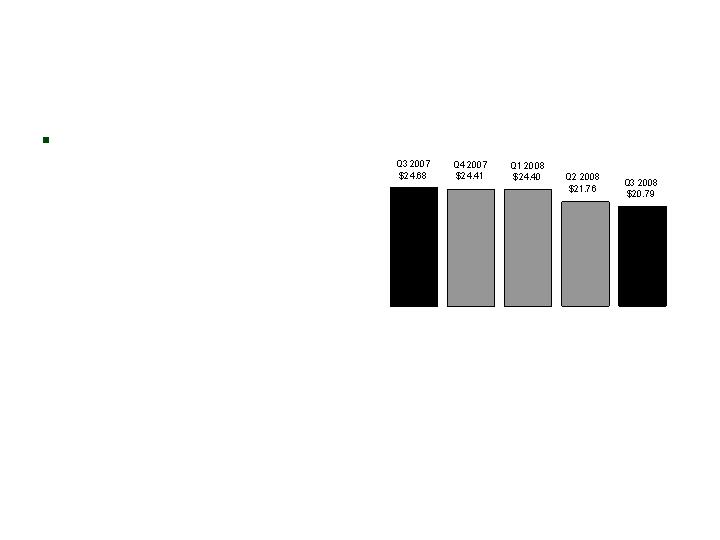
Book value per diluted share (excluding accumulated other comprehensive loss)
$20.79 at 9/30/08 vs $24.41 at 12/31/07
Pro forma $18.09 at 9/30/08**
Debt to total capital ratio (excluding accumulated other comprehensive loss)
24% at 9/30/08 vs 21% at 12/31/07
Pro forma 28% at 9/30/08**
Consolidated RBC ratio
257% at 9/30/08 vs 296% at 12/31/07
Pro forma RBC is expected to increase by approximately 10 percentage points**
Investments
Key indicators consistent with expectations
$359.5 million of investment income in Q3 2008
Earned yield of 5.91% in Q3 2008
94% of bonds investment grade at 9/30/08***
Gross unrealized losses of $2,119.6 million at 9/30/08 reflects widened credit spreads***
Financial Indicators*
17
CNO
*See appendix for detail on these indicators, including notes describing non-GAAP measures.
**Pro forma indicators are calculated as if the proposed transaction to transfer Senior Health to an independent
trust was completed at September 30, 2008.
***Excludes investments from consolidated variable interest entity.
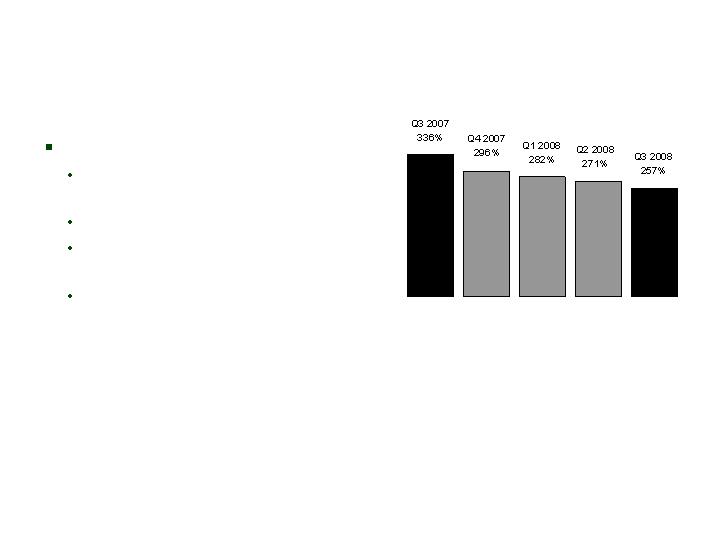
Consolidated RBC Ratio*
18
CNO
Decrease due primarily to:
Mortgage experience
adjustment factor
Impairments
Statutory Senior Health LTC
reserve pivoting
Business growth
*Risk-Based Capital (“RBC”) requirements provide a tool for insurance regulators to determine the levels of
statutory capital and surplus an insurer must maintain in relation to its insurance and investment risks. The
RBC ratio is the ratio of the statutory consolidated adjusted capital of our insurance subsidiaries to RBC.

Earnings significantly improved over Q2 2008
Q3 2008 earnings affected by:
Decrease in interest-adjusted benefit ratio on LTC policies, driven by
improvements in claims management practices
FAS 133 accounting treatment for embedded liability option in EIAs
Lower than expected PFFS margins
Strong Q3 2008 sales
Up 6% vs Q3 2007 (excluding PFFS), led by annuity sales
Total Q3 2008 NAP of $66 million, 16% over year-earlier quarter
Q3 Summary
19
Bankers

Significant efforts on multiple fronts, translating into improved results
and outlook
In force pricing – completed Round Three rate increase submissions to
the states
Claims management – protocol changes and process improvements
yielding strong results
Underwriting and risk selection - strengthened
New product design and pricing – on target for early 2009 launch
LTC: Strong Progress Achieved
During Q3 2008
20
Bankers

Round Three (2008 round – policies issued prior to 2002)
Re-rate filings were completed by end of Q3 2008
Filed $102.5 million of rate increases, on target
As of 11/3/08: approvals = $28.8 million (14 states), ahead of plan
As of 11/3/08: implementations = $27.7 million, ahead of plan
Projected financial impact = $20.7 million, ahead of plan
Round Two (2007 round – policies issued from 2002-2005)
Filed $45.6 million of rate increases, 100% of goal
As of 11/3/08: approvals/implementations = $20.6 million, 63% of goal
Projected financial impact = $18.0 million, 62% of goal
Continue to pursue over $10 million on existing filings - reaching our goal
for this round of re-rates depends largely on approvals from a few large
states – we continue to work with these states to obtain these approvals
LTC: Re-Rate Actions
21
Bankers

Claims management
Organizational re-alignment completed, resulting in subgroups of similar
size, span of control and risk management responsibility
Best-in-class new protocols have been introduced and are being applied
by all claims personnel
Important process improvements underway that are eliminating
inefficiencies and will improve cycle time and customer service levels
Underwriting
Cognitive impairment test (EMST) on Home Health Care implemented
10/1/08
New products
Continued progress on LTC product revision to be released Q1 2009
LTC/annuity combo product will also be launched Q1 2009
LTC:
Claims/Underwriting/Products
22
Bankers

Comparing LTC: Closed Block vs BLC
23
Active Lives
Active Claims
Claims Paid in 2007
Premium (2007)
Distribution
% of Policies with “0 Day Elimination Period”
% of Policies with “Lifetime Benefit Period”
Policy Forms
Closed Block
BLC
180,000
12,000
$404 million
$310 million
Brokers
75%
27%
4,500
430,000
12,000
$313 million
$620 million
Career agents
15%
6%
100
No significant change in
surrender activity this year:
Q3 2008 surrenders are slightly
higher than Q1 and Q2 2008, but
below 2007 levels in both EIAs and
non-EIAs
Average account value:
EIAs - $41,000
Non-EIAs - $35,000
Over 89% of our annuities are
still in surrender period:
EIAs – 94%
Non-EIAs – 88%
Annuities
24
Bankers
EIA Surrenders
(annualized quarterly rate)
Non-EIA Surrenders
(annualized quarterly rate)

Total sales up 16% vs Q3 2007; up 6% excluding PFFS
Strong sales of annuities (+29%) and Medicare Supplement (+3%),
partially offset by lower life (-5%) and LTC sales (-2%)
Agent productivity and agent force growth remain strong
4,782 agents at 9/30/08, up 8% vs 9/30/07
12% YTD growth in new agents
6% YTD growth in productive agents*
Economic slowdown has not impacted Bankers’ sales or its
ability to recruit and retain agents
Q3 2008 Sales and
Distribution Results
25
Bankers
*Agents who have sold 4+ policies or earned $2,000+ in commissions per month during the most recent 12 months.
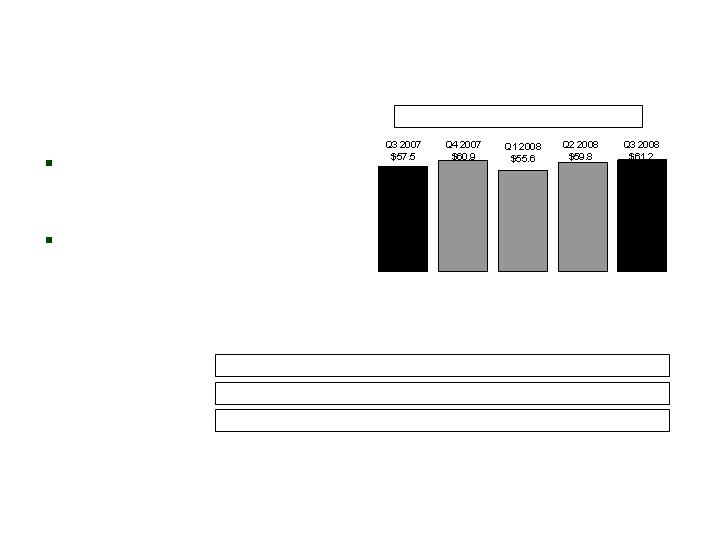
NAP Growth
Continued strong sales
momentum, driven by
annuities
Market conditions moving
customers to products with
safe returns
Bankers
26
($ millions)
Quarterly NAP-Excluding PFFS
NAP-Quarterly*: $56.6 $58.3 $114.6 $53.4 $65.8
PFFS NAP-Quarterly*: $(0.9) $(2.6) $59.0 $(6.4) $4.6
Non-PFFS NAP-Quarterly: $57.5 $60.9 $55.6 $59.8 $61.2
*Excludes group business not sold by Bankers agents.

Q3 Earnings
27
Bankers
Management believes that an analysis of income (loss) before net realized investment gains (losses), net of
related amortization (a non-GAAP financial measure), is important to evaluate the financial performance of our
business, and is a measure commonly used in the life insurance industry. Management uses this measure to
evaluate performance because realized gains or losses can be affected by events that are unrelated to a
company’s underlying fundamentals. The table on Page 9 reconciles the non-GAAP measure to the
corresponding GAAP measure. See Appendix for a reconciliation of the return on equity measure to the
corresponding GAAP measure.
Trailing 4 Quarter Operating Return on Equity: 7.6%
($ millions)
Q3 2007
(Restated)
Q1 2008
Q2 2008
Q3 2008
Insurance policy income
$473.6
$497.0
$543.4
$537.7
Net investment income
144.2
129.3
135.2
138.3
Fee revenue and other income
3.8
1.6
2.1
3.1
Total revenues
621.6
627.9
680.7
679.1
Insurance policy benefits
404.9
434.9
497.2
470.3
Amounts added to policyholder account balances
54.9
44.8
37.2
46.2
Amortization related to operations
47.8
75.0
66.6
53.5
Other operating costs and expenses
46.5
44.1
45.1
41.3
Total benefits and expenses
554.1
598.8
646.1
611.3
Income before net realized investment gains (losses), net of
related amortization and income taxes
$67.5
$29.1
$34.6
$67.8

Q3 2008 NAP of $12 million, 6% above Q3 2007
2008 YTD NAP of $43.5 million, up 32% over prior year
Earnings down 7% from Q3 2007
Higher life margins arising from recapture of reinsurance treaty
in Q4 2007 and sales expansion
More than offset by a $1.3 million adjustment to DAC
amortization that is not expected to recur
Q3 Summary
28
Colonial Penn

Q3 Earnings
29
Colonial Penn
Management believes that an analysis of income (loss) before net realized investment gains (losses), net of
related amortization (a non-GAAP financial measure), is important to evaluate the financial performance of our
business, and is a measure commonly used in the life insurance industry. Management uses this measure to
evaluate performance because realized gains or losses can be affected by events that are unrelated to a
company’s underlying fundamentals. The table on Page 9 reconciles the non-GAAP measure to the
corresponding GAAP measure. See Appendix for a reconciliation of the return on equity measure to the
corresponding GAAP measure.
Trailing 4 Quarter Operating Return on Equity: 8.4%
($ millions)
Q3 2007
Q1 2008
Q2 2008
Q3 2008
Insurance policy income
$32.5
$44.4
$47.5
$46.4
Net investment income
9.4
9.2
10.1
10.1
Fee revenue and other income
0.2
0.3
0.5
0.5
Total revenues
42.1
53.9
58.1
57.0
Insurance policy benefits
26.3
35.0
35.5
33.9
Amounts added to policyholder account balances
0.3
0.3
0.3
0.3
Amortization related to operations
5.1
7.4
7.4
9.2
Other operating costs and expenses
3.4
7.5
6.6
7.1
Total benefits and expenses
35.1
50.2
49.8
50.5
Income before net realized investment gains (losses) and
income taxes, net of related amortization
$7.0
$3.7
$8.3
$6.5

Q3 2008 NAP of $19 million, 5% above Q3 2007
Strong sales gains in specified disease, up 25% from Q3 2007
Decreases in Medicare supplement and annuities, consistent with CIG’s focus on more
profitable business
Q3 2008 earnings up 20% vs Q2 2008:
Improved mortality in interest-sensitive life business
Lower expenses
Partially offset by lower specified disease margins
Q3 2008 earnings up 98% vs Q3 2007:
Higher life margins and lower amortization
Lower expense - Q3 2007 included costs to write off software
Partially offset by:
Higher claims on specified disease and Medicare Supplement policies
Loss of annuity profits from block coinsured in October 2007
Continuing to make changes to non-guaranteed elements of older life insurance
policies issued by Conseco’s predecessor companies
Q3 Summary
30
CIG
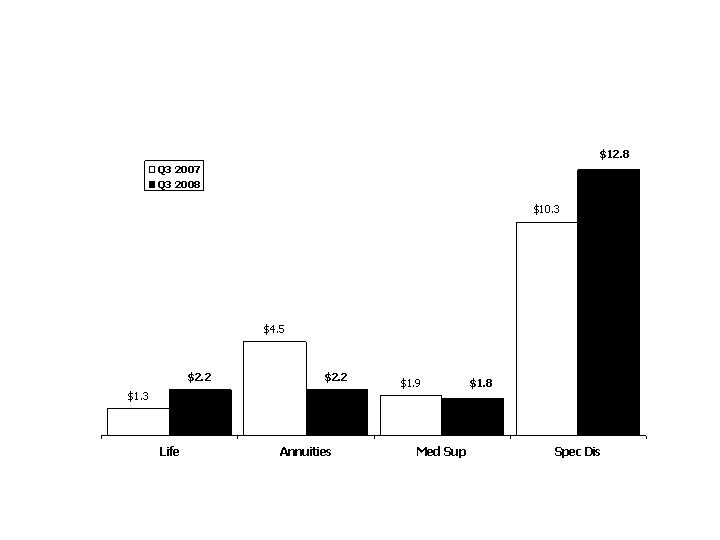
NAP: Q3 2007 vs Q3 2008
CIG
31
($ millions)

Q3 Earnings
32
CIG
Management believes that an analysis of income (loss) before net realized investment gains (losses), net of
related amortization (a non-GAAP financial measure), is important to evaluate the financial performance of our
business, and is a measure commonly used in the life insurance industry. Management uses this measure to
evaluate performance because realized gains or losses can be affected by events that are unrelated to a
company’s underlying fundamentals. The table on Page 9 reconciles the non-GAAP measure to the
corresponding GAAP measure. See Appendix for a reconciliation of the return on equity measure to the
corresponding GAAP measure.
Trailing 4 Quarter Operating Return on Equity: 1.9%
($ millions)
Q3 2007
(Restated)
Q1 2008
Q2 2008
Q3 2008
Insurance policy income
$238.7
$234.3
$229.7
$228.5
Net investment income
181.2
129.3
131.3
126.8
Fee revenue and other income
0.1
0.7
0.4
0.1
Total revenues
420.0
364.3
361.4
355.4
Insurance policy benefits
200.7
196.6
195.8
186.6
Amounts added to policyholder account balances
76.4
43.6
37.1
42.7
Amortization related to operations
41.2
30.1
31.0
24.6
Interest expense on investment borrowings
6.2
5.8
5.5
5.6
Other operating costs and expenses
77.3
64.9
62.0
59.8
Total benefits and expenses
401.8
341.0
331.4
319.3
Income before net realized investment gains (losses),
net of related amortization and income taxes, excluding
costs related to the litigation settlement and the loss
related to an annuity coinsurance transaction
$18.2
$23.3
$30.0
$36.1

Progressing plan to transfer Senior Health to independent trust
Fifth consecutive stable quarter
Q3 results reflect
Continued reserve adequacy
Impact of turnaround program
Q3 Summary
33
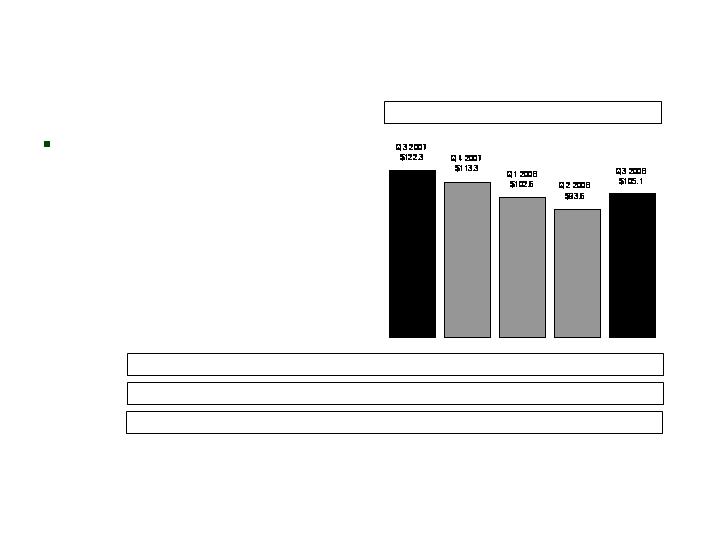
LTC Closed Block

Q3 Earnings
34
LTC Closed Block
Management believes that an analysis of income (loss) before net realized investment gains (losses)
(including losses related to the transfer of Senior Health to an independent trust), net of related amortization (a
non-GAAP financial measure), is important to evaluate the financial performance of our business, and is a
measure commonly used in the life insurance industry. Management uses this measure to evaluate
performance because realized gains or losses can be affected by events that are unrelated to a company’s
underlying fundamentals. The table on Page 9 reconciles the non-GAAP measure to the corresponding GAAP
measure. See Appendix for a reconciliation of the return on equity measure to the corresponding GAAP
measure.
($ millions)
Q3 2007
(Restated)
Q1 2008
Q2 2008
Q3 2008
Insurance policy income
$77.2
$75.5
$75.5
$74.2
Net investment income
48.8
50.5
51.6
53.9
Fee revenue and other income
0.1
0.1
0.1
0.0
Total revenues
126.1
126.1
127.2
128.1
Insurance policy benefits
122.3
102.6
93.6
105.1
Amortization related to operations
5.9
5.4
5.6
4.2
Other operating costs and expenses
17.4
19.4
15.8
15.9
Total benefits and expenses
145.6
127.4
115.0
125.2
Income (loss) before net realized investment gains (losses)
and income taxes
($19.5)
($1.3)
$12.2
$2.9
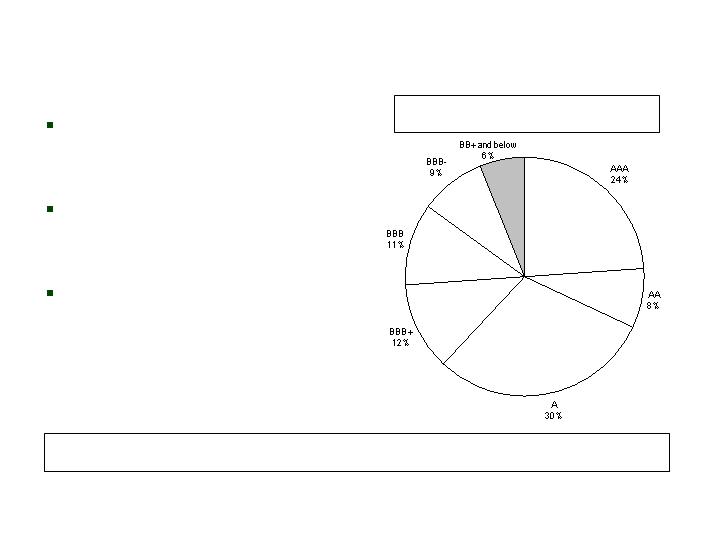
Investment Quality:
Fixed Maturities*
35
CNO
Investment grade securities
represent 94% of total
portfolio*
Limited new money
allocation to below-
investment grade securities
Pressure on below-
investment grade ratio due to
credit cycle/ratings migration
Actively Managed Fixed Maturities by Rating at
9/30/08 (Market Value)
9/30/08
94%
6/30/08
94%
3/31/08
95%
12/31/07
94%
9/30/07
94%
% of Bonds which are Investment Grade:
*Excludes investments from a variable interest entity which we consolidate under GAAP (though the related
liabilities are non-recourse to Conseco).

Q3 2008
Net Realized Investment Losses
36
CNO
($ millions)
Net losses on sales
Losses due to the recognition of other-than-temporary impairments
Subtotal before amortization adjustment
Amortization adjustment to DAC and PVP
Net realized investment losses
$(45.8)
(50.0)
(95.8)
9.9
$(85.9)

Q3 2008 Update:
Lehman/Washington Mutual/AIG
37
CNO
Loss on
Sales
$(25.7)
(14.3)
(6.1)
Lehman Brothers
Washington Mutual
AIG
All other realized investment losses
Total realized investment losses
Other-than-
Temporary
Impairments
$(9.9)
(10.8)
(2.3)
Par
$10.4
$21.6
$2.8
Book
$0.5
$10.8
$0.5
$ in millions
Total
Investment
Loss
$(35.6)
(25.1)
(8.4)
(69.1)
(26.7)
$(95.8)
9/30/08 Holdings
Net Unrealized Losses:
Fixed Maturity Securities
38
CNO
Net unrealized losses
($ and % of fixed maturity
securities)
$481.8
2.3%
$1,007.0
4.8%
$1,188.4
5.6%
$2,114.5
10.0%
($ in millions)
Fixed maturity securities

Structured Securities
represent 24% of total actively
managed fixed maturity
securities
90% AAA rated
Over 40% Agency CMOs
10% Alt-A’s (99% AAA
rated)
No exposure to Agency
(FRM/FRE) preferred or
common
Predominantly “Level Two”
FAS 157 pricing
Structured Securities at 9/30/08
CNO
39
(Market value in millions)
Pass-throughs, sequentials and
equivalent securities
$1,879.0
40.8%
Planned amortization class, target
amortization class, and accretion-
directed bonds
$1,546.6
33.6%
Commercial
mortgage-backed
securities
$794.9
17.2%
Other
$68.4
1.5%
Asset-backed
securities
$316.4
6.9%
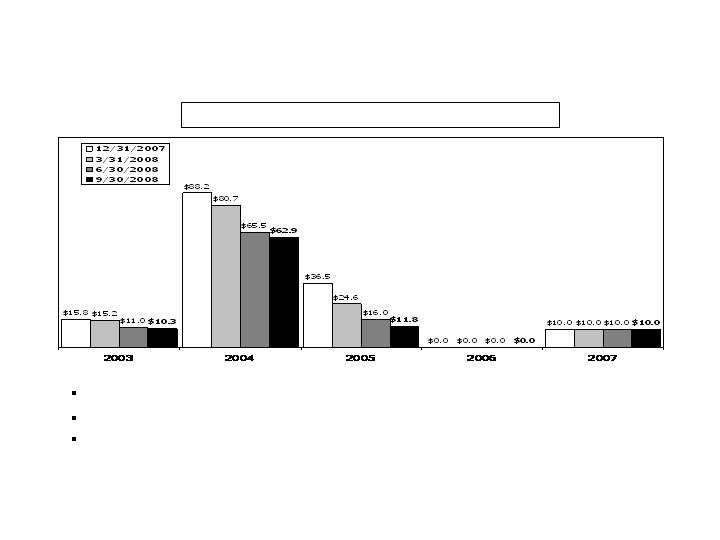
Sub-Prime Home Equity ABS*
CNO
40
Exposure reduced by 37% since 12/31/07
Market value represents 0.33% of invested assets at 9/30/08, compared to 0.52% at 12/31/07
Despite challenging market conditions, current collateral performance trends and credit
support suggest adequate protection
Exposure by Vintage Year (Book Value in millions)
*Includes exposure held in our trading portfolios.

Sub-Prime Home Equity ABS*
at 9/30/08
CNO
41
AAA
AA
A
Total
$27.1
$27.1
$19.3
$73.5
$35.2
$34.2
$25.6
$95.0
36.9%
36.9%
26.2%
100.0%
0.12%
0.12%
0.09%
0.33%
Market
Value (mil.)
Book
Value (mil.)
% of
Subprime*
% of
Portfolio**
Rating
Only $19.3 million (market value) A category or lower (0.09% of invested assets)
No exposure to “affordability products” – negative amortization, option ARM
collateral, etc.
Rising delinquency roll rates reflect market conditions
Remaining portfolio generally reflects satisfactory margin for adverse collateral
performance
641
648
683
655
Avg.
FICO
30.4%
23.4%
20.8%
25.3%
Avg.
Support
14.2%
8.0%
8.8%
10.5%
Avg. 60+
Delinq.
*Includes exposure held in our trading portfolios.
**% of market value.
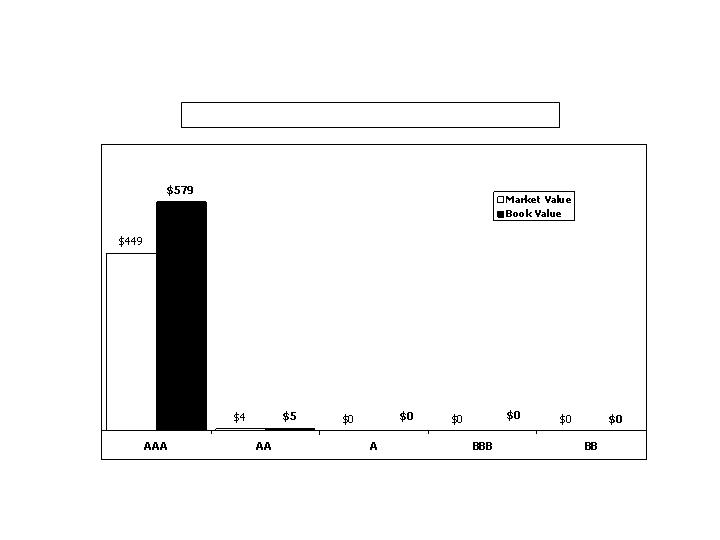
Alt-A Exposure Summary*
at 9/30/08
CNO
42
Exposure by Rating Category (in millions)
$453
$584
*Includes exposure held in our trading portfolios.
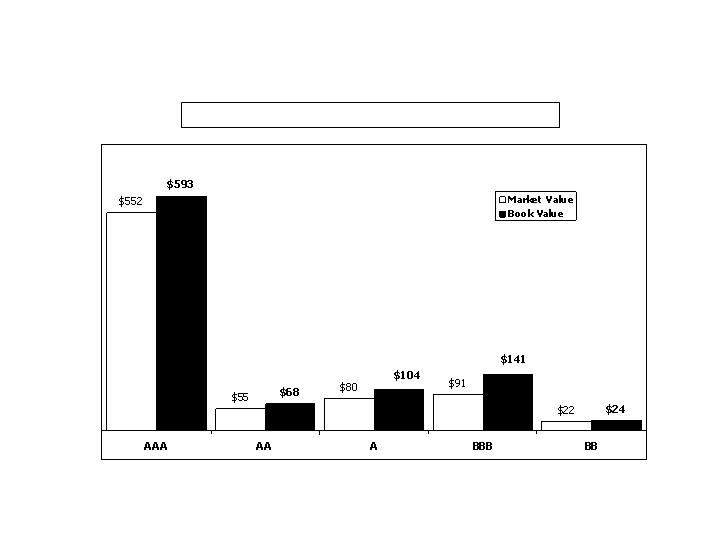
CMBS Exposure Summary*
at 9/30/08
CNO
43
Exposure by Rating Category (in millions)
$800
$930
*Includes exposure held in our trading portfolios.

CNO Summary
44
Separation of Senior Health from Conseco
Continued strong growth in new business
Bankers Life – continuing to grow at about 10%
Colonial Penn – growth in excess of 20%
CIG – producing more economic value from refocused sales efforts
Improved earnings
Bankers earnings back at run-rate expectations
CIG profitability continues to improve
CNO differentiating factors
Business not ratings-sensitive
Focus on protection products
Not in variable marketplace
Unique middle-market focus

Questions and Answers
45

Appendix
46
Book Value Per Diluted Share*
47
CNO
*Book value excludes accumulated other comprehensive income (loss). Shares outstanding assumes:
(1) conversion of convertible securities; and (2) the exercise of outstanding stock options and vesting of restricted
stock (each calculated using the treasury stock method). See Appendix for corresponding GAAP measure.
Decrease driven by net loss
in Q3 2008

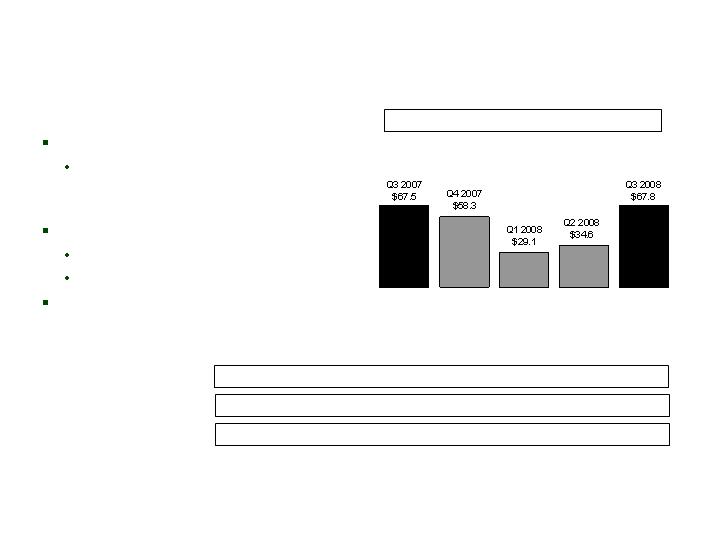
Ratio of Debt to Total Capital*
48
CNO
Increase primarily driven by
net loss in Q3 2008
*Excludes accumulated other comprehensive income (loss). See Appendix for corresponding GAAP measure.
Q3 2007
20.6%
Q4 2007
20.9%
Q1 2008
20.9%
Q2 2008
22.8%
Q3 2008
23.6%
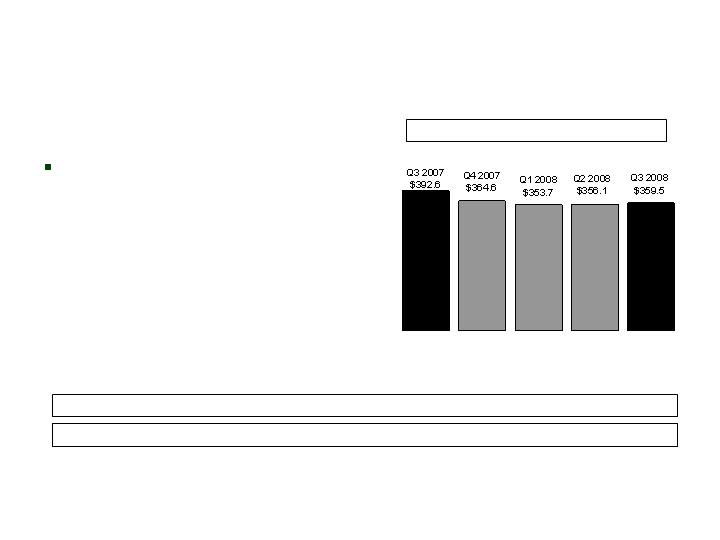
Net Investment Income
49
CNO
($ millions)
Yield up from Q3 2007
Net investment income (loss) from the prepayment of securities: $0.6 $5.0 $1.5 $1.7 $(1.1)
General Account Investment Income
5.91%
5.82%
5.82%
5.94%
5.87%
Yield:
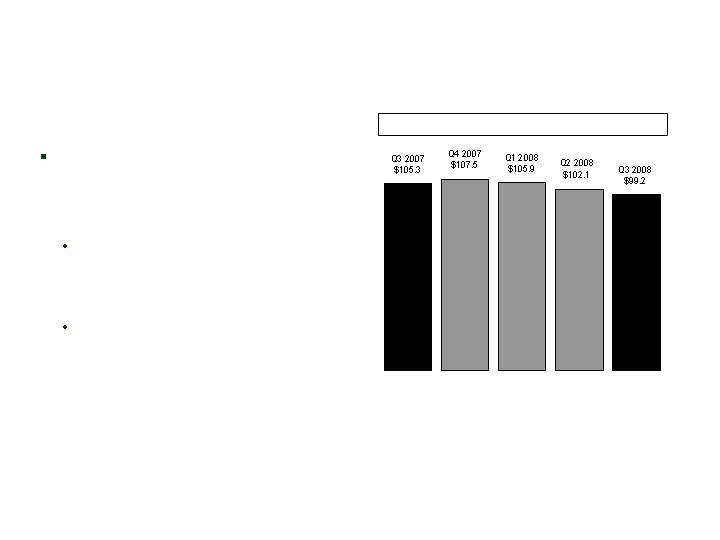
Expenses
50
CNO
($ millions)
Adjusted Operating Expenses*
*Adjusted operating expenses exclude primarily acquisition costs, capitalization of software development costs,
initial PFFS marketing costs, costs related to the R-factor litigation settlement, and contractual vacancy charges
related to exiting the Merchandise Mart in Chicago. This measure is used by the Company to evaluate its
progress in reducing operating expenses.
Back-office consolidation when
completed expected to produce
run-rate savings of $25 million
annually by YE 2008
Approximately $11 million in savings
realized in 2007; additional $9 million
expected in 2008; remaining $5 million
expected in 2009
Q1 2008 expenses reflect increased
investment in business growth at
Bankers and Colonial Penn

CNO substantially hedges its current-year exposure to equity volatility (with future
periods subject to product repricing)
Hedge positions periodically adjusted for terminations
Terminations tend to result in modestly long position
Financial impact based on market performance
Income statement impact approximately $1.5 million in Q3 2008
Accounting
FAS 157 fair value measurement adopted during Q1 2008
Liabilities include present value of future option credits, which are not hedged in the
current period
Fluctuation in financial results due to liability revaluation under FAS 133, not hedge or
asset performance
$8.0 million income statement impact in Q3 2008
Fluctuation will continue over time – differences are temporary and balance out over
the life of the contracts
Equity Indexed Products
51
CNO
Segment Performance
52
Bankers
*Operating earnings exclude net realized gains (losses). See Appendix for corresponding GAAP measure of
our consolidated results of operations.
Higher earnings driven by:
Higher margins as a result of
measures implemented to address
higher than expected LTC claims
Offset by:
FAS 133 volatility
Lower than expected PFFS margins
Continued strong revenue growth
PTOI-Trailing 4 Quarters: $251.0 $241.8 $225.4 $189.5 $189.8
Revenues-Quarterly: $621.6 $606.8 $627.9 $680.7 $679.1
Pre-Tax Operating Income*
Revenues -Tr. 4 Quarters: $2,291.8 $2,364.3 $2,438.1 $2,537.0 $2,594.5
($ millions)
Premiums –
Medicare Supplement
53
Bankers
(in millions)
Q3 2008 vs Q3 2007:
First-year premiums and
NAP up 3%
Medicare Supplement – First-Year Premiums
Med. Supp. First-Year Prems.-Tr. 4 Qtrs: $86.8 $82.5 $79.4 $78.8 $79.3
Med. Supp. Total Premiums-Quarterly: $152.9 $162.4 $159.9 $150.6 $153.8
Med. Supp. NAP-Quarterly: $16.1 $23.0 $17.1 $17.0 $16.6
Med. Supp. NAP-Trailing 4 Quarters: $63.9 $68.5 $70.9 $73.2 $73.7
Premiums –
PDP/PFFS
54
Bankers
(in millions)
Q3 2007 to Q3 2008 growth
driven by continued growth in in-
force policies and addition of one
new group case
Q1 2008 to Q2 2008 growth
reflects start of new group case
Q2 2008 to Q3 2008 decline due
to renewal of group case
(effective 7/1 – 6/30)
PDP
PFFS
PDP/PFFS – First-Year Premiums
PDP NAP-Quarterly: $0.8 $0.6 $3.6 $0.9 $0.7
PFFS NAP-Quarterly*: $(0.9) $(2.6) $59.1 $(6.4) $4.6
Q3 2007
$78.5
Q4 2007
$86.0
$76.2
Q1 2008
$70.4
Q2 2008
$116.1
$84.0
$68.8
$113.5
Q3 2008
$86.2
$84.2
*Excludes group PFFS business.
Premiums –
Long-Term Care
55
Bankers
($ millions)
Quarterly first-year premium
tracks decline in NAP
NAP decline attributable to three
main factors:
Overall industry sales decline
Agent force shift toward life and
annuity sales
Tightened underwriting
First-Year Prems.-Tr. 4 Qtrs: $47.4 $47.0 $46.4 $44.8 $43.9
Total Premiums-Quarterly: $154.5 $154.3 $156.6 $155.2 $154.8
Long-Term Care – First-Year Premiums
NAP-Quarterly: $11.7 $10.8 $9.4 $10.7 $11.4
NAP-Trailing 4 Quarters: $47.1 $46.9 $44.6 $42.6 $42.3
Premiums –
Life Insurance
56
Bankers
($ millions)
Fluctuations in first-year
premiums primarily reflect
variance in sales of single-
premium policies
Non-SPWL premiums flat vs
Q3 2007
First-Year Prems.-Tr. 4 Qtrs: $89.8 $89.2 $86.3 $83.5 $81.8
Total Premiums-Quarterly: $49.1 $50.7 $48.0 $53.8 $51.9
Life – First-Year Premiums
NAP-Quarterly: $13.8 $13.1 $11.7 $15.7 $13.1
NAP-Trailing 4 Quarters: $52.4 $54.1 $53.1 $54.3 $53.6
Q3 2007
$21.2
Q4 2007
$21.3
Q1 2008
$18.5
Q2 2008
$22.5
SPWL
Non-
SPWL
$9.4
$9.1
$9.3
$7.0
$12.1
$12.0
$11.5
$13.1
$7.5
$12.0
Q3 2008
$19.5

Premiums –
Annuity
57
Bankers
($ millions)
Fixed annuities have become
more attractive due to stock
market volatility
First-Year Prems.-Tr. 4 Qtrs: $909.0 $882.7 $899.3 $956.5 $1,022.0
Total Premiums-Quarterly: $250.9 $221.9 $229.1 $257.8 $316.7
Annuity – First-Year Premiums

Benefit Ratio* –
Medicare Supplement
58
Bankers
Trailing 4 Quarter Avg.: 66.6% 67.2% 67.3% 68.2% 69.0%
*We calculate benefit ratios by dividing insurance policy benefits by insurance policy income.
Q3 2008 ratio negatively
impacted by:
Premium refund adjustments
Higher incurred claims,
particularly in skilled nursing
Benefit Ratio* – PDP
59
Bankers
PDP ratio continues to trend as
expected, factoring in seasonal
fluctuations and settlement of
prior contract year
*We calculate benefit ratios by dividing insurance policy benefits by insurance policy income.
Benefit Ratio* –
PFFS Individual Business
60
Bankers
Q3 2008 reflects catch-up on
prior period claims processing
Q2 2008 reflects IBNR
adjustment
*We calculate benefit ratios by dividing insurance policy benefits by insurance policy income.
Benefit Ratio* –
PFFS Group Business
61
Bankers
Lower expense levels allow
group PFFS to operate at a
higher benefit ratio than
individual business, with
similar margin expectations
*We calculate benefit ratios by dividing insurance policy benefits by insurance policy income.
Interest-Adjusted Benefit Ratio* –
Long Term Care
62
Bankers
*We calculate interest-adjusted benefit ratios by dividing insurance policy benefits less interest income on
the accumulated assets backing the insurance liabilities by insurance policy income.
Q3 2008 positively impacted by:
Measures implemented in Q2 2008 to
address higher than expected LTC
claim frequency and stabilization of
excess termination activity in the first
half of 2008
During the quarter, completed Round
Three re-rates on legacy block; expect $50
million annual financial impact
Began implementation of premium re-rates
(Round Two) in Q3 2007 on more recent
business not previously re-rated; expect
additional $10 million in in-force premium
Trailing 4 Quarter Avg.: 71.0% 70.8% 72.5% 76.7% 74.9%
Qtrly. non-int. adjusted: 106.5% 103.3% 111.6% 114.7% 102.1%
Segment Performance
63
Colonial Penn
*Operating earnings exclude net realized gains (losses). See Appendix for corresponding GAAP measure of
our consolidated results of operations.
Q3 2007 to Q3 2008 earnings
Declined due to higher life claims
in 2008, offset by growth from
Q4 2007 recapture
Organic growth initiatives
PTOI-Trailing 4 Quarters: $23.7 $18.1 $17.2 $18.8 $18.3
Revenues-Quarterly: $42.1 $44.3 $53.9 $58.1 $57.0
Pre-Tax Operating Income*
Revenues -Tr. 4 Quarters: $161.4 $164.3 $179.2 $198.4 $213.3
($ millions)
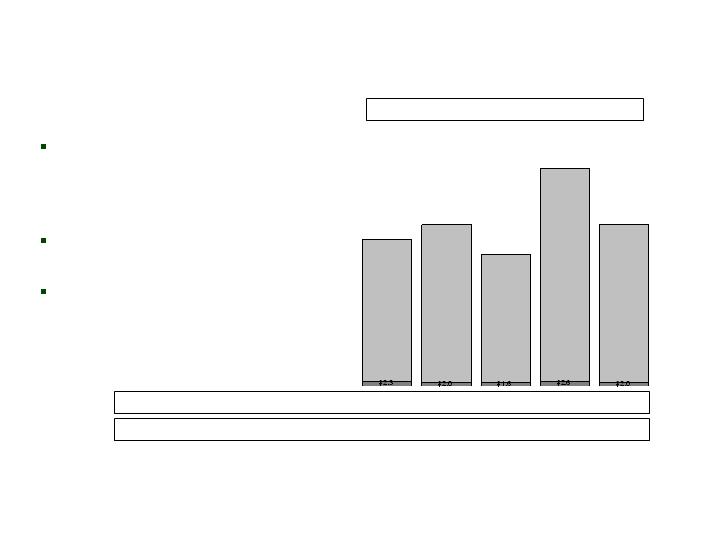
Premiums –
Life Insurance
64
Colonial Penn
($ millions)
Continued strong sales growth
Trailing four quarters data:
NAP grew 20%
First-year premium grew 25%
First-Year Prems.-Tr. 4 Qtrs: $27.0 $28.7 $30.4 $32.3 $33.7
Total Premiums-Quarterly: $29.3 $31.7 $42.9 $43.8 $43.6
Life – First-Year Premiums
NAP-Quarterly: $11.4 $9.3 $12.7 $14.5 $12.1
NAP-Trailing 4 Quarters: $40.5 $42.3 $44.6 $47.9 $48.6
Segment Performance
65
CIG
*Operating earnings exclude: (1) net realized gains (losses); (2) the Q2 2006 charge related to the
litigation settlement and refinements to such estimates recognized in subsequent periods; and (3) the Q3
2007 charge related to an annuity coinsurance transaction. See Appendix for corresponding GAAP
measure of our consolidated results of operations.
Improving life margins
Lower expenses, which includes a
writeoff to software in Q3 2007
Partially offset by loss of annuity
profits from block coinsured in
October 2007
PTOI-Trailing 4 Quarters: $122.9 $102.7 $92.5 $79.2 $97.1
Revenues-Quarterly: $420.0 $362.7 $364.3 $361.4 $355.4
Pre-Tax Operating Income*
Revenues-Tr. 4 Quarters: $1,722.2 $1,639.2 $1,585.9 $1,508.4 $1,443.8
($ millions)
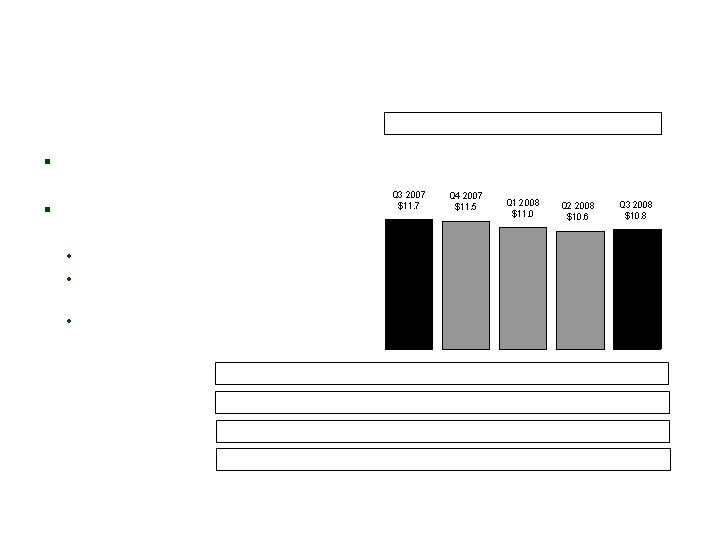
Premiums -
Medicare Supplement
66
CIG
($ millions)
NAP down 5% from Q3 2007:
We continue to focus on the
profitability of this business rather
than increased sales
First-Year Prems.-Tr. 4 Qtrs: $23.9 $19.4 $15.6 $12.7 $10.6
Total Premiums-Quarterly: $54.8 $55.2 $53.1 $49.6 $48.5
Medicare Supplement – First-Year Premiums
NAP-Quarterly: $1.9 $3.5 $2.3 $1.3 $1.8
NAP-Trailing 4 Quarters: $16.1 $13.2 $10.6 $9.0 $8.9
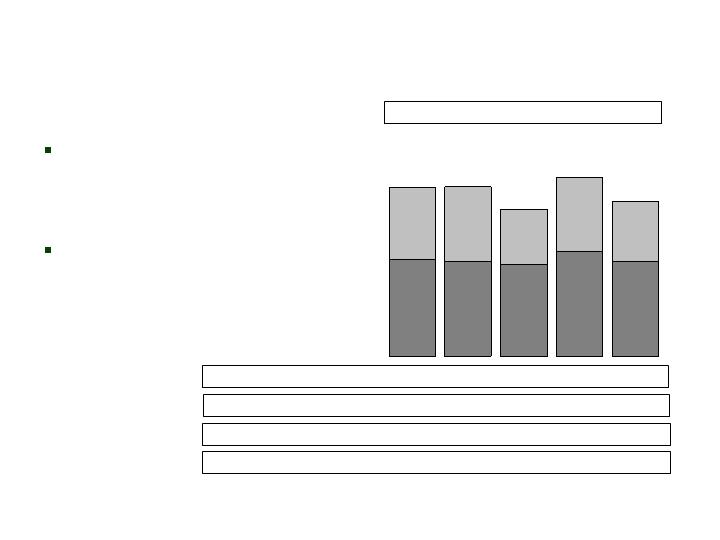
Premiums –
Specified Disease
67
CIG
($ millions)
NAP up 25% from Q3 2007:
New products
Increased PMA focus on
specified disease products
Recruitment of Health IMOs
First-Year Prems.-Tr. 4 Qtrs: $29.8 $31.4 $33.5 $35.6 $37.6
Total Premiums-Quarterly: $88.7 $89.3 $94.2 $92.5 $92.3
Specified Disease – First-Year Premiums
NAP-Quarterly: $10.3 $11.3 $9.6 $12.4 $12.8
NAP-Trailing 4 Quarters: $36.3 $39.0 $40.8 $43.6 $46.1
Premiums –
Annuity
68
CIG
($ millions)
Collections down 65% from
Q3 2007:
Discontinuance of products due
to an annuity coinsurance
transaction
Focus on profitable products
First-Year Prems.-Tr. 4 Qtrs: $415.9 $354.4 $277.3 $203.4 $155.3
Total Premiums-Quarterly: $77.5 $58.0 $41.6 $37.1 $27.4
Annuity – First-Year Premiums
Benefit Ratio* –
Medicare Supplement
69
CIG
Recognized higher incurred
claims in Q3 2008
Trailing 4 Quarter Avg.: 67.1% 67.6% 67.4% 68.0% 69.1%
*We calculate benefit ratios by dividing insurance policy benefits by insurance policy income.
Interest-Adjusted Benefit Ratio* –
Specified Disease
70
CIG
Trailing 4 Quarter Avg.: 43.2% 44.7% 46.0% 47.6% 47.4%
Qtrly. non-int. adjusted: 81.9% 80.6% 81.7% 80.4% 82.6%
*We calculate interest-adjusted benefit ratios by dividing insurance policy benefits, less interest income on
the accumulated assets backing the insurance liabilities, by insurance policy income.
Change from Q3 2007 primarily
driven by slight decrease in
incurred claims
Segment Performance
71
LTC Closed Block
*Operating earnings exclude net realized gains (losses) (including losses related to the transfer of Senior
Health to an independent trust). See Appendix for corresponding GAAP measure of our consolidated results
of operations.
Steady revenue trend
Continued reserve stability
Impact from improvement
initiatives
PTOI-Trailing 4 Quarters: $(221.0) $(185.9) $(161.1) $(18.6) $3.8
Revenues-Quarterly: $126.1 $127.9 $126.1 $127.2 $128.1
Pre-Tax Operating Income*
Revenues -Tr. 4 Quarters: $506.4 $506.4 $505.9 $507.3 $509.3
($ millions)
Collected Premiums-Quarterly: $75.7 $75.0 $76.3 $74.1 $72.8

Balance Sheet Detail
Continued stability since reserve strengthening in Q2 2007
LTC Closed Block
72
($ millions)
Insurance Liabilities and Intangible Assets, Net of Reinsurance
Reserve for Future Benefits
Claim Reserve
Insurance Acquisition Costs
Net Liability
Percent Change
Q3 2007
$2,402.3
954.3
(153.9)
$3,202.7
0.0%
Q4 2007
$2,392.7
962.1
(156.8)
$3,198.0
-0.1%
Q1 2008
$2,394.4
957.2
(151.4)
$3,200.2
0.1%
Q2 2008
$2,373.6
960.8
(145.9)
$3,188.5
-0.4%
Q3 2008
$2,411.9
989.2
(144.6)
$3,256.5
2.1%
Benefit Detail
Fifth consecutive stable
quarter; continued reserve
adequacy
Total benefits equal incurred claims plus increase in reserve for future benefits. Verified basis incurred claims
adjust all periods for claim reserve redundancies and deficiencies.
Incurred Claims $112.9 $119.8 $100.9 $114.4 $115.1
Increase in Reserves for Future Benefits $9.4 $(6.4) $1.6 $(20.8) $(10.0)
Verified Basis Incurred Claims $107.4 $123.6 $120.5 $111.2 $105.9
LTC Closed Block
Total Benefits
($ millions)
73
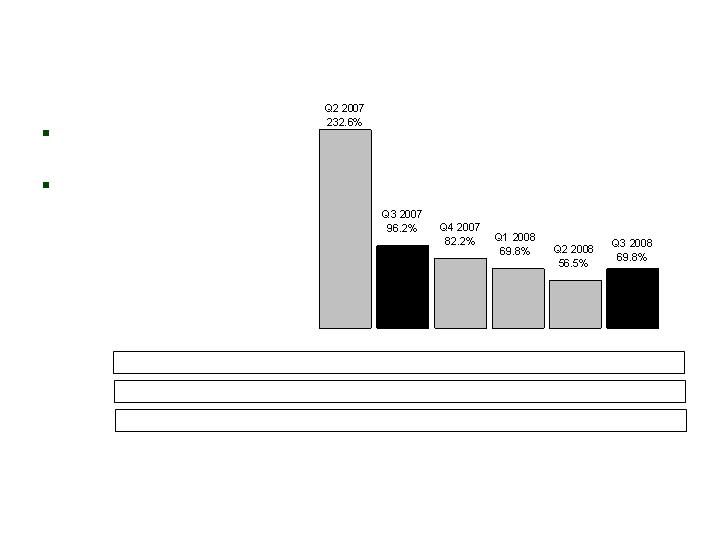
Interest-Adjusted
Benefit Ratio*
74
Fifth consecutive
stable quarter
Q2 2007 benefit ratio
reflects $110 million
claim reserve
strengthening
Trailing 4 Quarter Avg.: 134.1% 138.8% 127.5% 120.8% 76.3% 69.6%
LTC Closed Block
*We calculate interest-adjusted benefit ratios by dividing insurance policy benefits less interest income on
the accumulated assets backing the insurance liabilities by insurance policy income.
Qtrly. Non-int. adjusted: 292.4% 158.4% 146.6% 135.8% 123.9% 141.8%
Qtrly. Verified Basis non-int. adj.: 140.5% 138.6% 153.7% 158.7% 145.8% 142.8%

Q2 2007 claims reserving actions generated stability in the remainder of 2007 and the first three quarters of 2008:
Favorable prior-period development continues
Verified claims for all periods stable
Verified Incurred
Development*
75
*Excludes waiver-of-premium and return-of-premium benefits.
LTC Closed Block
Reported Claims
Prior Pd. Dev.
Ver. Clms. at Rep. Date
Ver. Claims
Developed thru:
12/31/04
12/31/05
12/31/06
3/31/07
6/30/07
9/30/07
12/31/07
3/31/08
6/30/08
9/30/08
($ millions)
Q3 2007
$100.7
3.3
104.0
104.0
102.3
101.9
100.5
95.0
Q2 2007
$212.0
(109.7)
102.3
102.3
103.0
107.1
103.9
97.3
96.9
Q1 2007
$119.7
(34.9)
84.7
84.7
104.2
103.6
106.3
101.4
100.8
99.8
2006
$433.3
(72.2)
361.1
361.1
375.1
418.3
414.4
412.2
408.2
408.0
405.6
2005
$396.0
(58.9)
337.2
337.2
365.0
368.8
389.2
388.7
391.0
390.8
392.4
395.6
2004
$370.8
(44.2)
326.6
326.6
326.0
337.7
344.2
356.5
356.6
356.6
361.0
361.6
365.3
Developed
Deficiencies
in Periods
Prior to 2004
$0.0
0
0
44.2
103.7
136.4
147.1
161.4
162.3
165.0
162.2
165.6
175.0
Q4 2007
$104.7
1.8
106.5
106.5
104.9
108.5
106.2
Q1 2008
$89.1
12.8
101.9
101.9
101.8
108.7
Q2 2008
$102.3
(0.3)
102.0
102.0
99.1
Q3 2008
$105.2
(9.2)
96.0
96.0

Claims paid, claimant and in force policy counts in line with trends for past two years
Decrease in Q3 2008 termination rate driven by timing
Operating Data
76
LTC Closed Block
Claims Paid (mils.)
Open Claimant Counts
In Force Policy Counts
Ann. Termination Rates
Q3 2006
$96.1
12,228
190,134
7.9%
Q4 2006
$81.6
12,048
187,123
6.2%
Q1 2007
$102.0
11,870
183,655
7.2%
Q2 2007
$96.8
12,424
179,952
7.8%
Q3 2007
$97.7
12,121
175,685
8.9%
Q4 2007
$104.9
12,338
172,222
7.7%
Q1 2008
$93.6
11,783
168,799
7.7%
Q2 2008
$99.2
12,237
164,865
9.0%
Q3 2008
$96.3
11,722
161,717
7.4%

Premium Re-rates
(as of 10/30/08)
77
LTC Closed Block
Round 1 results - exceeded each goal:
Submitted: $64.0 million (115% of goal)
Approved: $47.0 million (113% of goal)
Implemented: $46.7 million (112% of goal)
Financial impact: $39.2 million (112% of goal)
Round 2 results – on track to achieve goals:
Submitted: $42.9 million (100% of goal)
Approved: $23.1 million (90% of goal)
Implemented: $22.9 million (89% of goal)
Financial impact: $18.3 million (89% of goal)
Round 3 results – filing process now underway:
Submitted: $23.8 million (31% of $76.2 million goal)
Approved: $3.4 million (9% of $39.6 million goal)
Implemented: $3.3 million (8% of $39.6 million goal)
Financial impact: $2.7 million (8% of $31.7 million goal)

Information Related to Certain Non-GAAP Financial Measures
The following provides additional information regarding certain non-GAAP measures used in this presentation. A non-GAAP measure is a
numerical measure of a company’s performance, financial position, or cash flows that excludes or includes amounts that are normally excluded or
included in the most directly comparable measure calculated and presented in accordance with GAAP. While management believes these
measures are useful to enhance understanding and comparability of our financial results, these non-GAAP measures should not be considered as
substitutes for the most directly comparable GAAP measures. Additional information concerning non-GAAP measures is included in our periodic
filings with the Securities and Exchange Commission that are available in the “Investor – SEC Filings” section of Conseco’s website,
www.conseco.com.
Operating earnings measures
Management believes that an analysis of net income applicable to common stock before net realized gains or losses and losses related to the
proposed transfer of Senior Health to an independent trust (“net operating income”, a non-GAAP financial measure) is important to evaluate the
performance of the Company and is a key measure commonly used in the life insurance industry. Management uses this measure to evaluate
performance because realized investment gains or losses can be affected by events that are unrelated to the Company’s underlying fundamentals.
In addition, our results were affected by unusual and significant charges related to: (i) a litigation settlement in Q2 2006 and refinements to such
estimates recognized in subsequent periods; (ii) a Q3 2007 charge related to an annuity coinsurance transaction; and (iii) a Q4 2007 valuation
allowance for deferred tax assets. Management does not believe that similar charges are likely to recur within two years, and there were no
similar charges recognized within the prior two years. Management believes an analysis of operating earnings before these charges is important
to evaluate the performance of the Company prior to the effect of these unusual and significant charges.
78

Information Related to Certain Non-GAAP Financial Measures
A reconciliation of net income applicable to common stock to the net operating income, excluding: (i) Q2 2006 charge related to the litigation settlement and
refinements to such estimates recognized in subsequent periods; (ii) a Q3 2007 charge related to an annuity coinsurance transaction; and (iii) a Q4 2007
valuation allowance for deferred tax assets (and related per share amounts) is as follows (dollars in millions, except per share amounts):
79
Q3 2007
Q4 2007
Q1 2008
Q2 2008
Q3 2008
Net income (loss) applicable to common stock
(52.7)
$
(71.5)
$
(5.8)
$
(487.1)
$
(182.0)
$
Net realized investment losses, net of related amortization and taxes
31.0
23.0
26.5
16.8
85.9
Q2 2008 and Q3 2008 recognition of losses related to the proposed transfer of
Senior Health to an independent trust
-
-
-
503.7
155.0
Net operating income (loss) (a non-GAAP financial measure)
(21.7)
(48.5)
20.7
33.4
58.9
Q2 2006 charge related to the litigation settlement and refinements to such
estimates recognized in subsequent periods, net of taxes
10.6
-
-
-
-
Q3 2007 charge related to an annuity coinsurance transaction, net of taxes
49.7
-
-
-
-
Q4 2007 valuation allowance for deferred tax assets
-
68.0
-
-
-
Net operating income before: (i) Q2 2006 charge related to the litigation settle-
ment and refinements to such estimates recognized in subsequent periods;
(ii) a Q3 2007 charge related to an annuity coinsurance transaction; and
(iii) a Q4 2007 valuation allowance for deferred tax assets (a non-GAAP
financial measure)
38.6
$
19.5
$
20.7
$
33.4
$
58.9
$
Per diluted share:
Net income (loss)
(0.28)
$
(0.38)
$
(0.03)
$
(2.64)
$
(0.98)
$
Net realized investment losses, net of related amortization and taxes
0.16
0.12
0.14
0.09
0.46
Q2 2008 and Q3 2008 recognition of losses related to the proposed transfer of
Senior Health to an independent trust
-
-
-
2.73
0.84
Net operating income (loss) (a non-GAAP financial measure)
(0.12)
(0.26)
0.11
0.18
0.32
Q2 2006 charge related to the litigation settlement and refinements to such
estimates recognized in subsequent periods, net of taxes
0.06
-
-
-
-
Q3 2007 charge related to an annuity coinsurance transaction, net of taxes
0.27
-
-
-
-
Q4 2007 valuation allowance for deferred tax assets
-
0.37
-
-
-
Net operating income before: (i) Q2 2006 charge related to the litigation settle-
ment and refinements to such estimates recognized in subsequent periods;
(ii) a Q3 2007 charge related to an annuity coinsurance transaction; and
(iii) a Q4 2007 valuation allowance for deferred tax assets (a non-GAAP
financial measure)
0.21
$
0.11
$
0.11
$
0.18
$
0.32
$

Information Related to Certain Non-GAAP Financial Measures
80
Book value, excluding accumulated other comprehensive income, per diluted share
This non-GAAP financial measure differs from book value per diluted share because accumulated other comprehensive income has been
excluded from the book value used to determine the measure. Management believes this non-GAAP financial measure is useful because it
removes the volatility that arises from changes in accumulated other comprehensive income. Such volatility is often caused by changes in the
estimated fair value of our investment portfolio resulting from changes in general market interest rates rather than the business decisions made
by management.

Information Related to Certain Non-GAAP Financial Measures
81
A reconciliation from book value per diluted share to book value per diluted share, excluding accumulated other comprehensive income (loss) is
as follows (dollars in millions, except per share amounts):
Q3 07
Q4 07
Q1 08
Q2 08
Q3 08
Total shareholders' equity
4,285.5
$
4,235.9
$
3,939.7
$
3,382.1
$
2,704.0
$
Less accumulated other comprehensive income (loss)
(316.0)
(273.3)
(565.6)
(639.2)
1,137.7
Total shareholders' equity excluding
accumulated other comprehensive income (loss)
(a non-GAAP financial measure)
4,601.5
$
4,509.2
$
4,505.3
$
4,021.3
$
3,841.7
$
Diluted shares outstanding for the period
186,472,069
184,708,727
184,681,243
184,792,300
184,761,138
Book value per diluted share
22.98
$
22.93
$
21.33
$
18.30
$
14.64
$
Less accumulated other comprehensive income (loss)
(1.70)
(1.48)
(3.07)
(3.46)
(6.15)
Book value, excluding accumulated other
comprehensive income (loss), per diluted share
(a non-GAAP financial measure)
24.68
$
24.41
$
24.40
$
21.76
$
20.79
$

Information Related to Certain Non-GAAP Financial Measures
82
Operating return measures
Management believes that an analysis of return before net realized gains or losses and losses related to the proposed transfer of Senior Health
to an independent trust (“net operating income”, a non-GAAP financial measure) is important to evaluate the performance of the Company and is
a key measure commonly used in the life insurance industry. Management uses this measure to evaluate performance because realized
investment gains or losses can be affected by events that are unrelated to the Company’s underlying fundamentals.
In addition, our returns were affected by unusual and significant charges related to: (i) the litigation settlement in Q2 2006 and refinements to
such estimates recognized in subsequent periods; (ii) a Q3 2007 charge related to an annuity coinsurance transaction; and (iii) a Q4 2007
valuation allowance for deferred tax assets. Management does not believe that similar charges are likely to recur within two years, and there
were no similar charges recognized within the prior two years. Management believes an analysis of return before these charges and subsequent
refinements is important to evaluate the performance of the Company prior to the effect of these unusual and significant charges.
This non-GAAP financial measure also differs from return on equity because accumulated other comprehensive income (loss) has been excluded
from the value of equity used to determine this ratio. Management believes this non-GAAP financial measure is useful because it removes the
volatility that arises from changes in accumulated other comprehensive income (loss). Such volatility is often caused by changes in the
estimated fair value of our investment portfolio resulting from changes in general market interest rates rather than the business decisions made
by management.
In addition, our equity includes the value of significant net operating loss carryforwards (included in income tax assets). In accordance with
GAAP, these assets are not discounted, and accordingly will not provide a return to shareholders (until after it is realized as a reduction to taxes
that would otherwise be paid). Management believes that excluding this value from the equity component of this measure enhances the
understanding of the effect these non-discounted assets have on operating returns and the comparability of these measures from period-to-
period. Operating return measures are used in measuring the performance of our business units and are used as a basis for incentive
compensation.
All references to segment operating return measures assume a 25% debt to total capital ratio at the segment level. Additionally, corporate
expenses have been allocated to the segments.

Information Related to Certain Non-GAAP Financial Measures
83
A reconciliation of return on common equity to operating return (less: (i) Q2 2006 charge related to the litigation settlement and refinements to such
estimates recognized in subsequent periods; (ii) a Q3 2007 charge related to an annuity coinsurance transaction; and (iii) a Q4 2007 valuation
allowance for deferred tax assets on common equity (excluding accumulated other comprehensive income (loss) and net operating loss
carryforwards) is as follows (dollars in millions, except per share amounts):
(continued on next page)
Q3 07
Q4 07
Q1 08
Q2 08
Q3 08
Net income (loss) applicable to common stock
(52.7)
$
(71.5)
$
(5.8)
$
(487.1)
$
(182.0)
$
Net realized investment (gains) losses, net of related amortization and taxes
31.0
23.0
26.5
16.8
85.9
Q2 2008 and Q3 2008 recognition of losses related to the transfer of Senior
Health to an independent trust
-
-
-
503.7
155.0
Net operating income (loss) (a non-GAAP financial measure)
(21.7)
(48.5)
20.7
33.4
58.9
Q2 2006 charge related to the litigation settlement and refinements
to such estimates recognized in subsequent periods, net of taxes
10.6
-
-
-
-
Q3 2007 charge related to a coinsurance transaction, net of taxes
49.7
-
-
-
-
Q4 2007 valuation allowance for deferred tax assets
-
68.0
-
-
-
Net operating income before: (i) Q2 2006 charge related to the litigation
settlement and refinements to such estimates recognized in subsequent
periods; (ii) a Q3 2007 charge related to an annuity coinsurance
transaction; and (iii) a Q4 2007 valuation allowance for deferred tax
assets (a non-GAAP financial measure)
38.6
$
19.5
$
20.7
$
33.4
$
58.9
$
Common shareholders' equity
4,285.5
$
4,235.9
$
3,939.7
$
3,382.1
$
2,704.0
$
Less accumulated other comprehensive income (loss)
(316.0)
(273.3)
(565.6)
(639.2)
(1,137.7)
Common shareholder's equity, excluding accumulated other comprehensive
income (loss) (a non-GAAP financial measure)
4,601.5
4,509.2
4,505.3
4,021.3
3,841.7
Less net operating loss carryforwards
1,386.7
1,426.7
1,435.1
1,137.2
1,121.7
Common shareholders' equity, excluding accumulated other comprehensive income
(loss) and net operating loss carryforwards (a non-GAAP financial measure)
3,214.8
$
3,082.5
$
3,070.2
$
2,884.1
$
2,720.0
$

Information Related to Certain Non-GAAP Financial Measures
84
(continued from previous page)
Q3 07
Q4 07
Q1 08
Q2 08
Q3 08
Average common shareholders' equity
4,320.8
4,260.7
4,087.8
3,660.9
3,043.1
Average common shareholders' equity, excluding accumulated other
comprehensive income (loss) and net operating loss carryforwards (a
non-GAAP financial measure)
3,275.5
3,148.7
3,076.4
2,977.2
2,802.1
Return on equity ratios:
Return on common equity
-4.9%
-6.7%
-0.6%
-53.2%
-23.9%
Operating return (less: (i) Q2 2006 charge related to the litigation
settlement and refinements to such estimates recognized in
subsequent periods; (ii) the Q3 2007 charge related to an annuity
coinsurance transaction; and (iii) the Q4 2007 valuation allowance
for deferred tax assets on common equity, excluding accumulated
other comprehensive income (loss) and net operating loss carry-
forwards (a non-GAAP financial measure)
4.7%
2.5%
2.7%
4.5%
8.4%

Information Related to Certain Non-GAAP Financial Measures
85
A reconciliation of pretax operating earnings (a non-GAAP financial measure) to segment operating income (loss) and consolidated net income
(loss) for the nine months ended September 30, 2008, is as follows (dollars in millions):
(Continued on next page)
Other Business
CIG
Bankers
Colonial Penn
in Run-off
Corporate
Total
Pretax operating earnings (a non-GAAP financial measure)
89.4
$
131.5
$
18.5
$
13.8
$
(75.9)
$
177.3
$
Allocation of interest expense, excess capital and corporate
expenses
(41.9)
(30.7)
(2.5)
(5.7)
80.8
-
Income tax (expense) benefit
(17.2)
(36.4)
(5.8)
(3.0)
(1.9)
(64.3)
Segment operating income (loss)
30.3
$
64.4
$
10.2
$
5.1
$
3.0
$
113.0
Net realized investment losses, net of related amortization and taxes
(129.2)
Q2 2008 and Q3 2008 recognition of losses related to the transfer
of Senior Health to an independent trust
(658.7)
Net income
(674.9)
$

Information Related to Certain Non-GAAP Financial Measures
86
A reconciliation of common shareholders’ equity, excluding accumulated other comprehensive income (loss) and net operating loss
carryforwards (a non-GAAP financial measure) to common shareholders’ equity is as follows (dollars in millions):
(Continued from previous page)
(Continued on next page)
Other Business
CIG
Bankers
Colonial Penn
in Run-off
Corporate
Total
December 31, 2007
Common shareholders' equity, excluding accumulated other
comprehensive income (loss) and net operating loss carryforwards
(a non-GAAP financial measure)
1,192.4
$
1,299.8
$
109.7
$
393.7
$
86.9
$
3,082.5
$
Net operating loss carryforwards
1,426.7
-
-
-
-
1,426.7
Accumulated other comprehensive income (loss)
(106.7)
(106.7)
(4.1)
(42.2)
(13.6)
(273.3)
Allocation of capital
464.7
433.3
36.5
63.9
(998.4)
-
Common shareholders' equity
2,977.1
$
1,626.4
$
142.1
$
415.4
$
(925.1)
$
4,235.9
$
September 30, 2008
Common shareholders' equity, excluding accumulated other
comprehensive income (loss) and net operating loss carryforwards
(a non-GAAP financial measure)
1,527.8
$
1,255.2
$
116.6
$
174.3
$
(353.9)
$
2,720.0
$
Net operating loss carryforwards
1,121.7
-
-
-
-
1,121.7
Accumulated other comprehensive income (loss)
(562.4)
(505.6)
(39.2)
(10.0)
(20.5)
(1,137.7)
Allocation of capital
509.3
418.4
38.9
58.1
(1,024.7)
-
Common shareholders' equity
2,596.4
$
1,168.0
$
116.3
$
222.4
$
(1,399.1)
$
2,704.0
$

Information Related to Certain Non-GAAP Financial Measures
87
(Continued from previous page)
A reconciliation of average common shareholders’ equity, excluding accumulated other comprehensive income (loss) and net operating loss
carryforwards (a non-GAAP financial measure) to average common shareholders’ equity at September 30, 2008, is as follows (dollars in millions):
Other Business
CIG
Bankers
Colonial Penn
in Run-off
Corporate
Total
Average common shareholders' equity, excluding accumulated
other comprehensive income (loss) and net operating loss
carryforwards (a non-GAAP financial measure)
1,370.0
$
1,248.6
$
113.0
$
325.0
$
(104.7)
$
2,951.9
$
Average net operating loss carryforwards
1,282.2
Average accumulated other comprehensive income (loss)
(636.8)
Average common shareholders' equity
3,597.3
$
Return on equity ratios:
Return on equity
-25.0%
Operating return (less the Q2 2006 charge related to the
litigation settlement and refinements to such estimates
recognized in subsequent periods, the Q3 2007 charge
related to an annuity coinsurance transaction, the
Q4 2007 and Q2 2008 valuation allowance for deferred
tax assets) on common equity, excluding accumulated
other comprehensive income (loss) and net operating
loss carryforwards (a non-GAAP financial measure)
2.9%
6.9%
12.0%
2.1%
NM
5.1%

Information Related to Certain Non-GAAP Financial Measures
88
Debt to capital ratio, excluding accumulated other comprehensive income (loss)
This non-GAAP financial measure differs from the debt to capital ratio because accumulated other comprehensive income has been excluded
from the value of capital used to determine this measure. Management believes this non-GAAP financial measure is useful because it removes
the volatility that arises from changes in accumulated other comprehensive income. Such volatility is often caused by changes in the estimated
fair value of our investment portfolio resulting from changes in general market interest rates rather than the business decisions made by
management.

Information Related to Certain Non-GAAP Financial Measures
89
A reconciliation of the debt to capital ratio to debt to capital, excluding accumulated other comprehensive loss is as follows (dollars in millions):
Q3 07
Q4 07
Q1 08
Q2 08
Q3 08
Corporate notes payable
1,195.7
$
1,193.7
$
1,191.7
$
1,189.7
$
1,187.6
$
Total shareholders' equity
4,285.5
4,235.9
3,939.7
3,382.1
2,704.0
Total capital
5,481.2
5,429.6
5,131.4
4,571.8
3,891.6
Less accumulated other comprehensive loss
316.0
273.3
565.6
639.2
1,137.7
Total capital, excluding accumulated other
comprehensive loss
(a non-GAAP financial measure)
5,797.2
$
5,702.9
$
5,697.0
$
5,211.0
$
5,029.3
$
Corporate notes payable
1,195.7
$
1,193.7
$
1,191.7
$
1,189.7
$
1,187.6
$
Corporate notes payable to capital ratios:
Corporate debt to total capital
21.8%
22.0%
23.2%
26.0%
30.5%
Corporate debt to total capital, excluding
accumulated other comprehensive loss
(a non-GAAP financial measure)
20.6%
20.9%
20.9%
22.8%
23.6%