
Preliminary View of
Fourth Quarter 2008
Financial and Operating Results
Conseco, Inc.

Forward-Looking Statements
Cautionary Statement Regarding Forward-Looking Statements. Our statements, trend analyses and other information contained in these
materials relative to markets for Conseco’s products and trends in Conseco’s operations or financial results, as well as other statements, contain
forward-looking statements within the meaning of the federal securities laws and the Private Securities Litigation Reform Act of 1995. Forward-
looking statements typically are identified by the use of terms such as “anticipate,” “believe,” “plan,” “estimate,” “expect,” “project,” “intend,” “may,”
“will,” “would,” “contemplate,” “possible,” “attempt,” “seek,” “should,” “could,” “goal,” “target,” “on track,” “comfortable with,” “optimistic” and similar
words, although some forward-looking statements are expressed differently. You should consider statements that contain these words carefully
because they describe our expectations, plans, strategies and goals and our beliefs concerning future business conditions, our results of operations,
financial position, and our business outlook or they state other ‘‘forward-looking’’ information based on currently available information. Assumptions
and other important factors that could cause our actual results to differ materially from those anticipated in our forward-looking statements include,
among other things: (i) general economic, market and political conditions, including the performance and fluctuations of the financial markets which
may affect our ability to raise capital or refinance our existing indebtedness and the cost of doing so; (ii) our ability to generate sufficient liquidity to
meet our debt service obligations and other cash needs; (iii) our ability to obtain adequate and timely rate increases on our supplemental health
products including our long-term care business; (iv) the receipt of required regulatory approvals for dividend and surplus debenture interest
payments from our insurance subsidiaries; (v) mortality, morbidity, the increased cost and usage of health care services, persistency, the adequacy
of our previous reserve estimates and other factors which may affect the profitability of our insurance products; (vi) changes in our assumptions
related to the cost of policies produced or the value of policies inforce at the Effective Date; (vii) the recoverability of our deferred tax asset and the
effect of potential tax rate changes on its value; (viii) changes in accounting principles and the interpretation thereof; (ix) our ability to achieve
anticipated expense reductions and levels of operational efficiencies including improvements in claims adjudication and continued automation and
rationalization of operating systems; (x) performance and valuation of our investments, including the impact of realized losses (including other-than-
temporary impairment charges); (xi) our ability to identify products and markets in which we can compete effectively against competitors with greater
market share, higher ratings, greater financial resources and stronger brand recognition; (xii) the ultimate outcome of lawsuits filed against us and
other legal and regulatory proceedings to which we are subject; (xiii) our ability to remediate the material weakness in internal controls over the
actuarial reporting process that we identified at year-end 2006 and to maintain effective controls over financial reporting; (xiv) our ability to continue
to recruit and retain productive agents and distribution partners and customer response to new products, distribution channels and marketing
initiatives; (xv) our ability to achieve eventual upgrades of the financial strength ratings of Conseco and our insurance company subsidiaries as well
as the potential impact of rating downgrades on our business; (xvi) the risk factors or uncertainties listed from time to time in our filings with the
Securities and Exchange Commission; (xvii) our ability to continue to satisfy the financial ratio and balance requirements and other covenants of our
debt agreements; (xviii) regulatory changes or actions, including those relating to regulation of the financial affairs of our insurance companies, such
as the payment of dividends to us, regulation of financial services affecting (among other things) bank sales and underwriting of insurance products,
regulation of the sale, underwriting and pricing of products, and health care regulation affecting health insurance products; and (xix) changes in the
Federal income tax laws and regulations which may affect or eliminate the relative tax advantages of some of our products. Other factors and
assumptions not identified above are also relevant to the forward-looking statements, and if they prove incorrect, could also cause actual results to
differ materially from those projected. All written or oral forward-looking statements attributable to us are expressly qualified in their entirety by the
foregoing cautionary statement. Our forward-looking statements speak only as of the date made. We assume no obligation to update or to publicly
announce the results of any revisions to any of the forward-looking statements to reflect actual results, future events or developments, changes in
assumptions or changes in other factors affecting the forward-looking statements.

Non-GAAP Measures
This presentation contains the following financial measures that differ from the comparable measures
under Generally Accepted Accounting Principles (GAAP): operating earnings measures; book value
excluding accumulated other comprehensive income (loss) per diluted share; operating return measures;
earnings before net realized investment gains (losses) and corporate interest and taxes; debt to capital
ratios, excluding accumulated other comprehensive income (loss); and interest-adjusted benefit ratios.
Reconciliations between those non-GAAP measures and the comparable GAAP measures are included
in the Appendix, or on the page such measure is presented.
While management believes these measures are useful to enhance understanding and comparability of
our financial results, these non-GAAP measures should not be considered substitutes for the most
directly comparable GAAP measures.
Additional information concerning non-GAAP measures is included in our periodic filings with the
Securities and Exchange Commission that are available in the “Investor – SEC Filings” section of
Conseco’s website, www.conseco.com.
Preliminary Results
All financial results described herein should be considered preliminary and are subject to change to
reflect any necessary adjustments that are identified before the Company completes its financial
statements and files its Annual Report on Form 10-K for the year ended December 31, 2008.

CNO
Going Concern Discussion
Form 10-K filing delayed until on or before March 17, 2009.
Finalizing the analysis and disclosure related to investment portfolio
Auditors’ concerns regarding liquidity and debt covenant margins
(primarily those that could be impacted by a significant amount of
additional realized losses in the Company’s investment portfolio). Unless
auditors are satisfied with additional information being provided by the
Company, the audit opinion will include an explanatory paragraph
regarding the Company’s ability to continue as a going concern.
Material Control Weakness

Q4 2008
Preliminary Financial Summary
CNO
Continued profitability in all three insurance segments, with
total Q4 2008 EBIT of $78.1 million
$101.6 million quarterly sales for CNO, up 16% over Q4 2007
Bankers sales up 25%
Colonial Penn sales up 16%
CIG sales down 9%
Separation of Senior Health* occurred in Q4 2008
Capital management initiatives
Section 382 shareholder rights plan announced in January
2009
*Senior Health Insurance Company of Pennsylvania, formerly known as Conseco Senior Health Insurance
Company prior to its name change in October 2008.

Q4 2008
Preliminary Financial Summary
CNO
Investment portfolio earned yields meeting expectations
Net realized investment losses of $88.0 million (including
impairment losses of $44.8 million), consistent with Q3 2008
results, industry trends and market conditions
Accumulated other comprehensive loss increased from $1.1
billion at 9/30/08 to $1.8 billion at 12/31/08, primarily driven by
wider credit spreads, consistent with market conditions
Company expects final audited financial statements to show
compliance, as of 12/31/08, with all financial ratio and balance
covenants of bank facility

Why CNO is Different
Not ratings-sensitive
Virtually no variable business
Focus on protection products
Small average policy sizes
No significant investments in exotic securities
No dynamic hedging
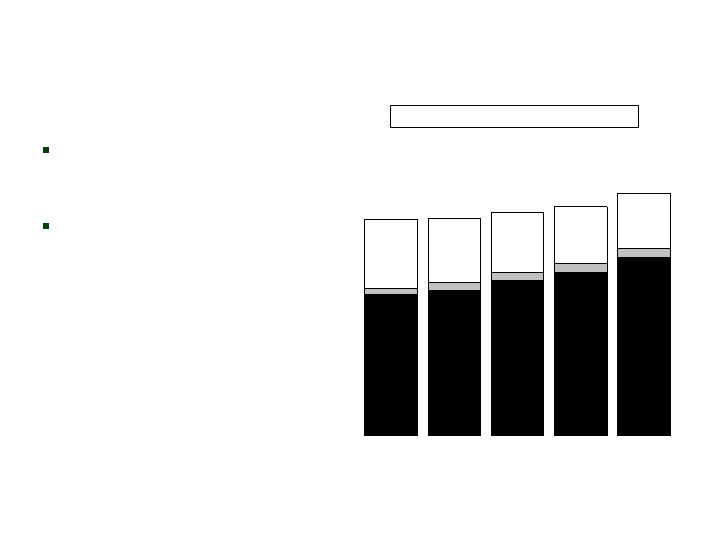
Collected Premiums
CNO
Strong, consistent
growth in Bankers
and Colonial Penn
Slight decline in CIG
due to focus on
more profitable
business
BLC
Q4 2007
$4,045.0
Q1 2008
$4,056.4
($ millions)
CP
CIG
Collected Premiums-Trailing 4 Quarters
Q2 2008
$4,167.3
Q3 2008
$4,275.1
Q4 2008
$4,524.9

Bankers Life
Colonial Penn
Conseco Insurance Group
Corporate operations, interest expense
and gain on extinguishment of debt
Income before net realized investment losses*
Net realized investment losses
Discontinued operations
Total
Q4 2008
Preliminary Summary of Results
CNO
$40.0
6.7
31.5
5.9
84.1
(88.0)
(369.6)
$(373.5)
Pre-Tax
After Tax
EPS
($ millions, except per share amounts)
$48.7
(88.0)
(367.5)
$(406.8)
$0.26
(0.47)
(1.99)
$(2.20)
*Management believes that an analysis of earnings before net realized investment gains (losses) (including losses
related to the transfer of Senior Health to an independent trust – now included in Discontinued Operations) and taxes (a
non-GAAP financial measure) provides an alternative measure of the operating results of the company because it
excludes net realized gains (losses) that are unrelated to the company’s underlying fundamentals. The table above
provides a reconciliation to the corresponding GAAP measure.
**See Appendix for a reconciliation to the corresponding GAAP measure.
**

Q4 Preliminary Earnings
CNO Consolidated
*Management believes that an analysis of earnings before net realized investment gains (losses) (including losses
related to the transfer of Senior Health to an independent trust – now included in discontinued Operations) and
corporate interest and taxes (“EBIT,” a non-GAAP financial measure) provides an alternative measure to compare
the operating results of the company quarter-over-quarter because it excludes: (1) corporate interest expense; and
(2) net realized gains (losses) that are unrelated to the company’s underlying fundamentals. The table above
provides a reconciliation of EBIT to net income applicable to common stock.
($ millions)
Q4 2007
Q1 2008
Q2 2008
Q3 2008
Q4 2008
Bankers Life
$58.3
$29.1
$34.6
$67.8
$40.0
Colonial Penn
(0.2)
3.7
8.3
6.5
6.7
Conseco Insurance Group
9.6
23.3
32.3
34.2
31.5
Corporate operations, excluding interest expense
(2.9)
(6.7)
(16.2)
(3.7)
(0.1)
Total EBIT*
64.8
49.4
59.0
104.8
78.1
Corporate interest expense
(19.1)
(16.4)
(13.9)
(13.7)
(15.2)
Gain on extinguishment of debt
0.0
0.0
0.0
0.0
21.2
Income (loss) before net realized investment losses, taxes
and discontinued operations
45.7
33.0
45.1
91.1
84.1
Tax expense on period income
18.5
11.5
18.5
31.5
35.4
Net operating income (loss)
27.2
21.5
26.6
59.6
48.7
Net realized investment losses (excluding the increase in unrealized
losses on those investments transferred to an independent
trust and net of related amortization and taxes and the establish-
ment of a valuation allowance for deferred tax assets related to
such losses)
(23.8)
(27.8)
(17.4)
(84.2)
(88.0)
Net income (loss) applicable to common stock before valuation
allowance for deferred tax assets and discontinued operations
3.4
(6.3)
9.2
(24.6)
(39.3)
Valuation allowance for deferred tax assets
(68.0)
0.0
(298.0)
0.0
0.0
Discontinued operations
(6.9)
0.5
(198.3)
(157.4)
(367.5)
Net loss applicable to common stock
($71.5)
($5.8)
($487.1)
($182.0)
($406.8)
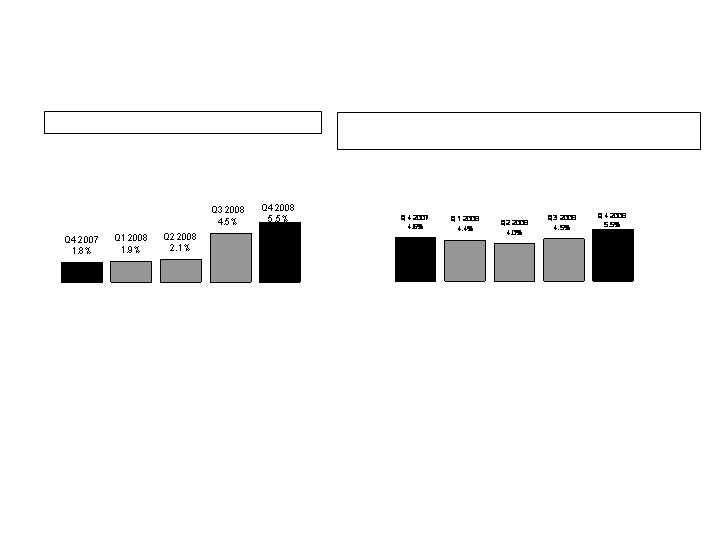
Preliminary Operating ROE
CNO
Operating ROE*, Trailing 4 Quarters
Operating ROE (Before Annuity Coinsurance Transaction)**,
Trailing 4 Quarters
*Operating return excludes net realized
investment gains (losses), valuation allowance
related to deferred tax assets and losses related
to the transfer of Senior Health to an
independent trust. Equity excludes
accumulated other comprehensive income
(loss) and the value of net operating loss
carryforwards, and assumes conversion of
preferred stock. See Appendix for
corresponding GAAP measure.
**Operating return, as calculated and defined on the left side
of this page, but before a Q3 2007 charge related to an
annuity coinsurance transaction. See Appendix for
corresponding GAAP measure.
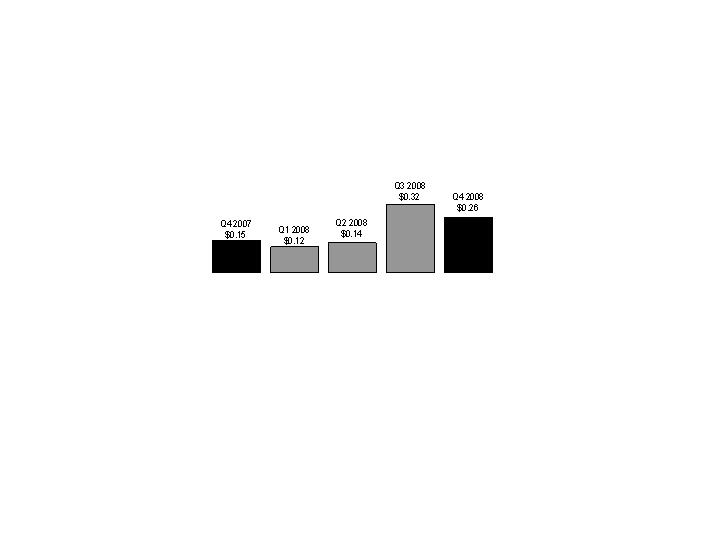
Preliminary Operating EPS* (Diluted)
CNO
*Operating earnings per share exclude net realized investment gains (losses), valuation allowance related to
deferred tax assets and losses related to the transfer of Senior Health to an independent trust. See Appendix
for corresponding GAAP measure.

Corporate liquidity
Available holding and non-life company liquidity of $59 million at 12/31/08
$108 million of liquidity at 2/27/09
Repurchased $37 million of our convertible debentures during October
2008 for $16 million, resulting in $21 million gain
Drew down $75 million on revolver during October 2008, which confirmed
the availability of these funds; repaid $20 million in December 2008
Sources of and uses of funds, excluding insurance subsidiary dividends
Liquidity
CNO
($ millions)
Sources:
Interest on Surplus Debentures
Net Fees for Services Provided Under Intercompany Agreements
Uses:
Interest Expense on Corporate Debt
Operating Expenses
Net Impact
2007
$69.9
92.9
(72.3)
(42.4)
$48.1
2008
$56.4
83.2
(59.2)
(43.5)
$36.9
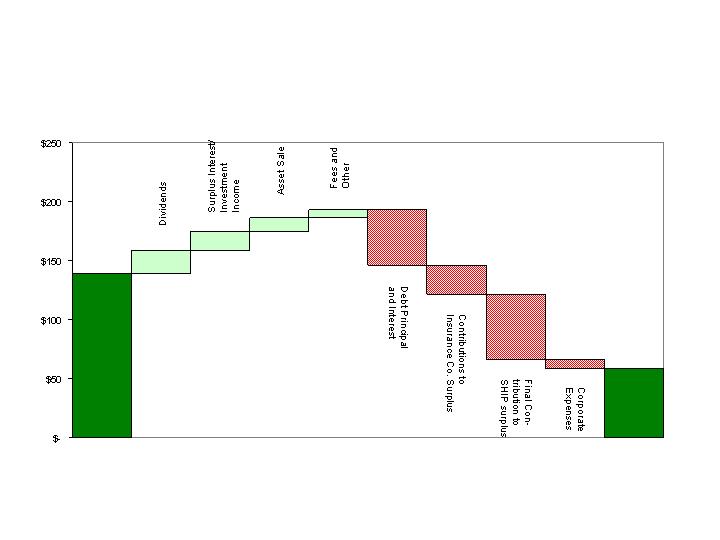
CNO
($ millions)
Liquidity: Q4 2008 Actual
$138
$20
$15
$12
$7
$46
$25
$50
$12
$59
Beginning
Liquidity
Balance
Ending
Liquidity
Balance

2009 Liquidity Projection
CNO
*Subject to regulatory approval. Dividend payments of $25 million and Surplus Debenture Interest of $21
million are pending regulatory approval.
($ millions)
$59.0
60.0
44.9
53.0
37.4
195.3
54.6
55.0
10.2
25.0
34.1
178.9
$75.4
Cash Balance 12/31/08
Sources
Dividends*
Surplus Debenture Interest*
Management and Investment Fees
Intercompany Loans and Other
Total Sources
Uses
Interest
Debt Repayments:
Revolver
Senior Credit Facility
Senior Health Notes
Holding Company Expenses
Total Uses
Cash Balance 12/31/09

Company expects final
audited statements to
show compliance, as of
12/31/08, with all
financial ratio and
balance covenants of
bank facility
Key Debt Covenants
CNO
Q4 2008
($ millions)
Q4 2007
30.0%
21.0%
2.00X
3.34X
$1,270
$1,497
250%
296%
30.0%
27.9%
2.00X
2.34X
$1,270
$1,381
250%
258%
Debt/Capital Ratio*
Covenant Maximum
Actual
Interest Coverage
Covenant Minimum
Actual
Statutory Capital
Covenant Minimum
Actual
RBC Ratio
Covenant Minimum
Actual
*Excludes Accumulated Other Comprehensive Income
Q3 2008
30.0%
23.6%
2.00X
2.64X
$1,270
$1,433
250%
257%
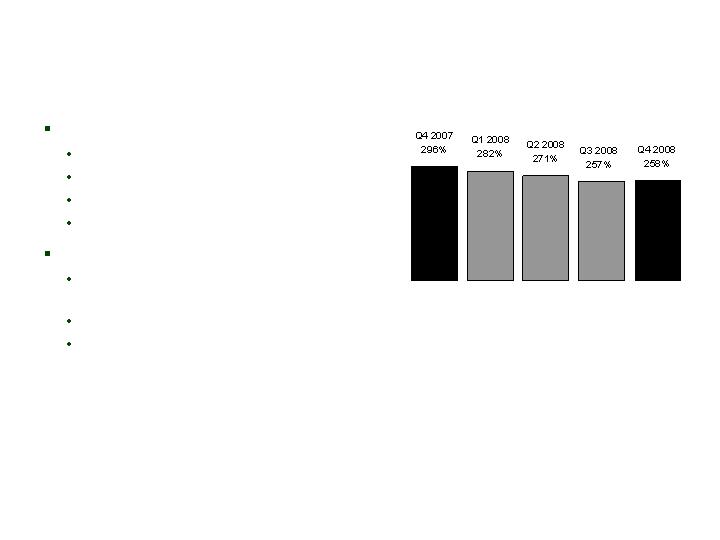
Consolidated RBC Ratio*
CNO
Q4 2008 positive impacts:
Senior Health separation
Q4 statutory operating results
Permitted practices
Capital management actions
Q4 2008 negative impacts:
Mortgage Experience Adjustment
Factor
Net realized losses
Investment downgrades
*Risk-Based Capital (“RBC”) requirements provide a tool for insurance regulators to determine the levels of
statutory capital and surplus an insurer must maintain in relation to its insurance and investment risks. The
RBC ratio is the ratio of the statutory consolidated adjusted capital of our insurance subsidiaries to RBC.
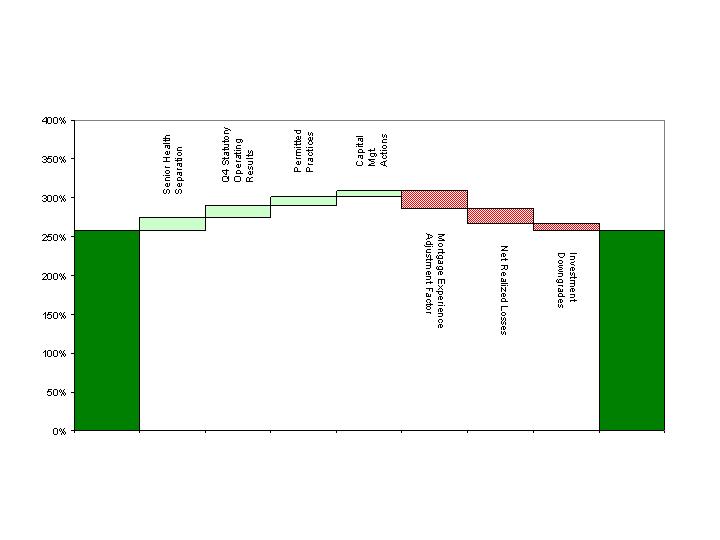
Consolidated RBC Ratio –
Q4 2008 Changes
CNO
Beginning
RBC
Ending
RBC
257%
258%
18%
15%
11%
8%
23%
19%
9%

Capital Management Actions
Bankers LTC New Business Reinsurance
Benefits
Improve capital and product risk mix
Develop partnership with reinsurer
Transaction Terms
Reinsurer: Reinsurance Group of America (RGA)
Reinsure 2008, 2009 and future new business
Traditional coinsurance; quota share is 70% for 2008 and 50% for 2009+
Coventry Agreement
Exited reinsurance of Coventry group contracts – non-core business
Improves RBC going forward
Other Reinsurance
Series of small external and internal arrangements – effects on following
page
Permitted Practice Approvals
CNO

Capital Management Actions:
Statutory Financial Impact
CNO
($ millions)
$6.8
N/A
$24.4
$61.9
Bankers - LTC Reinsurance
Bankers – Coventry Group Exit
Other Reinsurance and Capital Actions
Permitted Practices
+1.5%
N/A
+10.8%
+11.0%
$6.8
$(0.3)
$(20.7)
N/A
Consolidated
RBC Impact
+1.5%
+7.8%
+3.2%
N/A
2008
Consolidated
TAC Impact
Consolidated
RBC Impact
Consolidated
TAC Impact
2009

Capital Management Actions:
2009 GAAP Impact
CNO
($ millions, except per share amounts)
Pre-Tax
$(3.0)
$(7.5)
$(3.7)
Bankers - LTC Reinsurance
Bankers – Coventry Group Exit
Other Reinsurance and Capital Actions
After Tax
$(2.0)
$(4.9)
$(2.4)
Per Share
$(0.01)
$(0.03)
$(0.01)
GAAP Operating Income

Earnings were $40.0 million, vs. $67.8 million in Q3 2008
Q4 2008 earnings affected by:
Lower than expected PFFS/PDP margins
Lower margins in Med Supp
FAS 133 and COLI volatility
Med Supp and LTC reinsurance transaction
Continued stabilization in LTC margins
Strong Q4 2008 sales
Q4 Summary
Bankers
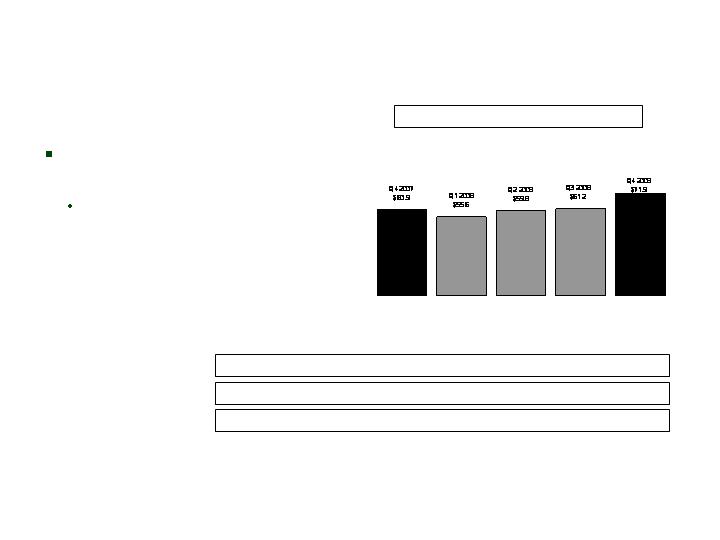
NAP Results
Quarterly NAP up 18% vs Q4
2007 (up 25% including PFFS)
Strong sales of annuities (+84%)
and Med Supp (+21%), partially
offset by lower life (-13%) and
LTC (-27%) sales
Bankers
($ millions)
Quarterly NAP-Excluding PFFS
NAP-Quarterly*: $58.3 $114.6 $53.4 $65.8 $72.8
PFFS NAP-Quarterly*: $(2.6) $59.0 $(6.4) $4.6 $0.9
Non-PFFS NAP-Quarterly: $60.9 $55.6 $59.8 $61.2 $71.9
*Excludes group business not sold by Bankers agents.

Q4 Earnings
Bankers
Management believes that an analysis of income (loss) before net realized investment gains (losses), net of
related amortization (a non-GAAP financial measure), is important to evaluate the financial performance of our
business, and is a measure commonly used in the life insurance industry. Management uses this measure to
evaluate performance because realized gains or losses can be affected by events that are unrelated to a
company’s underlying fundamentals. The table on Page 10 reconciles the non-GAAP measure to the
corresponding GAAP measure. See Appendix for a reconciliation of the return on equity measure to the
corresponding GAAP measure.
Trailing 4 Quarter Operating Return on Equity: 7.1%
($ millions)
Q4 2007
Q1 2008
Q2 2008
Q3 2008
Q4 2008
Insurance policy income
$470.4
$497.0
$543.4
$537.7
$531.8
Net investment income
132.1
129.3
135.2
138.3
155.4
Fee revenue and other income
4.3
1.6
2.1
3.1
4.2
Total revenues
606.8
627.9
680.7
679.1
691.4
Insurance policy benefits
394.9
434.9
497.2
470.3
477.5
Amounts added to policyholder account balances
43.5
44.8
37.2
46.2
82.3
Amortization related to operations
65.0
75.0
66.6
53.5
39.7
Other operating costs and expenses
45.1
44.1
45.1
41.3
51.9
Total benefits and expenses
548.5
598.8
646.1
611.3
651.4
Income before net realized investment gains (losses),
net of related amortization and income taxes
$58.3
$29.1
$34.6
$67.8
$40.0

Q4 2008 NAP of $11 million, 16% above Q4 2007
2008 YTD NAP of $54.4 million, up 28% over prior year
Q4 2008 earnings were $6.7 million, compared to $(0.2)
million in Q4 2007
Lower expenses from discontinued PFFS pilot program
Q4 2007 recapture of reinsurance treaty
Organic growth from sales initiatives
Q4 Summary
Colonial Penn

Q4 Earnings
Colonial Penn
Management believes that an analysis of income (loss) before net realized investment gains (losses), net of
related amortization (a non-GAAP financial measure), is important to evaluate the financial performance of our
business, and is a measure commonly used in the life insurance industry. Management uses this measure to
evaluate performance because realized gains or losses can be affected by events that are unrelated to a
company’s underlying fundamentals. The table on Page 10 reconciles the non-GAAP measure to the
corresponding GAAP measure. See Appendix for a reconciliation of the return on equity measure to the
corresponding GAAP measure.
Trailing 4 Quarter Operating Return on Equity: 12.4%
($ millions)
Q4 2007
Q1 2008
Q2 2008
Q3 2008
Q4 2008
Insurance policy income
$34.6
$44.4
$47.5
$46.4
$46.5
Net investment income
9.5
9.2
10.1
10.1
10.2
Fee revenue and other income
0.2
0.3
0.5
0.5
0.5
Total revenues
44.3
53.9
58.1
57.0
57.2
Insurance policy benefits
25.2
35.0
35.5
33.9
33.8
Amounts added to policyholder account balances
0.3
0.3
0.3
0.3
0.3
Amortization related to operations
5.5
7.4
7.4
9.2
8.0
Other operating costs and expenses
13.5
7.5
6.6
7.1
8.4
Total benefits and expenses
44.5
50.2
49.8
50.5
50.5
Income (loss) before net realized investment
gains (losses) and income taxes, net of
related amortization
($0.2)
$3.7
$8.3
$6.5
$6.7
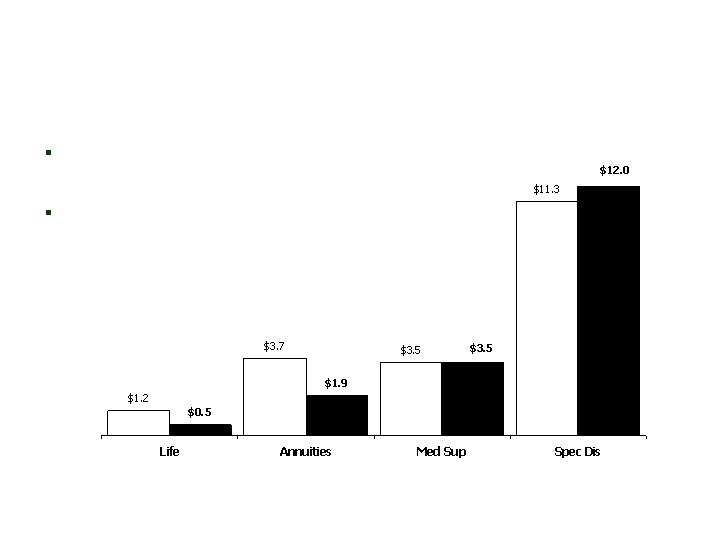
Q4 2008 NAP $18 million,
9% below Q4 2007
CIG
($ millions)
Sales gains in specified disease, up 6%
from Q4 2007
Decreases in high face-amount life and
annuity products, consistent with CIG’s
re-focus

Q4 2008 earnings down 8% vs Q3 2008:
Unlocking adjustment of $7.0 million on the interest-sensitive life block
Lower LTC closed block margins ($4.4 million)
Partially offset by:
Higher specified disease margins due to a deferred ROP adjustment
Higher Medicare supplement margins
Q4 2008 earnings up 228% vs Q4 2007:
Higher specified disease margins and lower amortization
The unlocking adjustment was significantly less in Q4 2008
Partially offset by lower LTC closed block margins
Continuing to make changes to non-guaranteed elements of older life
insurance policies issued by Conseco’s predecessor companies
Q4 Summary
CIG
Q4 Earnings
CIG
Management believes that an analysis of income (loss) before net realized investment gains (losses), net of
related amortization (a non-GAAP financial measure), is important to evaluate the financial performance of our
business, and is a measure commonly used in the life insurance industry. Management uses this measure to
evaluate performance because realized gains or losses can be affected by events that are unrelated to a
company’s underlying fundamentals. The table on Page 10 reconciles the non-GAAP measure to the
corresponding GAAP measure. See Appendix for a reconciliation of the return on equity measure to the
corresponding GAAP measure.
Trailing 4 Quarter Operating Return on Equity: 3.7%
($ millions)
Q4 2007
Q1 2008
Q2 2008
Q3 2008
Q4 2008
Insurance policy income
$242.6
$243.7
$239.1
$237.7
$238.4
Net investment income
137.7
136.1
138.7
134.0
143.7
Fee revenue and other income
0.3
0.8
0.5
0.1
0.3
Total revenues
380.6
380.6
378.3
371.8
382.4
Insurance policy benefits
195.1
209.1
208.6
203.6
199.6
Amounts added to policyholder account balances
47.7
43.6
37.1
42.7
38.4
Amortization related to operations
51.2
30.2
31.2
24.9
36.3
Interest expense on investment borrowings
6.1
5.8
5.5
5.6
5.5
Gain on reinsurance recapture
0.0
0.0
0.0
(0.8)
0.0
Other operating costs and expenses
70.9
68.6
63.6
61.6
71.1
Total benefits and expenses
371.0
357.3
346.0
337.6
350.9
Income before net realized investment gains (losses),
net of related amortization and income taxes, excluding
costs related to the litigation settlement and the loss
related to an annuity coinsurance transaction
$9.6
$23.3
$32.3
$34.2
$31.5

Q4 2008
Net Realized Losses
CNO
Net losses on sales
Losses due to recognition of other-than-temporary impairments
Subtotal before amortization adjustment
Amortization adjustment to DAC and PVP
Net realized investment losses
$(48.1)
(44.9)
(93.0)
5.0
$(88.0)
($ millions)
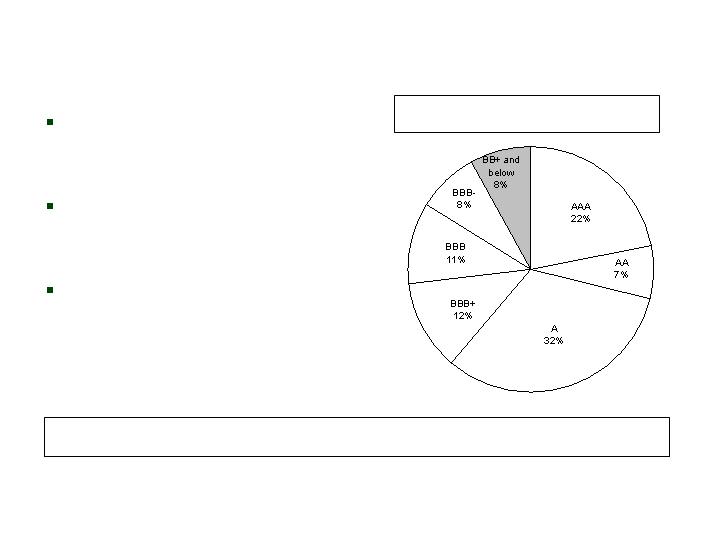
Investment Quality:
Fixed Maturities*
CNO
Investment grade securities
represent 92% of total
portfolio*
Limited new money allocation
to below-investment grade
securities
Increase in below-investment
grade ratio driven by credit
cycle/ratings migration
Actively Managed Fixed Maturities by Rating at
12/31/08 (Market Value)
12/31/08
92%
9/30/08
93%
6/30/08
93%
3/31/07
93%
12/31/07
92%
% of Bonds which are Investment Grade:
*Includes investments from a variable interest entity which we consolidate under GAAP (though the related
liabilities are non-recourse to Conseco).
Subprime allocation substantially
reduced
HEL allocation reflects market
stresses
Overall mark-to-market and
credit migration consistent with
credit cycle
Pressure on financials and
cyclicals
Overall highly rated
Pressure on ALT-A delinquency
trends
Some Alt-A downgrades
Low, but rising delinquency
trends
Seasoned portfolio
BBB market pricing pressure
severe
Nominal downgrades to date,
but rating activity likely
Slowing economy and lack of financing availability
likely to lead to higher delinquencies
Active surveillance and portfolio management
Nominal new investment activity
Liquidated $45 million in problematic exposures in
Q4 2008
Managing through the credit cycle by emphasizing long-term
assessments of value and quality
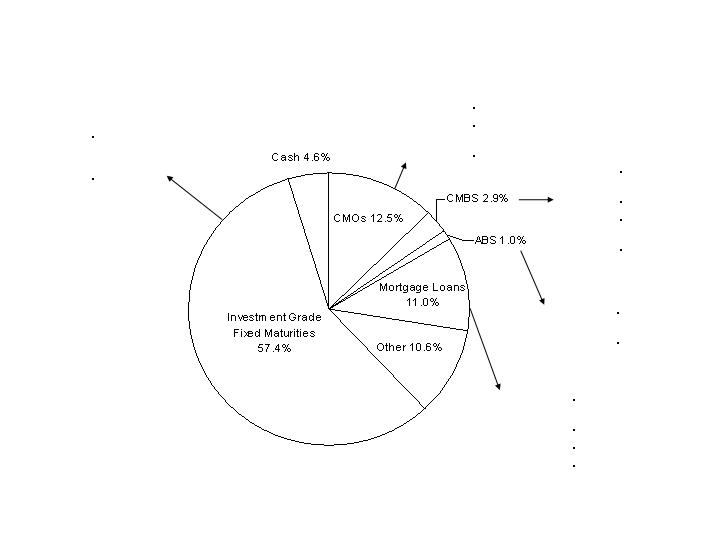
Asset Allocation at 12/31/08
CNO
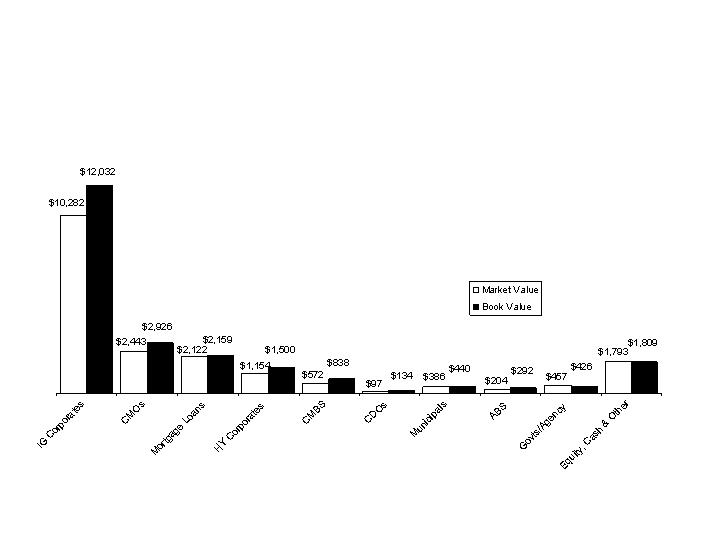
Asset Allocation at 12/31/08
MTM in line with market trends, reflecting
wider spreads in corporates and mortgages
CNO
($ millions)
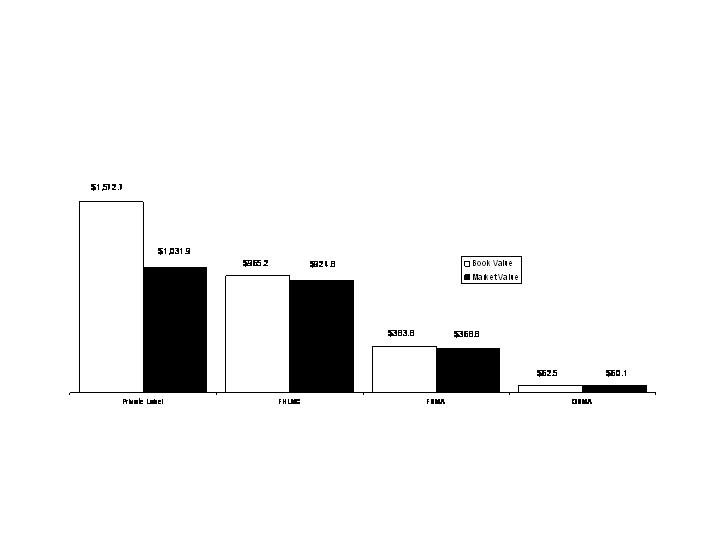
CMOs by Agency at 12/31/08
Our CMO portfolio is almost evenly divided
between agencies and non-agencies
CNO
($ millions)
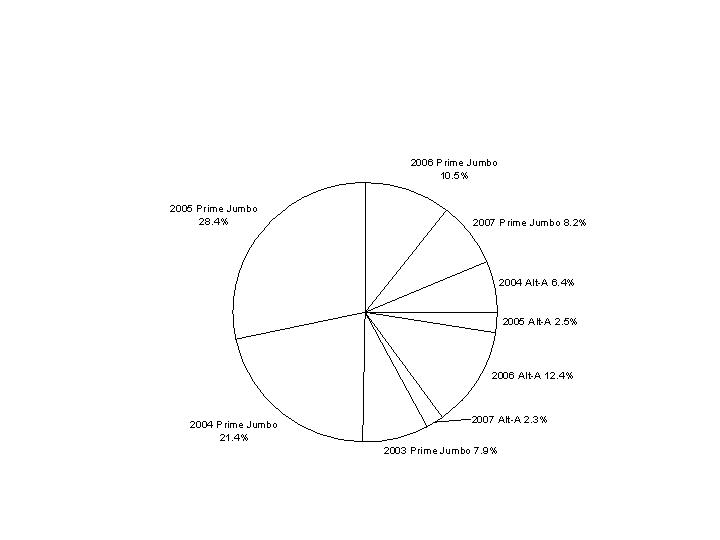
Non-Agency CMOs at 12/31/08
Our non-agency CMOs are diversified by type and vintage
CNO

Alt-A at 12/31/08
CNO
AAA
AA
A
BB
Total
$227.1
$0.9
$3.9
$10.8
$242.7
$466.5
$4.0
$3.9
$10.8
$485.2
93.6%
0.4%
1.6%
4.4%
100.0%
1.22%
0.00%
0.02%
0.06%
1.30%
Market
Value (mil.)
Book
Value (mil.)
% of
Alt-A*
% of
Portfolio*
Rating
$14.7 million (market value) A category or lower (0.08% of invested assets)
Substantial credit support inherent in structures relative to expected losses, even at
rising delinquency rates
No exposure to “affordability products” – option ARMs, hybrid, neg-ams
716
695
708
704
715
Avg.
FICO
9.2%
18.2%
6.8%
12.0%
9.3%
Avg.
Support
9.7%
6.5%
12.5%
16.2%
9.9%
Avg. 60+
Delinq.
*% of market value
($ millions)
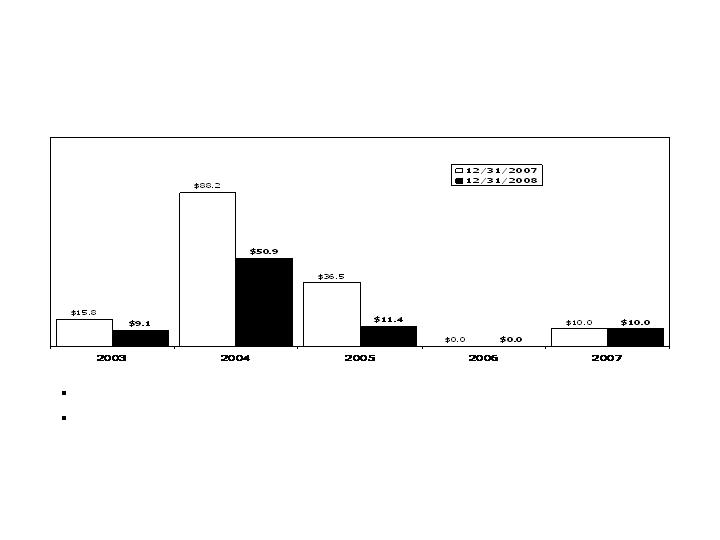
Sub-Prime Home Equity ABS
By Vintage
CNO
Exposure reduced by 46% in 2008
Market value represents 0.32% of invested assets at 12/31/08, compared to 0.52% at 12/31/07
(GAAP book value - $ millions)
$150.5
$81.4

Sub-Prime Home Equity ABS
CNO
AAA
AA
A
Total
$24.1
$21.6
$12.5
$58.2
$32.3
$31.7
$17.4
$81.4
39.7%
38.9%
21.4%
100.0%
0.13%
0.12%
0.07%
0.32%
Market
Value (mil.)
Book
Value (mil.)
% of
Subprime*
% of
Portfolio*
Rating
Only $12.5 million (market value) A category or lower (0.07% of invested assets)
No exposure to “affordability products” – negative amortization, option ARM
collateral, etc.
Rising delinquencies, consistent with market conditions
Remaining portfolio generally reflects satisfactory margin for adverse collateral
performance
639
648
665
648
Avg.
FICO
30.3%
23.4%
22.8%
26.1%
Avg.
Support
15.8%
9.5%
8.4%
11.9%
Avg. 60+
Delinq.
*% of market value
($ millions)

CMBS by Vintage at 12/31/08
Our CMBS exposure is heavily weighted toward higher ratings and
older vintages with stronger qualitative characteristics and seasoning
CNO
---
$93.3
$38.1
$15.6
$31.9
$15.6
$30.2
A
$23.2
$30.7
$21.4
---
2006
---
$23.2
$20.6
---
$122.7
$27.5
---
$61.2
$34.9
$47.0
$537.7
$450.8
2007
Total BV
Total MV
---
$76.9
$2.3
$111.7
2005
---
$9.1
$7.4
$153.7
2004
---
$6.0
$30.1
$225.3
Pre-2004
<BBB
BBB
AA
AAA
(GAAP book value - $ millions)
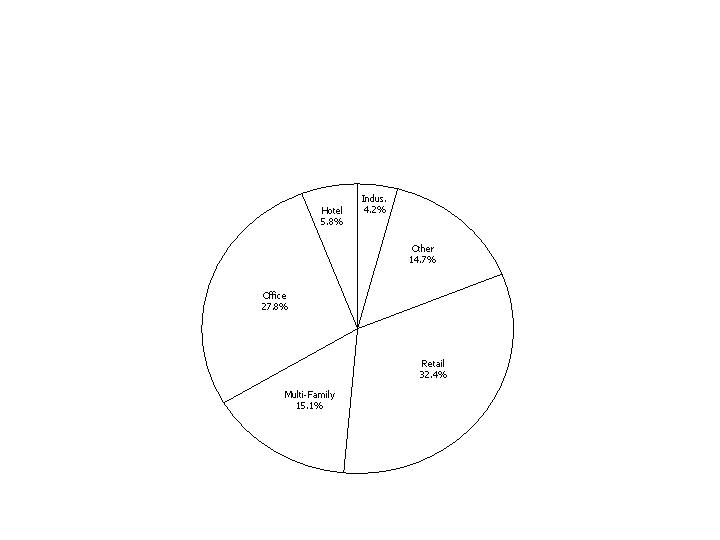
CMBS by Collateral Type at 12/31/08
Our CMBS are backed by a diverse pool of underlying collateral –
$90 billion, from more than 7,800 commercial mortgage loans
CNO
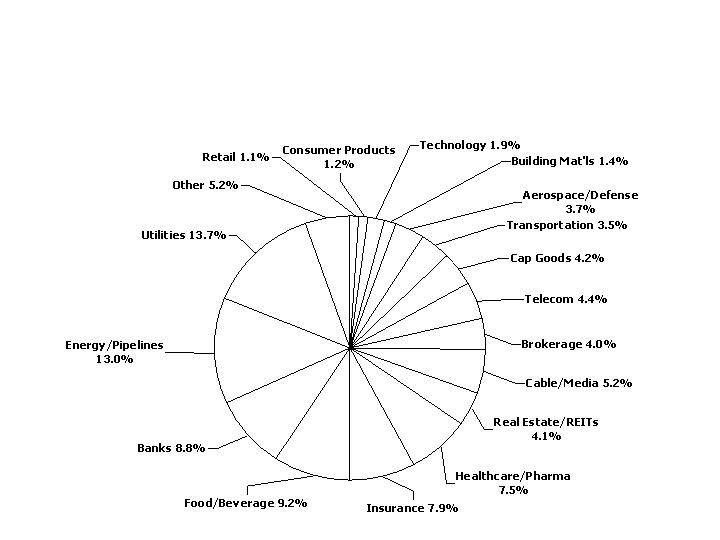
Investment Grade Corporates
at 12/31/08
Our IG Corporate allocation is highly diversified
CNO
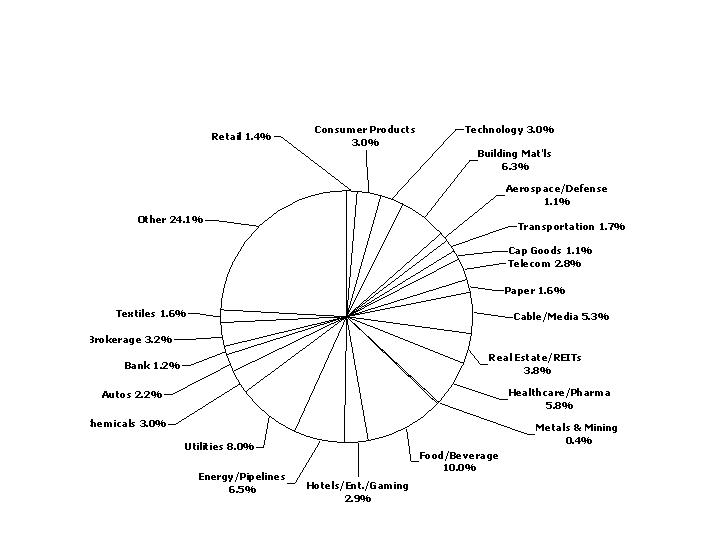
High Yield Corporates
at 12/31/08
Our HY Corporate allocation is diversified and is weighted away from cyclicals
CNO

CNO Summary
Key differences between Conseco and the rest of the industry:
Our sales are continuing to grow and, indeed, are growing strongly
Our products are simple and straightforward, and entail less risk than
products designed for higher-net-worth customers
Our market is sufficiently different from most insurers
Capital management initiatives implemented
Strong franchise in the consumer senior middle market
Less stock market exposure than some of our highly rated competitors
have
We will be:
Continuing to work on sales growth
Continuing to make the business more efficient
Continuing to work on projects to improve our capital position going forward

Questions and Answers

Appendix

Information Related to Certain Non-GAAP Financial Measures
The following provides additional information regarding certain non-GAAP measures used in this presentation. A non-GAAP measure is a
numerical measure of a company’s performance, financial position, or cash flows that excludes or includes amounts that are normally excluded or
included in the most directly comparable measure calculated and presented in accordance with GAAP. While management believes these
measures are useful to enhance understanding and comparability of our financial results, these non-GAAP measures should not be considered as
substitutes for the most directly comparable GAAP measures. Additional information concerning non-GAAP measures is included in our periodic
filings with the Securities and Exchange Commission that are available in the “Investor – SEC Filings” section of Conseco’s website,
www.conseco.com.
Operating earnings measures
Management believes that an analysis of net income applicable to common stock before net realized gains or losses and losses related to the
transfer of Senior Health to an independent trust (“net operating income”, a non-GAAP financial measure) is important to evaluate the performance
of the Company and is a key measure commonly used in the life insurance industry. Management uses this measure to evaluate performance
because realized investment gains or losses can be affected by events that are unrelated to the Company’s underlying fundamentals.
In addition, our results were affected by a significant charge related to a Q4 2007 valuation allowance for deferred tax assets. Management does
not believe that similar charges are likely to recur within two years, and there were no similar charges recognized within the prior two years.
Management believes an analysis of operating earnings before these charges is important to evaluate the performance of the Company prior to
the effect of these unusual and significant charges.

Information Related to Certain Non-GAAP Financial Measures
A reconciliation of net income applicable to common stock to the net operating income, excluding a Q4 2007 and Q2 2008 valuation allowance for
deferred tax assets (and related per share amounts) is as follows (dollars in millions, except per share amounts):
Q4 2007
Q1 2008
Q2 2008
Q3 2008
Q4 2008
Net income (loss) applicable to common stock
(71.5)
$
(5.8)
$
(487.1)
$
(182.0)
$
(406.8)
$
Net realized investment losses, net of related amortization and taxes
23.8
27.8
17.4
84.2
88.0
Discontinued operations
6.9
(0.5)
198.3
157.4
367.5
Net operating income (loss) (a non-GAAP financial measure)
(40.8)
21.5
(271.4)
59.6
48.7
Valuation allowance for deferred tax assets
68.0
-
298.0
-
-
Net operating income before a Q4 2007 valuation allowance for deferred
tax assets (a non-GAAP financial measure)
27.2
$
21.5
$
26.6
$
59.6
$
48.7
$
Per diluted share:
Net income (loss)
(0.38)
$
(0.03)
$
(2.64)
$
(0.98)
$
(2.20)
$
Net realized investment losses, net of related amortization and taxes
0.13
0.15
0.09
0.45
0.47
Discontinued operations
0.03
-
1.08
0.85
1.99
Net operating income (loss) (a non-GAAP financial measure)
(0.22)
0.12
(1.47)
0.32
0.26
Valuation allowance for deferred tax assets
0.37
-
1.61
-
-
Net operating income before a Q4 2007 valuation allowance for
deferred tax assets (a non-GAAP financial measure)
0.15
$
0.12
$
0.14
$
0.32
$
0.26
$

Information Related to Certain Non-GAAP Financial Measures
Book value, excluding accumulated other comprehensive income, per diluted share
This non-GAAP financial measure differs from book value per diluted share because accumulated other comprehensive income has been
excluded from the book value used to determine the measure. Management believes this non-GAAP financial measure is useful because it
removes the volatility that arises from changes in accumulated other comprehensive income. Such volatility is often caused by changes in the
estimated fair value of our investment portfolio resulting from changes in general market interest rates rather than the business decisions made
by management.

Information Related to Certain Non-GAAP Financial Measures
A reconciliation from book value per diluted share to book value per diluted share, excluding accumulated other comprehensive income (loss) is
as follows (dollars in millions, except per share amounts):
Q4 2007
Q1 2008
Q2 2008
Q3 2008
Q4 2008
Total shareholders' equity
4,235.9
$
3,939.7
$
3,382.1
$
2,704.0
$
1,664.2
$
Less accumulated other comprehensive income (loss)
(273.3)
(565.6)
(639.2)
(1,137.7)
(1,770.7)
Total shareholders' equity excluding
accumulated other comprehensive income (loss)
(a non-GAAP financial measure)
4,509.2
$
4,505.3
$
4,021.3
$
3,841.7
$
3,434.9
$
Diluted shares outstanding for the period
184,708,727
184,681,243
184,792,300
184,761,138
184,755,680
Book value per diluted share
22.93
$
21.33
$
18.30
$
14.64
$
9.01
$
Less accumulated other comprehensive income (loss)
(1.48)
(3.07)
(3.46)
(6.15)
(9.58)
Book value, excluding accumulated other
comprehensive income (loss), per diluted share
(a non-GAAP financial measure)
24.41
$
24.40
$
21.76
$
20.79
$
18.59
$

Information Related to Certain Non-GAAP Financial Measures
Operating return measures
Management believes that an analysis of return before net realized gains or losses and losses related to the transfer of Senior Health to an
independent trust (“net operating income”, a non-GAAP financial measure) is important to evaluate the performance of the Company and is a key
measure commonly used in the life insurance industry. Management uses this measure to evaluate performance because realized investment
gains or losses can be affected by events that are unrelated to the Company’s underlying fundamentals.
In addition, our returns were affected by a significant charge related to a Q4 2007 and Q2 2008 valuation allowance for deferred tax assets.
Management does not believe that similar charges are likely to recur within two years, and there were no similar charges recognized within the
prior two years. Management believes an analysis of return before these charges and subsequent refinements is important to evaluate the
performance of the Company prior to the effect of these unusual and significant charges.
This non-GAAP financial measure also differs from return on equity because accumulated other comprehensive income (loss) has been excluded
from the value of equity used to determine this ratio. Management believes this non-GAAP financial measure is useful because it removes the
volatility that arises from changes in accumulated other comprehensive income (loss). Such volatility is often caused by changes in the
estimated fair value of our investment portfolio resulting from changes in general market interest rates rather than the business decisions made
by management.
In addition, our equity includes the value of significant net operating loss carryforwards (included in income tax assets). In accordance with
GAAP, these assets are not discounted, and accordingly will not provide a return to shareholders (until after it is realized as a reduction to taxes
that would otherwise be paid). Management believes that excluding this value from the equity component of this measure enhances the
understanding of the effect these non-discounted assets have on operating returns and the comparability of these measures from period-to-
period. Operating return measures are used in measuring the performance of our business units and are used as a basis for incentive
compensation.
All references to segment operating return measures assume a 25% debt to total capital ratio at the segment level. Additionally, corporate
expenses have been allocated to the segments.

Information Related to Certain Non-GAAP Financial Measures
A reconciliation of return on common equity to operating return less a Q4 2007 and Q2 2008 valuation allowance for deferred tax assets on
common equity (excluding accumulated other comprehensive income (loss) and net operating loss carryforwards) is as follows (dollars in millions,
except per share amounts):
(continued on next page)
Q4 2007
Q1 2008
Q2 2008
Q3 2008
Q4 2008
Net income (loss) applicable to common stock
(71.5)
$
(5.8)
$
(487.1)
$
(182.0)
$
(406.8)
$
Net realized investment (gains) losses, net of related amortization and taxes
23.8
27.8
17.4
84.2
88.0
Discontinued operations
6.9
(0.5)
198.3
157.4
367.5
Net operating income (loss) (a non-GAAP financial measure)
(40.8)
21.5
(271.4)
59.6
48.7
Valuation allowance for deferred tax assets
68.0
-
298.0
-
-
Net operating income before a Q4 2007 valuation allowance for
deferred tax assets (a non-GAAP financial measure)
27.2
$
21.5
$
26.6
$
59.6
$
48.7
$
Common shareholders' equity
4,235.9
$
3,939.7
$
3,382.1
$
2,704.0
$
1,664.2
$
Less accumulated other comprehensive income (loss)
(273.3)
(565.6)
(639.2)
(1,137.7)
(1,770.7)
Common shareholder's equity, excluding accumulated other comprehensive
income (loss) (a non-GAAP financial measure)
4,509.2
4,505.3
4,021.3
3,841.7
3,434.9
Less net operating loss carryforwards
1,426.7
1,435.1
1,137.2
1,121.7
1,048.4
Common shareholders' equity, excluding accumulated other comprehensive income
(loss) and net operating loss carryforwards (a non-GAAP financial measure)
3,082.5
$
3,070.2
$
2,884.1
$
2,720.0
$
2,386.5
$

Information Related to Certain Non-GAAP Financial Measures
(continued from previous page)
Q4 2007
Q1 2008
Q2 2008
Q3 2008
Q4 2008
Average common shareholders' equity
$4,260.7
$4,087.8
$3,660.9
$3,043.1
$2,184.1
Average common shareholders' equity, excluding accumulated other
comprehensive income (loss) and net operating loss carryforwards (a
non-GAAP financial measure)
$3,148.7
$3,076.4
$2,977.2
$2,802.1
$2,553.3
Return on equity ratios:
Return on common equity
-6.7%
-0.6%
-53.2%
-23.9%
-74.5%
Operating return less the valuation allowance for deferred
tax assets on common equity, excluding accumulated
other comprehensive income (loss) and net operating loss carry-
forwards (a non-GAAP financial measure)
3.5%
2.8%
3.6%
8.5%
7.6%

Information Related to Certain Non-GAAP Financial Measures
A reconciliation of pretax operating earnings (a non-GAAP financial measure) to segment operating income (loss) and consolidated net income
(loss) for the nine months ended December 31, 2008, is as follows (dollars in millions):
(Continued on next page)
Corporate and
Discontinued
CIG
Bankers
Colonial Penn
Operations
Total
Pretax operating earnings (a non-GAAP financial measure)
121.3
$
171.5
$
25.2
$
(64.7)
$
253.3
$
Allocation of interest expense, excess capital and corporate
expenses
(37.3)
(27.3)
(2.3)
66.9
-
Income tax (expense) benefit
(32.1)
(55.1)
(8.8)
(0.9)
(96.9)
Segment operating income (loss)
51.9
$
89.1
$
14.1
$
1.3
$
156.4
Net realized investment losses, net of related amortization and taxes
(217.4)
Discontinued operations
(722.7)
Valuation allowance for deferred tax assets
(298.0)
Net income
(1,081.7)
$

Information Related to Certain Non-GAAP Financial Measures
A reconciliation of common shareholders’ equity, excluding accumulated other comprehensive income (loss) and net operating loss
carryforwards (a non-GAAP financial measure) to common shareholders’ equity is as follows (dollars in millions):
(Continued from previous page)
(Continued on next page)
Corporate and
Discontinued
CIG
Bankers
Colonial Penn
Operations
Total
December 31, 2007
Common shareholders' equity, excluding accumulated other
comprehensive income (loss) and net operating loss carryforwards
(a non-GAAP financial measure)
1,192.4
$
1,299.8
$
109.7
$
480.6
$
3,082.5
$
Net operating loss carryforwards
1,426.7
-
-
-
1,426.7
Accumulated other comprehensive income (loss)
(106.7)
(106.7)
(4.1)
(55.8)
(273.3)
Allocation of capital
464.7
433.3
36.5
(934.5)
-
Common shareholders' equity
2,977.1
$
1,626.4
$
142.1
$
(509.7)
$
4,235.9
$
December 31, 2008
Common shareholders' equity, excluding accumulated other
comprehensive income (loss) and net operating loss carryforwards
(a non-GAAP financial measure)
1,582.4
$
1,232.1
$
111.9
$
(539.9)
$
2,386.5
$
Net operating loss carryforwards
1,048.4
-
-
-
1,048.4
Accumulated other comprehensive income (loss)
(824.7)
(817.9)
(41.4)
(86.7)
(1,770.7)
Allocation of capital
526.9
410.7
37.3
(974.9)
-
Common shareholders' equity
2,333.0
$
824.9
$
107.8
$
(1,601.5)
$
1,664.2
$

Information Related to Certain Non-GAAP Financial Measures
(Continued from previous page)
A reconciliation of average common shareholders’ equity, excluding accumulated other comprehensive income (loss) and net operating loss
carryforwards (a non-GAAP financial measure) to average common shareholders’ equity at December 31, 2008, is as follows (dollars in millions):
Corporate and
Discontinued
CIG
Bankers
Colonial Penn
Operations
Total
Average common shareholders' equity, excluding accumulated
other comprehensive income (loss) and net operating loss
carryforwards (a non-GAAP financial measure)
1,416.3
$
1,247.3
$
113.3
$
75.3
$
2,852.2
$
Average net operating loss carryforwards
1,232.9
Average accumulated other comprehensive income (loss)
(841.1)
Average common shareholders' equity
3,244.0
$
Return on equity ratios:
Return on equity
-33.3%
Operating return (less the Q4 2007 and Q2 2008 valuation
allowance for deferred tax assets) on common equity,
excluding accumulated other comprehensive income
(loss) and net operating loss carryforwards (a
non-GAAP financial measure)
3.7%
7.1%
12.4%
NM
5.5%

Information Related to Certain Non-GAAP Financial Measures
Debt to capital ratio, excluding accumulated other comprehensive income (loss)
This non-GAAP financial measure differs from the debt to capital ratio because accumulated other comprehensive income has been excluded
from the value of capital used to determine this measure. Management believes this non-GAAP financial measure is useful because it removes
the volatility that arises from changes in accumulated other comprehensive income. Such volatility is often caused by changes in the estimated
fair value of our investment portfolio resulting from changes in general market interest rates rather than the business decisions made by
management.

Information Related to Certain Non-GAAP Financial Measures
A reconciliation of the debt to capital ratio to debt to capital, excluding accumulated other comprehensive loss is as follows (dollars in millions):
Q4 2007
Q1 2008
Q2 2008
Q3 2008
Q4 2008
Corporate notes payable
1,193.7
$
1,191.7
$
1,189.7
$
1,187.6
$
1,328.7
$
Total shareholders' equity
4,235.9
3,939.7
3,382.1
2,704.0
1,664.2
Total capital
5,429.6
5,131.4
4,571.8
3,891.6
2,992.9
Less accumulated other comprehensive loss
273.3
565.6
639.2
1,137.7
1,770.7
Total capital, excluding accumulated other
comprehensive loss
(a non-GAAP financial measure)
5,702.9
$
5,697.0
$
5,211.0
$
5,029.3
$
4,763.6
$
Corporate notes payable
1,193.7
$
1,191.7
$
1,189.7
$
1,187.6
$
1,328.7
$
Corporate notes payable to capital ratios:
Corporate debt to total capital
22.0%
23.2%
26.0%
30.5%
44.4%
Corporate debt to total capital, excluding
accumulated other comprehensive loss
(a non-GAAP financial measure)
20.9%
20.9%
22.8%
23.6%
27.9%