
UNITED STATES
SECURITIES AND EXCHANGE COMMISSION
Washington, D.C. 20549
SCHEDULE 14A
Proxy Statement Pursuant to Section 14(a) of the Securities Exchange Act of 1934
Filed by the Registrant
Filed by a Party other than the Registrant
Check the appropriate box:
Preliminary proxy statement
Confidential, for use of the Commission only (as permitted by Rule 14a-6(e)(2))
Definitive proxy statement
Definitive additional materials
Soliciting material pursuant to §240.14a-12
Conseco, Inc.
(Name of Registrant as Specified in Its Charter)
______________________________________________________________
(Name of Person(s) Filing Proxy Statement, if Other Than the Registrant)
Payment of filing fee (Check the appropriate box):
No fee required
Fee computed on table below per Exchange Act Rules 14a-(6)(i)(1) and 0-11.
(1) Title of each class of securities to which transaction applies:
______________________________________________________________
(2) Aggregate number of securities to which transaction applies:
______________________________________________________________

UNITED STATES
SECURITIES AND EXCHANGE COMMISSION
Washington, D.C. 20549
SCHEDULE 14A
(3)
Per unit price or other underlying value of transaction computed pursuant to Exchange Act Rule 0-11 (set forth
the amount on which the filing fee is calculated and state how it was determined):
______________________________________________________________
(4) Proposed maximum aggregate value of transaction:
______________________________________________________________
(5) Total fee paid:
______________________________________________________________
Fee paid previously with preliminary materials.
Check box if any part of the fee is offset as provided by Exchange Act Rule 0-11(a)(2) and identify the filing for which the offsetting fee was paid previously.
Identify the previous filing by registration statement number, or the form or schedule and the date of its filing.
(1) Amount previously paid:
______________________________________________________________
(2) Form, schedule or registration statement no.:
______________________________________________________________
(3) Filing party:
______________________________________________________________
(4) Date filed:
______________________________________________________________

The following materials were prepared for use in a presentation given to RiskMetrics Group on April 30,
2009 and may be provided to certain shareholders of Conseco, Inc. after April 30, 2009.
Conseco, Inc.
11825 North Pennsylvania Street
Carmel, IN 46032
April 30, 2009

RiskMetrics Presentation
April 30, 2009

Agenda
Business Overview
Recent Financial Performance
Investment Portfolio Review
Board of Directors
Summary
Q&A


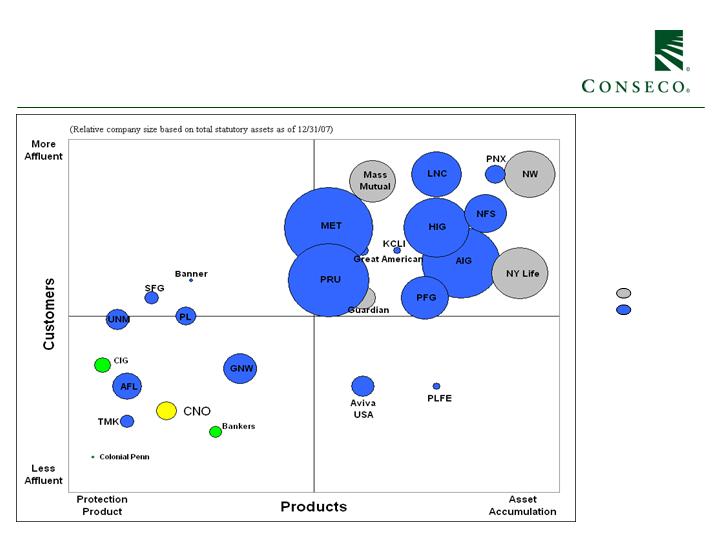
Conseco Highlights
Defined and differentiated by focus on senior middle income market
Target Market
Products
Distribution
Small face amount protection products (4 million policies in force)
Not ratings dependent
Virtually no variable business (no sales since 2002)
Bankers: “kitchen table” sales model through 4,800+ career agents
Colonial Penn: direct sales
CIG: Independent producers; PMA (wholly owned marketing company) now
57% of sales
High agent recruitment and retention
Operating Performance
Capital Management
Investments
Capital preservation through multiple reinsurance transactions
Improving product mix, reducing risk
92% Investment Grade
Highly diversified portfolio
No significant investment in exotic securities
Solid growth in Sales and VNB
Strong core operating performance
Volatility substantially reduced through separation of LTC run-off business

Conseco Has Expertise
Across Important Middle
Market Products
Specified Disease
Equity-Indexed Life and
Annuity products
(longevity solutions)
Long-Term Care
Medicare Supplement
Whole Life products
Final Expense / Term
insurance for protection
Able to Access Consumers
Across Multiple Channels
With an Agent (Retail)
Bankers
CIG
Independents
PMA (CIG-owned)
Without an Agent: (Direct)
Colonial Penn
At Work: (Worksite Marketing)
PMA Worksite Division
CIG - Independents
Strong Trends Are Impacting
Middle Market Consumers
Rising medical costs
Decline of societal safety nets
(government & employer)
Increased longevity
Greater awareness of need for
retirement planning
The Right Products and The Right Channels for
Today’s Middle Market Consumer
Unique Value Proposition that is Closely
Aligned to Important Target Market Trends
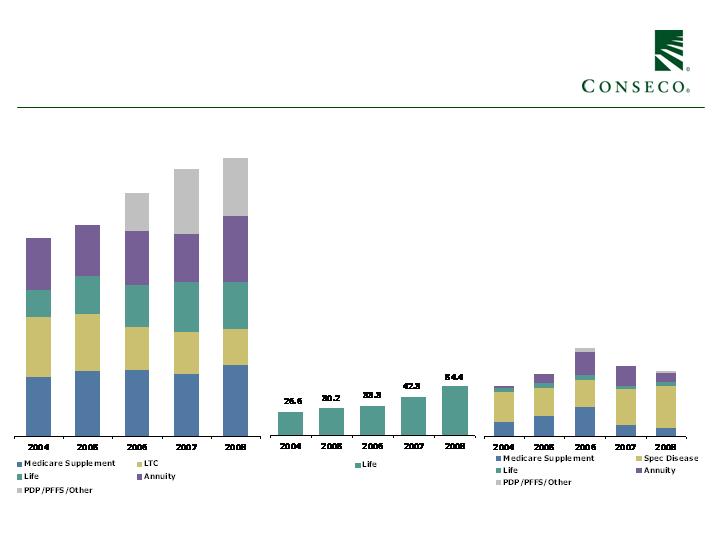
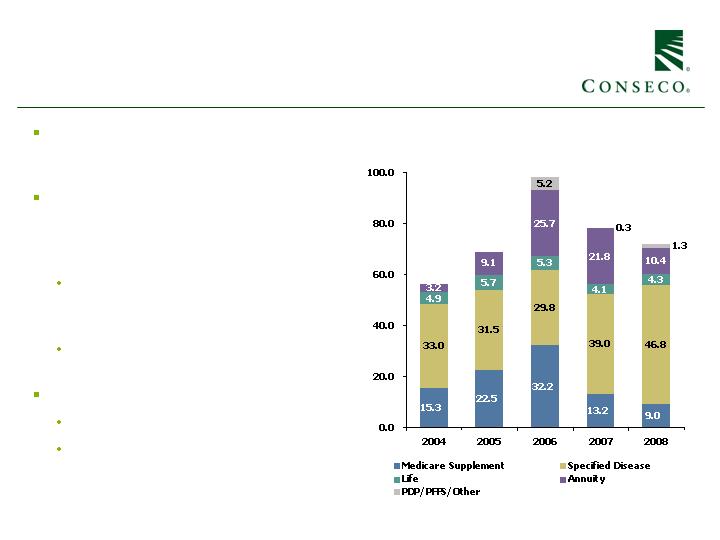
Product Shift aligned with profitability –
New Sales Across Business Units
(NAP $ in millions) (a)
Bankers
Colonial Penn
CIG
218.4
233.6
268.4
294.4
306.5
56.4
68.8
98.2
78.4
71.8
(a) Measured by new annualized premium, which includes 6% of annuity and 10% of single premium whole life deposits and 100% of all other
premiums, PDP sales equal $200 per enrolled policy in 2008, $310 in 2007 and $315 in 2006, PFFS sales equal $2,250 per enrolled policy
($2,100 in 2007)

Fix, Focus, Grow
Key Accomplishments
9/06
Jim Prieur
hired
10/08
Buy back of
Convertible
Securities
12/06
VNB
introduced
4/07
Ed Bonach
hired
6/07
Expanded credit facility to
$870 million at LIBOR +
200
2007/2008
CIG sales &
marketing rightsizing
- $6 million annual
expense reduction
2008
Excess Chicago space
vacated - $5 million
annual expense save
Q4 2007
Recapture of
Colonial Penn
Life Block
Q3 2007
Sale of $3 billion
annuity block
12/06
LTC brought under
one management team
Q3 2007
Completed consolidation of
shared services in Carmel,
Sale of excess space in
Carmel
12/08
Reinsured Bankers
LTC New Business
11/08
Separation of Closed
Block LTC business
12/08
Improved capital
efficiency through use
of reinsurance and
other means
3/09
Renegotiated credit facility
to loosen covenants; cost
increased to LIBOR (2.5%
floor) + 500
Q1/08
Engaged Morgan
Stanley to
evaluate strategic
alternatives

Analyst Commentary
FBR Analyst – Indianapolis Business Journal Article 3/14/09
Conseco has reported better numbers in the past, said Binner, the Friedman Billings analyst. But they were
pumped up due to problems that have been uncovered since the 2006 arrival of CEO Jim Prieur and Chief
Financial Officer Ed Bonach.
“Jim and Ed have created a better-functioning Conseco than ever really existed,” Binner said. “They are
real, and they’re really fixing the company. But the economic backdrop is just so terrible right now.
”
KBW Analyst Report 1/5/09
Nevertheless, we still believe current management has been upfront with all stakeholders in trying to
address and do the heavy lifting to fix Conseco's many problems.
Dowling Analyst Report 11/12/08
CNO had a major win today by receiving approval of the transfer of the Senior Health Insurance Co.
(formally American Travelers) to an independent trust in PA.
CNO management, its bankers and shareholders do not now have the future unknown obligations of this
company. We view this as a major positive for CNO. Precious capital can now be used to deal with
portfolio issues and other emerging issues, not this run-off LTC block of business.
KBW Analyst Report 3/18/08
In our opinion, the turnaround remains on track despite negative reaction in the stock following the reported
net loss and additional charges (though expected).

Bankers Overview
Solid business with expanding low cost
distribution
9% compounded annual sales growth (versus
low single digit growth rate for industry)
Focused on the middle-class senior market
with Medicare supplement, life, annuity,
LTC, Medicare Part D and Medicare
Advantage products
“Kitchen-table” sales model through over
4,800 agents
Strong momentum in recruitment
12% YTD growth in new agents
5% YTD growth in productive agents in
2008 over 2007 (a)
New Annualized Premiums ($ millions)
218.4
233.6
268.4
294.4
306.5
(a) Productive agents defined as agent who averages 4+ policies sold per month or averages $2,000+ in commissions earned per month
during the most recent 12 months
Bankers Agent Force Growth and
Productivity Improvements
Number of Productive Agents (a)
Monthly Average 2004 – 2008
NAP per Agent (productivity)
Yearly Average 2004 – 2008
These improvements are enabling Bankers to grow total NAP to a target of 10% growth
per year while the life insurance industry grows in the low single digits per year
(a) Productive agents defined as agent who averages 4+ policies sold per month or averages $2,000+ in commissions earned per month
during the most recent 12 months
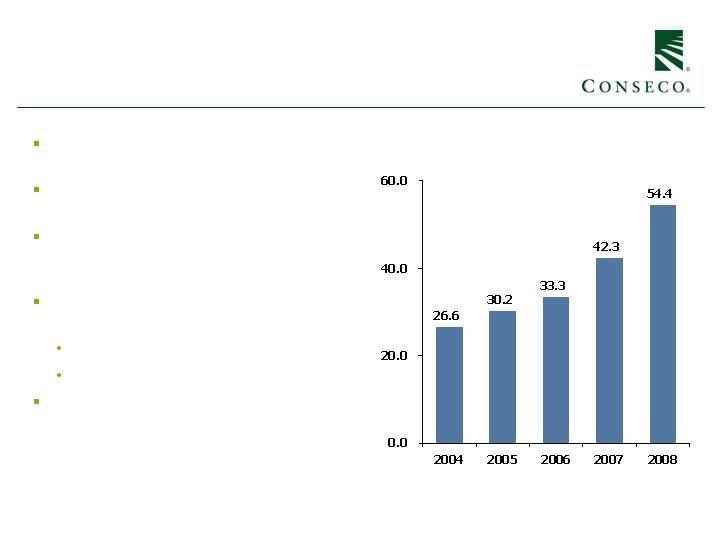
Colonial Penn Overview
Focus on lower middle-income retirees with
simple, low cost life insurance products
Approximately 17% compound annual sales
growth since 2004
Direct response model with media and mail
based lead generation with robust
telemarketing support
Well positioned in unique market niche with
strong growth potential
19% sales growth in 2008
Sustainable growth of 20% per year
Low cost administrative platform
New Annualized Life Premiums ($ millions)
CIG Overview
Focus on middle income working Americans
and retirees with supplemental health and
protection products
Distribution through approximately 2,400
independent producers, including 565 from
Performance Matters Associates (“PMA”), a
wholly-owned marketing company
PMA currently generates 57% of new
business focusing on profitable
supplemental health products
Building new relationships, broadening
supplemental health and life distribution
Key markets
Individual – farm/rural and seniors
Worksite – small business, education,
government, healthcare and credit unions
New Annualized Premiums ($ millions)
56.4
68.8
98.2
78.4
71.8

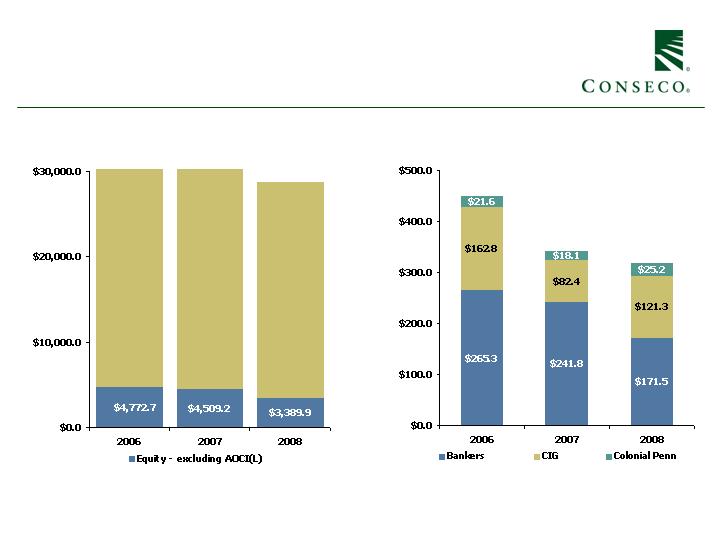
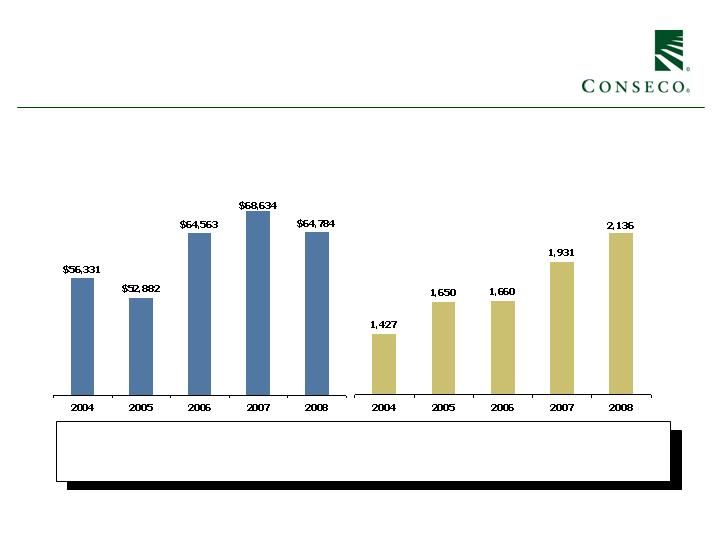
Historical Financial Performance
($ in millions)
Total Assets / Equity ex AOCI(L) (a)
(a) Amounts do not reflect changes for the adoption of any Accounting Pronouncements in 2009 which require retrospective application.
(b) A non-GAAP financial measure which excludes: (i) net realized investment gains (losses), net of related amortization; (ii) a litigation settlement
in 2006 and refinements to such estimates in subsequent periods; (iii) a 2007 charge related to an annuity coinsurance transaction; and (iv)
corporate operations. See the Appendix for a reconciliation to the corresponding GAAP measure.
$449.7
$342.3
$318.0
Pre – Tax Operating Income (b)
$33,593.1
$33,971.2
$28,769.7
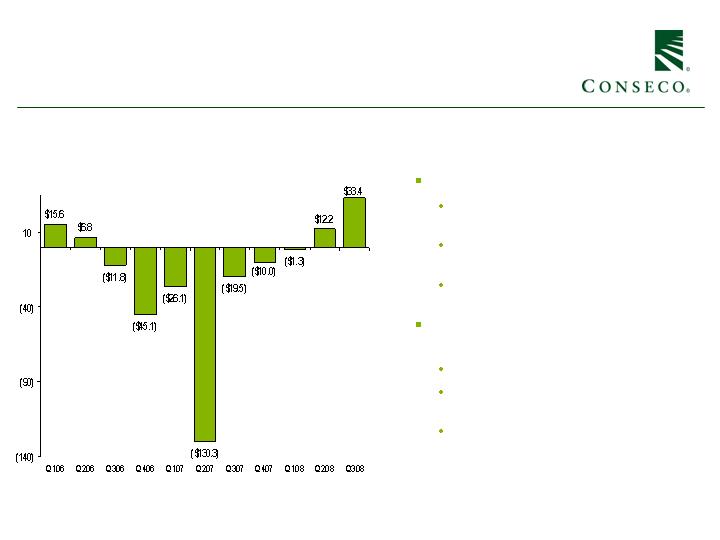
Fixing LTC Run-off:
The Separation of Senior Health
Run-off Segment Pre-Tax Operating Earnings ($MM) (a)
Stabilized LTC business
Strengthened reserves by $200MM in
2007 - 2008
Installed experienced management team
focused exclusively on LTC
Pursued premium rate increases where
justified
Improved customer service to LTC
policy holders
Enhanced claims management
Outsourced most admin operations to
the Long Term Care Group
Concluded multi-state insurance
regulatory examination and started
remediation
Management Actions Taken Prior to Separation
(a) A non-GAAP financial measure which excludes net realized investment gains (losses), net of related amortization. Q3 2008 results include $30.5
million gain on reinsurance recapture.

Senior Health Separation Transaction
Overview
Key Transaction Terms
Senior Health* (which housed 87% of run-off LTC business) was transferred for no consideration to a
not-for-profit business trust set up to own and operate the business for the benefit of its LTC
policyholders
Pre-separation capital contribution of $175MM to Senior Health to raise total adjusted statutory capital to
approximately $300MM
Closed in Q4 2008
Conseco Rationale
A balanced solution, considering the various stakeholders, to definitively separate Senior Health from
Conseco
Separation eliminates potential source of earnings volatility and perceived call on Conseco’s capital
Allows capital to be applied to profitable, high growth businesses
Improves risk profile
Allows Conseco’s management to focus on core businesses
*Senior Health Insurance Company of Pennsylvania, formerly known as Conseco Senior Health Insurance Company prior to its name change in
October 2008.

Senior Health Separation Transaction
and Related Charges
(a) Amount is before the potential tax benefit. A deferred tax valuation allowance was established for all future
potential tax benefits generated by these charges since management has concluded that it is more likely than
not that such tax benefits will not be utilized to offset future taxable income.
($ in millions)
During 2008, Conseco recorded accounting charges totaling $1.0 billion related to the transaction,
comprised of Senior Health's equity (as calculated in accordance with generally accepted accounting
principles), an additional valuation allowance for deferred tax assets, the capital contribution to Senior
Health and the Independent Trust and transaction expenses.
The accounting charges are summarized as follows:
$1,022.8
Total charges
204.4
Additional capital contribution and transaction expenses
159.2
Write-off of remaining shareholder's equity of Senior Health
298.0
Increase to deferred tax valuation allowance based on recent results which have
had a significant impact on taxable income and the effects of the transaction
(19.3)
Gain on reinsurance recapture, net of tax
$380.5
Recognition of unrealized losses on investments transferred to the Independent
Trust
(a)
(a)
(a)

Impact of Credit Facility Amendment
on Key Debt Covenants
*Excludes Accumulated Other Comprehensive Income (Loss)
** Changes in covenant levels from Q3 2008 primarily driven by the transfer of Senior Health to an independent trust
***Reflects impact of modifications to the covenants which are applicable from March 31, 2009 through June 30, 2010
NOTE: Amounts do not reflect changes for the adoption of any Accounting Pronouncements in 2009 which require retrospective application.
($ millions)
Q3 2008
Q4 2007
30.0%
21.0%
2.00X
3.34X
$1,270
$1,497
250%
296%
125%
30.0%
23.6%
2.00X
2.64X
$1,270
$1,433
250%
257%
125%
Debt/Capital Ratio*
Covenant Maximum
Actual
Interest Coverage
Covenant Minimum
Actual
Statutory Capital
Covenant Minimum
Actual
RBC Ratio
Covenant Minimum
Actual
Company Action Level Trigger
Q4 2008**
30.0%
28.3%
2.00X
2.35X
$1,270
$1,366
250%
255%
125%
Modified
Covenant Levels***
32.5%
1.50X
$1,100
200%

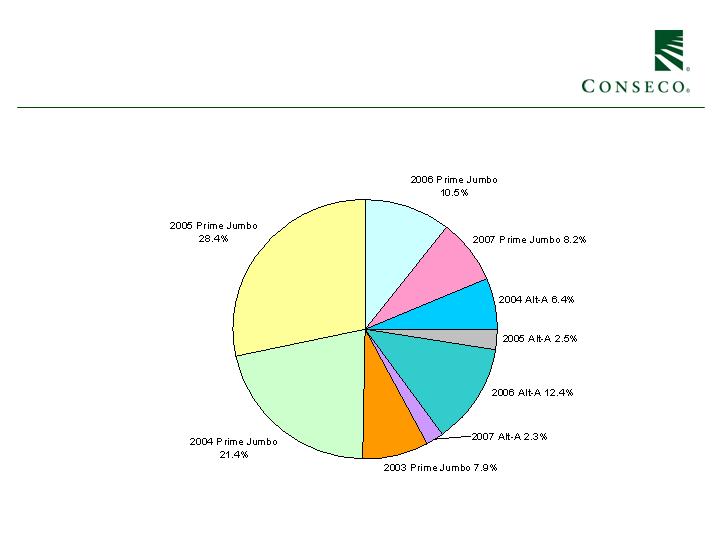
Subprime allocation substantially
reduced
HEL allocation reflects market
stresses
Overall mark-to-market and
credit migration consistent with
credit cycle
Pressure on financials and
cyclicals
Overall highly rated
Pressure on ALT-A delinquency
trends
Some Alt-A downgrades
Low, but rising delinquency
trends
Seasoned portfolio
BBB market pricing pressure
severe
Nominal downgrades to date,
but rating activity likely
Slowing economy and lack of financing availability
likely to lead to higher delinquencies
Active surveillance and portfolio management
Nominal new investment activity
Liquidated $45 million in problematic exposures in
Q4 2008
Managing through the credit cycle by emphasizing long-term
assessments of value and quality
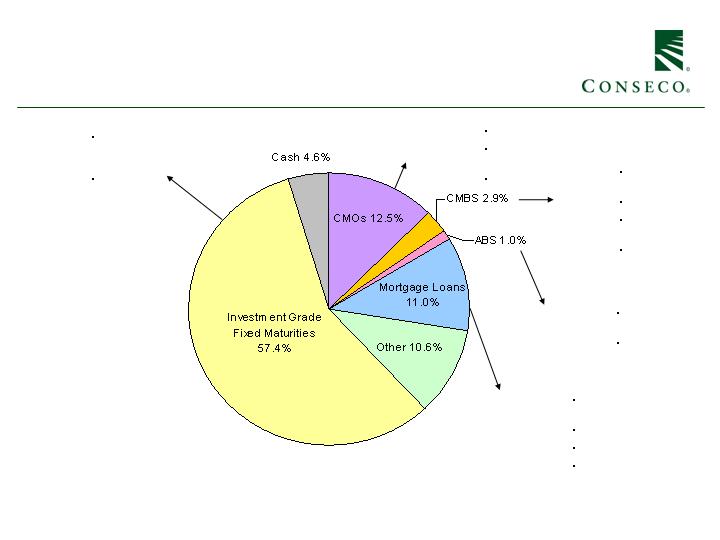
Asset Allocation
at 12/31/08

Rating Agency Commentary on
Investment Portfolio
AM BEST- Report Revision Date - 03/04/2009
The overall credit quality of the portfolio is solid.
The corporate bond portfolio is also well diversified by industry sector.
A.M. Best notes that CNO's credit risk on BIG securities is partially mitigated by its lower
exposure to structured securities relative to the industry.
Structured securities are reasonably well diversified, consisting mainly of CMOs, asset-backed
and commercial mortgage-backed securities. These securities are typically invested in
sequential and planned amortization classes with modest amounts invested in riskier tranches.
In general, A.M. Best notes that the group's investment risk credit risk profile has improved
due to a reduction in high yield bonds, structured securities, affiliated investments and limited
partnerships.
MOODY’S – 3/03/2009 Rating Update
Over the past several years, the company has reduced the amount of alternative investments
and affiliated investments.
Overall, we believe the company's investment portfolio is representative of an A-rated
company.

$13,532
340
440
11
134
76
2,920
838
292
2,159
1,809
$22,551
($ millions)
Corporates
US Treasuries
States and Political
Unrealized Losses
at 12/31/08
Foreign Governments
CDOs
Mortgage Pass-throughs
CMOs
CMBS
ABS
Mortgage Loans
Equity, Cash & Other
Total
Book Value
Market Value
Net Unrealized
Gain/(Loss)
2008
Impairments
$11,436
371
386
9
97
77
2,443
572
204
2,122
1,793
$19,510
$(2,096)
31
(54)
(2)
(37)
1
(477)
(266)
(88)
(37)
(16)
$(3,041)
$98
-
-
-
-
-
35
-
19
6
4
$162


Board Structure and Governance
Nine members being elected
Eight members are independent, including Chairman
Two independent directors added in 2007 following extensive search
Hired new CEO (September 2006) and CFO (April 2007)
Active Board
14 Board Meetings in 2008
More than 30 Board Committee Meetings in 2008 including 18 Audit
Committee meetings
Active role in establishing strategy – engaged Morgan Stanley to review strategic
alternatives beginning in January 2008
Adopted majority voting for directors and declassified Board in 2008

Board of Directors Biographies
R. Glenn Hilliard, 66, has served as chairman of our board of directors since September 2003. During the period from
August 2004 until September 2005, he served as executive chairman and at all other times since September 2003 he has
served as non-executive Chairman. Mr. Hilliard has been chairman and chief executive officer of Hilliard Group, LLC, an
investment and consulting firm, since 2003. From 1999 until his retirement in 2003, Mr. Hilliard served as chairman, chief
executive officer and a member of the executive committee for ING Americas. From 1994 to 1999 he was chairman and
CEO of ING North America. Mr. Hilliard is a Trustee of Columbia Funds Series Trust, Columbia Funds Master Investment
Trust, Columbia Funds Variable Insurance Trust I (formerly Nations Separate Account Trust) and Banc of America Funds
T
rust.
Donna A. James, 51, has been a director of Conseco since May 2007. Since 2006 Ms. James has been President and
managing director of Lardon & Associates, a business and executive advisory services firm. Before retiring in 2006, Ms.
James worked in various capacities with Nationwide Mutual Insurance Company and its public company subsidiary,
Nationwide Financial Services, Inc., beginning in 1981, including President, Nationwide Strategic Investments (2003-2006),
Executive Vice President and Chief Administrative Officer (2000-2003) and Senior Vice President and Chief Human
Resources Officer (1998-2000). She is also a director of Coca-Cola Enterprises, Inc., Limited Brands, Inc. and Time Warner
Cable Inc.
Debra J. Perry, 58, has served as a director of Conseco since June 2004. Since 2008 Ms. Perry has been the managing
member of Perry Consulting LLC. From 1992-2004, she was a senior executive at Moody’s Investors Service and Moody’s
Corporation. During her career there, she served as Chief Administrative Officer and Chief Credit Officer, and had
responsibility for several ratings groups, including Americas Corporate Finance, Leverage Finance, Public Finance, and
Finance, Securities and Insurance. Until recently, Ms. Perry served on the board of MBIA Inc., the largest financial guaranty
insurance company. At the request of the MBIA board, she became a consultant to its Credit Risk Committee to refine and
implement the company’s risk strategy as part of a five-year transformation plan. Ms. Perry is also a director of Korn/Ferry
International.

Board of Directors Biographies
C. James Prieur, 57, has been chief executive officer and a director since September 2006. Before joining Conseco,
Mr. Prieur had been with Sun Life Financial since 1979. He began his career in private placements, then equity and
fixed income portfolio management, rising to vice president of investments for Canada in 1988, and then vice
president of investments for the U.S. in 1992. In 1997 he was named senior vice president and general manager for
all U.S. operations, and became corporate president and chief operating officer in 1999.
Philip R. Roberts, 67, joined our board of directors in September 2003. Mr. Roberts is retired. From 2000 until
2007, Mr. Roberts was principal of Roberts Ventures L.L.C., consultant for merger and acquisition and product
development for investment management firms. From 1996 until 2000, Mr. Roberts served as chief investment
officer of trust business for Mellon Financial Corporation and headed its institutional asset management businesses
from 1990 to 1996.
Neal C. Schneider, 64, joined our board of directors in September 2003. Between 2002 and 2003, Mr. Schneider
was a partner of Smart and Associates, LLP, a business advisory and accounting firm. Between 2000 and 2002, he
was an independent consultant. Until his retirement in 2000, Mr. Schneider spent 34 years with Arthur Andersen &
Co., including service as partner in charge of the Worldwide Insurance Industry Practice and the North American
Financial Service Practice. Mr. Schneider has been chairman of the board of PMA Capital Corporation since 2003.

Board of Directors Biographies
Michael T. Tokarz, 59, joined our board of directors in September 2003. Mr. Tokarz is the chairman of MVC
Capital, Inc. (a registered investment company). In addition, he has been a managing member of the Tokarz Group,
LLC (venture capital investments) since 2002. He was a general partner with Kohlberg Kravis Roberts & Co. from
1985 until he retired in 2002. Mr. Tokarz is chairman of Walter Industries, Inc. and is also a director of Idex Corp.
and Dakota Growers Pasta Companies, Inc
John G. Turner, 69, joined our board of directors in September 2003. Mr. Turner has been chairman of Hillcrest
Capital Partners, a private equity investment firm since 2002. Mr. Turner served as chairman and CEO of ReliaStar
Financial Corp. from 1991 until it was acquired by ING in 2000. After the acquisition he became vice chairman and
a member of the executive committee for ING Americas until his retirement in 2002. Mr. Turner is a director of
Hormel Foods Corporation.
Doreen A. Wright, 52, joined our board of directors in May 2007. Ms. Wright was Senior Vice President and Chief
Information Officer of Campbell Soup Company from 2001 until her retirement in 2008. Prior to joining Campbell
Soup Company, she was Executive Vice President and Chief Information Officer at Nabisco, Inc. from 1999-2001.
From 1995 through 1998, Ms. Wright was Senior Vice President, Operations and Systems for Prudential Insurance
Company’s Prudential Investment Group. From 1984 until 1994, she held various leadership positions at Bankers
Trust Company as a Managing Director and Senior Vice President of numerous large-scale institutional customer
service and technology groups. Ms. Wright serves on the boards of directors of The Oriental Trading Company and
The Riverside Symphonia, and she previously served on the board of directors of The Yankee Candle Company.

Qualifications of Mr. Roberts
Mr. Roberts has worked in the insurance and securities industry since 1964
Joined Conseco's board of directors in September of 2003.
From 2000 to 2007, Mr. Roberts served as principal of Roberts Ventures L.L.C., consultant for
merger & acquisition and product development for investment management firms.
From 1996 until 2000, Mr. Roberts served as chief investment officer of trust business for Mellon
Financial Corporation and headed Mellon's institutional asset management businesses from 1990
to 1996, in addition to chairing the Trust Committee. (Institutional Assets at Mellon were about
$130 billion and Personal Assets were about $60 billion during his tenure). Company grew
organically about 7% after adjusting for market movements. Also started a company to run
dynamic currency hedging and built AUM to $30 billion in five year
s.
Prior to joining Mellon, Mr. Roberts enjoyed a 26-year career with Aetna Life & Casualty
Company. During his tenure he served in a variety of management positions, culminating in
service as senior vice president and chief investment officer. (Aetna's assets were approximately
$45 billion including P&C assets as well as the life assets).
Mr. Roberts graduated from Harvard University with a bachelor of arts degree in economics. He
also holds an MBA from the University of Connecticut.


Progress on Conseco’s Turnaround
Emerged from bankruptcy in September 2003 with new Board of Directors
Jim Prieur hired in September 2006 – “Fix Focus and Grow” Strategy
Sold $3 billion annuity block
Recaptured life block ($50 million of traditional life insurance premium in force
that had been ceded)
Reduced expenses, consolidated and right-sized operations (annual savings in
excess of $25 million)
Retained investment banker to advise on strategic alternatives to build shareholder
value
Separated LTC Closed-Block to reduce earnings volatility and free up capital
(Strengthened reserves by $200MM in 2007 – 2008)
Improved Capital Efficiency
Renegotiated Credit Facility to increase flexibility
All business segments returned to profitability
Board has been actively engaged throughout


Appendix

Amended and Restated Long-Term
Incentive Plan
Amendment and restatement of the Plan incorporates the provisions of the Plan as
currently in effect and includes the following key modifications:
Limits on Full-Value Awards.
Eliminating Liberal Share Counting Provisions.
Shareholders’ Re-Approval of Performance Goals.
Clarifying and Conforming Amendments.
Increase in the number of shares authorized to be issued under the Plan by
15,846,268 shares, for a total number of authorized shares under the Plan of
25,846,268. First increase in Plan shares since Plan was adopted in 2003.
2009 annual award is based upon a higher price than current market share price
(was developed on a 12 month trailing basis)
Additional shares needed to attract and retain management
Plan conforms to RiskMetrics Group guidelines

Information Related to Certain Non-
GAAP Financial Measures
The following provides additional information regarding certain non-GAAP measures used in this presentation. A non-GAAP
measure is a numerical measure of a company’s performance, financial position, or cash flows that excludes or includes amounts
that are normally excluded or included in the most directly comparable measure calculated and presented in accordance with
GAAP. While management believes these measures are useful to enhance understanding and comparability of our financial
results, these non-GAAP measures should not be considered as substitutes for the most directly comparable GAAP measures.
Additional information concerning non-GAAP measures is included in our periodic filings with the Securities and Exchange
Commission that are available in the “Investor – SEC Filings” section of Conseco’s website, www.conseco.com.
Operating earnings measures
Management believes that an analysis of net income applicable to common stock before net realized gains or losses, losses
related to the transfer of Senior Health to an independent trust and income taxes (a non-GAAP financial measure) is important to
evaluate the performance of the Company and is a key measure commonly used in the life insurance industry. Management uses
this measure to evaluate performance because realized investment gains or losses, losses related to the transfer of Senior Health
to an independent trust and increases to our valuation allowance for deferred tax assets are unrelated to the Company’s
continuing operations.
In addition, our results were affected by unusual and significant charges related to: (i) a litigation settlement in Q2 2006 and
refinements to such estimates recognized in subsequent periods; and (ii) a Q3 2007 charge related to an annuity coinsurance
transaction. Management believes an analysis of operating earnings before these charges is important to evaluate the
performance of the Company prior to the effect of these unusual and significant charges.

Information Related to Certain Non-
GAAP Financial Measures
A reconciliation of EBIT to net income (loss) applicable to common stock is as follows (dollars in millions):
NOTE: Amounts do not reflect changes for the adoption of any Accounting Pronouncements in 2009 which require retrospective application.
2006
2007
2008
EBIT, excluding costs related to a litigation settlement and loss
related to a coninsurance transaction:
Bankers Life
265.3
$
241.8
$
171.5
$
Colonial Penn
21.6
18.1
25.2
Conseco Insurance Group
162.8
82.4
121.3
Corporate Operations, excluding corporate interest expense
(18.2)
(16.8)
(26.7)
EBIT, excluding costs related to a litigation settlement and a loss
related to an annuity coinsurance transaction
431.5
325.5
291.3
Costs related to a litigation settlement
(174.7)
(64.4)
-
Loss related to an annuity coinsurance transaction
-
(76.5)
-
Total EBIT
256.8
184.6
291.3
Corporate interest expense
(52.9)
(72.3)
(59.2)
Gain (loss) on extinguishment of debt
(0.7)
-
21.2
Income (loss) before net realized investment losses, taxes
203.2
112.3
253.3
and discontinuted operations
Tax expense (benefit) on period income
73.7
38.8
96.9
Income (loss) before net realized investment losses, valuation
allowance for deferred tax assets and discontinued operations
129.5
73.5
156.4
Preferred stock dividends
(38.0)
(14.1)
-
Net income (loss) before net realized investment gains (losses),
valuation allowance for deferred tax assets and discontinued
operations
91.5
59.4
156.4
Net realized investment losses (excluding the increase in unrealized
losses on those investmentes transferred to an independent trust
and net of related amortization and taxes and the establishment of
a valuation allowance for deferred tax assets related to such losses)
(23.8)
(79.5)
(217.4)
Net income (loss) applicable to common stock before valuation
allowance for deferred tax assets and discontinued operations
67.7
(20.1)
(61.0)
Valuation allowance for deferred tax assets (excluding the establishment
of a valuation allowance for realized investment losses and
discontinued operations)
-
(68.0)
(343.0)
Discontinued Operations
0.3
(105.9)
(722.7)
Net income (loss) applicable to common stock
68.0
$
(194.0)
$
(1,126.7)
$