
First Quarter 2009
Financial and Operating Results
For the period ended March 31, 2009
Conseco, Inc.
May 11, 2009

Forward-Looking Statements
Cautionary Statement Regarding Forward-Looking Statements. Our statements, trend analyses and other information contained in these materials
relative to markets for Conseco’s products and trends in Conseco’s operations or financial results, as well as other statements, contain forward-looking
statements within the meaning of the federal securities laws and the Private Securities Litigation Reform Act of 1995. Forward-looking statements typically
are identified by the use of terms such as “anticipate,” “believe,” “plan,” “estimate,” “expect,” “project,” “intend,” “may,” “will,” “would,” “contemplate,”
“possible,” “attempt,” “seek,” “should,” “could,” “goal,” “target,” “on track,” “comfortable with,” “optimistic” and similar words, although some forward-looking
statements are expressed differently. You should consider statements that contain these words carefully because they describe our expectations, plans,
strategies and goals and our beliefs concerning future business conditions, our results of operations, financial position, and our business outlook or they
state other ‘‘forward-looking’’ information based on currently available information. Assumptions and other important factors that could cause our actual
results to differ materially from those anticipated in our forward-looking statements include, among other things: (i) general economic, market and political
conditions, including the performance and fluctuations of the financial markets which may affect our ability to raise capital or refinance existing indebtedness
and the cost of doing so; (ii) our ability to continue to satisfy the financial ratio and balance requirements and other covenants of our debt agreements; (iii)
our ability to generate sufficient liquidity to meet our debt service obligations and other cash needs; (iv) our ability to obtain adequate and timely rate
increases on our supplemental health products including our long-term care business; (v) the receipt of required regulatory approvals for dividend and
surplus debenture interest payments from our insurance subsidiaries; (vi) mortality, morbidity, the increased cost and usage of health care services,
persistency, the adequacy of our previous reserve estimates and other factors which may affect the profitability of our insurance products; (vii) changes in
our assumptions related to the cost of policies produced or the value of policies in force at the effective date of our emergence from bankruptcy; (viii) the
recoverability of our deferred tax asset and the effect of potential tax rate changes on its value; (ix) changes in accounting principles and the interpretation
thereof; (x) our ability to achieve anticipated expense reductions and levels of operational efficiencies including improvements in claims adjudication and
continued automation and rationalization of operating systems; (xi) performance and valuation of our investments, including the impact of realized losses
(including other-than-temporary impairment charges); (xii) our ability to identify products and markets in which we can compete effectively against
competitors with greater market share, higher ratings, greater financial resources and stronger brand recognition; (xiii) the ultimate outcome of lawsuits filed
against us and other legal and regulatory proceedings to which we are subject; (xiv) our ability to complete the remediation of the material weakness in
internal controls over our actuarial reporting process and to maintain effective controls over financial reporting; (xv) our ability to continue to recruit and
retain productive agents and distribution partners and customer response to new products, distribution channels and marketing initiatives; (xvi) our ability to
achieve eventual upgrades of the financial strength ratings of Conseco and our insurance company subsidiaries as well as the potential impact of rating
downgrades on our business; (xvii) the risk factors or uncertainties listed from time to time in our filings with the Securities and Exchange Commission;
(xviii) regulatory changes or actions, including those relating to regulation of the financial affairs of our insurance companies, such as the payment of
dividends and surplus debenture interest to us, regulation of financial services affecting (among other things) bank sales and underwriting of insurance
products, regulation of the sale, underwriting and pricing of products, and health care regulation affecting health insurance products; and (xix) changes in
the Federal income tax laws and regulations which may affect or eliminate the relative tax advantages of some of our products. Other factors and
assumptions not identified above are also relevant to the forward-looking statements, and if they prove incorrect, could also cause actual results to differ
materially from those projected. All written or oral forward-looking statements attributable to us are expressly qualified in their entirety by the foregoing
cautionary statement. Our forward-looking statements speak only as of the date made. We assume no obligation to update or to publicly announce the
results of any revisions to any of the forward-looking statements to reflect actual results, future events or developments, changes in assumptions or
changes in other factors affecting the forward-looking statements.

Non-GAAP Measures
This presentation contains the following financial measures that differ from the comparable measures
under Generally Accepted Accounting Principles (GAAP): operating earnings measures; book value,
excluding accumulated other comprehensive income (loss) per diluted share; operating return
measures; earnings before net realized investment gains (losses) and corporate interest and taxes;
debt to capital ratios, excluding accumulated other comprehensive income (loss); and interest-adjusted
benefit ratios. Reconciliations between those non-GAAP measures and the comparable GAAP
measures are included in the Appendix, or on the page such measure is presented.
While management believes these measures are useful to enhance understanding and comparability
of our financial results, these non-GAAP measures should not be considered substitutes for the most
directly comparable GAAP measures.
Additional information concerning non-GAAP measures is included in our periodic filings with the
Securities and Exchange Commission that are available in the “Investor – SEC Filings” section of
Conseco’s website, www.conseco.com.

Q1 2009 Summary
CNO
Continued profitability in all three insurance segments, with
total Q1 2009 EBIT of $72.3 million
Core sales* of $87.5 million, up 4% over Q1 2008
Trailing four-quarter premium up 12% over a year ago
Strong growth in agent recruiting
Bankers
22% YTD growth in new agents, a record-setting quarter
CIG
PMA – record recruiting quarter: agent count up to 477; increase
in average agent production
CIG Sales – signed 52 IMOs in Q1 2009; new producing worksite
agents increased by 61%, to 358
*Excludes PFFS.

Q1 2009 Summary
CNO
Net realized investment losses of $6.9 million
Total other-than-temporary impairment losses of $108.1 million
$92.0 million recorded in earnings
$16.1 million recorded in accumulated other comprehensive loss
Accumulated other comprehensive loss increased by $69.8
million in Q1 2009
Book value per share (excluding accumulated other
comprehensive loss)* rose to $18.57 at 3/31/09 from $18.41 at
12/31/08
*See Appendix for corresponding GAAP measure.
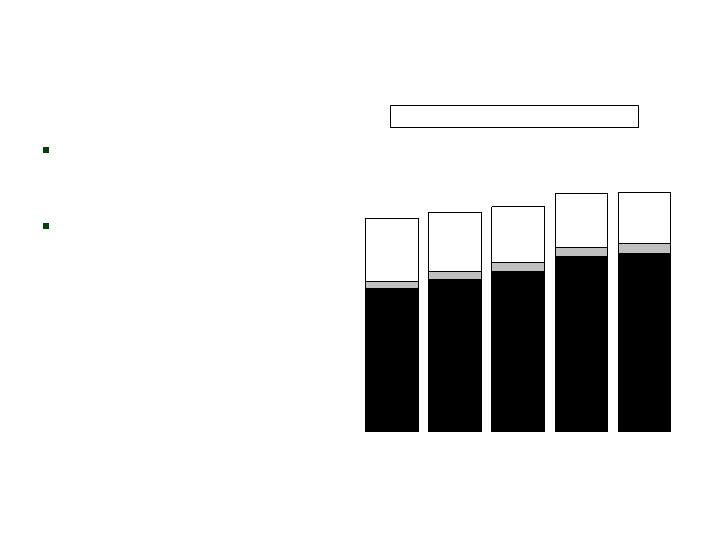
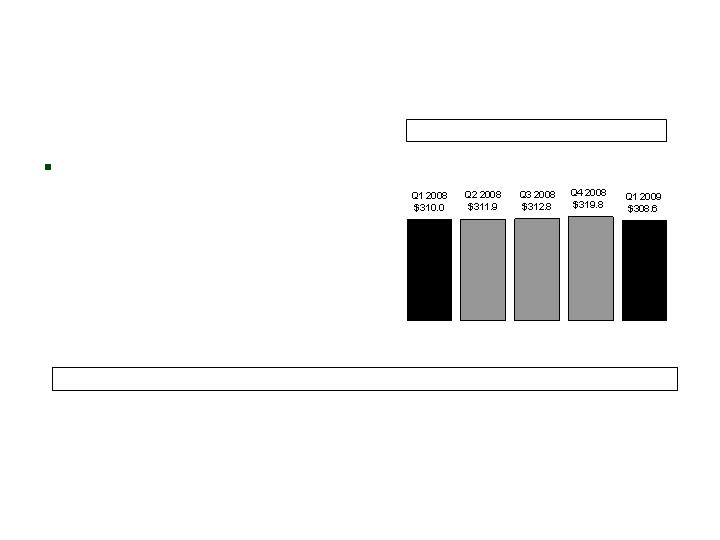
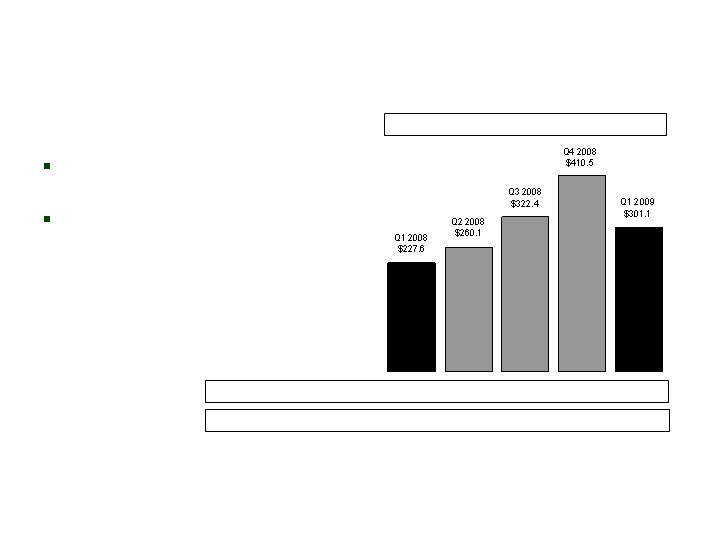
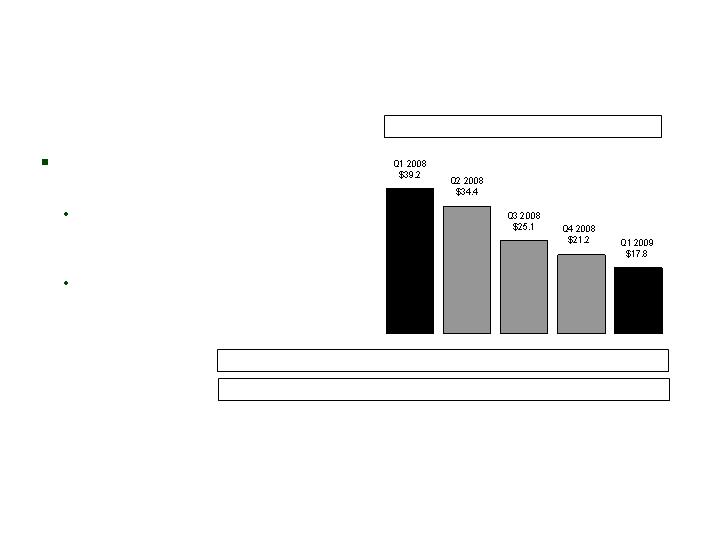
Collected Premiums
CNO
Strong, consistent
growth in Bankers
and Colonial Penn
Slight decline in CIG
due to focus on
more profitable
business
BLC
Q1 2008
$4,056.4
($ millions)
CP
CIG
Collected Premiums-Trailing 4 Quarters
Q2 2008
$4,167.3
Q3 2008
$4,275.1
Q4 2008
$4,524.9
Q1 2009
$4,549.3

Bankers Life
Colonial Penn
Conseco Insurance Group
Corporate operations, interest expense
and expenses related to debt modification
Income before net realized investment losses*
Net realized investment losses
Total
Q1 2009
Summary of Results
CNO
$44.7
5.1
31.2
(31.9)
49.1
(6.9)
$42.2
Pre-Tax
After Tax
EPS
($ millions, except per-share amounts)
$31.4
(6.9)
$24.5
$0.17
(0.04)
$0.13
*Management believes that an analysis of earnings before net realized investment gains (losses) and increases to
our valuation allowance for deferred tax assets (a non-GAAP financial measure) provides an alternative measure
of the operating results of the company because such items are unrelated to the company’s continuing operations.
The table above provides a reconciliation to the corresponding GAAP measure.
**See Appendix for a reconciliation to the corresponding GAAP measure.
**

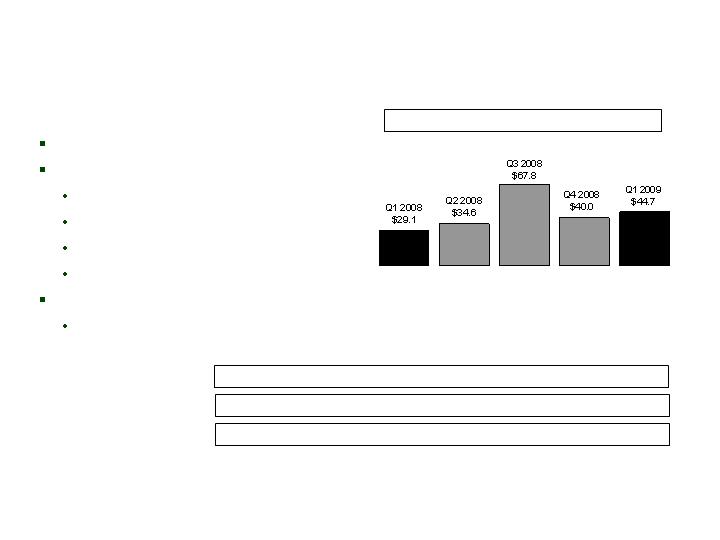
Q1 Earnings
CNO Consolidated
*Management believes that an analysis of earnings before net realized investment gains (losses), losses related to
the transfer of Senior Health to an independent trust (included in Discontinued Operations) and corporate interest
and taxes (“EBIT,” a non-GAAP financial measure) provides an alternative measure to compare the operating
results of the company quarter-over-quarter because it excludes: (1) corporate interest expense; and (2) items that
are unrelated to the company’s continuing operations. The table above provides a reconciliation of EBIT to net
income (loss).
($ millions)
Q1 2008
Q2 2008
Q3 2008
Q4 2008
Q1 2009
Bankers Life
$29.1
$34.6
$67.8
$40.0
$44.7
Colonial Penn
3.7
8.3
6.5
6.7
5.1
Conseco Insurance Group
23.3
32.3
34.2
31.5
31.2
Corporate operations, excluding interest expense
(6.7)
(16.2)
(3.7)
(0.1)
(8.7)
Total EBIT*
49.4
59.0
104.8
78.1
72.3
Corporate interest expense
(18.5)
(16.1)
(15.8)
(17.5)
(13.7)
Gain on extinguishment of debt
0.0
0.0
0.0
21.2
0.0
Expenses related to debt modification
0.0
0.0
0.0
0.0
(9.5)
Income before net realized investment losses, taxes and
discontinued operations
30.9
42.9
89.0
81.8
49.1
Tax expense on period income
10.8
17.7
30.7
34.6
17.7
Net operating income
20.1
25.2
58.3
47.2
31.4
Net realized investment losses
(27.8)
(17.4)
(84.2)
(88.0)
(6.9)
Net income (loss) before valuation allowance for deferred
tax assets and discontinued operations
(7.7)
7.8
(25.9)
(40.8)
24.5
Valuation allowance for deferred tax assets
0.0
(298.0)
0.0
(45.0)
0.0
Discontinued operations
0.5
(198.3)
(157.4)
(367.5)
0.0
Net income (loss)
($7.2)
($488.5)
($183.3)
($453.3)
$24.5
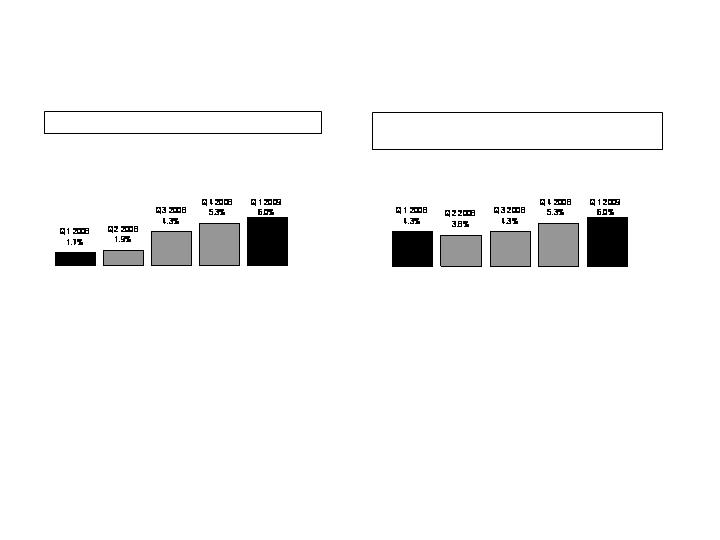
Operating ROE
CNO
Operating ROE*, Trailing 4 Quarters
Operating ROE (Before Annuity Coinsurance
Transaction)**, Trailing 4 Quarters
*Operating return excludes net realized
investment gains (losses), valuation allowance
related to deferred tax assets and discontinued
operations. Equity excludes accumulated other
comprehensive income (loss) and the value of
net operating loss carryforwards, and assumes
conversion of preferred stock. See Appendix for
corresponding GAAP measure.
**Operating return, as calculated and defined on
the left side of this page, but before a Q3 2007
charge related to an annuity coinsurance
transaction. See Appendix for corresponding
GAAP measure.
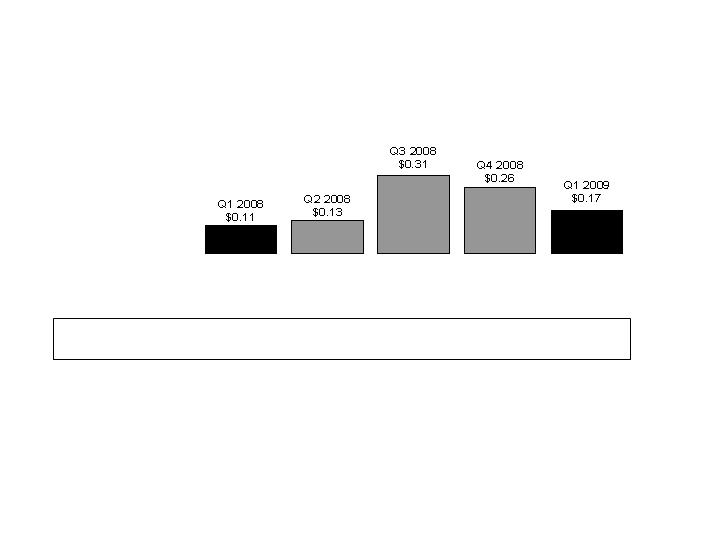
Operating EPS*
CNO
*Operating earnings per share exclude net realized investment gains (losses), valuation allowance related to
deferred tax assets and discontinued operations. See Appendix for corresponding GAAP measure.
**Represents the expected ratio of quarterly Operating EPS to annual Operating EPS, based on
historical experience.
Seasonality of Q1 Q2 Q3 Q4 Q1
Operating EPS** 17-22% 20-25% 23-28% 26-31% 17-22%

Key Debt Covenants
CNO
*Excludes Accumulated Other Comprehensive Income (Loss).
**Preliminary.
($ millions)
Bank Covenant Debt/Capital Ratio*
Covenant Maximum
Actual
Interest Coverage
Covenant Minimum
Actual
Statutory Capital
Covenant Minimum
Actual
RBC Ratio
Covenant Minimum
Actual
Q1 2009
32.5%
27.9%
1.50X
3.07X
$1,100
$1,301
200%
230%
Covenant Margins as of 3/31/09
Reduction to statutory capital and
surplus of approximately $169
million, or an increase to the risk-
based capital of approximately
$85 million.
Reduction to combined statutory
capital and surplus of
approximately $201 million.
Reduction in cash flows to the
holding company of
approximately $80 million.
Reduction to shareholders’ equity of
approximately $672 million or
additional debt of $324 million.
Q4 2008
30.0%
28.3%
2.00X
2.35X
$1,270
$1,366
250%
255%
**
**

Liquidity Projection
For Remainder of 2009
CNO
($ millions)
Cash Balance 3/31/09
Sources
Dividends
Surplus Debenture Interest
Management and Investment Fees
Total Sources
Uses
Interest
Debt Repayments:
Revolver (repaid in April 2009)
Senior Credit Facility
Senior Health Note
Holding Company Expenses
Other
Total Uses
Cash Balance 12/31/09
$104.3
$60.0
34.3
42.5
$136.8
$52.9
55.0
6.6
25.0
24.9
3.5
$167.9
$73.2
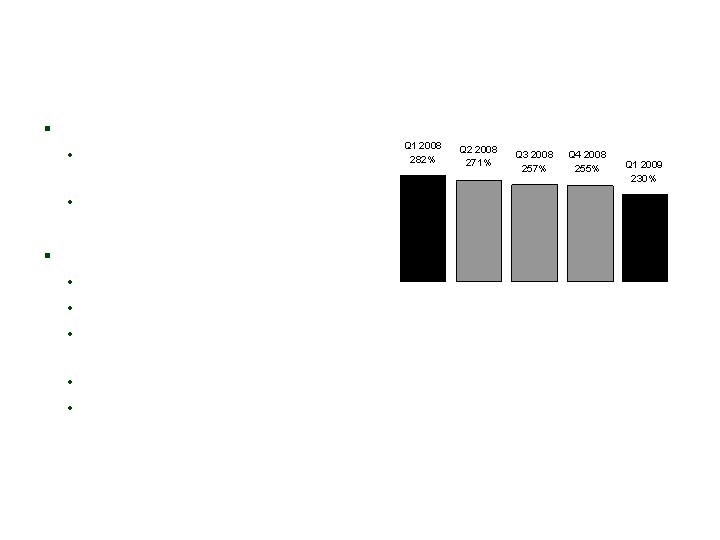
Consolidated RBC Ratio*
CNO
Q1 2009 positive impacts:
Q1 statutory operating results (7
percentage pts)
Termination of group PFFS cases
(6 pts)
Q1 2009 negative impacts:
Net capital losses (14 pts)
Credit rating migration (7 pts)
Mortgage Experience Adjustment
Factor (6 pts)
Dividend (4 pts)
Other items (7 pts)
*Risk-Based Capital (“RBC”) requirements provide a tool for insurance regulators to determine the levels of
statutory capital and surplus an insurer must maintain in relation to its insurance and investment risks. The
RBC ratio is the ratio of the statutory consolidated adjusted capital of our insurance subsidiaries to RBC.
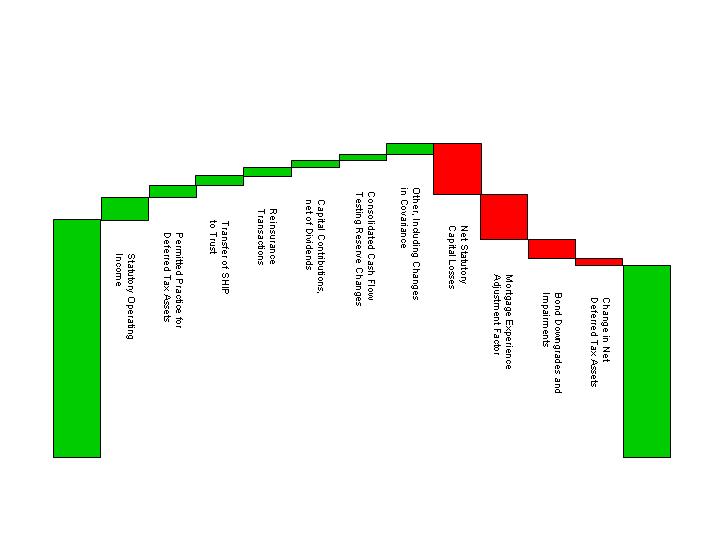
Consolidated RBC Ratio –
Changes Over Last Four Quarters
CNO
Beginning
RBC
Ending
RBC
282%
230%
+23%
-3%
+11%
-46%
-20%
-50%
+6%
+9%
+10%
+4%
+4%

Earnings of $44.7 million, up 54% over Q1 2008:
Higher LTC margins (+$11 million)
Positive impact of rate increases
Higher annuity margins (+$10 million)
Positive FAS 133 impact
Improved persistency
Increase in COLI surrender value (+$3 million)
Lower Med Supp margins due to higher benefit ratio (-$6 million)
Partially offset by impact of higher persistency
Strong core sales and record agent recruiting
Q1 Summary
Bankers
NAP Results
Core NAP up 9% vs Q1 2008
Strong sales of annuities
(+33%), Med Supp (+8%) and
life (+8%), partially offset by
lower LTC (-20%) sales
PFFS sales negatively
affected by:
New CMS marketing restrictions
Change in sales recognition
Bankers
($ millions)
Quarterly Core NAP (Excludes PFFS)
NAP-Quarterly*: $114.6 $53.4 $65.8 $72.8 $94.5
PFFS NAP-Quarterly*: $59.0 $(6.4) $4.6 $0.9 $34.1**
*Excludes group business not sold by Bankers agents.
**Net of $7 million reserve for anticipated chargebacks related to sales still within their 90-day disenrollment period.

Agent productivity and agent force growth remain strong
4,987 agents* at 3/31/09, up 5% vs 12/31/08
22% YTD growth in new agents; a record quarter for agent recruiting
Coventry’s decision to not file PFFS for 2010 not expected to
disrupt distribution
Currently in discussions to replace Coventry for Med Advantage in 2010,
with enhanced availability of network plans nationwide
Bankers agents control relationship with PFFS members; able to offer
these customers multiple solutions, including Med Supp
Lost fee income expected to be replaced through new agreement
Q1 2009 Sales and
Distribution Results
Bankers
*YTD average agent count.
Annuity Sales
Stock market volatility fueling fixed
annuity sales
Indexed annuities remain smaller
percentage of total annuity sales
SEC designation of indexed
annuities as securities (Rule 151A)
not expected to significantly impact
Bankers total annuity sales
Majority of Bankers branch offices
maintain one or more registered
reps to assist clients with portfolio
management and broker securities
Bankers
Indexed
Annuities
Annuities – NAP*
Q1 2008
$13.6
Q2 2008
$15.6
Q3 2008
$19.4
Q4 2008
$24.4
Fixed
Annuities
($ millions)
*Calculated as 6% of annuity deposits.
Q1 2009
$18.2
$5.7
$7.9
$7.6
$8.0
$9.0
$10.4
$18.2
$6.2
$5.0
$13.2
No significant change in
surrender activity:
Q1 2009 surrenders slightly lower
than Q4 2008
Average account value:
EIAs - $41,000
Non-EIAs - $35,000
Over 89% of our annuities are
still in surrender period:
EIAs – 94%
Non-EIAs – 87%
Annuity Surrenders
Bankers
EIA Surrenders
(annualized quarterly rate)
Non-EIA Surrenders
(annualized quarterly rate)

Rate increases ahead of schedule (2008 round – policies issued prior
to 2002)
Filed $102.5 million of rate increases = 100% of expected total
Approvals at 3/31/09 = $66.6 million (30 states), 94% of expected total
Projected financial impact = $56.7 million, 94% of expected total
Continued focus on claims management/underwriting
New products
LTC product revision in June 2009, with rates reflecting current claim
experience and higher profit targets
LTC/Annuity Combo product to be launched in June 2009
LTC Update
Bankers

Q1 Earnings
Bankers
Management believes that an analysis of income (loss) before net realized investment gains (losses), net of
related amortization (a non-GAAP financial measure), is important to evaluate the financial performance of our
business, and is a measure commonly used in the life insurance industry. Management uses this measure to
evaluate performance because realized gains or losses can be affected by events that are unrelated to a
company’s underlying fundamentals. The table on Page 8 reconciles the non-GAAP measure to the
corresponding GAAP measure. See Appendix for a reconciliation of the return on equity measure to the
corresponding GAAP measure.
Trailing 4 Quarter Operating Return on Equity: 8.1%
($ millions)
Q1 2008
Q2 2008
Q3 2008
Q4 2008
Q1 2009
Insurance policy income
$497.0
$543.4
$537.7
$531.8
$491.5
Net investment income
129.3
135.2
138.3
155.4
142.2
Fee revenue and other income
1.6
2.1
3.1
4.2
1.4
Total revenues
627.9
680.7
679.1
691.4
635.1
Insurance policy benefits
434.9
497.2
470.3
477.5
429.6
Amounts added to policyholder account balances
44.8
37.2
46.2
82.3
37.6
Amortization related to operations
75.0
66.6
53.5
39.7
75.6
Other operating costs and expenses
44.1
45.1
41.3
51.9
47.6
Total benefits and expenses
598.8
646.1
611.3
651.4
590.4
Income before net realized investment gains (losses),
net of related amortization and income taxes
$29.1
$34.6
$67.8
$40.0
$44.7

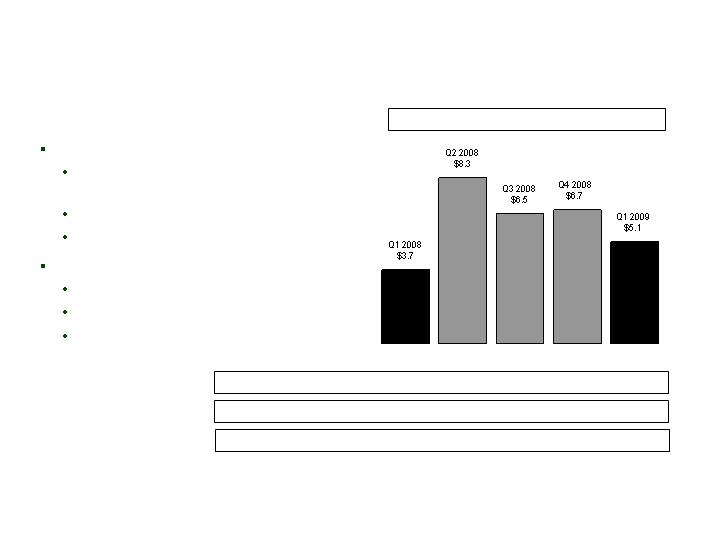
Earnings of $5.1 million, up 38% over Q1 2008:
Favorable life claim experience and overall business growth
Lower expense levels
Higher investment income
2009 lead generation efforts intentionally reduced as part of
company’s capital management efforts
Life sales for Q1 2009 were $12.3 million, down 4% from Q1
2008
Q1 Summary
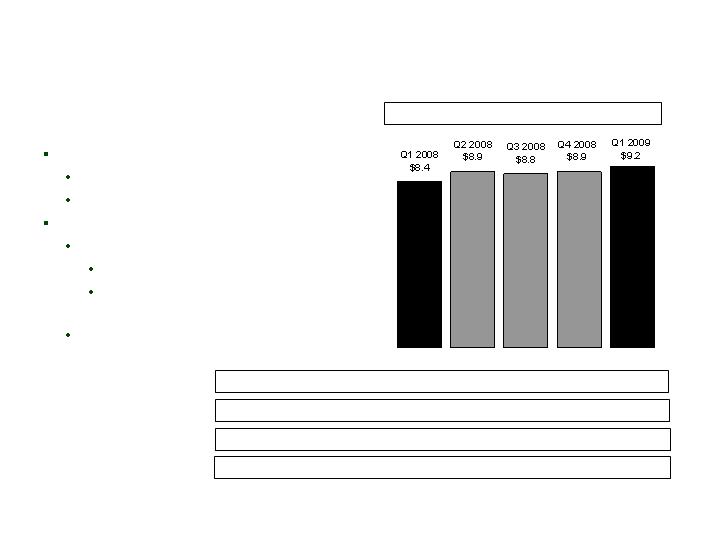
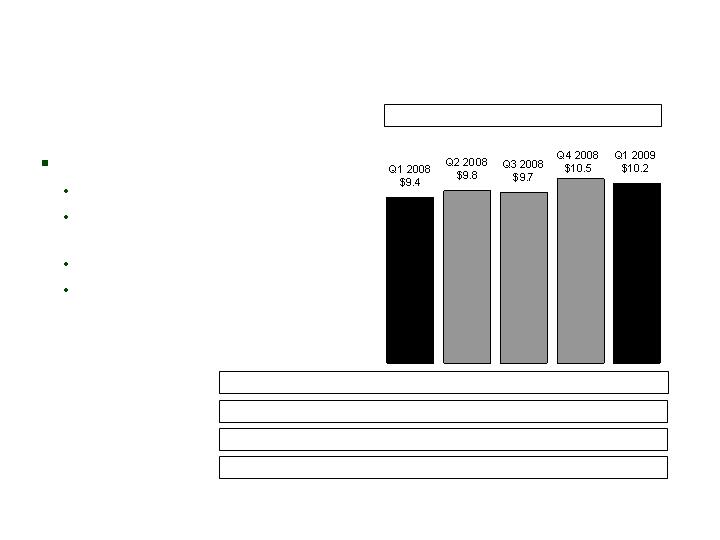
Colonial Penn

Q1 Earnings
Colonial Penn
Management believes that an analysis of income (loss) before net realized investment gains (losses), net of
related amortization (a non-GAAP financial measure), is important to evaluate the financial performance of our
business, and is a measure commonly used in the life insurance industry. Management uses this measure to
evaluate performance because realized gains or losses can be affected by events that are unrelated to a
company’s underlying fundamentals. The table on Page 8 reconciles the non-GAAP measure to the
corresponding GAAP measure. See Appendix for a reconciliation of the return on equity measure to the
corresponding GAAP measure.
Trailing 4 Quarter Operating Return on Equity: 13.4%
($ millions)
Q1 2008
Q2 2008
Q3 2008
Q4 2008
Q1 2009
Insurance policy income
$44.4
$47.5
$46.4
$46.5
$47.1
Net investment income
9.2
10.1
10.1
10.2
9.8
Fee revenue and other income
0.3
0.5
0.5
0.5
0.2
Total revenues
53.9
58.1
57.0
57.2
57.1
Insurance policy benefits
35.0
35.5
33.9
33.8
36.1
Amounts added to policyholder account balances
0.3
0.3
0.3
0.3
0.3
Amortization related to operations
7.4
7.4
9.2
8.0
8.4
Other operating costs and expenses
7.5
6.6
7.1
8.4
7.2
Total benefits and expenses
50.2
49.8
50.5
50.5
52.0
Income (loss) before net realized investment
gains (losses) and income taxes, net of
related amortization
$3.7
$8.3
$6.5
$6.7
$5.1

Earnings of $31.2 million, up 34% vs Q1 2008:
Higher margins for specified disease and Med Supp blocks (+$6
million)
Unlocking adjustment negatively impacted Q1 2008 (+$8 million)
Partially offset by lower annuity margin due to excess terminations
in Q1 2009 (-$3 million)
Continuing to analyze non-guaranteed elements of older life
insurance policies issued by predecessor companies and make
changes where appropriate
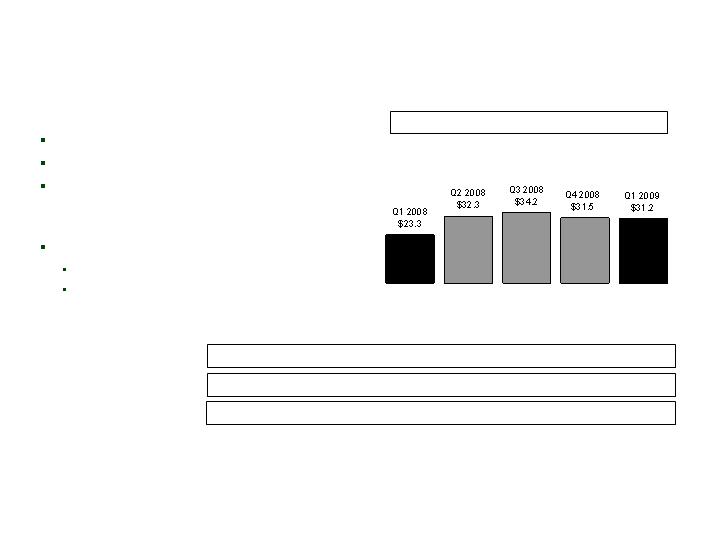
Q1 Summary
CIG
CIG
($ millions)
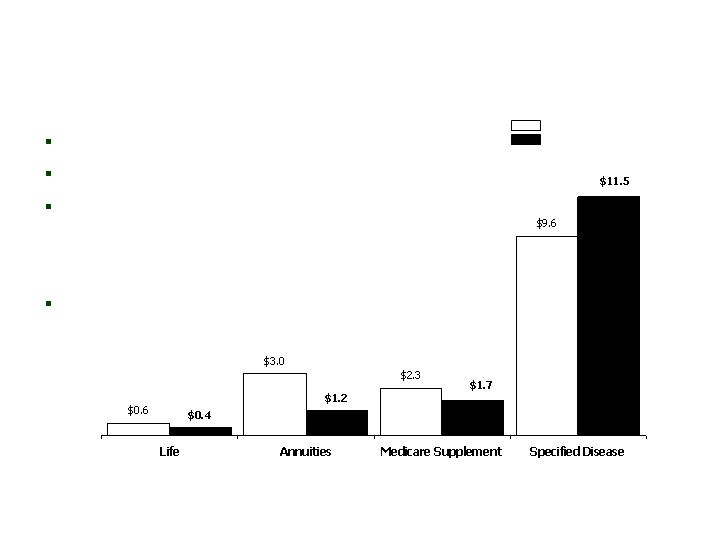
Specified disease sales up 20% over Q1 2008
Worksite sales up 27%
Strong recruiting, with record numbers of
new agents in PMA, 52 new IMOs signed for
CIG Sales, and 61% increase in producing
worksite agents
Decreases in high face-amount life and
annuity products, consistent with CIG’s re-
focus
Q1 2008
Q1 2009
Q1 2009 Sales and
Distribution Results

Q1 Earnings
CIG
Management believes that an analysis of income (loss) before net realized investment gains (losses), net of
related amortization (a non-GAAP financial measure), is important to evaluate the financial performance of our
business, and is a measure commonly used in the life insurance industry. Management uses this measure to
evaluate performance because realized gains or losses can be affected by events that are unrelated to a
company’s underlying fundamentals. The table on Page 8 reconciles the non-GAAP measure to the
corresponding GAAP measure. See Appendix for a reconciliation of the return on equity measure to the
corresponding GAAP measure.
Trailing 4 Quarter Operating Return on Equity: 3.7%
($ millions)
Q1 2008
Q2 2008
Q3 2008
Q4 2008
Q1 2009
Insurance policy income
$243.7
$239.1
$237.7
$238.4
$244.2
Net investment income
136.1
138.7
134.0
143.7
134.3
Fee revenue and other income
0.8
0.5
0.1
0.3
0.7
Total revenues
380.6
378.3
371.8
382.4
379.2
Insurance policy benefits
209.1
208.6
203.6
199.6
214.1
Amounts added to policyholder account balances
43.6
37.1
42.7
38.4
35.8
Amortization related to operations
30.2
31.2
24.9
36.3
36.8
Interest expense on investment borrowings
5.8
5.5
5.6
5.5
5.2
Other operating costs and expenses
68.6
63.6
60.8
71.1
56.1
Total benefits and expenses
357.3
346.0
337.6
350.9
348.0
Income before net realized investment gains (losses),
net of related amortization and income taxes, excluding
costs related to the litigation settlement and the loss
related to an annuity coinsurance transaction
$23.3
$32.3
$34.2
$31.5
$31.2

Q1 2009
Net Realized Losses
CNO
Net gains on sales
Losses due to recognition of other-
than-temporary impairments
Amortization adjustment to insurance
intangibles
Net investment losses before tax
Tax expense
Increase to tax valuation allowance
Net investment losses after tax
($ millions)
-
$(16.1)
2.7
(13.4)
4.7
-
$(8.7)
$85.1
(108.1)
2.7
(20.3)
7.1
(2.4)
$(15.6)
$85.1
(92.0)
-
(6.9)
2.4
(2.4)
$(6.9)
Gross
Amounts
Amount Recognized
through Accumulated
Other Comprehensive
Income
Amount Recognized
through Net Income
Investment Quality:
Fixed Maturities*
CNO
Investment grade securities
represent 91% of total
portfolio*
Limited new money allocation
to below-investment grade
securities
Increase in below-investment
grade ratio driven by credit
cycle/ratings migration
Actively Managed Fixed Maturities by Rating at
3/31/09 (Market Value)
3/31/09
91%
12/31/08
92%
9/30/08
93%
6/30/08
93%
3/31/08
93%
% of Bonds which are Investment Grade:*
*Excludes investments from a variable interest entity which we consolidate under GAAP (though the related
liabilities are non-recourse to Conseco).
AAA
16%
AA
5%
A
33%
BBB
37%
<BBB
9%

Q1 2009 Downgrades from Investment
Grade to Below Investment Grade
CNO
IG Corporates
Financials
Subprime
Alt-A
Prime Jumbo
CMBS
Other
Total
($ millions)
$119.3
87.4
10.0
114.0
15.0
15.1
34.4
$395.2
9
6
1
5
1
5
3
30
(1.4)
(1.6)
(0.1)
(2.2)
(0.5)
(0.3)
(0.9)
(7.0)
Type
Statutory Book
Value
# Issues
Effect of
Downgrades on
RBC Ratio*
*Includes estimated effect of covariance and tax.
Subprime allocation substantially
reduced
HEL allocation reflects market
stresses
Overall mark-to-market and
credit migration consistent with
credit cycle
Pressure on Financials/REITs
Overall highly rated
Pressure on ALT-A marks caused by
fundamentals and market illiquidity
Alt-A downgrades
Low, but rising delinquencies
Seasoned portfolio
Severe BBB market illiquidity
and pressure on marks
Nominal downgrades to date,
despite market rating activity
Slowing economy and lack of financing likely to
lead to higher delinquencies
Active surveillance and portfolio management
Nominal new investment activity
Liquidated $45 million in problematic exposures in
Q4 2008
Managing through the credit cycle by emphasizing long-term
assessments of value and quality
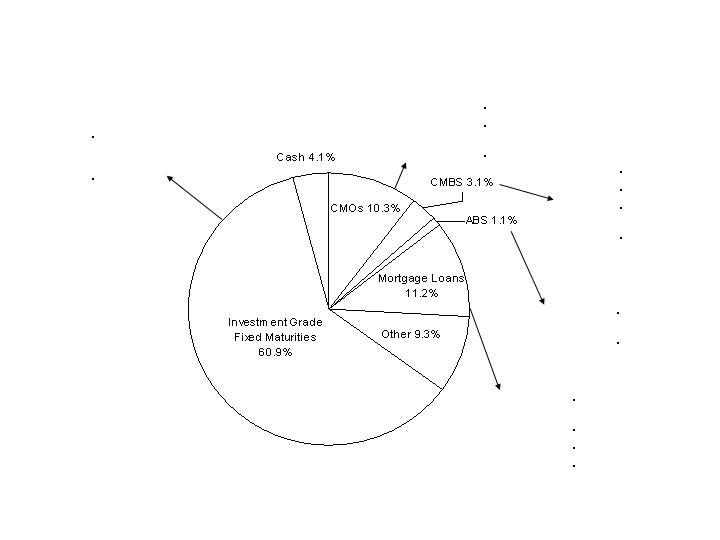
Asset Allocation at 3/31/09
CNO
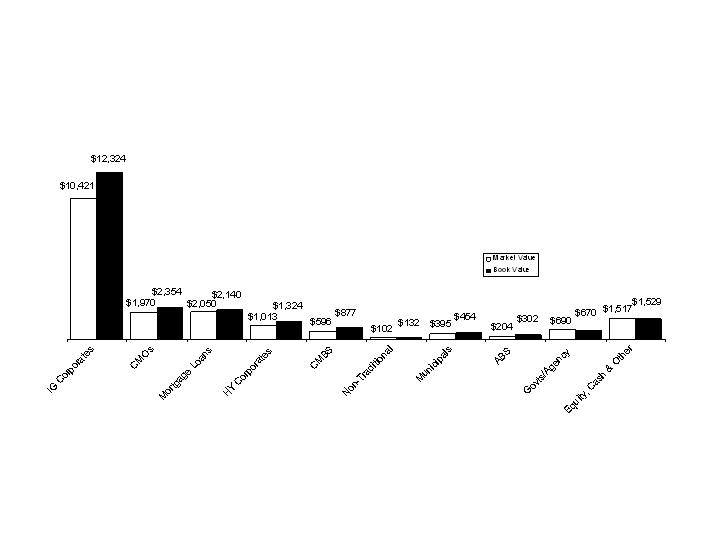
Asset Allocation at 3/31/09
MTM in line with expectations, reflecting generally
stabilized yields during Q1 2009
CNO
($ millions)
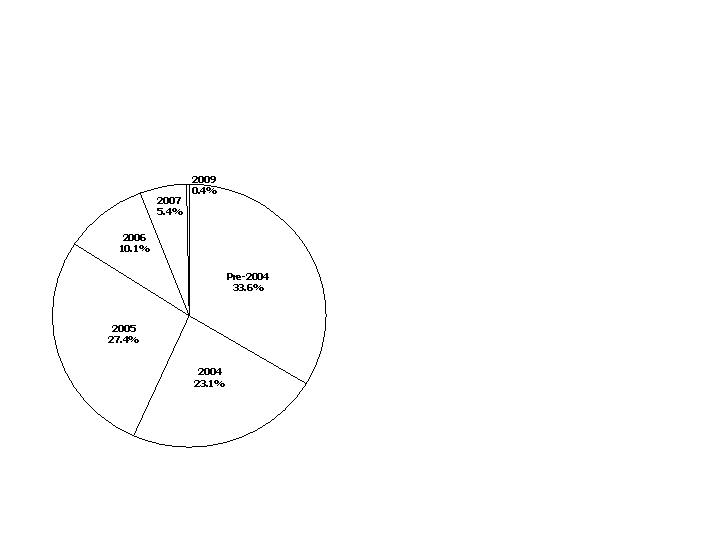
CMOs by Type at 3/31/09
Our allocation to CMOs has been reduced over
the last two years to meet our asset/liability
management needs
CNO
($ millions)
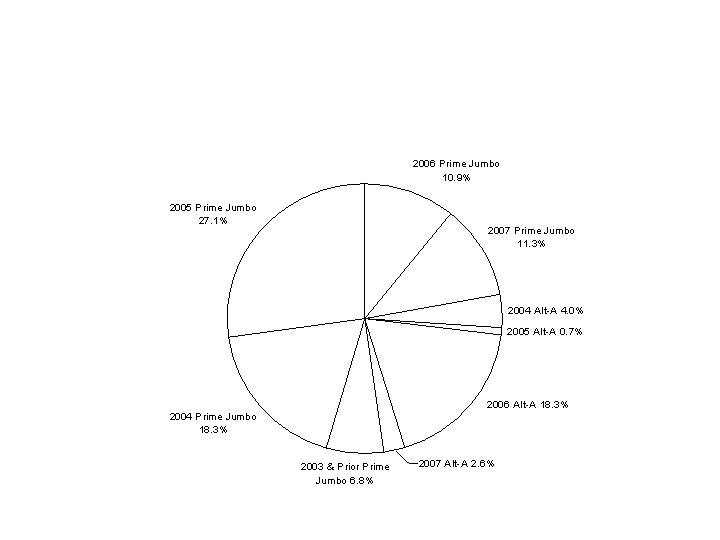

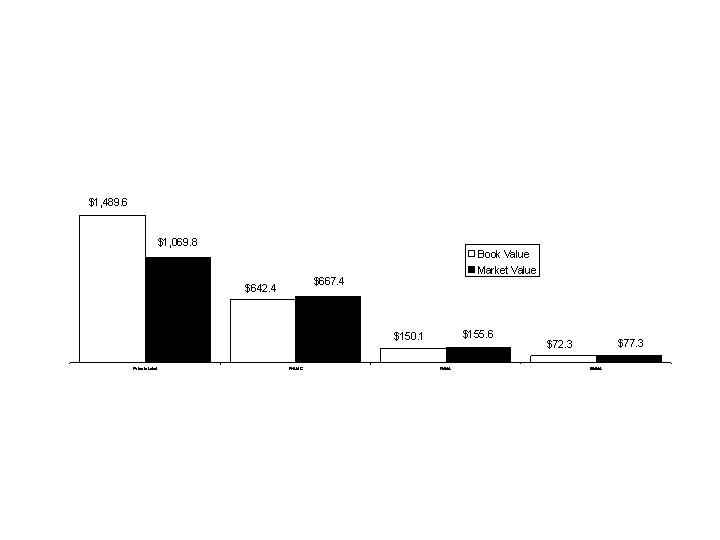
Alt-A at 3/31/09
CNO
AAA
AA
A
BBB
<BBB
Total
$13.1
$43.5
$5.1
$9.1
$193.1
$263.9
$18.3
$52.8
$10.0
$13.4
$328.2
$422.7
5.0%
16.5%
1.9%
3.4%
73.2%
100.00%
0.07%
0.23%
0.03%
0.05%
1.01%
1.39%
Market
Value (mil.)
Book
Value (mil.)
% of
Alt-A*
% of
Portfolio*
Rating
Exposure reduced by 21% from 12/31/08 to 3/31/09
No exposure to “affordability products” – option ARMs, hybrid, neg-ams
While delinquencies are higher than anticipated, collateral performing better than
overall Alt-A market, which has average FICO of 712, 60+ delinquency rate of
26.2%, and average accumulated loss of 1.78% (source: True Standings)
Substantial credit support inherent in structures relative to expected losses, even at
rising delinquency rates
692
734
691
699
714
716
Avg.
FICO
14.8%
7.7%
11.8%
5.3%
10.3%
9.9%
Avg.
Support
8.1%
5.4%
12.9%
6.6%
14.7%
12.5%
Avg. 60+
Delinq.
*% of market value
($ millions)
0.75%
0.23%
0.61%
1.69%
0.65%
0.62%
Avg. Accum.
Loss
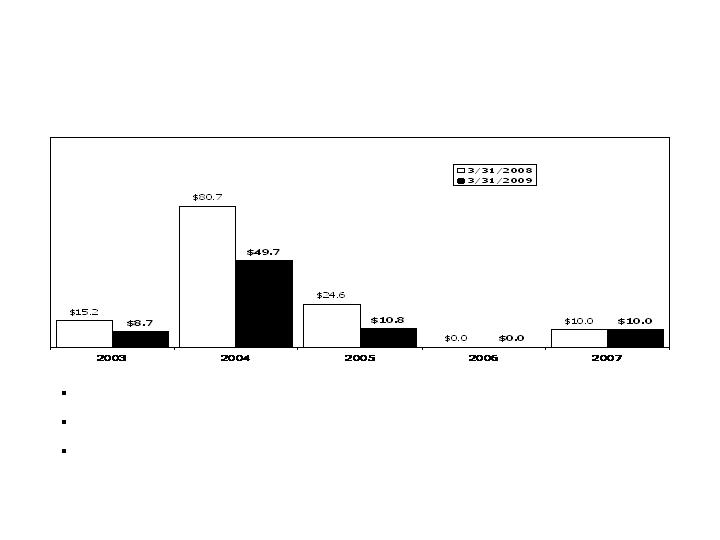
Sub-Prime Home Equity ABS
By Vintage
CNO
Exposure reduced by 39% in the last 12 months
Represents 0.35% of invested assets at 3/31/09, compared to 0.70% at 3/31/08
Very little exposure to 2006 and 2007 vintages ($10.0 million)
(GAAP book value - $ millions)
$130.5
$79.2

Sub-Prime Home Equity ABS
at 3/31/09
CNO
AAA
AA
A
BBB
<BBB
Total
$16.1
$10.0
$6.0
$6.1
$5.5
$43.7
$22.2
$18.2
$16.3
$11.9
$10.6
$79.2
36.7%
22.9%
13.7%
14.0%
12.7%
100.0%
0.09%
0.05%
0.03%
0.03%
0.03%
0.23%
Market
Value (mil.)
Book
Value (mil.)
% of
Subprime*
% of
Portfolio*
Rating
Only $5.5 million (market value) <BBB (0.03% of invested assets)
While delinquencies up, consistent with market conditions, remaining portfolio
generally reflects satisfactory margin for adverse collateral performance
No exposure to “affordability products” – negative amortization, option ARM
collateral, etc.
632
629
676
697
650
649
Avg.
FICO
34.3%
23.1%
19.7%
24.0%
23.8%
27.0%
Avg.
Support
13.7%
13.8%
6.8%
5.1%
26.1%
13.2%
Avg. 60+
Delinq.
*% of market value
($ millions)
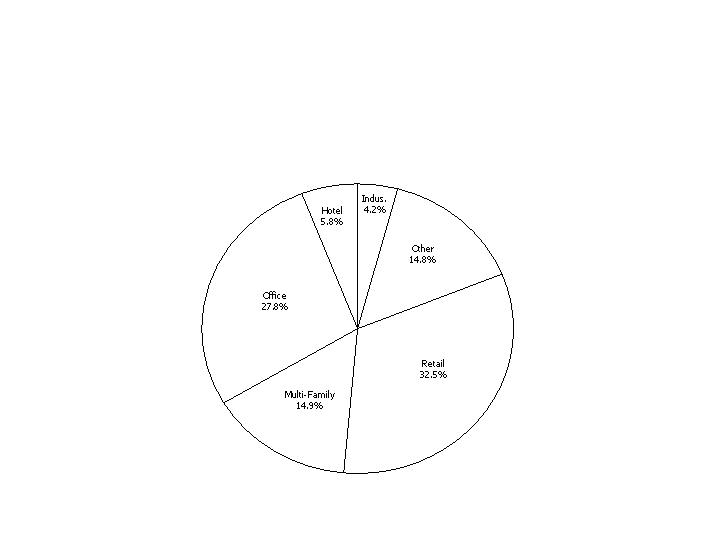
CMBS by Vintage at 3/31/09
Our CMBS exposure is heavily weighted toward higher ratings and
older vintages with stronger qualitative characteristics and seasoning
CNO
(GAAP book value - $ millions)
$206.7
$163.9
$119.3
$0.0
$47.0
$3.5
$540.4
$454.7
$34.1
$3.0
$12.0
$21.4
$0.0
$0.0
$70.5
$45.8
$42.5
$16.2
$31.9
$15.6
$0.0
$0.0
$106.2
$47.5
$12.0
$19.6
$75.1
$17.6
$0.0
$0.0
$124.3
$29.6
$0.0
$0.0
$1.9
$34.2
$0.0
$0.0
$36.1
$18.6
Pre-2004
2004
2005
2006
2007
2009
Total BV
Total MV
AAA
AA
A
BBB
<BBB
CMBS by Collateral Type at 3/31/09
Our CMBS are backed by a diverse pool of underlying collateral –
$90 billion, from more than 7,900 commercial mortgage loans
CNO

CNO Summary
Key differences between Conseco and the rest of the industry:
Our sales are continuing to grow
Our products are simple and straightforward, and entail less product risk
than those designed for higher-net-worth customers
Strong franchise in the senior middle market
Capital management initiatives implemented
Less stock market exposure than some of our highly rated competitors
We will be:
Continuing to work on sales growth
Continuing to make the business more efficient
Continuing to work on projects to improve our capital position going forward
CNO

Questions and Answers

Appendix
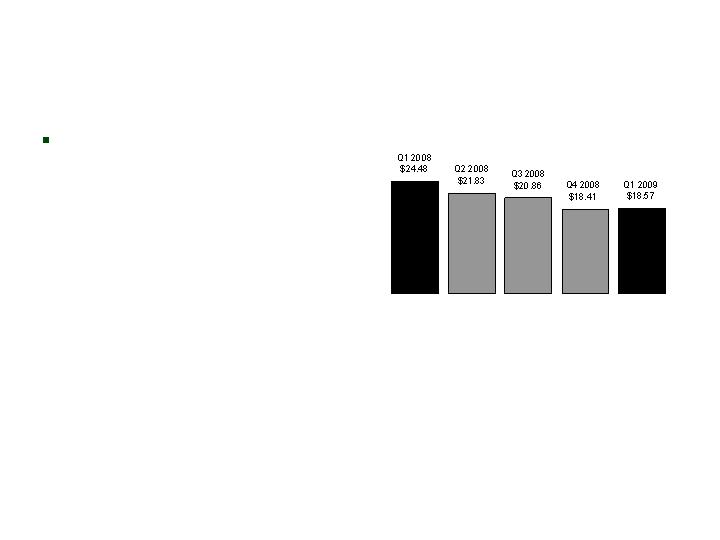
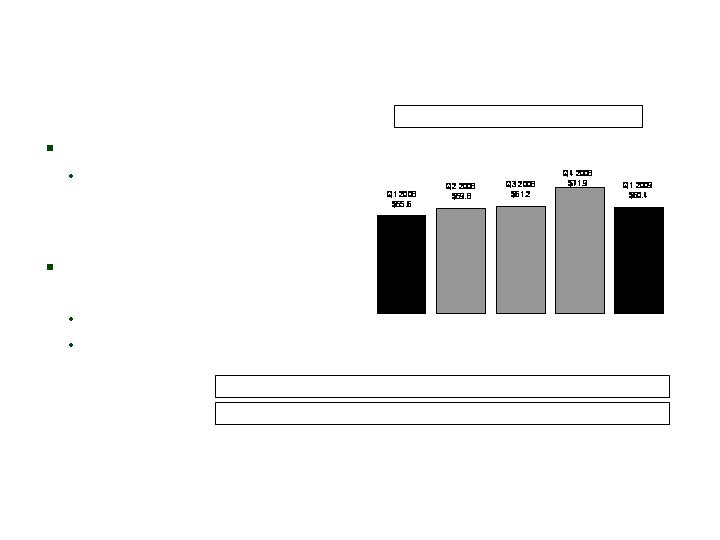
Book Value Per Share*
CNO
*Book value excludes accumulated other comprehensive income (loss). Shares outstanding assumes:
(1) conversion of convertible securities; and (2) the exercise of outstanding stock options and vesting of restricted
stock (each calculated using the treasury stock method). See Appendix for corresponding GAAP measure.
Increase from Q4 2008 due to
Q1 2009 net income

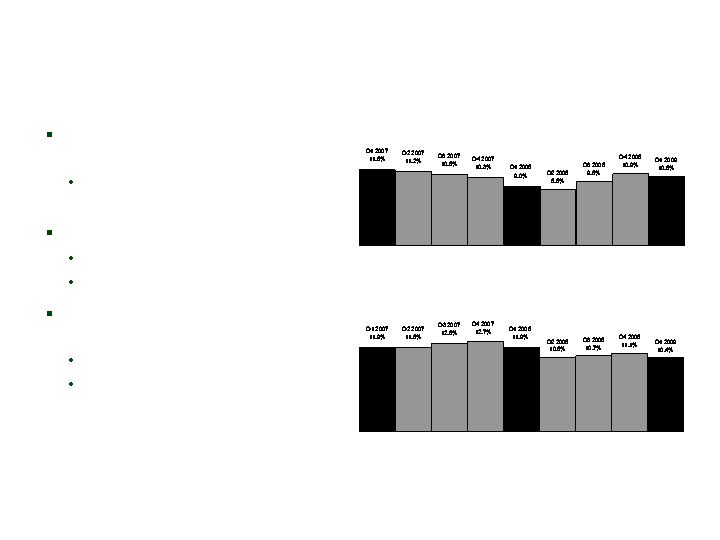
Bank Covenant
Debt to Total Capital Ratio*
CNO
Change from Q4 2008
primarily due to Q1 2009
net income
*Excludes accumulated other comprehensive income (loss). See Appendix for corresponding GAAP measure.
Q1 2008
20.9%
Q2 2008
22.9%
Q3 2008
23.6%
Q4 2008
28.3%
Q1 2009
27.9%
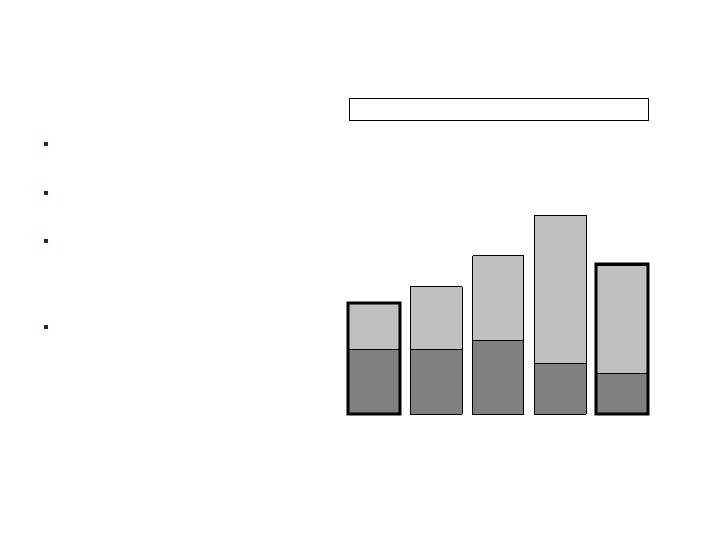
Net Investment Income
CNO
($ millions)
Decrease in Q1 2009 primarily
due to increase in cash and
short-term investment balances
compared to prior periods
General Account Investment Income
5.67%
5.93%
5.91%
5.82%
5.82%
Yield:
Expenses
CNO
($ millions)
Adjusted Operating Expenses*
*Adjusted operating expenses exclude primarily acquisition costs, capitalization of software development
costs, initial PFFS marketing costs and contractual vacancy charges related to exiting the Merchandise Mart
in Chicago. This measure is used by the Company to evaluate its progress in reducing operating expenses.
Expenses have been restated for all periods to reflect the SHIP separation.
Back-office consolidation complete
Approximately $20 million in savings
realized in 2007 and 2008; remaining $5
million expected in 2009
Q4 2008 expenses reflect increased
investment in business growth at
Bankers and Conseco Insurance Group
Segment Performance
Bankers
*Operating earnings exclude net realized gains (losses). See Appendix for corresponding GAAP measure of
our consolidated results of operations.
Earnings up 54% vs Q1 2008
Earnings positively affected by:
Higher LTC margins
Lower DAC/VOBA amortization
Change in COLI surrender value
FAS 133 accounting
Offset by:
Lower Med Supp margins
PTOI-Trailing 4 Quarters: $225.4 $189.5 $189.8 $171.5 $187.1
Revenues-Quarterly: $627.9 $680.7 $679.1 $691.4 $635.1
Pre-Tax Operating Income*
Revenues -Tr. 4 Quarters: $2,438.1 $2,537.0 $2,594.5 $2,679.1 $2,686.3
($ millions)
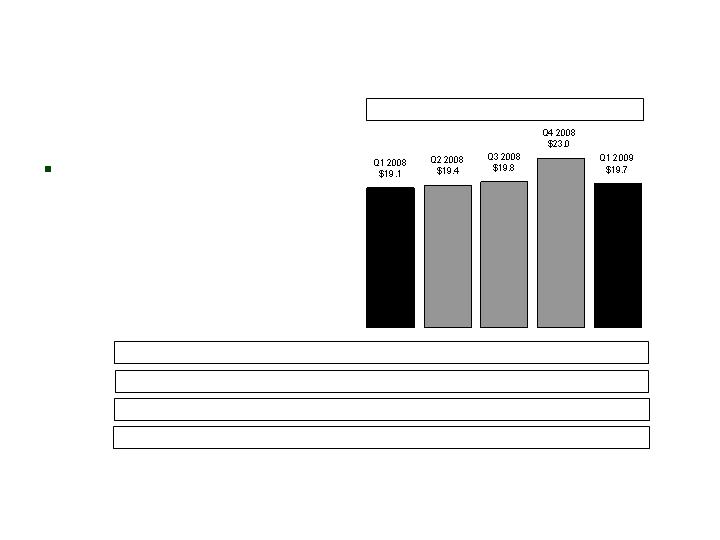
Premiums –
Medicare Supplement
Bankers
($ millions)
First-year premiums up 3%
vs Q1 2008
Medicare Supplement – First-Year Premiums
Med. Supp. First-Year Prems.-Tr. 4 Qtrs: $79.4 $78.8 $79.3 $81.3 $81.9
Med. Supp. Total Premiums-Quarterly: $159.9 $150.6 $153.8 $172.3 $155.8
Med. Supp. NAP-Quarterly: $17.1 $17.0 $16.6 $27.9 $18.4
Med. Supp. NAP-Trailing 4 Quarters: $70.9 $73.2 $73.7 $78.6 $79.9
Premiums –
Long-Term Care
Bankers
($ millions)
Quarterly first-year premium
tracks decline in NAP
NAP decline attributable to three
main factors:
Overall industry sales decline
Agent force shift toward life and
annuity sales
Tightened underwriting
First-Year Prems.-Tr. 4 Qtrs: $46.4 $44.8 $43.9 $42.7 $35.9
Total Premiums-Quarterly: $156.6 $155.2 $154.8 $159.1 $145.9
Long-Term Care – First-Year Premiums*
NAP-Quarterly: $9.4 ��$10.7 $11.4 $7.9 $7.5
NAP-Trailing 4 Quarters: $44.6 $42.6 $42.3 $39.4 $37.5
*Q1 2009 includes $5.7 million of premiums ceded under new business reinsurance agreement.
Q1 2009
(Direct)
$9.9
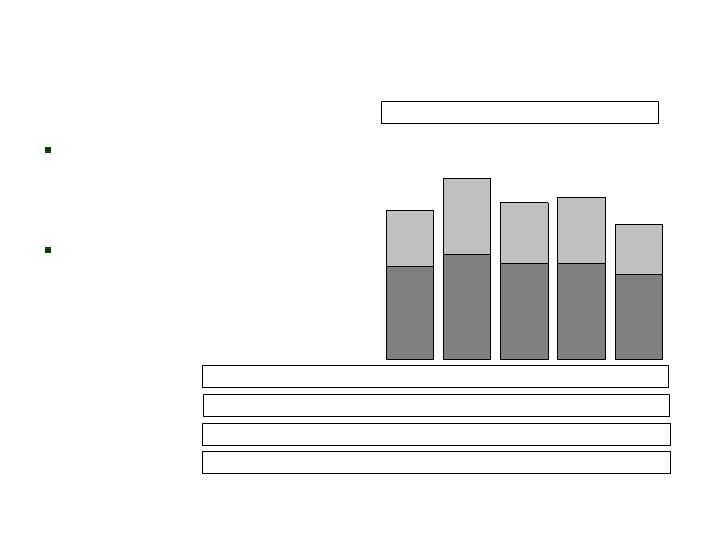
Premiums –
Life Insurance
Bankers
($ millions)
Fluctuations in first-year
premiums primarily reflect
variance in sales of single-
premium policies
Non-SPWL premiums down
8% vs Q1 2008
First-Year Prems.-Tr. 4 Qtrs: $86.3 $83.5 $81.8 $80.7 $79.0
Total Premiums-Quarterly: $48.0 $53.8 $51.9 $55.7 $48.9
Life – First-Year Premiums
NAP-Quarterly: $11.7 $15.7 $13.1 $11.4 $12.6
NAP-Trailing 4 Quarters: $53.1 $54.3 $53.6 $51.9 $52.8
Q1 2008
$18.5
Q2 2008
$22.5
SPWL
Non-
SPWL
$9.4
$7.0
$11.5
$13.1
$7.5
$12.0
Q3 2008
$19.5
Q4 2008
$20.2
$8.2
$12.0
Q1 2009
$16.8
$6.2
$10.6
Premiums –
Annuity
Bankers
($ millions)
Stock market volatility
fueling fixed annuity sales
Indexed annuities remain
smaller percentage of total
annuity sales
First-Year Prems.-Tr. 4 Qtrs: $898.9 $959.4 $1,031.3 $1,220.6 $1,294.1
Total Premiums-Quarterly: $228.7 $261.1 $323.1 $411.2 $302.1
Annuity – First-Year Premiums
Benefit Ratio* – PDP
Bankers
Down 8% vs Q1 2008
Q1 2009 impacted by prior
contract year IBNR release of
$0.9 million
Q1 2008 impacted by prior
contract year IBNR
strengthening of $2 million
*We calculate benefit ratios by dividing insurance policy benefits by insurance policy income.
Benefit Ratio* –
PFFS Individual Business
Bankers
Q1 2009 vs Q4 2008
comparison impacted by prior
contract year reserve releases
*We calculate benefit ratios by dividing insurance policy benefits by insurance policy income.

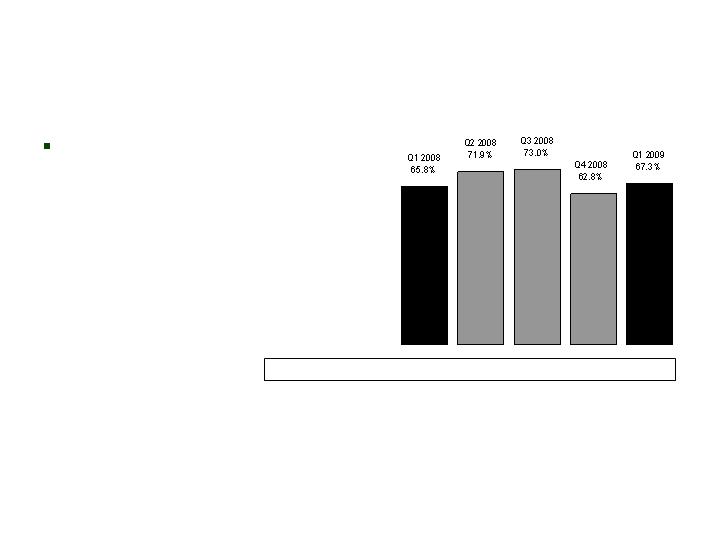
Interest-Adjusted Benefit Ratio* –
Long Term Care
Bankers
*We calculate interest-adjusted benefit ratios by dividing insurance policy benefits less interest income on
the accumulated assets backing the insurance liabilities by insurance policy income.
Q1 2009 positively impacted by
continued stabilization of incurred
claims and excess terminations
Completed Round Three re-rates on
legacy block; expect $50 million
annual financial impact
Began implementation of premium
re-rates (Round Two) in Q3 2007 on
more recent business not previously
re-rated; expect additional $10
million in in-force premium
Trailing 4 Quarter Avg.: 72.5% 76.7% 74.9% 74.0% 71.4%
Qtrly. non-int. adjusted: 111.6% 114.7% 102.1% 102.2% 105.1%
Segment Performance
Colonial Penn
*Operating earnings exclude net realized gains (losses). See Appendix for corresponding GAAP measure of
our consolidated results of operations.
Q1 2008 to Q1 2009 change affected by:
Organic growth initiatives and favorable
mortality, net of DAC amortization
Lower net expenses
Higher investment income
Q4 2008 to Q1 2009 change affected by:
Seasonally higher life claims in 2009
Lower net expenses
Lower investment income
PTOI-Trailing 4 Quarters: $17.2 $18.8 $18.3 $25.2 $26.6
Revenues-Quarterly: $53.9 $58.1 $57.0 $57.2 $57.1
Pre-Tax Operating Income*
Revenues -Tr. 4 Quarters: $179.2 $198.4 $213.3 $226.2 $229.4
($ millions)
Premiums –
Life Insurance
Colonial Penn
($ millions)
NAP:
Trailing 4 quarters relatively flat
14% growth over most recent quarter
Premium:
First year:
Trailing 4 quarters relatively flat
3% growth over most recent
quarter
Total: continued steady growth
First-Year Prems.-Tr. 4 Qtrs: $30.4 $32.3 $33.7 $35.0 $35.8
Total Premiums-Quarterly: $42.9 $43.8 $43.6 $43.8 $47.0
Life – First-Year Premiums
NAP-Quarterly: $12.7 $14.5 $12.1 $10.8 $12.3
NAP-Trailing 4 Quarters: $44.6 $47.9 $48.6 $50.1 $49.7
Segment Performance
CIG
*Operating earnings exclude: (1) net realized gains (losses); (2) the Q2 2006 charge related to the
litigation settlement and refinements to such estimates recognized in subsequent periods; and (3) the Q3
2007 charge related to an annuity coinsurance transaction. See Appendix for corresponding GAAP
measure of our consolidated results of operations.
Higher specified disease margins
Lower expenses
Unlocking adjustment negatively
impacting interest-sensitive life block in
Q1 2008
Partially offset by
Lower LTC closed block margins
Lower annuity margin due to excess
terminations on EIAs
PTOI-Trailing 4 Quarters: $71.5 $82.6 $99.4 $121.3 $129.2
Revenues-Quarterly: $380.6 $378.3 $371.8 $382.4 $379.2
Pre-Tax Operating Income*
Revenues-Tr. 4 Quarters: $1,653.7 $1,576.2 $1,511.3 $1,513.1 $1,511.7
($ millions)
Premiums -
Medicare Supplement
CIG
($ millions)
NAP lower vs Q4 2008:
We continue to focus on the
profitability of this business rather
than increased sales
First-Year Prems.-Tr. 4 Qtrs: $15.6 $12.7 $10.6 $9.6 $8.3
Total Premiums-Quarterly: $53.1 $49.6 $48.5 $52.6 $42.8
Medicare Supplement – First-Year Premiums
NAP-Quarterly: $2.3 $1.3 $1.8 $3.5 $1.7
NAP-Trailing 4 Quarters: $10.6 $9.0 $8.9 $8.9 $8.3
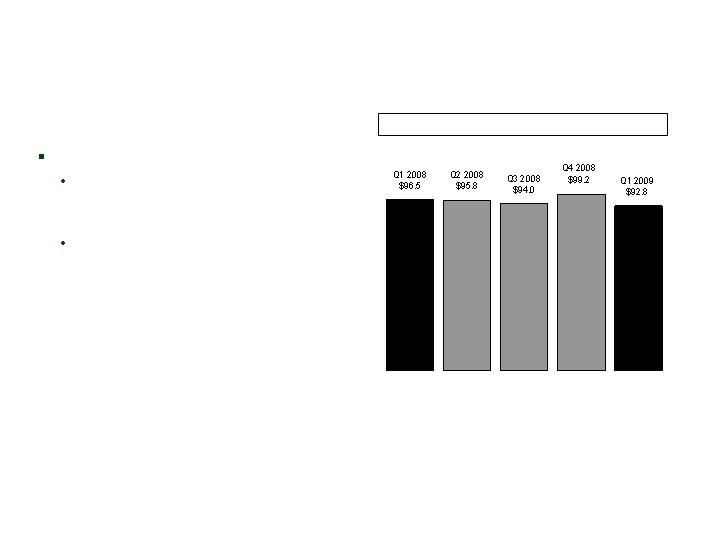
Premiums –
Specified Disease
CIG
($ millions)
NAP up 20% from Q1 2008:
New products
Increased PMA focus on
specified disease products
Recruitment of Health IMOs
Momentum increasing in
Worksite market
First-Year Prems.-Tr. 4 Qtrs: $33.5 $35.6 $37.6 $39.4 $40.2
Total Premiums-Quarterly: $94.2 $92.5 $92.3 $95.6 $93.0
Specified Disease – First-Year Premiums
NAP-Quarterly: $9.6 $12.4 $12.8 $12.0 $11.5
NAP-Trailing 4 Quarters: $40.8 $43.6 $46.1 $46.8 $48.7
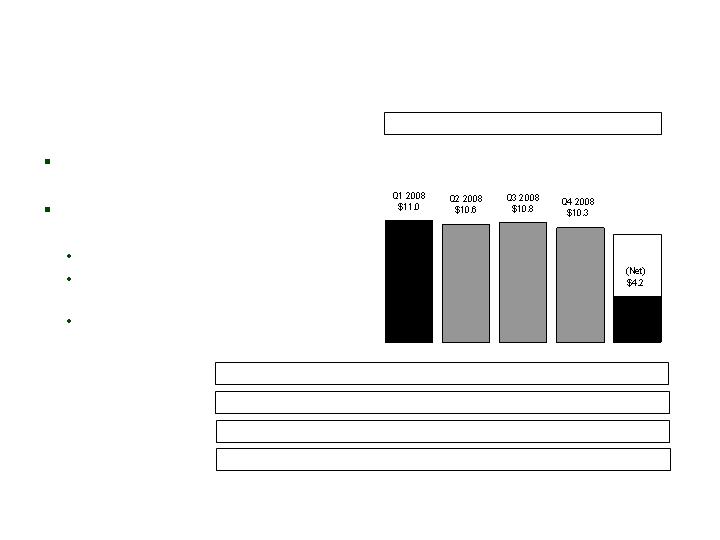
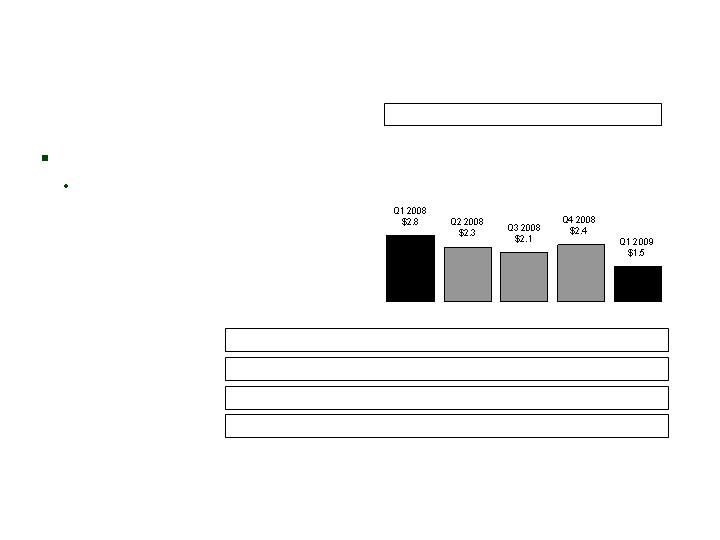
Premiums –
Annuity
CIG
($ millions)
First-year collections down
16% from Q4 2008:
Discontinuance of products due
to an annuity coinsurance
transaction
Focus on profitable products
First-Year Prems.-Tr. 4 Qtrs: $277.3 $203.4 $155.3 $119.9 $98.5
Total Premiums-Quarterly: $41.6 $37.1 $27.4 $23.7 $19.5
Annuity – First-Year Premiums
Benefit Ratio* –
Medicare Supplement
CIG
In line with expectations and
recent trends
Trailing 4 Quarter Avg.: 67.4% 68.0% 69.1% 68.4% 68.8%
*We calculate benefit ratios by dividing insurance policy benefits by insurance policy income.
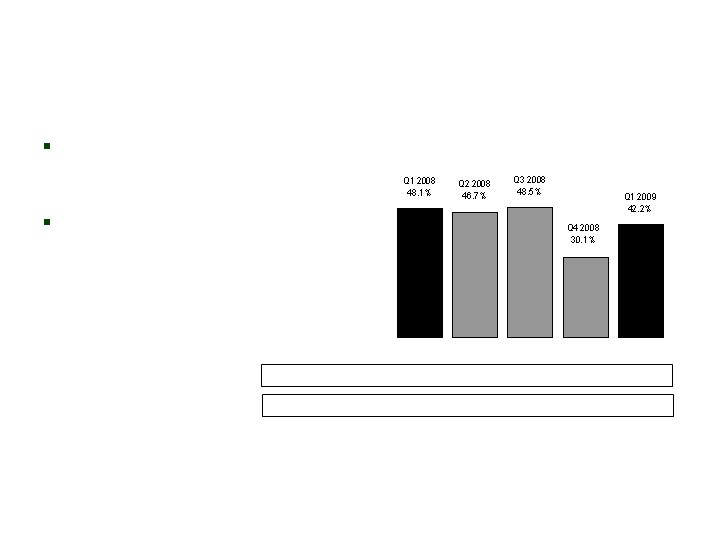
Interest-Adjusted Benefit Ratio* –
Specified Disease
CIG
Trailing 4 Quarter Avg.: 46.0% 47.6% 47.4% 43.3% 41.8%
Qtrly. non-int. adjusted: 81.7% 80.4% 82.6% 63.8% 76.0%
*We calculate interest-adjusted benefit ratios by dividing insurance policy benefits, less interest income on
the accumulated assets backing the insurance liabilities, by insurance policy income.
Q4 2008 included recognition
of deferred ROP adjustment
related to prior periods
Q1 2009 recognized lower
incurred claims due to
favorable experience in prior
periods

Information Related to Certain Non-GAAP Financial Measures
The following provides additional information regarding certain non-GAAP measures used in this presentation. A non-GAAP measure is a
numerical measure of a company’s performance, financial position, or cash flows that excludes or includes amounts that are normally excluded
or included in the most directly comparable measure calculated and presented in accordance with GAAP. While management believes these
measures are useful to enhance understanding and comparability of our financial results, these non-GAAP measures should not be considered
as substitutes for the most directly comparable GAAP measures. Additional information concerning non-GAAP measures is included in our
periodic filings with the Securities and Exchange Commission that are available in the “Investor – SEC Filings” section of Conseco’s website,
www.conseco.com.
Operating earnings measures
Management believes that an analysis of net income applicable to common stock before net realized gains or losses, discontinued operations
and increases to our valuation allowance for deferred tax assets (“net operating income,” a non-GAAP financial measure) is important to
evaluate the performance of the Company and is a key measure commonly used in the life insurance industry. Management uses this measure
to evaluate performance because realized investment gains or losses, discontinued operations and increases to our valuation allowance for
deferred tax assets are unrelated to the Company’s continuing operations.

Information Related to Certain Non-GAAP Financial Measures
A reconciliation of net income applicable to common stock to net operating income (and related per-share amounts) is as follows (dollars in
millions, except per-share amounts):
Q1 2008
Q2 2008
Q3 2008
Q4 2008
Q1 2009
Net income (loss) applicable to common stock
(7.2)
$
(488.5)
$
(183.3)
$
(453.3)
$
24.5
$
Net realized investment losses, net of related amortization and taxes
27.8
17.4
84.2
88.0
6.9
Discontinued operations
(0.5)
198.3
157.4
367.5
-
Valuation allowance for deferred tax assets
-
298.0
-
45.0
-
Net operating income (a non-GAAP financial measure)
20.1
$
25.2
$
58.3
$
47.2
$
31.4
$
Per diluted share:
Net income (loss)
(0.04)
$
(2.65)
$
(0.99)
$
(2.45)
$
0.13
$
Net realized investment losses, net of related amortization and taxes
0.15
0.09
0.45
0.48
0.04
Discontinued operations
-
1.08
0.85
1.99
-
Valuation allowance for deferred tax assets
-
1.61
-
0.24
-
Net operating income (a non-GAAP financial measure)
0.11
$
0.13
$
0.31
$
0.26
$
0.17
$

Information Related to Certain Non-GAAP Financial Measures
Book value, excluding accumulated other comprehensive income, per diluted share
This non-GAAP financial measure differs from book value per diluted share because accumulated other comprehensive income has been
excluded from the book value used to determine the measure. Management believes this non-GAAP financial measure is useful because it
removes the volatility that arises from changes in accumulated other comprehensive income. Such volatility is often caused by changes in the
estimated fair value of our investment portfolio resulting from changes in general market interest rates rather than the business decisions made
by management.
A reconciliation from book value per diluted share to book value per diluted share, excluding accumulated other comprehensive income (loss) is
as follows (dollars in millions, except per share amounts):
Q1 2008
Q2 2008
Q3 2008
Q4 2008
Q1 2009
Total shareholders' equity
3,954.7
$
3,395.7
$
2,716.3
$
1,630.0
$
1,591.2
$
Less accumulated other comprehensive income (loss)
(565.6)
(639.2)
(1,137.7)
(1,770.7)
(1,840.5)
Total shareholders' equity excluding
accumulated other comprehensive income (loss)
(a non-GAAP financial measure)
4,520.3
$
4,034.9
$
3,854.0
$
3,400.7
$
3,431.7
$
Diluted shares outstanding for the period
184,681,243
184,792,300
184,761,138
184,755,680
184,760,879
Book value per diluted share
21.41
$
18.38
$
14.70
$
8.82
$
8.61
$
Less accumulated other comprehensive income (loss)
(3.07)
(3.45)
(6.16)
(9.59)
(9.96)
Book value, excluding accumulated other
comprehensive income (loss), per diluted share
(a non-GAAP financial measure)
24.48
$
21.83
$
20.86
$
18.41
$
18.57
$

Information Related to Certain Non-GAAP Financial Measures
Operating return measures
Management believes that an analysis of return before net realized gains or losses, discontinued operations and increases to our valuation
allowance for deferred tax assets (“net operating income,” a non-GAAP financial measure) is important to evaluate the performance of the
Company and is a key measure commonly used in the life insurance industry. Management uses this measure to evaluate performance because
realized investment gains or losses, discontinued operations and increases to our valuation allowance for deferred tax assets are unrelated to the
Company’s continued operations.
This non-GAAP financial measure also differs from return on equity because accumulated other comprehensive income (loss) has been excluded
from the value of equity used to determine this ratio. Management believes this non-GAAP financial measure is useful because it removes the
volatility that arises from changes in accumulated other comprehensive income (loss). Such volatility is often caused by changes in the
estimated fair value of our investment portfolio resulting from changes in general market interest rates rather than the business decisions made
by management.
In addition, our equity includes the value of significant net operating loss carryforwards (included in income tax assets). In accordance with
GAAP, these assets are not discounted, and accordingly will not provide a return to shareholders (until after it is realized as a reduction to taxes
that would otherwise be paid). Management believes that excluding this value from the equity component of this measure enhances the
understanding of the effect these non-discounted assets have on operating returns and the comparability of these measures from period-to-
period. Operating return measures are used in measuring the performance of our business units and are used as a basis for incentive
compensation.
All references to segment operating return measures assume a 25% debt to total capital ratio at the segment level. Additionally, corporate
expenses have been allocated to the segments.

Information Related to Certain Non-GAAP Financial Measures
A reconciliation of return on common equity to operating return on common equity (excluding accumulated other comprehensive income (loss) and
net operating loss carryforwards) is as follows (dollars in millions, except per share amounts):
$
2,471.5
$
2,399.6
$
2,732.3
$
2,897.7
$
3,085.2
(loss) and net operating loss carryforwards (a non-GAAP financial measure)
Common shareholders' equity, excluding accumulated other comprehensive income
960.2
1,001.1
1,121.7
1,137.2
1,435.1
Less net operating loss carryforwards
3,431.7
3,400.7
3,854.0
4,034.9
4,520.3
income (loss) (a non-GAAP financial measure)
Common shareholder's equity, excluding accumulated other comprehensive
(1,840.5)
(1,770.7)
(1,137.7)
(639.2)
(565.6)
Less accumulated other comprehensive income (loss)
$
1,591.2
$
1,630.0
$
2,716.3
$
3,395.7
$
3,954.7
Common shareholders' equity
$
31.4
$
47.2
$
58.3
$
25.2
$
20.1
Net operating income (a non-GAAP financial measure)
-
45.0
-
298.0
-
Valuation allowance for deferred tax assets
-
367.5
157.4
198.3
(0.5)
Discontinued operations
6.9
88.0
84.2
17.4
27.8
Net realized investment (gains) losses, net of related amortization and taxes
$
24.5
$
(453.3)
$
(183.3)
$
(488.5)
$
(7.2)
Net income (loss) applicable to common stock
Q1 2009
Q4 2008
Q3 2008
Q2 2008
Q1 2008
Average common shareholders' equity
$4,103.5
$3,675.2
$3,056.0
$2,173.2
$1,610.6
Average common shareholders' equity, excluding accumulated other
comprehensive income (loss) and net operating loss carryforwards (a
non-GAAP financial measure)
$3,092.1
$2,991.5
$2,815.0
$2,566.0
$2,435.6
Return on equity ratios:
Return on common equity
-0.7%
-53.2%
-24.0%
-83.4%
6.1%
Operating return on common equity, excluding accumulated
other comprehensive income (loss) and net operating loss
carryforwards (a non-GAAP financial measure)
2.6%
3.4%
8.3%
7.4%
5.2%

Information Related to Certain Non-GAAP Financial Measures
A reconciliation of pretax operating earnings (a non-GAAP financial measure) to segment operating income (loss) and consolidated net income
(loss) for the three months ended March 31, 2009, is as follows (dollars in millions):
(Continued on next page)
CIG
Bankers
Colonial Penn
Corporate
Total
Pretax operating earnings (a non-GAAP financial measure)
31.2
$
44.7
$
5.1
$
(31.9)
$
49.1
$
Allocation of interest expense, excess capital and corporate
expenses
(17.7)
(13.8)
(1.3)
32.8
-
Income tax (expense) benefit
(4.9)
(11.1)
(1.4)
(0.3)
(17.7)
Segment operating income (loss)
8.6
$
19.8
$
2.4
$
0.6
$
31.4
Net realized investment losses, net of related amortization and taxes
(6.9)
Net income
24.5
$

Information Related to Certain Non-GAAP Financial Measures
A reconciliation of common shareholders’ equity, excluding accumulated other comprehensive income (loss) and net operating loss
carryforwards (a non-GAAP financial measure) to common shareholders’ equity at March 31, 2009, is as follows (dollars in millions):
(Continued from previous page)
(Continued on next page)
CIG
Bankers
Colonial Penn
Corporate
Total
December 31, 2008
Common shareholders' equity, excluding accumulated other
comprehensive income (loss) and net operating loss carryforwards
(a non-GAAP financial measure)
1,580.6
$
1,232.1
$
111.9
$
(525.0)
$
2,399.6
$
Net operating loss carryforwards
1,001.1
-
-
-
1,001.1
Accumulated other comprehensive income (loss)
(824.7)
(817.9)
(41.4)
(86.7)
(1,770.7)
Allocation of capital
526.9
410.7
37.3
(974.9)
-
Common shareholders' equity
2,283.9
$
824.9
$
107.8
$
(1,586.6)
$
1,630.0
$
March 31, 2009
Common shareholders' equity, excluding accumulated other
comprehensive income (loss) and net operating loss carryforwards
(a non-GAAP financial measure)
1,664.3
$
1,247.0
$
113.9
$
(553.7)
$
2,471.5
$
Net operating loss carryforwards
960.2
-
-
-
960.2
Accumulated other comprehensive income (loss)
(870.1)
(860.0)
(48.1)
(62.3)
(1,840.5)
Allocation of capital
554.8
415.7
37.9
(1,008.4)
-
Common shareholders' equity
2,309.2
$
802.7
$
103.7
$
(1,624.4)
$
1,591.2
$

Information Related to Certain Non-GAAP Financial Measures
(Continued from previous page)
A reconciliation of average common shareholders’ equity, excluding accumulated other comprehensive income (loss) and net operating loss
carryforwards (a non-GAAP financial measure) to average common shareholders’ equity at March 31, 2009, is as follows (dollars in millions):
CIG
Bankers
Colonial Penn
Corporate
Total
Average common shareholders' equity, excluding accumulated
other comprehensive income (loss) and net operating loss
carryforwards (a non-GAAP financial measure)
1,622.5
$
1,239.6
$
112.9
$
(539.4)
$
2,435.6
$
Average net operating loss carryforwards
980.6
Average accumulated other comprehensive income (loss)
(1,805.6)
Average common shareholders' equity
1,610.6
$
Return on equity ratios:
Return on equity
6.1%
Operating return on common equity, excluding accumulated
other comprehensive income (loss) and net operating
loss carryforwards (a non-GAAP financial measure)
2.1%
6.4%
8.5%
NM
5.2%

Information Related to Certain Non-GAAP Financial Measures
A reconciliation of the debt to capital ratio to debt to capital, excluding accumulated other comprehensive loss is as follows (dollars in millions):
Debt to capital ratio, excluding accumulated other comprehensive income (loss)
This non-GAAP financial measure differs from the debt to capital ratio because accumulated other comprehensive income has been excluded
from the value of capital used to determine this measure. Management believes this non-GAAP financial measure is useful because it removes
the volatility that arises from changes in accumulated other comprehensive income. Such volatility is often caused by changes in the estimated
fair value of our investment portfolio resulting from changes in general market interest rates rather than the business decisions made by
management.
Q1 2008
Q2 2008
Q3 2008
Q4 2008
Q1 2009
Corporate notes payable
1,167.7
$
1,167.9
$
1,168.0
$
1,311.5
$
1,310.5
$
Total shareholders' equity
3,954.7
3,395.7
2,716.3
1,630.0
1,591.2
Total capital
5,122.4
4,563.6
3,884.3
2,941.5
2,901.7
Less accumulated other comprehensive loss
565.6
639.2
1,137.7
1,770.7
1,840.5
Total capital, excluding accumulated other comprehensive
loss (a non-GAAP financial measure)
5,688.0
$
5,202.8
$
5,022.0
$
4,712.2
$
4,742.2
$
Corporate notes payable
1,167.7
$
1,167.9
$
1,168.0
$
1,311.5
$
1,310.5
$
Corporate notes payable to capital ratios:
Corporate debt to total capital
22.8%
25.6%
30.1%
44.6%
45.2%
Corporate debt to total capital, excluding
accumulated other comprehensive loss
(a non-GAAP financial measure)
20.5%
22.4%
23.3%
27.8%
27.6%