


Summary
Our goal is stable and predictable investment performance
We invest predominantly in liquid fixed income securities
Our portfolio is actively managed
Our portfolio reflects credit migration and mark-to-market trends consistent
with the credit cycle and market conditions
Our risk controls include intensive fundamental research, credit policy,
diversification, asset liability management, hedging, and compliance
We have experienced investment professionals (including 13 CFA
Charterholders, 2 CPAs, 11 MBAs, and 2 JDs)
Our current priority is the preservation of capital in the context of satisfactory
investment income

Asset Allocation
*Excludes the assets of a variable interest entity we are required to consolidate for GAAP purposes. The carrying value of our investment
in the subordinated debt of the entity was $78 million at March 31, 2009. The entity holds assets primarily consisting of below-investment
grade loans with a book value of $386 million.
As of 3/31/2009
(Allocations based on book values)
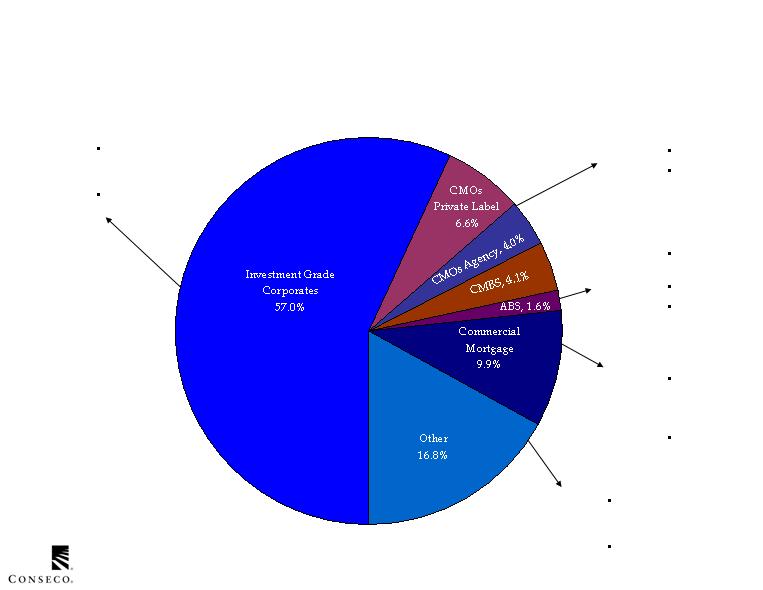
Our diversified investment portfolio is built around
traditional liquid fixed income products*

Asset Allocation
As of 3/31/2009
$Millions
Our mark-to-market is consistent with widened credit spreads
and increased volatility
*Excludes variable interest entity

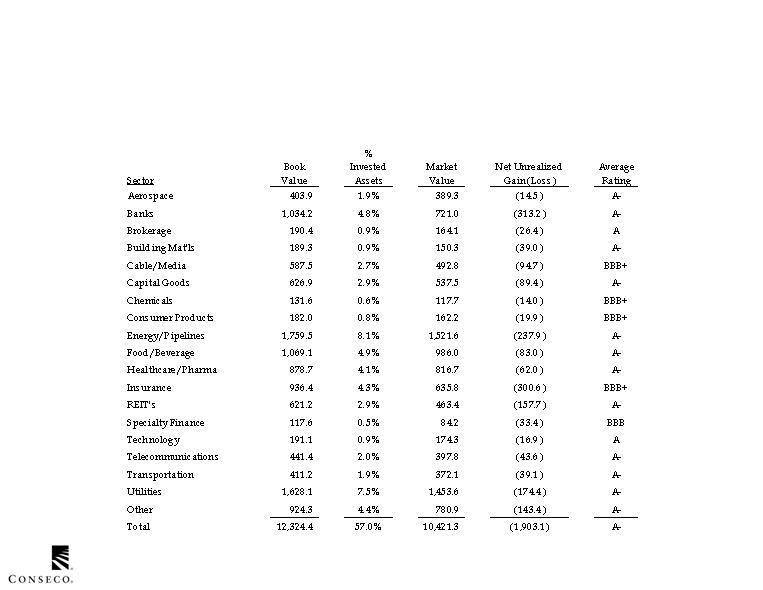
Our diversified IG Corporate allocation (57.0% of portfolio)
emphasizes traditionally non-cyclical sectors
Asset Allocation - Investment Grade Corporates
As of 3/31/2009
(Allocations based on book values)
Asset Allocation - Investment Grade Corporates
As of 3/31/2009
$Millions
In certain IG Corporate sectors, our mark-to-market reflects
significant market illiquidity and event risk (e.g. financials)
*This table excludes non investment grade securities
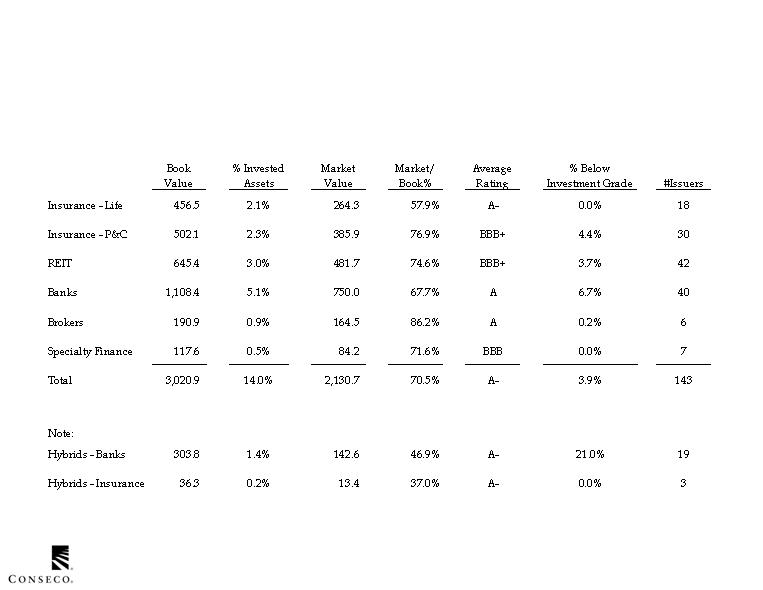
As of 3/31/2009
$Millions
Our exposure to financials (14% of invested assets) is diversified*
* This table includes financial below-investment grade securities
Asset Allocation - Investment Grade Corporates
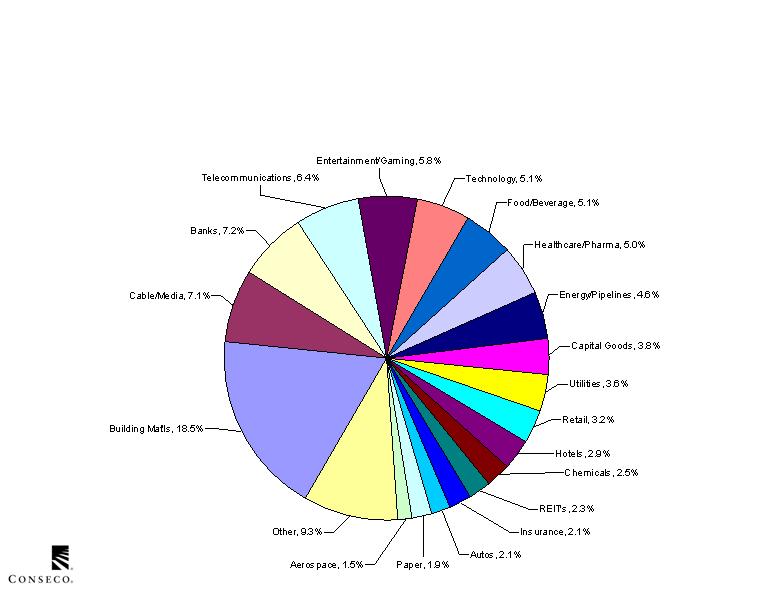
Our BIG Corporate allocation (5.0% of portfolio) is diversified
and weighted away from cyclicals
Asset Allocation – Below-Investment Grade Corporates
As of 3/31/2009
(Allocations based on book values)
As of 3/31/2009
$Millions
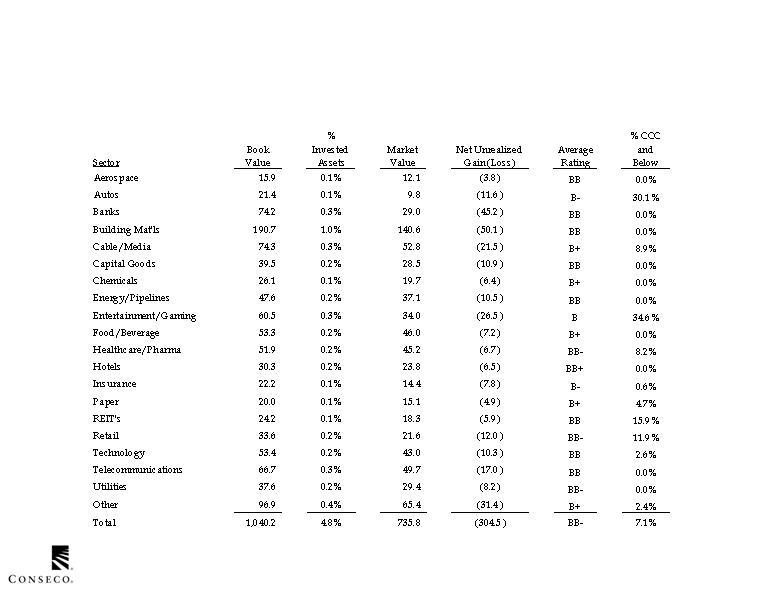
Our BIG Corporates are heavily oriented toward
BB credits: we have limited below B credits
Asset Allocation – Below-Investment Grade Corporates
Asset Allocation – Below-Investment Grade Corporates
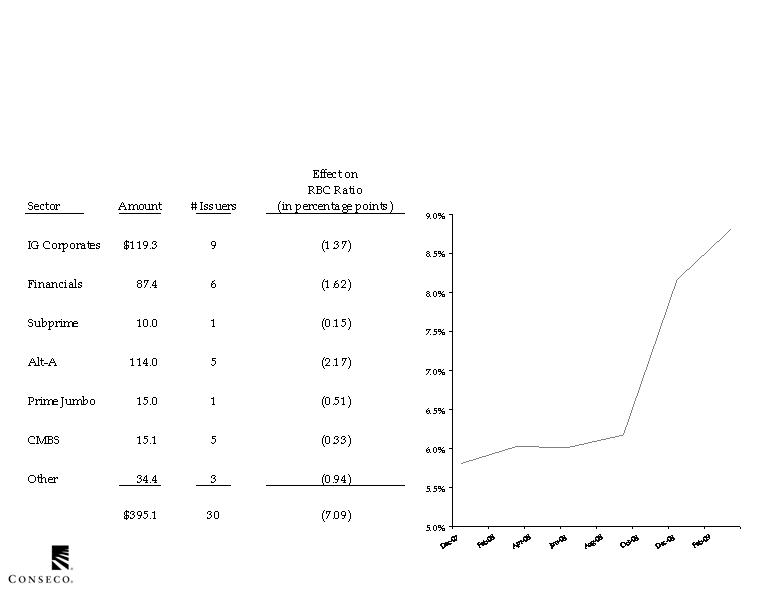
We are investing very little new money in below-investment grade;
experiencing ratings migration trends consistent with the credit cycle
From 1/1/2009 to 3/31/2009
$Millions
BIG Ratio
Downgrades in 1Q 2009
As of 3/31/2009
$Millions
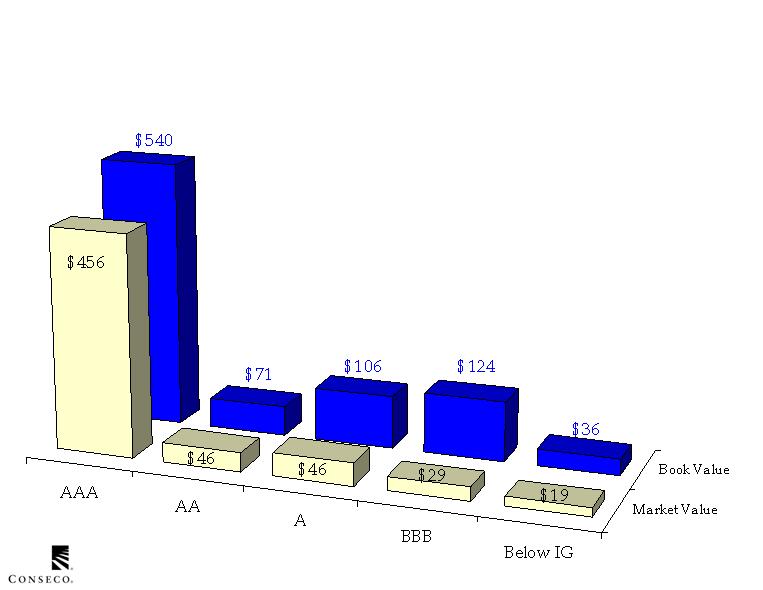
Our CMBS portfolio (4.1% of invested assets) is primarily
comprised of AAA and AA rated securities (70%)
Asset Allocation - CMBS
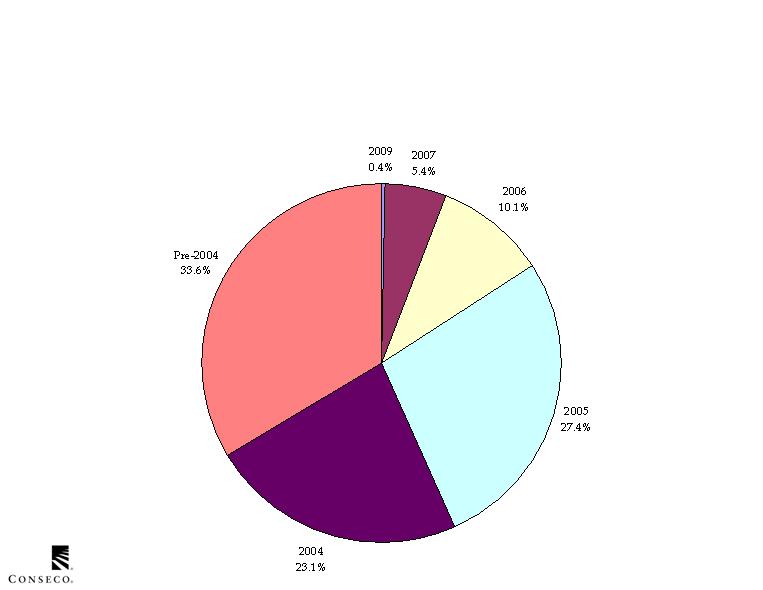
Our CMBS exposure is heavily weighted toward older vintages with stronger qualitative
characteristics and seasoning. We have limited exposure to the 2006 and 2007 vintages.
Asset Allocation - CMBS
As of 3/31/2009
(Allocations based on book values)
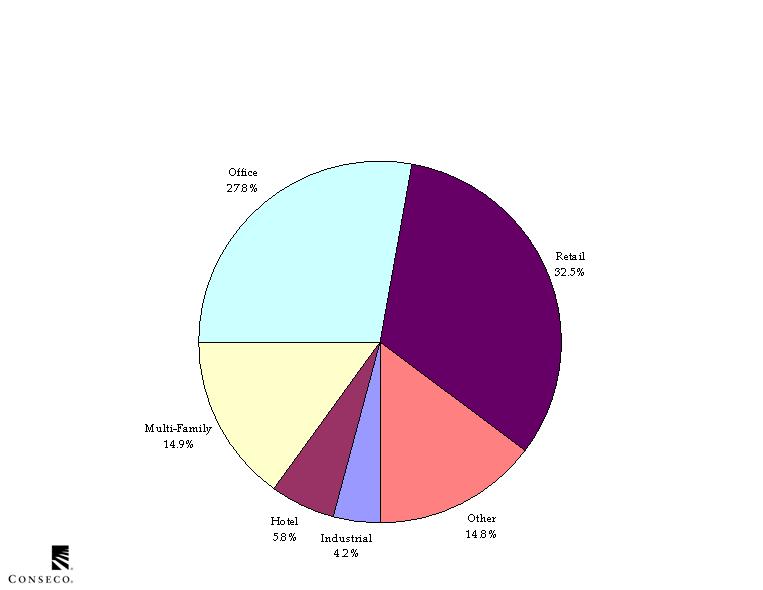
Our CMBS investments are backed by a diverse pool of underlying collateral –
more than 7,905 commercial mortgage loans with a face value exceeding $90 billion
Asset Allocation - CMBS
As of 3/31/2009
(Allocations based on book values)

South
Atlantic
17.9%
New
England
4.5%
East South
Central
2.0%
West South
Central
7.6%
Pacific
18.0%
Middle
Atlantic
20.5%
Mountain
7.1%
West North
Central
2.7%
East North
Central
8.2%
The collateral underlying our CMBS investments is geographically diverse
Multiple
Regions
11.5%
Asset Allocation - CMBS
As of 3/31/2009
(Allocations based on book values)

Delinquencies in the collateral underlying our CMBS are increasing but
are lower than comparable statistics for the entire CMBS market
1.
Source: Intex. Data as of March 31, 2009.
Asset Allocation - CMBS
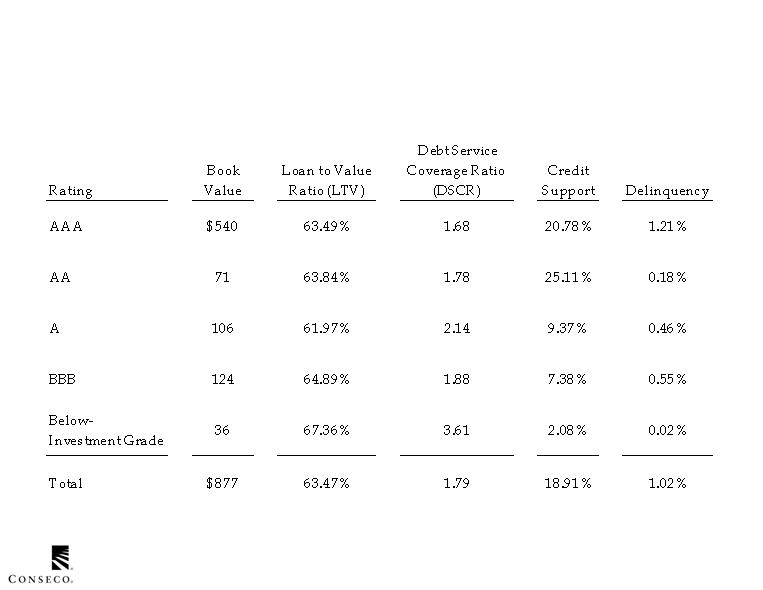
The following summarizes the credit characteristics of our CMBS portfolio
As of 3/31/2009
$Millions
Asset Allocation - CMBS
Asset Allocation - CMBS
Collateral
DSCR
LTV
Occupancy
Cap rate
Rent rolls
Geographic distribution
Industry distribution
Collateral rating/credit grade
distribution
IO loans
NOI trends
TI/LC reserves
Sponsor
Structure
Surveillance
Property/company and
management overview
Origination practices
Underwriting standards
Monitoring and collection
process
Quality control
Special Servicer
rating/strength
Trust structure
Cash flow allocation
Mechanics of credit
enhancement/protection
Stress tests
Rating
Term/Yield/Duration vs.
portfolio
Prepayment projections
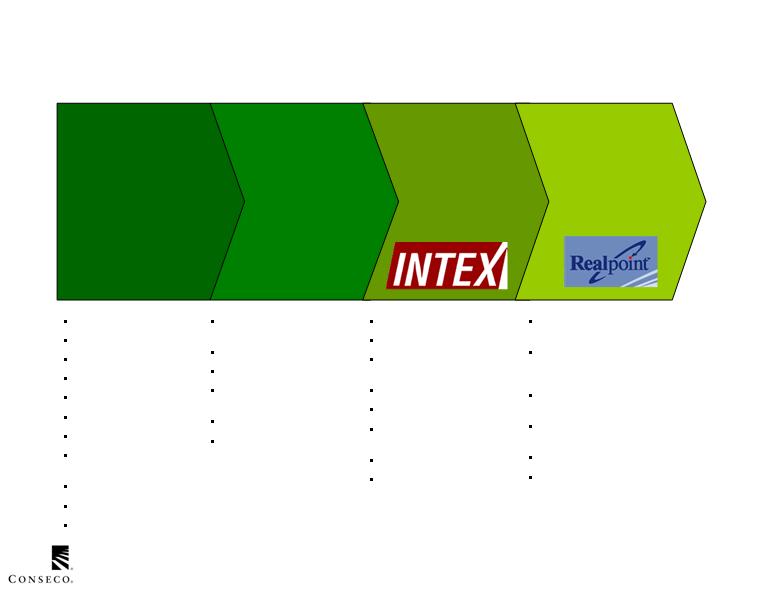
Intex Platform
Monitor rating versus
performance
Identify underperforming
assets/transactions which could
lead to rating change
Projections on defaults
delinquencies, and recoveries
Projected cash flows and credit
support levels
Stress tests
Real Point
We actively track CMBS using a robust underwriting and surveillance process
Our CMO investments (10.6% of the portfolio) are 80% AAA rated
and approximately 40% GSE guaranteed
As of 3/31/2009
$Millions
Asset Allocation - CMO
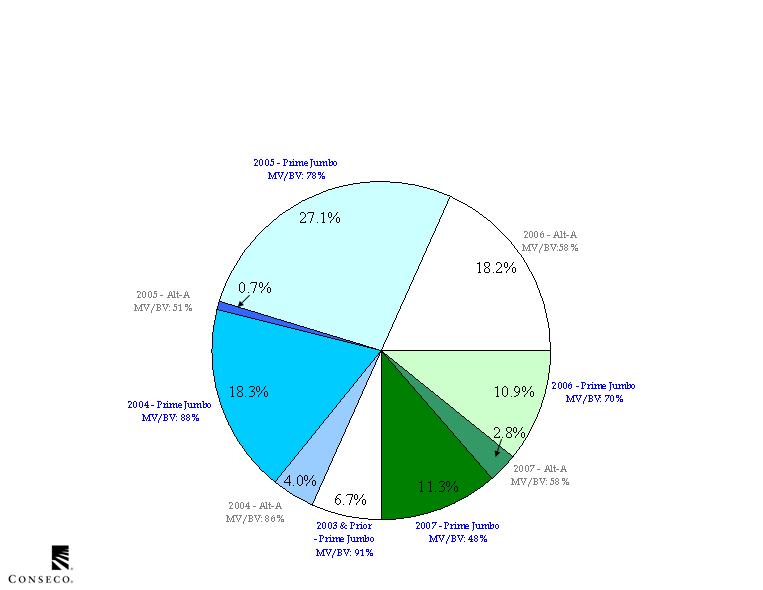
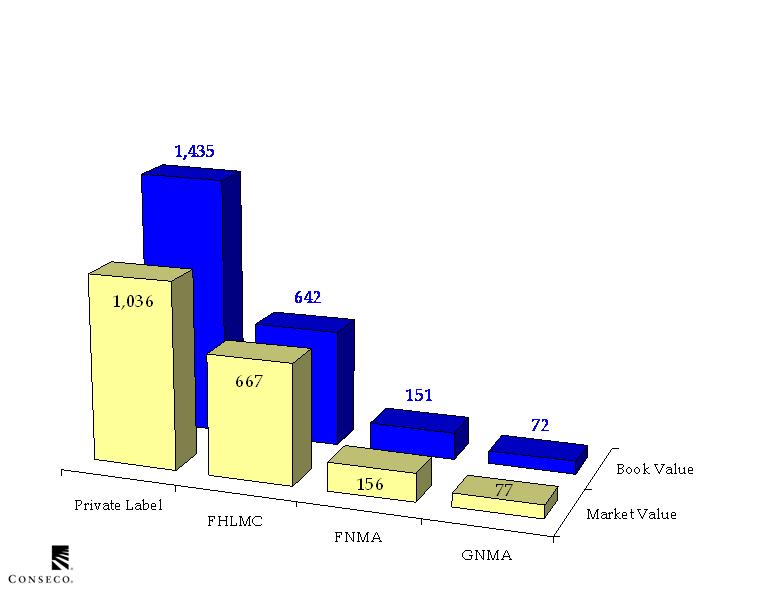
Our private label CMO investments (6.6% of the portfolio)
are 66% AAA rated and diversified by vintage
Asset Allocation - CMO
As of 3/31/2009
(Allocations based on book values)
As of 3/31/2009
$Millions
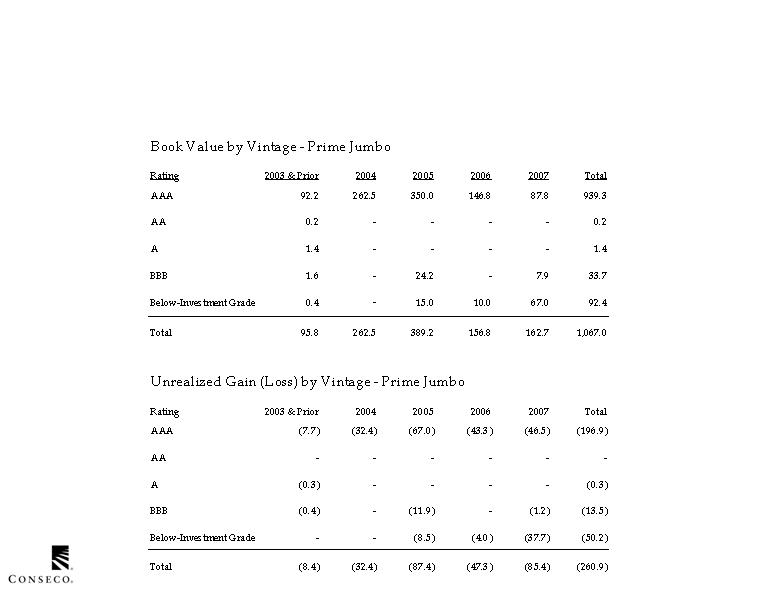
MBS collateralized by prime jumbo loans
comprise 74% of our private label CMO’s
Asset Allocation - CMO
As of 3/31/2009
$Millions
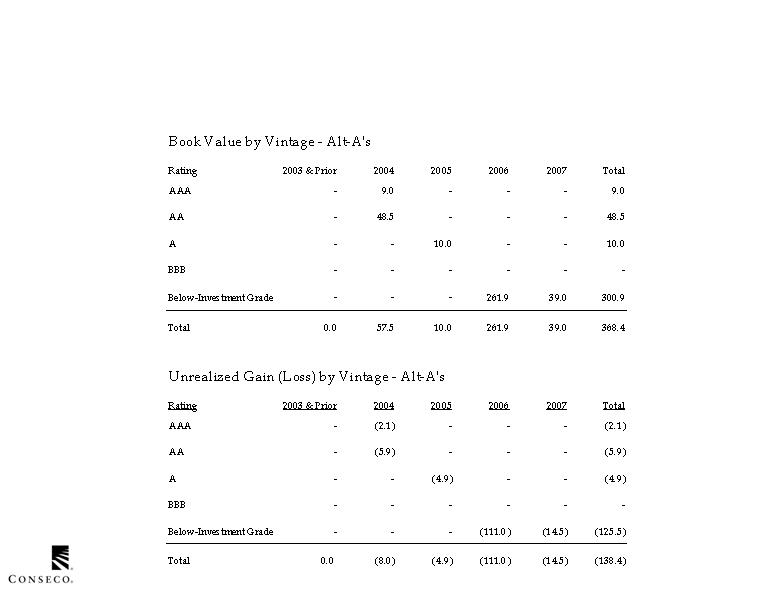
MBS collateralized by Alt-A mortgage loans
comprise 26% of our private label CMO’s
Asset Allocation - CMO
As of 3/31/2009
$Millions
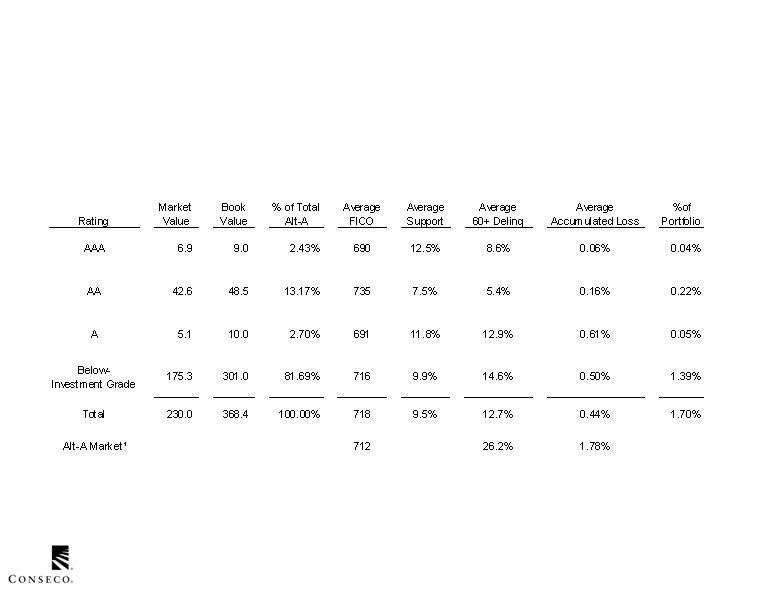
The following summaries the qualitative and credit support characteristics
of our Alt-A securities compared to the general Alt-A market
Asset Allocation - CMO
1.
Source: True Standings. Data as of March 31, 2009
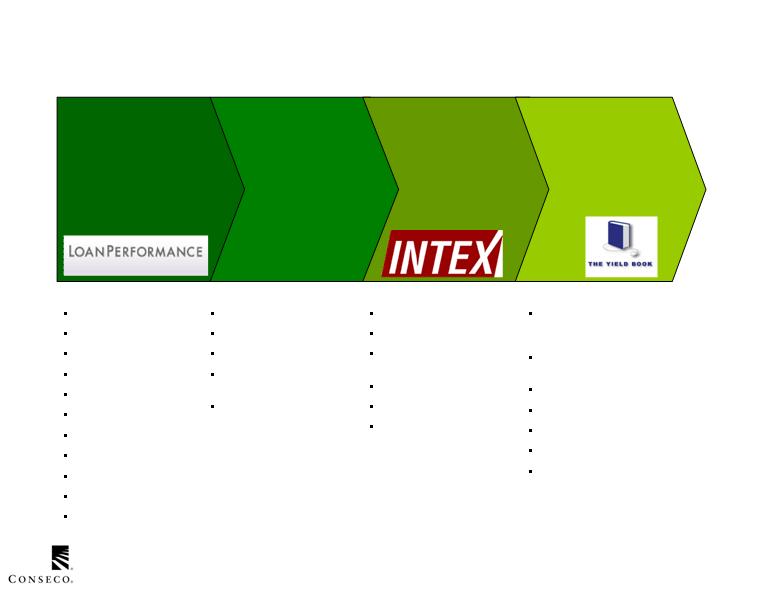
Asset Allocation - CMO
Collateral
Loan-Level analysis
Debt-to-Income
Loan-to-Value
Occupancy type
Geographic distribution
Property value trends
Credit score
IO loans
Documentation
Historical performance
Loan Performance Platform
Sponsor
Structure
Surveillance
Origination practices
Underwriting practices
Servicer quality
Monitoring and collection
process
Quality control
Trust structure
Cash flow allocation
Mechanics of credit
enhancement/protection
Stepdowns
Rating
Intex Platform
Stochastics on defaults,
delinquencies, recoveries,
prepayments, and cash flows
Trends in credit support relative to
delinquencies and losses
Projected cash coverages
Principal payment windows
Projected collateral writedowns
Term/Yield/Duration vs. portfolio
Yield Book Platform
We have a robust analytical process for all residential mortgage securities
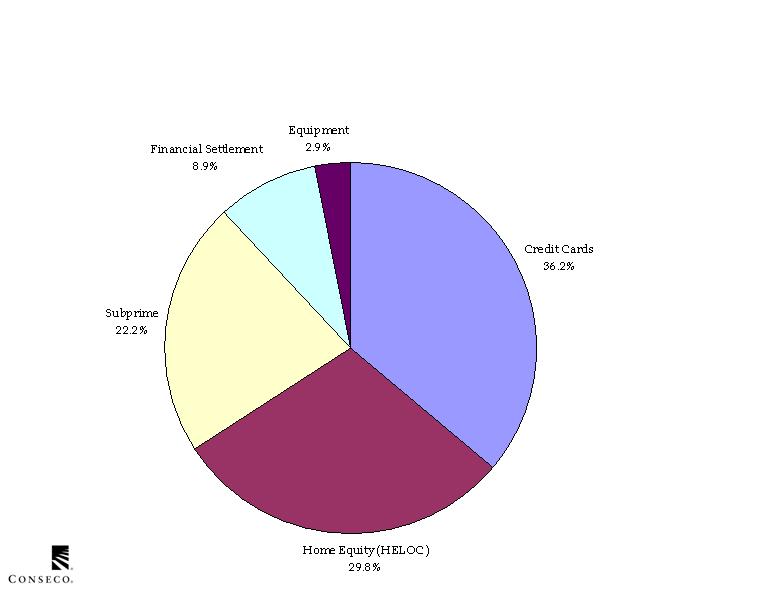
Our ABS allocation represents 1.6% of our portfolio
Asset Allocation - Asset Backed Securities
As of 3/31/2009
(Allocations based on book values)
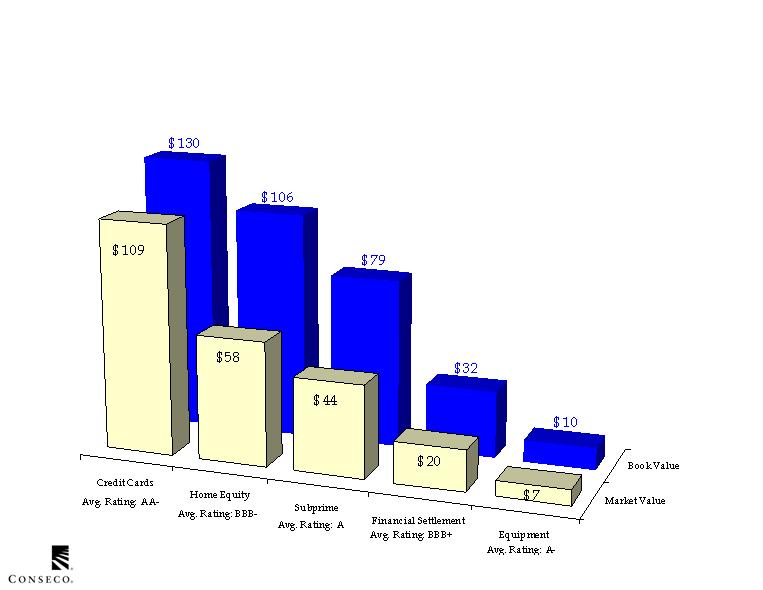
As of 3/31/2009
$Millions
Subprime and home equity valuations reflect the challenging market environment
Asset Allocation - Asset Backed Securities
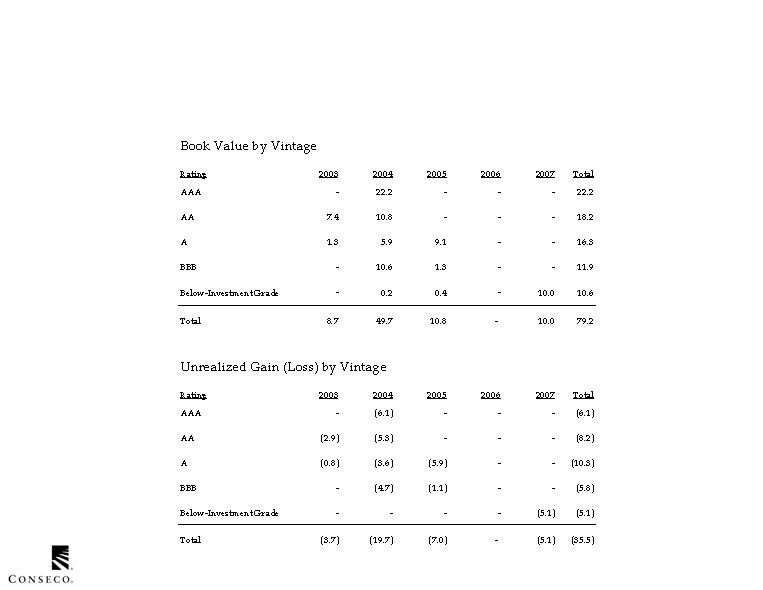
As of 3/31/2009
Subprime represents only 0.4% of our portfolio and
originates mostly in highly seasoned pre-2006 vintages
Asset Allocation - Asset Backed Securities
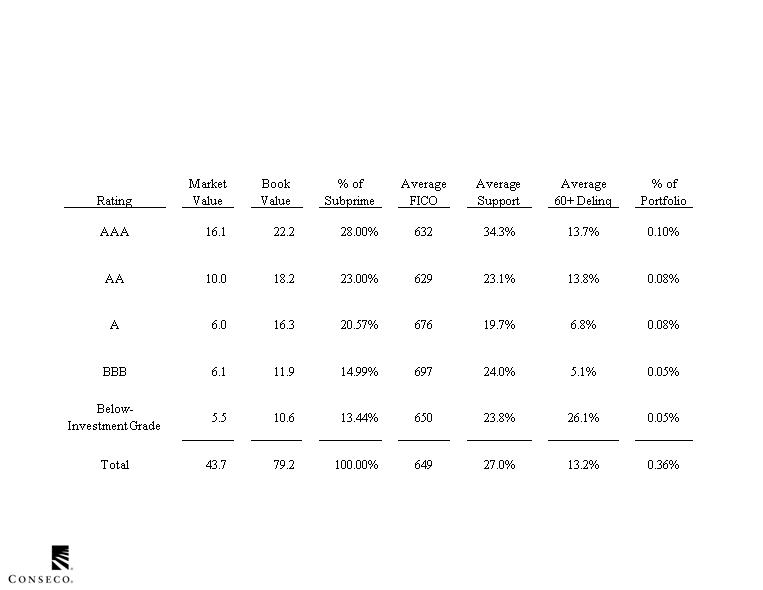
As of 3/31/2009
Asset Allocation - Asset Backed Securities
The following summarizes the credit support and other characteristics
of our Subprime Asset backed securities
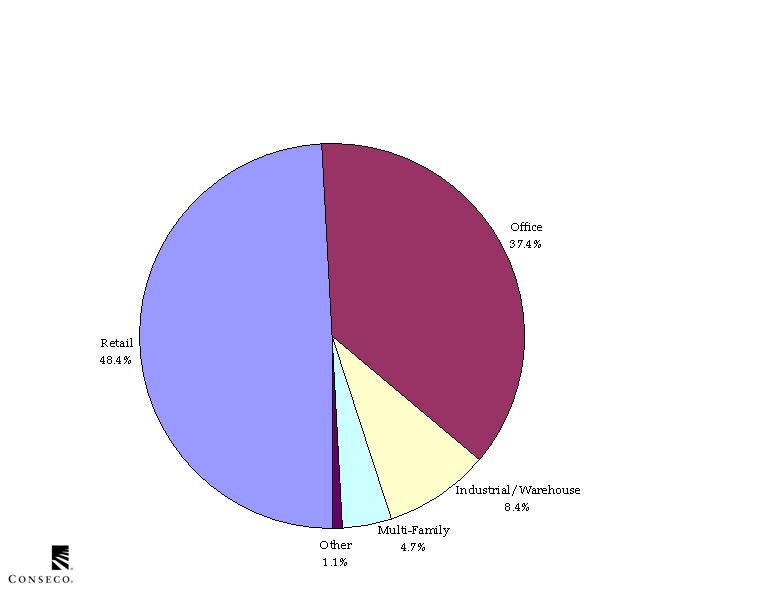
Asset Allocation - Commercial Mortgages
Commercial mortgage loans represent 9.9% of our portfolio
As of 3/31/2009
(Allocations based on book values)

South
Atlantic
21.4%
New
England
8.5%
East South
Central
5.2%
West South
Central
5.9%
Pacific
8.5%
Middle
Atlantic
6.8%
Mountain
10.0%
West North
Central
12.3%
East North
Central
21.4%
Our portfolio of commercial mortgage loans is geographically diversified
Asset Allocation - Commercial Mortgages
As of 3/31/2009
(Allocations based on book values)
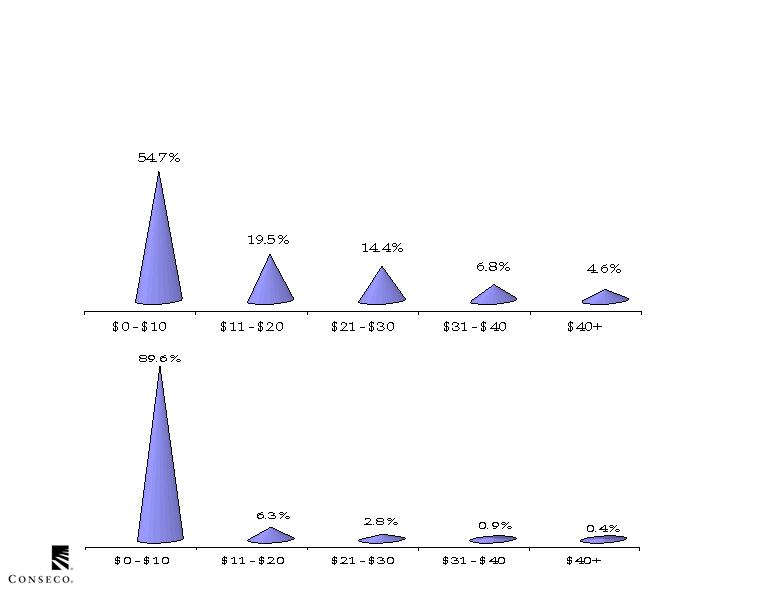
Loan Balance
Number of Loans
Our commercial mortgage portfolio tends toward a large number of
medium sized loans with few large exposures
Asset Allocation - Commercial Mortgages
As of 3/31/2009
(Allocations based on book values)
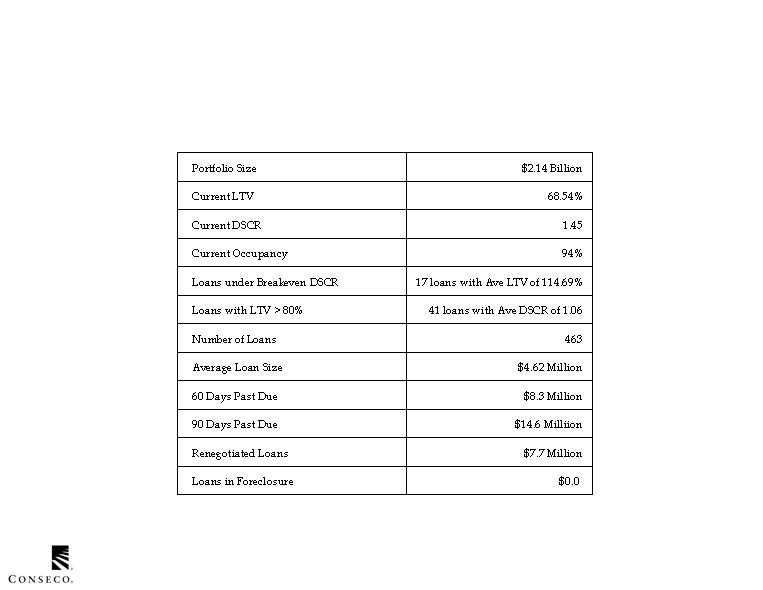
Characteristics of our commercial mortgage loans
Asset Allocation - Commercial Mortgages
As of 3/31/2009
(Dollar amounts are book values)

We take a proactive approach to controlling key investment risks
Risk Management
Measuring quantifiable risks using proven methodologies/market-consistent
values
Documented guidelines for risk policies and risk capacity
Monitoring and enforcing adherence to our risk policies
Extensive use of third parties to value invested assets - independent data
integrity function
Ongoing fundamental credit surveillance at individual credit level
Senior oversight of illiquid capital commitments
Dedicated hedging and asset liability management functions with clear
performance goals
Subprime allocation reflects
severe market discount and
high delinquencies in 2006
and 2007 vintages
HEL allocation reflects market
stresses
Risk Management
Overall mark-to-market and
credit migration consistent
with credit cycle
Pressure on financials
Highly rated, highly liquid
Pressure on ALT-A’s and
prime jumbos
Low, but rising delinquency
trends
Seasoned portfolio
Pricing pressure on BBB
exposure bears careful
surveillance
Increases in delinquencies
could result from slowing
economy
Active surveillance and
portfolio management
We are managing through the credit cycle by emphasizing
long-term assessments of value and quality
As of 3/31/2009
(Allocations based on book values)
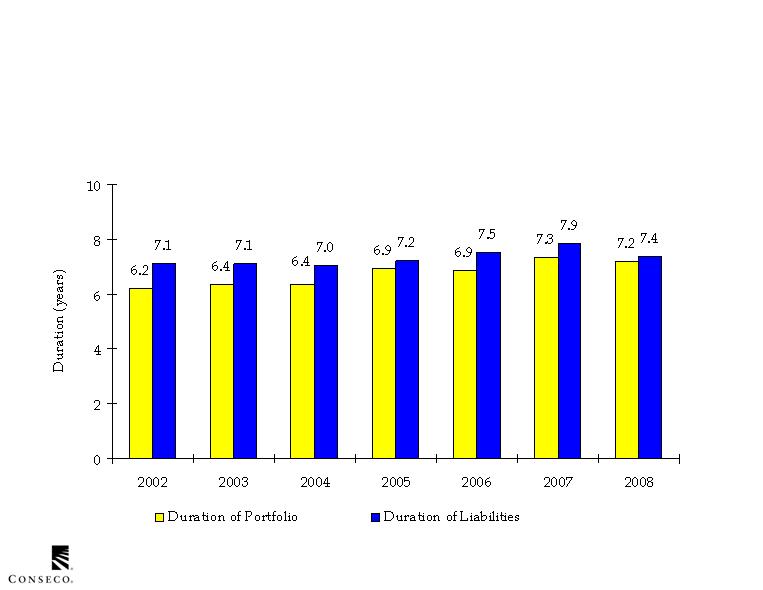
We continue to manage our asset portfolio to
align with our insurance liabilities
As of 12/31/2009
(In years)
Risk Management
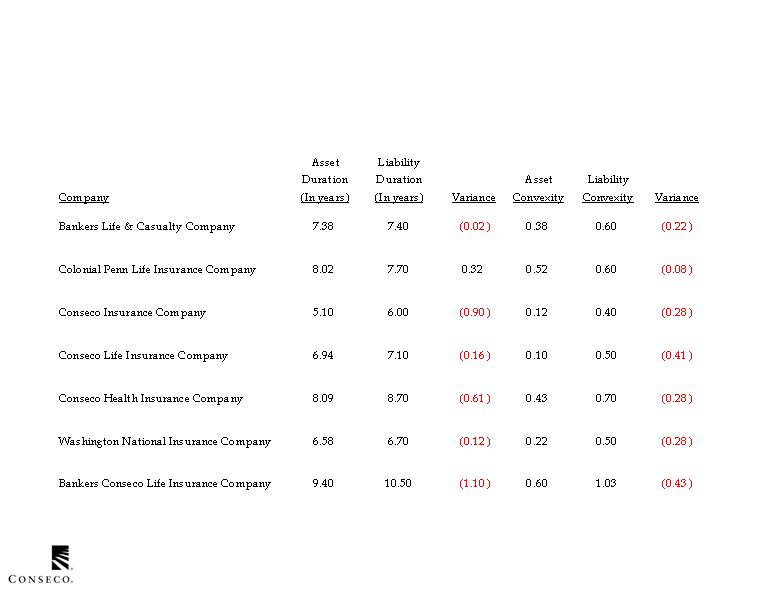
The following summarizes the duration of our assets and liabilities by legal entity
As of 3/31/09
Risk Management
