
Second Quarter 2009
Financial and Operating Results
For the period ended June 30, 2009
Conseco, Inc.
August 5, 2009

Forward-Looking Statements
Cautionary Statement Regarding Forward-Looking Statements. Our statements, trend analyses and other information contained in these
materials relative to markets for Conseco’s products and trends in Conseco’s operations or financial results, as well as other statements, contain
forward-looking statements within the meaning of the federal securities laws and the Private Securities Litigation Reform Act of 1995. Forward-
looking statements typically are identified by the use of terms such as “anticipate,” “believe,” “plan,” “estimate,” “expect,” “project,” “intend,”
“may,” “will,” “would,” “contemplate,” “possible,” “attempt,” “seek,” “should,” “could,” “goal,” “target,” “on track,” “comfortable with,” “optimistic” and
similar words, although some forward-looking statements are expressed differently. You should consider statements that contain these words
carefully because they describe our expectations, plans, strategies and goals and our beliefs concerning future business conditions, our results
of operations, financial position, and our business outlook or they state other ‘‘forward-looking’’ information based on currently available
information. Assumptions and other important factors that could cause our actual results to differ materially from those anticipated in our forward-
looking statements include, among other things: (i) general economic, market and political conditions, including the performance and
fluctuations of the financial markets which may affect our ability to raise capital or refinance existing indebtedness and the cost of doing so; (ii)
our ability to continue to satisfy the financial ratio and balance requirements and other covenants of our debt agreements; (iii) our ability to
generate sufficient liquidity to meet our debt service obligations and other cash needs; (iv) our ability to obtain adequate and timely rate
increases on our supplemental health products including our long-term care business; (v) the receipt of required regulatory approvals for
dividend and surplus debenture interest payments from our insurance subsidiaries; (vi) mortality, morbidity, the increased cost and usage of
health care services, persistency, the adequacy of our previous reserve estimates and other factors which may affect the profitability of our
insurance products; (vii) changes in our assumptions related to the cost of policies produced or the value of policies in force at the effective date
of our emergence from bankruptcy; (viii) the recoverability of our deferred tax asset and the effect of potential ownership changes and tax rate
changes on its value; (ix) changes in accounting principles and the interpretation thereof; (x) our ability to achieve anticipated expense
reductions and levels of operational efficiencies including improvements in claims adjudication and continued automation and rationalization of
operating systems; (xi) performance and valuation of our investments, including the impact of realized losses (including other-than-temporary
impairment charges); (xii) our ability to identify products and markets in which we can compete effectively against competitors with greater
market share, higher ratings, greater financial resources and stronger brand recognition; (xiii) the ultimate outcome of lawsuits filed against us
and other legal and regulatory proceedings to which we are subject; (xiv) our ability to complete the remediation of the material weakness in
internal controls over our actuarial reporting process and to maintain effective controls over financial reporting; (xv) our ability to continue to
recruit and retain productive agents and distribution partners and customer response to new products, distribution channels and marketing
initiatives; (xvi) our ability to achieve eventual upgrades of the financial strength ratings of Conseco and our insurance company subsidiaries as
well as the impact of rating downgrades on our business and our ability to access capital; (xvii) the risk factors or uncertainties listed from time to
time in our filings with the Securities and Exchange Commission; (xviii) regulatory changes or actions, including those relating to regulation of
the financial affairs of our insurance companies, such as the payment of dividends and surplus debenture interest to us, regulation of financial
services affecting (among other things) bank sales and underwriting of insurance products, regulation of the sale, underwriting and pricing of
products, and health care regulation affecting health insurance products; and (xix) changes in the Federal income tax laws and regulations which
may affect or eliminate the relative tax advantages of some of our products. Other factors and assumptions not identified above are also relevant
to the forward-looking statements, and if they prove incorrect, could also cause actual results to differ materially from those projected. All written
or oral forward-looking statements attributable to us are expressly qualified in their entirety by the foregoing cautionary statement. Our forward-
looking statements speak only as of the date made. We assume no obligation to update or to publicly announce the results of any revisions to
any of the forward-looking statements to reflect actual results, future events or developments, changes in assumptions or changes in other
factors affecting the forward-looking statements.

Non-GAAP Measures
This presentation contains the following financial measures that differ from the comparable measures
under Generally Accepted Accounting Principles (GAAP): operating earnings measures; book value,
excluding accumulated other comprehensive income (loss) per share; operating return measures;
earnings before net realized investment gains (losses) and corporate interest and taxes; debt to capital
ratios, excluding accumulated other comprehensive income (loss); and interest-adjusted benefit ratios.
Reconciliations between those non-GAAP measures and the comparable GAAP measures are
included in the Appendix, or on the page such measure is presented.
While management believes these measures are useful to enhance understanding and comparability
of our financial results, these non-GAAP measures should not be considered substitutes for the most
directly comparable GAAP measures.
Additional information concerning non-GAAP measures is included in our periodic filings with the
Securities and Exchange Commission that are available in the “Investor – SEC Filings” section of
Conseco’s website, www.conseco.com.

Q2 2009 Summary
CNO
Second consecutive profitable quarter
EBIT of $86.7 million, up 47% over Q2 2008
Continued profitability in all three insurance segments
Net income of $27.6 million
Core sales* of $91.8 million, down 1% from Q2 2008
Trailing four-quarter premium up 8% over a year ago
Agent recruitment continues to be strong
*Excludes PFFS.

Q2 2009 Summary
CNO
Net realized investment losses of $13.2 million
Total other-than-temporary impairment losses of $53.7 million
$36.6 million recorded in earnings
$17.1 million recorded in accumulated other comprehensive loss
Accumulated other comprehensive loss improved by $793.6
million, to $(1,046.9) million
Book value per share:
Excluding accumulated other comprehensive loss* rose to
$18.72 at 6/30/09 from $18.41 at 12/31/08
Including accumulated other comprehensive loss rose to $13.06
at 6/30/09 from $8.82 at 12/31/08
*See Appendix for corresponding GAAP measure.
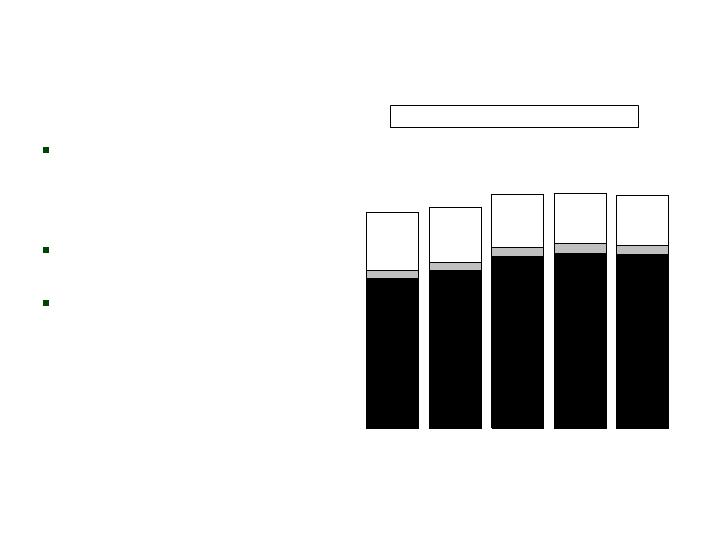
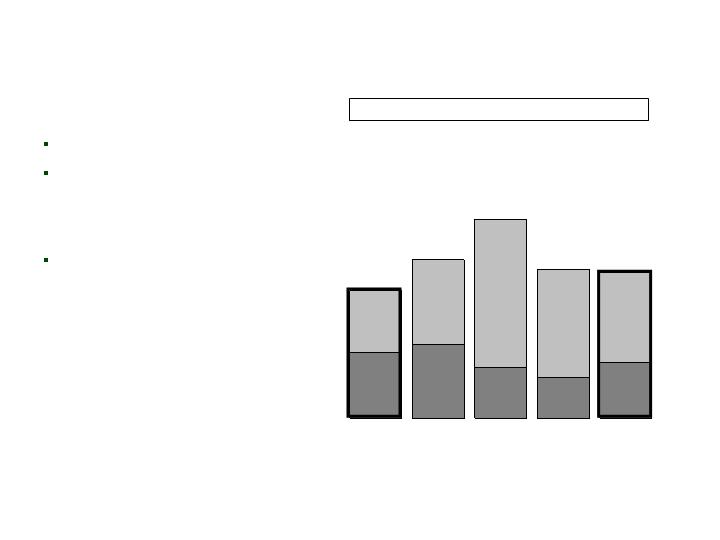
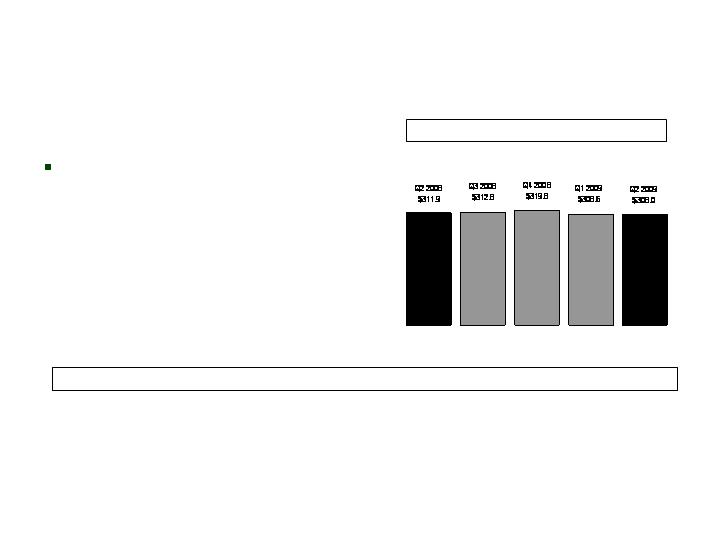
Collected Premiums
CNO
Slight decline at Bankers
due to termination of
PFFS group quota share
contracts
Consistent growth at
Colonial Penn
Slight decline at CIG due
to focus on more
profitable business
BLC
($ millions)
CP
CIG
Collected Premiums-Trailing 4 Quarters
Q2 2008
$4,167.3
Q3 2008
$4,275.1
Q4 2008
$4,524.9
Q1 2009
$4,549.3
Q2 2009
$4,494.9

Bankers Life
Colonial Penn
Conseco Insurance Group
Corporate operations and interest expense
Income before net realized investment losses*
Net realized investment losses
Total
Q2 2009
Summary of Results
CNO
$63.3
11.0
21.2
(32.7)
$62.8
(13.2)
$49.6
Pre-Tax
After Tax
EPS
($ millions, except per-share amounts)
$40.8
(13.2)
$27.6
$0.22
(0.07)
$0.15
*Management believes that an analysis of earnings before net realized investment gains (losses) and increases to
our valuation allowance for deferred tax assets (a non-GAAP financial measure) provides an alternative measure
of the operating results of the company because such items are unrelated to the company’s continuing operations.
The table above provides a reconciliation to the corresponding GAAP measure.
**See Appendix for a reconciliation to the corresponding GAAP measure.
**

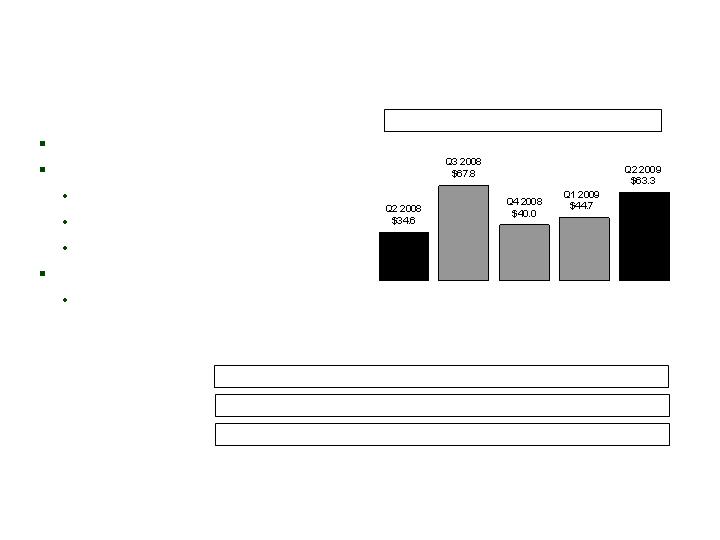
Q2 Earnings
CNO Consolidated
*Management believes that an analysis of earnings before net realized investment gains (losses), losses related to
the transfer of Senior Health to an independent trust (included in Discontinued Operations) and corporate interest
and taxes (“EBIT,” a non-GAAP financial measure) provides an alternative measure to compare the operating
results of the company quarter-over-quarter because it excludes: (1) corporate interest expense; and (2) items that
are unrelated to the company’s continuing operations. The table above provides a reconciliation of EBIT to net
income (loss).
($ millions)
Q2 2008
Q3 2008
Q4 2008
Q1 2009
Q2 2009
Bankers Life
$34.6
$67.8
$40.0
$44.7
$63.3
Colonial Penn
8.3
6.5
6.7
5.1
11.0
Conseco Insurance Group
32.3
34.2
31.5
31.2
21.2
Corporate operations, excluding interest expense
(16.2)
(3.7)
(0.1)
(8.7)
(8.8)
Total EBIT*
59.0
104.8
78.1
72.3
86.7
Corporate interest expense
(16.1)
(15.8)
(17.5)
(13.7)
(23.9)
Gain on extinguishment of debt
0.0
0.0
21.2
0.0
0.0
Expenses related to debt modification
0.0
0.0
0.0
(9.5)
0.0
Income before net realized investment losses, taxes and
discontinued operations
42.9
89.0
81.8
49.1
62.8
Tax expense on period income
17.7
30.7
34.6
17.7
22.0
Net operating income
25.2
58.3
47.2
31.4
40.8
Net realized investment losses
(17.4)
(84.2)
(88.0)
(6.9)
(13.2)
Net income (loss) before valuation allowance for deferred
tax assets and discontinued operations
7.8
(25.9)
(40.8)
24.5
27.6
Valuation allowance for deferred tax assets
(298.0)
0.0
(45.0)
0.0
0.0
Discontinued operations
(198.3)
(157.4)
(367.5)
0.0
0.0
Net income (loss)
($488.5)
($183.3)
($453.3)
$24.5
$27.6
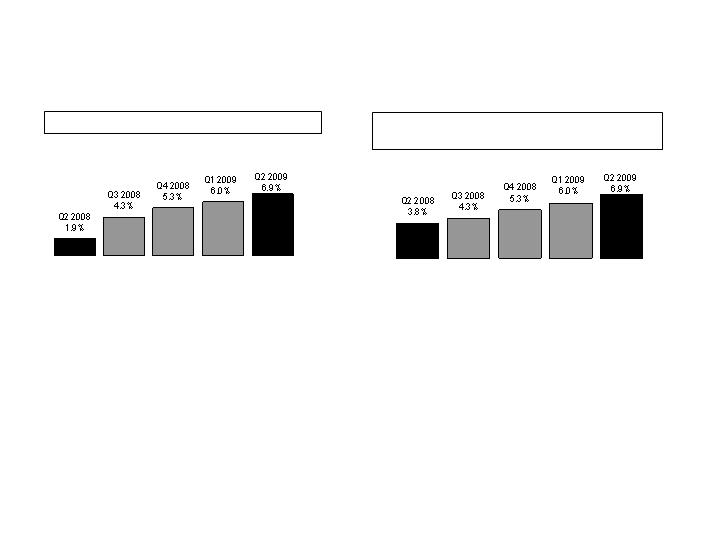
Operating ROE
CNO
Operating ROE*, Trailing 4 Quarters
Operating ROE (Before Annuity Coinsurance
Transaction)**, Trailing 4 Quarters
*Operating return excludes net realized
investment gains (losses), valuation allowance
related to deferred tax assets and discontinued
operations. Equity excludes accumulated other
comprehensive income (loss) and the value of
net operating loss carryforwards, and assumes
conversion of preferred stock. See Appendix for
corresponding GAAP measure.
**Operating return, as calculated and defined on
the left side of this page, but before a Q3 2007
charge related to an annuity coinsurance
transaction. See Appendix for corresponding
GAAP measure.
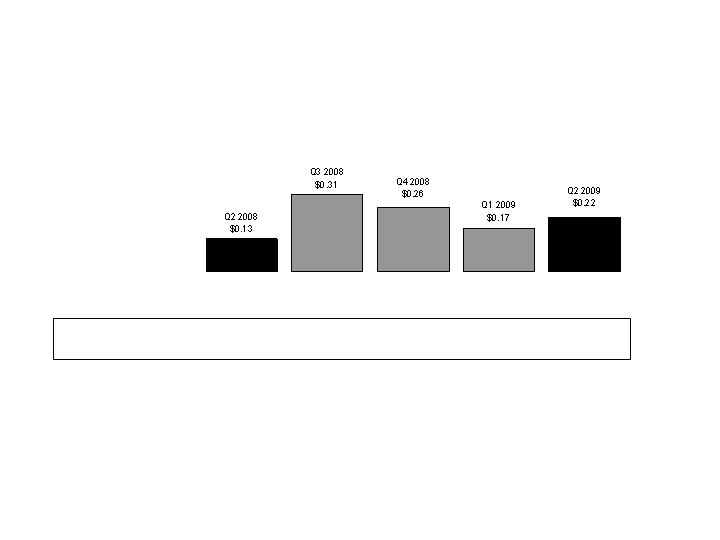
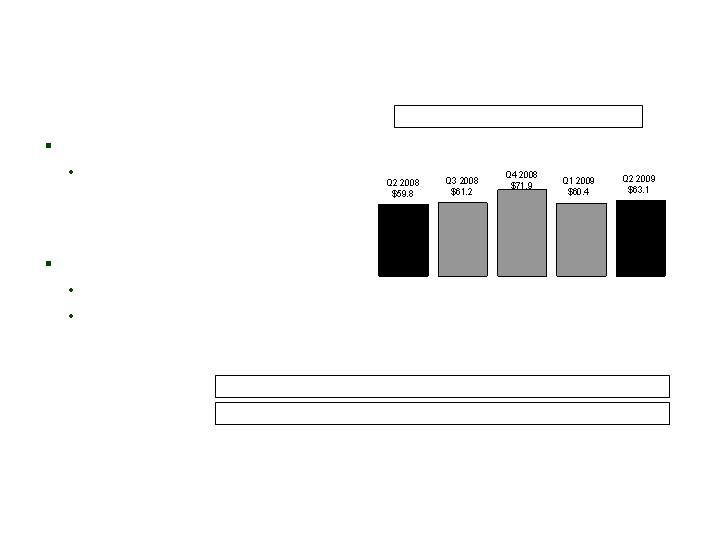
Operating EPS*
CNO
*Operating earnings per share exclude net realized investment gains (losses), valuation allowance related to
deferred tax assets and discontinued operations. See Appendix for corresponding GAAP measure.
**Represents the expected ratio of quarterly Operating EPS to annual Operating EPS, based on
historical experience.
Seasonality of Q2 Q3 Q4 Q1 Q2
Operating EPS** 20-25% 23-28% 26-31% 17-22% 20-25%

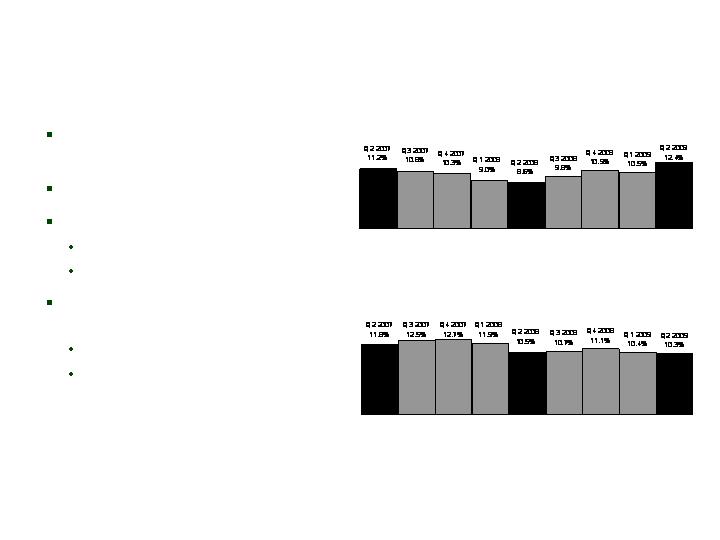
Key Debt Covenants
CNO
*Reflects impact of modification to the covenants which are applicable from March 31, 2009 through June 30,
2010. Effective with the third quarter of 2010, the covenant margins return to Q4 2008 levels.
**Excludes Accumulated Other Comprehensive Income (Loss).
($ millions)
Bank Covenant Debt/Capital Ratio**
Covenant Maximum
Actual
Interest Coverage
Covenant Minimum
Actual
Statutory Capital
Covenant Minimum
Actual
RBC Ratio
Covenant Minimum
Actual
Q2 2009
Covenant Margins as of 6/30/09*
Reduction to statutory capital and
surplus of approximately $242
million, or an increase to the risk-
based capital of approximately
$121 million.
Reduction to combined statutory
capital and surplus of
approximately $179 million.
Reduction in cash flows to the
holding company of
approximately $102 million.
Reduction to shareholders’ equity of
approximately $807 million or
additional debt of $389 million.
Q4 2008
30.0%
28.3%
2.00X
2.35X
$1,270
$1,366
250%
255%
Q1 2009
32.5%
27.9%
1.50X
3.07X
$1,100
$1,301
200%
230%
32.5%
27.0%
1.50X
3.31X
$1,100
$1,279
200%
247%

Liquidity Projection
For Remainder of 2009
CNO
($ millions)
Cash Balance 6/30/09
Sources
Dividends
Surplus Debenture Interest
Management and Investment Fees
Total Sources
Uses
Interest
Debt Repayments:
Senior Credit Facility
Senior Health Note
Holding Company Expenses
Total Uses
Cash Balance 12/31/09
$78.9
$25.0
17.5
30.0
$72.5
$36.7
4.4
25.0
18.4
$84.5
$66.9
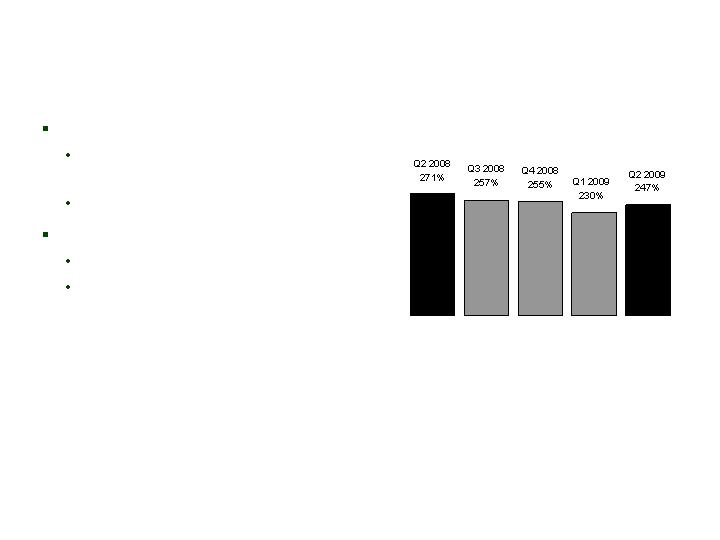
Consolidated RBC Ratio*
CNO
Q2 2009 positive impacts:
Mortgage Experience Adjustment
Factor relief (29 pts)
Statutory operating results (14 pts)
Q2 2009 negative impacts:
Credit rating migration (20 pts)
Net statutory capital losses (7 pts)
*Risk-Based Capital (“RBC”) requirements provide a tool for insurance regulators to determine the levels of
statutory capital and surplus an insurer must maintain in relation to its insurance and investment risks. The
RBC ratio is the ratio of the statutory consolidated adjusted capital of our insurance subsidiaries to RBC.
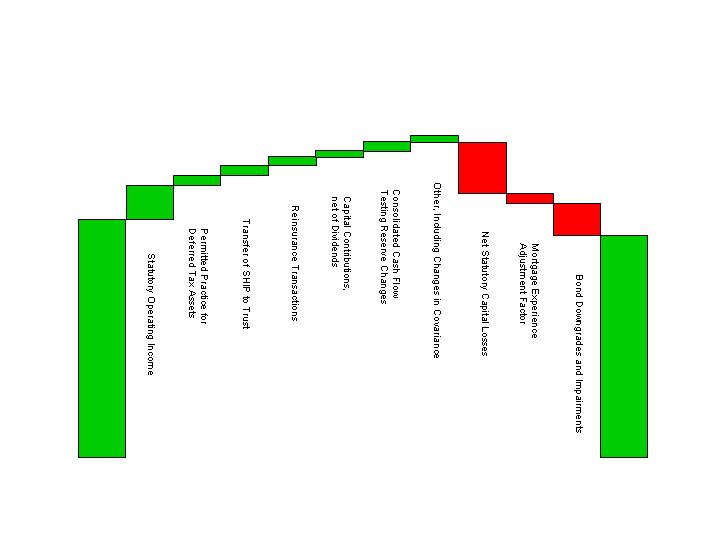
Consolidated RBC Ratio –
Changes Over Last Four Quarters
CNO
6/30/08
RBC
6/30/09
RBC
271%
247%
+39%
+11%
-9%
-38%
-59%
+7%
+9%
+5%
+9%
+2%

Reinsure inforce business – Wilton Re – pro forma +8 pts RBC
Reinsure new business (focus on Bankers)
Modified RGA agreement to increase Bankers LTC reinsurance to
70% on 2009 business
Manage investment portfolio to mitigate RBC impact of ratings
migration
Terminate PFFS quota share agreements with Coventry at
12/31/09 – improves consolidated RBC by 5 pts in 2010
Limit Bankers branch expansion
Reduce direct marketing spending at Colonial Penn
Capital and
Risk Management Initiatives
CNO

Capital Structure
CNO
($ millions)
12/31/08
3/31/09
6/30/09
Credit Facility (10/2013)
$856.8
$853.4
$854.6
Revolving Credit Facility (6/2009)
55.0
55.0
0.0
6% Senior Note ($25 million/year beginning 11/2009)
125.0
125.0
125.0
3.5% Convertible Debentures (9/2010)
293.0
293.0
293.0
Unamortized Discount on Convertible Debentures
(18.3)
(15.9)
(13.3)
Total Corporate Notes Payable
$1,311.5
$1,310.5
$1,259.3
Common Stock
$1.9
$1.9
$1.9
Additional Paid-in Capital
4,104.0
4,105.6
4,108.2
Accumulated Other Comprehensive Loss
(1,770.7)
(1,840.5)
(1,046.9)
Retained Earnings (Accumulated Deficit)
(705.2)
(675.8)
(648.2)
Total Shareholders' Equity
$1,630.0
$1,591.2
$2,415.0
Total Capital
$2,941.5
$2,901.7
$3,674.3

Earnings of $63.3 million, up 83% over Q2 2008:
Higher LTC margins (+$18 million)
Higher Medicare Supplement margins (+$7 million)
Lower benefit ratio
Improved persistency
Increase in COLI surrender value (+$4 million), plus death benefit
recognized (+$3 million)
Continued strong core sales and record agent recruiting
23% increase in new agents YTD
Q2 Summary
Bankers
NAP Results
Core NAP up 6% vs Q2 2008
Strong sales of Annuities (+14%)
and Med Supp (+13%), partially
offset by lower sales of LTC (-8%)
and flat Life sales
PFFS:
Q2 2008 sales reflect chargebacks
YTD 2009 sales down 24% due to
changes in consumer preferences
Bankers
($ millions)
Quarterly Core NAP (Excludes PFFS)
NAP-Quarterly*: $53.4 $65.8 $72.8 $94.5 $69.4
PFFS NAP-Quarterly*: $(6.4) $4.6 $0.9 $34.1** $6.3
*Excludes group business not sold by Bankers agents.
**Net of $7 million reserve for anticipated chargebacks related to sales still within their 90-day disenrollment period.

Continued growth in agent force
Average agent count YTD 5,183, up 11% vs. first six months of
2008
Coventry’s decision to exit PFFS for 2010 not expected to
disrupt distribution
During Q2 2009, announced strategic alliance with Humana to
begin selling their Medicare Advantage plans
Bankers agents have relationship with PFFS members; able to
offer these customers multiple solutions, including Med Supp
Q2 2009 Sales and
Distribution Results
Bankers

As previously announced, Coventry is exiting PFFS business effective
12/31/09
PFFS relationship terminates; affects approximately 55,000 Bankers-sold PFFS
members, partially reinsured by Bankers
PDP relationship (distribution and reinsurance) remains unchanged
Entered distribution agreement with Humana
Humana well positioned to compete in evolving Medicare Advantage space with
network-based Medicare Advantage plans in most markets
For 2010 enrollment, expecting Bankers agents to be able to offer Medicare
Advantage plans to approximately 95% of current PFFS members
Sales opportunity in 2010 to enroll existing PFFS members in either Humana
Medicare Advantage plans or Bankers Medicare Supplement plans
Fee-only arrangement, while expected to produce slightly lower earnings, reduces
both earnings volatility and statutory capital requirements (+5 pts in consolidated
RBC ratio)
Medicare Advantage
Bankers
Annuity Sales
Annuity sales up 14% vs Q2 2008
SEC designation of indexed
annuities as securities (Rule 151A)
not expected to significantly impact
Bankers total annuity sales
Majority of Bankers branch offices
maintain one or more registered
reps to assist clients with portfolio
management and broker securities
Bankers
Indexed
Annuities
Annuities – NAP*
Q2 2008
$15.6
Q3 2008
$19.4
Q4 2008
$24.4
Fixed
Annuities
($ millions)
*Calculated as 6% of annuity deposits.
Q1 2009
$18.2
$7.6
$8.0
$9.0
$10.4
$18.2
$6.2
$5.0
$13.2
$6.8
$11.0
Q2 2009
$17.8
Indexed Annuity surrenders
higher
Non-IA surrenders stable
Average account value:
IAs - $41,000
Non-IAs - $35,000
Over 89% of our annuities are
still in surrender charge period:
IAs – 95%
Non-IAs – 87%
Annuity Surrenders
Bankers
IA Surrenders
(annualized quarterly rate)
Non-IA Surrenders
(annualized quarterly rate)

Rate increases ahead of schedule (2008 round – policies
issued prior to 2002); expect to exceed original goals
Filed $102.5 million of rate increases = 100% of original goal
As of 6/30/09:
Approvals = $70.9 million, 100% of original goal
Projected financial impact = $53.2 million, 100% of original goal
Continued focus on claims management/underwriting
New products
LTC/Annuity Combo product launched in June 2009
LTC product revision in Q3 2009, with rates reflecting current
claim experience and in line with target profit margins
LTC Update
Bankers

Q2 Earnings
Bankers
Management believes that an analysis of income (loss) before net realized investment gains (losses), net of
related amortization (a non-GAAP financial measure), is important to evaluate the financial performance of our
business, and is a measure commonly used in the life insurance industry. Management uses this measure to
evaluate performance because realized gains or losses can be affected by events that are unrelated to a
company’s underlying fundamentals. The table on Page 8 reconciles the non-GAAP measure to the
corresponding GAAP measure. See Appendix for a reconciliation of the return on equity measure to the
corresponding GAAP measure.
Trailing 4 Quarter Operating Return on Equity: 8.7%
($ millions)
Q2 2008
Q3 2008
Q4 2008
Q1 2009
Q2 2009
Insurance policy income
$543.4
$537.7
$531.8
$491.5
$497.6
Net investment income
135.2
138.3
155.4
142.2
163.6
Fee revenue and other income
2.1
3.1
4.2
1.4
1.6
Total revenues
680.7
679.1
691.4
635.1
662.8
Insurance policy benefits
497.2
470.3
477.5
429.6
422.9
Amounts added to policyholder account balances
37.2
46.2
82.3
37.6
64.2
Amortization related to operations
66.6
53.5
39.7
75.6
63.1
Other operating costs and expenses
45.1
41.3
51.9
47.6
49.3
Total benefits and expenses
646.1
611.3
651.4
590.4
599.5
Income before net realized investment gains (losses),
net of related amortization and income taxes
$34.6
$67.8
$40.0
$44.7
$63.3

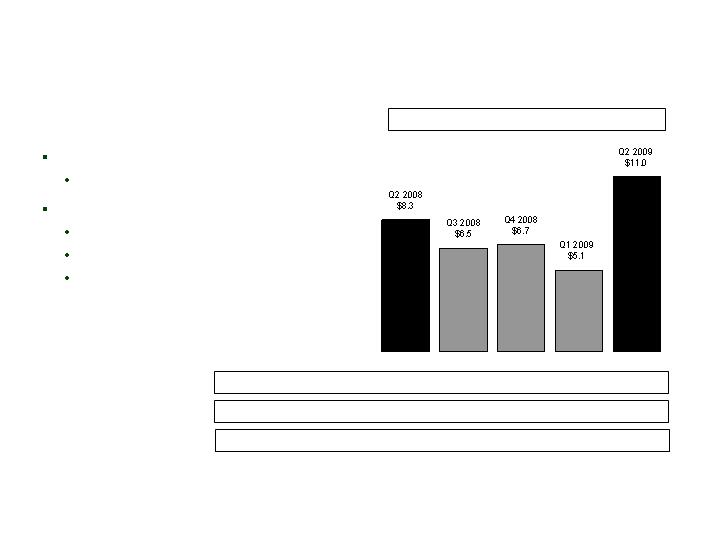
Earnings of $11.0 million, up 33% over Q2 2008
Increase primarily driven by distributions from a terminated
reinsurance pool (+$3 million)
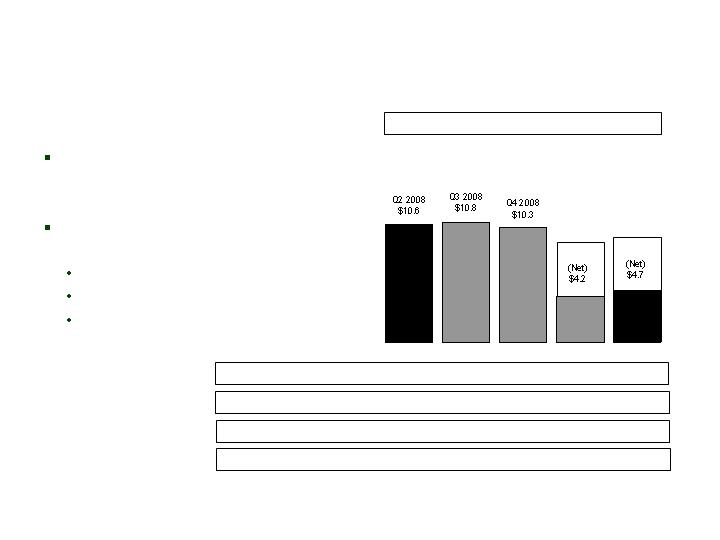
Life sales of $10.6 million, down 27% from Q2 2008
Consistent with cost reductions undertaken earlier this year as
part of our capital management efforts
YTD marketing costs associated with lead-based advertising and
related fulfillment costs were reduced by $9.3 million (38%)
YTD campaign productivity remains strong
Q2 Summary
Colonial Penn

Q2 Earnings
Colonial Penn
Management believes that an analysis of income (loss) before net realized investment gains (losses), net of
related amortization (a non-GAAP financial measure), is important to evaluate the financial performance of our
business, and is a measure commonly used in the life insurance industry. Management uses this measure to
evaluate performance because realized gains or losses can be affected by events that are unrelated to a
company’s underlying fundamentals. The table on Page 8 reconciles the non-GAAP measure to the
corresponding GAAP measure. See Appendix for a reconciliation of the return on equity measure to the
corresponding GAAP measure.
Trailing 4 Quarter Operating Return on Equity: 14.1%
($ millions)
Q2 2008
Q3 2008
Q4 2008
Q1 2009
Q2 2009
Insurance policy income
$47.5
$46.4
$46.5
$47.1
$52.7
Net investment income
10.1
10.1
10.2
9.8
9.8
Fee revenue and other income
0.5
0.5
0.5
0.2
0.2
Total revenues
58.1
57.0
57.2
57.1
62.7
Insurance policy benefits
35.5
33.9
33.8
36.1
36.0
Amounts added to policyholder account balances
0.3
0.3
0.3
0.3
0.2
Amortization related to operations
7.4
9.2
8.0
8.4
8.0
Other operating costs and expenses
6.6
7.1
8.4
7.2
7.5
Total benefits and expenses
49.8
50.5
50.5
52.0
51.7
Income (loss) before net realized investment
gains (losses) and income taxes, net of
related amortization
$8.3
$6.5
$6.7
$5.1
$11.0

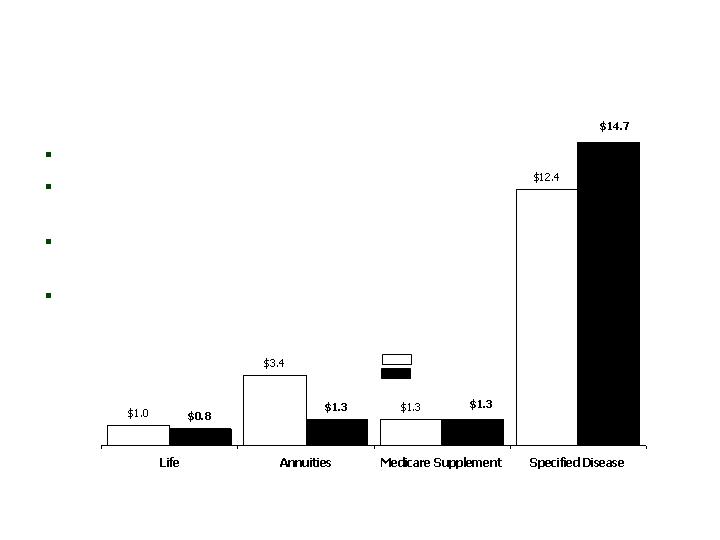
Earnings of $21.2 million, down 34% vs Q2 2008:
Lower Annuity results due to higher surrenders (-$10 million)
Lower LTC margins (-$4 million)
Lower Specified Disease margins (-$2 million)
Partially offset by higher Life margins due to favorable mortality
(+$7 million)
Continued strong sales growth in Specified Disease products
and strong agent recruiting
Q2 Summary
CIG
CIG
($ millions)
Specified Disease sales up 18% over Q2 2008
Worksite sales continue strong momentum,
up 13% YTD
Strong recruiting results, with 126 new
recruits for PMA and 502 for CIG Sales
Decrease in Annuity sales, consistent with
CIG’s re-focus
Q2 2008
Q2 2009
Q2 2009 Sales and
Distribution Results
IA surrenders slightly down from Q1
2009, but up significantly over 2008
due to market value adjustment
feature included in some products
Non-IA surrenders stable
Average account value:*
IAs - $44,700
Non-IAs - $20,500
65% of our annuities are still in
surrender charge period:*
IAs – 99%
Non-IAs – 34%
Annuity Surrenders
CIG
IA Surrenders
(annualized quarterly rate)
Non-IA Surrenders
(annualized quarterly rate)
*Statistics based on account value and GAAP reserves.

Q2 Earnings
CIG
Management believes that an analysis of income (loss) before net realized investment gains (losses), net of
related amortization (a non-GAAP financial measure), is important to evaluate the financial performance of our
business, and is a measure commonly used in the life insurance industry. Management uses this measure to
evaluate performance because realized gains or losses can be affected by events that are unrelated to a
company’s underlying fundamentals. The table on Page 8 reconciles the non-GAAP measure to the
corresponding GAAP measure. See Appendix for a reconciliation of the return on equity measure to the
corresponding GAAP measure.
Trailing 4 Quarter Operating Return on Equity: 2.2%
($ millions)
Q2 2008
Q3 2008
Q4 2008
Q1 2009
Q2 2009
Insurance policy income
$239.1
$237.7
$238.4
$244.2
$241.0
Net investment income
138.7
134.0
143.7
134.3
141.1
Fee revenue and other income
0.5
0.1
0.3
0.7
0.4
Total revenues
378.3
371.8
382.4
379.2
382.5
Insurance policy benefits
208.6
203.6
199.6
214.1
215.1
Amounts added to policyholder account balances
37.1
42.7
38.4
35.8
42.7
Amortization related to operations
31.2
24.9
36.3
36.8
33.8
Interest expense on investment borrowings
5.5
5.6
5.5
5.2
5.2
Other operating costs and expenses
63.6
60.8
71.1
56.1
64.5
Total benefits and expenses
346.0
337.6
350.9
348.0
361.3
Income before net realized investment gains (losses),
net of related amortization and income taxes, excluding
costs related to the litigation settlement and the loss
related to an annuity coinsurance transaction
$32.3
$34.2
$31.5
$31.2
$21.2

Q2 2009
Net Realized Losses
CNO
Gains on sales
Losses on sales
Losses due to recognition of other-
than-temporary impairments
Amortization adjustment to insurance
intangibles
Net investment losses before tax
Tax benefit
Increase to tax valuation allowance
Net investment losses after tax
($ millions)
-
-
$(17.1)
1.9
(15.2)
(5.4)
-
$(9.8)
$83.6
(63.3)
(53.7)
5.0
(28.4)
(10.0)
4.6
$(23.0)
$83.6
(63.3)
(36.6)
3.1
(13.2)
(4.6)
4.6
$(13.2)
Gross
Amounts
Amount Recognized
through Accumulated
Other Comprehensive
Income
Amount Recognized
through Net Income

Q2 2009 Downgrades from Investment
Grade to Below Investment Grade
CNO
IG Corporates
Financials
Alt-A
Prime Jumbo
Other
Total
($ millions)
$98.6
81.7
13.2
176.6
46.6
$416.7
7
6
1
8
2
24
(0.9%)
(0.8%)
(0.1%)
(5.4%)
(2.3%)
(9.5%)
Type
Statutory Book
Value
# Issues
Effect of
Downgrades on
RBC Ratio*
*Includes estimated effect of covariance and tax.

Q2 2009
Impairment Losses
CNO
Below-Investment Grade Corporates
Financials*
Subprime
Alt-A
CMBS
Commercial Mortgages
Other
Total
($ millions)
Gross
Amounts
Amount Recognized
through Accumulated
Other Comprehensive
Income
Amount Recognized
through Net Income
*Includes $13.8 million of writedowns on CIT Group investment. Remaining market value was
$8.9 million.
$1.9
17.3
6.7
9.3
1.7
14.8
2.0
$53.7
$0.0
0.0
6.0
8.2
1.6
0.0
1.3
$17.1
$1.9
17.3
0.7
1.1
0.1
14.8
0.7
$36.6
Investment Quality:
Fixed Maturities*
CNO
Investment-grade bonds at
91%, unchanged from 3/31/09:
Sales of below investment-
grade bonds offset the
negative impact of credit
cycle-related ratings migration
Actively Managed Fixed Maturities by Rating at
6/30/09 (Market Value)
6/30/09
91%
3/31/09
91%
12/31/08
92%
9/30/08
93%
6/30/08
93%
% of Bonds which are Investment Grade:
*Excludes investments from a variable interest entity which we consolidate under GAAP (the related liabilities are
non-recourse to Conseco).
AAA
14%
AA
6%
A
31%
BBB
40%
<BBB
9%
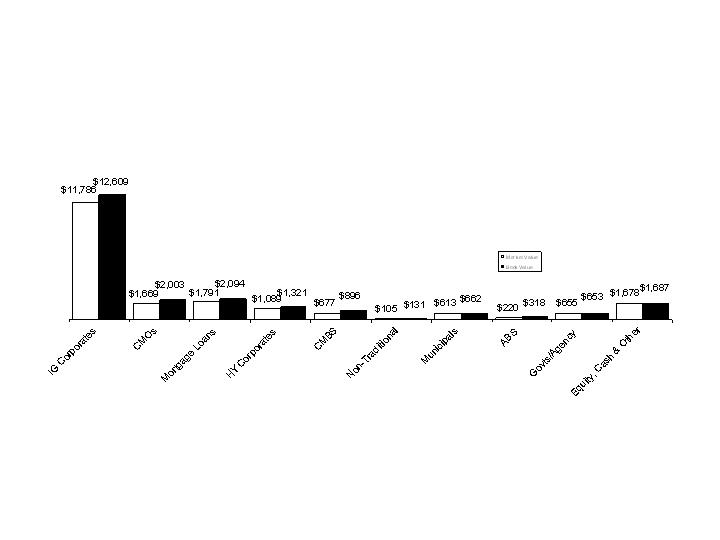
Asset Allocation at 6/30/09*
MTM reflects generally tighter spreads
during Q2 2009
CNO
($ millions)
*Excludes investments from a variable interest entity which we consolidate under GAAP (the related liabilities are
non-recourse to Conseco).

Alt-A at 6/30/09
CNO
AAA
AA
A
BBB
<BBB
Total
$7.0
$45.8
$6.7
$0.9
$139.2
$199.6
$8.8
$55.5
$10.0
$4.2
$232.3
$310.8
3.5%
23.0%
3.3%
0.4%
69.8%
100.00%
0.03%
0.23%
0.03%
0.00%
0.69%
0.98%
Market
Value (mil.)
Book
Value (mil.)
% of
Alt-A*
% of
Portfolio*
Rating
Allocation reduced by 36% (book value) from 12/31/08 to 6/30/09
No exposure to “affordability products” – option ARMs, hybrid, neg-ams
While delinquencies are higher than anticipated, collateral performing materially better
than overall Alt-A market in terms of delinquency and average accumulated loss
Adequate credit support inherent in structures relative to expected cumulative losses
691
729
691
694
712
714
Avg.
FICO
12.8%
8.9%
11.8%
18.7%
6.8%
7.7%
Avg.
Support
10.5%
6.7%
13.3%
11.1%
11.5%
10.4%
Avg. 60+
Delinq.
*% of market value
($ millions)
0.07%
0.41%
0.77%
4.02%
1.08%
0.89%
Avg. Accum.
Loss

Sub-Prime ABS at 6/30/09
CNO
AAA
AA
A
BBB
<BBB
Total
$15.6
$7.6
$5.2
$6.8
$3.5
$38.7
$21.9
$13.7
$17.2
$13.3
$9.3
$75.4
40.3%
19.6%
13.4%
17.5%
9.2%
100.0%
0.08%
0.04%
0.03%
0.03%
0.02%
0.20%
Market
Value (mil.)
Book
Value (mil.)
% of
Subprime*
% of
Portfolio*
Rating
Only $23 million (book value) rated BBB or lower (0.05% of invested assets)
No exposure to “affordability products” – negative amortization, option ARM
collateral, etc.
While delinquencies have increased, consistent with market conditions, portfolio
generally reflects satisfactory margin for adverse collateral performance
633
632
662
684
652
651
Avg.
FICO
34.6%
23.5%
21.8%
23.3%
20.4%
25.9%
Avg.
Support
16.2%
13.4%
9.9%
7.6%
30.1%
14.5%
Avg. 60+
Delinq.
*% of market value
($ millions)
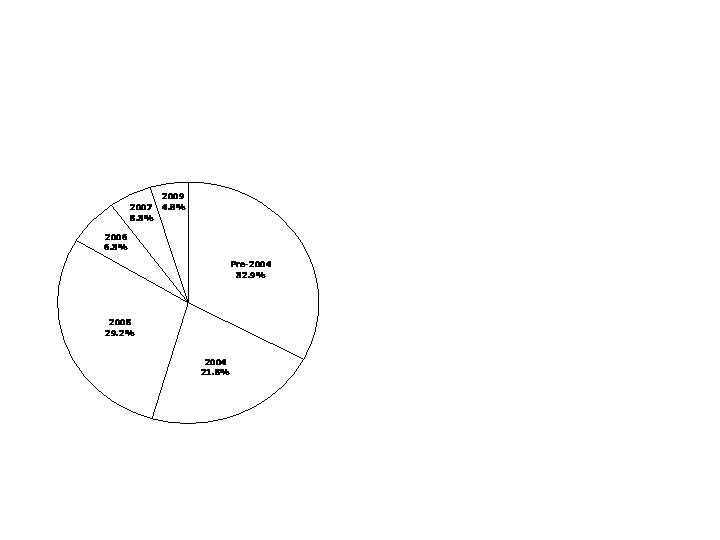
CMBS by Vintage at 6/30/09
Our CMBS exposure is heavily weighted toward securities with
high ratings and seasoned vintages with relatively stronger
qualitative characteristics
CNO
(GAAP book value - $ millions)
$206.6
$153.2
$150.2
$0.0
$47.1
$43.0
$600.1
$540.2
$34.2
$3.0
$2.2
$14.7
$0.0
$0.0
$54.1
$35.7
$42.3
$16.5
$31.9
$15.7
$0.0
$0.0
$106.4
$53.7
$12.0
$19.6
$75.1
$4.3
$0.0
$0.0
$111.0
$27.6
$0.0
$0.0
$1.9
$22.4
$0.0
$0.0
$24.3
$19.3
Pre-2004
2004
2005
2006
2007
2009
Total BV
Total MV
AAA
AA
A
BBB
<BBB

CMBS at 6/30/09
CNO
AAA
AA
A
BBB
<BBB
Total
$540.2
$35.7
$53.7
$27.6
$19.3
$676.5
$600.1
$54.1
$106.4
$111.0
$24.3
$895.9
79.9%
5.3%
7.9%
4.1%
2.8%
100.0%
2.71%
0.13%
0.27%
0.14%
0.09%
3.34%
Market
Value (mil.)
Book
Value (mil.)
% of
CMBS*
% of
Portfolio*
Rating
Collateral performing materially better than overall CMBS market in terms of
delinquency and cumulative loss
Substantial credit support inherent in structures relative to expected cumulative losses
27.3%
26.0%
6.9%
6.3%
4.8%
24.1%
Avg.
Support
1.2%
0.4%
0.9%
0.9%
0.0%
1.1%
Avg. 60+
Del. & FCR
*% of market value
($ millions)
0.41%
0.09%
0.11%
0.05%
0.00%
0.35%
Avg. Cum.
Loss
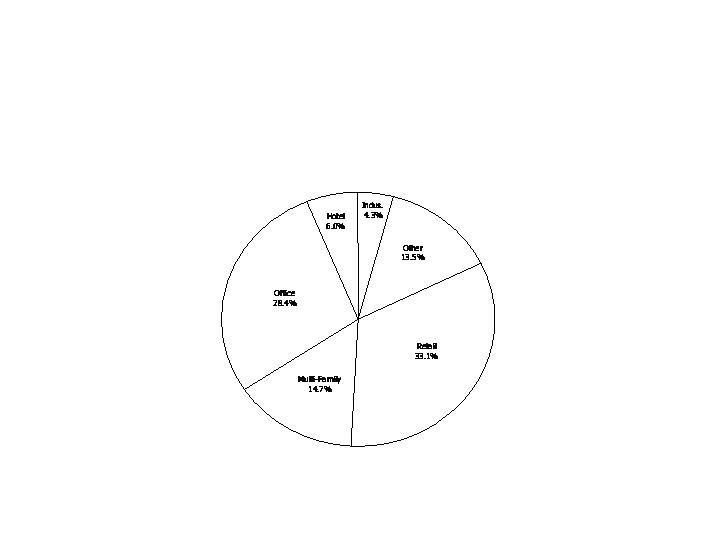
CMBS by Collateral Type at 6/30/09
Our CMBS are backed by a diverse pool of underlying collateral –
$87 billion, from more than 7,900 commercial mortgage loans
CNO
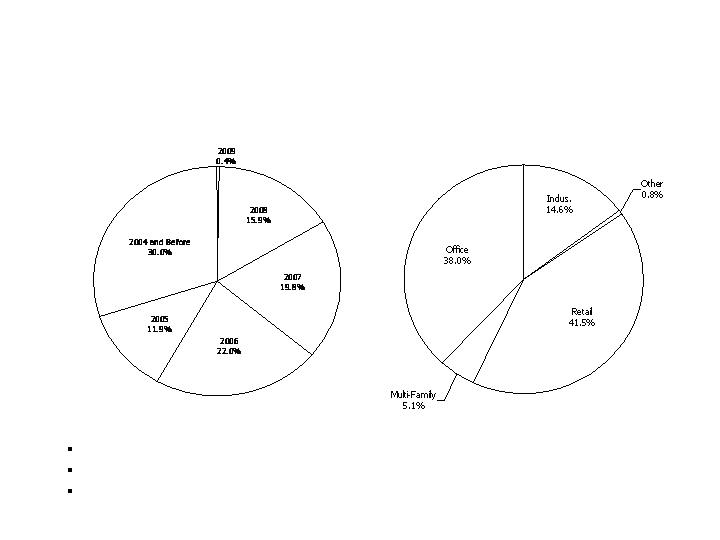
Commercial Mortgage Loans
at 6/30/09
By Vintage
CNO
By Property Type
LTV of approximately 64%
Debt Service Coverage Ratio relatively stable at underwritten levels of approximately 1.45
Emphasis on reducing overall allocation via prepayments, etc.

CNO Summary
Second consecutive quarter of net income
Seasonality has historically produced stronger earnings in second
half of year
Core sales continue to improve in declining market
Capital and risk management remain our top priorities
Convertible debentures due September 2010
Continue to evaluate reinsurance opportunities
Manage investments in effort to mitigate impact on RBC
CNO

Questions and Answers

Appendix
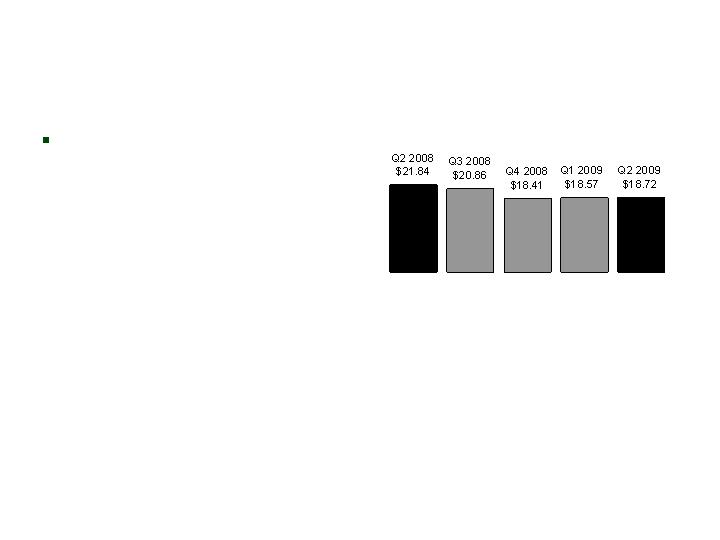
Book Value Per Share*
CNO
*Book value excludes accumulated other comprehensive income (loss). See Appendix for corresponding GAAP
measure.
Increase from Q1 2009 due to
Q2 2009 net income
Net Investment Income
CNO
($ millions)
Decreases in 2009 primarily
due to increase in cash and
short-term investment balances
compared to prior periods
General Account Investment Income
5.65%
5.67%
5.93%
5.91%
5.82%
Yield:
Expenses
CNO
($ millions)
Adjusted Operating Expenses*
*Adjusted operating expenses exclude primarily acquisition costs, capitalization of software development
costs, initial PFFS marketing costs and contractual vacancy charges related to exiting the Merchandise Mart
in Chicago. This measure is used by the Company to evaluate its progress in reducing operating expenses.
Expenses have been restated for all periods to reflect the SHIP separation.
Approximately $20 million in savings
from back-office consolidation
realized in 2007 and 2008; remaining
$5 million expected in 2009
Q4 2008 reflects increased
investment in business growth at
Bankers
Q2 2009 reflects the impact of
business growth, additional
consulting expense, and the timing of
insurance and premium tax
payments
Segment Performance
Bankers
*Operating earnings exclude net realized gains (losses). See Appendix for corresponding GAAP measure of
our consolidated results of operations.
Earnings up 83% vs Q2 2008
Earnings positively affected by:
Higher LTC margins
Higher Life margins
Higher Med Supp margins
Offset by:
FAS 133 accounting
PTOI-Trailing 4 Quarters: $189.5 $189.8 $171.5 $187.1 $215.8
Revenues-Quarterly: $680.7 $679.1 $691.4 $635.1 $662.8
Pre-Tax Operating Income*
Revenues -Tr. 4 Quarters: $2,537.0 $2,594.5 $2,679.1 $2,686.3 $2,668.4
($ millions)
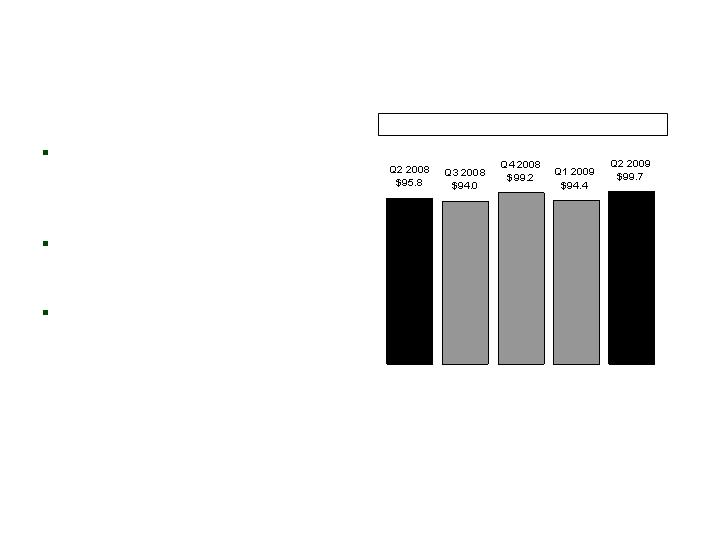
Premiums –
Medicare Supplement
Bankers
($ millions)
First-year premiums up 9%
vs Q2 2008
Medicare Supplement – First-Year Premiums
Med. Supp. First-Year Prems.-Tr. 4 Qtrs: $78.8 $79.3 $81.3 $81.9 $83.6
Med. Supp. Total Premiums-Quarterly: $150.6 $153.8 $172.3 $155.8 $155.2
Med. Supp. NAP-Quarterly: $17.0 $16.6 $27.9 $18.4 $19.2
Med. Supp. NAP-Trailing 4 Quarters: $73.2 $73.7 $78.6 $79.9 $82.1
Premiums –
Long-Term Care
Bankers
($ millions)
Quarterly first-year premium
declines due to new business
reinsurance
NAP decline attributable to three
main factors:
Overall industry sales decline
Agent force shift toward other products
Tightened underwriting
First-Year Prems.-Tr. 4 Qtrs: $44.8 $43.9 $42.7 $35.9 $30.0
Total Premiums-Quarterly: $155.2 $154.8 $159.1 $145.9 $151.9
Long-Term Care – First-Year Premiums*
NAP-Quarterly: $10.7 $11.4 $7.9 $7.5 $9.8
NAP-Trailing 4 Quarters: $42.6 $42.3 $39.4 $37.5 $36.6
*Includes $4.4 million in both Q1 2009 and Q2 2009 of premiums ceded under new business reinsurance
agreement.
Q2 2009
(Direct)
$9.1
Q1 2009
(Direct)
$8.6

Premiums –
Life Insurance
Bankers
($ millions)
Fluctuations in first-year
premiums primarily reflect
variance in sales of single-
premium policies
Non-SPWL premiums down
11% vs Q2 2008
First-Year Prems.-Tr. 4 Qtrs: $83.5 $81.8 $80.7 $79.0 $75.9
Total Premiums-Quarterly: $53.8 $51.9 $55.7 $48.9 $55.3
Life – First-Year Premiums
NAP-Quarterly: $15.7 $13.1 $11.4 $12.6 $15.6
NAP-Trailing 4 Quarters: $54.3 $53.6 $51.9 $52.8 $52.7
Q2 2008
$22.5
SPWL
Non-
SPWL
$9.4
$13.1
$7.5
$12.0
Q3 2008
$19.5
Q4 2008
$20.2
$8.2
$12.0
Q1 2009
$16.8
$6.2
$10.6
Q2 2009
$19.4
$7.8
$11.6
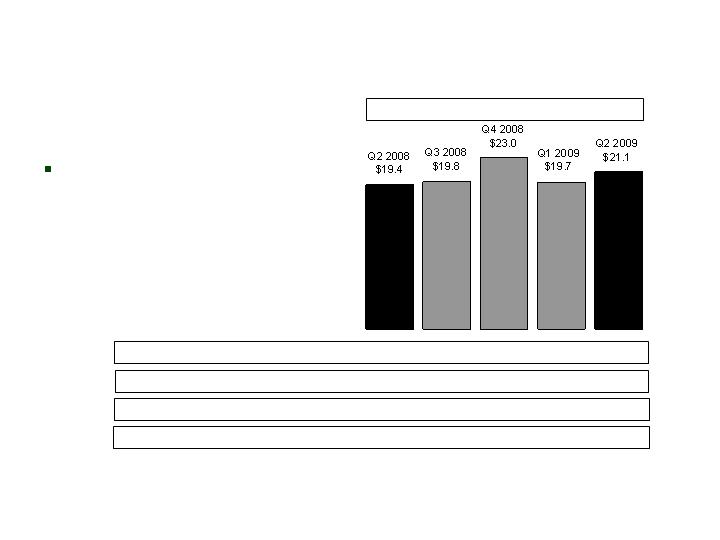
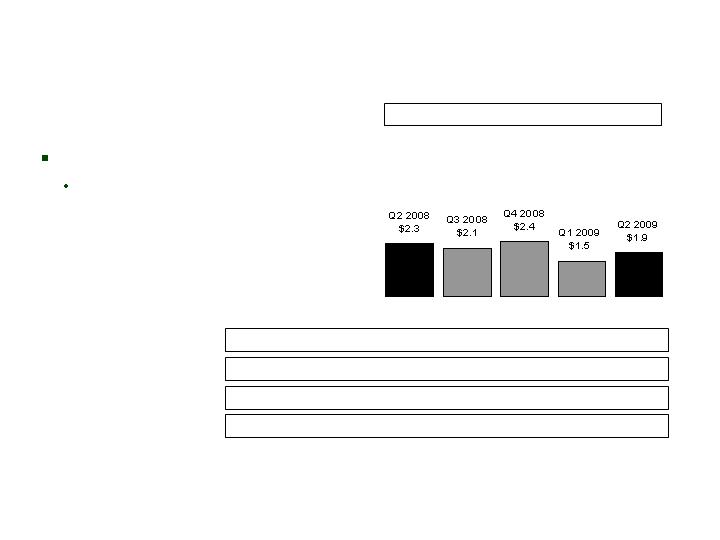
Premiums –
Annuity
Bankers
($ millions)
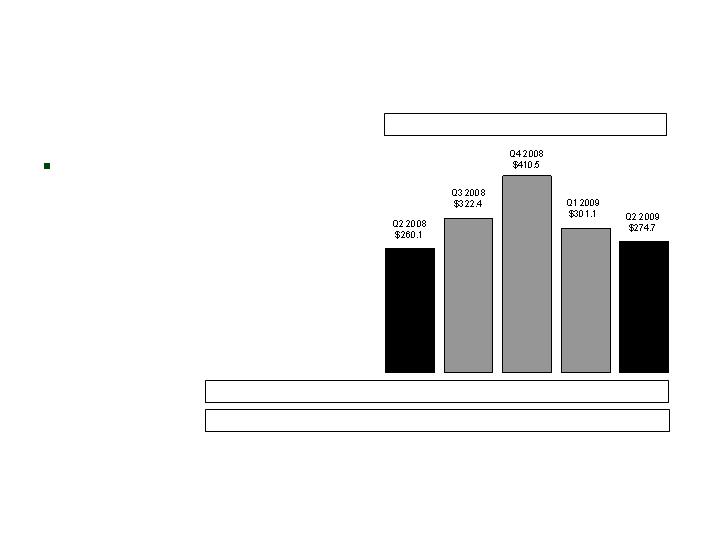
Annuity first-year premiums
up 6% over Q2 2008
First-Year Prems.-Tr. 4 Qtrs: $959.4 $1,031.3 $1,220.6 $1,294.1 $1,308.7
Total Premiums-Quarterly: $261.1 $323.1 $411.2 $302.1 $275.4
Annuity – First-Year Premiums
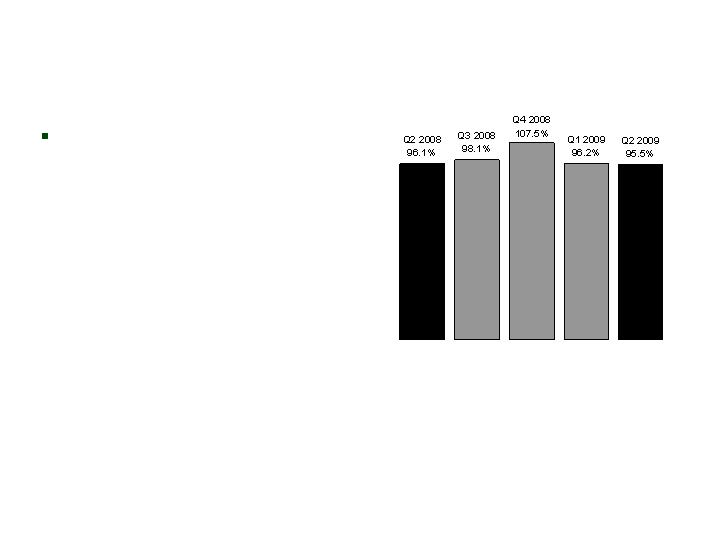
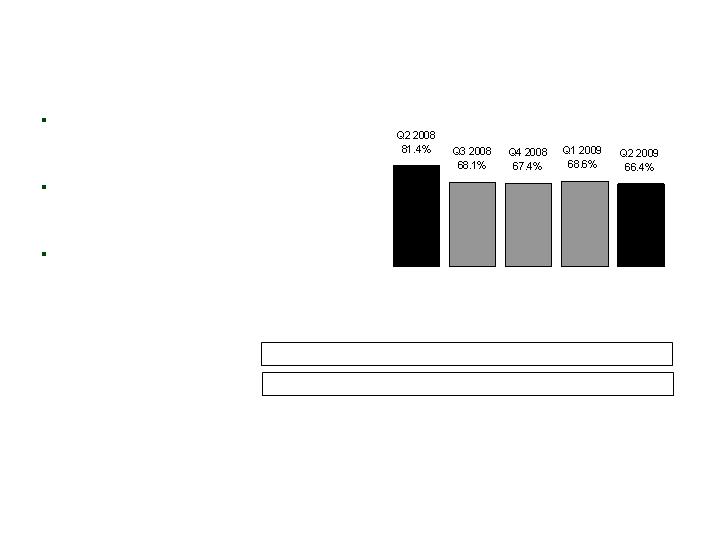
Benefit Ratio* – PDP
Bankers
Up 2% vs Q2 2008
Impacted by true-up to
previous quarter estimate
*We calculate benefit ratios by dividing insurance policy benefits by insurance policy income.
Benefit Ratio* –
PFFS Individual Business
Bankers
Q2 2009 vs Q2 2008
comparison impacted by prior-
year IBNR strengthening
*We calculate benefit ratios by dividing insurance policy benefits by insurance policy income.
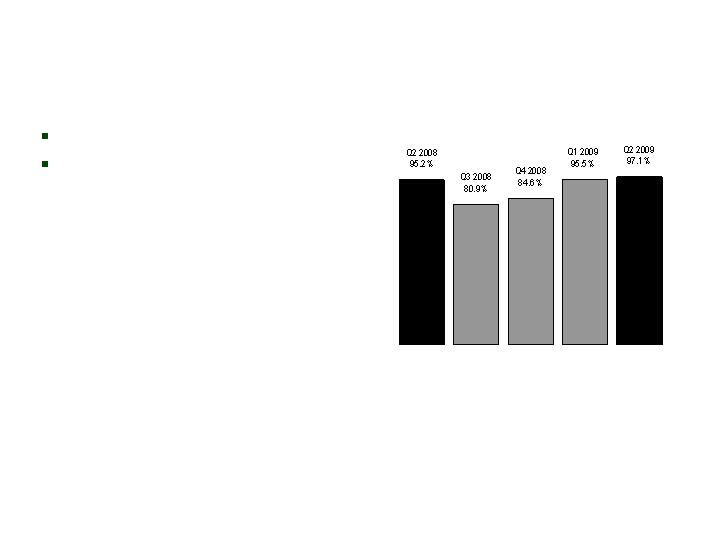
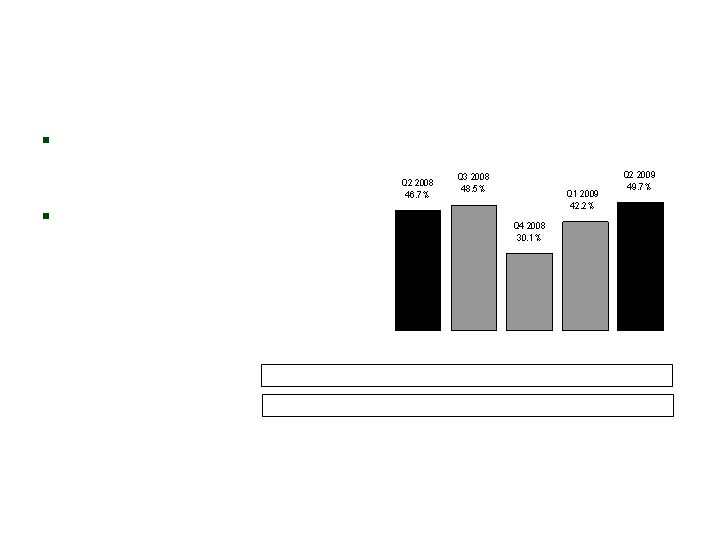
Interest-Adjusted Benefit Ratio* –
Long Term Care
Bankers
*We calculate interest-adjusted benefit ratios by dividing insurance policy benefits less interest income on
the accumulated assets backing the insurance liabilities by insurance policy income.
Q2 2009 positively impacted by
continued stabilization of incurred
claims and excess terminations
Completed Round Three re-rates on
legacy block; expect $50 million
annual financial impact
Began implementation of premium
re-rates (Round Two) in Q3 2007 on
more recent business not previously
re-rated; expect additional $10
million in in-force premium
Trailing 4 Quarter Avg.: 76.7% 74.9% 74.0% 71.4% 67.6%
Qtrly. non-int. adjusted: 114.7% 102.1% 102.2% 105.1% 103.2%
Segment Performance
Colonial Penn
*Operating earnings exclude net realized gains (losses). See Appendix for corresponding GAAP measure of
our consolidated results of operations.
Q2 2008 to Q2 2009 change affected by:
$3 million reinsurance termination
Q1 2009 to Q2 2009 change affected by:
$3 million reinsurance termination
Favorable mortality rates on core life
Lower amortization costs due to
favorable mortality rates
PTOI-Trailing 4 Quarters: $18.8 $18.3 $25.2 $26.6 $29.3
Revenues-Quarterly: $58.1 $57.0 $57.2 $57.1 $62.7
Pre-Tax Operating Income*
Revenues -Tr. 4 Quarters: $198.4 $213.3 $226.2 $229.4 $234.0
($ millions)
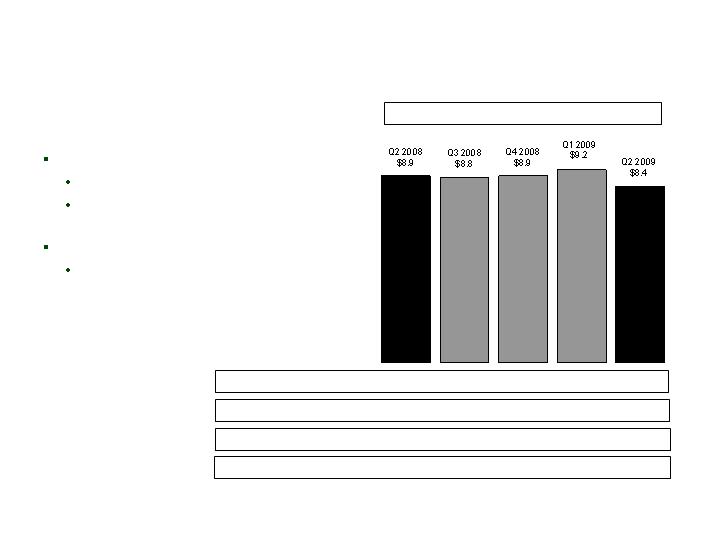
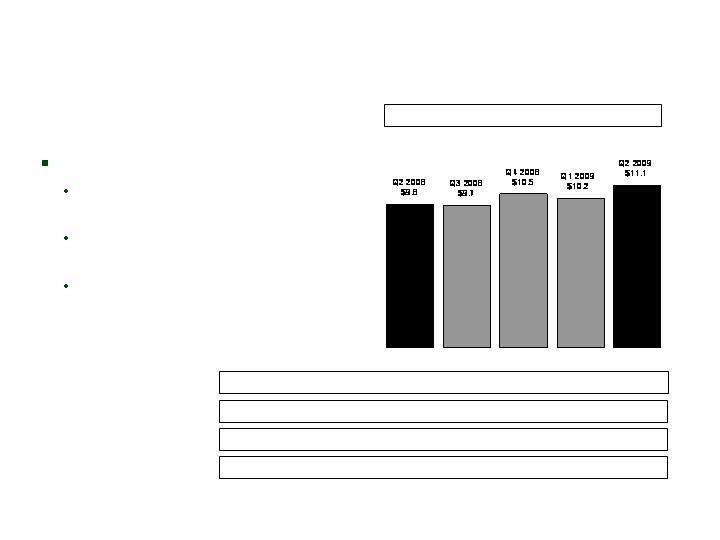
Premiums –
Life Insurance
Colonial Penn
($ millions)
NAP:
Trailing 4 quarters relatively flat
2009 levels consistent with capital
management efforts
Premium:
Recent sales growth reflected in
premium development
First-Year Prems.-Tr. 4 Qtrs: $32.3 $33.7 $35.0 $35.8 $35.3
Total Premiums-Quarterly: $43.8 $43.6 $43.8 $47.0 $45.8
Life – First-Year Premiums
NAP-Quarterly: $14.5 $12.1 $10.8 $12.3 $10.6
NAP-Trailing 4 Quarters: $47.9 $48.6 $50.1 $49.7 $45.8
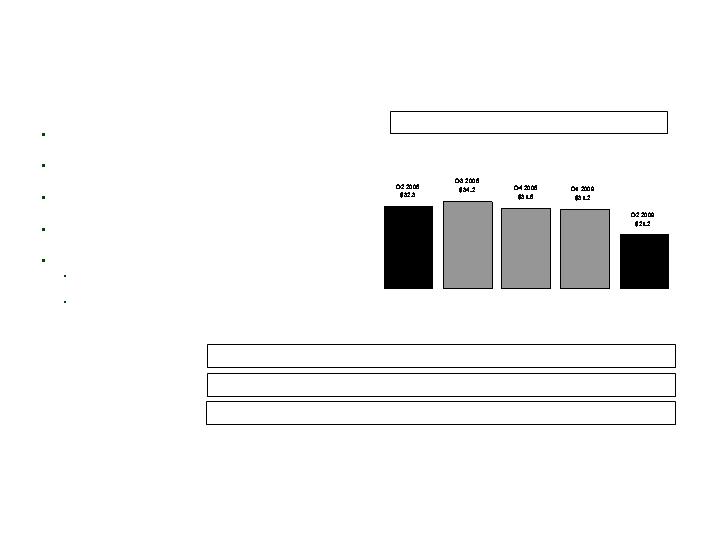
Segment Performance
CIG
*Operating earnings exclude: (1) net realized gains (losses); (2) the Q2 2006 charge related to the
litigation settlement and refinements to such estimates recognized in subsequent periods; and (3) the Q3
2007 charge related to an annuity coinsurance transaction. See Appendix for corresponding GAAP
measure of our consolidated results of operations.
Lower Specified Disease margin due to higher
incurred claims
Lower Medicare Supplement margin driven by lower
premium
Lower LTC margin due to higher home health care
costs
Unlocking adjustment negatively impacting Indexed
Annuity block due to excess terminations
Partially offset by:
Higher Life margin as universal life block emerges from loss
recognition
Favorable universal life mortality
PTOI-Trailing 4 Quarters: $82.6 $99.4 $121.3 $129.2 $109.1
Revenues-Quarterly: $378.3 $371.8 $382.4 $379.2 $382.5
Pre-Tax Operating Income*
Revenues-Tr. 4 Quarters: $1,576.2 $1,511.3 $1,513.1 $1,511.7 $1,515.9
($ millions)
Premiums -
Medicare Supplement
CIG
($ millions)
NAP lower vs Q2 2008:
Continue to focus on the sale of
profitable product lines, rather
than increasing overall sales
First-Year Prems.-Tr. 4 Qtrs: $12.7 $10.6 $9.6 $8.3 $7.9
Total Premiums-Quarterly: $49.6 $48.5 $52.6 $42.8 $44.4
Medicare Supplement – First-Year Premiums
NAP-Quarterly: $1.3 $1.8 $3.5 $1.7 $1.3
NAP-Trailing 4 Quarters: $9.0 $8.9 $8.9 $8.3 $8.3
Premiums –
Specified Disease
CIG
($ millions)
NAP up 18% from Q2 2008:
Increased PMA focus on
Specified Disease products
Increased recruitment of Health
IMOs
Momentum increasing in
Worksite market
First-Year Prems.-Tr. 4 Qtrs: $35.6 $37.6 $39.4 $40.2 $41.5
Total Premiums-Quarterly: $92.5 $92.3 $95.6 $93.0 $95.1
Specified Disease – First-Year Premiums
NAP-Quarterly: $12.4 $12.8 $12.0 $11.5 $14.7
NAP-Trailing 4 Quarters: $43.6 $46.1 $46.8 $48.7 $51.0
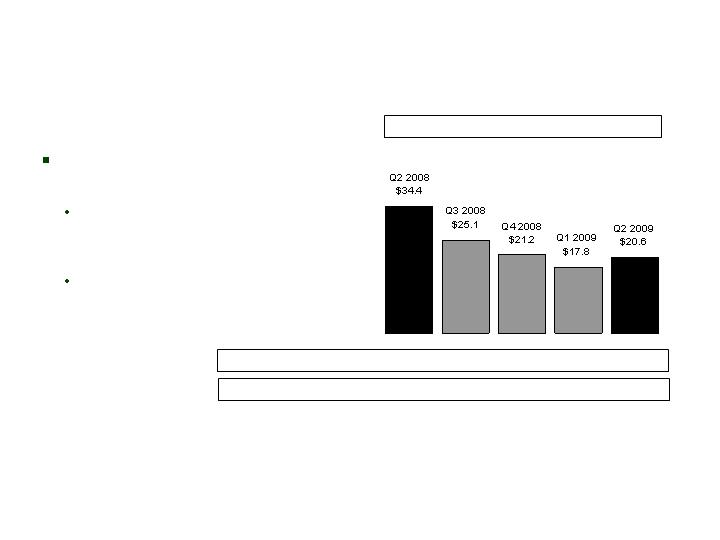
Premiums –
Annuity
CIG
($ millions)
First-year collections down
40% from Q2 2009:
Discontinuance of products due
to an annuity coinsurance
transaction
Focus on profitable products
(i.e., Specified Disease)
First-Year Prems.-Tr. 4 Qtrs: $203.4 $155.3 $119.9 $98.5 $84.7
Total Premiums-Quarterly: $37.1 $27.4 $23.7 $19.5 $22.3
Annuity – First-Year Premiums
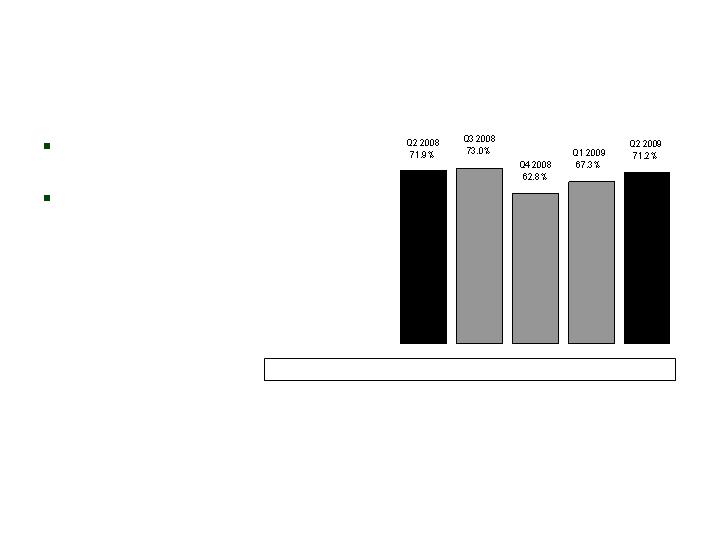
Benefit Ratio* –
Medicare Supplement
CIG
In line with expectations and
recent trends
Stable persistency
Trailing 4 Quarter Avg.: 68.0% 69.1% 68.4% 68.8% 68.6%
*We calculate benefit ratios by dividing insurance policy benefits by insurance policy income.
Interest-Adjusted Benefit Ratio* –
Specified Disease
CIG
Trailing 4 Quarter Avg.: 47.6% 47.4% 43.3% 41.8% 42.6%
Qtrly. non-int. adjusted: 80.4% 82.6% 63.8% 76.0% 83.3%
*We calculate interest-adjusted benefit ratios by dividing insurance policy benefits, less interest income on
the accumulated assets backing the insurance liabilities, by insurance policy income.
Q4 2008 included recognition of
deferred ROP adjustment related
to prior periods
Q2 2009 recognized higher
incurred claims

Information Related to Certain Non-GAAP Financial Measures
The following provides additional information regarding certain non-GAAP measures used in this presentation. A non-GAAP measure is a
numerical measure of a company’s performance, financial position, or cash flows that excludes or includes amounts that are normally excluded
or included in the most directly comparable measure calculated and presented in accordance with GAAP. While management believes these
measures are useful to enhance understanding and comparability of our financial results, these non-GAAP measures should not be considered
as substitutes for the most directly comparable GAAP measures. Additional information concerning non-GAAP measures is included in our
periodic filings with the Securities and Exchange Commission that are available in the “Investor – SEC Filings” section of Conseco’s website,
www.conseco.com.
Operating earnings measures
Management believes that an analysis of net income applicable to common stock before net realized gains or losses, discontinued operations
and increases to our valuation allowance for deferred tax assets (“net operating income,” a non-GAAP financial measure) is important to
evaluate the performance of the Company and is a key measure commonly used in the life insurance industry. Management uses this measure
to evaluate performance because realized investment gains or losses, discontinued operations and increases to our valuation allowance for
deferred tax assets are unrelated to the Company’s continuing operations.

Information Related to Certain Non-GAAP Financial Measures
A reconciliation of net income applicable to common stock to net operating income (and related per-share amounts) is as follows (dollars in
millions, except per-share amounts):
Q2 2008
Q3 2008
Q4 2008
Q1 2009
Q2 2009
Net income (loss) applicable to common stock
(488.5)
$
(183.3)
$
(453.3)
$
24.5
$
27.6
$
Net realized investment losses, net of related amortization and taxes
17.4
84.2
88.0
6.9
13.2
Discontinued operations
198.3
157.4
367.5
-
-
Valuation allowance for deferred tax assets
298.0
-
45.0
-
-
Net operating income (a non-GAAP financial measure)
25.2
$
58.3
$
47.2
$
31.4
$
40.8
$
Per diluted share:
Net income (loss)
(2.65)
$
(0.99)
$
(2.45)
$
0.13
$
0.15
$
Net realized investment losses, net of related amortization and taxes
0.09
0.45
0.48
0.04
0.07
Discontinued operations
1.08
0.85
1.99
-
-
Valuation allowance for deferred tax assets
1.61
-
0.24
-
-
Net operating income (a non-GAAP financial measure)
0.13
$
0.31
$
0.26
$
0.17
$
0.22
$

Information Related to Certain Non-GAAP Financial Measures
Book value, excluding accumulated other comprehensive income, per share
This non-GAAP financial measure differs from book value per diluted share because accumulated other comprehensive income has been
excluded from the book value used to determine the measure. Management believes this non-GAAP financial measure is useful because it
removes the volatility that arises from changes in accumulated other comprehensive income. Such volatility is often caused by changes in the
estimated fair value of our investment portfolio resulting from changes in general market interest rates rather than the business decisions made
by management.
A reconciliation from book value per share to book value per share, excluding accumulated other comprehensive income (loss) is as follows
(dollars in millions, except per share amounts):
Q2 2008
Q3 2008
Q4 2008
Q1 2009
Q2 2009
Total shareholders' equity
3,395.7
$
2,716.3
$
1,630.0
$
1,591.2
$
2,415.0
$
Less accumulated other comprehensive income (loss)
(639.2)
(1,137.7)
(1,770.7)
(1,840.5)
(1,046.9)
Total shareholders' equity excluding
accumulated other comprehensive income (loss)
(a non-GAAP financial measure)
4,034.9
$
3,854.0
$
3,400.7
$
3,431.7
$
3,461.9
$
Diluted shares outstanding for the period
184,725,949
184,725,949
184,753,758
184,758,758
184,886,216
Book value per share
18.38
$
14.70
$
8.82
$
8.61
$
13.06
$
Less accumulated other comprehensive income (loss)
(3.46)
(6.16)
(9.59)
(9.96)
(5.66)
Book value, excluding accumulated other
comprehensive income (loss), per share
(a non-GAAP financial measure)
21.84
$
20.86
$
18.41
$
18.57
$
18.72
$

Information Related to Certain Non-GAAP Financial Measures
Operating return measures
Management believes that an analysis of return before net realized gains or losses, discontinued operations and increases to our valuation
allowance for deferred tax assets (“net operating income,” a non-GAAP financial measure) is important to evaluate the performance of the
Company and is a key measure commonly used in the life insurance industry. Management uses this measure to evaluate performance because
realized investment gains or losses, discontinued operations and increases to our valuation allowance for deferred tax assets are unrelated to the
Company’s continued operations.
This non-GAAP financial measure also differs from return on equity because accumulated other comprehensive income (loss) has been excluded
from the value of equity used to determine this ratio. Management believes this non-GAAP financial measure is useful because it removes the
volatility that arises from changes in accumulated other comprehensive income (loss). Such volatility is often caused by changes in the
estimated fair value of our investment portfolio resulting from changes in general market interest rates rather than the business decisions made
by management.
In addition, our equity includes the value of significant net operating loss carryforwards (included in income tax assets). In accordance with
GAAP, these assets are not discounted, and accordingly will not provide a return to shareholders (until after it is realized as a reduction to taxes
that would otherwise be paid). Management believes that excluding this value from the equity component of this measure enhances the
understanding of the effect these non-discounted assets have on operating returns and the comparability of these measures from period-to-
period. Operating return measures are used in measuring the performance of our business units and are used as a basis for incentive
compensation.
All references to segment operating return measures assume a 25% debt to total capital ratio at the segment level. Additionally, corporate
expenses have been allocated to the segments.

Information Related to Certain Non-GAAP Financial Measures
A reconciliation of return on common equity to operating return on common equity (excluding accumulated other comprehensive income (loss) and
net operating loss carryforwards) is as follows (dollars in millions, except per share amounts):
$
2,488.2
$
2,471.5
$
2,399.6
$
2,732.3
$
2,897.7
loss carryforwards (a non-GAAP financial measure)
comprehensive income (loss) and net operating
Common shareholders' equity, excluding accumulated other
973.7
960.2
1,001.1
1,121.7
1,137.2
Less net operating loss carryforwards
3,461.9
3,431.7
3,400.7
3,854.0
4,034.9
income (loss) (a non-GAAP financial measure)
Common shareholder's equity, excluding accumulated other comprehensive
(1,046.9)
(1,840.5)
(1,770.7)
(1,137.7)
(639.2)
Less accumulated other comprehensive income (loss)
$
2,415.0
$
1,591.2
$
1,630.0
$
2,716.3
$
3,395.7
Common shareholders' equity
$
40.8
$
31.4
$
47.2
$
58.3
$
25.2
Net operating income (a non-GAAP financial measure)
-
-
45.0
-
298.0
Valuation allowance for deferred tax assets
-
-
367.5
157.4
198.3
Discontinued operations
13.2
6.9
88.0
84.2
17.4
Net realized investment (gains) losses, net of related amortization and taxes
$
27.6
$
24.5
$
(453.3)
$
(183.3)
$
(488.5)
Net income (loss) applicable to common stock
Q2 2009
Q1 2009
Q4 2008
Q3 2008
Q2 2008
Average common shareholders' equity
$3,675.2
$3,056.0
$2,173.2
$1,610.6
$2,003.1
Average common shareholders' equity, excluding accumulated other
comprehensive income (loss) and net operating loss carryforwards (a
non-GAAP financial measure)
$2,991.5
$2,815.0
$2,566.0
$2,435.6
$2,479.9
Return on equity ratios:
Return on common equity
-53.2%
-24.0%
-83.4%
6.1%
5.5%
Operating return on common equity, excluding accumulated
other comprehensive income (loss) and net operating loss
carryforwards (a non-GAAP financial measure)
3.4%
8.3%
7.4%
5.2%
6.6%

Information Related to Certain Non-GAAP Financial Measures
A reconciliation of pretax operating earnings (a non-GAAP financial measure) to segment operating income (loss) and consolidated net income
(loss) for the six months ended June 30, 2009, is as follows (dollars in millions):
(Continued on next page)
CIG
Bankers
Colonial Penn
Corporate
Total
Pretax operating earnings (a non-GAAP financial measure)
52.4
$
108.0
$
16.1
$
(64.6)
$
111.9
$
Allocation of interest expense, excess capital and corporate
expenses
(35.3)
(26.4)
(2.4)
64.1
-
Income tax (expense) benefit
(6.2)
(29.4)
(4.9)
0.8
(39.7)
Segment operating income
10.9
$
52.2
$
8.8
$
0.3
$
72.2
Net realized investment losses, net of related amortization and taxes
(20.1)
Net income
52.1
$

Information Related to Certain Non-GAAP Financial Measures
A reconciliation of common shareholders’ equity, excluding accumulated other comprehensive income (loss) and net operating loss
carryforwards (a non-GAAP financial measure) to common shareholders’ equity at June 30, 2009, is as follows (dollars in millions):
(Continued from previous page)
(Continued on next page)
CIG
Bankers
Colonial Penn
Corporate
Total
December 31, 2008
Common shareholders' equity, excluding accumulated other
comprehensive income (loss) and net operating loss carryforwards
(a non-GAAP financial measure)
1,580.6
$
1,232.1
$
111.9
$
(525.0)
$
2,399.6
$
Net operating loss carryforwards
1,001.1
-
-
-
1,001.1
Accumulated other comprehensive income (loss)
(824.7)
(817.9)
(41.4)
(86.7)
(1,770.7)
Allocation of capital
526.9
410.7
37.3
(974.9)
-
Common shareholders' equity
2,283.9
$
824.9
$
107.8
$
(1,586.6)
$
1,630.0
$
June 30, 2009
Common shareholders' equity, excluding accumulated other
comprehensive income (loss) and net operating loss carryforwards
(a non-GAAP financial measure)
1,625.6
$
1,262.4
$
119.4
$
(519.2)
$
2,488.2
$
Net operating loss carryforwards
973.7
-
-
-
973.7
Accumulated other comprehensive income (loss)
(527.8)
(463.4)
(23.9)
(31.8)
(1,046.9)
Allocation of capital
541.9
420.8
39.8
(1,002.5)
-
Common shareholders' equity
2,613.4
$
1,219.8
$
135.3
$
(1,553.5)
$
2,415.0
$

Information Related to Certain Non-GAAP Financial Measures
(Continued from previous page)
A reconciliation of average common shareholders’ equity, excluding accumulated other comprehensive income (loss) and net operating loss
carryforwards (a non-GAAP financial measure) to average common shareholders’ equity at June 30, 2009, is as follows (dollars in millions):
CIG
Bankers
Colonial Penn
Corporate
Total
Average common shareholders' equity, excluding accumulated
other comprehensive income (loss) and net operating loss
carryforwards (a non-GAAP financial measure)
1,633.7
$
1,247.2
$
114.7
$
(537.9)
$
2,457.7
$
Average net operating loss carryforwards
973.8
Average accumulated other comprehensive income (loss)
(1,624.6)
Average common shareholders' equity
1,806.9
$
Return on equity ratios:
Return on equity
5.8%
Operating return on common equity, excluding accumulated
other comprehensive income (loss) and net operating
loss carryforwards (a non-GAAP financial measure)
1.3%
8.4%
15.3%
NM
5.9%

Information Related to Certain Non-GAAP Financial Measures
A reconciliation of the debt to capital ratio to debt to capital, excluding accumulated other comprehensive loss is as follows (dollars in millions):
Debt to capital ratio, excluding accumulated other comprehensive income (loss)
This non-GAAP financial measure differs from the debt to capital ratio because accumulated other comprehensive income has been excluded
from the value of capital used to determine this measure. Management believes this non-GAAP financial measure is useful because it removes
the volatility that arises from changes in accumulated other comprehensive income. Such volatility is often caused by changes in the estimated
fair value of our investment portfolio resulting from changes in general market interest rates rather than the business decisions made by
management.
Q2 2008
Q3 2008
Q4 2008
Q1 2009
Q2 2009
Corporate notes payable
1,167.9
$
1,168.0
$
1,311.5
$
1,310.5
$
1,259.3
$
Total shareholders' equity
3,395.7
2,716.3
1,630.0
1,591.2
2,415.0
Total capital
4,563.6
3,884.3
2,941.5
2,901.7
3,674.3
Less accumulated other comprehensive loss
639.2
1,137.7
1,770.7
1,840.5
1,046.9
Total capital, excluding accumulated other comprehensive
loss (a non-GAAP financial measure)
5,202.8
$
5,022.0
$
4,712.2
$
4,742.2
$
4,721.2
$
Corporate notes payable
1,167.9
$
1,168.0
$
1,311.5
$
1,310.5
$
1,259.3
$
Corporate notes payable to capital ratios:
Corporate debt to total capital
25.6%
30.1%
44.6%
45.2%
34.3%
Corporate debt to total capital, excluding
accumulated other comprehensive loss
(a non-GAAP financial measure)
22.4%
23.3%
27.8%
27.6%
26.7%