
Unless otherwise specified, the periods cited in our
performance comparisons are Q1 2010 vs Q1 2009.
performance comparisons are Q1 2010 vs Q1 2009.
Exhibit 99.1
First Quarter 2010
Financial and Operating Results
For the period ended March 31, 2010
Conseco, Inc.
May 5, 2010

2
Forward-Looking Statements
Cautionary Statement Regarding Forward-Looking Statements. Our statements, trend analyses and other information contained in these
materials relative to markets for Conseco’s products and trends in Conseco’s operations or financial results, as well as other statements,
contain forward-looking statements within the meaning of the federal securities laws and the Private Securities Litigation Reform Act of 1995.
Forward-looking statements typically are identified by the use of terms such as “anticipate,” “believe,” “plan,” “estimate,” “expect,” “project,”
“intend,” “may,” “will,” “would,” “contemplate,” “possible,” “attempt,” “seek,” “should,” “could,” “goal,” “target,” “on track,” “comfortable with,”
“optimistic” and similar words, although some forward-looking statements are expressed differently. You should consider statements that
contain these words carefully because they describe our expectations, plans, strategies and goals and our beliefs concerning future business
conditions, our results of operations, financial position, and our business outlook or they state other ‘‘forward-looking’’ information based on
currently available information. Assumptions and other important factors that could cause our actual results to differ materially from those
anticipated in our forward-looking statements include, among other things: (i) our ability to continue to satisfy the financial ratio and balance
requirements and other covenants of our debt agreements; (ii) general economic, market and political conditions, including the performance and
fluctuations of the financial markets which may affect our ability to raise capital or refinance existing indebtedness and the cost of doing so; (iii)
our ability to generate sufficient liquidity to meet our debt service obligations and other cash needs; (iv) our ability to obtain adequate and timely
rate increases on our supplemental health products, including our long-term care business; (v) the receipt of any required regulatory approvals
for dividend and surplus debenture interest payments from our insurance subsidiaries; (vi) mortality, morbidity, the increased cost and usage of
health care services, persistency, the adequacy of our previous reserve estimates and other factors which may affect the profitability of our
insurance products; (vii) changes in our assumptions related to the cost of policies produced or the value of policies in force at the effective
date; (viii) the recoverability of our deferred tax assets and the effect of potential ownership changes and tax rate changes on its value; (ix) our
assumption that the positions we take on our tax return filings, including our position that our 7.0% convertible senior debentures due 2016 will
not be treated as stock for purposes of Section 382 of the Internal Revenue Code of 1986, as amended, and will not trigger an ownership
change, will not be successfully challenged by the Internal Revenue Service; (x) changes in accounting principles and the interpretation thereof;
(xi) our ability to achieve anticipated expense reductions and levels of operational efficiencies including improvements in claims adjudication
and continued automation and rationalization of operating systems, (xii) performance and valuation of our investments, including the impact of
realized losses (including other-than-temporary impairment charges); (xiii) our ability to identify products and markets in which we can compete
effectively against competitors with greater market share, higher ratings, greater financial resources and stronger brand recognition; (xiv) the
ultimate outcome of lawsuits filed against us and other legal and regulatory proceedings to which we are subject; (xv) our ability to complete the
remediation of the material weakness in internal controls over our actuarial reporting process and to maintain effective controls over financial
reporting; (xvi) our ability to continue to recruit and retain productive agents and distribution partners and customer response to new products,
distribution channels and marketing initiatives; (xvii) our ability to achieve eventual upgrades of the financial strength ratings of Conseco and our
insurance company subsidiaries as well as the impact of rating downgrades on our business and our ability to access capital; (xviii) the risk
factors or uncertainties listed from time to time in our filings with the Securities and Exchange Commission; (xix) regulatory changes or actions,
including those relating to regulation of the financial affairs of our insurance companies, such as the payment of dividends and surplus
debenture interest to us, regulation of financial services affecting (among other things) bank sales and underwriting of insurance products,
regulation of the sale, underwriting and pricing of products, and health care regulation affecting health insurance products; and (xx) changes in
the Federal income tax laws and regulations which may affect or eliminate the relative tax advantages of some of our products. Other factors
and assumptions not identified above are also relevant to the forward-looking statements, and if they prove incorrect, could also cause actual
results to differ materially from those projected. All written or oral forward-looking statements attributable to us are expressly qualified in their
entirety by the foregoing cautionary statement. Our forward-looking statements speak only as of the date made. We assume no obligation to
update or to publicly announce the results of any revisions to any of the forward-looking statements to reflect actual results, future events or
developments, changes in assumptions or changes in other factors affecting the forward-looking statements.

Non-GAAP Measures
3
This presentation contains the following financial measures that differ from the comparable measures
under Generally Accepted Accounting Principles (GAAP): operating earnings measures; book value,
excluding accumulated other comprehensive income (loss) per share; operating return measures;
earnings before net realized investment gains (losses) and corporate interest and taxes; debt to capital
ratios, excluding accumulated other comprehensive income (loss); and interest-adjusted benefit ratios.
Reconciliations between those non-GAAP measures and the comparable GAAP measures are
included in the Appendix, or on the page such measure is presented.
While management believes these measures are useful to enhance understanding and comparability
of our financial results, these non-GAAP measures should not be considered substitutes for the most
directly comparable GAAP measures.
of our financial results, these non-GAAP measures should not be considered substitutes for the most
directly comparable GAAP measures.
Additional information concerning non-GAAP measures is included in our periodic filings with the
Securities and Exchange Commission that are available in the “Investor - SEC Filings” section of
Conseco’s website, www.conseco.com.
Securities and Exchange Commission that are available in the “Investor - SEC Filings” section of
Conseco’s website, www.conseco.com.

Q1 2010 Summary
4
CNO
§ Core sales* of $87 million, up 4%
§ Net operating income** $38.2 million, up 2%
• 14 cents per diluted share
• Reflects dilution from the issuance of shares of common stock and
convertible debentures
convertible debentures
§ Consolidated RBC up 10 points to 319%
§ Holding company liquidity: $131.2 million
§ Book value per share: $15.24 vs $15.14 at 12/31/09
*Excludes PFFS and PDP.
**Management believes that an analysis of net income applicable to common stock before: (1) loss on
extinguishment or modification of debt, net of income taxes; and (2) net realized investment gains or losses,
net of related amortization and income taxes (“Net operating income,” a non-GAAP financial measure) is
important to evaluate the financial performance of the company, and is a key measure commonly used in the
life insurance industry. Management uses this measure to evaluate performance because loss on
extinguishment of debt and realized investment gains or losses can be affected by events that are unrelated to
the company’s underlying fundamentals. The table on page 8 reconciles the non-GAAP measure to the
corresponding GAAP measure.

CIG Segmentation
5
CIG
§ Splitting into two segments:
• Other CNO Business
• Washington National
§ Other CNO Business comprised primarily of closed blocks from CIG
• Will be separately managed from current/growing business
• Accounts for about two-thirds of CIG’s capital
§ Segmentation is another step toward increased transparency of operations
• Will bring clearer accountability and focus on business strategies
§ Expect to begin reporting on new segment basis effective Q3 2010
• Bankers
• Colonial Penn
• Washington National
• Other CNO Business
• Corporate

Collected Premiums
6
CNO
§ Total collected premiums
for trailing 4 quarters down
13%
for trailing 4 quarters down
13%
§ Decline at Bankers due to
termination of PFFS
reinsurance contracts and
lower annuity sales, as
expected
termination of PFFS
reinsurance contracts and
lower annuity sales, as
expected
§ Consistent growth at
Colonial Penn
Colonial Penn
§ Slight decline at CIG
primarily due to impact of
2009 reinsurance ceded to
Wilton Re
primarily due to impact of
2009 reinsurance ceded to
Wilton Re
($ millions)
CP
CIG
Collected Premiums-Trailing 4 Quarters
Q1 2009
$4,549.3
Q2 2009
$4,494.9
Q3 2009
$4,423.1
Q4 2009
$4,114.8
BLC OTHER
Q1 2010
$3,937.2
BLC PFFS

Q1 2010
Summary of Results
7
CNO
$53.2
5.3
25.7
(24.5)
59.7
(1.8)
(4.8)
$53.1
Pre-Tax
After Tax
EPS
($ millions, except per-share amounts)
$38.2
(1.2)
(3.1)
$33.9
$0.14
(0.00)
(0.01)
$0.13
*Management believes that an analysis of earnings before net realized investment gains (losses) and loss on
extinguishment or modification of debt (a non-GAAP financial measure) provides an alternative measure of the operating
results of the company because such items are unrelated to the company’s continuing operations. The table above
provides a reconciliation to the corresponding GAAP measure.
extinguishment or modification of debt (a non-GAAP financial measure) provides an alternative measure of the operating
results of the company because such items are unrelated to the company’s continuing operations. The table above
provides a reconciliation to the corresponding GAAP measure.
Bankers Life
Colonial Penn
Conseco Insurance Group
Corporate operations and interest expense
Income before net realized investment losses
and valuation allowance for deferred tax assets*
Loss on extinguishment of debt
Net realized investment losses
Total
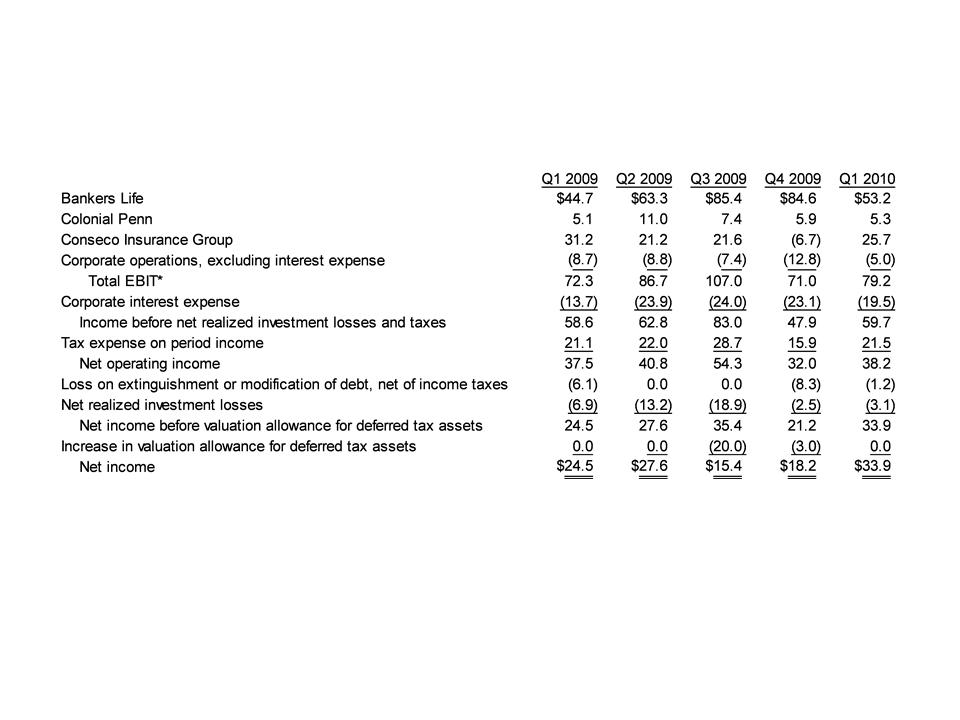
Quarterly Earnings
8
CNO Consolidated
*Management believes that an analysis of earnings before net realized investment gains (losses), corporate interest,
loss on extinguishment or modification of debt and taxes (“EBIT,” a non-GAAP financial measure) provides a clearer
comparison of the operating results of the company quarter-over-quarter because it excludes: (1) corporate interest
expense; (2) loss on extinguishment or modification of debt; and (3) net realized investment gains (losses) that are
unrelated to the company’s underlying fundamentals. The table above provides a reconciliation of EBIT to net income.
($ millions)
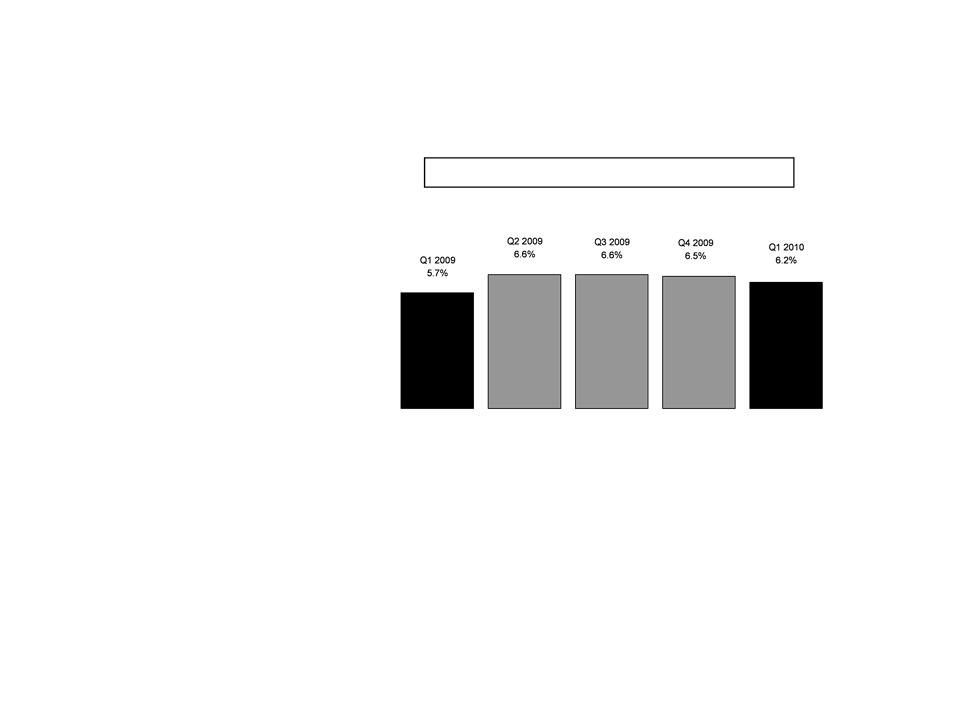
Operating ROE
9
CNO
Operating ROE*, Trailing 4 Quarters
*Operating return excludes gain (loss) on extinguishment or modification of debt, net realized investment gains
(losses), valuation allowance related to deferred tax assets and discontinued operations. Equity excludes
accumulated other comprehensive income (loss) and the value of net operating loss carryforwards. See
Appendix for corresponding GAAP measure.
(losses), valuation allowance related to deferred tax assets and discontinued operations. Equity excludes
accumulated other comprehensive income (loss) and the value of net operating loss carryforwards. See
Appendix for corresponding GAAP measure.
Average common shareholders’ equity, excluding AOCL and net operating loss carryforwards, trailing 4 quarters ($ millions): | $2,702.0 | $2,574.1 | $2,503.9 | $2,551.1 | $2,679.2 |
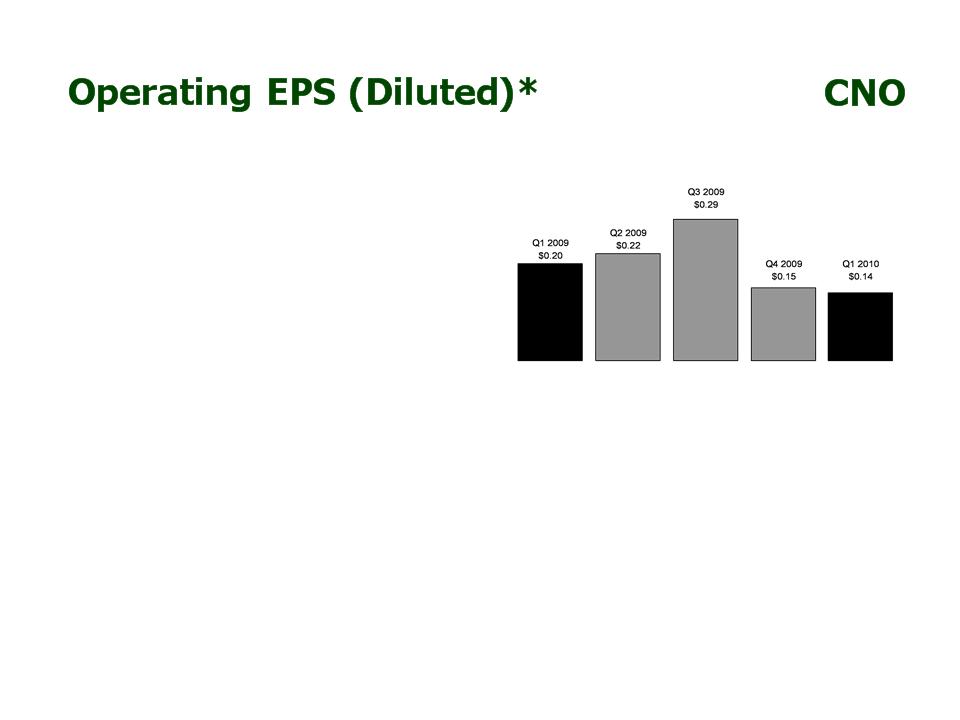
10
*Operating earnings per share exclude loss on extinguishment or modification of debt, net realized investment
gains (losses) and valuation allowance related to deferred tax assets. See Appendix for a reconciliation to the
corresponding GAAP measure.
Weighted average diluted shares (in millions): | 184.8 | 185.2 | 185.8 | 217.5 | 292.1 |
§ Q1 2010 reflects dilution from
issuance of 65.9 million shares
of common stock and $240.5
million of convertible
debentures
issuance of 65.9 million shares
of common stock and $240.5
million of convertible
debentures

Book Value
11
CNO
*See Appendix for a reconciliation to the corresponding GAAP measure.
Shareholders’ Equity (excluding AOCL)
Accumulated Other Comprehensive Loss
Total Shareholders’ Equity
Shares Outstanding
Book Value Per Share
Book Value Per Share (Excluding AOCL)
$3,431.7
(1,840.5)
$1,591.2
184.8
$8.61
$18.57
3/31/09
$3,461.9
(1,046.9)
$2,415.0
184.9
$13.06
$18.72
6/30/09
$3,479.7
(146.0)
$3,333.7
184.9
$18.03
$18.82
9/30/09
$3,796.7
(264.3)
$3,532.4
250.8
$14.09
$15.14
12/31/09
($ millions, except per-share amounts)
$3,823.1
(103.0)
$3,720.1
250.9
$14.83
$15.24
3/31/10
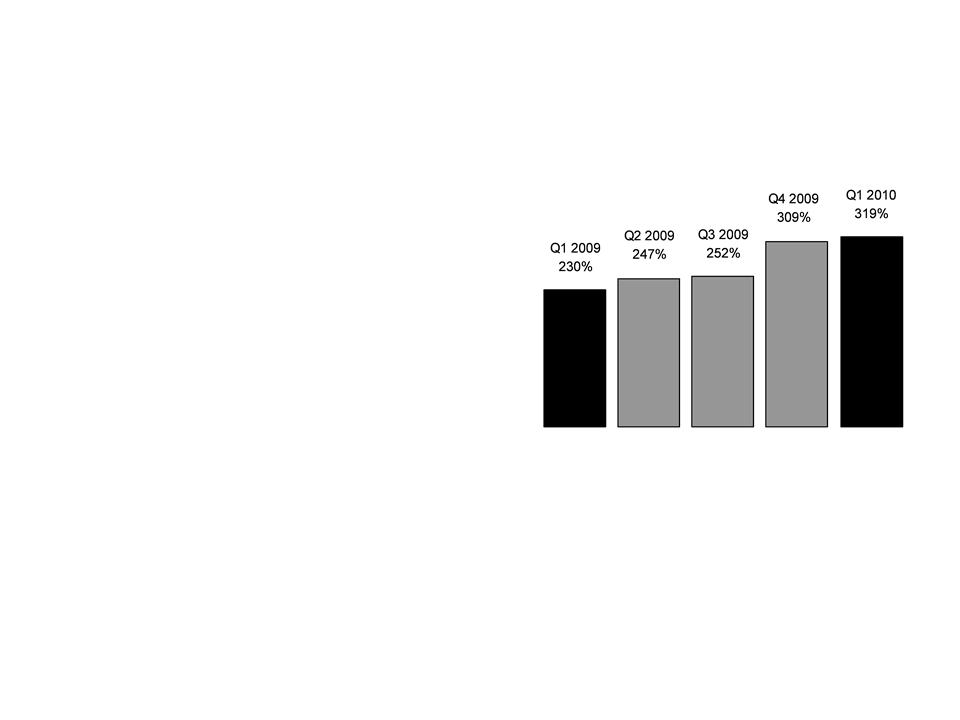
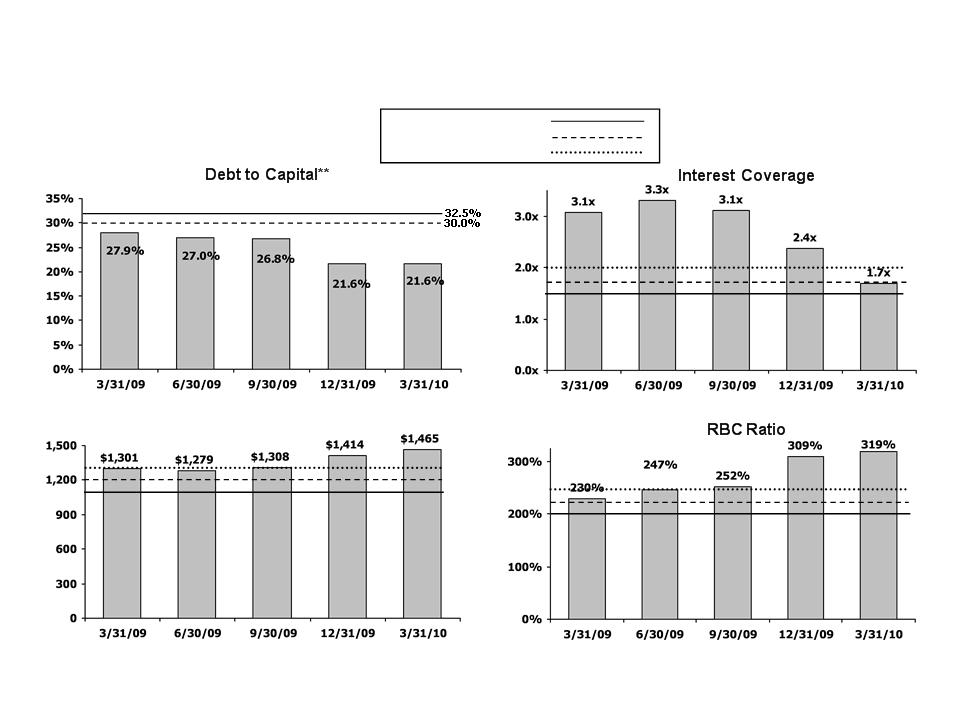
Consolidated RBC Ratio*
12
CNO
*Risk-Based Capital (“RBC”) requirements provide a tool for insurance regulators to determine the levels of
statutory capital and surplus an insurer must maintain in relation to its insurance and investment risks. The
RBC ratio is the ratio of the statutory consolidated adjusted capital of our insurance subsidiaries to RBC.
§ RBC ratio continues to improve
§ Primarily driven by Q1 2010
statutory earnings
statutory earnings

Q1 Summary
13
Bankers
§ Earnings of $53.2 million, up 19%
• Higher Life income due to:
• Favorable mortality (+$5 million)
• Reserve changes from Q1 2009 (+$5 million)
• Lost earnings from blocks reinsured in 2009 (-$3 million)
• Higher PFFS/PDP income due to:
• Favorable PFFS IBNR development (+$2 million)
• Higher PDP margins (+$1 million)
§ NAP up 1%
§ Stable agent count; improved agent productivity
Bankers
14
($ millions)
Quarterly NAP*
*PFFS and PDP sales are not comparable and are excluded from NAP in all periods; in addition, we no longer
assume any of the risks on PFFS contracts through reinsurance.
assume any of the risks on PFFS contracts through reinsurance.
PFFS policies issued: | 19.3 | 1.8 | -0.2 | -1.0 | 22.8 |
PDP policies issued: | 18.3 | 3.8 | 3.8 | 1.3 | 8.0 |
Policies issued and not included in NAP (net of chargebacks, in thousands):
Sales & Distribution Results
§ NAP up 1%
• Increases in Life (+25%), LTC (+14%)
and Med Supp (+5%), offset by
and Med Supp (+5%), offset by
• Lower sales of Annuities (-25%),
consistent with overall industry results
and driven by lower market interest
rates
consistent with overall industry results
and driven by lower market interest
rates

Medicare Sales Update
15
Bankers
Q4 2008-
Q1 2009
Q4 2009-
Q1 2010
Medicare
Supplement
Med Advantage/
PFFS
Issued Policies
18,902
24,120
21,819
43,086
+79%
+15%
PDP
19,391
9,191
-53%
§ Strong growth in Med Supp/
Med Advantage sales for Q4
2009-Q1 2010 period vs Q4
2008-Q1 2009
Med Advantage sales for Q4
2009-Q1 2010 period vs Q4
2008-Q1 2009
• Med Supp issued policies up 79%
• Med Advantage/PFFS up 15%
• PDP down 53%
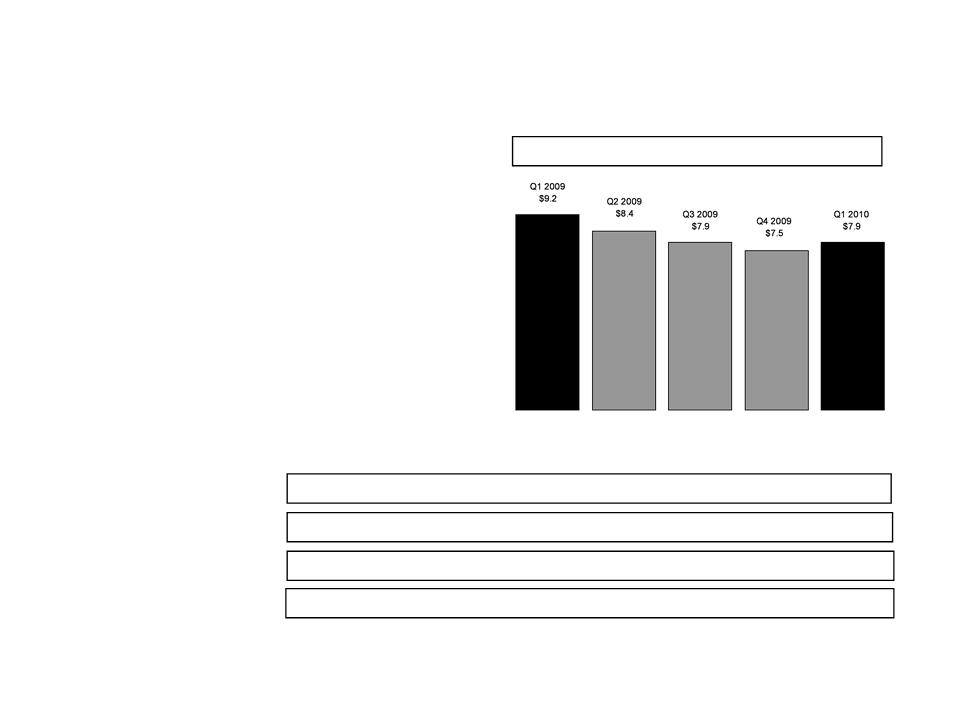
Q1 Earnings
16
Bankers
($ millions)
Trailing 4 Quarter Operating Return on Equity: 11.8%
Management believes that an analysis of income before net realized investment gains (losses), net of related
amortization (a non-GAAP financial measure), is important to evaluate the financial performance of our
business, and is a measure commonly used in the life insurance industry. Management uses this measure to
evaluate performance because realized gains or losses can be affected by events that are unrelated to a
company’s underlying fundamentals. The table on Page 8 reconciles the non-GAAP measure to the
corresponding GAAP measure. See Appendix for a reconciliation of the return on equity measure to the
corresponding GAAP measure.

Q1 Summary
17
Colonial Penn
§ Earnings of $5.3 million, up 4%
• Primarily due to favorable mortality and growth in our block of life
insurance policies
insurance policies
§ Sales (NAP) up 7%
• Lead generation momentum building following 2009 capital limitations
• Increased lead activity will drive return to pre-2009 sales levels
• NAP from lead-based programs up 32% over Q1 2009, and up 76% over
Q4 2009
Q4 2009
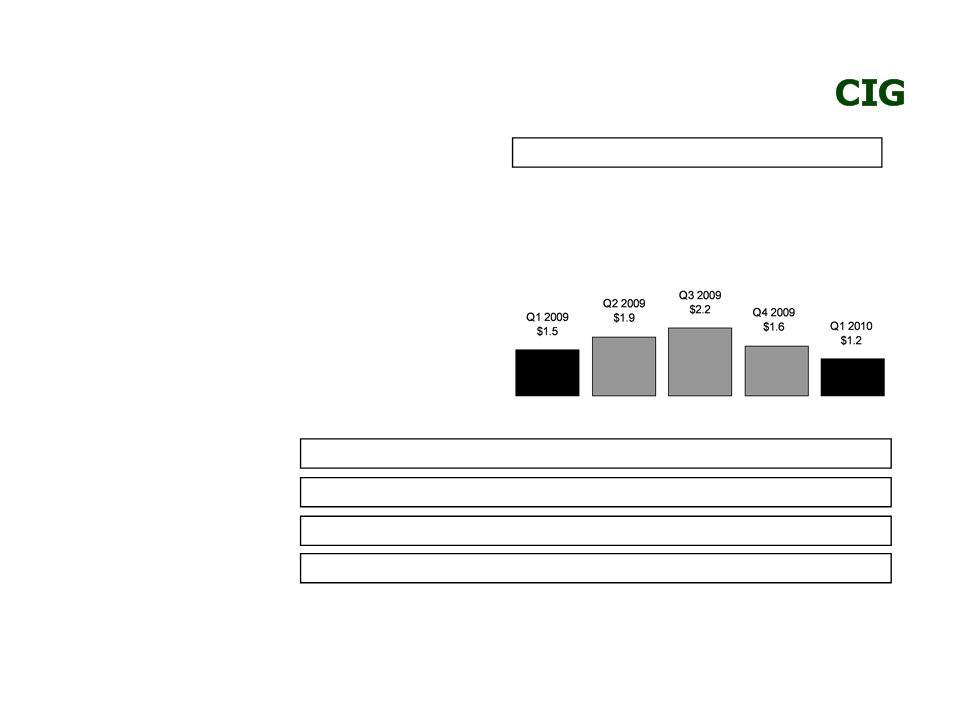
Q1 Earnings
18
Colonial Penn
($ millions)
Trailing 4 Quarter Operating Return on Equity: 14.0%
Management believes that an analysis of income before net realized investment gains (losses), net of related
amortization (a non-GAAP financial measure), is important to evaluate the financial performance of our
business, and is a measure commonly used in the life insurance industry. Management uses this measure to
evaluate performance because realized gains or losses can be affected by events that are unrelated to a
company’s underlying fundamentals. The table on Page 8 reconciles the non-GAAP measure to the
corresponding GAAP measure. See Appendix for a reconciliation of the return on equity measure to the
corresponding GAAP measure.
amortization (a non-GAAP financial measure), is important to evaluate the financial performance of our
business, and is a measure commonly used in the life insurance industry. Management uses this measure to
evaluate performance because realized gains or losses can be affected by events that are unrelated to a
company’s underlying fundamentals. The table on Page 8 reconciles the non-GAAP measure to the
corresponding GAAP measure. See Appendix for a reconciliation of the return on equity measure to the
corresponding GAAP measure.

Q1 Summary
19
CIG
§ NAP of $16.7 million, up 12%
• Third consecutive quarter of positive sales comparisons
§ Strong sales growth in both CIG Sales and PMA
§ Strong recruiting results
§ Earnings of $25.7 million, down 18%
• Lower Specified Disease income due primarily to reserve
releases in Q1 2009 (-$5 million)
releases in Q1 2009 (-$5 million)
• Lower Life income due primarily to lost earnings on blocks
reinsured in 2009 (-$5 million)
reinsured in 2009 (-$5 million)
• Higher Annuity income due to return to normal surrender activity
for indexed annuity products in Q1 2010 (+$6 million)
for indexed annuity products in Q1 2010 (+$6 million)
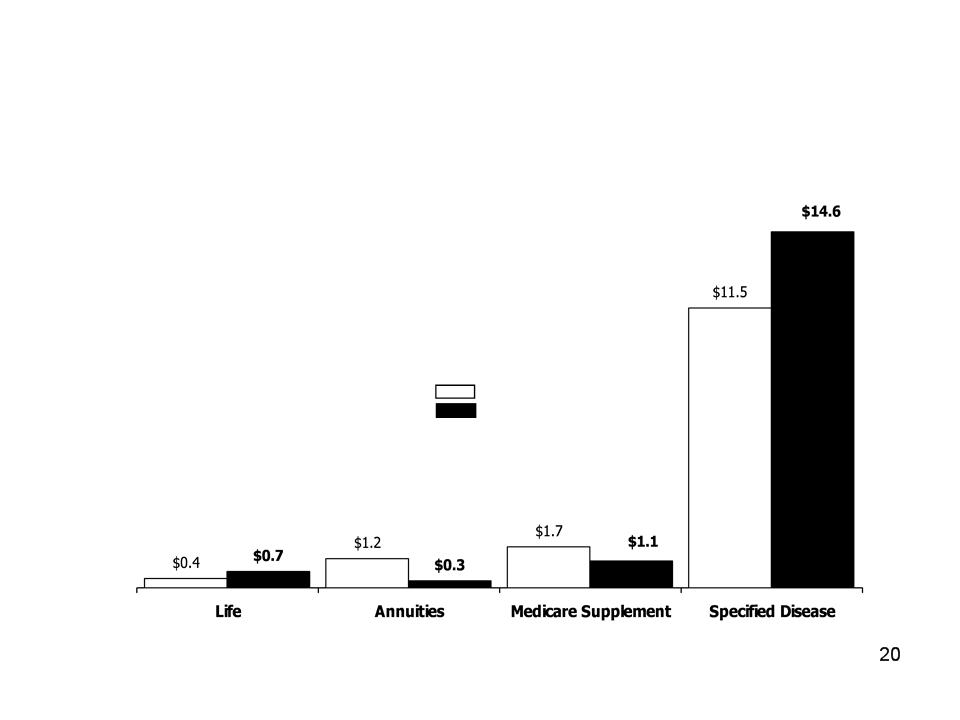
CIG
($ millions)
§ Specified Disease sales up 28%
§ New worksite groups up 64%
Q1 2009
Q1 2010
Q1 2010 Sales Results
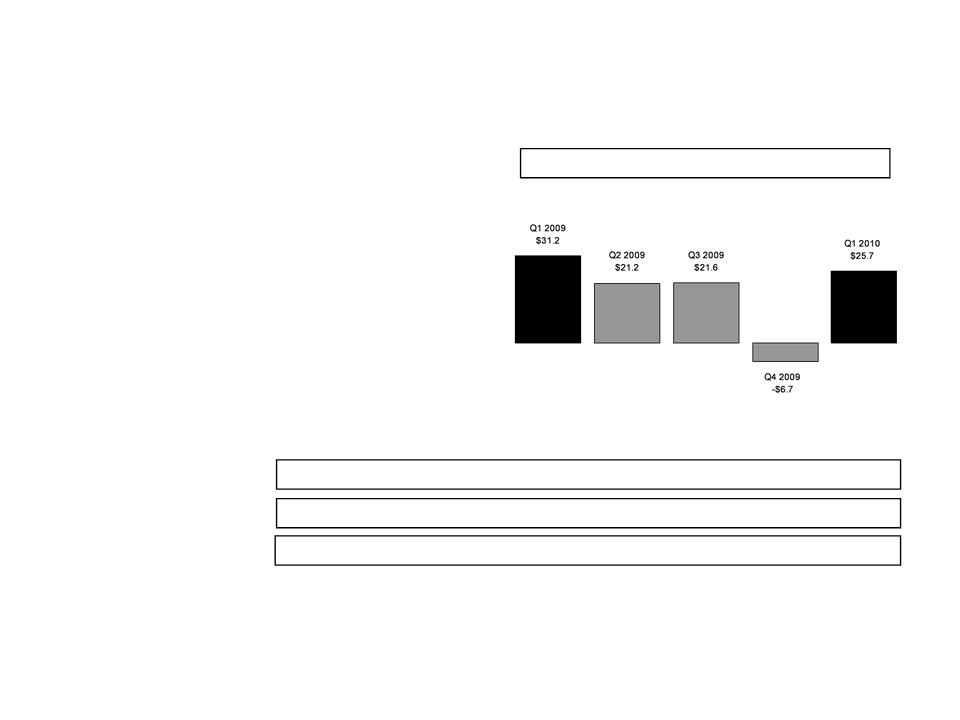
Q1 Earnings
21
CIG
Management believes that an analysis of income (loss) before net realized investment gains (losses), net of
related amortization (a non-GAAP financial measure), is important to evaluate the financial performance of
our business, and is a measure commonly used in the life insurance industry. Management uses this
measure to evaluate performance because realized gains or losses can be affected by events that are
unrelated to a company’s underlying fundamentals. The table on Page 8 reconciles the non-GAAP measure
to the corresponding GAAP measure.
($ millions)

Realized Gains/Losses Recognized
Through Net Income
22
CNO
Gross gains
Gross losses
Losses due to recognition of other-than-tempor-
ary impairments recognized in earnings
Amortization adjustment to insurance intangibles
Net investment losses before tax
Income tax benefit
Net investment losses after tax
($ millions)
$89.5
(4.4)
(92.0)
0.0
(6.9)
0.0
$(6.9)
Q1 2009
$83.6
(63.3)
(36.6)
3.1
(13.2)
0.0
$(13.2)
Q2 2009
$99.5
(84.1)
(35.7)
1.4
(18.9)
0.0
$(18.9)
Q3 2009
$110.5
(96.4)
(31.1)
(0.5)
(17.5)
15.0
$(2.5)
Q4 2009
$50.9
(35.5)
(20.3)
0.1
(4.8)
1.7
$(3.1)
Q1 2010
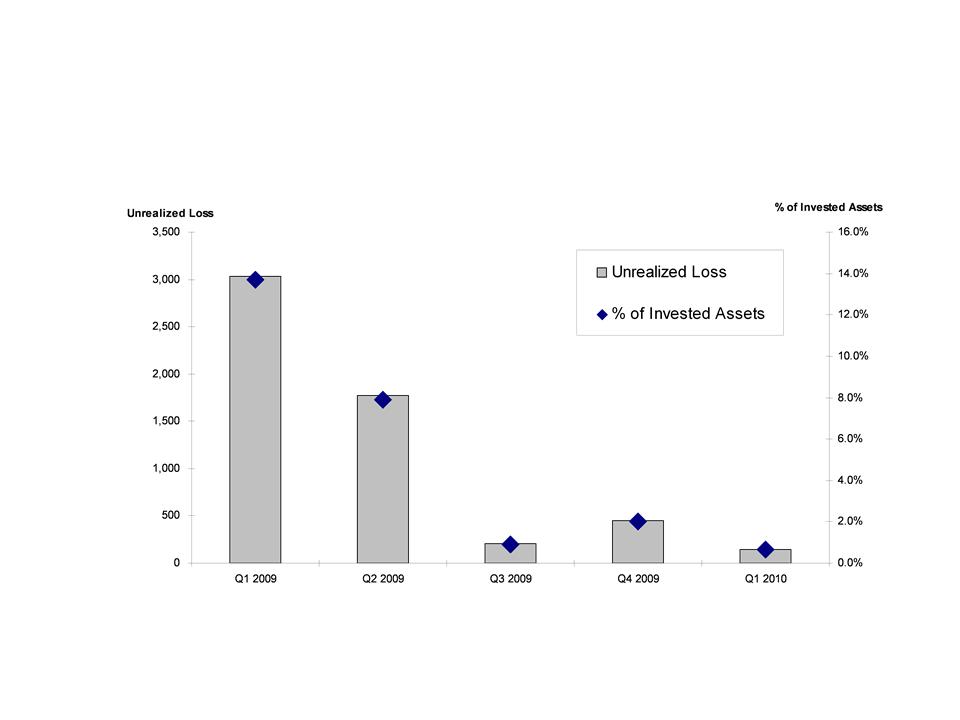
Unrealized Gain/Loss*
23
CNO
($ millions)
*Includes debt and equity securities classified as available for sale. Excludes investments from variable
interest entities which we consolidate under GAAP.

Q1 2010 Impairments
24
CNO
Corporates
Alt-A
Prime Jumbos
Commercial Mortgage Loans
Other
Total
($ millions)
Gross
Amounts
Amount Recognized
through Accumulated
Other Comprehensive
Loss
through Accumulated
Other Comprehensive
Loss
Amount Recognized
through Net Income
through Net Income
$1.2
5.0
0.7
10.9
2.5
$20.3
$0.0
(1.9)
(0.7)
0.0
0.0
$(2.6)
$1.2
3.1
0.0
10.9
2.5
$17.7
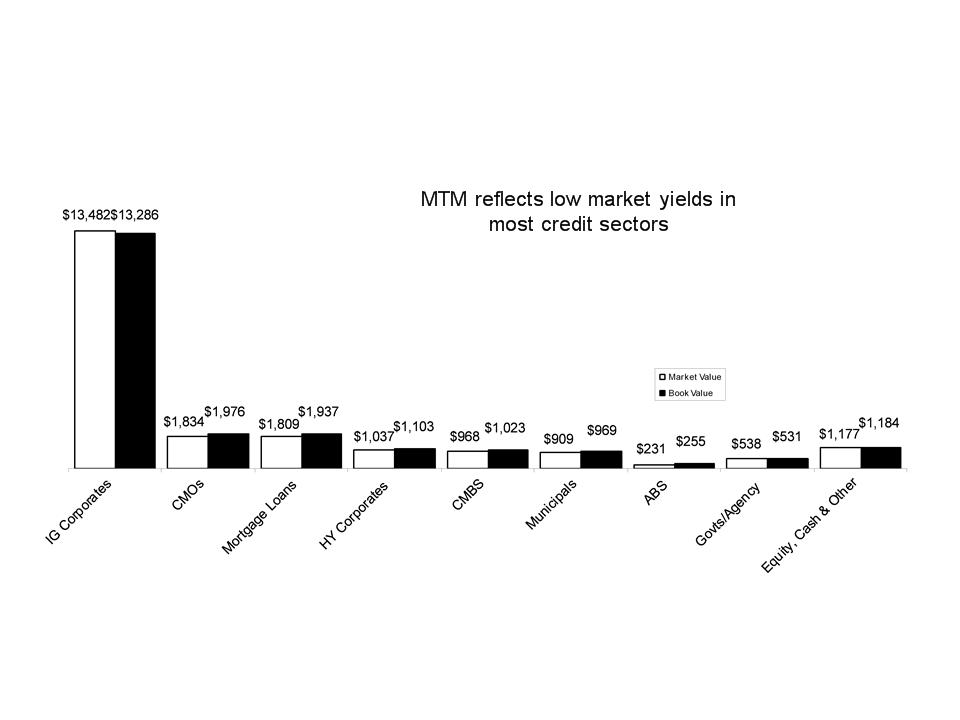
Asset Allocation at 3/31/10*
25
CNO
($ millions)
*Excludes investments from variable interest entities which we consolidate under GAAP (the related liabilities are
non-recourse to Conseco).
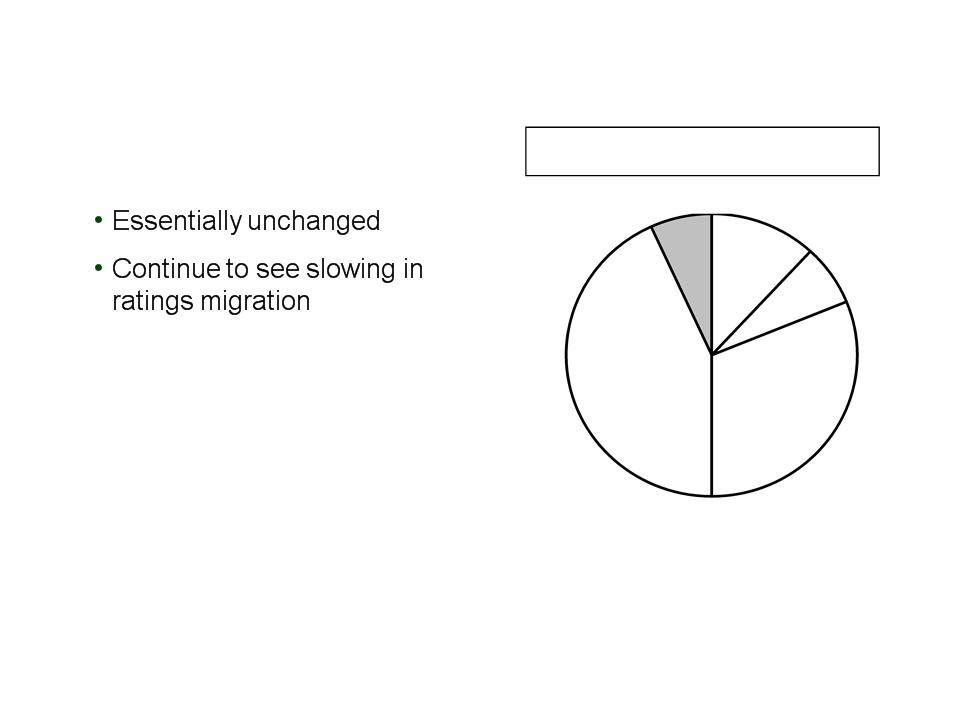
Investment Quality:
Fixed Maturities*
26
CNO
Actively Managed Fixed Maturities by Rating at
3/31/10 (Market Value)
3/31/10 (Market Value)
% of Bonds which are Investment Grade: | 3/31/09 91% | 6/30/09 91% | 9/30/09 93% | 12/31/09 93% | 3/31/10 93% |
*Excludes investments from variable interest entities which we consolidate under GAAP (the related liabilities are
non-recourse to Conseco).
AAA
12%
AA
7%
A
31%
BBB
43%
7%
§ 93% investment grade:

Alt-A at 3/31/10
CNO
27
AAA
AA
A
Total
$4.2
$53.9
$16.2
$140.9
$215.2
$4.2
$56.9
$16.5
$182.6
$260.2
2.0%
25.0%
7.5%
65.5%
100.0%
0.02%
0.24%
0.07%
0.65%
0.98%
Market
Value (mil.)
Book
Value (mil.)
% of
Alt-A*
% of
Portfolio*
Rating
§ 0.98% of total invested assets
§ Collateral performing better than overall Alt-A market in terms of delinquency and accumulated
loss trends
loss trends
§ All securities evaluated using market-consistent estimates of collateral performance
§ Relating to recovery of book values, adequate credit support to expected cumulative losses
720
707
721
710
710
Avg.
FICO
FICO
10.9%
13.0%
9.8%
9.2%
10.2%
Avg.
Support
6.5%
9.0%
8.7%
24.3%
18.9%
Avg. 60+
Delinq.
*Market value.
($ millions)
0.3%
0.7%
0.3%
2.6%
1.9%
Avg. Accum.
Loss

Prime Jumbo at 3/31/10
CNO
28
AAA
AA
A
BBB
Total
$129.7
$73.0
$161.1
$47.2
$208.2
$619.2
$141.0
$76.6
$176.6
$53.2
$263.3
$710.7
21.0%
11.8%
26.0%
7.6%
33.6%
100.0%
0.59%
0.33%
0.73%
0.21%
0.96%
2.82%
Market
Value (mil.)
Book
Value (mil.)
% of
Prime
Jumbo*
Jumbo*
% of
Portfolio*
Rating
§ 2.82% of total invested assets
§ All securities evaluated using market-consistent estimates of collateral performance
§ Credit support remains substantial relative to anticipated cumulative losses
736
744
740
743
738
739
Avg.
FICO
FICO
6.6%
7.6%
8.2%
7.4%
6.2%
7.0%
Avg.
Support
2.7%
5.2%
4.9%
7.0%
12.0%
7.0%
Avg. 60+
Delinq.
*Market value.
($ millions)
0.07%
0.36%
0.35%
0.67%
0.98%
0.53%
Avg. Accum.
Loss
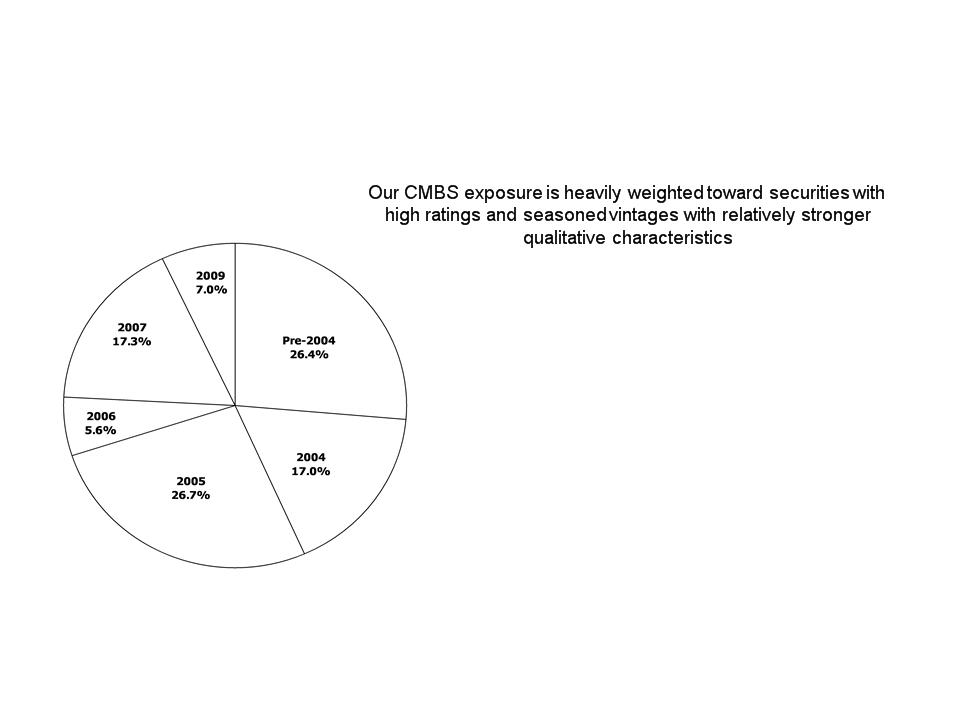
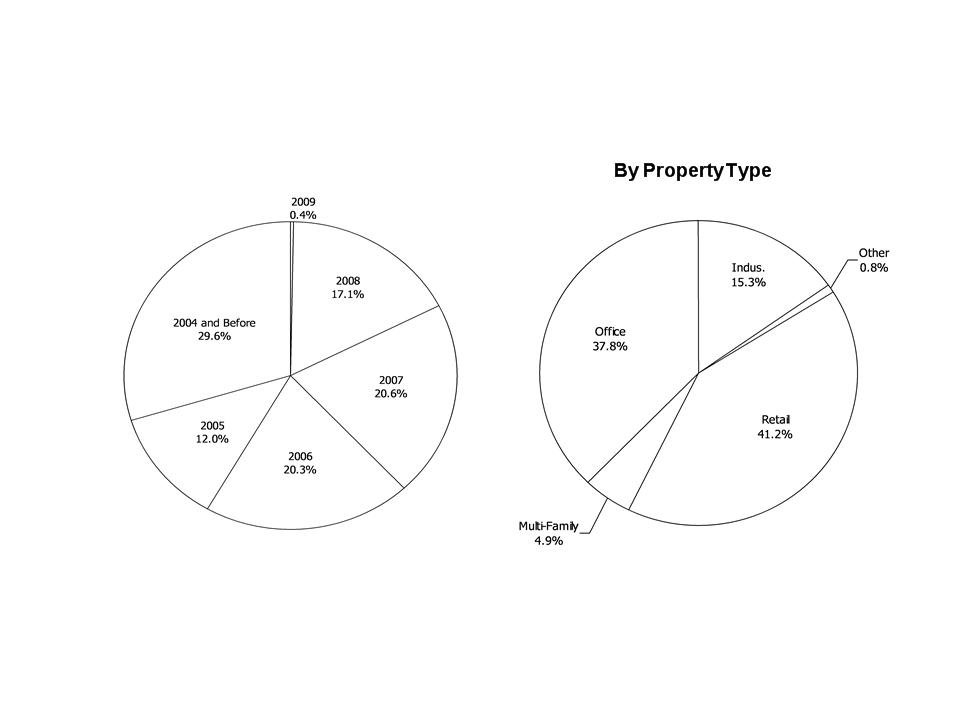
CMBS at 3/31/10
29
CNO
(GAAP book value - $ millions)
$200.8
$136.4
$208.3
$24.9
$176.5
$71.3
$818.2
$833.9
$26.3
$10.1
$22.0
$14.7
$0.0
$0.0
$73.1
$62.8
$37.4
$10.6
$5.9
$0.0
$0.0
$0.0
$53.9
$39.3
$5.9
$17.3
$13.1
$18.1
$0.0
$0.0
$54.4
$25.6
$0.0
$0.0
$23.3
$0.0
$0.0
$0.0
$23.3
$6.8
Pre-2004
2004
2005
2006
2007
2009
Total BV
Total MV
AAA
AA
A
BBB

CMBS at 3/31/10
CNO
30
AAA
AA
A
BBB
Total
$833.9
$62.8
$39.3
$25.6
6.8
$968.4
$818.2
$73.1
$53.9
$54.4
$23.3
$1,022.9
86.1%
6.5%
4.1%
2.6%
0.7%
100.0%
3.78%
0.29%
0.18%
0.12%
0.03%
4.40%
Market
Value (mil.)
Book
Value (mil.)
% of
CMBS*
% of
Portfolio*
Rating
§ 4.40% of invested assets
§ Collateral performing materially better than overall CMBS market in terms of delinquency and
cumulative loss
cumulative loss
§ All securities evaluated using market-consistent estimates of collateral performance
§ Substantial credit support inherent in structures relative to expected cumulative losses
30.7%
20.7%
8.4%
7.7%
4.0%
28.3%
Avg.
Support
3.4%
1.3%
1.1%
2.1%
1.3%
3.1%
Avg. 60+
Del. & FCR
*% of market value
($ millions)
0.32%
0.09%
0.15%
0.01%
0.08%
0.29%
Avg. Cum.
Loss
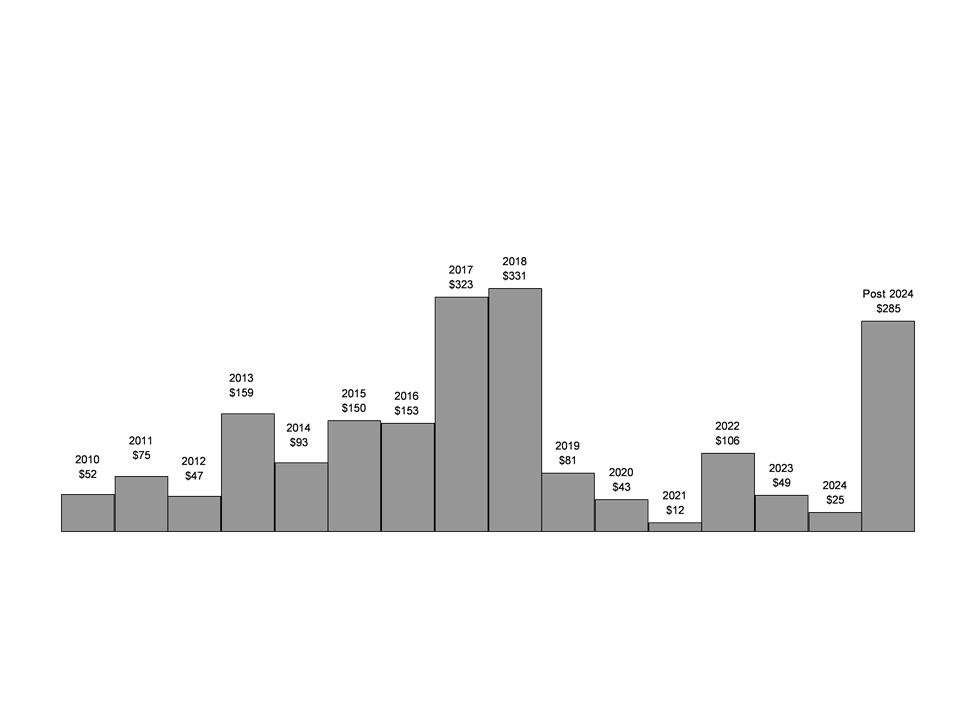
Commercial Mortgage Loans
at 3/31/10
By Vintage
31
CNO
§ Current LTV of approximately 63%
§ Trailing debt service coverage ratio (DSCR) stable at approximately 1.53
§ Three delinquent loans at 3/31/10, totaling $12 million

CNO Summary
32
CNO
�� Core sales and lead generation continue to be strong
§ Impact of health care reform
• Medicare Supplement and Medicare Advantage
• Potential opportunities in Supplemental Health market
§ Demographics are trending favorably
• First of Boomer population will become Medicare-eligible in 2011;
in 10 years, number of those 65 and older will increase by 50%
in 10 years, number of those 65 and older will increase by 50%
§ Focus:
• Improve results of underperforming blocks in new “Other CNO
Business” segment
Business” segment
• Drive sales growth in all channels
§ Expect to launch CNO Financial Group investor brand on May 12

33
Questions and Answers

34
Appendix
Statutory Surplus ($ millions)
*Also applicable in 2010 for Debt to Capital ratio only.
**Excludes Accumulated Other Comprehensive Loss, as defined by the senior credit facility.
$1,200
$1,100
Prior Amendment Level
New 2011 Level*
New 2012 Level
CNO
35
250%
200%
1.5x
2.0x
1.75x
225%
$1,300
Covenant Metrics

Q1 2010 Liquidity
36
CNO
($ millions)
Cash Balance 12/31/09
Sources
Dividends from insurance subsidiary
Net Proceeds from New Convertible Debentures
Surplus Debenture Interest
Management and Investment Fees and Other
Total Sources
Uses
Interest
Debt Repayments:
Retirement of Old Convertible Debentures
Holding Company Expenses and Other
Capital Contributions
Total Uses
Cash Balance 3/31/10
$146.1
$25.0
61.4
12.0
6.9
105.3
15.5
64.0
11.3
29.4
120.2
$131.2
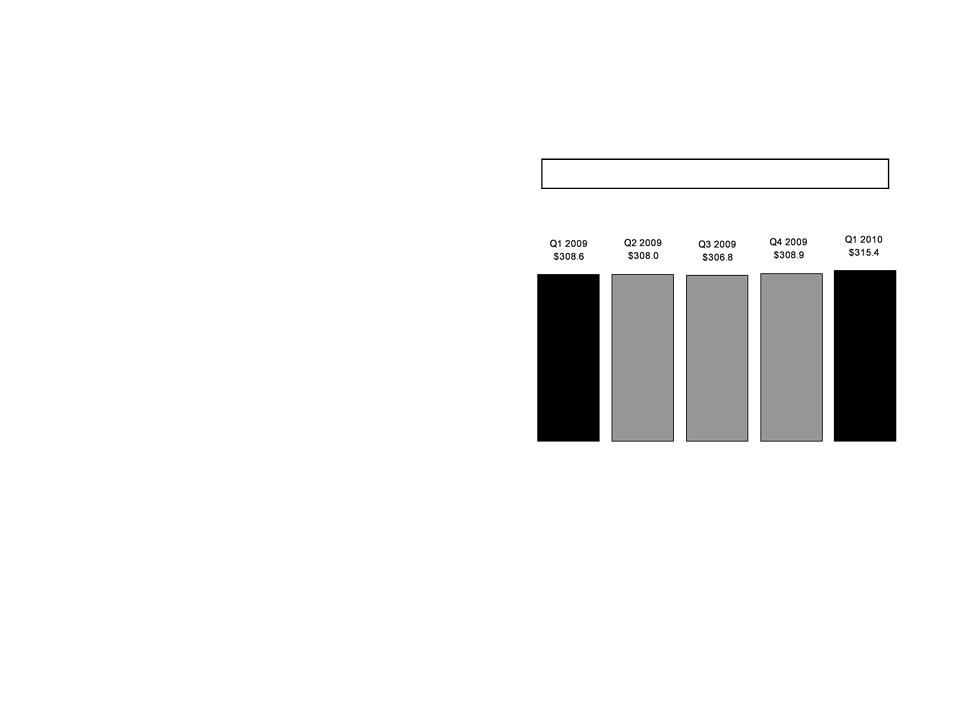
Net Investment Income
37
CNO
($ millions)
General Account Investment Income
Yield: | 5.67% | 5.65% | 5.63% | 5.66% | 5.76% |
§ Q1 2010 increase in yield due
primarily to higher call
premiums on fixed maturities
primarily to higher call
premiums on fixed maturities

Commercial Mortgage Loans
at 3/31/10
Geographic Distribution
38
CNO
Pacific
9.4%
Mountain
9.4%
West North
Central
Central
11.9%
West South
Central
Central
5.9%
East North
Central
Central
22.1%
East South
Central
Central
5.4%
New England
9.2%
Middle
Atlantic
Atlantic
6.4%
South
Atlantic
Atlantic
20.3%
Commercial Mortgage Loans
at 3/31/10
By Maturity
39
CNO
($ millions)
Expenses
40
CNO
($ millions)
Adjusted Operating Expenses*
*Adjusted operating expenses exclude primarily acquisition costs, capitalization of software development
costs, initial PFFS marketing costs and contractual vacancy charges related to exiting the Merchandise Mart
in Chicago. This measure is used by the Company to evaluate its progress in reducing operating expenses.
costs, initial PFFS marketing costs and contractual vacancy charges related to exiting the Merchandise Mart
in Chicago. This measure is used by the Company to evaluate its progress in reducing operating expenses.
§ Q1 2010 expenses returned
to a more stable level after
higher expense in Q4 2009
due to litigation cost, IT
expense and investment in
Operations re-engineering
to a more stable level after
higher expense in Q4 2009
due to litigation cost, IT
expense and investment in
Operations re-engineering
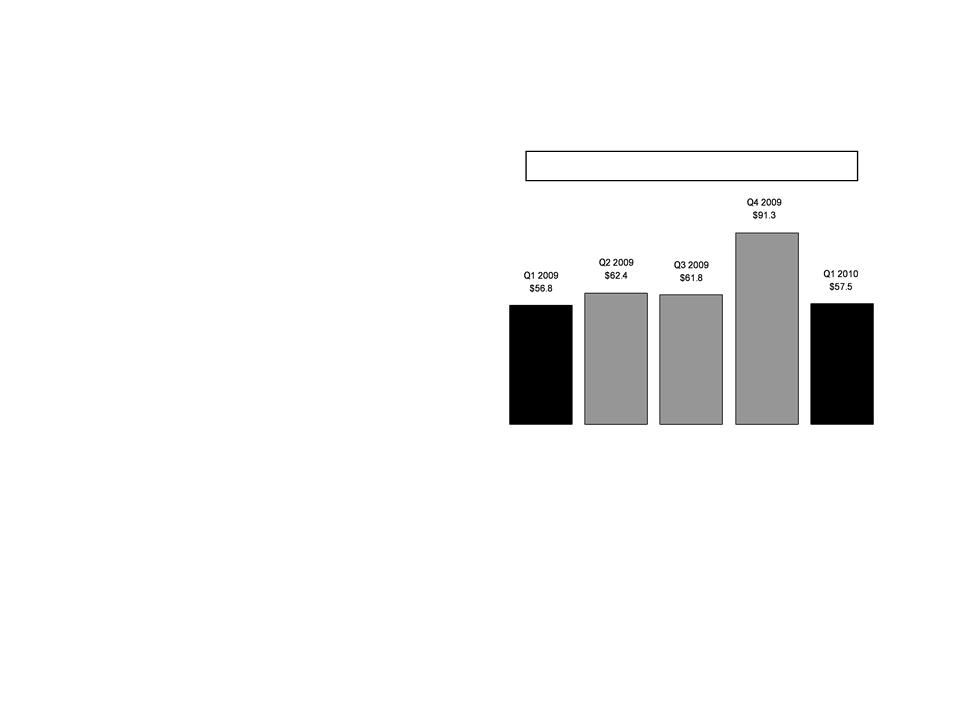
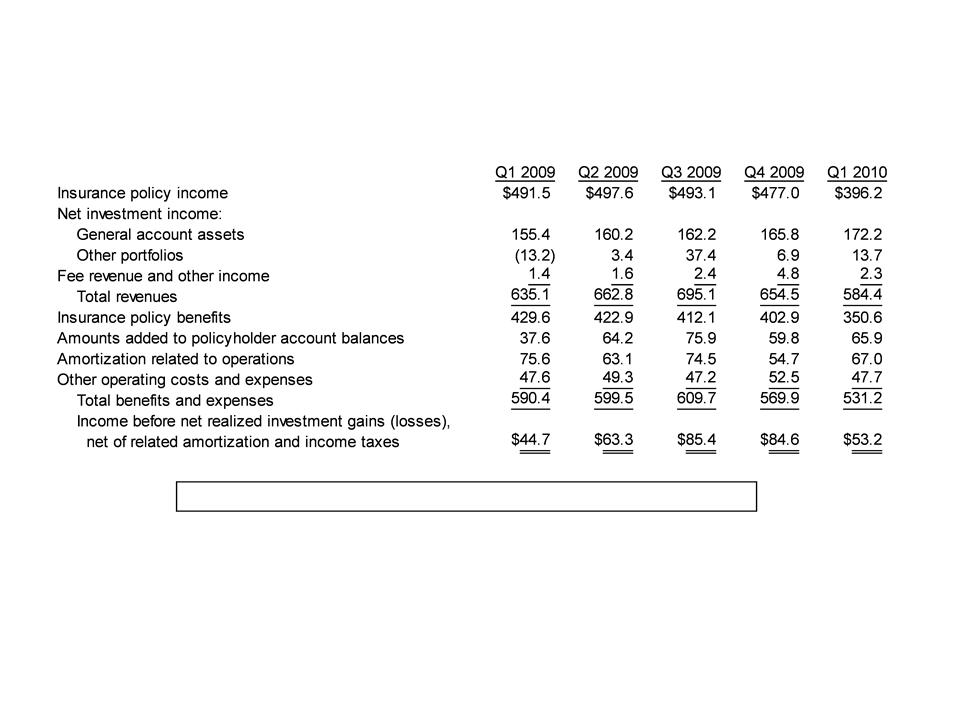
Segment Performance
41
Bankers
*Operating earnings exclude net realized gains (losses). See Appendix for corresponding GAAP measure of
our consolidated results of operations.
our consolidated results of operations.
PTOI-Trailing 4 Quarters: $187.1 $215.8 $233.4 $278.0 $286.5
Revenues-Quarterly: $635.1 $662.8 $695.1 $654.5 $584.4
Pre-Tax Operating Income*
Revenues -Tr. 4 Quarters: $2,686.3 $2,668.4 $2,684.4 $2,647.5 $2,596.8
($ millions)
§ Earnings up 19%, positively
affected by:
affected by:
• Higher Life income due to
favorable mortality and reserve
changes
favorable mortality and reserve
changes
• Higher PFFS/PDP income due
to favorable IBNR development
and higher PDP margins
to favorable IBNR development
and higher PDP margins
Premiums - -
Medicare Supplement
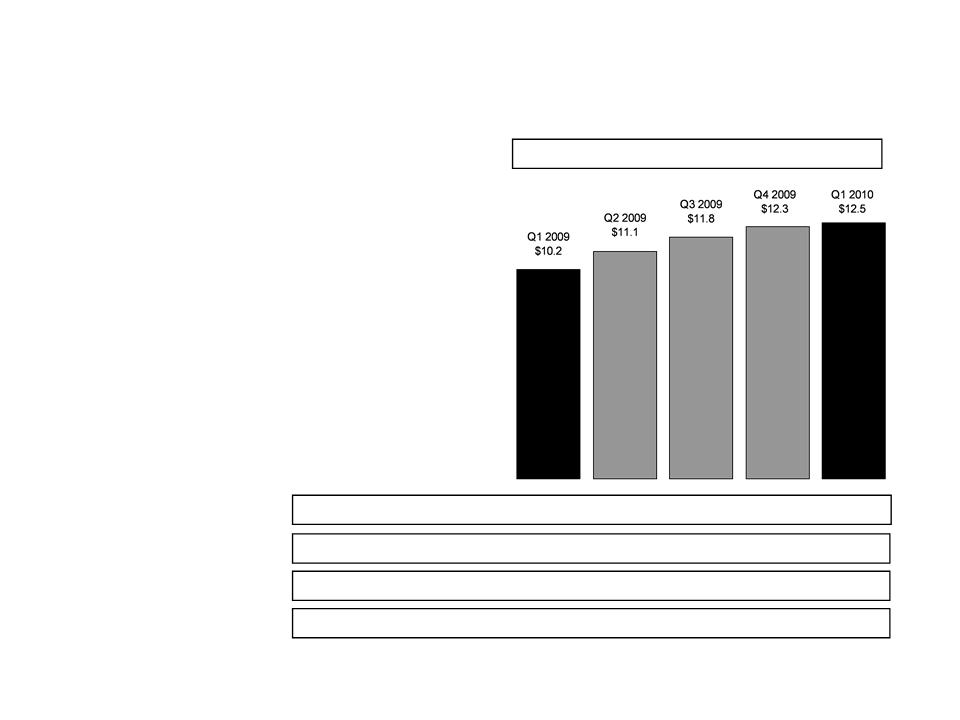
42
Bankers
§ First-year premiums up 38%
Med. Supp. First-Year Prems.-Tr. 4 Qtrs: $81.9 $83.6 $86.5 $91.7 $99.2
Med. Supp. Total Premiums-Quarterly: $155.8 $155.2 $168.9 $173.8 $176.6
Med. Supp. NAP-Quarterly: $18.4 $19.2 $19.9 $56.8 $19.4
Med. Supp. NAP-Trailing 4 Quarters: $79.9 $82.1 $85.4 $114.3 $115.3
($ millions)
Premiums - -
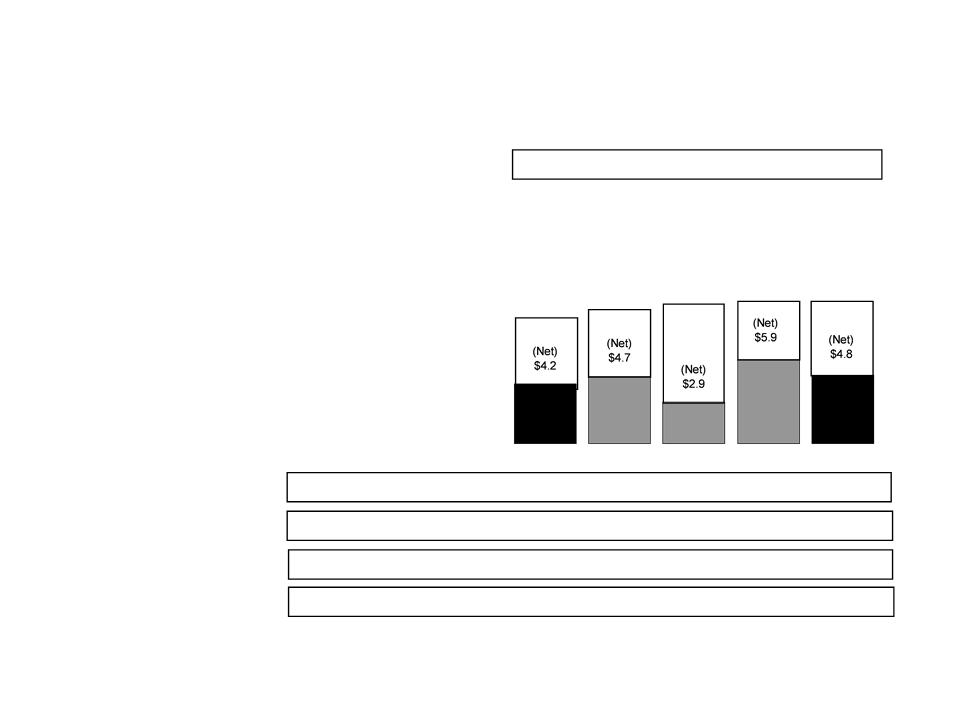
Long-Term Care
43
Bankers
($ millions)
First-Year Prems.-Tr. 4 Qtrs: $35.9 $30.0 $22.1 $17.7 $18.3
Total Premiums-Quarterly: $145.9 $151.9 $154.3 $149.5 $149.5
Long-Term Care - First-Year Premiums*
NAP-Quarterly: $7.5 $9.8 $9.8 $8.3 $8.6
NAP-Trailing 4 Quarters: $37.5 $36.6 $35.0 $35.4 $36.5
*Includes $4.4 million in both Q1 2009 and Q2 2009, $6.6 million in Q3 2009, $3.9 million in Q4 2009 and
$5.0 million in Q1 2010 of premiums ceded under new business reinsurance agreement.
Q2 2009
(Direct)
$9.1
Q1 2009
(Direct)
$8.6
Q3 2009
(Direct)
$9.5
Q4 2009
(Direct)
$9.8
Q1 2010
(Direct)
$9.8
§ First-year premiums up 14%
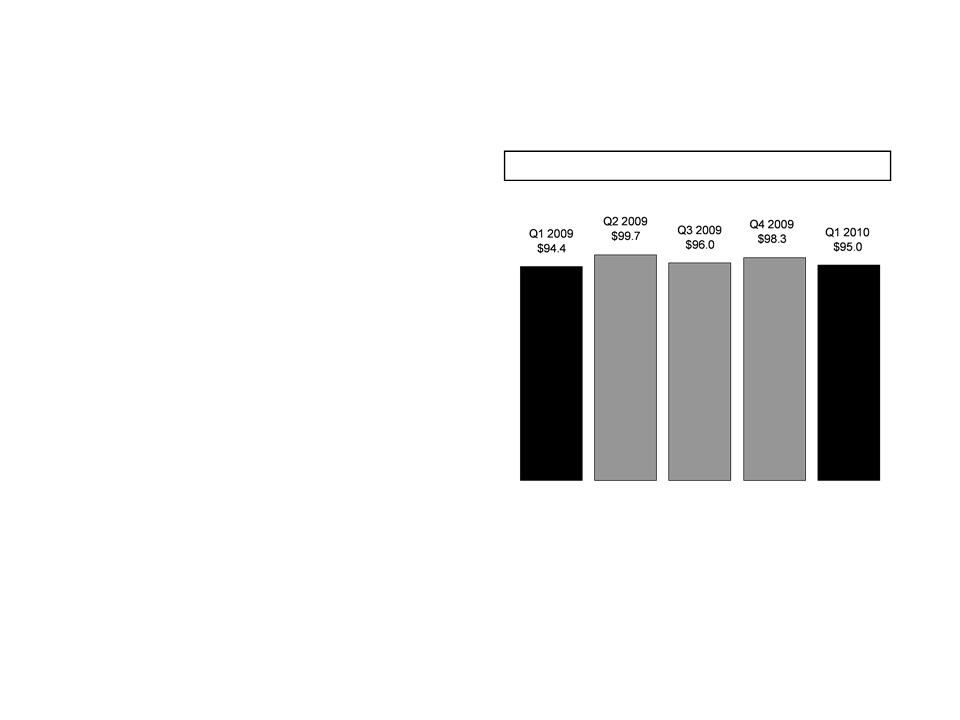
Premiums - -
Life Insurance
44
Bankers
($ millions)
First-Year Prems.-Tr. 4 Qtrs: $79.0 $75.9 $79.8 $82.6 $86.0
Total Premiums-Quarterly: $48.9 $55.3 $63.2 $61.4 $46.5
Life - First-Year Premiums
NAP-Quarterly: $12.6 $15.6 $15.8 $13.7 $15.8
NAP-Trailing 4 Quarters: $52.8 $52.7 $55.4 $57.7 $60.9
SPWL
Non-
SPWL
Q1 2009
$16.8
$6.2
$10.6
Q2 2009
$19.4
$7.8
$11.6
Q3 2009
$23.4
$10.5
$12.9
Q4 2009
$23.0
$10.8
$12.2
Q1 2010
$20.2
$9.6
$10.6
§ Fluctuations in first-year
premiums primarily reflect
variance in sales of single
-premium policies
premiums primarily reflect
variance in sales of single
-premium policies
§ Non-SPWL premiums
even
even
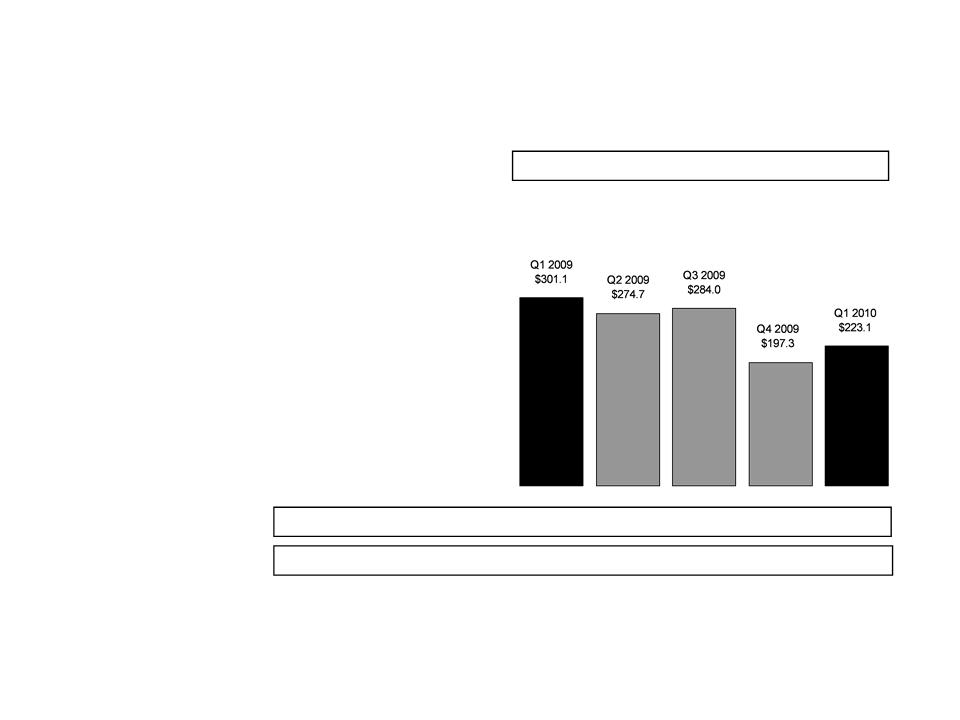
Premiums - -
Annuity
45
Bankers
($ millions)
First-Year Prems.-Tr. 4 Qtrs: $1,294.1 $1,308.7 $1,270.3 $1,057.1 $979.1
Total Premiums-Quarterly: $302.1 $275.4 $284.7 $198.2 $224.4
Annuity - - First-Year Premiums
§ First-year premiums down
26% as result of current
interest rate environment
26% as result of current
interest rate environment
Annuity Surrenders
46
Bankers
IA Surrenders
(annualized quarterly rate)
Non-IA Surrenders
(annualized quarterly rate)
§ Surrenders: both indexed and non-
indexed annuity surrenders lower
than prior year
indexed annuity surrenders lower
than prior year
§ Total account value:
• IAs - $1.7 billion
• Non-IAs - $4.8 billion
§ Average account value:
• IAs - $41,000
• Non-IAs - $36,000
§ Over 89% of our annuities are
subject to surrender charge:
subject to surrender charge:
• IAs - 95%
• Non-IAs - 86%
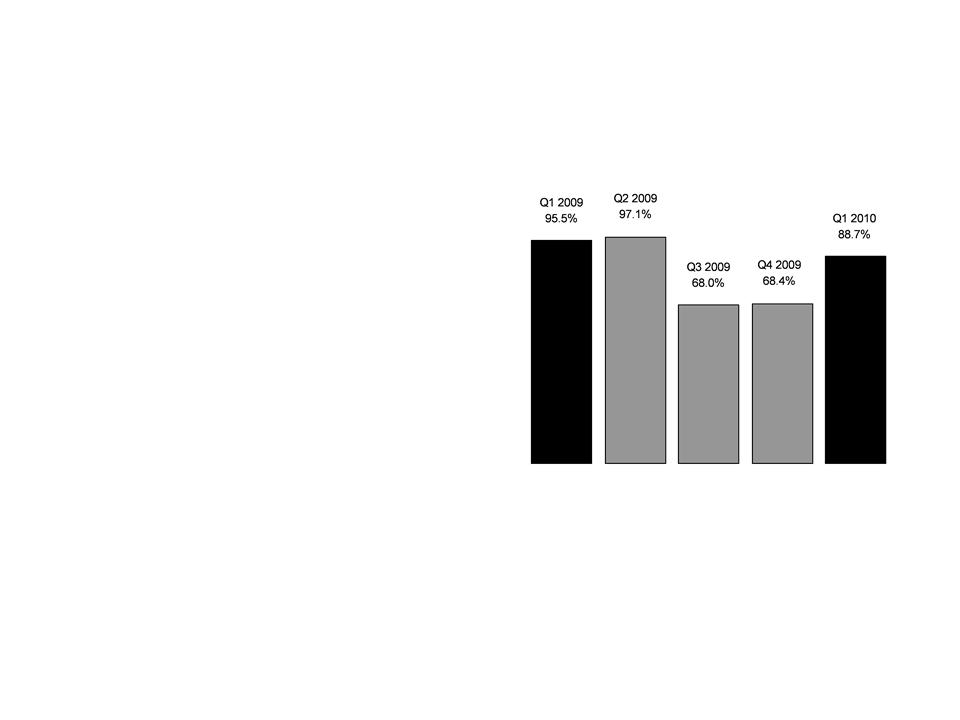
Benefit Ratio* - PDP
47
Bankers
*We calculate benefit ratios by dividing insurance policy benefits by insurance policy income.
§ Down 7%, impacted by
improved pricing and plan
design changes
improved pricing and plan
design changes
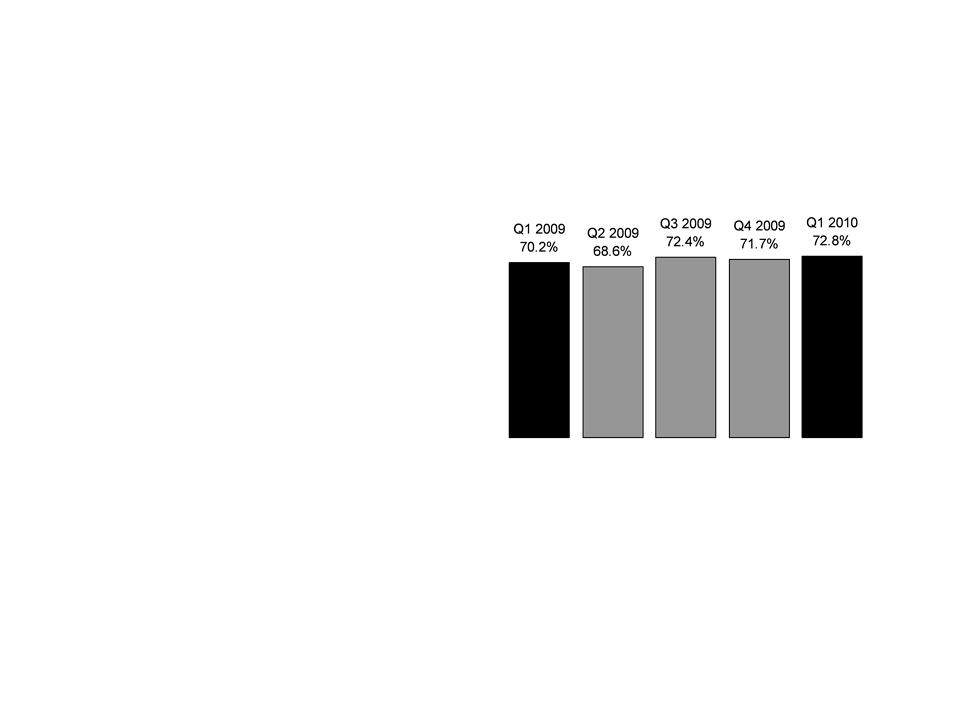
Benefit Ratio* -
Medicare Supplement
48
Bankers
*We calculate benefit ratios by dividing insurance policy benefits by insurance policy income.
§ Q1 2010 impacted by higher
incurred claims
incurred claims
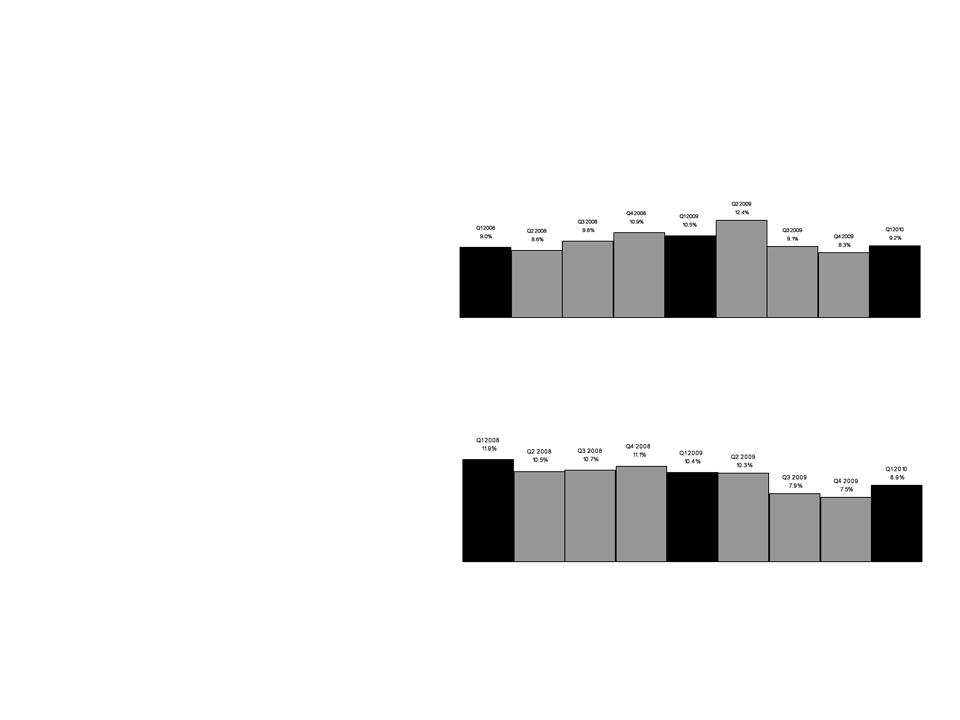
Interest-Adjusted Benefit Ratio* -
Long Term Care
49
Bankers
*We calculate interest-adjusted benefit ratios by dividing insurance policy benefits less interest income on
the accumulated assets backing the insurance liabilities by insurance policy income.
the accumulated assets backing the insurance liabilities by insurance policy income.
Trailing 4 Quarter Avg.: 71.4% 67.6% 68.2% 67.9% 69.6%
Qtrly. non-int. adjusted: 105.1% 103.2% 108.3% 104.3% 114.4%
§ Q1 2009 impacted by prior-
period rate increase activity
affecting lapses
period rate increase activity
affecting lapses
Segment Performance
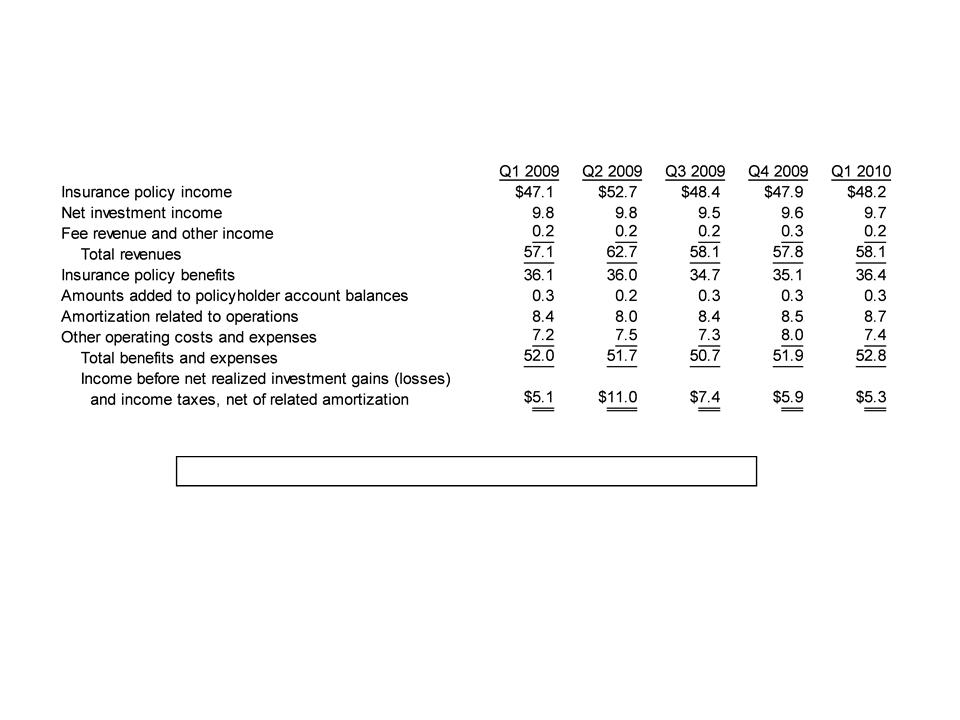
50
Colonial Penn
*Operating earnings exclude net realized gains (losses). See Appendix for corresponding GAAP measure of
our consolidated results of operations.
our consolidated results of operations.
PTOI-Trailing 4 Quarters: $26.6 $29.3 $30.2 $29.4 $29.6
Revenues-Quarterly: $57.1 $62.7 $58.1 $57.8 $58.1
Pre-Tax Operating Income*
Revenues -Tr. 4 Quarters: $229.4 $234.0 $235.1 $235.7 $236.7
($ millions)
§ Earnings up 4%
• Primarily due to favorable
mortality and growth in our block
of life insurance policies
mortality and growth in our block
of life insurance policies
Premiums - -
Life Insurance
51
Colonial Penn
($ millions)
First-Year Prems.-Tr. 4 Qtrs: $35.8 $35.3 $34.4 $33.0 $31.7
Total Premiums-Quarterly: $47.0 $45.8 $45.6 $48.9 $47.3
Life - First-Year Premiums
NAP-Quarterly: $12.3 $10.6 $10.6 $8.4 $13.1
NAP-Trailing 4 Quarters: $49.7 $45.8 $44.3 $41.9 $42.7
§ Sales (NAP) up 7%
• Lead generation momentum
building following 2009 capital
limitations
building following 2009 capital
limitations
• Increased lead activity will drive
return to pre-2009 sales levels
return to pre-2009 sales levels
• NAP from lead-based programs
up 32% over Q1 2009, and 76%
over Q4 2009
up 32% over Q1 2009, and 76%
over Q4 2009
Segment Performance
52
CIG
*Operating earnings exclude net realized gains (losses). See Appendix for corresponding GAAP measure
of our consolidated results of operations.
of our consolidated results of operations.
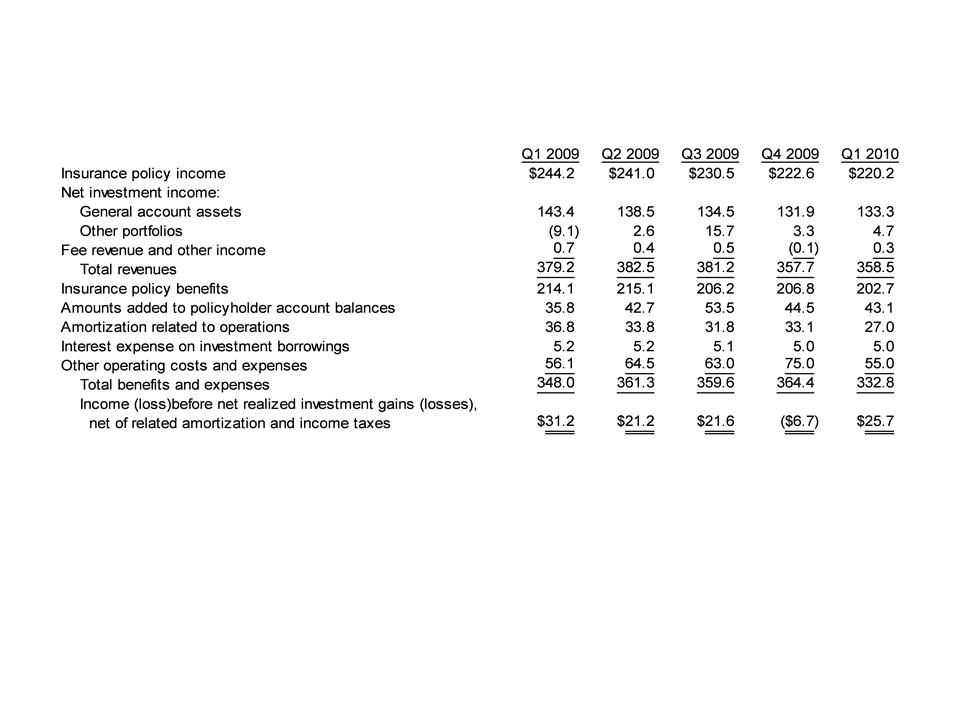
PTOI-Trailing 4 Quarters: $129.2 $118.1 $105.5 $67.3 $61.8
Revenues-Quarterly: $379.2 $382.5 $381.2 $357.7 $358.5
Pre-Tax Operating Income (loss)*
Revenues-Tr. 4 Quarters: $1,511.7 $1,515.9 $1,525.3 $1,500.6 $1,479.9
($ millions)
§ Earnings down 18%
• Lower Specified Disease income
due primarily to reserve releases in
Q1 2009
due primarily to reserve releases in
Q1 2009
• Lower Life income due primarily to
lost earnings on blocks reinsured in
2009
lost earnings on blocks reinsured in
2009
• Higher Annuity income due to lower
surrenders on indexed annuities
surrenders on indexed annuities
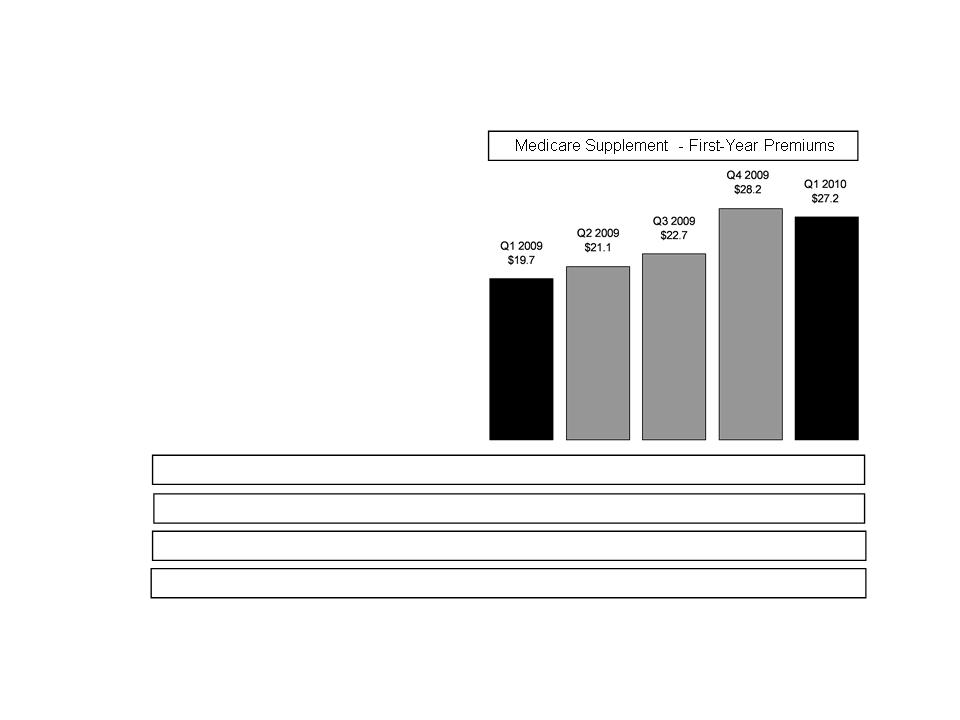
Premiums - -
Medicare Supplement
53
($ millions)
First-Year Prems.-Tr. 4 Qtrs: $8.3 $7.9 $8.0 $7.2 $6.9
Total Premiums-Quarterly: $42.8 $44.4 $46.9 $43.7 $40.7
Medicare Supplement - - First-Year Premiums
NAP-Quarterly: $1.7 $1.3 $1.3 $1.5 $1.1
NAP-Trailing 4 Quarters: $8.3 $8.3 $7.8 $5.8 $5.2
§ First-year collections down 20%
• Focus on core products (i.e.,
Specified Disease)
Specified Disease)
Premiums - -
Specified Disease
54
CIG
($ millions)
First-Year Prems.-Tr. 4 Qtrs: $40.2 $41.5 $43.6 $45.4 $47.7
Total Premiums-Quarterly: $93.0 $95.1 $96.2 $99.0 $99.6
Specified Disease - First-Year Premiums
NAP-Quarterly: $11.5 $14.7 $16.1 $15.2 $14.6
NAP-Trailing 4 Quarters: $48.7 $51.0 $54.3 $57.5 $60.6
§ NAP up 28%
• Increased focus on Specified
Disease products
Disease products
• Momentum increasing in
Worksite market
Worksite market
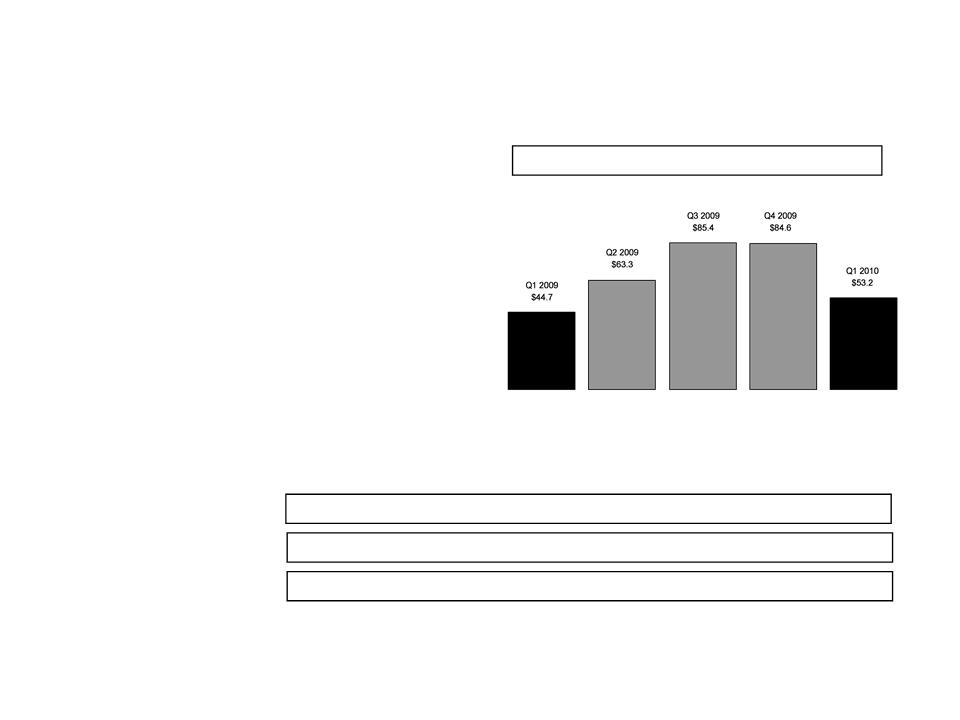
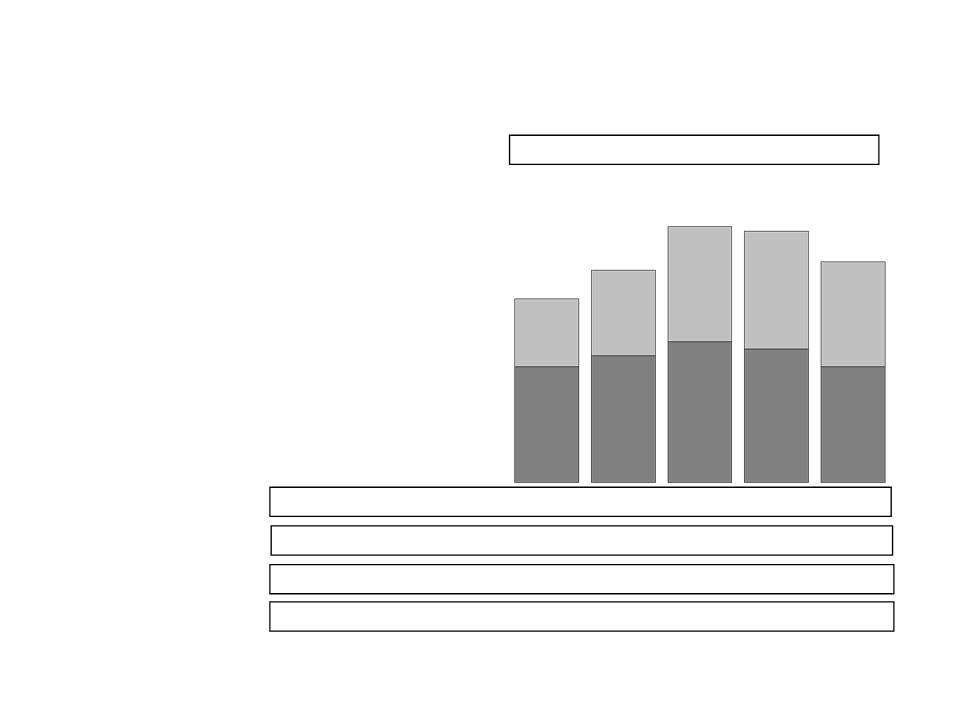
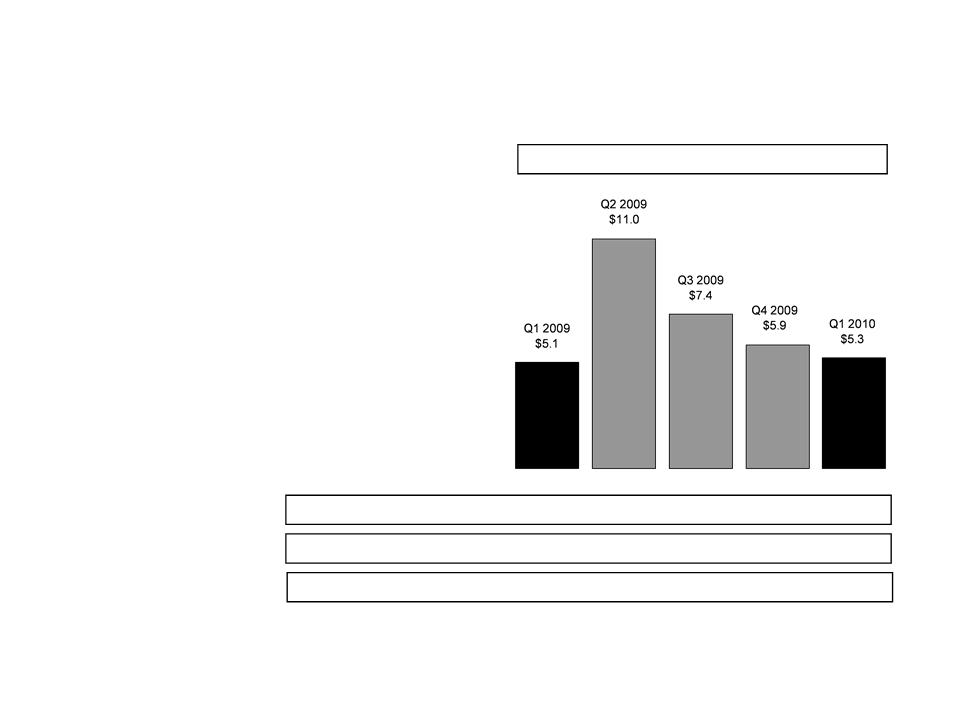
Premiums - -
Annuity
55
CIG
($ millions)
First-Year Prems.-Tr. 4 Qtrs: $98.5 $84.7 $83.0 $71.8 $57.7
Total Premiums-Quarterly: $19.5 $22.3 $25.2 $11.4 $5.1
Annuity - - First-Year Premiums
§ First-year collections down 79%
• Increased focus on core products
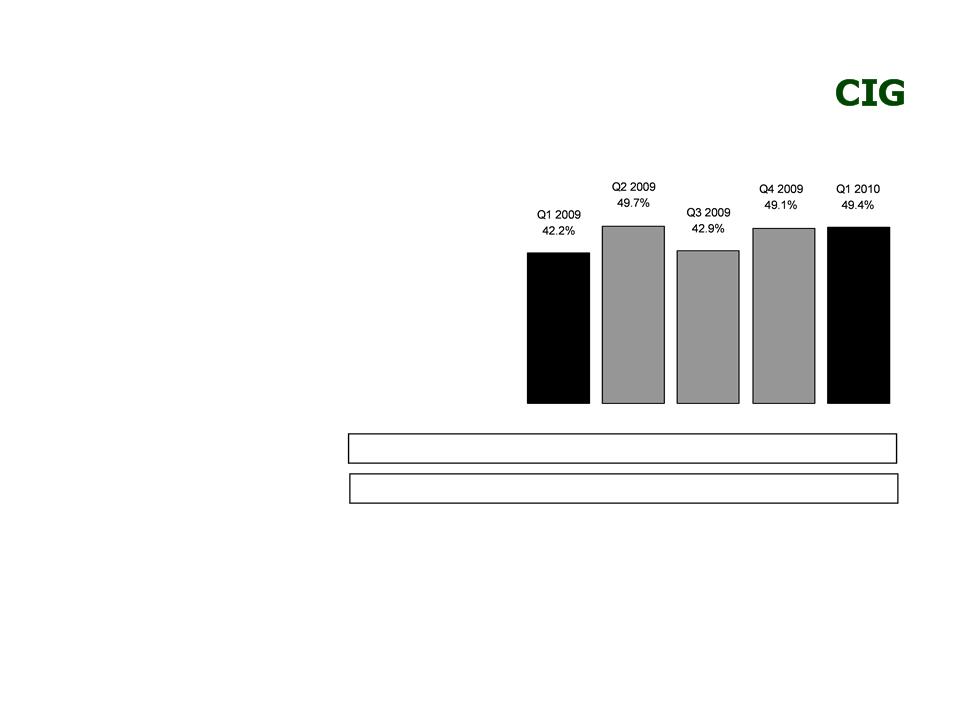
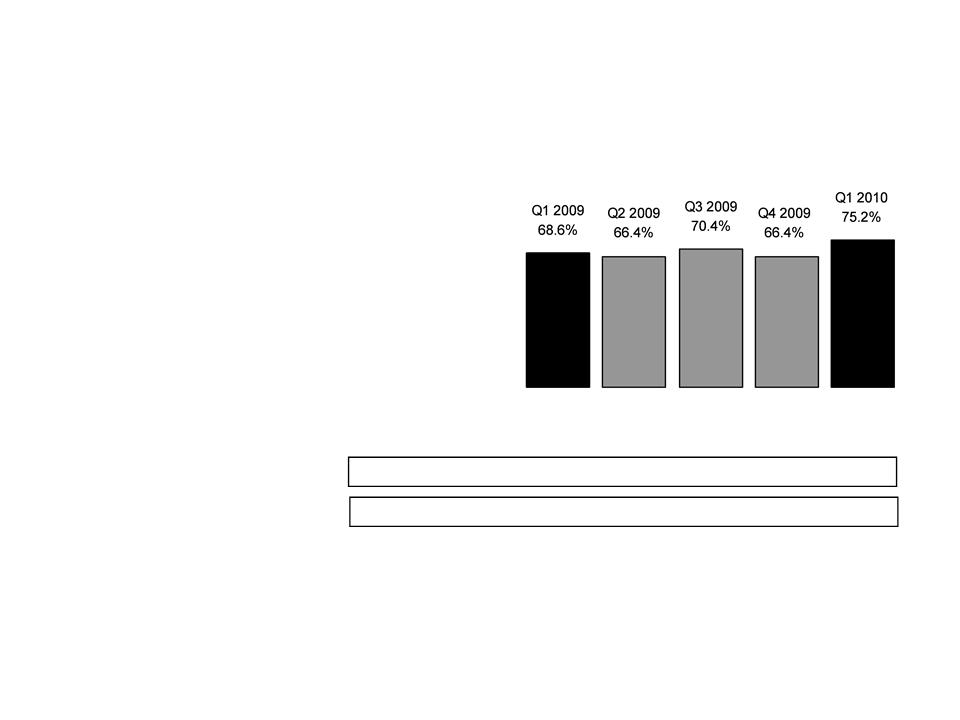
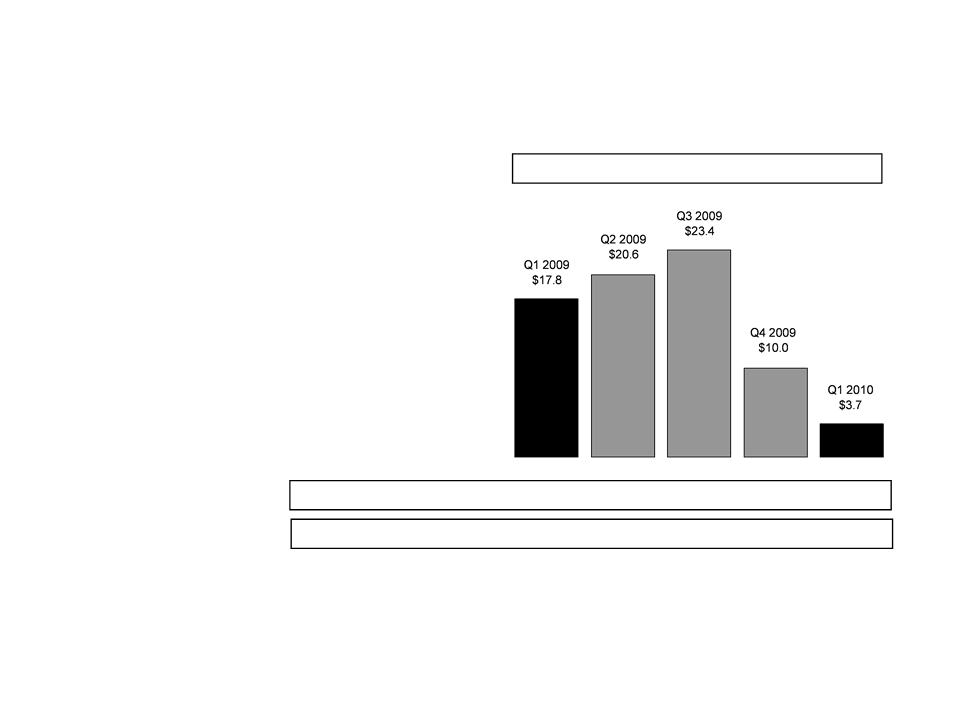
Interest-Adjusted Benefit Ratio* -
Specified Disease
56
Trailing 4 Quarter Avg.: 41.8% 42.6% 41.2% 46.0% 47.8%
Qtrly. non-int. adjusted: 76.0% 83.3% 76.6% 82.0% 82.3%
*We calculate interest-adjusted benefit ratios by dividing insurance policy benefits, less interest income on
the accumulated assets backing the insurance liabilities, by insurance policy income.
the accumulated assets backing the insurance liabilities, by insurance policy income.
§ Up 17% vs Q1 2009, which was
impacted by reserve releases
impacted by reserve releases

57
Information Related to Certain Non-GAAP Financial Measures
The following provides additional information regarding certain non-GAAP measures used in this presentation. A non-GAAP measure is a
numerical measure of a company’s performance, financial position, or cash flows that excludes or includes amounts that are normally excluded
or included in the most directly comparable measure calculated and presented in accordance with GAAP. While management believes these
measures are useful to enhance understanding and comparability of our financial results, these non-GAAP measures should not be considered
as substitutes for the most directly comparable GAAP measures. Additional information concerning non-GAAP measures is included in our
periodic filings with the Securities and Exchange Commission that are available in the “Investor - - SEC Filings” section of Conseco’s website,
www.conseco.com.
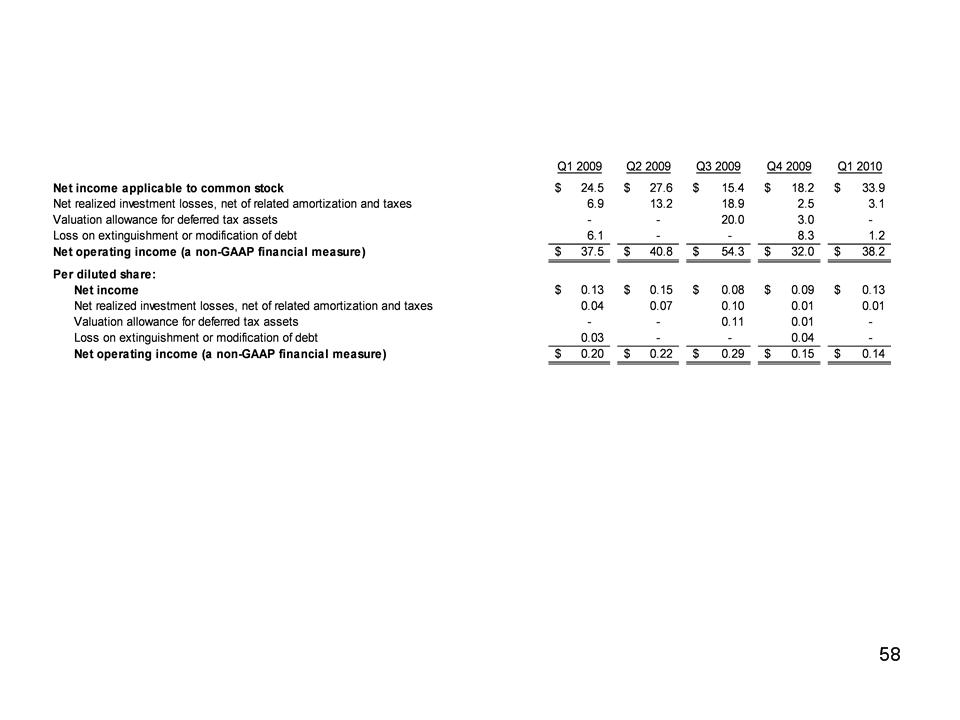
Operating earnings measures
Management believes that an analysis of net income applicable to common stock before loss on extinguishment or modification of debt, net
realized gains or losses and increases to our valuation allowance for deferred tax assets (“net operating income,” a non-GAAP financial
measure) is important to evaluate the performance of the Company and is a key measure commonly used in the life insurance industry.
Management uses this measure to evaluate performance because loss on extinguishment or modification of debt, realized investment gains or
losses and increases to our valuation allowance for deferred tax assets are unrelated to the Company’s continuing operations.
Information Related to Certain Non-GAAP Financial Measures
A reconciliation of net income applicable to common stock to net operating income (and related per-share amounts) is as follows (dollars in
millions, except per-share amounts):
millions, except per-share amounts):

Book value, excluding accumulated other comprehensive income, per share
This non-GAAP financial measure differs from book value per share because accumulated other comprehensive income has been excluded
from the book value used to determine the measure. Management believes this non-GAAP financial measure is useful because it removes the
volatility that arises from changes in accumulated other comprehensive income. Such volatility is often caused by changes in the estimated fair
value of our investment portfolio resulting from changes in general market interest rates rather than the business decisions made by
management.
A reconciliation from book value per share to book value per share, excluding accumulated other comprehensive income (loss) is as follows
(dollars in millions, except per share amounts):
(dollars in millions, except per share amounts):
Information Related to Certain Non-GAAP Financial Measures

60
Operating return measures
Management believes that an analysis of return before loss on extinguishment or modification of debt, net realized gains or losses, and
increases to our valuation allowance for deferred tax assets (“net operating income,” a non-GAAP financial measure) is important to evaluate the
performance of the Company and is a key measure commonly used in the life insurance industry. Management uses this measure to evaluate
performance because loss on extinguishment or modification of debt, realized investment gains or losses, and increases to our valuation
allowance for deferred tax assets are unrelated to the Company’s continued operations.
This non-GAAP financial measure also differs from return on equity because accumulated other comprehensive income (loss) has been
excluded from the value of equity used to determine this ratio. Management believes this non-GAAP financial measure is useful because it
removes the volatility that arises from changes in accumulated other comprehensive income (loss). Such volatility is often caused by changes in
the estimated fair value of our investment portfolio resulting from changes in general market interest rates rather than the business decisions
made by management.
In addition, our equity includes the value of significant net operating loss carryforwards (included in income tax assets). In accordance with
GAAP, these assets are not discounted, and accordingly will not provide a return to shareholders (until after it is realized as a reduction to taxes
that would otherwise be paid). Management believes that excluding this value from the equity component of this measure enhances the
understanding of the effect these non-discounted assets have on operating returns and the comparability of these measures from period-to-
period. Operating return measures are used in measuring the performance of our business units and are used as a basis for incentive
compensation.
All references to segment operating return measures assume a 25% debt to total capital ratio at the segment level. Additionally, corporate
expenses have been allocated to the segments.
expenses have been allocated to the segments.
Information Related to Certain Non-GAAP Financial Measures
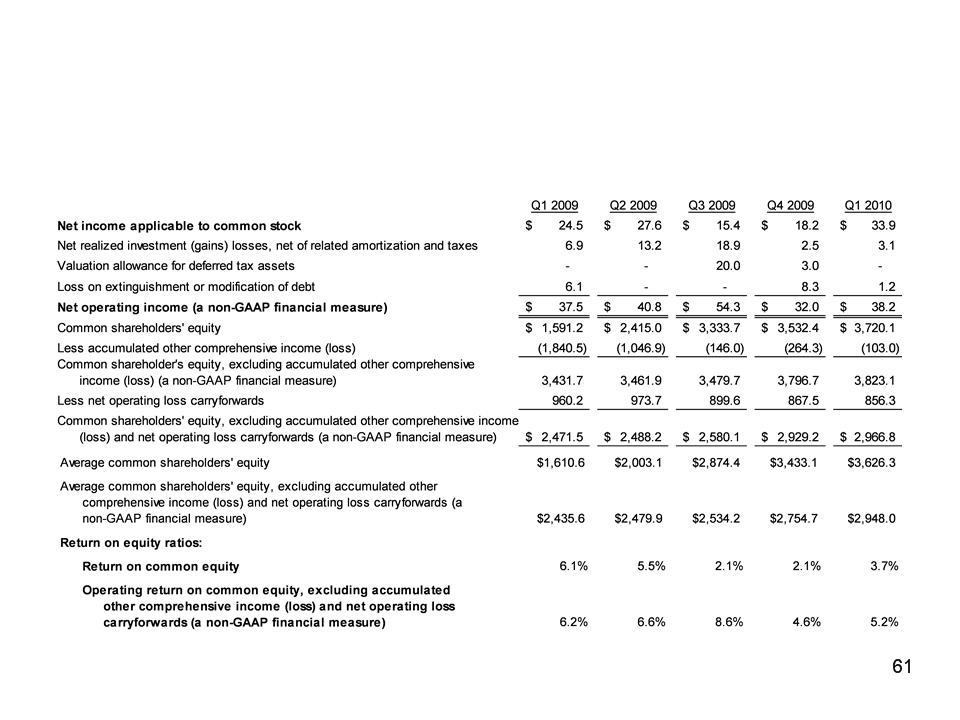
A reconciliation of return on common equity to operating return on common equity (excluding accumulated other comprehensive income (loss) and
net operating loss carryforwards) is as follows (dollars in millions, except per share amounts):
net operating loss carryforwards) is as follows (dollars in millions, except per share amounts):
Information Related to Certain Non-GAAP Financial Measures
62
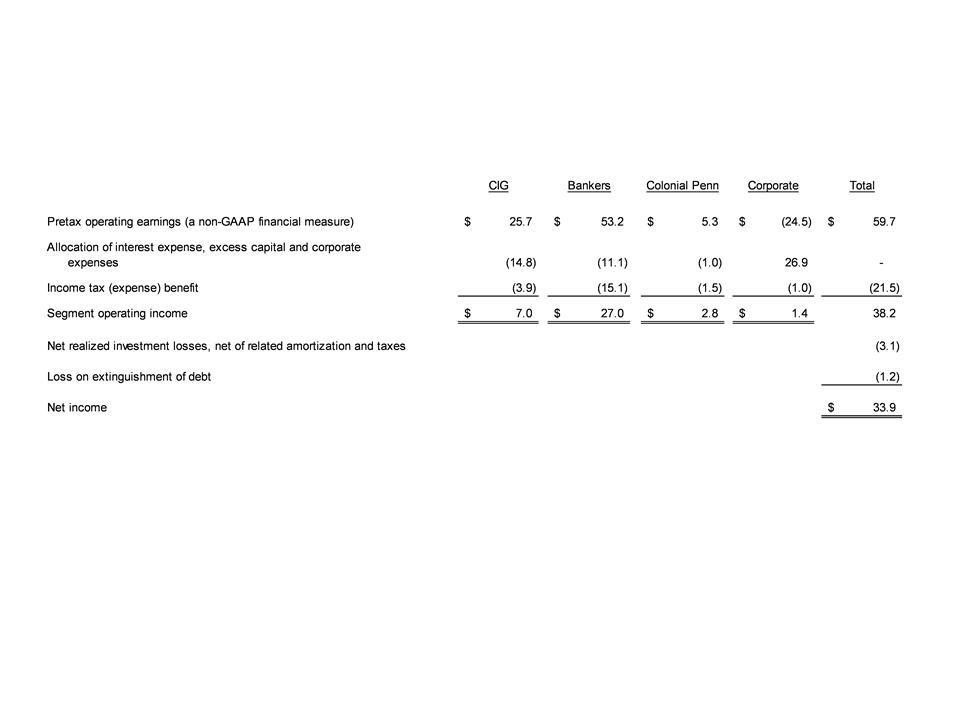
A reconciliation of pretax operating earnings (a non-GAAP financial measure) to segment operating income (loss) and consolidated net income
(loss) for the quarter ended March 31, 2010, is as follows (dollars in millions):
(loss) for the quarter ended March 31, 2010, is as follows (dollars in millions):
(Continued on next page)
Information Related to Certain Non-GAAP Financial Measures

63
A reconciliation of common shareholders’ equity, excluding accumulated other comprehensive income (loss) and net operating loss
carryforwards (a non-GAAP financial measure) to common shareholders’ equity at March 31, 2010, is as follows (dollars in millions):
carryforwards (a non-GAAP financial measure) to common shareholders’ equity at March 31, 2010, is as follows (dollars in millions):
(Continued on next page)
(Continued from previous page)
Information Related to Certain Non-GAAP Financial Measures
64
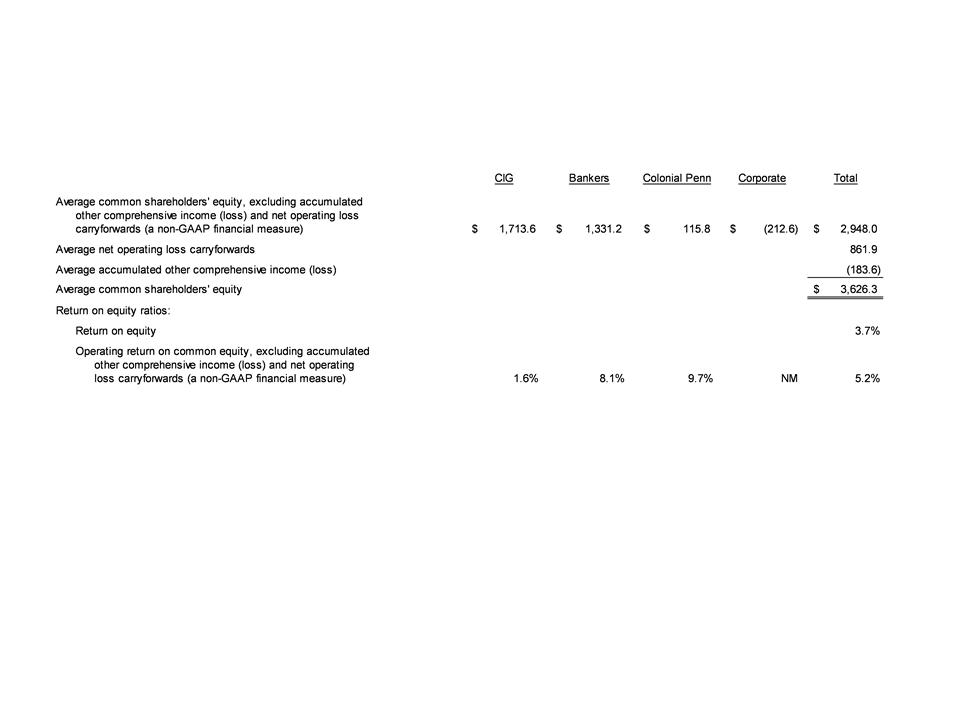
A reconciliation of average common shareholders’ equity, excluding accumulated other comprehensive income (loss) and net operating loss
carryforwards (a non-GAAP financial measure) to average common shareholders’ equity at March 31, 2010, is as follows (dollars in millions):
carryforwards (a non-GAAP financial measure) to average common shareholders’ equity at March 31, 2010, is as follows (dollars in millions):
(Continued from previous page)
Information Related to Certain Non-GAAP Financial Measures
65
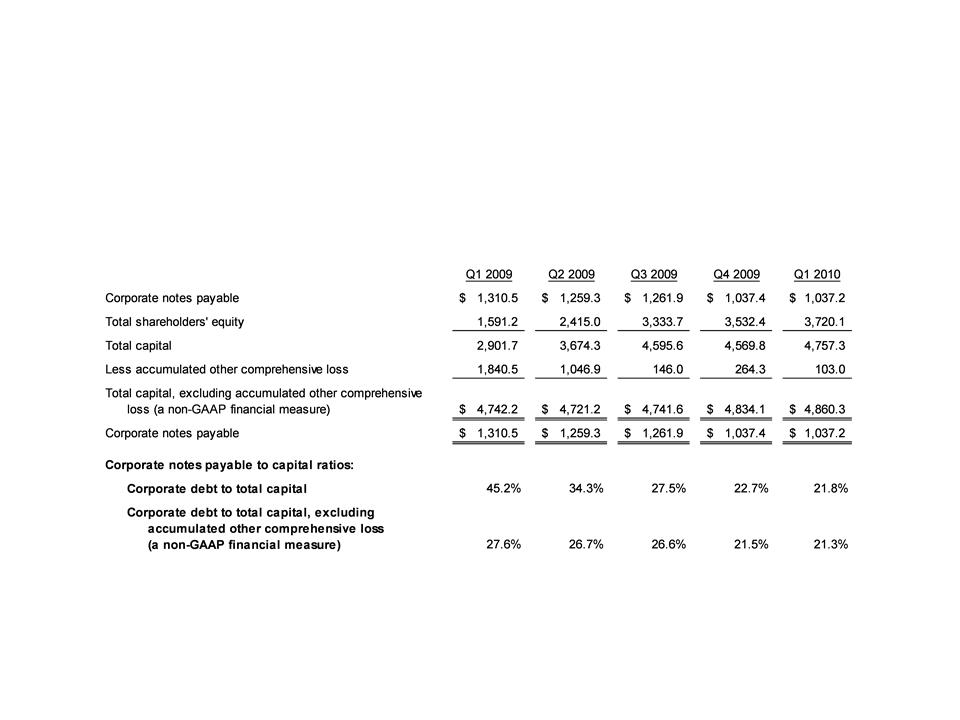
A reconciliation of the debt to capital ratio to debt to capital, excluding accumulated other comprehensive loss is as follows (dollars in millions):
Debt to capital ratio, excluding accumulated other comprehensive income (loss)
This non-GAAP financial measure differs from the debt to capital ratio because accumulated other comprehensive income has been excluded
from the value of capital used to determine this measure. Management believes this non-GAAP financial measure is useful because it removes
the volatility that arises from changes in accumulated other comprehensive income. Such volatility is often caused by changes in the estimated
fair value of our investment portfolio resulting from changes in general market interest rates rather than the business decisions made by
management.
Information Related to Certain Non-GAAP Financial Measures