UNITED STATES
SECURITIES AND EXCHANGE COMMISSION
Washington, D.C. 20549
Form 10-K
[ X ] Annual report pursuant to Section 13 or 15(d) of the Securities Exchange Act of 1934
For the fiscal year ended December 31, 2010 or
[ ] Transition report pursuant to Section 13 or 15(d) of the Securities Exchange Act of 1934
For the transition period from _________ to _________
Commission file number: 001-31792
CNO Financial Group, Inc.
| Delaware | | 75-3108137 |
| State of Incorporation | | IRS Employer Identification No. |
| | | |
| 11825 N. Pennsylvania Street | | |
| Carmel, Indiana 46032 | | (317) 817-6100 |
| Address of principal executive offices | | Telephone |
Securities registered pursuant to Section 12(b) of the Act:
| Title of each class | | Name of Each Exchange on which Registered |
| Common Stock, par value $0.01 per share | | New York Stock Exchange |
| Rights to purchase Series A Junior Participating Preferred Stock | | New York Stock Exchange |
Securities registered pursuant to Section 12(g) of the Act:
None
Indicate by check mark if the registrant is a well-known seasoned issuer, as defined in Rule 405 of the Securities Act.
Yes [ X ] No [ ]
Indicate by check mark if the registrant is not required to file reports pursuant to Section 13 or 15(d) of the Act.
Yes [ ] No [ X ]
Indicate by check mark whether the Registrant (1) has filed all reports required to be filed by Section 13 or 15(d) of the Securities Exchange Act of 1934 during the preceding 12 months (or for such shorter period that the registrant was required to file such reports) and (2) has been subject to such filing requirements for the past 90 days: Yes [ X ] No [ ]
Indicate by check mark whether the registrant has submitted electronically and posted on its corporate Website, if any, every Interactive Data File required to be submitted and posted pursuant to Rule 405 of Regulation S-T (§232.405 of this chapter) during the preceding 12 months (or for such shorter period that the registrant was required to submit and post such files). Yes [ X ] No [ ]
Indicate by check mark if disclosure of delinquent filers pursuant to Item 405 of Regulation S-K is not contained herein, and will not be contained, to the best of Registrant’s knowledge, in definitive proxy or information statements incorporated by reference in Part III of this Form 10-K or any amendment to this Form 10-K. [ X ]
Indicate by check mark whether the Registrant is a large accelerated filer, an accelerated filer, a non-accelerated filer or a smaller reporting company. See the definitions of “large accelerated filer,” “accelerated filer” and “smaller reporting company” in Rule 12b-2 of the Exchange Act. Large accelerated filer [ X ] Accelerated filer [ ] Non-accelerated filer [ ] Smaller reporting company [ ]
Indicate by check mark whether the registrant is a shell company (as defined in Rule 12b-2 of the Exchange Act): Yes [ ] No [ X ]
At June 30, 2010, the last business day of the Registrant’s most recently completed second fiscal quarter, the aggregate market value of the Registrant’s common equity held by nonaffiliates was approximately $1,225 million.
Indicate by check mark whether the Registrant has filed all documents and reports required to be filed by Section 12, 13 or 15(d) of the Securities Exchange Act of 1934 subsequent to the distribution of securities under a plan confirmed by a court. Yes [ ] No [ ]
Shares of common stock outstanding as of February 11, 2011: 251,084,174
DOCUMENTS INCORPORATED BY REFERENCE: Portions of the Registrant’s definitive proxy statement for the 2011 annual meeting of shareholders are incorporated by reference into Part III of this report.
| TABLE OF CONTENTS |
| | | |
| | | Page |
| PART I | | |
| | | |
| Item 1. | Business of CNO | 3 |
| | | |
| Item 1A. | Risk Factors | 24 |
| | | |
| Item 1B. | Unresolved Staff Comments | 42 |
| | | |
| Item 2. | Properties | 42 |
| | | |
| Item 3. | Legal Proceedings | 42 |
| | | |
| | Executive Officers of the Registrant | 43 |
| | | |
| PART II | | |
| | | |
| Item 5. | Market for Registrant’s Common Equity, Related Stockholder Matters and Issuer Purchases of Equity Securities | 44 |
| | | |
| Item 6. | Selected Consolidated Financial Data | 47 |
| | | |
| Item 7. | Management’s Discussion and Analysis of Consolidated Financial Condition and Results of Operations | 48 |
| | | |
| Item 7A. | Quantitative and Qualitative Disclosures About Market Risk | 117 |
| | | |
| Item 8. | Consolidated Financial Statements and Supplementary Data | 117 |
| | | |
| Item 9. | Changes in and Disagreements with Accountants on Accounting and Financial Disclosure | 202 |
| | | |
| Item 9A. | Controls and Procedures | 202 |
| | | |
| Item 9B. | Other Information | 203 |
| | | |
| PART III | | |
| | | |
| Item 10. | Directors, Executive Officers and Corporate Governance | 203 |
| | | |
| Item 11. | Executive Compensation | 203 |
| | | |
| Item 12. | Security Ownership of Certain Beneficial Owners and Management and Related Stockholder Matters | 203 |
| | | |
| Item 13. | Certain Relationships and Related Transactions, and Director Independence | 204 |
| | | |
| Item 14. | Principal Accountant Fees and Services | 204 |
| | | |
| PART IV | | |
| | | |
| Item 15. | Exhibits and Financial Statement Schedules | 204 |
PART I
ITEM 1. BUSINESS OF CNO.
CNO Financial Group, Inc., a Delaware corporation (“CNO”), (formerly known as Conseco, Inc. prior to its name change in May 2010) is a holding company for a group of insurance companies operating throughout the United States that develop, market and administer health insurance, annuity, individual life insurance and other insurance products. CNO became the successor to Conseco, Inc., an Indiana corporation (our “Predecessor”), in connection with our bankruptcy reorganization which became effective on September 10, 2003 (the “Effective Date”). The terms “CNO Financial Group, Inc.”, the “Company”, “we”, “us”, and “our” as used in this report refer to CNO and its subsidiaries or, when the context requires otherwise, our Predecessor and its subsidiaries. Such terms, when used to describe insurance business and products, refer to the insurance business and products of CNO’s insurance subsidiaries.
We focus on serving the senior and middle-income markets, which we believe are attractive, underserved, high growth markets. We sell our products through three distribution channels: career agents, independent producers (some of whom sell one or more of our product lines exclusively) and direct marketing. As of December 31, 2010, we had shareholders’ equity of $4.3 billion and assets of $31.9 billion. For the year ended December 31, 2010, we had revenues of $4.1 billion and net income of $284.6 million. See our consolidated financial statements and accompanying footnotes for additional financial information about the Company and its segments.
Beginning July 1, 2010, management changed the manner in which it disaggregates the Company’s operations for making operating decisions and assessing performance. As a result, the Company manages its business through the following operating segments: Bankers Life, Washington National and Colonial Penn, which are defined on the basis of product distribution; Other CNO Business, comprised primarily of products we no longer sell actively; and corporate operations, comprised of holding company activities and certain noninsurance company businesses. Our segments are described below.
| | • | Bankers Life, which markets and distributes Medicare supplement insurance, interest-sensitive life insurance, traditional life insurance, fixed annuities and long-term care insurance products to the middle-income senior market through a dedicated field force of career agents and sales managers supported by a network of community-based branch offices. The Bankers Life segment includes primarily the business of Bankers Life and Casualty Company (“Bankers Life”). Bankers Life also markets and distributes Medicare Advantage plans primarily through a distribution arrangement with Humana, Inc. (“Humana”) and Medicare Part D prescription drug plans through a distribution and reinsurance arrangement with Coventry Health Care (“Coventry”). |
| | • | Washington National, which markets and distributes supplemental health (including specified disease, accident and hospital indemnity insurance products) and life insurance to middle-income consumers at home and at the worksite. These products are marketed through Performance Matters Associates, Inc. (“PMA”), a wholly owned subsidiary, and through independent marketing organizations and insurance agencies, including worksite marketing. The products being marketed are underwritten by Washington National Insurance Company (“Washington National”). |
| | • | Colonial Penn, which markets primarily graded benefit and simplified issue life insurance directly to customers through television advertising, direct mail, the internet and telemarketing. The Colonial Penn segment includes primarily the business of Colonial Penn Life Insurance Company (“Colonial Penn”). |
| | • | Other CNO Business, which consists of blocks of interest-sensitive life insurance, traditional life insurance, annuities, long-term care insurance and other supplemental health products. These blocks of business are not being actively marketed and were primarily issued or acquired by Conseco Life Insurance Company (“Conseco Life”) and Washington National. |
On November 12, 2008, CNO and CDOC, Inc. (“CDOC”), a wholly owned subsidiary of CNO, completed the transfer (the “Transfer”) of the stock of Senior Health Insurance Company of Pennsylvania (“Senior Health”) to Senior Health Care Oversight Trust, an independent trust (the “Independent Trust”) for the exclusive benefit of Senior Health’s long-term care policyholders. The Transfer was approved by the Pennsylvania Insurance Department.
In connection with the Transfer, the Company entered into a $125.0 million Senior Note due November 12, 2013 (the “Senior Health Note”), payable to Senior Health. The note has a five-year maturity date; a 6 percent interest rate; and requires annual principal payments of $25.0 million. As of December 31, 2010, the principal amount outstanding under the
Senior Health Note was $75.0 million. As a condition of the order from the Pennsylvania Insurance Department approving the Transfer, CNO agreed that it would not pay cash dividends on its common stock while any portion of the $125.0 million note remained outstanding.
OUR STRATEGIC DIRECTION
Our mission is to be a premier provider of life insurance, supplemental health products and annuities to America’s middle-income consumers with a focus on seniors, while providing value to our shareholders. We believe we can accomplish this mission through the effective execution of the following strategies:
| | • | Remain Focused on the Needs of Our Senior and Middle Income Market Customers. We define our business by our target markets and not by our products. We continue to adapt our distribution, product offerings and product features to the evolving needs of our middle income and senior customers. We provide a broad range of middle market products to meet the protection needs of our customers and to provide them with longevity solutions. We are able to reach our customers through our career agents and independent agent relationships, directly, through our Colonial Penn direct distribution platform, and at work, through our worksite marketing channel. |
| | • | Expand and Improve the Efficiency of our Distribution Channels. The continued development and maintenance of our distribution channels is critical to our continued sales growth. We dedicate substantial resources to the recruitment, development and retention of our Bankers Life career agents and seek to maximize their productivity by providing them with high quality leads for new business opportunities. In addition, investments in both our direct distribution platform, Colonial Penn and in PMA, have enabled us to achieve significant sales growth since 2004. |
| | • | Seek Profitable Growth. We continue to pursue profitable growth opportunities in the middle income market. We focus on marketing and selling products that meet the needs of our customers, and we believe it will enable us to provide long-term value for our shareholders. As part of this strategy, we have eliminated or de-emphasized products with return characteristics that we consider to be inadequate. |
| | • | Pursue Operational Efficiencies and Cost Reduction Opportunities. We seek to strengthen our competitive position with a focus on cost control and enhanced operational efficiency. Our efforts include: |
| | • | improvements to our policy administration processes and procedures to reduce costs and improve customer service; |
| | • | continued consolidation of policy processing systems, including conversions and elimination of systems; |
| | • | streamlining administrative procedures and consolidating processes across the enterprise to reduce costs; and |
| | • | eliminating expenses associated with the marketing of those products that do not meet our return objectives. |
| | • | Continue to Manage and Where Possible Reduce the Risk Profile of Our Business . We actively manage the risks associated with our business and have taken several steps to reduce the risk profile of our business. In the fourth quarter of 2007, we completed a transaction to coinsure 100 percent of a block of inforce fixed index annuity and fixed annuity business sold through independent distribution. Such business was largely out of the surrender charge periods and had policyholder and other reserves of $2.8 billion. This transaction significantly reduced the asset and liability risks associated with this business. In the fourth quarter of 2008, we transferred the stock of Senior Health to the Independent Trust, eliminating our exposure to a substantial block of long-term care business previously included in our run-off segment. In 2009, we began coinsuring a significant portion of the new long-term care business written through our Bankers Life segment. These transactions have reduced our exposure to long-term care business that has led to volatile earnings in the past. |
We have purposefully avoided products like variable life and variable annuity contracts that we believe would expose us to risks that are not commensurate with potential profits. We plan to continue to emphasize products that are straightforward and have a lower risk profile. We believe such products meet various needs of the middle income markets we serve.
We will continue to manage the investment risks associated with our insurance business by:
• maintaining a largely investment-grade, diversified fixed-income portfolio;
| | • | maximizing the spread between the investment income we earn and the yields we pay on investment products within acceptable levels of risk; and |
| | • | continually tailoring our investment portfolio to consider expected liability durations, cash flows and other requirements. |
We believe that our focus on middle-income families and seniors will position us favorably to capitalize on the future growth in these markets.
OTHER INFORMATION
Our Predecessor was organized in 1979 as an Indiana corporation and commenced operations in 1982. Our executive offices are located at 11825 N. Pennsylvania Street, Carmel, Indiana 46032, and our telephone number is (317) 817-6100. Our annual reports on Form 10-K, quarterly reports on Form 10-Q, current reports on Form 8-K and amendments to those reports filed or furnished pursuant to Section 13(a) or 15(d) of the Securities Exchange Act are available free of charge on our website at www.CNOinc.com as soon as reasonably practicable after they are electronically filed with, or furnished to, the Securities and Exchange Commission (the “SEC”). These filings are also available on the SEC’s website at www.sec.gov. In addition, the public may read and copy any document we file at the SEC’s Public Reference Room located at 100 F Street, NE, Room 1580, Washington, D.C. 20549. The public may obtain information on the operation of the Public Reference Room by calling the SEC at 1-800-SEC-0330. Copies of these filings are also available, without charge, from CNO Investor Relations, 11825 N. Pennsylvania Street, Carmel, IN 46032.
Our website also includes the charters of our Audit and Enterprise Risk Committee, Executive Committee, Governance and Strategy Committee, Human Resources and Compensation Committee and Investment Committee, as well as our Corporate Governance Operating Principles and our Code of Business Conduct and Ethics that applies to all officers, directors and employees. Copies of these documents are available free of charge on our website at www.CNOinc.com or from CNO Investor Relations at the address shown above. Within the time period specified by the SEC and the New York Stock Exchange, we will post on our website any amendment to our Code of Business Conduct and Ethics and any waiver applicable to our principal executive officer, principal financial officer or principal accounting officer.
In May 2010, we filed with the New York Stock Exchange the Annual CEO Certification regarding the Company’s compliance with their Corporate Governance listing standards as required by Section 303A.12(a) of the New York Stock Exchange Listed Company Manual. In addition, we have filed as exhibits to this 2010 Form 10-K the applicable certifications of the Company’s Chief Executive Officer and Chief Financial Officer required under Section 302 of the Sarbanes-Oxley Act of 2002 regarding the Company’s public disclosures.
Data in Item 1 are provided as of or for the year ended December 31, 2010 (as the context implies), unless otherwise indicated.
MARKETING AND DISTRIBUTION
Insurance
Our insurance subsidiaries develop, market and administer health insurance, annuity, individual life insurance and other insurance products. We sell these products through three primary distribution channels: career agents, independent producers (some of whom sell one or more of our product lines exclusively) and direct marketing. We had premium collections of $3.6 billion, $4.1 billion and $4.5 billion in 2010, 2009 and 2008, respectively.
Our insurance subsidiaries collectively hold licenses to market our insurance products in all fifty states, the District of Columbia, and certain protectorates of the United States. Sales to residents of the following states accounted for at least five percent of our 2010 collected premiums: Florida (7.8 percent), California (7.2 percent), Texas (6.1 percent) and Pennsylvania (6.1 percent).
We believe that most purchases of life insurance, accident and health insurance and annuity products occur only after individuals are contacted and solicited by an insurance agent. Accordingly, the success of our distribution system is largely dependent on our ability to attract and retain experienced and highly motivated agents. A description of our primary distribution channels is as follows:
Career Agents. This agency force of over 5,100 agents and sales managers working from 145 branch offices establishes one-on-one contact with potential policyholders and promotes strong personal relationships with existing policyholders. The career agents sell primarily supplemental health and long-term care insurance policies, life insurance and annuities. In 2010, this distribution channel accounted for $2,575.2 million, or 72 percent, of our total collected premiums. These agents sell Bankers Life policies, as well as Medicare Advantage plans primarily through a distribution arrangement with Humana and Medicare Part D prescription drug plans through a distribution and reinsurance arrangement with Coventry, and typically visit the prospe ctive policyholder’s home to conduct personalized “kitchen-table” sales presentations. After the sale of an insurance policy, the agent serves as a contact person for policyholder questions, claims assistance and additional insurance needs.
Independent Producers. Independent producers are a diverse network of independent agents, insurance brokers and marketing organizations. The general agency and insurance brokerage distribution system is comprised of independent licensed agents doing business in all fifty states, the District of Columbia, and certain protectorates of the United States. In 2010, this distribution channel collected $820.8 million, or 23 percent, of our total premiums.
Marketing organizations typically recruit agents by advertising our products and commission structure through direct mail advertising or through seminars for agents and brokers. These organizations bear most of the costs incurred in marketing our products. We compensate the marketing organizations by paying them a percentage of the commissions earned on new sales generated by agents recruited by such organizations. Certain of these marketing organizations are specialty organizations that have a marketing expertise or a distribution system related to a particular product or market, such as worksite and individual health products. During 1999 and 2000, we purchased three organizations that specialize in marketing and distributing health products and combined them under the name PMA. In 2010, the PMA distribution channel accounted for $228.8 million, or 6 percent, of our total collected premiums.
Direct Marketing. This distribution channel is engaged primarily in the sale of graded benefit life insurance policies through Colonial Penn. In 2010, this channel accounted for $194.1 million, or 5 percent, of our total collected premiums.
Products
The following table summarizes premium collections by major category and segment for the years ended December 31, 2010, 2009 and 2008 (dollars in millions):
Total premium collections
| | | 2010 | | | 2009 | | | 2008 | |
| Health: | | | | | | | | | |
| Bankers Life | | $ | 1,360.1 | | | $ | 1,711.7 | | | $ | 1,887.0 | |
| Washington National | | | 564.9 | | | | 566.3 | | | | 584.9 | |
| Colonial Penn | | | 6.4 | | | | 7.5 | | | | 8.9 | |
| Other CNO Business | | | 31.7 | | | | 34.1 | | | | 36.9 | |
| | | | | | | | | | | | | |
| Total health | | | 1,963.1 | | | | 2,319.6 | | | | 2,517.7 | |
| | | | | | | | | | | | | |
| Annuities: | | | | | | | | | | | | |
| Bankers Life | | | 1,005.5 | | | | 1,060.4 | | | | 1,224.1 | |
| Other CNO Business | | | 16.4 | | | | 78.4 | | | | 129.8 | |
| | | | | | | | | | | | | |
| Total annuities | | | 1,021.9 | | | | 1,138.8 | | | | 1,353.9 | |
| | | | | | | | | | | | | |
| Life: | | | | | | | | | | | | |
| Bankers Life | | | 209.6 | | | | 228.8 | | | | 209.4 | |
| Washington National | | | 16.2 | | | | 30.1 | | | | 35.7 | |
| Colonial Penn | | | 187.7 | | | | 187.3 | | | | 174.1 | |
| Other CNO Business | | | 191.6 | | | | 210.2 | | | | 234.1 | |
| | | | | | | | | | | | | |
| Total life | | | 605.1 | | | | 656.4 | | | | 653.3 | |
| | | | | | | | | | | | | |
| Total premium collections | | $ | 3,590.1 | | | $ | 4,114.8 | | | $ | 4,524.9 | |
| | | | | | | | | | | | | |
In addition, the long-term care business included in our discontinued operations had collected premiums of $225.9 million in 2008.
Our insurance companies collected premiums from the following products:
Health
Health Premium Collections (dollars in millions)
| | | | | | | | | | |
| | | 2010 | | | 2009 | | | 2008 | |
| | | | | | | | | | |
| Medicare supplement: | | | | | | | | | |
| Bankers Life | | $ | 697.8 | | | $ | 653.7 | | | $ | 636.6 | |
| Washington National | | | 154.8 | | | | 177.8 | | | | 203.8 | |
| Colonial Penn | | | 6.0 | | | | 7.0 | | | | 8.1 | |
| | | | | | | | | | | | | |
| Total | | | 858.6 | | | | 838.5 | | | | 848.5 | |
| | | | | | | | | | | | | |
| Long-term care: | | | | | | | | | | | | |
| Bankers Life | | | 584.6 | | | | 601.6 | | | | 625.7 | |
| Other CNO Business | | | 29.2 | | | | 31.4 | | | | 33.7 | |
| | | | | | | | | | | | | |
| Total | | | 613.8 | | | | 633.0 | | | | 659.4 | |
| | | | | | | | | | | | | |
| Prescription Drug Plan and Medicare Advantage products included in Bankers Life | | | 66.4 | | | | 444.4 | | | | 614.0 | |
| | | | | | | | | | | | | |
| Health products included in Washington National | | | 405.5 | | | | 383.3 | | | | 374.6 | |
| | | | | | | | | | | | | |
| Other: | | | | | | | | | | | | |
| Bankers Life | | | 11.3 | | | | 12.0 | | | | 10.7 | |
| Washington National | | | 4.6 | | | | 5.2 | | | | 6.5 | |
| Colonial Penn | | | .4 | | | | .5 | | | | .8 | |
| Other CNO Business | | | 2.5 | | | | 2.7 | | | | 3.2 | |
| | | | | | | | | | | | | |
| Total | | | 18.8 | | | | 20.4 | | | | 21.2 | |
| | | | | | | | | | | | | |
| Total health premium collections | | $ | 1,963.1 | | | $ | 2,319.6 | | | $ | 2,517.7 | |
The following describes our major supplemental health products:
Medicare Supplement. Medicare supplement collected premiums were $858.6 million during 2010 or 24 percent of our total collected premiums. Medicare is a federal health insurance program for disabled persons and seniors (age 65 and older). Part A of the program provides protection against the costs of hospitalization and related hospital and skilled nursing facility care, subject to an initial deductible, related coinsurance amounts and specified maximum benefit levels. The deductible and coinsurance amounts are subject to change each year by the federal government. Part B of Medicare covers doctor’s bills and a number of other medical costs not covered by Part A, subject to deductible and coinsurance am ounts for charges approved by Medicare. The deductible amount is subject to change each year by the federal government.
Medicare supplement policies provide coverage for many of the hospital and medical expenses which the Medicare program does not cover, such as deductibles, coinsurance costs (in which the insured and Medicare share the costs of medical expenses) and specified losses which exceed the federal program’s maximum benefits. Our Medicare supplement plans automatically adjust coverage to reflect changes in Medicare benefits. In marketing these products, we currently concentrate on individuals who have recently become eligible for Medicare by reaching the age of 65. Approximately 42 percent of new sales of Medicare supplement policies in 2010 were to individuals who had recently reached the age of 65.
Both Bankers Life and Washington National sell Medicare supplement insurance.
Long-Term Care. Long-term care collected premiums were $613.8 million during 2010, or 17 percent of our total collected premiums. Long-term care products provide coverage, within prescribed limits, for nursing homes, home
healthcare, or a combination of both. We sell the long-term care plans primarily to retirees and, to a lesser degree, to older self-employed individuals in the middle-income market.
Current nursing home care policies cover incurred charges up to a daily fixed-dollar limit with an elimination period (which, similar to a deductible, requires the insured to pay for a certain number of days of nursing home care before the insurance coverage begins), subject to a maximum benefit. Home healthcare policies cover incurred charges after a deductible or elimination period and are subject to a weekly or monthly maximum dollar amount, and an overall benefit maximum. Comprehensive policies cover both nursing home care and home healthcare. We monitor the loss experience on our long-term care products and, when necessary, apply for rate increases in the jurisdictions in which we sell such products. Regulatory filings are made before we increase our premiums on these products.
A small portion of our long-term care business resides in the Other CNO Business segment. This business was sold through independent producers and was largely underwritten by certain of our subsidiaries prior to their acquisitions by our Predecessor in 1996 and 1997. The performance of these blocks of business did not meet the expectations we had when the blocks were acquired. As a result, we ceased selling new long-term care policies through independent distribution in 2003.
We continue to sell long-term care insurance through the Bankers Life career agent distribution channel. This business is underwritten using stricter underwriting and pricing standards than had previously been used on our acquired blocks of long-term care business included in the Other CNO Business segment.
Prescription Drug Plan and Medicare Advantage. The Medicare Prescription Drug, Improvement and Modernization Act of 2003 provided for the introduction of a prescription drug program under Medicare Part D. Persons eligible for Medicare can receive their Part D coverage through a stand-alone Prescription Drug Plan (“PDP”). In order to offer a PDP product to our current and potential future policyholders without investment in management and infrastructure, we entered into a national distribution agreement with Coventry to use our career and independent agents to distribute Coventry’s PDP product, Advantra Rx. We receive a fee based on the number of PDP plans sold through our distribution channels. &# 160;In addition, CNO has a quota-share reinsurance agreement with Coventry for CNO enrollees that provides CNO with a specified percentage of net premiums and related profits subject to a risk corridor. The Part D program was effective January 1, 2006. PDP collected premiums were $65.3 million during 2010 or 2 percent of our total collected premiums.
CNO expanded its strategic alliance with Coventry by entering into national distribution agreements under which our career agents began distributing Coventry’s Private-Fee-For-Service (“PFFS”) plan, with coverage beginning January 1, 2007. Under the agreement, we received a fee based on the number of PFFS plans sold through our distribution channels. In addition, CNO had a quota-share reinsurance agreement with Coventry for CNO enrollees that provided CNO with a specified percentage of the net premiums and related profits. Coventry decided to cease selling PFFS plans effective January 1, 2010. On July 22, 2009, Bankers Life announced a strategic alliance under which it offers Humana’s Medicare Advantage plans to its policyholders and consumers nationwide throug h its career agency force and receives marketing fees based on sales. Effective January 1, 2010, the Company no longer assumes the underwriting risk related to PFFS business.
Supplemental Health Products. Supplemental health collected premiums were $405.5 million during 2010, or 11 percent of our total collected premiums. These policies generally provide fixed or limited benefits. Cancer insurance and heart/stroke products are guaranteed renewable individual accident and health insurance policies. Payments under cancer insurance policies are generally made directly to, or at the direction of, the policyholder following diagnosis of, or treatment for, a covered type of cancer. Heart/stroke policies provide for payments directly to the policyholder for treatment of a covered heart disease, heart attack or stroke. Accident products combine insurance for accidental death wi th limited benefit disability income insurance. Hospital indemnity products provide a fixed dollar amount per day of confinement in a hospital. The benefits provided under the supplemental health policies do not necessarily reflect the actual cost incurred by the insured as a result of the illness, or accident, and benefits are not reduced by any other medical insurance payments made to or on behalf of the insured.
Approximately 75 percent of the total number of our supplemental health policies inforce was sold with return of premium or cash value riders. The return of premium rider generally provides that, after a policy has been inforce for a specified number of years or upon the policyholder reaching a specified age, we will pay to the policyholder, or in some cases, a beneficiary under the policy, the aggregate amount of all premiums paid under the policy, without interest, less the aggregate amount of all claims incurred under the policy. For some policies, the return of premium rider does not have any claim offset. The cash value rider is similar to the return of premium rider, but also provides for payment of a graded portion of the return of premium benefit if the policy terminates before the return of premi um benefit is earned.
Other Health Products. Other supplemental health product collected premiums were $18.8 million during 2010. This category includes various other health products such as major medical health insurance, senior hospital indemnity and disability income products which are sold in small amounts or other products which are no longer actively marketed.
Annuities
Annuity premium collections (dollars in millions)
| | | 2010 | | | 2009 | | | 2008 | |
| Fixed index annuity: | | | | | | | | | |
Bankers Life | | $ | 577.7 | | | $ | 350.1 | | | $ | 522.8 | |
Other CNO Business | | | 14.9 | | | | 76.6 | | | | 123.7 | |
| | | | | | | | | | | | | |
| Total fixed index annuity premium collections | | | 592.6 | | | | 426.7 | | | | 646.5 | |
| | | | | | | | | | | | | |
| Other fixed annuity: | | | | | | | | | | | | |
Bankers Life | | | 427.8 | | | | 710.3 | | | | 701.3 | |
Other CNO Business | | | 1.5 | | | | 1.8 | | | | 6.1 | |
| | | | | | | | | | | | | |
Total fixed annuity premium collections | | | 429.3 | | | | 712.1 | | | | 707.4 | |
| | | | | | | | | | | | | |
Total annuity premium collections | | $ | 1,021.9 | | | $ | 1,138.8 | | | $ | 1,353.9 | |
During 2010, we collected annuity premiums of $1,021.9 million or 28 percent of our total premiums collected. Annuity products include fixed index annuity, traditional fixed rate annuity and single premium immediate annuity products sold through both Bankers Life and Other CNO Business. Annuities offer a tax-deferred means of accumulating savings for retirement needs, and provide a tax-efficient source of income in the payout period. Our major source of income from fixed rate annuities is the spread between the investment income earned on the underlying general account assets and the interest credited to contractholders’ accounts. For fixed index annuities, our major source of income is the spread between the investment income earned on the underlying general account assets and the cost o f the index options purchased to provide index-based credits to the contractholders’ accounts.
The change in mix of premium collections between Bankers Life’s fixed index products and fixed annuity products has fluctuated due to volatility in the financial markets in recent periods. In addition, premium collections from Bankers Life’s fixed annuity products decreased in 2010 as low new money interest rates negatively impacted our sales and the overall sales in the fixed annuity market.
The following describes the major annuity products:
Fixed Index Annuities. These products accounted for $592.6 million, or 16 percent, of our total premium collections during 2010. The account value (or “accumulation value”) of these annuities is credited in an amount that is based on changes in a particular index during a specified period of time. Within each contract issued, each fixed index annuity specifies:
| | • | The time period during which the change in the index is measured. At the end of the time period, the change in the index is applied to the account value. The time period of the contract ranges from 1 to 4 years. |
| | • | The method used to measure the change in the index. |
| | • | The measured change in the index is multiplied by a “participation rate” (percentage of change in the index) before the credit is applied. Some policies guarantee the initial participation rate for the life of the contract, and some vary the rate for each period. |
| | • | The measured change in the index may also be limited to a “cap” before the credit is applied. Some policies guarantee the initial cap for the life of the contract, and some vary the cap for each period. |
| | • | The measured change in the index may also be limited to the excess in the measured change over a “margin” before the credit is applied. Some policies guarantee the initial margin for the life of the contract, and some vary the margin for each period. |
These products have guaranteed minimum cash surrender values, regardless of actual index performance and the resulting indexed-based interest credits applied.
We generally buy call options and similar investments on the applicable indices in an effort to hedge potential increases to policyholder benefits resulting from increases in the indices to which the product’s return is linked.
Other Fixed Rate Annuities. These products include fixed rate single-premium deferred annuities (“SPDAs”), flexible premium deferred annuities (“FPDAs”) and single-premium immediate annuities (“SPIAs”). These products accounted for $429.3 million, or 12 percent, of our total premium collections during 2010. Our fixed rate SPDAs and FPDAs typically have an interest rate (the “crediting rate”) that is guaranteed by the Company for the first policy year, after which we have the discretionary ability to change the crediting rate to any rate not below a guaranteed minimum rate. The guaranteed rates on annuities written recently range from 1.5 percent to 3.0 percent, and the rat es, on all policies inforce range from 1.5 percent to 6.0 percent. The initial crediting rate is largely a function of:
• the interest rate we can earn on invested assets acquired with the new annuity fund deposits;
• the costs related to marketing and maintaining the annuity products; and
• the rates offered on similar products by our competitors.
For subsequent adjustments to crediting rates, we take into account current and prospective yields on investments, annuity surrender assumptions, competitive industry pricing and the crediting rate history for particular groups of annuity policies with similar characteristics.
In 2010, a significant portion of our new annuity sales have been “bonus interest” products. The initial crediting rate on these products specifies a bonus crediting rate of 1.0 to 3.0 percent of the annuity deposit for the first policy year only. After the first year, the bonus interest portion of the initial crediting rate is automatically discontinued, and the renewal crediting rate is established. As of December 31, 2010, the average crediting rate, excluding bonuses, on our outstanding traditional annuities was 3.6 percent.
Withdrawals from deferred annuities are generally subject to a surrender charge of 3 percent to 19 percent in the first year, declining to zero over a 5 to 12 year period, depending on issue age and product. Surrender charges are set at levels intended to protect the Company from loss on early terminations and to reduce the likelihood that policyholders will terminate their policies during periods of increasing interest rates. This practice is intended to lengthen the duration of policy liabilities and to enable us to maintain profitability on such policies.
Penalty-free withdrawals from deferred annuities of up to 10 percent of either premiums or account value are available in most plans after the first year of the annuity’s term.
Some deferred annuity products apply a market value adjustment during the surrender charge period. This adjustment is determined by a formula specified in the annuity contract, and may increase or decrease the cash surrender value depending on changes in the amount and direction of market interest rates or credited interest rates at the time of withdrawal. The resulting cash surrender values will be at least equal to the guaranteed minimum values.
SPIAs accounted for $12.0 million, or .3 percent, of our total premiums collected in 2010. SPIAs are designed to provide a series of periodic payments for a fixed period of time or for life, according to the policyholder’s choice at the time of issuance. Once the payments begin, the amount, frequency and length of time over which they are payable are fixed. SPIAs often are purchased by persons at or near retirement age who desire a steady stream of payments over a future period of years. The single premium is often the payout from a deferred annuity contract. The implicit interest rate on SPIAs is based on market conditions when the policy is issued. The implicit interest rate on our outstanding SPIAs averaged 7.0 percent at December 31, 2010.
Life Insurance
Life insurance premium collections (dollars in millions)
| | | 2010 | | | 2009 | | | 2008 | |
| Interest-sensitive life products: | | | | | | | | | |
| Bankers Life | | $ | 65.5 | | | $ | 63.2 | | | $ | 63.7 | |
| Colonial Penn | | | .5 | | | | .5 | | | | .5 | |
| Other CNO Business | | | 162.7 | | | | 180.6 | | | | 202.5 | |
| | | | | | | | | | | | | |
| Total interest-sensitive life premium collections | | | 228.7 | | | | 244.3 | | | | 266.7 | |
| | | | | | | | | | | | | |
| Traditional life: | | | | | | | | | | | | |
| Bankers Life | | | 144.1 | | | | 165.6 | | | | 145.7 | |
| Washington National | | | 16.4 | | | | 30.1 | | | | 35.7 | |
| Colonial Penn | | | 187.2 | | | | 186.8 | | | | 173.6 | |
| Other CNO Business | | | 28.7 | | | | 29.6 | | | | 31.6 | |
| | | | | | | | | | | | | |
| Total traditional life premium collections | | | 376.4 | | | | 412.1 | | | | 386.6 | |
| | | | | | | | | | | | | |
| Total life insurance premium collections | | $ | 605.1 | | | $ | 656.4 | | | $ | 653.3 | |
Life products include traditional and interest-sensitive life insurance products. These products are currently sold through the Bankers Life, Washington National and Colonial Penn segments. During 2010, we collected life insurance premiums of $605.1 million, or 17 percent, of our total collected premiums. Sales of life products are affected by the financial strength ratings assigned to our insurance subsidiaries by independent rating agencies. See “—Competition” below.
Interest-Sensitive Life Products. These products include universal life and other interest-sensitive life products that provide life insurance with adjustable rates of return related to current interest rates. They accounted for $228.7 million, or 6.4 percent, of our total collected premiums in 2010. These products are marketed by independent producers and, to a lesser extent, career agents (including independent producers and career agents specializing in worksite sales). The principal differences between universal life products and other interest-sensitive life products are policy provisions affecting the amount and timing of premium payments. Universal life policyholders may vary the frequency and size of their premium payments, and policy benefits may also fluctuate according to such payments. Premium payments under other interest-sensitive policies may not be varied by the policyholders. Universal life products include fixed index universal life products. The account value of these policies is credited with interest at a guaranteed rate, plus additional interest credits based on changes in a particular stock index during a specified time period.
Traditional Life. These products accounted for $376.4 million, or 10 percent, of our total collected premiums in 2010. Traditional life policies, including whole life, graded benefit life, term life and single premium whole life products, are marketed through independent producers, career agents and direct response marketing. Under whole life policies, the policyholder generally pays a level premium over an agreed period or the policyholder’s lifetime. The annual premium in a whole life policy is generally higher than the premium for comparable term insurance coverage in the early years of the policy’s life, but is generally lower than the premium for comparable term insurance coverage in the later years of the policy& #8217;s life. These policies combine insurance protection with a savings component that gradually increases in amount over the life of the policy. The policyholder may borrow against the savings component generally at a rate of interest lower than that available from other lending sources. The policyholder may also choose to surrender the policy and receive the accumulated cash value rather than continuing the insurance protection. Term life products offer pure insurance protection for life with a guaranteed level premium for a specified period of time—typically 5, 10, 15 or 20 years. In some instances, these products offer an option to return the premium at the end of the guaranteed period.
Traditional life products also include graded benefit life insurance products. Graded benefit life products accounted for $184.1 million, or 5.1 percent, of our total collected premiums in 2010. Graded benefit life insurance products are offered on an individual basis primarily to persons age 50 to 85, principally in face amounts of $400 to $25,000, without medical examination or evidence of insurability. Premiums are paid as frequently as monthly. Benefits paid are less than the face amount of the policy during the first two years, except in cases of accidental death. Our Colonial Penn segment markets graded benefit life policies under its own brand name using direct response marketing techniques. New policyholder leads are generated primarily from television, print adver tisements and direct response mailings.
Traditional life products also include single premium whole life insurance. This product requires one initial lump sum payment in return for providing life insurance protection for the insured’s entire lifetime. Single premium whole life products accounted for $46.2 million, or 1.3 percent, of our total collected premiums in 2010.
INVESTMENTS
40|86 Advisors, Inc. (“40|86 Advisors”, a registered investment advisor and wholly owned subsidiary of CNO) manages the investment portfolios of our insurance subsidiaries. 40|86 Advisors had approximately $24.0 billion of assets (at fair value) under management at December 31, 2010, of which $23.7 billion were assets of our subsidiaries and $.3 billion were assets managed for third parties. Our general account investment strategies are to:
| | • | maintain a largely investment-grade, diversified fixed-income portfolio; |
| | • | maximize the spread between the investment income we earn and the yields we pay on investment products within acceptable levels of risk; |
| | • | provide adequate liquidity; |
| | • | construct our investment portfolio considering expected liability durations, cash flows and other requirements; and |
| | • | maximize total return through active investment management. |
During 2010, 2009 and 2008, we recognized net realized investment gains (losses) of $30.2 million, $(60.5) million and $(262.4) million, respectively, excluding any such amounts included in discontinued operations. During 2010, net realized investment gains were comprised of: (i) $180.0 million of net gains from the sale of investments (primarily fixed maturities); and (ii) $149.8 million of writedowns of investments for other-than-temporary declines in fair value recognized through net income ($146.8 million, prior to the $(3.0) million of impairment losses recognized through accumulated other comprehensive income (loss)). During 2009, net realized investment losses were comprised of: (i) $134.9 million of net gains from the sales of investments (primarily fixed maturities); and (ii) $195.4 mil lion of writedowns of investments for other than temporary declines in fair value recognized through net income ($385.0 million, prior to the $189.6 million of impairment losses recognized through accumulated other comprehensive loss). During 2008, net realized investment losses were comprised of: (i) $100.1 million of net losses from the sales of investments (primarily fixed maturities); and (ii) $162.3 million of writedowns of investments for other than temporary declines in fair value.
Investment activities are an integral part of our business because investment income is a significant component of our revenues. The profitability of many of our insurance products is significantly affected by spreads between interest yields on investments and rates credited on insurance liabilities. Although substantially all credited rates on SPDAs, FPDAs and interest sensitive life products may be changed annually (subject to minimum guaranteed rates), changes in crediting rates may not be sufficient to maintain targeted investment spreads in all economic and market environments. In addition, competition, minimum guaranteed rates and other factors, including the impact of surrenders and withdrawals, may limit our ability to adjust or to maintain crediting rates at levels necessary to avoid narrowing of spreads under certain market conditions. As of December 31, 2010, the average yield, computed on the cost basis of our fixed maturity portfolio, was 5.9 percent, and the average interest rate credited or accruing to our total insurance liabilities was 4.5 percent.
We manage the equity-based risk component of our fixed index annuity products by:
• purchasing equity-based options with similar payoff characteristics; and
| | • | adjusting the participation rate to reflect the change in the cost of such options (such cost varies based on market conditions). |
The price of the options we purchase to manage the equity-based risk component of our fixed index annuities varies based on market conditions. The price of the options generally increases with increases in the volatility of the applicable indices, which may either reduce the profitability of the fixed index products or cause us to lower participation rates. Accordingly, volatility of the indices is one factor in the uncertainty regarding the profitability of our fixed index products. We attempt to mitigate this risk by adjusting the participation rates to reflect the change in the cost of such options.
Our invested assets are predominately fixed rate in nature and their value fluctuates with changes in market rates. We seek to manage the interest rate risk inherent in our business by managing the durations and cash flows of our fixed maturity investments along with those of our insurance liabilities. For example, duration measures the expected change in the fair value of assets and liabilities for a given change in interest rates. If interest rates increase by 1 percent, the fair value of a fixed maturity security with a duration of 5 years is typically expected to decrease in value by approximately 5 percent. When the estimated durations of assets and liabilities are similar, a change in the value of assets should be largely offset by a change in the value of liabilities.
We calculate asset and liability durations using our estimates of future asset and liability cash flows. At December 31, 2010, the duration of our fixed income securities (as modified to reflect prepayments and potential calls) was approximately 8.8 years and the duration of our insurance liabilities was approximately 8.7 years. These durations indicate that while our investment portfolio had a longer duration and, consequently, was more sensitive to interest rate fluctuations than our liabilities at that date, this sensitivity was within corporate guidelines. We generally seek to minimize the gap between asset and liability durations.
For information regarding the composition and diversification of the investment portfolio of our subsidiaries, see “Investments”.
COMPETITION
The markets in which we operate are competitive. Compared to CNO, many companies in the financial services industry are larger, have greater capital, technological and marketing resources, have better access to capital and other sources of liquidity at a lower cost, offer broader and more diversified product lines, have larger staffs and higher ratings. An expanding number of banks, securities brokerage firms and other financial intermediaries also market insurance products or offer competing products, such as mutual fund products, traditional bank investments and other investment and retirement funding alternatives. We also compete with many of these companies and others in providing services for fees. In most areas, competition is based on a number of factors including pricing, service provid ed to distributors and policyholders and ratings. CNO’s subsidiaries must also compete to attract and retain the allegiance of agents, insurance brokers and marketing companies.
In the individual health insurance business, companies compete primarily on the bases of marketing, service and price. Pursuant to federal regulations, the Medicare supplement products offered by all companies have standardized policy features. This increases the comparability of such policies and intensifies competition based on other factors. See “—Insurance Underwriting” and “Governmental Regulation” for additional information. In addition to competing with the products of other insurance companies, commercial banks, thrifts, mutual funds and broker dealers, our insurance products compete with health maintenance organizations, preferred provider organizations and other health care-related institutions which provide medical benefits based on contractual agreements.
We believe that the volatility experienced in the financial markets in recent periods, its impact on the capital position of many competitors, and subsequent actions by regulators and rating agencies have altered the competitive environment. In particular, these factors have emphasized financial strength as a significant differentiator from the perspective of consumers. The effects of the current market conditions may also lead to consolidation in the insurance industry. Although we can not predict the ultimate impact of these conditions, we believe that the strongest companies will have a competitive advantage as a result of the current circumstances.
An important competitive factor for life insurance companies is the ratings they receive from nationally recognized rating organizations. Agents, insurance brokers and marketing companies who market our products and prospective purchasers of our products use the ratings of our insurance subsidiaries as one factor in determining which insurer’s products to market or purchase. Ratings have the most impact on our annuity, interest-sensitive life insurance and long-term care products. Insurance financial strength ratings are opinions regarding an insurance company’s financial capacity to meet the obligations of its insurance policies in accordance with their terms. They are not directed toward the protection of investors, and such ratings are not recommendations to buy, sell or hold sec urities.
On December 22, 2010, A.M. Best Company (“A.M. Best”) upgraded the financial strength ratings of our primary insurance subsidiaries, except Conseco Life, to “B+” from “B”. A.M. Best also affirmed the financial strength rating of “B-” of Conseco Life and revised the outlook for the rating of Conseco Life to stable from negative. On March 23, 2010, A.M. Best affirmed the financial strength rating of “B” of our primary insurance subsidiaries, except Conseco Life, whose “B”
rating was downgraded to “B-”. A.M. Best also revised the outlook for the ratings of our primary insurance subsidiaries to stable from negative, except for Conseco Life, whose outlook of negative was affirmed. A “stable” designation means that there is a low likelihood of a rating change due to stable financial market trends. The “B+” rating is assigned to companies that have a good ability, in A.M. Best’s opinion, to meet their ongoing obligations to policyholders. A “B-“ rating is assigned to companies that have a fair ability, in A.M. Best’s opinion, to meet their current obligations to policyholders, but are financially vulnerable to adverse changes in underwriting and economic conditions. A.M. Best ratings for the indust ry currently range from “A++ (Superior)” to “F (In Liquidation)” and some companies are not rated. An “A++” rating indicates a superior ability to meet ongoing obligations to policyholders. A.M. Best has sixteen possible ratings. There are five ratings above the “B+” rating of our primary insurance subsidiaries, other than Conseco Life, and ten ratings that are below that rating. There are seven ratings above the “B-” rating of Conseco Life and eight ratings that are below that rating.
On December 21, 2010, Standard & Poor’s Corporation (“S&P”) upgraded the financial strength ratings of our primary insurance subsidiaries to “BB” from “BB-” and the outlook for such ratings is stable. A “stable” designation means that a rating is not likely to change. S&P financial strength ratings range from “AAA” to “R” and some companies are not rated. An insurer rated “BB” or lower is regarded as having vulnerable characteristics that may outweigh its strengths. A “BB” rating indicates the least degree of vulnerability within the range; a “CC” rating indicates the highest degree of vulnerability. Pluses and minuses show the relative standing within a categ ory. In S&P’s view, an insurer rated “BB” has marginal financial security characteristics and although positive attributes exist, adverse business conditions could lead to an insufficient ability to meet financial commitments. S&P has twenty-one possible ratings. There are eleven ratings above our “BB” rating and nine ratings that are below our rating.
On November 30, 2010, Moody’s Investor Services, Inc. (“Moody’s”) affirmed the financial strength rating of “Ba1” of our primary insurance subsidiaries with a stable outlook. On May 26, 2010, Moody’s upgraded the financial strength ratings of our primary insurance subsidiaries to “Ba1” from “Ba2”. Moody’s also revised the outlook for the ratings of our primary insurance subsidiaries to stable from positive. A “stable” designation means that a rating is not likely to change. Moody’s financial strength ratings range from “Aaa” to “C”. Rating categories from “Aaa” to “Baa” are classified as “secure” by Moody’s and rating categor ies from “Ba” to “C” are considered “vulnerable” and these ratings may be supplemented with numbers “1”, “2”, or “3” to show relative standing within a category. In Moody’s view, an insurer rated “Ba1” offers questionable financial security and, often, the ability of these companies to meet policyholders’ obligations may be very moderate and thereby not well safeguarded in the future. Moody’s has twenty-one possible ratings. There are ten ratings above our “Ba1” rating and ten ratings that are below our rating.
In light of the difficulties experienced recently by many financial institutions, including insurance companies, rating agencies have increased the frequency and scope of their credit reviews and requested additional information from the companies that they rate, including us. They may also adjust upward the capital and other requirements employed in the rating agency models for maintenance of certain ratings levels. We cannot predict what actions rating agencies may take, or what actions we may take in response. Accordingly, downgrades and outlook revisions related to us or the life insurance industry may occur in the future at any time and without notice by any rating agency. These could increase policy surrenders and withdrawals, adversely affect relationships with our distribution channels, reduce new sales, reduce our ability to borrow and increase our future borrowing costs.
INSURANCE UNDERWRITING
Under regulations developed by the National Association of Insurance Commissioners (“NAIC”) (an association of state regulators and their staffs) and adopted by the states, we are prohibited from underwriting our Medicare supplement policies for certain first-time purchasers. If a person applies for insurance within six months after becoming eligible by reason of age, or disability in certain limited circumstances, the application may not be rejected due to medical conditions. Some states prohibit underwriting of all Medicare supplement policies. For other prospective Medicare supplement policyholders, such as senior citizens who are transferring to our products, the underwriting procedures are relatively limited, except for policies providing prescription drug coverage.
Before issuing long-term care products, we generally apply detailed underwriting procedures to assess and quantify the insurance risks. We require medical examinations of applicants (including blood and urine tests, where permitted) for certain health insurance products and for life insurance products which exceed prescribed policy amounts. These requirements vary according to the applicant’s age and may vary by type of policy or product. We also rely on medical records and the potential policyholder’s written application. In recent years, there have been significant regulatory changes with respect to underwriting certain types of health insurance. An increasing number of states prohibit underwriting and/or charging higher
premiums for substandard risks. We monitor changes in state regulation that affect our products, and consider these regulatory developments in determining the products we market and where we market them.
Our supplemental health policies are individually underwritten using a simplified issue application. Based on an applicant’s responses on the application, the underwriter either: (i) approves the policy as applied for; (ii) approves the policy with reduced benefits; or (iii) rejects the application.
Most of our life insurance policies are underwritten individually, although standardized underwriting procedures have been adopted for certain low face-amount life insurance coverages. After initial processing, insurance underwriters obtain the information needed to make an underwriting decision (such as medical examinations, doctors’ statements and special medical tests). After collecting and reviewing the information, the underwriter either: (i) approves the policy as applied for; (ii) approves the policy with an extra premium charge because of unfavorable factors; or (iii) rejects the application.
We underwrite group insurance policies based on the characteristics of the group and its past claim experience. Graded benefit life insurance policies are issued without medical examination or evidence of insurability. There is minimal underwriting on annuities.
LIABILITIES FOR INSURANCE PRODUCTS
At December 31, 2010, the total balance of our liabilities for insurance products was $24.5 billion. These liabilities are generally payable over an extended period of time. The profitability of our insurance products depends on pricing and other factors. Differences between our expectations when we sold these products and our actual experience could result in future losses.
Liabilities for insurance products are calculated using management’s best judgments, based on our past experience and standard actuarial tables, of mortality, morbidity, lapse rates, investment experience and expense levels. For all of our insurance products, we establish an active life reserve, a liability for due and unpaid claims, claims in the course of settlement and incurred but not reported claims. In addition, for our health insurance business, we establish a reserve for the present value of amounts not yet due on incurred claims. Many factors can affect these reserves and liabilities, such as economic and social conditions, inflation, hospital and pharmaceutical costs, changes in doctrines of legal liability and extra-contractual damage awards. Therefore, our reserves and liabili ties are necessarily based on extensive estimates, assumptions and historical experience. Establishing reserves is an uncertain process, and it is possible that actual claims will materially exceed our reserves and have a material adverse effect on our results of operations and financial condition. Our financial results depend significantly upon the extent to which our actual claims experience is consistent with the assumptions we used in determining our reserves and pricing our products. If our assumptions with respect to future claims are incorrect, or our reserves are insufficient to cover our actual losses and expenses, we would be required to increase our liabilities, which would negatively affect our operating results.
REINSURANCE
Consistent with the general practice of the life insurance industry, our subsidiaries enter into both facultative and treaty agreements of indemnity reinsurance with other insurance companies in order to reinsure portions of the coverage provided by our insurance products. Indemnity reinsurance agreements are intended to limit a life insurer’s maximum loss on a large or unusually hazardous risk or to diversify its risk. Indemnity reinsurance does not discharge the original insurer’s primary liability to the insured. Our reinsured business is ceded to numerous reinsurers. Based on our periodic review of their financial statements, insurance industry reports and reports filed with state insurance departments, we believe the assuming companies are able to honor all contractual commitments.
As of December 31, 2010, the policy risk retention limit of our insurance subsidiaries was generally $.8 million or less. Reinsurance ceded by CNO represented 25 percent of gross combined life insurance inforce and reinsurance assumed represented .8 percent of net combined life insurance inforce. Our principal reinsurers at December 31, 2010 were as follows (dollars in millions):
| | | Ceded life | | | A.M. Best | |
| Name of Reinsurer | | insurance inforce | | | rating | |
| | | | | | | |
| Wilton Reassurance Company (“Wilton Re”) | | $ | 3,389.0 | | | | A | - |
| Swiss Re Life and Health America Inc. | | | 3,086.3 | | | | A | |
| Security Life of Denver Insurance Company | | | 2,523.4 | | | | A | |
Reassure America Life Insurance Company (“REALIC”) (a) | | | 1,247.0 | | | | A | |
| RGA Reinsurance Company | | | 827.9 | | | | A | + |
| Munich American Reassurance Company | | | 814.7 | | | | A | + |
| Lincoln National Life Insurance Company | | | 519.3 | | | | A | + |
| Scor Global Life Re Insurance Co of Texas | | | 473.8 | | | | A | |
| Hannover Life Reassurance Company | | | 340.9 | | | | A | |
| General Re Life Corporation | | | 331.6 | | | | A | ++ |
| All others (b) | | | 1,247.0 | | | | | |
| | | | | | | | | |
| | | $ | 14,800.9 | | | | | |
____________________
| (a) | In addition to the life insurance business summarized above, REALIC has assumed certain annuity business from our insurance subsidiaries through a coinsurance agreement. Such business had total insurance policy liabilities of $1.7 billion at December 31, 2010. |
| (b) | No other single reinsurer assumed greater than 2 percent of the total ceded business inforce. |
EMPLOYEES
At December 31, 2010, we had approximately 3,680 full time employees, including 1,400 employees supporting our Bankers Life segment, 370 employees supporting our Colonial Penn segment and 1,910 employees supporting our shared services and our Washington National, Other CNO Business and corporate segments. None of our employees are covered by a collective bargaining agreement. We believe that we have good relations with our employees.
GOVERNMENTAL REGULATION
Our insurance businesses are subject to extensive regulation and supervision by the insurance regulatory agencies of the jurisdictions in which they operate. This regulation and supervision is primarily for the benefit and protection of customers, and not for the benefit of investors or creditors. State laws generally establish supervisory agencies that have broad regulatory authority, including the power to:
• grant and revoke business licenses;
• regulate and supervise sales practices and market conduct;
• establish guaranty associations;
• license agents;
• approve policy forms;
| | • | approve premium rates and premium rate increases for some lines of business such as long-term care and Medicare supplement; |
• establish reserve requirements;
• prescribe the form and content of required financial statements and reports;
• determine the reasonableness and adequacy of statutory capital and surplus;
• perform financial, market conduct and other examinations;
• define acceptable accounting principles; and
• regulate the types and amounts of permitted investments.
In addition, the NAIC issues model laws and regulations, many of which have been adopted by state insurance regulators, relating to:
• reserve requirements;
• risk-based capital (“RBC”) standards;
• codification of insurance accounting principles;
• investment restrictions;
• restrictions on an insurance company’s ability to pay dividends;
• credit for reinsurance; and
• product illustrations.
In addition to the regulations described above, most states have also enacted laws or regulations regarding the activities of insurance holding company systems, including acquisitions, the terms of surplus debentures, the terms of transactions between insurance companies and their affiliates and other related matters. Various notice and reporting requirements generally apply to transactions between insurance companies and their affiliates within an insurance holding company system, depending on the size and nature of the transactions. These requirements may include prior regulatory approval or prior notice for certain material transactions. Currently, the Company and its insurance subsidiaries are registered as a holding company system pursuant to such laws and regulations in the domiciliary states of the insurance subsidiaries. In addition, the Company’s insurance subsidiaries routinely report to other jurisdictions.
Insurance regulators may prohibit the payment of dividends or other payments by our insurance subsidiaries to parent companies if they determine that such payment could be adverse to our policyholders or contract holders. Otherwise, the ability of our insurance subsidiaries to pay dividends is subject to state insurance department regulations and is based on the financial statements of our insurance subsidiaries prepared in accordance with statutory accounting practices prescribed or permitted by regulatory authorities, which differ from financial statements prepared in accordance with accounting principles generally accepted in the United States of America (“GAAP”). These regulations generally permit dividends to be paid by the insurance company if such dividends are not in excess of unassigned surplus and, for any 12-month period, are in amounts less than the greater of, or in a few states, the lesser of:
• statutory net gain from operations or statutory net income for the prior year; or
• 10 percent of statutory capital and surplus at the end of the preceding year.
Any dividends in excess of these levels require the approval of the director or commissioner of the applicable state insurance department.
In accordance with an order from the Florida Office of Insurance Regulation, Washington National may not distribute funds to any affiliate or shareholder without prior notice to the Florida Office of Insurance Regulation. In addition, the RBC and other capital requirements described below can also limit, in certain circumstances, the ability of our insurance subsidiaries to pay dividends.
Our insurance subsidiaries that have long-term care business have made insurance regulatory filings seeking actuarially justified rate increases on our long-term care policies. Most of our long-term care business is guaranteed renewable, and, if necessary rate increases are not approved, we may be required to write off all or a portion of the insurance acquisition costs and establish a premium deficiency reserve. If we are unable to raise our premium rates because we fail to obtain approval for actuarially justified rate increases in one or more states, our financial condition and results of operations could be adversely affected.
During 2006, the Florida legislature enacted a statute, known as House Bill 947, intended to provide new protections to long-term care insurance policyholders. Among other requirements, this statute requires: (i) claim experience of affiliated long-term care insurers to be pooled in determining justification for rate increases for Florida policyholders; and (ii) insurers with closed blocks of long-term care insurance to not raise rates above the comparable new business premium rates offered by affiliated insurers. The manner in which the requirements of this statute are applied to our long-term care policies in Florida (including policies subject to the order from the Florida Office of Insurance Regulation as described in “Management’s Discussion and Analysis of Consolidated Financial Condition and Results of Operations”) may affect our ability to achieve our anticipated rate increases on this business.
Most states have also enacted legislation or adopted administrative regulations that affect the acquisition (or sale) of control of insurance companies. The nature and extent of such legislation and regulations vary from state to state. Generally, these regulations require an acquirer of control to file detailed information and the plan of acquisition, and to obtain administrative approval prior to the acquisition of control. “Control” is generally defined as the direct or indirect power to direct or cause the direction of the management and policies of a person and is rebuttably presumed to exist if a person or group of affiliated persons directly or indirectly owns or controls 10 percent or more of the voting securities of another person.
Using statutory statements filed with state regulators annually, the NAIC calculates certain financial ratios to assist state regulators in monitoring the financial condition of insurance companies. A “usual range” of results for each ratio is used as a benchmark. An insurance company may fall out of the usual range for one or more ratios because of specific transactions that are in themselves immaterial or eliminated at the consolidated level. Generally, an insurance company will become subject to regulatory scrutiny if it falls outside the usual ranges of four or more of the ratios, and regulators may then act, if the company has insufficient capital, to constrain the company’s underwriting capacity. In the past, variances in certain ratios of our insurance subsidiaries have resulted in inquiries from insurance departments, to which we have responded. These inquiries have not led to any restrictions affecting our operations.
The NAIC’s RBC requirements provide a tool for insurance regulators to determine the levels of statutory capital and surplus an insurer must maintain in relation to its insurance and investment risks and the need for possible regulatory attention. The RBC requirements provide four levels of regulatory attention, varying with the ratio of the insurance company’s total adjusted capital (defined as the total of its statutory capital and surplus, asset valuation reserve and certain other adjustments) to its RBC (as measured on December 31 of each year), as follows:
| | • | if a company’s total adjusted capital is less than 100 percent but greater than or equal to 75 percent of its RBC (the “Company Action Level”), the company must submit a comprehensive plan to the regulatory authority proposing corrective actions aimed at improving its capital position; |
| | • | if a company’s total adjusted capital is less than 75 percent but greater than or equal to 50 percent of its RBC, the regulatory authority will perform a special examination of the company and issue an order specifying the corrective actions that must be taken; |
| | • | if a company’s total adjusted capital is less than 50 percent but greater than or equal to 35 percent of its RBC (the “Authorized Control Level”), the regulatory authority may take any action it deems necessary, including placing the company under regulatory control; and |
| | • | if a company’s total adjusted capital is less than 35 percent of its RBC (the “Mandatory Control Level”), the regulatory authority must place the company under its control. |
In addition, the RBC requirements provide for a trend test if a company’s total adjusted capital is between 100 percent and 125 percent of its RBC at the end of the year. The trend test calculates the greater of the decrease in the margin of total adjusted capital over RBC:
• between the current year and the prior year; and
• for the average of the last 3 years.
It assumes that such decrease could occur again in the coming year. Any company whose trended total adjusted capital is less than 95 percent of its RBC would trigger a requirement to submit a comprehensive plan as described above for the Company Action Level.
The 2010 statutory annual statements to be filed with the state insurance regulators of each of our insurance subsidiaries are expected to reflect total adjusted capital in excess of the levels subjecting the subsidiaries to any regulatory action. No assurances can be given that we will make future contributions or otherwise make capital available to our insurance subsidiaries.
In addition to the RBC requirements, certain states have established minimum capital requirements for insurance companies licensed to do business in their state. These regulators have the discretionary authority, in connection with the continual licensing of the Company’s insurance subsidiaries, to limit or prohibit writing new business within its jurisdiction when, in the state’s judgment, the insurance subsidiary is not maintaining adequate statutory surplus or capital or that the insurance subsidiary’s further transaction of business would be hazardous to policyholders. These additional requirements generally have not had a significant impact on the Company’s insurance subsidiaries. Refer to the note entitled “Statutory Information (Based on Non-GAAP Measures)” in th e notes to the consolidated financial statements for more information on our RBC ratios.
In addition, although we are under no obligation to do so, we may elect to contribute additional capital to strengthen the surplus of certain insurance subsidiaries. Any election regarding the contribution of additional capital to our insurance subsidiaries could affect the ability of our insurance subsidiaries to pay dividends to the holding company. The ability of our insurance subsidiaries to pay dividends is also impacted by various criteria established by rating agencies to maintain or receive higher ratings and by the capital levels that we target for our insurance subsidiaries.
The NAIC has adopted model long-term care policy language providing nonforfeiture benefits and has proposed a rate stabilization standard for long-term care policies. Various bills are introduced from time to time in the U.S. Congress which propose the implementation of certain minimum consumer protection standards in all long-term care policies, including guaranteed renewability, protection against inflation and limitations on waiting periods for pre-existing conditions. Federal legislation permits premiums paid for qualified long-term care insurance to be tax-deductible medical expenses and for benefits received on such policies to be excluded from taxable income.
Our insurance subsidiaries are required, under guaranty fund laws of most states, to pay assessments up to prescribed limits to fund policyholder losses or liabilities of insolvent insurance companies. Typically, assessments are levied on member insurers on a basis which is related to the member insurer’s proportionate share of the business written by all member insurers. Assessments can be partially recovered through a reduction in future premium taxes in some states.
The Company’s insurance subsidiaries are required to file detailed annual reports, in accordance with prescribed statutory accounting rules, with regulatory authorities in each of the jurisdictions in which they do business. As part of their routine oversight process, state insurance departments conduct periodic detailed examinations, generally once every three to five years, of the books, records and accounts of insurers domiciled in their states. These examinations are generally conducted in cooperation with the departments of two or three other states under guidelines promulgated by the NAIC.
State regulatory authorities and industry groups have developed several initiatives regarding market conduct, including the form and content of disclosures to consumers, advertising, sales practices and complaint handling. Various state insurance departments periodically examine domestic and non-domestic insurance companies conducting business in their states, including the insurance subsidiaries. The purpose of these periodic examinations is to determine if operations are consistent with the public interest of the policyholders resident in the state conducting the examination. State regulators have imposed significant fines and restrictions on our insurance company subsidiaries for improper market conduct. See “Management̵ 7;s Discussion and Analysis of Financial Condition and Results of Operations”. In addition, market conduct has become one of the criteria used by rating agencies to establish the ratings of an insurance company. For example, A.M. Best’s ratings analysis now includes a review of the insurer’s compliance program.
Recent investigations of broker placement and compensation practices initiated by the attorney general offices of certain states, together with recently filed class action lawsuits, initiated against such broker entities and certain insurance companies have challenged the legality of certain activities conducted by these brokers and companies. The investigations and suits challenge, among other things, (i) the appropriateness of setting fees paid to brokers based on the volume of business placed by a broker with a particular insurer or reinsurer; (ii) the payment of contingent fees to brokers by insurers or reinsurers because of an alleged conflict of interest arising from such fee arrangements; (iii) the nondisclosure by brokers to their clients of contingent fees paid to them by insurers and reinsurers; and (i v) bid rigging and tying the receipt of direct insurance to placing reinsurance through the same broker.
Most states mandate minimum benefit standards and benefit ratios for accident and health insurance policies. We are generally required to maintain, with respect to our individual long-term care policies, minimum anticipated benefit ratios over the entire period of coverage of not less than 60 percent. With respect to our Medicare supplement policies, we are generally required to attain and maintain an actual benefit ratio, after three years, of not less than 65 percent. We provide to the insurance departments of all states in which we conduct business annual calculations that demonstrate compliance with required minimum benefit ratios for both long-term care and Medicare supplement insurance. These calculations are prepared utilizing statutory lapse and interest rate assumptions. In the event that we fail to maintain minimum mandated benefit ratios, our insurance subsidiaries could be required to provide retrospective refunds and/or prospective rate reductions. We believe that our insurance subsidiaries currently comply with all applicable mandated minimum benefit ratios.
Our insurance subsidiaries are subject to state laws and regulations that require diversification of their investment portfolios and limit the amount of investments in certain investment categories, such as below investment grade bonds, equity real estate and common stocks. Failure to comply with these laws and regulations would cause investments exceeding regulatory limitations to be treated as non-admitted assets for purposes of measuring statutory surplus, and, in some instances, would require divestiture of such non-qualifying investments. The investments made by our insurance subsidiaries comply in all material respects with such investment regulations as of December 31, 2010.
Federal and state law and regulation require financial institutions to protect the security and confidentiality of personal information, including health-related and customer information, and to notify customers and other individuals about their policies and practices relating to their collection and disclosure of health-related and customer information and their practices relating to protecting the security and confidentiality of that information. State laws regulate use and disclosure of social security numbers and federal and state laws require notice to affected individuals, law enforcement, regulators and others if there is a breach of the security of certain personal information, including social security numbers. Federal and state laws and regulations regulate the ability of financial institutions to make tel emarketing calls and to send unsolicited e-mail or fax messages to consumers and customers. Federal and state lawmakers and regulatory bodies may be expected to consider additional or more detailed regulation regarding these subjects and the privacy and security of personal information. The United States Department of Health and Human Services has issued regulations under the Health Insurance Portability and Accountability Act relating to standardized electronic transaction formats, code sets and the privacy of member health information. These regulations, and any corresponding state legislation, affect our administration of health insurance.
Title III of the USA PATRIOT Act of 2001 (the “Patriot Act”), amends the Money Laundering Control Act of 1986 and the Bank Secrecy Act of 1970 to expand anti-money laundering (“AML”) and financial transparency laws applicable to financial services companies, including insurance companies. The Patriot Act, among other things, seeks to promote cooperation among financial institutions, regulators and law enforcement entities in identifying parties that may be involved in terrorism, money laundering or other illegal activities. To the extent required by applicable laws and regulations, CNO and its insurance subsidiaries have adopted AML programs that include policies, procedures and controls to detect and prevent money laundering, have designated compliance officers to oversee the programs, provi de for on-going employee
training and ensure periodic independent testing of the programs. CNO’s and the insurance subsidiaries’ AML programs, to the extent required, also establish and enforce customer identification programs and provide for the monitoring and the reporting to the Department of the Treasury of certain suspicious transactions.
Traditionally, the federal government has not directly regulated the business of insurance. However, federal legislation and administrative policies in several areas can significantly and adversely affect insurance companies. Most prominently, the Patient Protection and Affordable Care Act and the Health Care and Education Reconciliation Act of 2010 give the U.S. federal government direct regulatory authority over certain aspects of the business of health insurance. In addition, the reform includes major changes to the U.S. health care insurance marketplace. Among other changes, the reform legislation includes an individual medical insurance coverage mandate, provides for penalties on certain employers for failing to provide adequate coverage, creates health insurance exchanges to attempt to fa cilitate the purchase of insurance by individuals and small businesses, and addresses policy coverages and exclusions as well as the medical loss ratios of insurers. The legislation also includes changes in government reimbursements and tax credits for individuals and employers and alters federal and state regulation of health insurers. These changes will be phased in over the next several years. These changes are directed toward major medical health insurance coverage, which our insurance subsidiaries do not offer. Rather, our core products (e.g., medicare supplement insurance, long term care insurance, and other limited benefit supplemental insurance products) are not subject to or covered under the major provisions of this new federal legislation.
In addition, the Dodd-Frank Wall Street Reform and Consumer Protection Act of 2010 (the “Dodd-Frank Act”) generally provides for enhanced federal supervision of financial institutions, including insurance companies in certain circumstances, and financial activities that represent a systemic risk to financial stability or the U.S. economy. Under the Dodd-Frank Act, a Federal Insurance Office will be established within the U.S. Treasury Department to monitor all aspects of the insurance industry and its authority would likely extend to most lines of insurance that are written by the Company, although the Federal Insurance Office is not empowered with any general regulatory authority over insurers. The director of the Federal Insurance Office will serve in an advisory capacity to the newly established Finan cial Stability Oversight Council and will have the ability to recommend that an insurance company or an insurance holding company be subject to heightened prudential standards by the Federal Reserve, if it is determined that financial distress at the company could pose a threat to financial stability in the U.S. The Dodd-Frank Act also provides for the preemption of state laws when inconsistent with certain international agreements, and would streamline the state-level regulation of reinsurance and surplus lines insurance. Under certain circumstances, the FDIC can assume the role of a state insurance regulator and initiate liquidation proceedings under state law.
It is unclear what impact, if any, the Dodd-Frank Act or any other similar legislation could have on the insurance subsidiaries’ results of operations, financial condition or liquidity.
On March 5, 2009, the U.S. House of Representatives passed the “Helping Families Save Their Homes Act of 2009”, which would grant federal bankruptcy judges the ability to modify the terms of certain mortgage loans by, among other things, reducing interest rates and principal and extending repayments. Because it would permit judges to reduce, or “cram down” principal, this type of legislation is referred to as “cram down” legislation. Although the U.S. Senate defeated the “cram down” aspects of this legislation on April 30, 2009, similar legislation may be introduced in the future. Mortgage loan modifications can affect the allocation of losses on certain residential mortgage-backed securities (“RMBS”) transactions including senior tranc hes of RMBS transactions that include bankruptcy carve-outs, which provide that bankruptcy losses above a specified threshold are allocated to all tranches pro rata regardless of seniority. If similar mortgage-related legislation is signed into law, it could cause loss of principal on or ratings downgrades of certain of the Company’s RMBS holdings, including senior tranches of RMBS transactions that include bankruptcy carve-outs.
In late 2009, the NAIC issued Statement of Statutory Accounting Principles 10R (“SSAP 10R”). SSAP 10R increased the amount of deferred tax assets that may be admitted on a statutory basis. The admission criteria for realizing the value of deferred tax assets was increased from a one year to a three-year period. Further, the aggregate cap on deferred tax assets that may be admitted was increased from 10 percent to 15 percent of surplus. These changes increased the capital and surplus of our insurance subsidiaries, thereby positively impacting RBC. To temper this positive RBC impact, a 5 percent pretax RBC charge must be applied to the additional admitted deferred tax assets generated by SSAP 10R.
The asset management activities of 40|86 Advisors are subject to various federal and state securities laws and regulations. The SEC and certain state securities commissions are the principal regulators of our asset management operations. In addition, CNO has a subsidiary that is registered as a broker/dealer, which is regulated by the Financial Industry Regulatory Authority, Inc. and by state securities commissioners.
FEDERAL INCOME TAXATION
Our annuity and life insurance products generally provide policyholders with an income tax advantage, as compared to other savings investments such as certificates of deposit and bonds, because taxes on the increase in value of the products are deferred until received by policyholders. With other savings investments, the increase in value is generally taxed as earned. Annuity benefits and life insurance benefits, which accrue prior to the death of the policyholder, are generally not taxable until paid. Life insurance death benefits are generally exempt from income tax. Also, benefits received on immediate annuities (other than structured settlements) are recognized as taxable income ratably, as opposed to the methods used for some other investments which tend to accelerate taxable income into e arlier years. The tax advantage for annuities and life insurance is provided in the Internal Revenue Code (the “Code”), and is generally followed in all states and other United States taxing jurisdictions.
In recent years, Congress enacted legislation to lower marginal tax rates, reduce the federal estate tax gradually over a ten-year period, with total elimination of the federal estate tax in 2010, and increase contributions that may be made to individual retirement accounts and 401(k) accounts. Additionally, Congress has considered, from time to time, other possible changes to the U.S. tax laws, including elimination of the tax deferral on the accretion of value of certain annuities and life insurance products. It is possible that further tax legislation will be enacted which would contain provisions with possible adverse effects on our annuity and life insurance products.
Our insurance company subsidiaries are taxed under the life insurance company provisions of the Code. Provisions in the Code require a portion of the expenses incurred in selling insurance products to be deducted over a period of years, as opposed to immediate deduction in the year incurred. This provision increases the tax for statutory accounting purposes, which reduces statutory earnings and surplus and, accordingly, decreases the amount of cash dividends that may be paid by the life insurance subsidiaries.
Our income tax expense includes deferred income taxes arising from temporary differences between the financial reporting and tax bases of assets and liabilities, capital loss carryforwards and net operating loss carryforwards (“NOLs”). In evaluating our deferred income tax assets, we consider whether it is more likely than not that the deferred income tax assets will be realized. The ultimate realization of our deferred income tax assets depends upon generating future taxable income during the periods in which our temporary differences become deductible and before our NOLs expire. In addition, the use of our NOLs is dependent, in part, on whether the Internal Revenue Service (“IRS”) ultimately agrees with the tax position we plan to take in our current and future tax returns. Accordingly, with respect to our deferred tax assets, we assess the need for a valuation allowance on an ongoing basis.
Based upon information existing at the time of our emergence from bankruptcy, we established a valuation allowance equal to our entire balance of net deferred income tax assets because, at that time, the realization of such deferred tax assets in future periods was uncertain. As of December 31, 2010, 2009 and 2008, we determined that a full valuation allowance was no longer necessary. However, as further discussed in the note to the consolidated financial statements entitled “Income Taxes”, we continue to believe that it is necessary to have a valuation allowance on a portion of our deferred tax asset. This determination was made by evaluating each component of the deferred tax assets and assessing the effects of limitations or issues on the value of such component to be fully recognized in th e future.
ITEM 1A. RISK FACTORS.
CNO and its businesses are subject to a number of risks including general business and financial risk factors. Any or all of such factors could have a material adverse effect on the business, financial condition or results of operations of CNO. In addition, please refer to the “Cautionary Statement Regarding Forward-Looking Statements” included in “Item 7 – Management’s Discussion and Analysis of Consolidated Financial Condition and Results of Operations”.
Continuation of a low interest rate environment for an extended period of time may impact our profitability.
During periods in 2010, interest rates were at historically low levels. If interest rates were to remain low over an extended period of time, we may have to invest new cash flows or reinvest proceeds from investments that have matured, prepaid or been sold at lower yields, reducing our net spread between interest earned on investments and interest credited to some of our products (including annuity and other interest-sensitive products). Our ability to lower credited rates is limited by the guaranteed minimum rates that we must credit to policyholders on certain products, as well as the terms of most of our other products that limit reductions in the crediting rates. In addition, investment income is an important component of the profitability of our health products, especially long-term care and suppleme ntal health products.
Our expectation of future investment income is an important consideration in determining the amortization of deferred acquisition costs and the present value of future profits (collectively referred to as “insurance acquisition costs”), analyzing the recovery of these assets and determining the adequacy of our liabilities for insurance products. Expectations of lower future investment earnings may cause us to accelerate amortization or write down the balance of insurance acquisition costs or establish additional liabilities for insurance products, thereby reducing net income in the affected reporting period. The blocks of business in our Other CNO Business segment are particularly sensitive to changes in our expectations of future interest rates, since many of these blocks are not expected to generate fu ture profits and the entire impact of adverse changes to our earlier estimates of future gross profits is reflected in earnings in the period such changes occur. For example, during 2010, we were required to recognize a pre-tax reduction in earnings of approximately $13 million in our Other CNO Business segment primarily due to additional amortization expense resulting from decreased projected future investment yields related to interest-sensitive insurance products.
Sustained periods of low or declining interest rates may adversely affect our results of operations, financial position and cash flows.
We have substantial indebtedness that will require a significant portion of the cash available to CNO, restricting our ability to take advantage of business, strategic or financing opportunities.
As of December 31, 2010, we had an aggregate principal amount of indebtedness of $1,018.0 million, consisting of the following (dollars in millions):
| New Senior Secured Credit Agreement (as defined below) | | $ | 375.0 | |
| 9.0% Senior Secured Notes due 2018 (“9.0% Senior Secured Notes”) | | | 275.0 | |
| 7.0% Convertible Senior Debentures due 2016 (“7.0% Debentures”) | | | 293.0 | |
| 6.0% Senior Health Note | | | 75.0 | |
| | | | | |
| | | $ | 1,018.0 | |
The principal payments on our direct corporate obligations (including payments required under the New Senior Secured Credit Agreement, the Senior Health Note, the 9.0% Senior Secured Notes and the 7.0% Debentures) are as follows (dollars in millions):
| 2011 | | $ | 55.0 | |
| 2012 | | | 65.0 | |
| 2013 | | | 80.0 | |
| 2014 | | | 75.0 | |
| 2015 | | | 85.0 | |
| 2016 | | | 383.0 | |
| 2018 | | | 275.0 | |
| | | | | |
| | | $ | 1,018.0 | |
CNO’s indebtedness will require $122 million in cash to service in 2011. The payment of principal and interest on our outstanding indebtedness will require a substantial portion of CNO’s available cash each year, which, as a holding company, is limited, as further described in the risk factor entitled “CNO is a holding company and its liquidity and ability to meet its obligations may be constrained by the ability of CNO’s insurance subsidiaries to distribute cash to it” below. Our debt obligations may restrict our ability to take advantage of business, strategic or financing opportunities.
On December 21, 2010, the Company entered into a $375 million senior secured term loan facility maturing on September 30, 2016, pursuant to an agreement among the Company, Morgan Stanley Senior Funding, Inc., as administrative agent (the “Agent”), and the lenders from time to time party thereto (the “New Senior Secured Credit Agreement”). The New Senior Secured Credit Agreement contains various restrictive covenants and required financial ratios that we will be required to meet or maintain and that will limit our operating flexibility. If we default under any of these covenants, the lenders could declare the outstanding principal amount of the term loan, accrued and unpaid interest and all other amounts owing or payable thereunder to be immediately due and payable. In such event, t he holders of the 7.0% Debentures, the 9.0% Senior Secured Notes and the unsecured Senior Health Note could elect to take similar action with respect to those debts. If that were to occur, we would not have sufficient liquidity to repay our indebtedness. Absent sufficient liquidity to repay our indebtedness, our management or our independent registered public accounting firm may conclude that there is substantial doubt regarding our ability to continue as a going concern.
If we fail to pay interest or principal on the 7.0% Debentures or the 9.0% Senior Secured Notes, we will be in default under the indentures governing such indebtedness, which could also lead to a default under agreements governing our existing and future indebtedness, including under the New Senior Secured Credit Agreement. If the repayment of the related indebtedness were to be accelerated after any applicable notice or grace periods, we likely would not have sufficient funds to repay our indebtedness.
The New Senior Secured Credit Agreement contains various restrictive covenants and required financial ratios that limit our operating flexibility. The violation of one or more loan covenant requirements will entitle our lenders to declare all outstanding amounts under the New Senior Secured Credit Agreement to be due and payable.
Pursuant to the New Senior Secured Credit Agreement, CNO agreed to a number of covenants and other provisions that restrict the Company’s ability to borrow money and pursue some operating activities without the prior consent of the lenders. We also agreed to meet or maintain various financial ratios and balances. Our ability to meet these financial tests and maintain ratings may be affected by events beyond our control. There are several conditions or circumstances that could lead to an event of default under the New Senior Secured Credit Agreement, as described below.
The New Senior Secured Credit Agreement prohibits or restricts, among other things, CNO’s ability to:
| | • | incur or guarantee additional indebtedness (including, for this purpose, reimbursement obligations under letters of credit, except to the extent such reimbursement obligations relate to letters of credit issued in connection with reinsurance transactions entered into in the ordinary course of business) or issue preferred stock; |
• pay dividends or make other distributions to shareholders;
• purchase or redeem capital stock or subordinated indebtedness;
• make certain investments;
• create liens;
| | • | incur restrictions on CNO’s ability and the ability of CNO’s subsidiaries to pay dividends or make other payments to CNO; |
• sell assets, including capital stock of CNO’s subsidiaries;
• consolidate or merge with or into other companies or transfer all or substantially all of our assets; and
• engage in transactions with affiliates;
in each case subject to important exceptions and qualifications as set forth in the New Senior Secured Credit Agreement.
These provisions represent significant restrictions on the manner in which we may operate our business. If we default under any of these provisions, the lenders will be able to declare the outstanding principal amount of the term loan, accrued and unpaid interest and all other amounts owing or payable thereunder to be due and payable. If that were to occur, we would likely not have sufficient liquidity to repay amounts due under the New Senior Secured Credit Agreement in full or any of our other debts which may be accelerated as a result of any such default.
Pursuant to the New Senior Secured Credit Agreement, unless our Debt to Total Capitalization Ratio (as defined in the New Senior Secured Credit Agreement) is less than or equal to 20 percent and either (A) Bankers Life, Washington National and Colonial Penn have financial strength ratings of not less than either “A-” (stable) from A.M. Best or (B) the senior secured term loan facility under the New Senior Secured Credit Agreement has a rating of not less than “BBB-” (stable) from S&P and “Baa3” (stable) from Moody’s, we will be required to make mandatory prepayments with all or a portion of the proceeds from the following transactions or events: (i) certain equity issuances; (ii) certain asset sales; and (iii) certain casualty events.
In addition, the New Senior Secured Credit Agreement requires the Company to maintain: (i) a debt to total capitalization ratio of not more than 30 percent (such ratio was 19.99 percent at December 31, 2010); (ii) an interest coverage ratio of not less than 2.00 to 1.00 for each rolling four quarters (or, if less, the number of full fiscal quarters commencing after the effective date of the New Senior Secured Credit Agreement) (such ratio was not applicable for the period ended December 31, 2010); (iii) an aggregate ratio of total adjusted capital to company action level risk-based capital for the Company’s insurance subsidiaries of not less than 225 percent on or prior to December 31, 2011 and 250 percent thereafter (such ratio was 332 percent at December 31, 2010); and (iv) a combined statutory capital and surplus for the Company’s insurance subsidiaries of at least $1,200.0 million (combined statutory capital and surplus at December 31, 2010, was $1,596.4 million).
These covenants may place significant restrictions on the manner in which we may operate our business and our ability to meet these financial covenants may be affected by events beyond our control. If we default under any of these covenants, the lenders could declare the outstanding principal amount of the term loan, accrued and unpaid interest and all other amounts owing and payable thereunder to be immediately due and payable, which would have material adverse consequences to us. If the lenders under the New Senior Secured Credit Agreement elect to accelerate the amounts due, the holders of the 7.0% Debentures, the 9.0% Senior Secured Notes and the Senior Health Note could elect to take similar action with respect to those debts. If that were to occur, we would not have sufficient liquidity to repay our indebtedness.
If in future periods we are not able to demonstrate that we will be in compliance with the financial covenant requirements in the New Senior Secured Credit Agreement for at least 12 months following the date of the financial statements, management may conclude there is substantial doubt about our ability to continue as a going concern and the audit opinion that we would receive from our independent registered public accounting firm may include an explanatory paragraph regarding our ability to continue as a going concern. Such an opinion would be in breach of the covenants in the New Senior Secured Credit Agreement. If the circumstances leading to the substantial doubt were not cured prior to the issuance of the audit opinion, or we were unable to obtain a waiver on the going concern opinion requirement within 3 0 days after notice from the lenders, it would be an event of default entitling the lenders to declare the outstanding principal amount of term loan, accrued and unpaid interest and all other amounts due and payable thereunder to be due and payable. If an
event of default were to occur, it is highly probable that we would not have sufficient liquidity to repay our bank indebtedness in full or any of our other indebtedness which could also be accelerated as a result of the default.
The obligations under the New Senior Secured Credit Agreement and the 9.0% Senior Secured Notes are guaranteed by our current and future domestic subsidiaries, other than our insurance subsidiaries and certain immaterial subsidiaries. CDOC’s guarantee under the 9.0% Senior Secured Notes and the New Senior Secured Credit Agreement is secured by a lien on substantially all of the assets of our primary non-insurance company subsidiaries, as defined in the New Senior Secured Credit Agreement (collectively, the “Subsidiary Guarantors”), including the stock of Conseco Life Insurance Company of Texas (“Conseco Life of Texas”) (which is the parent of Bankers Life, Bankers Conseco Life Insurance Company (“Bankers Conseco Life”) and Colonial Penn), Washington National and Conseco Life. � 0;If we fail to make the required payments, do not meet the financial covenants or otherwise default on the terms of the New Senior Secured Credit Agreement or the 9.0% Senior Secured Notes, the stock of Conseco Life of Texas, Washington National and Conseco Life could be transferred to the lenders under the New Senior Secured Credit Agreement and the holders of the 9.0% Senior Secured Notes. Any such transfer would have a material adverse effect on our business, financial condition and results of operations.
Our current credit ratings may adversely affect our ability to access capital and the cost of such capital, which could have a material adverse effect on our financial condition and results of operations.
On December 21, 2010, S&P upgraded the rating on CNO’s senior secured debt to “B” from “B-”. On December 17, 2009, S&P upgraded the rating on CNO’s senior secured debt to “B-” from “CCC”. In S&P’s view, an obligation rated “B” is more vulnerable to nonpayment than obligations rated “BB”, but the obligor currently has the capacity to meet its financial commitment on the obligation. Adverse business, financial, or economic conditions will likely impair the obligor’s capacity or willingness to meet its financial commitment on the obligation. S&P has a total of 22 separate categories rating senior debt, ranging from “AAA (Extremely Strong)” to “D (Payment Default).& #8221; There are fourteen ratings above CNO’s “B” rating and seven ratings that are below its rating. On December 21, 2010, Moody’s upgraded the rating on CNO’s senior secured debt to “B1” from “B2”. On May 26, 2010, Moody’s upgraded the rating on CNO’s senior secured debt to “B2”, from “Caa1”. In Moody’s view, an obligation rated “B” generally lacks the characteristics of a desirable investment and assurance of interest and principal payments or maintenance of other terms of the contract over any long period of time may be small. Moody’s has a total of 21 separate categories in which to rate senior debt, ranging from “Aaa (Exceptional)” to “C (Lowest Rated).” There are 13 ratings above CNO’s “B1” rating and seven ratings that are below its rating. If we were to require additional capital, either to refinance our existing indebtedness or for any other reason, our current senior debt ratings, as well as conditions in the credit markets generally, could restrict our access to such capital and adversely affect its cost.
CNO is a holding company and its liquidity and ability to meet its obligations may be constrained by the ability of CNO’s insurance subsidiaries to distribute cash to it.
CNO and CDOC are holding companies with no business operations of their own. CNO and CDOC depend on their operating subsidiaries for cash to make principal and interest payments on debt and to pay administrative expenses and income taxes. CNO and CDOC receive cash from insurance subsidiaries, consisting of dividends and distributions, principal and interest payments on surplus debentures and tax-sharing payments, as well as cash from their non-insurance subsidiaries consisting of dividends, distributions, loans and advances. Deterioration in the financial condition, earnings or cash flow of these significant subsidiaries for any reason could hinder the ability of such subsidiaries to pay cash dividends or other disbursements to CNO and/or CDOC, which would limit our ability to meet our debt service requir ements and satisfy other financial obligations. In addition, CNO may elect to contribute additional capital to certain insurance subsidiaries to strengthen their surplus for covenant compliance or regulatory purposes (including, for example, maintaining adequate RBC levels) or to provide the capital necessary for growth, in which case it is less likely that its insurance subsidiaries would pay CNO dividends. Accordingly, this could limit CNO’s ability to meet debt service requirements and satisfy other holding company financial obligations.
CNO receives dividends and other payments from CDOC and from certain non-insurance subsidiaries. CDOC receives dividends and surplus debenture interest payments from our insurance subsidiaries and payments from certain of our non-insurance subsidiaries. Payments from our non-insurance subsidiaries to CNO or CDOC, and payments from CDOC to CNO, do not require approval by any regulatory authority or other third party. However, the payment of dividends or surplus debenture interest by our insurance subsidiaries to CDOC is subject to state insurance department regulations and may be prohibited by insurance regulators if they determine that such dividends or other payments could be adverse to our policyholders or contract holders. Insurance regulations generally permit dividends to be paid from stat utory earned surplus of the insurance company without regulatory approval for any 12-month period in amounts equal to the greater of (or in a few states, the lesser of):
• statutory net gain from operations or statutory net income for the prior year, or
| | • | 10 percent of statutory capital and surplus as of the end of the preceding year (excluded from this calculation would be the $76.1 million of additional surplus recognized due to temporary modifications in statutory prescribed practices related to certain deferred tax assets). |
This type of dividend is referred to as “ordinary dividends”. Any dividends in excess of these levels require the approval of the director or commissioner of the applicable state insurance department. This type of dividend is referred to as “extraordinary dividends”. In 2010, our insurance subsidiaries paid extraordinary dividends of $166.0 million to CDOC and an aggregate of $114.4 million was paid by CDOC to our insurance subsidiaries in the form of capital contributions. Accordingly, during 2010, the cash dividends we received from our insurance subsidiaries exceeded capital contributions by $51.6 million. Each of the immediate insurance subsidiaries of CDOC had negative earned surplus at December 31, 2010. As a result, any dividend payments from the insurance subsidiaries to the holding company will require the prior approval of the director or commissioner of the applicable state insurance department. While the payment of dividends does require regulatory approval, CNO expects to receive regulatory approval for future dividends from its subsidiaries, but there can be no assurance that such payments will be approved or that the financial condition of our insurance subsidiaries will not change, making future approvals less likely.
We generally strive to maintain capital and surplus levels in our insurance subsidiaries in an amount that is sufficient to maintain a minimum consolidated RBC ratio of approximately 300 percent and will typically cause our insurance subsidiaries to pay ordinary dividends or request regulatory approval for extraordinary dividends when the consolidated RBC ratio exceeds such level and we have concluded the capital level in each of our insurance subsidiaries is adequate to support their business and projected growth. As required by applicable insurance regulations, we calculate the RBC ratio of our insurance company subsidiaries as of December 31 of each year. In addition, for purposes of a covenant in our New Senior Secured Credit Agreement, we calculate the consolidated RBC ratio of our insurance company s ubsidiaries quarterly by dividing our consolidated TAC (the sum of the TAC of Washington National, Conseco Life, Conseco Life of Texas, Bankers Life, Colonial Penn and Bankers Conseco Life minus the equity in the TAC of Bankers Life, Colonial Penn and Bankers Conseco Life (the subsidiaries of Conseco Life of Texas) included in the TAC of Conseco Life of Texas) by our consolidated RBC (the RBC calculated for all of our insurance company subsidiaries based on an aggregation of our insurance company subsidiaries’ data on a pro forma basis, as if they were one entity). The consolidated RBC ratio of our insurance company subsidiaries was 332 percent at December 31, 2010. See the risk factor above entitled “The New Senior Secured Credit Agreement contains various restrictive covenants and required financial ratios that limit our operating flexibility. The violation of one or more loan covenant requirements will entitle our lenders to declare all outstanding amounts unde r the New Senior Secured Credit Agreement to be due and payable”. We expect to receive regulatory approval for future dividends from our subsidiaries, but there can be no assurance that such payments will be approved or that the financial condition of our insurance subsidiaries will not change, making future approvals less likely.
Interest payments on surplus debentures from Conseco Life of Texas do not require additional approval provided the RBC ratio of Conseco Life of Texas exceeds 100 percent (but do require prior written notice to the Texas state insurance department). The RBC ratio of Conseco Life of Texas was 262 percent at December 31, 2010. Dividends and other payments from our non-insurance subsidiaries, including 40|86 Advisors and CNO Services, LLC, to CNO or CDOC do not require approval by any regulatory authority or other third party. However, insurance regulators may prohibit payments by our insurance subsidiaries to parent companies if they determine that such payments could be adverse to our policyholders or contractholders.
In addition, although we are under no obligation to do so, we may elect to contribute additional capital to strengthen the surplus of certain insurance subsidiaries for covenant compliance or regulatory purposes or to provide the capital necessary for growth. Any election regarding the contribution of additional capital to our insurance subsidiaries could affect the ability of our top tier insurance subsidiaries to pay dividends. The ability of our insurance subsidiaries to pay dividends is also impacted by various criteria established by rating agencies to maintain or receive higher ratings and by the capital levels that we target for our insurance subsidiaries, as well as RBC and statutory capital and surplus compliance requirements under the New Senior Secured Credit Agreement.
In addition, Washington National may not distribute funds to any affiliate or shareholder, without prior notice to the Florida Office of Insurance Regulation, in accordance with an order from the Florida Office of Insurance Regulation.
The following table sets forth the aggregate amount of (i) dividends and other distributions that our insurance subsidiaries paid to us; and (ii) capital contributions paid by us, to our insurance subsidiaries in each of the last three fiscal years (dollars in millions):
| | | Years ended December 31, | |
| | | 2010 | | | 2009 | | | 2008 | |
| | | | | | | | | | |
Dividends | | $ | 166.0 | | | $ | 35.0 | | | $ | 20.0 | |
Surplus debenture interest | | | 48.7 | | | | 59.3 | | | | 56.4 | |
Fees for services provided pursuant to service agreements | | | 79.5 | | | | 80.5 | | | | 71.5 | |
Tax sharing payments | | | 4.2 | | | | 3.4 | | | | 1.1 | |
| | | | | | | | | | | | | |
Total dividends and other distributions paid by its subsidiaries | | | 298.4 | | | | 178.2 | | | | 149.0 | |
Total capital contributions paid to insurance subsidiaries | | | (114.4 | ) | | | - | | | | (79.4 | ) |
| | | | | | | | | | | | | |
| Excess of dividends and other distributions over capital contributions | | $ | 184.0 | | | $ | 178.2 | | | $ | 69.6 | |
There are risks to our business associated with the current economic environment.
Over the past three years, the U.S. economy has experienced unprecedented credit and liquidity issues and entered into a recession. Following several years of rapid credit expansion, a contraction in mortgage lending coupled with substantial declines in home prices and rising mortgage defaults, resulted in significant write-downs of asset values by financial institutions, including government-sponsored entities and major commercial and investment banks. These write-downs, initially of mortgage-backed securities but spreading to many sectors of the related credit markets, and to related credit default swaps and other derivative securities, caused many financial institutions to seek additional capital, to merge with larger and stronger institutions, to be subsidized by the U.S. government and, in some cases, to f ail. These factors, combined with declining business and consumer confidence and increased unemployment, precipitated an economic slowdown. Although the recession may have ended, the risk of elevated unemployment remains.
Even under more favorable market conditions, general factors such as the availability of credit, consumer spending, business investment, capital market conditions and inflation affect our business. For example, in an economic downturn, higher unemployment, lower family income, lower corporate earnings, lower business investment and lower consumer spending may depress the demand for life insurance, annuities and other insurance products. In addition, this type of economic environment may result in higher lapses or surrenders of policies. Accordingly, the risks we face related to general economic and business conditions are more pronounced given the severity and magnitude of the recent adverse economic and market conditions.
More specifically, our business is exposed to the performance of the debt and equity markets. Adverse market conditions can affect the liquidity and value of our investments. The manner in which debt and equity market performance and changes in interest rates have affected, and will continue to affect, our business, financial condition, growth and profitability include, but are not limited to, the following:
| | • | The value of our investment portfolio has been materially affected in recent periods by changes in market conditions which resulted in, and may continue to result in, substantial realized and/or unrealized losses. For example, in 2008, the value of our investments decreased by $2.5 billion due to net unrealized losses on investments. Certain types of securities in our investment portfolio, such as structured securities supported by residential and commercial mortgages, have been disproportionately affected. Although the value of our investments increased on an aggregate basis in 2009 and 2010, future adverse capital market conditions could result in additional realized and/or unrealized losses. |
| | • | Changes in interest rates also affect our investment portfolio. In periods of increasing interest rates, life insurance policy loans, surrenders and withdrawals could increase as policyholders seek investments with higher returns. This could require us to sell invested assets at a time when their prices are depressed by the increase in interest rates, which could cause us to realize investment losses. Conversely, during periods of declining interest rates, we could experience increased premium payments on products with flexible premium features, repayment of policy loans and increased percentages of policies remaining inforce. We would obtain lower returns on investments made with these cash flows. In addition, borrowers may prepay or redeem bonds in our investment portfolio so that we might have to reinvest those proceeds in lower-yielding investments. &# 160;As a consequence of |
these factors, we could experience a decrease in the spread between the returns on our investment portfolio and amounts credited to policyholders and contract owners, which could adversely affect our profitability.
| | • | The attractiveness of certain of our products may decrease because they are linked to the equity markets and assessments of our financial strength, resulting in lower profits. Increasing consumer concerns about the returns and features of our products or our financial strength may cause existing customers to surrender policies or withdraw assets, and diminish our ability to sell policies and attract assets from new and existing customers, which would result in lower sales and fee revenues. |
Our investment portfolio is subject to several risks that may diminish the value of our invested assets and negatively impact our profitability, our financial condition, our liquidity and our ability to continue to comply with the financial covenants under the New Senior Secured Credit Agreement.
The value of our investment portfolio is subject to numerous factors, which may be difficult to predict, and are often beyond our control. These factors include, but are not limited to, the following:
| | • | changes in interest rates and credit spreads, which can reduce the value of our investments as further discussed in the risk factor below entitled “Changing interest rates may adversely affect our results of operations”; |
| | • | changes in patterns of relative liquidity in the capital markets for various asset classes; |
| | • | changes in the ability of issuers to make timely repayments, which can reduce the value of our investments. This risk is significantly greater with respect to below-investment grade securities, which comprised 9 percent of our available for sale fixed maturity investments as of December 31, 2010; and |
| | • | changes in the estimated timing of receipt of cash flows. For example, our structured security investments, which comprised 20 percent of our available for sale fixed maturity investments at December 31, 2010, are subject to risks relating to variable prepayment on the assets underlying such securities, such as mortgage loans. When structured securities prepay faster than expected, investment income may be adversely affected due to the acceleration of the amortization of purchase premiums or the inability to reinvest at comparable yields in lower interest rate environments. |
We have recorded writedowns of fixed maturity investments, equity securities and other invested assets as a result of conditions which caused us to conclude a decline in the fair value of the investment was other than temporary as follows (excluding any such amounts included in discontinued operations): $149.8 million in 2010 ($146.8 million, prior to the $(3.0) million of impairment losses recognized through accumulated other comprehensive income (loss)); $195.4 million in 2009 ($385.0 million, prior to the $189.6 million of impairment losses recognized through accumulated other comprehensive loss); and $162.3 million in 2008. Our investment portfolio is subject to the risks of further declines in realizable value. However, we attempt to mitigate this risk through the diversification and active management of our portfolio.
In the event of substantial product surrenders or policy claims, we may choose to maintain highly liquid, and potentially lower-yielding, assets or to sell assets at a loss, thereby eroding the performance of our portfolio.
Because a substantial portion of our operating results are derived from returns on our investment portfolio, significant losses in the portfolio may have a direct and materially adverse impact on our results of operations. In addition, losses on our investment portfolio could reduce the investment returns that we are able to credit to our customers of certain products, thereby impacting our sales and eroding our financial performance. Investment losses may also reduce the capital of our insurance subsidiaries, which may cause us to make additional capital contributions to those subsidiaries or may limit the ability of the insurance subsidiaries to make dividend payments to the holding company. In addition, future investment losses could cause us to be in violation of the financial covenants under the New Senior Secured Credit Agreement.
Deteriorating financial performance of securities collateralized by mortgage loans and commercial mortgage loans may lead to writedowns, which could have a material adverse effect on our results of operations and financial condition.
Changes in mortgage delinquency or recovery rates, declining real estate prices, changes in credit or bond insurer credit ratings, challenges to the validity of foreclosures and the quality of service provided by service providers on securities in our portfolios could lead us to determine that writedowns are appropriate in the future.
The determination of the amount of realized investment losses recorded as impairments of our investments is highly subjective and could have a material adverse effect on our operating results and financial condition.
The determination of realized investment losses recorded as impairments varies by investment type and is based upon our ongoing evaluation and assessment of known risks. We consider a wide range of factors about the issuer and use our best judgment in evaluating the cause of a decline in estimated fair value and in assessing prospects for recovery. Inherent in our evaluation are assumptions and estimates about the operations of the issuer and its future earnings potential. Such evaluations and assessments are revised as conditions change and new information becomes available. We update our evaluations regularly and reflect changes in realized investment gains and losses from impairments in operating results as such evaluations are revised. Our assessment of whether unrealized losses are other-than-temporary impairments requires significant judgment and future events may occur, or additional information may become available, which may necessitate future impairments of securities in our portfolio. Historical trends may not be indicative of future other-than- temporary impairments. For example, the cost of our fixed maturity and equity securities is adjusted for impairments in value deemed to be other than temporary in the period in which the determination is made. The assessment of whether impairments have occurred is based on our case-by-case evaluation of the underlying reasons for the decline in fair value.
The valuation determination of our fixed maturity securities results in unrealized net investment gains and losses and is highly subjective and could materially impact our operating results and financial condition.
In determining fair value, we generally utilize market transaction data for the same or similar instruments. The degree of management judgment involved in determining fair values is inversely related to the availability of market observable information. Since significant observable market inputs are not available for certain securities, it may be difficult to value them. The fair value of financial assets and financial liabilities may differ from the amount actually received to sell an asset or the amount paid to transfer a liability in an orderly transaction between market participants at the measurement date. Moreover, the use of different valuation assumptions may have a material effect on the fair values of the financial assets and financial liabilities. As of December 31, 2 010 and 2009, our total unrealized net investment gains (losses) before adjustments for insurance intangibles and deferred income taxes were $.5 billion and $(.5) billion, respectively.
Litigation and regulatory investigations are inherent in our business, may harm our financial strength and reputation and negatively impact our financial results.
Insurance companies historically have been subject to substantial litigation. In addition to the traditional policy claims associated with their businesses, insurance companies face class action suits and derivative suits from shareholders and/or policyholders. We also face significant risks related to regulatory investigations and proceedings. The litigation and regulatory matters we are, have been, or may become, subject to include matters related to sales, marketing and underwriting practices, payment of contingent or other sales commissions, claim payments and procedures, product design, product disclosure, administration, additional premium charges for premiums paid on a periodic basis, calculation of cost of insurance charges, changes to certain non-guaranteed policy features, denial or delay of ben efits, charging excessive or impermissible fees on products and recommending unsuitable products to customers. Certain of our insurance policies allow or require us to make changes based on experience to certain non-guaranteed elements such as cost of insurance charges, expense loads, credited interest rates and policyholder bonuses. We intend to make changes to certain non-guaranteed elements in the future. In some instances in the past, such action has resulted in litigation and similar litigation may arise in the future. Our exposure (including the potential adverse financial consequences of delays or decisions not to pursue changes to certain non-guaranteed elements), if any, arising from any such action cannot presently be determined. Our pending legal and regulatory proceedings include matters that are specific to us, as well as matters faced by other insurance companies. State insurance departments have focused and continue to focus on sales, marketing and claims payment practices and product issues in their market conduct examinations. Negotiated settlements of class action and other lawsuits have had a material adverse effect on the business, financial condition and results of operations of our insurance companies. We are, in the ordinary course of our business, a plaintiff or defendant in actions arising out of our insurance business, including class actions and reinsurance disputes, and, from time to time, we are also involved in various governmental and administrative proceedings and investigations and inquiries such as information requests, subpoenas and books and record examinations, from state, federal and other authorities. The ultimate outcome of these lawsuits and regulatory proceedings and investigations cannot be predicted with certainty. In the event of an unfavorable outcome in one or more of these matters, the ultimate liability may be in excess of liabilities we have established and could have a material adverse effect on our business, financial condition, results of operations or cash flows. We could also suffer significant reputational harm as a result of such litigation, regulatory proceedings or investigations, including harm flowing from regulator actions to assert supervision or control over our business, which could have a material adverse effect on our business, financial condition, results of operations or cash flows.
If our subsidiary, Conseco Life, is unable to implement anticipated changes to certain non-guaranteed elements, the reserves on our interest-sensitive life insurance blocks may prove to be inadequate, requiring us to increase liabilities which may have a material adverse effect on our results of operations and our financial condition and on the results of operations and financial condition of Conseco Life.
In establishing the net liabilities for our interest-sensitive life insurance products, we make estimates and assumptions using management’s best judgments. These estimates and assumptions include mortality, lapse rates, investment experience and expense levels including charges to policyholders which, under some of our policies, we are allowed or required to make based on experience to certain non-guaranteed elements (“NGEs”) such as cost of insurance charges, expense loads, credited interest rates and policyholder bonuses. If our estimates and assumptions are incorrect and our reserves prove to be insufficient to cover amounts payable under these policies, we would be required to increase our liabilities, and our financial results could be adversely affected.
A substantial block of our interest-sensitive life insurance policies was issued by Conseco Life and its predecessors. These policies are included in our Other CNO Business segment. After Conseco Life notified holders in late 2008 of changes to certain NGEs of their Lifetrend and CIUL3+ interest-sensitive life insurance policies, several state insurance departments began a market conduct examination. After working with state insurance regulators to review the terms of the Lifetrend and CIUL3+ policies, Conseco Life entered into a regulatory settlement agreement with the regulators regarding issues involving these policies, which was effective in June 2010. In addition to the market conduct examination which resulted in the regulatory settlement agreement, Conseco Life has been the defendant in litigation involving NGE changes. See the note to the consolidated financial statements entitled “Commitments and Contingencies – Litigation and Other Legal Proceedings – Other Litigation”). Conseco Life intends to make changes to certain NGEs in the future, and such changes may result in similar litigation. Adverse decisions in any such litigation, delays in the implementation of NGEs, or any other events which limit Conseco Life’s ability to implement changes to NGEs could have a material adverse effect on our results of operations and our financial condition and on the results of operations and financial condition of Conseco Life.
The limited historical claims experience on our long-term care products could negatively impact our operations if our estimates prove wrong and we have not adequately set premium rates.
In setting premium rates, we consider historical claims information and other factors, but we cannot predict future claims with certainty. This is particularly applicable to our long-term care insurance products, for which we (as well as other companies selling these products) have relatively limited historical claims experience. Long-term care products tend to have fewer claims than other health products such as Medicare supplement, but when claims are incurred, they tend to be much higher in dollar amount and longer in duration. Also, long-term care claims are incurred much later in the life of the policy than most other supplemental health products. As a result of these traits, it is difficult to appropriately price this product. For our long-term care insurance, actual persistenc y in later policy durations that is higher than our persistency assumptions could have a negative impact on profitability. If these policies remain inforce longer than we assumed, then we could be required to make greater benefit payments than anticipated when the products were priced. ��Mortality is a critical factor influencing the length of time a claimant receives long-term care benefits. Mortality continues to improve for the general population, and life expectancy has increased. Improvements in actual mortality trends relative to assumptions may adversely affect our profitability.
Our Bankers Life segment has offered long-term care insurance since 1985. In recent years, the claims experience on some of Bankers Life long-term care blocks has generally been higher than our pricing expectations and the persistency of these policies has been higher than our pricing expectations, which may result in higher benefit ratios in the future.
On November 12, 2008, CNO and CDOC completed the Transfer of the stock of Senior Health to the Independent Trust. After the Transfer, we continue to hold long-term care business acquired through previous acquisitions in our Other CNO Business segment. The premiums collected from this block totaled $29.2 million in 2010. The experience on this acquired block has generally been worse than the acquired companies’ original pricing expectations. We have received regulatory approvals for numerous premium rate increases in recent years pertaining to these blocks. Even with these rate increases, this block experienced benefit ratios of 210.8 percent in 2010, 186.7 percent in 2009 and 169.6 percent in 2008. If future claims experience continues to be worse than anti cipated as our long-term care blocks continue to age, our financial results will be adversely affected. In addition, rate increases may cause existing policyholders to allow their policies to lapse.
The occurrence of natural or man-made disasters or a pandemic could adversely affect our financial condition and results of operations.
We are exposed to various risks arising out of natural disasters, including earthquakes, hurricanes, floods and tornadoes, and man-made disasters, including acts of terrorism and military actions and pandemics. For example, a natural or man-made disaster or a pandemic could lead to unexpected changes in persistency rates as policyholders and contractholders who are affected by the disaster may be unable to meet their contractual obligations, such as payment of premiums on our insurance policies, deposits into our investment products, and mortgage payments on loans insured by our mortgage insurance policies. They could also significantly increase our mortality and morbidity experience above the assumptions we used in pricing our insurance and investment products. The continued threat of terrorism and ongoi ng military actions may cause significant volatility in global financial markets, and a natural or man-made disaster or a pandemic could trigger an economic downturn in the areas directly or indirectly affected by the disaster or pandemic. These consequences could, among other things, result in a decline in business and increased claims from those areas, as well as an adverse effect on home prices in those areas, which could result in increased loss experience in our mortgage insurance businesses. Disasters or a pandemic also could disrupt public and private infrastructure, including communications and financial services, which could disrupt our normal business operations.
A natural or man-made disaster or a pandemic could also disrupt the operations of our counterparties or result in increased prices for the products and services they provide to us. For example, a natural or man-made disaster or a pandemic could lead to increased reinsurance prices and potentially cause us to retain more risk than we otherwise would retain if we were able to obtain reinsurance at lower prices. In addition, a disaster or a pandemic could adversely affect the value of the assets in our investment portfolio if it affects companies’ ability to pay principal or interest on their securities.
The results of operations of our insurance business will decline if our premium rates are not adequate or if we are unable to increase rates.
We set the premium rates on our health insurance policies, including long-term care policies and certain life insurance policies, based on facts and circumstances known at the time we issue the policies and on assumptions about numerous variables, including the actuarial probability of a policyholder incurring a claim, the probable size of the claim, maintenance costs to administer the policies and the interest rate earned on our investment of premiums. In setting premium rates, we consider historical claims information, industry statistics, the rates of our competitors and other factors, but we cannot predict with certainty the future actual claims on our products. If our actual claims experience proves to be less favorable than we assumed and we are unable to raise our premium rates to the extent necessary to offs et the unfavorable claims experience, our financial results will be adversely affected.
We review the adequacy of our premium rates regularly and file proposed rate increases on our health insurance products when we believe existing premium rates are too low. It is possible that we will not be able to obtain approval for premium rate increases from currently pending requests or from future requests. If we are unable to raise our premium rates because we fail to obtain approval in one or more states, our financial results will be adversely affected. Moreover, in some instances, our ability to exit unprofitable lines of business is limited by the guaranteed renewal feature of the policy. Due to this feature, we cannot exit such business without regulatory approval, and accordingly, we may be required to continue to service those products at a loss for an extended period of time.� 0; Most of our long-term care business is guaranteed renewable, and, if necessary rate increases are not approved, we would be required to recognize a loss and establish a premium deficiency reserve. During 2010, the financial statements of one of our subsidiaries prepared in accordance with statutory accounting practices prescribed or permitted by regulatory authorities reflected asset adequacy or premium deficiency reserves. Total asset adequacy or premium deficiency reserves for Washington National were $75.3 million at December 31, 2010. Due to differences between statutory and GAAP insurance liabilities, we were not required to recognize a similar premium deficiency reserve in our consolidated financial statements prepared in accordance with GAAP. The determination of the need for and amount of asset adequacy reserves is subject to numerous actuarial assumptions, including our ability to change non-guaranteed elements related to certain products consistent with contract provisions.
If, however, we are successful in obtaining regulatory approval to raise premium rates, the increased premium rates may reduce the volume of our new sales and cause existing policyholders to allow their policies to lapse. This could result in a significantly higher ratio of claim costs to premiums if healthier policyholders who get coverage elsewhere allow their policies to lapse, while policies of less healthy policyholders continue inforce. This would reduce our premium income and profitability in future periods.
Most of our supplemental health policies allow us to increase premium rates when warranted by our actual claims experience. These rate increases must be approved by the applicable state insurance departments, and we are required to submit actuarial claims data to support the need for such rate increases. The re-rate application and approval process on supplemental health products is a normal recurring part of our business operations and reasonable rate increases are typically approved by the state departments as long as they are supported by actual claims experience and are not unusually large in either dollar amount or percentage increase. For policy types on which rate increases are a normal recurring event, our estimates of insurance liabilities assume we will be able to raise rates if experience on th e blocks warrants such increases in the future.
The benefit ratio for our long-term care products included in the Other CNO Business segment has increased in recent periods and was 210.8 percent in 2010, 186.7 percent in 2009 and 169.6 percent in 2008. We will have to continue to raise rates or take other actions with respect to some of these policies or our financial results will be adversely affected.
As a result of higher persistency and resultant higher claims in our long-term care block in the Bankers Life segment than assumed in the original pricing, our premium rates were too low. Accordingly, we have been seeking approval from regulatory authorities for rate increases on portions of this business. Many of the rate increases have been approved by regulators and implemented. However, it is possible that we will not be able to obtain approval for all or a portion of the premium rate increases from currently pending requests or future requests. If we are unable to obtain these rate increases, the profitability of these policies and the performance of this block of business will be adversely affected. In addition, such rate increases may reduce the volume of our new sales and cau se existing policyholders to allow their policies to lapse, resulting in reduced profitability.
We have implemented and will continue to implement from time to time and when actuarially justified, premium rate increases in our long-term care business. In some cases, we offer policyholders the opportunity to reduce their coverage amounts or accept non-forfeiture benefits as alternatives to increasing their premium rates. The financial impact of our rate increase actions could be adversely affected by policyholder anti-selection, meaning that policyholders who are less likely to incur claims may lapse their policies or reduce their benefits, while policyholders who are more likely to incur claims may maintain full coverage and accept their rate increase.
We previously identified a material weakness in our internal control over financial reporting which has been remediated, and our business may be adversely affected if we fail to maintain effective controls over financial reporting.
We previously identified a material weakness in internal controls over the actuarial reporting processes related to the design of controls to ensure the completeness and accuracy of certain inforce policies. Remediation efforts to enhance controls over the actuarial reporting process have been completed and the controls we implemented to address the weakness were determined to be effective as of December 31, 2010.
We face the risk that, notwithstanding our efforts to date to identify and remedy the material weakness in our internal control over financial reporting, we may discover other material weaknesses in the future and the cost of remediating the material weakness could be high and could have a material adverse effect on our financial condition and results of operations.
Our ability to use our existing Net Operating Losses may be limited by certain transactions, and an impairment of existing Net Operating Losses could cause us to breach the debt to total capitalization covenant of the New Senior Secured Credit Agreement.
As of December 31, 2010, we had approximately $4.4 billion of federal tax NOLs and $1.0 billion of capital loss carry-forwards, resulting in a deferred tax asset of approximately $1.9 billion, expiring in years 2011 through 2029. Section 382 of the Code imposes limitations on a corporation’s ability to use its NOLs when it undergoes a 50 percent “ownership change” over a three year period. Although we underwent an ownership change in 2003 as the result of our reorganization, the timing and manner in which we will be able to utilize our NOLs is not currently limited by Section 382.
We regularly monitor ownership changes (as calculated for purposes of Section 382) based on available information and, as of December 31, 2010, our analysis indicated that we were below the 50 percent ownership change threshold that would limit our ability to utilize our NOLs. However, after the common stock issuance to Paulson & Co. Inc. (“Paulson”) and CNO’s public offering of common stock in 2009, we were close to the 50 percent ownership change level. As a result, any future transaction or transactions and the timing of such transaction or transactions could trigger an additional ownership
change under Section 382. Such transactions may include, but are not limited to, additional repurchases or issuances of common stock, including upon conversion of CNO’s outstanding 7.0% Debentures (including conversion pursuant to a make whole adjustment event) or exercise of the warrants sold to Paulson, or acquisitions or sales of shares of CNO’s stock by certain holders of its shares, including persons who have held, currently hold or may accumulate in the future 5 percent or more of CNO’s outstanding common stock (“5 Percent Shareholders”) for their own account. In January 2009, CNO’s board of directors adopted a Section 382 Rights Agreement that is designed to protect shareholder value by preserving the value of our NOLs. The Section 382 Rights Agreement p rovides a strong economic disincentive for any one shareholder knowingly, and without the approval of the board, to become a 5 Percent Shareholder and for any of the 5 Percent Shareholders as of the date of the Section 382 Rights Agreement to increase their ownership stake by more than 1 percent of the shares of CNO’s common stock then outstanding, and thus limits the uncertainty with regard to the potential for future ownership changes. However, despite the strong economic disincentives of the Section 382 Rights Agreement, shareholders may elect to increase their ownership, including beyond the limits set by the Section 382 Rights Agreement, and thus adversely affect CNO’s ownership shift calculations. To further protect against the possibility of triggering an ownership change under Section 382, the Company’s shareholders approved an amendment to CNO’s certificate of incorporation designed to prevent certain transfers of common stock which could otherwise adver sely affect our ability to use our NOLs. See the note to the consolidated financial statements entitled “Income Taxes” for further information regarding the Section 382 Rights Agreement, the Section 382 Charter Amendment and the Company’s NOLs.
Additionally, based on the advice of our tax advisor, we have taken the position that the 7.0% Debentures are not treated as stock for purposes of Section 382 and do not trigger an ownership change. However, the IRS may not agree with our position. If the IRS were to succeed in challenging this position, the issuance of the 7.0% Debentures would push us above the 50 percent ownership change level described above and trigger an ownership change under Section 382.
If an ownership change were to occur for purposes of Section 382, we would be required to calculate an annual limitation on the amount of our taxable income that may be offset by NOLs arising prior to such ownership change. That limitation would apply to all of our current NOLs. The annual limitation would be calculated based upon the fair market value of our equity at the time of such ownership change, multiplied by a federal long-term tax exempt rate (3.67 percent at December 31, 2010), and would eliminate our ability to use a substantial portion of our NOLs to offset future taxable income. Additionally, the writedown of our deferred tax assets that would occur in the event of an ownership change for purposes of Section 382 could cause us to breach the debt to total capitalization covenant, which will be included in the New Senior Secured Credit Agreement.
The value of our deferred tax assets may be impaired to the extent our future profits are less than we have projected and such impairment may have a material adverse effect on our results of operations and our financial condition.
As of December 31, 2010, we had net deferred tax assets of $.8 billion. Our income tax expense includes deferred income taxes arising from temporary differences between the financial reporting and tax bases of assets and liabilities, capital loss carry-forwards and NOLs. We evaluate the realizability of our deferred income tax assets and assess the need for a valuation allowance on an ongoing basis. In evaluating our deferred income tax assets, we consider whether it is more likely than not that the deferred income tax assets will be realized. The ultimate realization of our deferred income tax assets depends upon generating sufficient future taxable income during the periods in which our temporary differences become deductible and before our capital loss carry-forwards and NOLs expire.� 60; Additionally, the value of our deferred tax assets would be significantly impaired if we were to undergo a 50 percent “ownership change” for purposes of Section 382 of the Code, as discussed in the risk factor immediately above. Our assessment of the realizability of our deferred income tax assets requires significant judgment. Failure to achieve our projections may result in an increase in the valuation allowance in a future period. Any future increase in the valuation allowance would result in additional income tax expense which could have a material adverse effect upon our earnings in the future, and reduce shareholders’ equity.
Concentration of our investment portfolios in any particular sector of the economy or type of asset may have an adverse effect on our financial position or results of operations.
The concentration of our investment portfolios in any particular industry, group of related industries, asset classes (such as residential mortgage-backed securities and other asset-backed securities), or geographic area could have an adverse effect on its value and performance and, consequently, on our results of operations and financial position. While we seek to mitigate this risk by having a broadly diversified portfolio, events or developments that have a negative impact on any particular industry, group of related industries or geographic area may have an adverse effect on the investment portfolios to the extent that the portfolios are concentrated.
Our business is subject to extensive regulation, which limits our operating flexibility and could result in our insurance subsidiaries being placed under regulatory control or otherwise negatively impact our financial results.
Our insurance business is subject to extensive regulation and supervision in the jurisdictions in which we operate. Our insurance subsidiaries are subject to state insurance laws that establish supervisory agencies. Such agencies have broad administrative powers including the power to:
• grant and revoke business licenses;
• regulate and supervise sales practices and market conduct;
• establish guaranty associations;
• license agents;
• approve policy forms;
• approve premium rates for some lines of business such as long-term care and Medicare supplement;
• establish reserve requirements;
• credit for reinsurance;
• prescribe the form and content of required financial statements and reports;
• determine the reasonableness and adequacy of statutory capital and surplus;
• perform financial, market conduct and other examinations;
• define acceptable accounting principles; and
• regulate the types and amounts of permitted investments.
The regulations issued by state insurance agencies can be complex and subject to differing interpretations. If a state insurance regulatory agency determines that one of our insurance company subsidiaries is not in compliance with applicable regulations, the subsidiary is subject to various potential administrative remedies including, without limitation, monetary penalties, restrictions on the subsidiary’s ability to do business in that state and a return of a portion of policyholder premiums. In addition, regulatory action or investigations could cause us to suffer significant reputational harm, which could have an adverse effect on our business, financial condition and results of operations.
Our insurance subsidiaries are also subject to RBC requirements. These requirements were designed to evaluate the adequacy of statutory capital and surplus in relation to investment and insurance risks associated with asset quality, mortality and morbidity, asset and liability matching and other business factors. The requirements are used by states as an early warning tool to discover companies that may be weakly-capitalized for the purpose of initiating regulatory action. Generally, if an insurer’s RBC falls below specified levels, the insurer is subject to different degrees of regulatory action depending upon the magnitude of the deficiency. The 2010 statutory annual statements to be filed with the state insurance regulators of each of our insurance subsidiaries are expected to reflect TAC in excess of the levels subjecting the subsidiaries to any regulatory action.
Our reserves for future insurance policy benefits and claims may prove to be inadequate, requiring us to increase liabilities which results in reduced net income and shareholders’ equity.
Liabilities for insurance products are calculated using management’s best judgments, based on our past experience and standard actuarial tables of mortality, morbidity, lapse rates, investment experience and expense levels. For our health insurance business, we establish an active life reserve, a liability for due and unpaid claims, claims in the course of settlement, incurred but not reported claims, and a reserve for the present value of amounts on incurred claims not yet due. We establish reserves based on assumptions and estimates of factors either established at the fresh-start date for business inforce or considered when we set premium rates for business written after that date.
Many factors can affect these reserves and liabilities, such as economic and social conditions, inflation, hospital and pharmaceutical costs, changes in life expectancy, regulatory actions, changes in doctrines of legal liability and extra-contractual damage awards. Therefore, the reserves and liabilities we establish are necessarily based on estimates, assumptions, industry data and prior years’ statistics. It is possible that actual claims will materially exceed our reserves and have a material adverse effect on our results of operations and financial condition. We have incurred significant losses beyond our estimates as a result of actual claim costs and persistency of our long-term care business included in our Bankers Life and Other CNO Business segments. The insurance policy benefit s incurred for our long-term care products in our Bankers Life segment were $666.3 million, $635.8 million and $672.0 million in 2010, 2009 and 2008, respectively. The benefit ratios for our long-term care products in our Bankers Life segment were 113.7 percent, 105.2 percent and 107.6 percent in 2010, 2009 and 2008, respectively. The benefit ratios for our long-term care products in our Other CNO Business segment were 210.8 percent, 186.7 percent and 169.6 percent in 2010, 2009 and 2008, respectively. The insurance policy benefits incurred for our long-term care products in our Other CNO Business segment were $63.0 million, $59.9 million and $58.7 million in 2010, 2009 and 2008, respectively. Our financial performance depends significantly upon the extent to which our actual claims experience and future expenses are consistent with the assumptions we used in setting our reserves. If our assumptions with respect to future claims are incorrect, and our re serves prove to be insufficient to cover our actual losses and expenses, we would be required to increase our liabilities, and our financial results could be adversely affected.
We may be required to accelerate the amortization of deferred acquisition costs or the present value of future profits.
Deferred acquisition costs represent the costs that vary with, and are primarily related to, producing new insurance business. The present value of future profits represents the value assigned to the right to receive future cash flows from contracts existing at the Effective Date. The balances of these accounts are amortized over the expected lives of the underlying insurance contracts. On an ongoing basis, we test these accounts recorded on our balance sheet to determine if these amounts are recoverable under current assumptions. In addition, we regularly review the estimates and assumptions underlying these accounts for those products for which we amortize deferred acquisition costs or the present value of future profits in proportion to gross profits or gross margins. If facts and circumstances change, these tests and reviews could lead to reduction in the balance of those accounts that could have an adverse effect on the results of our operations and our financial condition.
Our operating results will suffer if policyholder surrender levels differ significantly from our assumptions.
Surrenders of our annuities and life insurance products can result in losses and decreased revenues if surrender levels differ significantly from assumed levels. At December 31, 2010, approximately 23 percent of our total insurance liabilities, or approximately $5.6 billion, could be surrendered by the policyholder without penalty. The surrender charges that are imposed on our fixed rate annuities typically decline during a penalty period, which ranges from five to twelve years after the date the policy is issued. Surrender charges are eliminated after the penalty period. Surrenders and redemptions could require us to dispose of assets earlier than we had planned, possibly at a loss. Moreover, surrenders and redemptions require faster amortization of either the acquisition costs or t he commissions associated with the original sale of a product, thus reducing our net income. We believe policyholders are generally more likely to surrender their policies if they believe the issuer is having financial difficulties, or if they are able to reinvest the policy’s value at a higher rate of return in an alternative insurance or investment product.
Changing interest rates may adversely affect our results of operations.
Our profitability is affected by fluctuating interest rates. While we monitor the interest rate environment and employ asset/liability and hedging strategies to mitigate such impact, our financial results could be adversely affected by changes in interest rates. Our spread-based insurance and annuity business is subject to several inherent risks arising from movements in interest rates. First, interest rate changes can cause compression of our net spread between interest earned on investments and interest credited to customer deposits. Our ability to adjust for such a compression is limited by the guaranteed minimum rates that we must credit to policyholders on certain products, as well as the terms on most of our other products that limit reductions in the crediting rates to pre-established in tervals. As of December 31, 2010, approximately 40 percent of our insurance liabilities were subject to interest rates that may be reset annually; 41 percent had a fixed explicit interest rate for the duration of the contract; 14 percent had credited rates that approximate the income we earn; and the remainder had no explicit interest rates. Second, if interest rate changes produce an unanticipated increase in surrenders of our spread-based products, we may be forced to sell invested assets at a loss in order to fund such surrenders. Third, the profits from many non-spread-based insurance products, such as long-term care policies, can be adversely affected when interest rates decline
because we may be unable to reinvest the cash from premiums received at the interest rates anticipated when we sold the policies. Finally, changes in interest rates can have significant effects on the fair value and performance of our investments in general and specifically on the performance of our structured securities portfolio, including collateralized mortgage obligations, which can affect the timing of cash flows due to changes in the prepayment rate of the loans underlying such securities.
We employ asset/liability strategies that are designed to mitigate the effects of interest rate changes on our profitability but do not currently extensively employ derivative instruments for this purpose. We may not be successful in implementing these strategies and achieving adequate investment spreads.
We use computer models to simulate our cash flows expected from existing business under various interest rate scenarios. With such estimates, we seek to manage the relationship between the duration of our assets and the expected duration of our liabilities. When the estimated durations of assets and liabilities are similar, exposure to interest rate risk is minimized because a change in the value of assets should be largely offset by a change in the value of liabilities. At December 31, 2010, the duration of our fixed income securities (as modified to reflect prepayments and potential calls) was approximately 8.8 years, and the duration of our insurance liabilities was approximately 8.7 years. We estimate that our fixed maturity securities and short-term investments, net of corre sponding changes in insurance acquisition costs, would decline in fair value by approximately $405 million if interest rates were to increase by 10 percent from rates as of December 31, 2010. This compares to a decline in fair value of $455 million based on amounts and rates at December 31, 2009. The calculations involved in our computer simulations incorporate numerous assumptions, require significant estimates and assume an immediate change in interest rates without any management reaction to such change. Consequently, potential changes in the values of our financial instruments indicated by the simulations will likely be different from the actual changes experienced under given interest rate scenarios, and the differences may be material. Because we actively manage our investments and liabilities, our net exposure to interest rates can vary over time.
General market conditions affect investments and investment income.
The performance of our investment portfolio depends in part upon the level of and changes in interest rates, risk spreads, real estate values, market volatility, the performance of the economy in general, the performance of the specific obligors included in our portfolio and other factors that are beyond our control. Changes in these factors can affect our net investment income in any period, and such changes can be substantial.
Financial market conditions can also affect our realized and unrealized investment gains (losses). During periods of rising interest rates, the fair values of our investments will typically decline. Conversely, during periods of falling interest rates, the fair values of our investments will typically rise.
Our results of operations may be negatively impacted if our initiatives to restructure our insurance operations are unsuccessful or if our planned conversions result in valuation differences.
We have implemented several initiatives to improve operating results, including: (i) focusing sales efforts on higher margin products; (ii) reducing operating expenses by eliminating or reducing marketing costs of certain products; (iii) streamlining administrative procedures and reducing personnel; and (iv) increasing retention rates on our more profitable blocks of inforce business. Many of our initiatives address issues resulting from the substantial number of acquisitions of our Predecessor. Between 1982 and 1997, our Predecessor completed 19 transactions involving the acquisitions of 44 separate insurance companies. Our efforts involve improvements to our policy administration procedures and significant systems conversions, such as the elimination of duplicate processing systems f or similar business. These initiatives may result in unforeseen expenses, complications or delays, and may be inadequate to address all issues. Some of these initiatives have only recently begun to be executed, and may not ultimately be successfully completed. While our future operating performance depends greatly on the success of these efforts, even if we successfully implement these measures, they alone may not sufficiently improve our results of operations.
Conversions to new systems can result in valuation differences between the prior system and the new system. We have recognized such differences in the past. Our planned conversions could result in future valuation adjustments, and these adjustments may have a material adverse effect on future earnings.
Our financial position may be negatively impacted if we are unable to achieve our goals.
We have identified a number of goals, including growth at Bankers Life, Washington National and Colonial Penn, improving earnings stability and reducing volatility. The continued growth and profitability of those businesses is critical to our overall results. We are also seeking to improve earnings and reduce volatility in our Other CNO Business segment. The failure to achieve these and our other goals could have a material adverse effect on our results of operations, financial condition and the price of our common stock.
A decline in the current financial strength rating of our insurance subsidiaries could cause us to experience decreased sales, increased agent attrition and increased policyholder lapses and redemptions.
An important competitive factor for our insurance subsidiaries is the ratings they receive from nationally recognized rating organizations. Agents, insurance brokers and marketing companies who market our products, and prospective policyholders view ratings as an important factor in evaluating an insurer’s products. This is especially true for annuity, interest-sensitive life insurance and long-term care products. The current financial strength ratings of our primary insurance subsidiaries from A.M. Best, S&P and Moody’s are “B+ (Good)” (except Conseco Life), “BB” and “Ba1,” respectively. A.M. Best has 16 possible ratings. There are five ratings above our “B+” rating and ten ratings that are below our rating.&# 160; S&P has 21 possible ratings. There are eleven ratings above our “BB” rating and nine ratings that are below our rating. Moody’s has 21 possible ratings. There are ten ratings above our “Ba1” rating and ten ratings that are below our rating.
If our ratings are downgraded, we may experience declining sales of certain of our insurance products, defections of our independent and career sales force, and increased policies being redeemed or allowed to lapse. These events would adversely affect our financial results, which could then lead to ratings downgrades.
Competition from companies that have greater market share, higher ratings, greater financial resources and stronger brand recognition, may impair our ability to retain existing customers and sales representatives, attract new customers and sales representatives and maintain or improve our financial results.
The supplemental health insurance, annuity and individual life insurance markets are highly competitive. Competitors include other life and accident and health insurers, commercial banks, thrifts, mutual funds and broker-dealers.
Our principal competitors vary by product line. Our main competitors for agent-sold long-term care insurance products include Genworth Financial, Inc., John Hancock Financial Services, Northwestern Mutual and Mutual of Omaha. Our main competitors for agent-sold Medicare supplement insurance products include United HealthCare, Blue Cross and Blue Shield Plans, Mutual of Omaha and United American.
In some of our product lines, such as life insurance and fixed annuities, we have a relatively small market share. Even in some of the lines in which we are one of the top five writers, our market share is relatively small. For example, while, based on an Individual Long-Term Care Insurance Survey, our Bankers Life segment ranked fifth in annualized premiums of individual long-term care insurance in 2009 with a market share of approximately 5.8 percent, the top four writers of individual long-term care insurance had annualized premiums with a combined market share of approximately 64 percent during the period. In addition, while, based on the NAIC’s 2009 Medicare Supplement Loss Ratios report, our Bankers Life segment was ranked third in direct premiums earned for individual Medicare supplement insu rance in 2009 with a market share of 3.8 percent, the top writer of individual Medicare supplement insurance had direct premiums with a market share of 17.0 percent during the period.
Many of our major competitors have higher financial strength ratings than we do. Many of our competitors are larger companies that have greater capital, technological and marketing resources and have access to capital at a lower cost. Recent industry consolidation, including business combinations among insurance and other financial services companies, has resulted in larger competitors with even greater financial resources. Furthermore, changes in federal law have narrowed the historical separation between banks and insurance companies, enabling traditional banking institutions to enter the insurance and annuity markets and further increase competition. This increased competition may harm our ability to maintain or improve our profitability.
In addition, because the actual cost of products is unknown when they are sold, we are subject to competitors who may sell a product at a price that does not cover its actual cost. Accordingly, if we do not also lower our prices for similar products, we may lose market share to these competitors. If we lower our prices to maintain market share, our profitability will decline.
We must attract and retain sales representatives to sell our insurance and annuity products. Strong competition exists among insurance and financial services companies for sales representatives. We compete for sales representatives primarily on the basis of our financial position, financial strength ratings, support services, compensation, products and product features. Our competitiveness for such agents also depends upon the relationships we develop with these agents. Our Predecessor’s bankruptcy continues to be an adverse factor in developing relationships with certain agents. If we are unable to attract and retain sufficient numbers of sales representatives to sell our products, our ability to compete and our revenues and profitability would suffer.
Volatility in the securities markets, and other economic factors, may adversely affect our business, particularly our sales of certain life insurance products and annuities.
Fluctuations in the securities markets and other economic factors may adversely affect sales and/or policy surrenders of our annuities and life insurance policies. For example, volatility in the equity markets may deter potential purchasers from investing in fixed index annuities and may cause current policyholders to surrender their policies for the cash value or to reduce their investments. In addition, significant or unusual volatility in the general level of interest rates could negatively impact sales and/or lapse rates on certain types of insurance products.
Federal and state legislation could adversely affect the financial performance of our insurance operations.
During recent years, the health insurance industry has experienced substantial changes, including those caused by healthcare legislation. Recent federal and state legislation and pending legislative proposals concerning healthcare reform contain features that could severely limit, or eliminate, our ability to vary pricing terms or apply medical underwriting standards to individuals, thereby potentially increasing our benefit ratios and adversely impacting our financial results. In particular, Medicare reform could affect our ability to price or sell our products or profitably maintain our blocks inforce. For example, the Medicare Advantage program provides incentives for health plans to offer managed care plans to seniors. The growth of managed care plans under this program could decrease sales of the traditional Medicare supplement products we sell. Some current proposals contain government provided long-term care insurance which could affect the sales of our long-term care products.
Proposals currently pending in Congress and some state legislatures may also affect our financial results. These proposals include the implementation of minimum consumer protection standards in all long-term care policies, including: guaranteed premium rates; protection against inflation; limitations on waiting periods for pre-existing conditions; setting standards for sales practices for long-term care insurance; and guaranteed consumer access to information about insurers, including information regarding lapse and replacement rates for policies and the percentage of claims denied. Enactment of any proposal that would limit the amount we can charge for our products, such as guaranteed premium rates, or that would increase the benefits we must pay, such as limitations on waiting periods, or that would otherwise incr ease the costs of our business, could adversely affect our financial results.
On July 21, 2010, the Dodd-Frank Act was enacted and signed into law. The Dodd-Frank Act made extensive changes to the laws regulating financial services firms and requires various federal agencies to adopt a broad range of new rules and regulations. Among other provisions, the Dodd-Frank Act provides for a new framework of regulation of over-the-counter (“OTC”) derivatives markets. This will require us to clear certain types of transactions currently traded in the OTC derivative markets and may limit our ability to customize derivative transactions for our needs. In addition, we will likely experience additional collateral requirements and costs associated with derivative transactions.
The Dodd-Frank Act also establishes a Financial Stability Oversight Council, which is authorized to subject nonbank financial companies deemed systemically significant to stricter prudential standards and other requirements and to subject such a company to a special orderly liquidation process outside the federal bankruptcy code, administered by the Federal Deposit Insurance Corporation (although insurance company subsidiaries would remain subject to liquidation and rehabilitation proceedings under state law). In addition, the Dodd-Frank Act establishes a Federal Insurance Office within the Department of the Treasury. While not having a general supervisory or regulatory authority over the business of insurance, the director of this office will perform various functions with respect to insurance, including serving as a non-voting member of the Financial Stability Oversight Council and making recommendations to the Council regarding insurers to be designated for more stringent regulation. The director is also required to conduct a study on how to modernize and improve the system of insurance regulation in the United States, including by increased national uniformity through either a federal charter or effective action by the states.
Federal agencies have been given significant discretion in drafting the rules and regulations that will implement the Dodd-Frank Act. Consequently, many of the details and much of the impact of the Dodd-Frank Act may not be known for some time. In addition, this legislation mandated multiple studies and reports for Congress, which could result in additional legislative or regulatory action.
We cannot predict the requirements of the regulations ultimately adopted under the Dodd-Frank Act, the effect such regulations will have on financial markets generally, or on our businesses specifically, the additional costs associated with compliance with such regulations, or any changes to our operations that may be necessary to comply with the Dodd-Frank Act, any of which could have a material adverse affect on our business, results of operations, cash flows or financial condition.
Reinsurance may not be available, affordable or adequate to protect us against losses.
As part of our overall risk and capital management strategy, we have historically purchased reinsurance from external reinsurers as well as provided internal reinsurance support for certain risks underwritten by our business segments. The availability and cost of reinsurance protection are impacted by our operating and financial performance as well as conditions beyond our control. For example, volatility in the equity markets and the related impacts on asset values required to fund liabilities may reduce the availability of certain types of reinsurance and make it more costly when it is available, as reinsurers are less willing to take on credit risk in a volatile market. Accordingly, we may be forced to incur additional expenses for reinsurance or may not be able to obtain sufficient new reinsurance on acceptable terms, which could adversely affect our ability to write future business or obtain statutory capital credit for new reinsurance.
We face risk with respect to our reinsurance agreements.
We transfer exposure to certain risks to others through reinsurance arrangements. Under these arrangements, other insurers assume a portion of our losses and expenses associated with reported and unreported claims in exchange for a portion of policy premiums. The availability, amount and cost of reinsurance depend on general market conditions and may vary significantly. As of December 31, 2010, our reinsurance receivables totaled $3.3 billion. Our ceded life insurance in-force totaled $14.8 billion. Our ten largest reinsurers accounted for 92 percent of our ceded life insurance in-force. We face credit risk with respect to reinsurance. When we obtain reinsurance, we are still liable for those transferred risks if the reinsurer cannot meet its obli gations. Therefore, the inability of our reinsurers to meet their financial obligations may require us to increase liabilities, thereby reducing our net income and shareholders’ equity.
Our insurance subsidiaries may be required to pay assessments to fund other companies’ policyholder losses or liabilities and this may negatively impact our financial results.
The solvency or guaranty laws of most states in which an insurance company does business may require that company to pay assessments up to certain prescribed limits to fund policyholder losses or liabilities of other insurance companies that become insolvent. Insolvencies of insurance companies increase the possibility that these assessments may be required. These assessments may be deferred or forgiven under most guaranty laws if they would threaten an insurer’s financial strength and, in certain instances, may be offset against future premium taxes. We cannot estimate the likelihood and amount of future assessments. Although past assessments have not been material, if there were a number of large insolvencies, future assessments could be material and could have a material adverse effect on our operating results and financial position.
ITEM 1B. UNRESOLVED STAFF COMMENTS.
None.
ITEM 2. PROPERTIES.
Our headquarters and the administrative operations of our Washington National and Other CNO Business segments and certain administrative operations of our subsidiaries are located on a Company-owned corporate campus in Carmel, Indiana, immediately north ofIndianapolis. We currently occupy four buildings on the campus with approximately 422,000 square feet of space.
Our Bankers Life segment is primarily administered from a facility in downtown Chicago, Illinois. Bankers Life has approximately 222,000 square feet leased under an agreement which expires in 2018. In addition, Bankers Life leases approximately 114,000 square feet of space in its former location, the Merchandise Mart. Approximately 98 percent of that space is subleased through November 2013, the early termination date of the lease. We also lease 247 sales offices in various states totaling approximately 736,000 square feet. These leases generally are short-term in length, with remaining lease terms expiring between 2011 and 2017.
Our Colonial Penn segment is administered from a Company-owned office building in Philadelphia, Pennsylvania, with approximately 127,000 square feet. We occupy approximately 60 percent of this space, with unused space leased to tenants.
Management believes that this office space is adequate for our needs.
ITEM 3. LEGAL PROCEEDINGS.
Information required for Item 3 is incorporated by reference to the discussion under the heading “Legal Proceedings” in note 8 “Commitments and Contingencies” to our consolidated financial statements included in Item 8 of this Form 10-K.
Executive Officers of the Registrant
| Officer | | | | Positions with CNO, Principal |
| Name and Age (a) | | Since | | Occupation and Business Experience (b) |
| | | | | |
| C. James Prieur, 59 | | 2006 | | Since September 2006, chief executive officer. From April 1999 until September 2006, president and chief operating officer of Sun Life Financial, Inc. and chief operating officer of its principal subsidiary, Sun Life Assurance Company. |
| | | | | |
| Edward J. Bonach, 57 | | 2007 | | Since May 2007, executive vice president and chief financial officer. From 2002 until 2007, Mr. Bonach served as chief financial officer of National Life Group. |
| | | | | |
| Eric R. Johnson, 50 | | 1997 | | Since September 2003, chief investment officer of CNO and president and chief executive officer of 40|86 Advisors, CNO’s wholly-owned registered investment advisor. Mr. Johnson has held various investment management positions since joining CNO in 1997. |
| | | | | |
| John R. Kline, 53 | | 1990 | | Since July 2002, senior vice president and chief accounting officer. Mr. Kline has served in various accounting and finance capacities with CNO since 1990. |
| | | | | |
| Susan L. Menzel, 45 | | 2005 | | Since May 2005, executive vice president, human resources. |
| | | | | |
| Christopher J. Nickele, 54 | | 2005 | | Since October 2005, executive vice president, product management and since May 2010, president, Other CNO Business. |
| | | | | |
| Scott R. Perry, 48 | | 2001 | | Since 2006, president of Bankers Life. Employed in various capacities for Bankers Life since 2001. |
| | | | | |
| Steven M. Stecher, 50 | | 2004 | | Since August 2008, president of Washington National. From January 2007 until August 2008, executive vice president, operations. From August 2004 until January 2007, executive vice president of Washington National. |
| | | | | |
| Matthew J. Zimpfer, 43 | | 1998 | | Since June 2008, executive vice president and general counsel. Mr. Zimpfer has held various legal positions since joining CNO in 1998. |
____________________
| | (a) | The executive officers serve as such at the discretion of the Board of Directors and are elected annually. |
| | (b) | Business experience is given for at least the last five years. |
PART II
| | ITEM 5. | MARKET FOR REGISTRANT’S COMMON EQUITY, RELATED STOCKHOLDER MATTERS AND ISSUER PURCHASES OF EQUITY SECURITIES. |
MARKET INFORMATION
The following table sets forth the ranges of high and low sales prices per share for our common stock on the New York Stock Exchange for the quarterly periods beginning January 1, 2009. There have been no dividends paid or declared on our common stock during this period.
| Period | | Market price | |
| | | High | | | Low | |
| | | | | | | |
| 2009: | | | | | | |
| First Quarter | | $ | 5.10 | | | $ | .26 | |
| Second Quarter | | | 3.90 | | | | .82 | |
| Third Quarter | | | 6.31 | | | | 1.79 | |
| Fourth Quarter | | | 7.03 | | | | 4.41 | |
| | | | | | | | | |
| 2010: | | | | | | | | |
| First Quarter | | $ | 6.62 | | | $ | 4.18 | |
| Second Quarter | | | 6.65 | | | | 4.30 | |
| Third Quarter | | | 5.78 | | | | 4.59 | |
| Fourth Quarter | | | 7.13 | | | | 5.22 | |
As of February 14, 2011, there were approximately 35,000 holders of the outstanding shares of common stock, including individual participants in securities position listings.
PERFORMANCE GRAPH
The Performance Graph below compares CNO’s cumulative total shareholder return on its common stock for the period from December 31, 2005 through December 31, 2010 with the cumulative total return of the Standard & Poor’s 500 Composite Stock Price Index (the “S&P 500 Index”) and the Dow Jones Life Insurance Index. The comparison for each of the periods assumes that $100 was invested on December 31, 2005 in each of CNO common stock, the stocks included in the S&P 500 Index and the stocks included in the Dow Jones Life Insurance Index and that all dividends were reinvested. The stock performance shown in this graph represents past performance and should not be considered an indication of future performance of CNO’s common stock.
COMPARISON OF CUMULATIVE TOTAL RETURN
AMONG CNO FINANCIAL GROUP, S&P 500 INDEX AND
DOW JONES LIFE INSURANCE INDEX
| Cumulative Total Returns | | 12/31/05 | | | 12/31/06 | | | 12/31/07 | | | 12/31/08 | | | 12/31/09 | | | 12/31/10 | |
| DJ Life Insurance Index | | $ | 100 | | | $ | 113 | | | $ | 120 | | | $ | 59 | | | $ | 70 | | | $ | 88 | |
| S&P 500 Index | | $ | 100 | | | $ | 116 | | | $ | 122 | | | $ | 77 | | | $ | 97 | | | $ | 105 | |
| CNO Financial Group, Inc. | | $ | 100 | | | $ | 86 | | | $ | 54 | | | $ | 22 | | | $ | 22 | | | $ | 29 | |
DIVIDENDS
The Company does not anticipate declaring or paying cash dividends on its common stock in the foreseeable future, and is currently limited in doing so pursuant to our debt agreements. Please refer to “Management’s Discussion and Analysis of Consolidated Financial Condition and Results of Operations – Liquidity of the Holding Companies” for further discussion of these restrictions.
ISSUER PURCHASES OF EQUITY SECURITIES
| Period | | Total number of shares (or units) | | | Average price paid per share (or unit) | | | Total number of shares (or units) purchased as part of publicly announced plans or programs | | | Maximum number (or approximate dollar value) of shares (or units) that may yet be purchased under the plans or programs(a) | |
| | | | | | | | | | | | (dollars in millions) | |
| | | | | | | | | | | | | |
| October 1 through October 31 | | | - | | | $ | - | | | | - | | | $ | 262.8 | |
| | | | | | | | | | | | | | | | | |
| November 1 through November 30 | | | - | | | | - | | | | - | | | | 262.8 | |
| | | | | | | | | | | | | | | | | |
| December 1 through December 31 | | | 2,238 | | | | 6.80 | | | | - | | | | 262.8 | |
| | | | | | | | | | | | | | | | | |
| Total | | | 2,238 | | | | 6.80 | | | | - | | | | 262.8 | |
____________
| (a) | On December 21, 2006, the Company announced a common share repurchase program of up to $150 million. On May 8, 2007, the Company announced that the maximum amount that was authorized under the common share repurchase program had been increased to $350 million. |
EQUITY COMPENSATION PLAN INFORMATION
The following table summarizes information, as of December 31, 2010, relating to our common stock that may be issued under the CNO Financial Group, Inc. Amended and Restated Long-Term Incentive Plan.
| | | Number of securities to be issued upon exercise of outstanding options, warrants and rights | | | Weighted-average exercise price of outstanding options, warrants and rights | | | Number of securities remaining available for future issuance under equity compensation plans (excluding securities reflected in first column) | |
| | | | | | | | | | |
Equity compensation plans approved by security holders | | | 9,753,548 | | | $ | 10.87 | | | | 9,326,107 | |
| | | | | | | | | | | | | |
| Equity compensation plans not approved by security holders | | | - | | | | - | | | | - | |
| | | | | | | | | | | | | |
| Total | | | 9,753,548 | | | $ | 10.87 | | | | 9,326,107 | |
ITEM 6. SELECTED CONSOLIDATED FINANCIAL DATA.
| | | Years ended December 31, | |
| | | 2010 | | | 2009 | | | 2008(a) | | | 2007(a) | | | 2006(a) | |
| (Amounts in millions, except per share data) | | | | | | | | | | | | | | | |
| STATEMENT OF OPERATIONS DATA (b) | | | | | | | | | | | | | | | |
Insurance policy income | | $ | 2,670.0 | | | $ | 3,093.6 | | | $ | 3,253.6 | | | $ | 2,895.7 | | | $ | 2,696.4 | |
Net investment income | | | 1,366.9 | | | | 1,292.7 | | | | 1,178.8 | | | | 1,369.8 | | | | 1,350.8 | |
Net realized investment gains (losses) | | | 30.2 | | | | (60.5 | ) | | | (262.4 | ) | | | (158.0 | ) | | | (46.6 | ) |
Total revenues | | | 4,083.9 | | | | 4,341.4 | | | | 4,189.7 | | | | 4,131.3 | | | | 4,019.8 | |
Interest expense | | | 113.2 | | | | 117.9 | | | | 106.5 | | | | 125.3 | | | | 81.0 | |
Total benefits and expenses | | | 3,790.4 | | | | 4,167.8 | | | | 4,186.0 | | | | 4,149.3 | | | | 3,860.6 | |
| Income (loss) before income taxes and discontinued operations | | | 293.5 | | | | 173.6 | | | | 3.7 | | | | (18.0 | ) | | | 159.2 | |
Income tax expense | | | 8.9 | | | | 87.9 | | | | 413.3 | | | | 61.1 | | | | 58.3 | |
| Income (loss) before discontinued operations | | | 284.6 | | | | 85.7 | | | | (409.6 | ) | | | (79.1 | ) | | | 100.9 | |
| Discontinued operations, net of income taxes | | | - | | | | - | | | | (722.7 | ) | | | (105.9 | ) | | | .3 | |
Net income (loss) | | | 284.6 | | | | 85.7 | | | | (1,132.3 | ) | | | (185.0 | ) | | | 101.2 | |
Preferred stock dividends | | | - | | | | - | | | | - | | | | 14.1 | | | | 38.0 | |
| Net income (loss) applicable to common stock | | | 284.6 | | | | 85.7 | | | | (1,132.3 | ) | | | (199.1 | ) | | | 63.2 | |
| | | | | | | | | | | | | | | | | | | | | |
PER SHARE DATA (b) | | | | | | | | | | | | | | | | | | | | |
| Income (loss) before discontinued operations, basic | | $ | 1.13 | | | $ | .45 | | | $ | (2.22 | ) | | $ | (.54 | ) | | $ | .42 | |
| Income (loss) before discontinued operations, diluted | | | .99 | | | | .45 | | | | (2.22 | ) | | | (.54 | ) | | | .41 | |
Net income, basic | | | 1.13 | | | | .45 | | | | (6.13 | ) | | | (1.15 | ) | | | .42 | |
Net income, diluted | | | .99 | | | | .45 | | | | (6.13 | ) | | | (1.15 | ) | | | .41 | |
| Book value per common share outstanding | | | 17.23 | | | | 14.09 | | | | 8.82 | | | | 23.03 | | | | 26.64 | |
| Weighted average shares outstanding for basic earnings | | | 251.0 | | | | 188.4 | | | | 184.7 | | | | 173.4 | | | | 151.7 | |
| Weighted average shares outstanding for diluted earnings | | | 301.9 | | | | 193.3 | | | | 184.7 | | | | 173.4 | | | | 152.5 | |
Shares outstanding at period-end | | | 251.1 | | | | 250.8 | | | | 184.8 | | | | 184.7 | | | | 152.2 | |
| | | | | | | | | | | | | | | | | | | | | |
BALANCE SHEET DATA - AT PERIOD END (b) | | | | | | | | | | | | | | | | | | | | |
Total investments | | $ | 23,782.0 | | | $ | 21,530.2 | | | $ | 18,647.5 | | | $ | 21,324.5 | | | $ | 23,768.8 | |
Total assets | | | 31,899.6 | | | | 30,343.8 | | | | 28,763.3 | | | | 33,961.5 | | | | 33,580.2 | |
Corporate notes payable | | | 998.5 | | | | 1,037.4 | | | | 1,311.5 | | | | 1,167.6 | | | | 966.4 | |
Total liabilities | | | 27,574.3 | | | | 26,811.4 | | | | 27,133.3 | | | | 29,709.2 | | | | 28,858.6 | |
Shareholders’ equity | | | 4,325.3 | | | | 3,532.4 | | | | 1,630.0 | | | | 4,252.3 | | | | 4,721.6 | |
| | | | | | | | | | | | | | | | | | | | | |
| STATUTORY DATA – AT PERIOD END (c) | | | | | | | | | | | | | | | | | | | | |
Statutory capital and surplus | | $ | 1,525.1 | | | $ | 1,410.7 | | | $ | 1,311.5 | | | $ | 1,336.2 | | | $ | 1,554.5 | |
Asset valuation reserve (“AVR”) | | | 71.3 | | | | 28.2 | | | | 55.0 | | | | 161.3 | | | | 179.1 | |
| Total statutory capital and surplus and AVR | | | 1,596.4 | | | | 1,438.9 | | | | 1,366.5 | | | | 1,497.5 | | | | 1,733.6 | |
____________________
| (a) | Selected amounts have been restated to reflect the retrospective application of the adoption of authoritative guidance that specifies that issuers of convertible debt instruments that may be settled in cash upon conversion (including partial cash settlement) should separately account for the liability and equity components in a manner that will reflect the entity’s nonconvertible debt borrowing rate when interest cost is recognized in subsequent periods. The guidance has been applied retrospectively to the years ended December 31, 2008, 2007 and 2006. |
| (b) | As a result of the Transfer, as further discussed in the note to the consolidated financial statements entitled “Transfer of Senior Health Insurance Company of Pennsylvania to an Independent Trust”, a substantial portion of our long-term care business is presented as discontinued operations in periods prior to 2009. |
| (c) | We have derived the statutory data from statements filed by our insurance subsidiaries with regulatory authorities which are prepared in accordance with statutory accounting principles, which vary in certain respects from GAAP, and include amounts related to our discontinued operations in 2007 and 2006. |
| | ITEM 7. | MANAGEMENT’S DISCUSSION AND ANALYSIS OF CONSOLIDATED FINANCIAL CONDITION AND RESULTS OF OPERATIONS. |
In this section, we review the consolidated financial condition of CNO and its consolidated results of operations for the years ended December 31, 2010, 2009 and 2008 and, where appropriate, factors that may affect future financial performance. Please read this discussion in conjunction with the consolidated financial statements and notes included in this Form 10-K.
CAUTIONARY STATEMENT REGARDING FORWARD-LOOKING STATEMENTS
Our statements, trend analyses and other information contained in this report and elsewhere (such as in filings by CNO with the SEC, press releases, presentations by CNO or its management or oral statements) relative to markets for CNO’s products and trends in CNO’s operations or financial results, as well as other statements, contain forward-looking statements within the meaning of the federal securities laws and the Private Securities Litigation Reform Act of 1995. Forward-looking statements typically are identified by the use of terms such as “anticipate,” “believe,” “plan,” “estimate,” “expect,” “project,” “intend,” “may,” “will,” “would,” “contemplate,” “possible,” � 220;attempt,” “seek,” “should,” “could,” “goal,” “target,” “on track,” “comfortable with,” “optimistic” and similar words, although some forward-looking statements are expressed differently. You should consider statements that contain these words carefully because they describe our expectations, plans, strategies and goals and our beliefs concerning future business conditions, our results of operations, financial position, and our business outlook or they state other “forward-looking” information based on currently available information. The “Risk Factors” in Item 1A provide examples of risks, uncertainties and events that could cause our actual results to differ materially from the expectations expressed in our forward-looking statements. Assumptions and other important factors that could cause our actual results to differ materially from those antici pated in our forward-looking statements include, among other things:
| · | changes in or sustained low interest rates causing a reduction in investment income, the margins of our fixed annuity and life insurance business and demand for our products; |
| · | general economic, market and political conditions, including the performance and fluctuations of the financial markets which may affect our ability to raise capital or refinance existing indebtedness and the cost of doing so; |
| · | the ultimate outcome of lawsuits filed against us and other legal and regulatory proceedings to which we are subject; |
| · | our ability to make changes to certain non-guaranteed elements of our life insurance products; |
| · | our ability to obtain adequate and timely rate increases on our health products, including our long-term care business; |
| · | the receipt of any required regulatory approvals for dividend and surplus debenture interest payments from our insurance subsidiaries; |
| · | mortality, morbidity, the increased cost and usage of health care services, persistency, the adequacy of our previous reserve estimates and other factors which may affect the profitability of our insurance products; |
| · | changes in our assumptions related to deferred acquisition costs or the present value of future profits; |
| · | the recoverability of our deferred tax assets and the effect of potential ownership changes and tax rate changes on their value; |
| · | our assumption that the positions we take on our tax return filings, including our position that our 7.0% Debentures will not be treated as stock for purposes of Section 382 of the Code and will not trigger an ownership change, will not be successfully challenged by the IRS; |
| · | changes in accounting principles and the interpretation thereof; |
| · | our ability to continue to satisfy the financial ratio and balance requirements and other covenants of our debt agreements; |
| · | our ability to achieve anticipated expense reductions and levels of operational efficiencies including improvements in claims adjudication and continued automation and rationalization of operating systems, |
| · | performance and valuation of our investments, including the impact of realized losses (including other-than-temporary impairment charges); |
| · | our ability to identify products and markets in which we can compete effectively against competitors with greater market share, higher ratings, greater financial resources and stronger brand recognition; |
| · | our ability to generate sufficient liquidity to meet our debt service obligations and other cash needs; |
| · | our ability to maintain effective controls over financial reporting; |
| · | our ability to continue to recruit and retain productive agents and distribution partners and customer response to new products, distribution channels and marketing initiatives; |
| · | our ability to achieve eventual upgrades of the financial strength ratings of CNO and our insurance company subsidiaries as well as the impact of our ratings on our business, our ability to access capital, and the cost of capital; |
| · | the risk factors or uncertainties listed from time to time in our filings with the SEC; |
| · | regulatory changes or actions, including those relating to regulation of the financial affairs of our insurance companies, such as the payment of dividends and surplus debenture interest to us, regulation of financial services affecting (among other things) bank sales and underwriting of insurance products, regulation of the sale, underwriting and pricing of products, and health care regulation affecting health insurance products; and |
| · | changes in the Federal income tax laws and regulations which may affect or eliminate the relative tax advantages of some of our products. |
Other factors and assumptions not identified above are also relevant to the forward-looking statements, and if they prove incorrect, could also cause actual results to differ materially from those projected.
All written or oral forward-looking statements attributable to us are expressly qualified in their entirety by the foregoing cautionary statement. Our forward-looking statements speak only as of the date made. We assume no obligation to update or to publicly announce the results of any revisions to any of the forward-looking statements to reflect actual results, future events or developments, changes in assumptions or changes in other factors affecting the forward-looking statements.
OVERVIEW
We are a holding company for a group of insurance companies operating throughout the United States that develop, market and administer health insurance, annuity, individual life insurance and other insurance products. We focus on serving the senior and middle-income markets, which we believe are attractive, underserved, high growth markets. We sell our products through three distribution channels: career agents, independent producers (some of whom sell one or more of our product lines exclusively) and direct marketing.
Beginning July 1, 2010, management has changed the manner in which it disaggregates the Company’s operations for making operating decisions and assessing performance. As a result, the Company manages its business through the following operating segments: Bankers Life, Washington National and Colonial Penn, which are defined on the basis of product distribution; Other CNO Business, comprised primarily of products we no longer sell actively; and corporate operations, comprised of holding company activities and certain noninsurance company businesses. The Company’s segments are described below:
· | Bankers Life, which markets and distributes Medicare supplement insurance, interest-sensitive life insurance, traditional life insurance, fixed annuities and long-term care insurance products to the middle-income senior market through a dedicated field force of career agents and sales managers supported by a network of community-based branch offices. The Bankers Life segment includes primarily the business of Bankers Life. Bankers Life also markets and distributes Medicare Advantage plans primarily through a distribution arrangement with Humana and Medicare Part D prescription drug plans through a distribution and reinsurance arrangement with Coventry. |
| | |
· | Washington National, which markets and distributes supplemental health (including specified disease, accident and hospital indemnity insurance products) and life insurance to middle-income consumers at home and at the worksite. These products are marketed through PMA and through independent marketing organizations and insurance agencies, including worksite marketing. The products being marketed are underwritten by Washington National. |
| | |
· | Colonial Penn, which markets primarily graded benefit and simplified issue life insurance directly to customers through television advertising, direct mail, the internet and telemarketing. The Colonial Penn segment includes primarily the business of Colonial Penn. |
| | |
· | Other CNO Business, which consists of blocks of interest-sensitive life insurance, traditional life insurance, annuities, long-term care insurance and other supplemental health products. These blocks of business are not being actively marketed and were primarily issued or acquired by Conseco Life and Washington National. |
The following summarizes our earnings for the three years ending December 31, 2010 (dollars in millions, except per share data):
| | | 2010 | | | 2009 | | | 2008 | |
| Earnings before net realized investment gains (losses), discontinued operations, corporate interest, gain (loss) on extinguishment or modification of debt and income taxes (“EBIT” a non-GAAP financial measure) (a): | | | | | | | | | |
Bankers Life | | $ | 284.1 | | | $ | 278.0 | | | $ | 171.5 | |
Washington National | | | 104.6 | | | | 110.9 | | | | 121.1 | |
Colonial Penn | | | 26.5 | | | | 29.4 | | | | 25.2 | |
Other CNO Business | | | (11.5 | ) | | | (43.6 | ) | | | .2 | |
Corporate Operations, excluding corporate interest expense | | | (42.8 | ) | | | (37.7 | ) | | | (26.7 | ) |
EBIT | | | 360.9 | | | | 337.0 | | | | 291.3 | |
Corporate interest expense | | | (79.3 | ) | | | (84.7 | ) | | | (67.9 | ) |
| Income before gain (loss) on extinguishment or modification of debt, net realized investment gains (losses), taxes and discontinued operations | | | 281.6 | | | | 252.3 | | | | 223.4 | |
Tax expense on operating income | | | 99.7 | | | | 87.7 | | | | 86.4 | |
| | | | | | | | | | | | | |
Net operating income | | | 181.9 | | | | 164.6 | | | | 137.0 | |
| | | | | | | | | | | | | |
| Gain (loss) on extinguishment or modification of debt, net of income taxes | | | (4.4 | ) | | | (14.4 | ) | | | 13.8 | |
| Net realized investment gains (losses) (excluding the increase in unrealized losses on those investments transferred to an independent trust and net of related amortization and taxes and the establishment of a valuation allowance for deferred tax assets related to such losses) | | | 12.1 | | | | (41.5 | ) | | | (217.4 | ) |
| Net income (loss) before valuation allowance for deferred tax assets and discontinued operations | | | 189.6 | | | | 108.7 | | | | (66.6 | ) |
| (Increase) decrease in the valuation allowance for deferred tax assets (excluding the establishment of a valuation allowance for realized investment losses and discontinued operations) | | | 95.0 | | | | (23.0 | ) | | | (343.0 | ) |
Discontinued operations | | | - | | | | - | | | | (722.7 | ) |
Net income (loss) applicable to common stock | | $ | 284.6 | | | $ | 85.7 | | | $ | (1,132.3 | ) |
| Per diluted share: | | | | | | | | | | | | |
Net operating income | | $ | .65 | | | $ | .86 | | | $ | .74 | |
| Gain (loss) on extinguishment or modification of debt, net of income taxes | | | (.01 | ) | | | (.08 | ) | | | .08 | |
| Net realized investment gains (losses), net of related amortization and taxes | | | .04 | | | | (.21 | ) | | | (1.18 | ) |
Valuation allowance for deferred tax assets | | | .31 | | | | (.12 | ) | | | (1.86 | ) |
Discontinued operations | | | - | | | | - | | | | (3.91 | ) |
Net income (loss) | | $ | .99 | | | $ | .45 | | | $ | (6.13 | ) |
____________
| (a) | Management believes that an analysis of EBIT provides a clearer comparison of the operating results of the Company from period to period because it excludes: (i) corporate interest expense; (ii) gain (loss) on extinguishment or modification of debt; (iii) net realized investment gains (losses) that are unrelated to the Company’s underlying fundamentals; and (iv) discontinued operations and increases to our valuation allowance for deferred tax assets, which are unrelated to our continuing operations. The table above reconciles the non-GAAP measure to the corresponding GAAP measure. |
Our major goals for 2011 include:
| · | Increasing earnings per share. |
| · | Profitably increasing sales at Bankers Life, Washington National and Colonial Penn. |
| · | Generating targeted levels of investment income in a low interest rate environment within acceptable risk tolerance levels. |
| · | Continuing to execute on initiatives to achieve efficiencies and cost savings. |
| · | Continuing to actively manage the profitability of our long-term care business. |
| · | Improving profitability of existing lines of business or disposing of underperforming blocks of business. |
CRITICAL ACCOUNTING POLICIES
The preparation of financial statements in accordance with GAAP requires management to make estimates and assumptions that affect the reported amounts of assets and liabilities and disclosure of contingent assets and liabilities at the date of the financial statements and the reported amounts of revenues and expenses during the reporting period. Management has made estimates in the past that we believed to be appropriate but were subsequently revised to reflect actual experience. If our future experience differs materially from these estimates and assumptions, our results of operations and financial condition could be materially affected.
We base our estimates on historical experience and other assumptions that we believe are reasonable under the circumstances. We continually evaluate the information used to make these estimates as our business and the economic environment change. The use of estimates is pervasive throughout our financial statements. The accounting policies and estimates we consider most critical are summarized below. Additional information on our accounting policies is included in the note to our consolidated financial statements entitled “Summary of Significant Accounting Policies”.
Investments
At December 31, 2010, the carrying value of our investment portfolio was $23.8 billion.
We defer any fees received or costs incurred when we originate investments. We amortize fees, costs, discounts and premiums as yield adjustments over the contractual lives of the investments. We consider anticipated prepayments on structured securities when we estimate yields on such securities. When actual prepayments differ from our estimates, the adjustment to yield is recognized as investment income (loss).
Our evaluation of investments for impairment requires significant judgments, including: (i) the identification of potentially impaired securities; (ii) the determination of their estimated fair value; and (iii) the assessment of whether any decline in estimated fair value is other than temporary.
We regularly evaluate our investments for possible impairment. Our assessment of whether unrealized losses are “other than temporary” requires significant judgment. Factors considered include: (i) the extent to which fair value is less than the cost basis; (ii) the length of time that the fair value has been less than cost; (iii) whether the unrealized loss is event driven, credit-driven or a result of changes in market interest rates or risk premium; (iv) the near-term prospects for specific events, developments or circumstances likely to affect the value of the investment; (v) the investment’s rating and whether the investment is investment-grade and/or has been downgraded since its purchase; (vi) whether the issuer is current on all payments in accordance with the contractual terms of the investment and is expected to meet all of its obligations under the terms of the investment; (vii) whether we intend to sell the investment or it is more likely than not that circumstances will require us to sell the investment before recovery occurs; (viii) the underlying current and prospective asset and enterprise values of the issuer and the extent to which the recoverability of the carrying value of our investment may be affected by changes in such values; (ix) projections of, and unfavorable changes in, cash flows on structured securities including mortgage-backed and asset-backed securities; and (x) other objective and subjective factors.
Future events may occur, or additional information may become available, which may necessitate future realized losses of securities in our portfolio. Significant losses in the estimated fair values of our investments could have a material adverse effect on our earnings in future periods.
Impairment losses on equity securities are recognized in net income. The manner in which impairment losses on fixed maturity securities, available for sale, are recognized in the financial statements is dependent on the facts and circumstances related to the specific security. If we intend to sell a security or it is more likely than not that we would be required to sell a security before the recovery of its amortized cost, the security is other-than-temporarily impaired and the full amount of the impairment is recognized as a loss through earnings. If we do not expect to recover the amortized cost basis, we do not plan to sell the security, and if it is not more likely than not that we would be required to sell a security before the recovery of its amortized cost, less any current period credit loss, the recognition of the other-than-temporary impairment is bifurcated. We recognize the credit loss portion in net income and the noncredit loss portion in accumulated other comprehensive income (loss). Prior to 2009, such other-than-temporary impairments were recognized in their entirety through earnings and the amount recognized was the difference between amortized cost and estimated fair value.
We estimate the amount of the credit loss component of a fixed maturity security impairment as the difference between amortized cost and the present value of the expected cash flows of the security. The present value is determined using the best estimate of future cash flows discounted at the effective interest rate implicit to the security at the date of purchase or the current yield to accrete an asset-backed or floating rate security. The methodology and assumptions for establishing the best estimate of future cash flows vary depending on the type of security.
For most structured securities, cash flow estimates are based on bond specific facts and circumstances that may include collateral characteristics, expectations of delinquency and default rates, loss severity, prepayment speeds and structural support, including excess spread, subordination and guarantees. For corporate bonds, cash flow estimates are derived from scenario-based outcomes of expected corporate restructurings or the disposition of assets using bond specific facts and circumstances including timing, secured interest and loss severity. The previous amortized cost basis less the impairment recognized in net income becomes the security’s new cost basis. We accrete the new cost basis to the estimated future cash flows over the expected remaining life of the security.
The remaining non-credit impairment, which is recorded in accumulated other comprehensive income (loss), is the difference between the security’s estimated fair value and our best estimate of future cash flows discounted at the effective interest rate prior to impairment. The remaining non-credit impairment typically represents changes in the market interest rates, current market liquidity and risk premiums. As of December 31, 2010, other-than-temporary impairments included in accumulated other comprehensive income (loss) of $23.4 million (before taxes and related amortization) relate to structured securities.
Fair value is the price that would be received to sell an asset or paid to transfer a liability in an orderly transaction between market participants at the measurement date and, therefore, represents an exit price, not an entry price. We hold fixed maturities, equity securities, trading securities, investments held by variable interest entities, derivatives and separate account assets, which are carried at fair value.
The degree of judgment utilized in measuring the fair value of financial instruments is largely dependent on the level to which pricing is based on observable inputs. Observable inputs reflect market data obtained from independent sources, while unobservable inputs reflect our view of market assumptions in the absence of observable market information. Financial instruments with readily available active quoted prices would be considered to have fair values based on the highest level of observable inputs, and little judgment would be utilized in measuring fair value. Financial instruments that rarely trade often have fair value based on a lower level of observable inputs, and more judgment would be utilized in measuring fair value.
There is a three-level hierarchy for valuing assets or liabilities at fair value based on whether inputs are observable or unobservable.
| · | Level 1 – includes assets and liabilities valued using inputs that are quoted prices in active markets for identical assets or liabilities. Our Level 1 assets include exchange traded securities. |
| · | Level 2 – includes assets and liabilities valued using inputs that are quoted prices for similar assets in an active market, quoted prices for identical or similar assets in a market that is not active, observable inputs, or observable inputs that can be corroborated by market data. Level 2 assets and liabilities include those financial instruments that are valued by independent pricing services using models or other valuation methodologies. These models are primarily industry-standard models that consider various inputs such as interest rate, credit spread, reported trades, broker/dealer quotes, issuer spreads and other inputs that are observable or derived from observable information in the marketplace or are supported by observable levels at which transactions are executed in the marketplace. Financial instrum ents in this category primarily include: certain public and private corporate fixed maturity |
securities; certain government or agency securities; certain mortgage and asset-backed securities; and non-exchange-traded derivatives such as call options to hedge liabilities related to our fixed index annuity products.
| · | Level 3 – includes assets and liabilities valued using unobservable inputs that are used in model-based valuations that contain management assumptions. Level 3 assets and liabilities include those financial instruments whose fair value is estimated based on non-binding broker prices or internally developed models or methodologies utilizing significant inputs not based on, or corroborated by, readily available market information. Financial instruments in this category include certain corporate securities (primarily private placements), certain mortgage and asset-backed securities, and other less liquid securities. Additionally, the Company’s liabilities for embedded derivatives (including embedded derivatives related to our fixed index annuity products and to a modified coinsurance arrangement) are classifie d in Level 3 since their values include significant unobservable inputs including actuarial assumptions. |
At each reporting date, we classify assets and liabilities into the three input levels based on the lowest level of input that is significant to the measurement of fair value for each asset and liability reported at fair value. This classification is impacted by a number of factors, including the type of financial instrument, whether the financial instrument is new to the market and not yet established, the characteristics specific to the transaction and overall market conditions. Our assessment of the significance of a particular input to the fair value measurement and the ultimate classification of each asset and liability requires judgment. The vast majority of our fixed maturity securities and separate account assets use Level 2 inputs for the determination of fair value.
Below-investment grade securities generally have different characteristics than investment grade corporate debt securities. Based on historical performance, likelihood of default by the borrower is significantly greater for below-investment grade securities and in many cases, severity of loss is relatively greater as such securities are often subordinated to other indebtedness of the issuer. Also, issuers of below-investment grade securities may be more financially leveraged hence, all other things being equal, more sensitive to adverse economic conditions, such as recession or increasing interest rates. The Company attempts to reduce the overall risk related to its investment in below-investment grade securities, as in all investments, through careful credit analysis, strict investment policy guidelines, and diversification by issuer and/or guarantor and by industry.
Our fixed maturity investments are generally purchased in the context of a long-term strategy to fund insurance liabilities, so we do not generally seek to purchase and sell such securities to generate short-term realized gains. In certain circumstances, including those in which securities are selling at prices which exceed our view of their current fair value, and it is possible to reinvest the proceeds to better meet our long-term asset-liability management objectives, we may sell certain securities. During 2010, we sold $1.4 billion of fixed maturity investments which resulted in gross investment losses (before income taxes) of $147.7 million. We sell securities at a loss for a number of reasons including, but not limited to: (i) changes in the investment environment; (ii) expectation that the fair val ue could deteriorate further; (iii) desire to reduce our exposure to an issuer or an industry; (iv) changes in credit quality; or (v) changes in expected liability cash flows.
We generally seek to balance the duration and cash flows of our invested assets with the estimated duration and cash flows of benefit payments arising from contract liabilities. These efforts may cause us to sell investments before their maturity date and could result in the realization of net realized investment gains (losses). When the estimated durations of assets and liabilities are similar, exposure to interest rate risk is minimized because a change in the value of assets should be largely offset by a change in the value of liabilities. In certain circumstances, a mismatch of the durations or related cash flows of invested assets and insurance liabilities could have a significant impact on our results of operations and financial position. See “— Quantitative and Qualitative Di sclosures About Market Risks” for additional discussion of the duration of our invested assets and insurance liabilities.
For more information on our investment portfolio and our critical accounting policies related to investments, see the note to our consolidated financial statements entitled “Investments”.
Present Value of Future Profits and Deferred Acquisition Costs
In conjunction with the implementation of fresh start accounting, we eliminated the historical balances of our Predecessor’s deferred acquisition costs and the present value of future profits and replaced them with the present value of future profits as calculated on the Effective Date.
The value assigned to the right to receive future cash flows from contracts existing at the Effective Date is referred to as the present value of future profits. We also defer renewal commissions paid in excess of ultimate commission levels related to the existing policies in this account. The balance of this account is amortized, evaluated for recovery, and adjusted
for the impact of unrealized gains (losses) in the same manner as the deferred acquisition costs described below. We expect to amortize approximately 13 percent of the December 31, 2010 balance of the present value of future profits inforce in 2011, 11 percent in 2012, 10 percent in 2013, 8 percent in 2014 and 7 percent in 2015.
The deferred acquisition costs are those costs that vary with, and are primarily related to, producing new insurance business in the period after September 10, 2003. For universal life or investment products, we amortize these costs using the interest rate credited to the underlying policy in relation to the estimated gross profits. For other products, we amortize these costs using the projected investment earnings rate in relation to future anticipated premium revenue. The present value of future profits and the deferred acquisition costs are collectively referred to as “insurance acquisition costs.”
Insurance acquisition costs are amortized to expense over the lives of the underlying policies in relation to future anticipated premiums or gross profits. The insurance acquisition costs for policies other than universal life and investment-type products are amortized with interest (using the projected investment earnings rate) over the estimated premium-paying period of the policies, in a manner which recognizes amortization expense in proportion to each year’s premium income. The insurance acquisition costs for universal life and investment-type products are amortized with interest (using the interest rate credited to the underlying policy) in proportion to estimated gross profits. The interest, mortality, morbidity and persistency assumptions used to amortize insurance acquisition costs are cons istent with those assumptions used to estimate liabilities for insurance products. For universal life and investment-type products, these assumptions are reviewed on a regular basis. When actual profits or our current best estimates of future profits are different from previous estimates, we adjust cumulative amortization of insurance acquisition costs to maintain amortization expense as a constant percentage of gross profits over the entire life of the policies.
The blocks of universal life and interest-sensitive products in the Other CNO Business segment have not performed in accordance with prior estimates of future gross profits, resulting in adjustments to amortization expense over the last 3 years. For a description of these adjustments, see “Management’s Discussion and Analysis of Consolidated Financial Condition and Results of Operations – Results of Operations – Other CNO Business – Amortization Related to Operations”.
When we realize a gain or loss on investments backing our universal life or investment-type products, we adjust the amortization of insurance acquisition costs to reflect the change in estimated gross profits from the products due to the gain or loss realized and the effect on future investment yields. We increased (decreased) amortization expense for such changes by $11.5 million, $(4.0) million and $(21.5) million during the years ended December 31, 2010, 2009 and 2008, respectively. We also adjust insurance acquisition costs for the change in amortization that would have been recorded if fixed maturity securities, available for sale, had been sold at their stated aggregate fair value and the proceeds reinvested at current yields. We include the impact of this adjustment in accumulated other comprehensive income ( loss) within shareholders’ equity. We limit the total adjustment related to unrealized losses to the total of the costs capitalized plus interest (or the total value of policies inforce recognized at the Effective Date plus interest with respect to the present value of future profits) related to insurance policies issued in a particular year (or policies inforce at the Effective Date with respect to the present value of future profits). The investment environment during the fourth quarter of 2008 resulted in significant net unrealized losses in our fixed maturity investment portfolio. The total adjustment to accumulated other comprehensive income related to the change in deferred acquisition costs for the negative amortization that would have been recorded if fixed maturity securities, available for sale, had been sold at their stated aggregate fair value would have resulted in the balance of deferred acquisition costs exceeding the total of costs capitalized plus interest for ann uity blocks of business issued in certain years. Accordingly, the adjustment made to deferred acquisition costs produced and accumulated other comprehensive income was reduced by $206 million. The total pre-tax impact of such adjustments on accumulated other comprehensive income (loss) was a decrease of $93.8 million at December 31, 2010.
At December 31, 2010, the balance of insurance acquisition costs was $2.8 billion. The recoverability of this amount is dependent on the future profitability of the related business. Each year, we evaluate the recoverability of the unamortized balance of insurance acquisition costs. These evaluations are performed to determine whether estimates of the present value of future cash flows, in combination with the related liability for insurance products, will support the unamortized balance. These future cash flows are based on our best estimate of future premium income, less benefits and expenses. The present value of these cash flows, plus the related balance of liabilities for insurance products, is then compared with the unamortized balance of insurance acquisition costs. ;In the event of a deficiency, such amount would be charged to amortization expense. The determination of future cash flows involves significant judgment. Revisions to the assumptions which determine such cash flows could have a significant adverse effect on our results of operations and financial position.
The table presented below summarizes our estimates of cumulative adjustments to insurance acquisition costs resulting from hypothetical revisions to certain assumptions. Although such hypothetical revisions are not currently required or anticipated, we believe they could occur based on past variances in experience and our expectations of the ranges of future experience that could reasonably occur. We have assumed that revisions to assumptions resulting in the adjustments
summarized below would occur equally among policy types, ages and durations within each product classification. Any actual adjustment would be dependent on the specific policies affected and, therefore, may differ from the estimates summarized below. In addition, the impact of actual adjustments would reflect the net effect of all changes in assumptions during the period.
| | | Estimated adjustment to | |
| | | income before | |
| | | income taxes based on | |
| Change in assumptions | | revisions to certain assumptions | |
| | | (dollars in millions) | |
| Universal life-type products (a): | | | |
| 5% increase to assumed mortality | | $ | (96.5 | ) |
| 5% decrease to assumed mortality | | | 98.8 | |
| 15% increase to assumed expenses | | | (22.2 | ) |
| 15% decrease to assumed expenses | | | 20.5 | |
| 10 basis point decrease to assumed spread | | | (24.3 | ) |
| 10 basis point increase to assumed spread | | | 24.5 | |
| 10% increase to assumed lapses | | | (1.5 | ) |
| 10% decrease to assumed lapses | | | 1.7 | |
| | | | | |
| Investment-type products: | | | | |
| 20% increase to assumed surrenders | | | (54.9 | ) |
| 20% decrease to assumed surrenders | | | 69.2 | |
| 15% increase to assumed expenses | | | (6.7 | ) |
| 15% decrease to assumed expenses | | | 6.7 | |
| 10 basis point decrease to assumed spread | | | (30.1 | ) |
| 10 basis point increase to assumed spread | | | 29.8 | |
| | | | | |
| Other than universal life and investment-type products (b): | | | | |
| 5% increase to assumed morbidity | | | (170.9 | ) |
| 50 basis point decrease to investment earnings rate | | | (116.6 | ) |
| 15% increase to assumed expenses | | | (.2 | ) |
____________________
| (a) | A significant portion of our universal life-type products inforce are valued in a loss recognition status. A favorable change in experience on such blocks may slow down future amortization; however, the current period adjustment to insurance acquisition costs would be small. This causes the downside sensitivities above to be lower in magnitude than the upside results. |
| (b) | We have excluded the effect of reasonably likely changes in mortality, lapse, surrender and expense assumptions for policies other than universal life and investment-type products. Our estimates indicate such changes would not result in any portion of the $2.2 billion balance of unamortized insurance acquisition costs related to these policies being unrecoverable. |
The following summarizes the persistency of our major blocks of insurance business summarized by segment and line of business:
| | | | | | | | | | |
| | | Years ended December 31, | |
| | | 2010 | | | 2009 | | | 2008 | |
| Bankers Life: | | | | | | | | | |
| Medicare supplement (1) (3) | | | 82.3 | % | | | 85.2 | % | | | 83.7 | % |
| Long-term care (1) (5) | | | 89.0 | % | | | 87.9 | % | | | 90.4 | % |
| Fixed index annuities (2) (5) | | | 88.7 | % | | | 87.6 | % | | | 88.0 | % |
| Other annuities (2) (4) | | | 86.8 | % | | | 87.0 | % | | | 84.3 | % |
| Life (1) (6) | | | 87.2 | % | | | 87.4 | % | | | 87.3 | % |
| | | | | | | | | | | | | |
| Washington National: | | | | | | | | | | | | |
| Medicare supplement (1) (5) | | | 78.8 | % | | | 78.9 | % | | | 77.8 | % |
| Supplemental health (1) (5) | | | 88.7 | % | | | 89.6 | % | | | 90.3 | % |
| Life (1) (5) | | | 93.3 | % | | | 92.8 | % | | | 91.6 | % |
| | | | | | | | | | | | | |
| Colonial Penn: | | | | | | | | | | | | |
| Life (1) (5) | | | 86.1 | % | | | 86.4 | % | | | 86.0 | % |
| | | | | | | | | | | | | |
| Other CNO Business: | | | | | | | | | | | | |
| Long-term care (1) (5) | | | 91.5 | % | | | 92.2 | % | | | 92.1 | % |
| Fixed index annuities (2) (6) | | | 88.6 | % | | | 82.6 | % | | | 86.5 | % |
| Other annuities (2) (4) | | | 91.2 | % | | | 93.3 | % | | | 80.6 | % |
| Life (1) (5) | | | 94.3 | % | | | 93.6 | % | | | 94.0 | % |
____________
| | (1) | Based on number of inforce policies. |
| | (2) | Based on the percentage of the inforce block persisting. |
| | (3) | The Medicare supplement block of Bankers Life reflected higher lapse activity which was expected due to conversions to new Medicare Modernization plans. |
| | (4) | We have noted an increase in persistency rates since 2008 for other annuity products (consisting primarily of fixed rate annuity policies). We believe this increase is related to the lack of competing investment products which would offer higher returns for consumers. |
| | (5) | These persistency rates are generally in line with our expectations. |
| | (6) | This block of business experienced higher than anticipated surrenders during 2009. The annuities which experienced higher surrenders have a MVA feature, which effectively reduced (or in some cases eliminated) the charges paid upon the surrender of these policies as the 10-year treasury rate dropped to historic lows. The impact of both the historical experience and projected increased surrender activity and higher MVA benefits has reduced our expectations on the profitability of the annuity block of Other CNO Business to approximately break-even. Refer to “Management’s Discussion and Analysis of Financial Condition and Results of Operations – Other CNO Business – Amortization Related to Operations” for additional information. |
Liabilities for Insurance Products – reserves for the future payment of long-term care policy claims
We calculate and maintain reserves for the future payment of claims to our policyholders based on actuarial assumptions. For all our insurance products, we establish an active life reserve, a liability for due and unpaid claims, claims in the course of settlement and incurred but not reported claims. In addition, for our health insurance business, we establish a reserve for the present value of amounts not yet due on claims. Many factors can affect these reserves and liabilities, such as economic and social conditions, inflation, hospital and pharmaceutical costs, changes in doctrines of legal liability and extra-contractual damage awards. Therefore, our reserves and liabilities are necessarily based on numerous estimates and assumptions as well as historical experience. Establishing reserves is an uncertain process, and it is possible that actual claims will materially exceed our reserves and have a material adverse effect on our results of operations and financial condition. For example, our long-term care policy claims may be paid over a long period of time and, therefore, loss estimates have a higher degree of uncertainty. We have incurred significant losses beyond our estimates as a result of actual claim costs and persistency of our long-term care business of Senior Health and Washington National. The long-term care business of Senior Health was transferred to an independent trust in 2008 and CNO no longer has any liability for this business. Estimates of unpaid losses related to long-term care business have a higher degree of uncertainty than estimates for our other products due to the range of ultimate duration of these claims and the resulting variability in their cost (in addition to the variations in the lag time in reporting claims ). We would not consider a variance of 5-10 percentage points from the
initial expected loss ratio to be unusual. As an example, an increase in the initial loss ratio of 5-10 percentage points for claims incurred in 2010 related to our long-term care business (in both our Bankers Life and Other CNO Business segments) would result in a decrease in our earnings of approximately $35 to $70 million. Our financial results depend significantly upon the extent to which our actual claims experience is consistent with the assumptions we used in determining our reserves and pricing our products. If our assumptions with respect to future claims are incorrect, and our reserves are insufficient to cover our actual losses and expenses, we would be required to increase our liabilities, which would negatively affect our operating results.
Accounting for marketing and reinsurance agreements with Coventry
Prescription Drug Benefit
The Medicare Prescription Drug, Improvement and Modernization Act of 2003 provided for the introduction of a PDP product. In order to offer this product to our current and potential future policyholders without investing in management and infrastructure, we entered into a national distribution agreement with Coventry to use our career and independent agents to distribute Coventry’s prescription drug plan, Advantra Rx. We receive a fee based on the premiums collected on plans sold through our distribution channels. In addition, CNO has a quota-share reinsurance agreement with Coventry for CNO enrollees that provides CNO with 50 percent of net premiums and related policy benefits subject to a risk corridor. The Part D program was effective January 1, 2006.
The following describes how we account for and report our PDP business:
Our accounting for the national distribution agreement
| · | For contracts sold prior to 2009, we recognize distribution and licensing fee income from Coventry based upon negotiated percentages of collected premiums on the underlying Medicare Part D contracts. For contracts sold in 2009 and thereafter, we recognize distribution income based on a fixed fee per PDP contract. This fee income is recognized over the calendar year term as premiums are collected. |
| · | We also pay commissions to our agents who sell the plans on behalf of Coventry. These payments are deferred and amortized over the remaining term of the initial enrollment period (the one-year life of the initial policy). |
Our accounting for the quota-share agreement
| · | We recognize premium revenue evenly over the period of the underlying Medicare Part D contracts. |
| · | We recognize policyholder benefits and ceding commission expense as incurred. |
| · | We recognize risk-share premium adjustments consistent with Coventry’s risk-share agreement with the Centers for Medicare and Medicaid Services. |
The following summarizes the pre-tax income (loss) of the PDP business (dollars in millions):
| | | 2010 | | | 2009 | | | 2008 | |
| | | | | | | | | | |
| Insurance policy income | | $ | 67.8 | | | $ | 78.6 | | | $ | 67.1 | |
| Fee revenue and other | | | 3.8 | | | | 2.8 | | | | 2.6 | |
| | | | | | | | | | | | | |
| Total revenues | | | 71.6 | | | | 81.4 | | | | 69.7 | |
| | | | | | | | | | | | | |
| Insurance policy benefits | | | 52.6 | | | | 66.6 | | | | 62.3 | |
| Commission expense | | | 6.4 | | | | 7.7 | | | | 6.0 | |
| Other operating expenses | | | .4 | | | | .6 | | | | 2.1 | |
| | | | | | | | | | | | | |
| Total expense | | | 59.4 | | | | 74.9 | | | | 70.4 | |
| | | | | | | | | | | | | |
| Pre-tax income (loss) | | $ | 12.2 | | | $ | 6.5 | | | $ | (.7 | ) |
Private-Fee-For-Service
CNO expanded its strategic alliance with Coventry by entering into a national distribution agreement under which our career agents began distributing Coventry’s PFFS plan, beginning January 1, 2007. Under the agreement, we received a fee based on the number of PFFS plans sold through our distribution channels. In addition, CNO had a quota-share reinsurance agreement with Coventry for CNO enrollees that provided CNO with a specified percentage of the net premiums and related profits. Coventry decided to cease selling PFFS plans effective January 1, 2010. In July 2009, we announced a strategic alliance under which we would offer Humana’s Medicare Advantage plans to our policyholders and consumers through our career agency force and will receive marketing fees based on sales. � 0;Effective January 1, 2010, we no longer assume the underwriting risk related to PFFS business.
We received distribution fees from Coventry and we paid sales commissions to our agents for these enrollments. In addition, we received a specified percentage of the income (loss) related to this business pursuant to a quota-share agreement with Coventry.
The following summarizes our accounting and reporting practices for the PFFS business.
Our accounting for the distribution agreement
| · | We received distribution income from Coventry and other parties based on a fixed fee per PFFS contract. This income was deferred and recognized over the remaining calendar year term of the initial enrollment period. |
| · | We also paid commissions to our agents who sell the plans on behalf of Coventry and other parties. These payments were deferred and amortized over the remaining term of the initial enrollment period (the one-year life of the initial policy). |
Our accounting for the quota-share agreement
| · | We recognized revenue evenly over the period of the underlying PFFS contracts. |
| · | We recognized policyholder benefits and ceding commission expense as incurred. |
The following summarizes the pre-tax income (loss) of the PFFS business (dollars in millions):
| | | 2010 | | | 2009 | | | 2008 | |
| | | | | | | | | | |
| Insurance policy income | | $ | (1.0 | ) | | $ | 318.2 | | | $ | 228.9 | |
| Fee revenue and other | | | 8.0 | | | | 8.4 | | | | 8.3 | |
| | | | | | | | | | | | | |
| Total revenues | | | 7.0 | | | | 326.6 | | | | 237.2 | |
| | | | | | | | | | | | | |
| Insurance policy benefits | | | (15.9 | ) | | | 286.4 | | | | 221.7 | |
| Commission expense | | | 1.5 | | | | 12.4 | | | | 8.0 | |
| Other operating expenses �� | | | 5.4 | | | | 6.2 | | | | 12.7 | |
| | | | | | | | | | | | | |
| Total expense | | | (9.0 | ) | | | 305.0 | | | | 242.4 | |
| | | | | | | | | | | | | |
| Pre-tax income (loss) | | $ | 16.0 | | | $ | 21.6 | | | $ | (5.2 | ) |
Large Group Private-Fee-For-Service Blocks
During 2007 and 2008, CNO entered into three quota-share reinsurance agreements with Coventry related to the PFFS business written by Coventry under certain group policies. CNO received a specified percentage of the net premiums and related profits associated with this business as long as the ceded revenue margin was less than or equal to five percent. CNO received a specified percentage of the net premiums and related profits on the ceded margin in excess of five percent. In order to reduce the required statutory capital associated with the assumption of this business, CNO terminated two group policy quota-share agreements as of December 31, 2008 and terminated the last agreement on June 30, 2009. The following summarizes the premiums assumed, related expenses and pre-tax income of this busine ss (dollars in millions):
| | | 2010 | | | 2009 | | | 2008 | |
| | | | | | | | | | |
| Premiums assumed | | $ | .3 | | | $ | 47.5 | | | $ | 313.5 | |
| | | | | | | | | | | | | |
| Policy benefits | | | (2.2 | ) | | | 31.8 | | | | 301.1 | |
| Commission expense | | | - | | | | 1.7 | | | | 12.0 | |
| | | | | | | | | | | | | |
| Total expenses | | | (2.2 | ) | | | 33.5 | | | | 313.1 | |
| | | | | | | | | | | | | |
| Pre-tax income | | $ | 2.5 | | | $ | 14.0 | | | $ | .4 | |
Income Taxes
Our income tax expense includes deferred income taxes arising from temporary differences between the financial reporting and tax bases of assets and liabilities, capital loss carryforwards and NOLs. Deferred tax assets and liabilities are measured using enacted tax rates expected to apply in the years in which temporary differences are expected to be recovered or paid. The effect of a change in tax rates on deferred tax assets and liabilities is recognized in earnings in the period when the changes are enacted.
Authoritative guidance requires a reduction of the carrying amount of deferred tax assets by establishing a valuation allowance if, based on the available evidence, it is more likely than not that such assets will not be realized. We evaluate the need to establish a valuation allowance for our deferred income tax assets on an ongoing basis. In evaluating our deferred income tax assets, we consider whether the deferred income tax assets will be realized, based on the more-likely-than-not realization threshold criterion. The ultimate realization of our deferred income tax assets depends upon generating sufficient future taxable income during the periods in which our temporary differences become deductible and before our capital loss carryforwards and NOLs expire. This assessment requires signific ant judgment. In assessing the need for a valuation allowance, appropriate consideration is given to all positive and negative evidence related to the realization of the deferred tax assets. This assessment considers, among other matters, the nature, frequency and severity of current and cumulative losses, forecasts of future profitability, excess appreciated asset value over the tax basis of net assets, the duration of
carryforward periods, our experience with operating loss and tax credit carryforwards expiring unused, and tax planning alternatives.
Concluding that a valuation allowance is not required is difficult when there has been significant negative evidence, such as cumulative losses in recent years. We utilize a three year rolling calculation of actual income before income taxes as our primary measure of cumulative losses in recent years. Our analysis of whether there needs to be any changes to the deferred tax valuation allowance recognizes that as of December 31, 2010, we have incurred a cumulative loss over the evaluation period, resulting from the substantial loss during 2008 primarily related to the Transfer of the stock of Senior Health to the Independent Trust for the exclusive benefit of Senior Health’s long-term care policyholders as described in the note to these consolidated financial statements entitled “Transfer of Senior Health Insurance Company of Pennsylvania to an Independent Trust”. As a result of the cumulative losses recognized in recent years, our evaluation of the valuation allowance for deferred tax assets was primarily based on our historical taxable earnings. However, because a substantial portion of the cumulative losses for the three-year period ended December 31, 2010, relates to transactions to dispose of blocks of businesses, we have adjusted the three-year cumulative results for the income and losses from the blocks of business disposed of in the past and the business transferred as further described in the note to these financial statements entitled “Transfer of Senior Health Insurance Company of Pennsylvania to an Independent Trust”. We consider this to be non-recurring and have reflected our best estimates of when temporary differences will reverse over the carryforward periods.
In order to support the utilization of the tax benefits of NOLs that do not have an offsetting valuation allowance, we project future taxable income based on our historical earnings adjusted for the items described in the previous paragraph. Based on these projections, we must generate approximately $225 million for each year through 2018 in order to utilize the tax benefits of our NOLs which expire through that date. The taxable income requirements are substantially comprised of life insurance income, as the potential tax benefits related to our non-life NOLs are substantially offset by a valuation allowance. Our taxable income excluding realized gains for 2010 was $235 million and we expect our future taxable income to be adequate to utilize the remaining NOLs. The projections of future taxab le income used to support the recovery of our NOLs do not anticipate the use of any tax planning strategies that we would consider to avoid a tax benefit from expiring.
At December 31, 2010, our valuation allowance for our net deferred tax assets was $1.1 billion, as we have determined that it is more likely than not that a portion of our deferred tax assets will not be realized. This determination was made by evaluating each component of the deferred tax asset and assessing the effects of limitations and/or interpretations on the value of such component to be fully recognized in the future. We have also evaluated the likelihood that we will have sufficient taxable income to offset the available deferred tax assets based on evidence which we consider to be objective and verifiable. Based upon our analysis completed at December 31, 2010, we believe that we will, more likely than not, recover $850.2 million of our deferred tax assets through reductions of our tax liabilities in futur e periods.
During 2010, we reduced the valuation allowance established in prior periods by $95 million. The decrease was primarily attributable to: revisions to projected future taxable income supported by our increased profitability in the past two years ($47 million); utilization of capital loss carryforwards with current capital gains ($30 million); and utilization of NOL carryforwards with higher taxable income than projected in our previous analysis of the valuation allowance ($18 million).
Changes in our valuation allowance are summarized as follows (dollars in millions):
| Balance at December 31, 2007 | | $ | 672.9 | | |
| | | | | | |
| Increase in 2008 �� | | | 856.2 | | (a) |
| Expiration of capital loss carryforwards | | | (209.7 | ) | |
| Write-off of capital loss carryforwards related to Senior Health | | | (133.2 | ) | |
| Write-off of certain NOLs related to Senior Health | | | (5.5 | ) | |
| | | | | | |
| Balance at December 31, 2008 | | | 1,180.7 | | |
| | | | | | |
| Increase in 2009 | | | 27.8 | | (b) |
| Expiration of capital loss carryforwards | | | (32.1 | ) | |
| | | | | | |
| Balance at December 31, 2009 | | | 1,176.4 | | |
| | | | | | |
| Decrease in 2010 | | | (95.0 | ) | (c) |
| | | | | | |
| Balance at December 31, 2010 | | $ | 1,081.4 | | |
____________________
| (a) | The $856.2 million increase to our valuation allowance during 2008 included increases of: (i) $452 million of deferred tax assets related to Senior Health, which was transferred to an independent trust during 2008; (ii) $298 million related to our reassessment of the recovery of our deferred tax assets in accordance with GAAP, following the additional losses incurred as a result of the transaction to transfer Senior Health to an independent trust; (iii) $60 million related to the recognition of additional realized investment losses for which we are unlikely to receive any tax benefit; and (iv) $45 million related to the estimated additional future expense following the modifications to our Second Amended and Restated Credit Agreement dated as of October 10, 2006, as subsequently amended (the “Previous Senior Credit Agreement”) a s described in the note to these consolidated financial statements entitled “Notes Payable – Direct Corporate Obligations.” |
| (b) | The $27.8 million increase to our valuation allowance during 2009 included increases of: (i) $23.0 million related to our reassessment of the recovery of our deferred tax assets following the completion of reinsurance transactions in 2009; and (ii) $4.8 million related to the recognition of additional realized investment losses for which we are unlikely to receive any tax benefit. |
| (c) | The $95.0 million reduction to the deferred tax valuation allowance during 2010 resulted from the utilization of NOLs and capital loss carryforwards and higher projections of future taxable income based on evidence we consider to be objective and verifiable. |
Recovery of our deferred tax assets is dependent on achieving the projections of future taxable income embedded in our analysis and failure to do so would result in an increase in the valuation allowance in a future period. Any future increase in the valuation allowance may result in additional income tax expense and reduce shareholders’ equity, and such an increase could have a significant impact upon our earnings in the future. In addition, the use of the Company’s NOLs is dependent, in part, on whether the IRS does not take an adverse position in the future regarding the tax position we have taken in our tax returns with respect to the allocation of a portion of the cancellation of indebtedness income resulting from the bankruptcy of our Predecessor and the classification of the loss we recognized as a result of the transfer of Senior Health to an Independent Trust (as further described below).
The Code limits the extent to which losses realized by a non-life entity (or entities) may offset income from a life insurance company (or companies) to the lesser of: (i) 35 percent of the income of the life insurance company; or (ii) 35 percent of the total loss of the non-life entities (including NOLs of the non-life entities). There is no similar limitation on the extent to which losses realized by a life insurance entity (or entities) may offset income from a non-life entity (or entities).
Section 382 imposes limitations on a corporation’s ability to use its NOLs when the company undergoes an ownership change. Future transactions and the timing of such transactions could cause an ownership change for Section 382 income tax purposes. Such transactions may include, but are not limited to, additional repurchases or issuances of common stock (including upon conversion of our outstanding 7.0% Debentures), or acquisitions or sales of shares of CNO stock by certain holders of our shares, including persons who have held, currently hold or may accumulate in the future five percent or more of our outstanding common stock for their own account. Many of these transactions are beyond our control. If an additional ownership change were to occur for purposes of Section 382, we would be re quired to calculate an annual restriction on the use of our NOLs to offset future taxable income. The annual restriction would be calculated based upon the value of CNO’s equity at the time of such ownership change, multiplied by a federal long-term tax exempt rate (3.67 percent at December 31, 2010), and the annual restriction could effectively eliminate our ability to use a substantial portion of our NOLs to offset future taxable income. We regularly monitor ownership change (as calculated for purposes of Section 382) and, as of December 31, 2010, we were below the 50 percent ownership change level that would trigger further impairment of our ability to utilize our NOLs.
As of December 31, 2010, we had $4.4 billion of federal NOLs and $1.0 billion of capital loss carryforwards, which expire as follows (dollars in millions):
| Year of expiration | | Net operating loss carryforwards (a) | | Capital loss | | | Total loss | |
| | | Life | | Non-life | | carryforwards | | | carryforwards | |
| | | | | | | | | | | | | | | |
| 2011 | | $ | - | | | | $ | .1 | | | | $ | - | | | $ | .1 | |
| 2013 | | | - | | | | | - | | | | | 942.0 | | | | 942.0 | |
| 2014 | | | - | | | | | - | | | | | 28.7 | | | | 28.7 | |
| 2018 | | | 1,713.9 | | (a) | | | - | | | | | - | | | | 1,713.9 | |
| 2021 | | | 29.6 | | | | | - | | | | | - | | | | 29.6 | |
| 2022 | | | 204.1 | | | | | - | | | | | - | | | | 204.1 | |
| 2023 | | | - | | | | | 1,999.3 | | (a) | | | - | | | | 1,999.3 | |
| 2024 | | | - | | | | | 3.2 | | | | | - | | | | 3.2 | |
| 2025 | | | - | | | | | 118.8 | | | | | - | | | | 118.8 | |
| 2027 | | | - | | | | | 216.8 | | | | | - | | | | 216.8 | |
| 2028 | | | - | | | | | .5 | | | | | - | | | | .5 | |
| 2029 | | | - | | | | | 148.7 | | | | | - | | | | 148.7 | |
| | | | | | | | | | | | | | | | | | | |
| Total | | $ | 1,947.6 | | | | $ | 2,487.4 | | | | $ | 970.7 | | | $ | 5,405.7 | |
___________________
| (a) | The allocation of the NOLs summarized above assumes the IRS does not take an adverse position in the future regarding the tax position we plan to take in our tax returns with respect to the allocation of cancellation of indebtedness income. If the IRS disagrees with the tax position we plan to take with respect to the allocation of cancellation of indebtedness income, and their position prevails, approximately $631 million of the NOLs expiring in 2018 would be characterized as non-life NOLs. |
As more fully discussed below, the Company’s interpretation of the tax law, as it relates to the application of the cancellation of indebtedness income to its NOLs, is an uncertain tax position. Since all other life NOLs must be utilized prior to this portion of the NOL, it has not yet been utilized nor is it expected to be utilized within the next twelve months. As a result, an uncertain tax position has not yet been taken on the Company’s tax return.
Although authoritative guidance allowed a change in accounting, the Company has chosen to continue its past accounting policy of classifying interest and penalties as income tax expense in the consolidated statement of operations. No such amounts were recognized in 2010, 2009 or 2008. The liability for accrued interest and penalties was not significant at December 31, 2010 or December 31, 2009.
Tax years 2007 through 2009 are open to examination by the IRS, and tax year 2002 remains open only for potential adjustments related to certain partnership investments. The Company does not anticipate any material adjustments related to these partnership investments. The Company’s various state income tax returns are generally open for tax years 2007 through 2009 based on the individual state statutes of limitation.
In July 2006, the Joint Committee of Taxation accepted the audit and the settlement which characterized $2.1 billion of the tax losses on our Predecessor’s investment in Conseco Finance Corp. as life company losses and the remaining $3.8 billion as non-life losses prior to the application of the cancellation of indebtedness attribute reductions described below.
The Code provides that any income realized as a result of the cancellation of indebtedness in bankruptcy (cancellation of debt income or “CODI”) must reduce NOLs. We realized $2.5 billion of CODI when we emerged from bankruptcy. Pursuant to the Company’s interpretation of the tax law, the CODI reductions were all used to reduce non-life NOLs. However, if the IRS were to disagree with our interpretation and ultimately prevail, we believe $631 million of NOLs classified as life company NOLs would be re-characterized as non-life NOLs and subject to the 35% limitation discussed above. Such a re-characterization would also extend the year of expiration as life company NOLs expire after 15 years whereas non-life NOLs expire after 20 years. Due to uncertainties with respec t to the ultimate position the IRS may take and limitations on our ability to utilize NOLs based on projected life and non-life income, we have considered the $631 million of CODI to be a reduction to life NOLs when determining our valuation allowance. If we determine the IRS agrees with our position that the $631 million of CODI is a reduction to non-life NOLs, our valuation allowance would be reduced by approximately $140 million based on the income projection used in our valuation allowance at December 31, 2010.
We recognized a $742 million loss on our investment in Senior Health which was worthless when it was transferred to an Independent Trust in 2008. We have treated the loss as a capital loss when determining the deferred tax benefit we may
receive. We also established a full valuation allowance as we believe we will not generate capital gains to utilize the benefit. However, due to uncertainties in the tax code, we have reflected this loss as an ordinary loss in our tax return, contrary to certain IRS rulings. If classifying this loss as ordinary is ultimately determined to be correct, our valuation allowance would be reduced by approximately $160 million based on income projections used in our valuation allowance at December 31, 2010.
Liabilities for Insurance Products
At December 31, 2010, the total balance of our liabilities for insurance products was $24.5 billion. These liabilities are generally payable over an extended period of time and the profitability of the related products is dependent on the pricing of the products and other factors. Differences between our expectations when we sold these products and our actual experience could result in future losses.
We calculate and maintain reserves for the future payment of claims to our policyholders based on actuarial assumptions. For all our insurance products, we establish an active life reserve, a liability for due and unpaid claims, claims in the course of settlement and incurred but not reported claims. In addition, for our health insurance business, we establish a reserve for the present value of amounts not yet due on claims. Many factors can affect these reserves and liabilities, such as economic and social conditions, inflation, hospital and pharmaceutical costs, changes in doctrines of legal liability and extra-contractual damage awards. Therefore, our reserves and liabilities are necessarily based on numerous estimates and assumptions as well as historical experience. Establishing reserves is an uncertain process, and it is possible that actual claims will materially exceed our reserves and have a material adverse effect on our results of operations and financial condition. We have incurred significant losses beyond our estimates as a result of actual claim costs and persistency of our long-term care business of Senior Health and Washington National. Our financial results depend significantly upon the extent to which our actual claims experience is consistent with the assumptions we used in determining our reserves and pricing our products. If our assumptions with respect to future claims are incorrect, and our reserves are insufficient to cover our actual losses and expenses, we would be required to increase our liabilities, which would negatively affect our operating results.
Liabilities for insurance products are calculated using management’s best judgments, based on our past experience and standard actuarial tables, of mortality, morbidity, lapse rates, investment experience and expense levels.
Accounting for Long-term Care Premium Rate Increases
Many of our long-term care policies were subject to premium rate increases in 2006 and 2007. In some cases, these premium rate increases were reasonably consistent with the assumptions we used to value the particular block of business at the fresh-start date. With respect to the 2006 premium rate increases, some of our policyholders were provided an option to cease paying their premiums and receive a non-forfeiture option in the form of a paid-up policy with limited benefits. In addition, our policyholders could choose to reduce their coverage amounts and premiums in the same proportion, when permitted by our contracts or as required by regulators. The following describes how we account for these premium rate increases and related policyholder options:
| · | Premium rate increases – If premium rate increases reflect a change in our previous rate increase assumptions, the new assumptions are not reflected prospectively in our reserves. Instead, the additional premium revenue resulting from the rate increase is recognized as earned and original assumptions continue to be used to determine changes to liabilities for insurance products unless a premium deficiency exists. |
| · | Benefit reductions – If there is a premium rate increase on one of our long-term care policies, a policyholder may choose reduced coverage with a proportionate reduction in premium, when permitted by our contracts. This option does not require additional underwriting. Benefit reductions are treated as a partial lapse of coverage, and the balance of our reserves and deferred insurance acquisition costs is reduced in proportion to the reduced coverage. |
| · | Non-forfeiture benefits offered in conjunction with a rate increase – In some cases, non-forfeiture benefits are offered to policyholders who wish to lapse their policies at the time of a significant rate increase. In these cases, exercise of this option is treated as an extinguishment of the original contract and issuance of a new contract. The balance of our reserves and deferred insurance acquisition costs are released, and a reserve for the new contract is established. |
| · | Florida Order – In 2004, the Florida Office of Insurance Regulation issued an order to Washington National regarding its home health care business in Florida. The order required Washington National to offer a choice of three alternatives to holders of home health care policies in Florida subject to premium rate increases as follows: |
| · | retention of their current policy with a rate increase of 50 percent in the first year and actuarially justified increases in subsequent years; |
| · | receipt of a replacement policy with reduced benefits and a rate increase in the first year of 25 percent and no more than 15 percent in subsequent years; or |
| · | receipt of a paid-up policy, allowing the holder to file future claims up to 100 percent of the amount of premiums paid since the inception of the policy. |
Reserves for all three groups of policies under the order were prospectively adjusted using the prospective revision methodology described above, as these alternatives were required by the Florida Office of Insurance Regulation. These policies had no insurance acquisition costs established at the Effective Date.
Some of our policyholders may receive a non-forfeiture benefit if they cease paying their premiums pursuant to their original contract (or pursuant to changes made to their original contract as a result of a litigation settlement made prior to the Effective Date or an order issued by the Florida Office of Insurance Regulation). In these cases, exercise of this option is treated as the exercise of a policy benefit, and the reserve for premium paying benefits is reduced, and the reserve for the non-forfeiture benefit is adjusted to reflect the election of this benefit.
Liabilities for Loss Contingencies Related to Lawsuits and Our Guarantees of Bank Loans and Related Interest Loans
We are involved on an ongoing basis in arbitrations and lawsuits, including purported class actions. The ultimate outcome of these legal matters cannot be predicted with certainty. We recognize an estimated loss from these loss contingencies when we believe it is probable that a loss has been incurred and the amount of the loss can be reasonably estimated. However, it is difficult to measure the actual loss that might be incurred related to litigation. The ultimate outcome of these lawsuits could have a significant impact on our results of operations and financial position.
In conjunction with our bankruptcy reorganization in 2003, $481.3 million principal amount of bank loans made to certain former directors and employees to enable them to purchase common stock of our Predecessor were transferred to the Company. These loans had been guaranteed by our Predecessor. We received all rights to collect the balances due pursuant to the original terms of these loans. In addition, we held loans to participants for interest on the loans. The loans and the interest loans are collectively referred to as the “D&O loans.” As of December 31, 2010, we had reached settlements with the former directors and employees and had collected the remaining amounts outstanding related to the D&O loan settlements.
Pursuant to the settlement that was reached with the Official Committee of the Trust Originated Preferred Securities (“TOPrS”) Holders and the Official Committee of Unsecured Creditors in connection with our bankruptcy reorganization in 2003, the former holders of TOPrS (issued by our Predecessor’s subsidiary trusts and eliminated in our reorganization) who did not opt out of the bankruptcy settlement were entitled to receive 45 percent of any proceeds from the collection of certain D&O loans in an aggregate amount not to exceed $30 million. As of December 31, 2010, we had paid $20.5 million to the former holders of TOPrS and we have established a liability of $2.0 million (which is included in other liabilities), representing the final amount which will be paid to the former holders of TOPrS pursuant to the settlement.
RESULTS OF OPERATIONS:
We manage our business through the following operating segments: Bankers Life, Colonial Penn and Washington National, which are defined on the basis of product distribution; Other CNO Business, comprised primarily of products we no longer sell actively; and corporate operations, comprised of holding company activities and certain noninsurance company businesses.
Please read this discussion in conjunction with the consolidated financial statements and notes included in this Form 10-K.
The following tables and narratives summarize the operating results of our segments (dollars in millions):
| | | 2010 | | | 2009 | | | 2008 | |
| | | | | | | | | | |
| Income (loss) before net realized investment gains (losses), net of related amortization and income taxes (a non-GAAP measure) (a): | | | | | | | | | |
| Bankers Life | | $ | 284.1 | | | $ | 278.0 | | | $ | 171.5 | |
| Washington National | | | 104.6 | | | | 110.9 | | | | 121.1 | |
| Colonial Penn | | | 26.5 | | | | 29.4 | | | | 25.2 | |
| Other CNO Business | | | (11.5 | ) | | | (43.6 | ) | | | .2 | |
| Corporate operations | | | (128.9 | ) | | | (144.6 | ) | | | (73.4 | ) |
| | | | | | | | | | | | | |
| | | | 274.8 | | | | 230.1 | | | | 244.6 | |
| | | | | | | | | | | | | |
| Net realized investment gains (losses), net of related amortization: | | | | | | | | | | | | |
| Bankers Life | | | 51.9 | | | | (31.6 | ) | | | (100.9 | ) |
| Washington National | | | (7.4 | ) | | | (2.6 | ) | | | (16.2 | ) |
| Colonial Penn | | | 6.6 | | | | 4.5 | | | | (1.6 | ) |
| Other CNO Business | | | (28.9 | ) | | | (19.4 | ) | | | (71.4 | ) |
| Corporate operations | | | (3.5 | ) | | | (7.4 | ) | | | (50.8 | ) |
| | | | | | | | | | | | | |
| | | | 18.7 | | | | (56.5 | ) | | | (240.9 | ) |
| | | | | | | | | | | | | |
| Income (loss) before income taxes and discontinued operations: | | | | | | | | | | | | |
| Bankers Life | | | 336.0 | | | | 246.4 | | | | 70.6 | |
| Washington National | | | 97.2 | | | | 108.3 | | | | 104.9 | |
| Colonial Penn | | | 33.1 | | | | 33.9 | | | | 23.6 | |
| Other CNO Business | | | (40.4 | ) | | | (63.0 | ) | | | (71.2 | ) |
| Corporate operations | | | (132.4 | ) | | | (152.0 | ) | | | (124.2 | ) |
| | | | | | | | | | | | | |
| Income (loss) before income taxes and discontinued operations | | $ | 293.5 | | | $ | 173.6 | | | $ | 3.7 | |
____________________
| (a) | These non-GAAP measures as presented in the above table and in the following segment financial data and discussions of segment results exclude net realized investment gains (losses), net of related amortization and before income taxes. These are considered non-GAAP financial measures. A non-GAAP measure is a numerical measure of a company’s performance, financial position, or cash flows that excludes or includes amounts that are normally excluded or included in the most directly comparable measure calculated and presented in accordance with GAAP. |
These non-GAAP financial measures of “income (loss) before net realized investment gains (losses), net of related amortization, and before income taxes” differ from “income (loss) before income taxes” as presented in our consolidated statement of operations prepared in accordance with GAAP due to the exclusion of before tax realized investment gains (losses), net of related amortization. We measure segment performance excluding realized investment gains (losses) because we believe that this performance measure is a better indicator of the ongoing businesses and trends in our business. Our primary investment focus is on investment income to support our liabilities for insurance products as opposed to the generation of realized investment gains (losses), and a long-term focus is necessary to ma intain profitability over the life of the business. Realized investment gains (losses) depend on market conditions and do not necessarily relate to decisions regarding the underlying business of our segments. However, “income (loss) before net realized investment gains (losses), net of related amortization, and before income taxes” does not replace “income (loss) before income taxes” as a measure of overall profitability. We may experience
realized investment gains (losses), which will affect future earnings levels since our underlying business is long-term in nature and we need to earn the assumed interest rates on the investments backing our liabilities for insurance products to maintain the profitability of our business. In addition, management uses this non-GAAP financial measure in its budgeting process, financial analysis of segment performance and in assessing the allocation of resources. We believe these non-GAAP financial measures enhance an investor’s understanding of our financial performance and allows them to make more informed judgments about the Company as a whole. These measures also highlight operating trends that might not otherwise b e transparent. The table above reconciles the non-GAAP measure to the corresponding GAAP measure.
General: CNO is the top tier holding company for a group of insurance companies operating throughout the United States that develop, market and administer health insurance, annuity, individual life insurance and other insurance products. We distribute these products through our Bankers Life segment, which utilizes a career agency force, through our Colonial Penn segment, which utilizes direct response marketing and through our Washington National segment, which utilizes independent producers.
Bankers Life (dollars in millions)
| | | 2010 | | | 2009 | | | 2008 | |
| Premium collections: | | | | | | | | | |
| Annuities | | $ | 1,005.5 | | | $ | 1,060.4 | | | $ | 1,224.1 | |
| Medicare supplement and other supplemental health | | | 1,360.1 | | | | 1,711.7 | | | | 1,887.0 | |
| Life | | | 209.6 | | | | 228.8 | | | | 209.4 | |
| | | | | | | | | | | | | |
| Total collections | | $ | 2,575.2 | | | $ | 3,000.9 | | | $ | 3,320.5 | |
| | | | | | | | | | | | | |
| Average liabilities for insurance products: | | | | | | | | | | | | |
| Annuities: | | | | | | | | | | | | |
| Mortality based | | $ | 250.1 | | | $ | 250.9 | | | $ | 252.9 | |
| Fixed index | | | 1,833.6 | | | | 1,506.3 | | | | 1,203.0 | |
| Deposit based | | | 4,899.7 | | | | 4,789.9 | | | | 4,464.3 | |
| Health | | | 4,355.3 | | | | 4,122.1 | | | | 3,880.5 | |
| Life: | | | | | | | | | | | | |
| Interest sensitive | | | 412.9 | | | | 401.6 | | | | 385.9 | |
| Non-interest sensitive | | | 355.3 | | | | 407.2 | | | | 357.8 | |
| | | | | | | | | | | | | |
| Total average liabilities for insurance products, net of reinsurance ceded | | $ | 12,106.9 | | | $ | 11,478.0 | | | $ | 10,544.4 | |
| | | | | | | | | | | | | |
| Revenues: | | | | | | | | | | | | |
| Insurance policy income | | $ | 1,596.2 | | | $ | 1,959.2 | | | $ | 2,109.9 | |
| Net investment income: | | | | | | | | | | | | |
| General account invested assets | | | 719.3 | | | | 643.6 | | | | 617.1 | |
| Fixed index products | | | 32.6 | | | | 24.5 | | | | (49.4 | ) |
| Other special-purpose portfolios | | | 7.0 | | | | 10.0 | | | | (9.5 | ) |
| Fee revenue and other income | | | 12.8 | | | | 10.2 | | | | 11.0 | |
| | | | | | | | | | | | | |
| Total revenues | | | 2,367.9 | | | | 2,647.5 | | | | 2,679.1 | |
| | | | | | | | | | | | | |
| Expenses: | | | | | | | | | | | | |
| Insurance policy benefits | | | 1,376.5 | | | | 1,667.5 | | | | 1,879.9 | |
| Amounts added to policyholder account balances: | | | | | | | | | | | | |
| Annuity products and interest-sensitive life products other than fixed index products | | | 175.3 | | | | 183.1 | | | | 175.7 | |
| Fixed index products | | | 55.5 | | | | 54.4 | | | | 34.8 | |
| Amortization related to operations | | | 290.5 | | | | 267.9 | | | | 234.8 | |
| Interest expense on investment borrowings | | | 1.0 | | | | - | | | | - | |
| Other operating costs and expenses | | | 185.0 | | | | 196.6 | | | | 182.4 | |
| | | | | | | | | | | | | |
| Total benefits and expenses | | | 2,083.8 | | | | 2,369.5 | | | | 2,507.6 | |
| | | | | | | | | | | | | |
| Income before net realized investment gains (losses), net of related amortization and income taxes | | | 284.1 | | | | 278.0 | | | | 171.5 | |
| | | | | | | | | | | | | |
| Net realized investment gains (losses) | | | 62.1 | | | | (31.4 | ) | | | (116.7 | ) |
| Amortization related to net realized investment gains (losses) | | | (10.2 | ) | | | (.2 | ) | | | 15.8 | |
| | | | | | | | | | | | | |
| Net realized investment gains (losses), net of related amortization | | | 51.9 | | | | (31.6 | ) | | | (100.9 | ) |
| | | | | | | | | | | | | |
| Income before income taxes | | $ | 336.0 | | | $ | 246.4 | | | $ | 70.6 | |
(continued)
(continued from previous page)
| | | 2010 | | | 2009 | | | 2008 | |
| | | | | | | | | | |
| Health benefit ratios: | | | | | | | | | |
| All health lines: | | | | | | | | | |
| Insurance policy benefits | | $ | 1,206.5 | | | $ | 1,489.4 | | | $ | 1,709.4 | |
| Benefit ratio (a) | | | 88.33 | % | | | 87.0 | % | | | 91.3 | % |
| | | | | | | | | | | | | |
| Medicare supplement: | | | | | | | | | | | | |
| Insurance policy benefits | | $ | 505.6 | | | $ | 468.8 | | | $ | 452.3 | |
| Benefit ratio (a) | | | 70.9 | % | | | 70.7 | % | | | 70.8 | % |
| | | | | | | | | | | | | |
| PDP: | | | | | | | | | | | | |
| Insurance policy benefits | | $ | 52.7 | | | $ | 66.6 | | | $ | 62.3 | |
| Benefit ratio (a) | | | 77.7 | % | | | 84.7 | % | | | 92.9 | % |
| | | | | | | | | | | | | |
| PFFS: | | | | | | | | | | | | |
| Insurance policy benefits | | $ | (18.1 | ) | | $ | 318.2 | | | $ | 522.8 | |
| Benefit ratio (a) | | | N/A | | | | 87.0 | % | | | 96.4 | % |
| | | | | | | | | | | | | |
| Long-term care: | | | | | | | | | | | | |
| Insurance policy benefits | | $ | 666.3 | | | $ | 635.8 | | | $ | 672.0 | |
| Benefit ratio (a) | | | 113.7 | % | | | 105.2 | % | | | 107.6 | % |
| Interest-adjusted benefit ratio (b) | | | 73.0 | % | | | 67.9 | % | | | 74.0 | % |
____________________
| (a) | We calculate benefit ratios by dividing the related product’s insurance policy benefits by insurance policy income. |
| (b) | We calculate the interest-adjusted benefit ratio (a non-GAAP measure) for Bankers Life’s long-term care products by dividing such product’s insurance policy benefits less interest income on the accumulated assets backing the insurance liabilities by policy income. These are considered non-GAAP financial measures. A non-GAAP measure is a numerical measure of a company’s performance, financial position, or cash flows that excludes or includes amounts that are normally excluded or included in the most directly comparable measure calculated and presented in accordance with GAAP. |
These non-GAAP financial measures of “interest-adjusted benefit ratios” differ from “benefit ratios” due to the deduction of interest income on the accumulated assets backing the insurance liabilities from the product’s insurance policy benefits used to determine the ratio. Interest income is an important factor in measuring the performance of health products that are expected to be inforce for a longer duration of time, are not subject to unilateral changes in provisions (such as non-cancelable or guaranteed renewable contracts) and require the performance of various functions and services (including insurance protection) for an extended period of time. The net cash flows from long-term care products generally cause an accumulation of amounts in the early years of a policy (accounted f or as reserve increases) that will be paid out as benefits in later policy years (accounted for as reserve decreases). Accordingly, as the policies age, the benefit ratio will typically increase, but the increase in benefits will be partially offset by interest income earned on the accumulated assets. The interest-adjusted benefit ratio reflects the effects of the interest income offset. Since interest income is an important factor in measuring the performance of this product, management believes a benefit ratio that includes the effect of interest income is useful in analyzing product performance. We utilize the interest-adjusted benefit ratio in measuring segment performance because we believe that this performance measure is a better indicator of the ongoing businesses and trends in the business. However, the “interest-adjusted benefit ratio” does not replace the “benefit ratio” as a measure of current period benefits to curren t period insurance policy income. Accordingly, management reviews both “benefit ratios” and “interest-adjusted benefit ratios” when analyzing the financial results attributable to these products. The investment income earned on the accumulated assets backing Bankers Life’s long-term care reserves was $238.8 million, $225.1 million and $210.1 million in 2010, 2009 and 2008, respectively.
Total premium collections were $2,575.2 million in 2010, down 14 percent from 2009, and $3,000.9 million in 2009, down 9.6 percent from 2008. Premium collections include $1.1 million, $369.0 million and $542.4 million in 2010, 2009, and 2008, respectively, of premiums collected pursuant to the PFFS quota-share agreements with Coventry which were terminated or expired prior to 2010 and are described above under “Accounting for marketing and reinsurance agreements with Coventry”. See “Premium Collections” for further analysis of Bankers Life’s premium collections.
Average liabilities for insurance products, net of reinsurance ceded were $12.1 billion in 2010, up 5.5 percent from 2009, and $11.5 billion in 2009, up 8.9 percent from 2008. The increase in such liabilities was primarily due to increases in annuity and health reserves resulting from new sales of these products.
Insurance policy income is comprised of premiums earned on policies which provide mortality or morbidity coverage and fees and other charges assessed on other policies. Insurance policy income includes $365.7 million and $542.4 million in 2009 and 2008, respectively, of premium income from the PFFS quota-share agreements with Coventry which were terminated or expired prior to 2010 and are described above under “Accounting for marketing and reinsurance agreements with Coventry”.
Net investment income on general account invested assets (which excludes income on policyholder accounts) increased 12 percent, to $719.3 million, in 2010 and 4.3 percent, to $643.6 million, in 2009. The average balance of general account invested assets was $12.3 billion, $11.4 billion and $10.6 billion in 2010, 2009 and 2008, respectively. The average yield on these assets was 5.84 percent in 2010, 5.64 percent in 2009 and 5.83 percent in 2008. The increase in general account invested assets is primarily due to: (i) sales of our annuity and health products in recent periods; and (ii) the proceeds from collateralized borrowings from the FHLB pursuant to an investment borrowing program that commenced in September 2010.& #160; The increase in net investment income in 2010 reflects: (i) an increase in the average yield due to our reinvestment of short-term investments held in 2009 into longer-term securities; and (ii) the growth in general account invested assets.
Net investment income related to fixed index products represents the change in the estimated fair value of options which are purchased in an effort to hedge certain potential benefits accruing to the policyholders of our fixed index products. Our fixed index products are designed so that the investment income spread earned on the related insurance liabilities is expected to be more than adequate to cover the cost of the options and other costs related to these policies. Net investment income (loss) related to fixed index products was $21.1 million, $38.5 million and $(67.0) million in 2010, 2009 and 2008, respectively. Net investment income related to fixed index products also inc ludes income (loss) on trading securities which are held to act as hedges for embedded derivates related to fixed index products. Such trading account income (loss) was $11.5 million, $(14.0) million and $17.6 million in 2010, 2009 and 2008, respectively. Such amounts are generally offset by the corresponding charge (credit) to amounts added to policyholder account balances for fixed index products based on the change in value of the indices. Such income and related charges fluctuate based on the value of options embedded in the segment’s fixed index annuity policyholder account balances subject to this benefit and to the performance of the index to which the returns on such products are linked.
Net investment income on other special-purpose portfolios includes: (i) the income related to Company-owned life insurance (“COLI”) which was purchased as an investment vehicle to fund the deferred compensation plan for certain agents; and (ii) the change in fair value of a trading securities portfolio. The COLI assets are not assets of the deferred compensation plan, and as a result, are accounted for outside the plan and are recorded in the consolidated balance sheet as other invested assets. Changes in the cash surrender value (which approximates net realizable value) of the COLI assets are recorded as net investment income (loss) and totaled $5.0 million, $7.1 million and $(9.5) million in 2010, 2009 and 2008, resp ectively. We also recognized a death benefit of $2.9 million in 2009. The trading securities are carried at estimated fair value with changes in such value recognized as trading income. We recognized trading income of $2.0 million in 2010. There was no such trading income in 2009 or 2008.
Fee revenue and other income was $12.8 million in 2010, compared to $10.2 million in 2009 and $11.0 million in 2008. We recognized fee income of $11.4 million, $9.2 million and $9.9 million in 2010, 2009 and 2008, respectively, pursuant to the agreements described above under “Accounting for marketing and reinsurance agreements with Coventry”.
Insurance policy benefits fluctuated as a result of the factors summarized below for benefit ratios. Benefit ratios are calculated by dividing the related insurance product’s insurance policy benefits by insurance policy income.
The Medicare supplement business consists of both individual and group policies. Government regulations generally require us to attain and maintain a ratio of total benefits incurred to total premiums earned (excluding changes in policy benefit reserves), after three years from the original issuance of the policy and over the lifetime of the policy, of not less than 65 percent on individual products and not less than 75 percent on group products, as determined in accordance with statutory accounting principles. Since the insurance product liabilities we establish for Medicare supplement business are subject to significant estimates, the ultimate claim liability we incur for a particular period is likely to be different than our initial estimate. Our insurance policy benefits reflected reserve redundancies from prior years of $8.1 million, $7.7 million and $.5 million in 2010, 2009 and 2008, respectively. Excluding the effects of prior year claim reserve redundancies, our benefit ratios would have been 72.1 percent, 71.9 percent and 70.8 percent in 2010, 2009 and 2008, respectively. The increase in the benefit ratios reflects unfavorable claim experience.
The insurance policy benefits on our PDP and PFFS business result from our quota-share reinsurance agreements with Coventry. Coventry decided to cease selling PFFS plans effective January 1, 2010. Effective January 1, 2010, the Company no longer assumes the underwriting risk related to PFFS business. In the third quarter of 2009, Bankers Life began offering Humana’s Medicare Advantage plans to its policyholders and consumers nationwide through its career agency force and receives marketing fees based on sales. Insurance margins (insurance policy income less insurance policy benefits) on the PDP business were $15.2 million, $12.0 million and $4.8 million in 2010, 2009 and 2008, respectively. Insurance margins on the PFFS business were $17.4 million, $47.5 million and $19.6 milli on in 2010, 2009 and 2008, respectively. The increase in margin in 2009 is primarily due to increases in our share of risk adjustment premium payments made by the Centers for Medicare and Medicaid Services. Both 2010 and 2009 reflect favorable reserve developments. During 2008, we recognized a $3 million increase in insurance policy benefits due to changes in our estimates of prior period claim costs on the PFFS business we assumed from Coventry.
The net cash flows from our long-term care products generally cause an accumulation of amounts in the early years of a policy (accounted for as reserve increases) which will be paid out as benefits in later policy years (accounted for as reserve decreases). Accordingly, as the policies age, the benefit ratio typically increases, but the increase in reserves is partially offset by investment income earned on the accumulated assets. The benefit ratio on our long-term care business in the Bankers Life segment was 113.7 percent, 105.2 percent and 107.6 percent in 2010, 2009 and 2008, respectively. The interest-adjusted benefit ratio on this business was 73.0 percent, 67.9 percent and 74.0 percent in 2010, 2009 and 2008, respectively. Since the insurance product liabilities we establish for long-ter m care business are subject to significant estimates, the ultimate claim liability we incur for a particular period is likely to be different than our initial estimate. Our insurance policy benefits reflected reserve redundancies (deficiencies) from prior years of $26.3 million, $10.0 million and $(6.0) million in 2010, 2009 and 2008, respectively. Excluding the effects of prior year claim reserve redundancies (deficiencies), our benefit ratios would have been 118.2 percent, 106.9 percent and 106.7 percent in 2010, 2009 and 2008, respectively. The benefit ratio for 2009 reflected a reduction in liabilities for insurance products of approximately $41.9 million due to our estimates of: (i) the reduction in liabilities for policyholders choosing to lapse their policies rather than paying higher rates; (ii) the reduction in liabilities for policyholders choosing to reduce their coverages to achieve a lower cost; offset by (iii) the increase in the reserves related to w aiver of premium benefits to reflect the higher premiums after the rate increase. The aforementioned reduction in liabilities was partially offset by increased amortization of insurance acquisition costs of $4.7 million resulting from the increase in lapses. When policies lapse, active life reserves for such lapsed policies are released, resulting in decreased insurance policy benefits (although such decrease is somewhat offset by additional amortization expense). The benefit ratio in 2010 increased due to lower re-rate activity.
Over the past several years, we have implemented rate increases in the long-term care block in the Bankers Life segment. In the fourth quarter of 2009, additional filings were initiated in states that had not granted approval of the full amount of the previous rate increase requests. Approximately $13 million of additional rate increases have been approved as of December 31, 2010. All expected approvals for these filings have been received. In October 2010, we commenced additional rate increase filings on certain long-term care blocks. We expect to implement rate increases of approximately $35 million after approval from all states. Approximately $5.5 million of approvals had been received as of December 31, 2010.
Amounts added to policyholder account balances for annuity products and interest-sensitive life products were $175.3 million, $183.1 million and $175.7 million in 2010, 2009 and 2008, respectively. The weighted average crediting rates for these products was 3.3 percent, 3.5 percent and 3.6 percent in 2010, 2009 and 2008, respectively. The average liabilities of the deposit-based annuity block was $4.9 billion, $4.8 billon and $4.5 billion in 2010, 2009 and 2008, respectively.
Amounts added to fixed index products based on change in value of the indices will generally fluctuate with the corresponding related investment income accounts described above. Such corresponding relationship did not exist in 2008 due to a number of factors including variations in option costs and changes in the value of the trading account securities which did not correspond to the changes in the value of the embedded derivatives related to these products.
Amortization related to operations includes amortization of deferred acquisition costs and the present value of future profits (collectively referred to as “amortization of insurance acquisition costs”). Insurance acquisition costs are generally amortized either: (i) in relation to the estimated gross profits for universal life and investment-type products; or (ii) in relation to actual and expected premium revenue for other products. In addition, for universal life and investment-type products, we are required to adjust the total amortization recorded to date through the statement of operations if actual experience or other evidence suggests that earlier estimates of future gross profits should be revised. Accordingly, amortization for universal life and investment-type products is dependent on the profits realized during the period and on our expectation of future profits. For other products, we amortize insurance acquisition costs in relation to actual and expected premium revenue, and amortization is only adjusted if expected premium revenue changes or if we determine the balance of
these costs is not recoverable from future profits. Bankers Life’s amortization expense was $290.5 million, $267.9 million and $234.8 million in 2010, 2009 and 2008, respectively. Amortization expense related to our annuity block of business increased $46.9 million in 2009, as compared to 2008, partially due to changes in our lapse assumptions. Amortization expense related to our annuity block continued to increase in 2010 due to higher gross profits on this business. We limit the total amortization adjustments resulting from losses on a block of business issued in a particular year to an amount which would not result in the balance of insurance acquisition costs exceeding the total of costs capitalized plus interest. During 2009, amortization expense related to annuities decrea sed by $5.9 million due to this limitation. During the first six months of 2008, we experienced higher lapses than we anticipated on our Medicare supplement products. These lapses reduced our estimates of future expected premium income and, accordingly, we recognized additional amortization expense of $12.2 million in 2008. We believe such increases were partially related to competition from Medicare Advantage products.
Interest expense on investment borrowings represents interest expense on collateralized borrowings as further described in the note to the consolidated financial statements entitled “Summary of Significant Accounting Policies - Investment Borrowings”.
Other operating costs and expenses in our Bankers Life segment were $185.0 million in 2010, down 5.9 percent from 2009 and were $196.6 million in 2009, up 7.8 percent from 2008. Other operating costs and expenses include the following (dollars in millions):
| | | 2010 | | | 2009 | | | 2008 | |
| Expenses related to the marketing and quota-share agreements with Coventry | | $ | 13.6 | | | $ | 28.6 | | | $ | 40.8 | |
| Commission expense | | | 15.1 | | | | 18.0 | | | | 20.5 | |
| Other operating expenses | | | 156.3 | | | | 150.0 | | | | 121.1 | |
| | | | | | | | | | | | | |
| Total | | $ | 185.0 | | | $ | 196.6 | | | $ | 182.4 | |
Net realized investment losses fluctuated each period. During 2010, net realized investment gains in this segment included $116.8 million of net gains from the sales of investments (primarily fixed maturities) and $54.7 million of writedowns of investments for other than temporary declines in fair value recognized through net income ($50.7 million, prior to the $(4.0) million of impairment losses recognized through accumulated other comprehensive income (loss)). During 2009, net realized investment losses in this segment included $65.0 million of net gains from the sales of investments (primarily fixed maturities) and $96.4 million of writedowns of investments for other than temporary declines in fair value recognized through net income ($18 2.2 million, prior to the $85.8 million of impairment losses recognized through accumulated other comprehensive income (loss)). During 2008, net realized investment losses in this segment included $31.1 million of net losses from the sales of investments (primarily fixed maturities) and $85.6 million of writedowns of investments resulting from declines in fair value that we concluded were other than temporary.
Amortization related to net realized investment losses is the increase or decrease in the amortization of insurance acquisition costs which results from realized investment gains or losses. When we sell securities which back our universal life and investment-type products at a gain (loss) and reinvest the proceeds at a different yield, we increase (reduce) the amortization of insurance acquisition costs in order to reflect the change in estimated gross profits due to the gains (losses) realized and the resulting effect on estimated future yields. Sales of fixed maturity investments resulted in an increase (decrease) in the amortization of insurance acquisition costs of $10.2 million, $.2 million and $(15.8) million in 2010, 2009 and 2008, re spectively.
Washington National (dollars in millions)
| | | 2010 | | | 2009 | | | 2008 | |
| | | | | | | | | | |
| Premium collections: | | | | | | | | | |
| Medicare supplement and other supplemental health | | $ | 564.9 | | | $ | 566.3 | | | $ | 584.9 | |
| Life | | | 16.2 | | | | 30.1 | | | | 35.7 | |
| | | | | | | | | | | | | |
| Total collections | | $ | 581.1 | | | $ | 596.4 | | | $ | 620.6 | |
| | | | | | | | | | | | | |
| Average liabilities for insurance products: | | | | | | | | | | | | |
| Medicare supplement and other supplemental health | | $ | 2,470.1 | | | $ | 2,518.2 | | | $ | 2,510.3 | |
| Non-interest sensitive life | | | 206.7 | | | | 376.7 | | | | 493.0 | |
| | | | | | | | | | | | | |
| Total average liabilities for insurance products, net of reinsurance ceded | | $ | 2,676.8 | | | $ | 2,894.9 | | | $ | 3,003.3 | |
| Revenues: | | | | | | | | | | | | |
| Insurance policy income | | $ | 581.0 | | | $ | 597.9 | | | $ | 617.2 | |
| Net investment income: | | | | | | | | | | | | |
| General account invested assets | | | 184.2 | | | | 191.2 | | | | 197.3 | |
Trading account income related to reinsurer accounts and other portfolios | | | 2.5 | | | | 4.2 | | | | (6.7 | ) |
| Change in value of embedded derivatives related to modified coinsurance agreements | | | (1.3 | ) | | | (6.5 | ) | | | 6.7 | |
| Fee revenue and other income | | | 1.1 | | | | 1.5 | | | | .7 | |
| | | | | | | | | | | | | |
| Total revenues | | | 767.5 | | | | 788.3 | | | | 815.2 | |
| | | | | | | | | | | | | |
| Expenses: | | | | | | | | | | | | |
| Insurance policy benefits | | | 450.6 | | | | 467.0 | | | | 473.2 | |
| Amortization related to operations | | | 56.9 | | | | 53.9 | | | | 54.0 | |
| Other operating costs and expenses | | | 155.4 | | | | 156.5 | | | | 166.9 | |
| | | | | | | | | | | | | |
| Total benefits and expenses | | | 662.9 | | | | 677.4 | | | | 694.1 | |
| | | | | | | | | | | | | |
| Income before net realized investment losses | | | 104.6 | | | | 110.9 | | | | 121.1 | |
| | | | | | | | | | | | | |
| Net realized investment losses | | | (7.4 | ) | | | (2.6 | ) | | | (16.2 | ) |
| | | | | | | | | | | | | |
| Income before income taxes | | $ | 97.2 | | | $ | 108.3 | | | $ | 104.9 | |
| Health benefit ratios: | | | | | | | | | |
| All health lines: | | | | | | | | | |
| Insurance policy benefits | | $ | 432.5 | | | $ | 433.3 | | | $ | 432.4 | |
| Benefit ratio (a) | | | 76.7 | % | | | 76.2 | % | | | 74.3 | % |
| | | | | | | | | | | | | |
| Medicare supplement: | | | | | | | | | | | | |
| Insurance policy benefits | | $ | 106.6 | | | $ | 124.0 | | | $ | 139.8 | |
| Benefit ratio (a) | | | 67.3 | % | | | 68.3 | % | | | 68.4 | % |
| | | | | | | | | | | | | |
| Supplemental health: | | | | | | | | | | | | |
| Insurance policy benefits | | $ | 322.2 | | | $ | 303.4 | | | $ | 285.4 | |
| Benefit ratio (a) | | | 80.4 | % | | | 79.5 | % | | | 77.1 | % |
| Interest-adjusted benefit ratio (b) | | | 49.2 | % | | | 46.0 | % | | | 43.3 | % |
| | | | | | | | | | | | | |
| Other: | | | | | | | | | | | | |
| Insurance policy benefits | | $ | 3.7 | | | $ | 5.9 | | | $ | 7.2 | |
| Benefit ratio (a) | | | 76.1 | % | | | 110.2 | % | | | 101.1 | % |
____________________| (a) | We calculate benefit ratios by dividing the related product’s insurance policy benefits by insurance policy income. |
| (b) | We calculate the interest-adjusted benefit ratio (a non-GAAP measure) for Washington National’s supplemental health products by dividing such product’s insurance policy benefits less interest income on the accumulated assets backing the insurance liabilities by policy income. These are considered non-GAAP financial measures. A non-GAAP measure is a numerical measure of a company’s performance, financial position, or cash flows that excludes or includes amounts that are normally excluded or included in the most directly comparable measure calculated and presented in accordance with GAAP. |
These non-GAAP financial measures of “interest-adjusted benefit ratios” differ from “benefit ratios” due to the deduction of interest income on the accumulated assets backing the insurance liabilities from the product’s insurance policy benefits used to determine the ratio. Interest income is an important factor in measuring the performance of health products that are expected to be inforce for a longer duration of time, are not subject to unilateral changes in provisions (such as non-cancelable or guaranteed renewable contracts) and require the performance of various functions and services (including insurance protection) for an extended period of time. The net cash flows from supplemental health products generally cause an accumulation of amounts in the early years of a policy (accoun ted for as reserve increases) that will be paid out as benefits in later policy years (accounted for as reserve decreases). Accordingly, as the policies age, the benefit ratio will typically increase, but the increase in benefits will be partially offset by interest income earned on the accumulated assets. The interest-adjusted benefit ratio reflects the effects of the interest income offset. Since interest income is an important factor in measuring the performance of these products, management believes a benefit ratio that includes the effect of interest income is useful in analyzing product performance. We utilize the interest-adjusted benefit ratio in measuring segment performance because we believe that this performance measure is a better indicator of the ongoing businesses and trends in the business. However, the “interest-adjusted benefit ratio” does not replace the “benefit ratio” as a measure of current period benefits to current period insurance policy income. Accordingly, management reviews both “benefit ratios” and “interest-adjusted benefit ratios” when analyzing the financial results attributable to these products. The investment income earned on the accumulated assets backing the supplemental health reserves was $125.1 million, $127.7 million and $125.2 million in 2010, 2009 and 2008, respectively.
Total premium collections were $581.1 million in 2010, down 2.6 percent from 2009, and $596.4 million in 2009, down 3.9 percent from 2008. See “Premium Collections” for further analysis of fluctuations in premiums collected by product.
Average liabilities for insurance products, net of reinsurance ceded were $2.7 billion in 2010, down 7.5 percent from 2009, and $2.9 billion in 2009, down 3.6 percent from 2008. The decrease in such liabilities in 2010 and 2009 was primarily due to the coinsurance transaction with Wilton Re completed in September 2009, as further discussed in the note to the consolidated financial statements entitled “Summary of Significant Accounting Policies - Reinsurance”, and policyholder redemptions and lapses exceeding new sales.
Insurance policy income is comprised of premiums earned on traditional insurance policies which provide mortality or morbidity coverage and fees and other charges assessed on other policies. The decrease in insurance policy income is primarily due to lower premiums from our life insurance block reflecting the impact of the completion of the coinsurance transaction with Wilton Re in 2009. See “Premium Collections” for further analysis.
Net investment income on general account invested assets (which excludes income on policyholder and reinsurer accounts) decreased 3.7 percent, to $184.2 million, in 2010 and 3.1 percent, to $191.2 million, in 2009. The average balance of general account invested assets was $3.1 billion, $3.3 billion and $3.4 billion in 2010, 2009 and 2008, respectively. The average yield on these assets was 5.90 percent in 2010, 5.71 percent in 2009 and 5.87 percent in 2008. The increase in yield in 2010 primarily resulted from shifts among asset classes to increase income. The reduction in average yield in 2009 reflects lower new money rates due to tighter credit spreads for many investments.
Trading account income related to reinsurer accounts and other portfolios primarily represents the income on trading securities which are held to act as hedges for embedded derivatives related to certain modified coinsurance agreements. The income on our trading account securities is designed to substantially offset the change in value of embedded derivatives related to modified coinsurance agreements described below. In addition, in 2010, we recognized trading income of $.8 million from the change in fair value of a trading securities portfolio.
Change in value of embedded derivatives related to modified coinsurance agreements is described in the note to our consolidated financial statements entitled “Summary of Significant Accounting Policies - Accounting for Derivatives.” We have transferred the specific block of investments related to these agreements to our trading securities account, which we
carry at estimated fair value with changes in such value recognized as trading account income. The change in the value of the embedded derivatives has largely been offset by the change in value of the trading securities.
Insurance policy benefits were affected by: (i) lower benefits from our life insurance block including the impact of the completion of the coinsurance transaction with Wilton Re in 2009; and (ii) the factors summarized below for benefit ratios. Benefit ratios are calculated by dividing the related insurance product’s insurance policy benefits by insurance policy income.
The benefit ratios on Washington National’s Medicare supplement products have been impacted by increases in policyholder lapses following our premium rate increase actions and competition from companies offering Medicare Advantage products. We establish active life reserves for these policies, which are in addition to amounts required for incurred claims. When policies lapse, active life reserves for such lapsed policies are released, resulting in decreased insurance policy benefits (although such decrease is substantially offset by additional amortization expense). In addition, the insurance product liabilities we establish for our Medicare supplement business are subject to significant estimates and the ultimate cl aim liability we incur for a particular period is likely to be different than our initial estimate. Our insurance policy benefits reflected claim reserve redundancies from prior years of $4.2 million, $4.6 million and $2.5 million in 2010, 2009 and 2008, respectively. Excluding the effects of prior year claim reserve redundancies, our benefit ratios for the Medicare supplement block would have been 69.9 percent, 70.8 percent and 69.6 percent in 2010, 2009 and 2008, respectively. Governmental regulations generally require us to attain and maintain a ratio of total benefits incurred to total premiums earned (excluding changes in policy benefit reserves), after three years from the original issuance of the policy and over the lifetime of the policy, of not less than 65 percent on these products, as determined in accordance with statutory accounting principles. Insurance margins (insurance policy income less insurance policy benefits) on these products were $51.8 milli on, $57.6 million and $64.6 million in 2010, 2009 and 2008, respectively. Such decreases are primarily due to lower sales, partially offset by favorable claim experience.
Washington National’s supplemental health products (including specified disease, accident and hospital indemnity products) generally provide fixed or limited benefits. For example, payments under cancer insurance policies are generally made directly to, or at the direction of, the policyholder following diagnosis of, or treatment for, a covered type of cancer. Approximately three-fourths of our supplemental health policies inforce (based on policy count) are sold with return of premium or cash value riders. The return of premium rider generally provides that after a policy has been inforce for a specified number of years or upon the policyholder reaching a specified age, we will pay to the policyholder, or a beneficiary under the policy, the aggregate amount of all premiums paid under the policy, wi thout interest, less the aggregate amount of all claims incurred under the policy. The cash value rider is similar to the return of premium rider, but also provides for payment of a graded portion of the return of premium benefit if the policy terminates before the return of premium benefit is earned. Accordingly, the net cash flows from these products generally result in the accumulation of amounts in the early years of a policy (reflected in our earnings as reserve increases) which will be paid out as benefits in later policy years (reflected in our earnings as reserve decreases which offset the recording of benefit payments). As the policies age, the benefit ratio will typically increase, but the increase in benefits will be partially offset by investment income earned on the accumulated assets. The benefit ratio will fluctuate depending on the claim experience during the year. Insurance margins (insurance policy income less insurance policy benefits) on these products were $78.6 million, $78.2 million and $85.0 million in 2010, 2009 and 2008, respectively. The increase in the margin in 2008 includes a $12 million correction to insurance policy benefits resulting from our material control weakness remediation procedures.
The benefit ratios on Washington National’s other products are subject to fluctuations due to the smaller size of these blocks of business.
Amortization related to operations includes amortization of insurance acquisition costs. Insurance acquisition costs are generally amortized in relation to actual and expected premium revenue, and amortization is only adjusted if expected premium revenue changes or if we determine the balance of these costs is not recoverable from future profits. Such amounts were generally consistent with the related premium revenue. A revision to our current assumptions could result in increases or decreases to amortization expense in future periods.
Other operating costs and expenses were $155.4 million, $156.5 million and $166.9 million in 2010, 2009 and 2008, respectively. Other operating costs and expenses include commission expense of $64.8 million, $63.6 million and $67.5 million in 2010, 2009 and 2008, respectively.
Net realized investment gains (losses) fluctuate each period. During 2010, net realized investment losses in this segment included $23.5 million of net gains from the sales of investments (primarily fixed maturities) and $30.9 million of writedowns of investments for other than temporary declines in fair value recognized through net income ($31.1 million, prior to the $.2 million of impairment losses recognized through accumulated other comprehensive income (loss)). During
2009, net realized investment losses in this segment included $25.7 million of net gains from the sales of investments (primarily fixed maturities) and $28.3 million of writedowns of investments for other than temporary declines in fair value recognized through net income ($64.4 million, prior to the $36.1 million of impairment losses recognized through accumulated other comprehensive income (loss)). During 2008, net realized investment losses included $3.9 million of net gains from the sales of investments (primarily fixed maturities) and $20.1 million of writedowns of investments resulting from declines in fair value that we concluded were other than temporary.
Colonial Penn (dollars in millions)
| | | 2010 | | | 2009 | | | 2008 | |
| | | | | | | | | | |
| Premium collections: | | | | | | | | | |
| Life | | $ | 187.7 | | | $ | 187.3 | | | $ | 174.1 | |
| Supplemental health | | | 6.4 | | | | 7.5 | | | | 8.9 | |
| | | | | | | | | | | | | |
| Total collections | | $ | 194.1 | | | $ | 194.8 | | | $ | 183.0 | |
| | | | | | | | | | | | | |
| Average liabilities for insurance products: | | | | | | | | | | | | |
| Annuities-mortality based | | $ | 79.4 | | | $ | 81.7 | | | $ | 85.9 | |
| Health | | | 17.6 | | | | 19.1 | | | | 20.7 | |
| Life: | | | | | | | | | | | | |
| Interest sensitive | | | 21.3 | | | | 23.2 | | | | 25.0 | |
| Non-interest sensitive | | | 579.7 | | | | 569.6 | | | | 562.9 | |
| | | | | | | | | | | | | |
| Total average liabilities for insurance products, net of reinsurance ceded | | $ | 698.0 | | | $ | 693.6 | | | $ | 694.5 | |
| | | | | | | | | | | | | |
| Revenues: | | | | | | | | | | | | |
| Insurance policy income | | $ | 194.9 | | | $ | 196.1 | | | $ | 184.8 | |
| Net investment income: | | | | | | | | | | | | |
| General account invested assets | | | 39.3 | | | | 38.7 | | | | 40.1 | |
| Trading account income related to reinsurer accounts | | | - | | | | - | | | | (.5 | ) |
| Fee revenue and other income | | | .7 | | | | .9 | | | | 1.8 | |
| | | | | | | | | | | | | |
| Total revenues | | | 234.9 | | | | 235.7 | | | | 226.2 | |
| | | | | | | | | | | | | |
| Expenses: | | | | | | | | | | | | |
| Insurance policy benefits | | | 143.8 | | | | 141.9 | | | | 138.2 | |
| Amounts added to annuity and interest-sensitive life product account balances | | | 1.0 | | | | 1.1 | | | | 1.2 | |
| Amortization related to operations | | | 33.3 | | | | 33.3 | | | | 32.0 | |
| Other operating costs and expenses | | | 30.3 | | | | 30.0 | | | | 29.6 | |
| | | | | | | | | | | | | |
| Total benefits and expenses | | | 208.4 | | | | 206.3 | | | | 201.0 | |
| | | | | | | | | | | | | |
| Income before net realized investment gains (losses) and income taxes | | | 26.5 | | | | 29.4 | | | | 25.2 | |
| Net realized investment gains (losses) | | | 6.6 | | | | 4.5 | | | | (1.6 | ) |
| | | | | | | | | | | | | |
| Income before income taxes | | $ | 33.1 | | | $ | 33.9 | | | $ | 23.6 | |
Total premium collections decreased .4 percent, to $194.1 million, in 2010 and increased 6.4 percent, to $194.8 million, in 2009. See “Premium Collections” for further analysis of Colonial Penn’s premium collections.
Average liabilities for insurance products, net of reinsurance ceded, did not fluctuate significantly during the three years ended December 31, 2010.
Insurance policy income is comprised of premiums earned on policies which provide mortality or morbidity coverage and fees and other charges assessed on other policies. In 2009, insurance policy income includes the recognition of a $3.4
million final distribution and commutation amount following the termination of a group insurance pool that Colonial Penn previously participated in. Insurance policy income in the 2010 and 2009 periods also reflects the growth in this segment.
Net investment income on general account invested assets (which excludes income on policyholder and reinsurer accounts) did not fluctuate significantly during the three years ended December 31, 2010. The average balance of general account invested assets was $662.8 million in 2010, $659.9 million in 2009 and $676.0 million in 2008. The average yield on these assets was 5.93 percent in 2010, 5.86 percent in 2009 and 5.94 percent in 2008.
Trading account income related to reinsurer accounts represented the income on trading securities, which were designed to act as hedges for embedded derivatives related to a modified coinsurance agreement. The income on our trading account securities was designed to be substantially offset by the change in value of embedded derivatives related to a modified coinsurance agreement. As a result of the recapture of the modified coinsurance agreement in the fourth quarter of 2007, such trading account securities were sold in the first quarter of 2008.
Insurance policy benefits fluctuated as a result of the growth in this segment in recent periods.
Amortization related to operations includes amortization of insurance acquisition costs. Insurance acquisition costs in the Colonial Penn segment are amortized in relation to actual and expected premium revenue, and amortization is only adjusted if expected premium revenue changes or if we determine the balance of these costs is not recoverable from future profits. Such amounts were generally consistent with the related premium revenue and gross profits for such periods and the assumptions we made when we established the present value of future profits. A revision to our current assumptions could result in increases or decreases to amortization expense in future periods.
Other operating costs and expenses in our Colonial Penn segment did not fluctuate significantly during the three years ended December 31, 2010.
Net realized investment gains (losses) fluctuated each period. During 2010, net realized investment gains in this segment included $9.0 million of net gains from the sales of investments (primarily fixed maturities) and $2.4 million of writedowns of investments for other than temporary declines in fair value recognized through net income ($2.7 million, prior to the $.3 million of impairment losses recognized through accumulated other comprehensive income (loss)). During 2009, net realized investment gains in this segment included $8.7 million of net gains from the sales of investments (primarily fixed maturities) and $4.2 million of writedowns of investments for other than temporary declines in fair value recognized through net income ($4.6 million, prior to the $.4 million of impairment losses recognized through accumulated other comprehensive income (loss)). During 2008, net realized investment losses in this segment included $.1 million of net gains from the sales of investments (primarily fixed maturities) and $1.7 million of writedowns of investments resulting from declines in fair value that we concluded were other than temporary.
Other CNO Business (dollars in millions)
| | | 2010 | | | 2009 | | | 2008 | |
| | | | | | | | | | |
| Premium collections: | | | | | | | | | |
| Annuities | | $ | 16.4 | | | $ | 78.4 | | | $ | 129.8 | |
| Other health | | | 31.7 | | | | 34.1 | | | | 36.9 | |
| Life | | | 191.6 | | | | 210.2 | | | | 234.1 | |
| | | | | | | | | | | | | |
| Total collections | | $ | 239.7 | | | $ | 322.7 | | | $ | 400.8 | |
| | | | | | | | | | | | | |
| Average liabilities for insurance products: | | | | | | | | | | | | |
| Annuities: | | | | | | | | | | | | |
| Mortality based | | $ | 210.5 | | | $ | 215.2 | | | $ | 220.7 | |
| Fixed index | | | 713.8 | | | | 778.5 | | | | 891.0 | |
| Deposit based | | | 670.9 | | | | 661.5 | | | | 752.6 | |
| Separate accounts | | | 16.7 | | | | 18.2 | | | | 23.6 | |
| Other health | | | 480.0 | | | | 485.9 | | | | 482.8 | |
| Life: | | | | | | | | | | | | |
| Interest sensitive | | | 2,585.5 | | | | 2,777.2 | | | | 2,945.5 | |
| Non-interest sensitive | | | 834.1 | | | | 862.7 | | | | 900.8 | |
| | | | | | | | | | | | | |
| Total average liabilities for insurance products, net of reinsurance ceded | | $ | 5,511.5 | | | $ | 5,799.2 | | | $ | 6,217.0 | |
| Revenues: | | | | | | | | | | | | |
| Insurance policy income | | $ | 297.9 | | | $ | 340.4 | | | $ | 341.7 | |
| Net investment income: | | | | | | | | | | | | |
| General account invested assets | | | 352.1 | | | | 357.1 | | | | 393.8 | |
| Fixed index products | | | 9.8 | | | | 7.0 | | | | (28.4 | ) |
| Trading account income related to policyholder accounts | | | 2.7 | | | | 7.8 | | | | (10.2 | ) |
| Fee revenue and other income | | | - | | | | - | | | | 1.0 | |
| | | | | | | | | | | | | |
| Total revenues | | | 662.5 | | | | 712.3 | | | | 697.9 | |
| | | | | | | | | | | | | |
| Expenses: | | | | | | | | | | | | |
| Insurance policy benefits | | | 367.6 | | | | 376.6 | | | | 349.2 | |
| Amounts added to policyholder account balances: | | | | | | | | | | | | |
| Annuity products and interest-sensitive life products other than fixed index products | | | 127.6 | | | | 138.8 | | | | 152.1 | |
| Fixed index products | | | 25.8 | | | | 36.3 | | | | 8.2 | |
| Amortization related to operations | | | 51.6 | | | | 81.6 | | | | 68.6 | |
| Interest expense on investment borrowings | | | 20.0 | | | | 20.5 | | | | 22.4 | |
| Other operating costs and expenses | | | 81.4 | | | | 102.1 | | | | 97.2 | |
| | | | | | | | | | | | | |
| Total benefits and expenses | | | 674.0 | | | | 755.9 | | | | 697.7 | |
| | | | | | | | | | | | | |
| Income (loss) before net realized investment losses, net of related amortization and income taxes | | | (11.5 | ) | | | (43.6 | ) | | | .2 | |
| | | | | | | | | | | | | |
| Net realized investment losses | | | (27.6 | ) | | | (23.6 | ) | | | (77.1 | ) |
| Amortization related to net realized investment losses | | | (1.3 | ) | | | 4.2 | | | | 5.7 | |
Net realized investment losses, net of related amortization | | | (28.9 | ) | | | (19.4 | ) | | | (71.4 | ) |
| | | | | | | | | | | | | |
| Loss before income taxes | | $ | (40.4 | ) | | $ | (63.0 | ) | | $ | (71.2 | ) |
(continued)
(continued from previous page)
| | | 2010 | | | 2009 | | | 2008 | |
| | | | | | | | | | |
| Health benefit ratios: | | | | | | | | | |
| All health lines: | | | | | | | | | |
| Insurance policy benefits | | $ | 65.7 | | | $ | 62.7 | | | $ | 61.9 | |
| Benefit ratio (a) | | | 202.3 | % | | | 178.9 | % | | | 163.6 | % |
| | | | | | | | | | | | | |
| Long-term care: | | | | | | | | | | | | |
| Insurance policy benefits | | $ | 63.0 | | | $ | 59.9 | | | $ | 58.7 | |
| Benefit ratio (a) | | | 210.8 | % | | | 186.7 | % | | | 169.6 | % |
| Interest-adjusted benefit ratio (b) | | | 123.8 | % | | | 107.9 | % | | | 93.5 | % |
| | | | | | | | | | | | | |
| Other: | | | | | | | | | | | | |
| Insurance policy benefits | | $ | 2.7 | | | $ | 2.8 | | | $ | 3.2 | |
| Benefit ratio (a) | | | 104.2 | % | | | 95.5 | % | | | 99.3 | % |
____________________
| (a) | We calculate benefit ratios by dividing the related product’s insurance policy benefits by insurance policy income. |
| (b) | We calculate the interest-adjusted benefit ratio (a non-GAAP measure) for long-term care products in our Other CNO Business segment by dividing such product’s insurance policy benefits less interest income on the accumulated assets backing the insurance liabilities by policy income. These are considered non-GAAP financial measures. A non-GAAP measure is a numerical measure of a company’s performance, financial position, or cash flows that excludes or includes amounts that are normally excluded or included in the most directly comparable measure calculated and presented in accordance with GAAP. |
These non-GAAP financial measures of “interest-adjusted benefit ratios” differ from “benefit ratios” due to the deduction of interest income on the accumulated assets backing the insurance liabilities from the product’s insurance policy benefits used to determine the ratio. Interest income is an important factor in measuring the performance of health products that are expected to be inforce for a longer duration of time, are not subject to unilateral changes in provisions (such as non-cancelable or guaranteed renewable contracts) and require the performance of various functions and services (including insurance protection) for an extended period of time. The net cash flows from long-term care products generally cause an accumulation of amounts in the early years of a policy (accounted f or as reserve increases) that will be paid out as benefits in later policy years (accounted for as reserve decreases). Accordingly, as the policies age, the benefit ratio will typically increase, but the increase in benefits will be partially offset by interest income earned on the accumulated assets. The interest-adjusted benefit ratio reflects the effects of the interest income offset. Since interest income is an important factor in measuring the performance of these products, management believes a benefit ratio that includes the effect of interest income is useful in analyzing product performance. We utilize the interest-adjusted benefit ratio in measuring segment performance because we believe that this performance measure is a better indicator of the ongoing businesses and trends in the business. However, the “interest-adjusted benefit ratio” does not replace the “benefit ratio” as a measure of current period benefits to curr ent period insurance policy income. Accordingly, management reviews both “benefit ratios” and “interest-adjusted benefit ratios” when analyzing the financial results attributable to these products. The investment income earned on the accumulated assets backing the long-term care reserves was $26.0 million, $25.2 million and $26.3 million in 2010, 2009 and 2008, respectively.
Total premium collections were $239.7 million in 2010, down 26 percent from 2009, and $322.7 million in 2009, down 19 percent from 2008. The decrease in collected premiums was primarily due to policyholder redemptions and lapses and lower life insurance premiums subsequent to the completion of the coinsurance transaction with Wilton Re in 2009. See “Premium Collections” for further analysis of fluctuations in premiums collected by product.
Average liabilities for insurance products, net of reinsurance ceded were $5.5 billion in 2010, down 5.0 percent from 2009, and $5.8 billion in 2009, down 6.7 percent from 2008. The decreases in such liabilities were primarily due to: (i) the coinsurance transaction with Wilton Re completed in September 2009, as further discussed in the note to the consolidated financial statements entitled “Summary of Significant Accounting Policies - Reinsurance”; and (ii) policyholder redemptions and lapses.
Insurance policy income is comprised of policyholder charges on our interest-sensitive products and premiums earned on traditional insurance policies which provide mortality or morbidity coverage. The decrease in insurance policy income is
primarily due to lower policyholder charges and premiums from our life insurance block including the impact of the completion of the coinsurance transaction with Wilton Re in 2009. See “Premium Collections” for further analysis.
Net investment income on general account invested assets (which excludes income on policyholder and reinsurer accounts) decreased 1.4 percent, to $352.1 million, in 2010 and 9.3 percent, to $357.1 million, in 2009. The average balance of general account invested assets was $6.0 billion in 2010, $6.3 billion in 2009 and $6.7 billion in 2008. The average yield on these assets was 5.84 percent in 2010, 5.71 percent in 2009 and 5.87 percent in 2008. The increase in yield in 2010 primarily resulted from shifts among asset classes to increase income, and from bond prepayment income. Prepayment income was $5.1 million and $(.9) million in 2010 and 2009, respectively. The reduction in average yield in 2009 reflects l ower new money rates due to tighter credit spreads for many investments. The reduction in average invested assets was primarily due to the coinsurance transaction with Wilton Re completed in 2009.
Net investment income related to fixed index products represents the change in the estimated fair value of options which are purchased in an effort to hedge certain potential benefits accruing to the policyholders of our fixed index products. Our fixed index products are designed so that the investment income spread earned on the related insurance liabilities is expected to be more than adequate to cover the cost of the options and other costs related to these policies. Net investment income (loss) related to fixed index products were $7.1 million, $12.2 million and $(37.3) million in 2010, 2009 and 2008, respectively. Net investment income related to fixed index products also includes income (loss) on trading securities which are held to ac t as hedges for embedded derivatives related to fixed index products. Such trading account income (loss) was $2.7 million, $(5.2) million and $8.9 million in 2010, 2009 and 2008, respectively. Such amounts were mostly offset by the corresponding charge (credit) to amounts added to policyholder account balances for fixed index products. Such income and related charges fluctuate based on the value of options embedded in the segment’s fixed index annuity policyholder account balances subject to this benefit and to the performance of the indices to which the returns on such products are linked.
Trading account income related to policyholder accounts represents the income on investments backing the market strategies of certain annuity products which provide for different rates of cash value growth based on the experience of a particular market strategy. The income on our trading account securities is designed to substantially offset certain amounts included in insurance policy benefits related to the aforementioned annuity products.
Insurance policy benefits were affected by a number of items as summarized below for benefit ratios. Benefit ratios are calculated by dividing the related insurance product’s insurance policy benefits by insurance policy income.
The long-term care policies in this segment generally provide for indemnity and non-indemnity benefits on a guaranteed renewable or non-cancellable basis. The benefit ratio on our long-term care policies was 210.8 percent, 186.7 percent and 169.6 percent in 2010, 2009 and 2008, respectively. Since the insurance product liabilities we establish for long-term care business are subject to significant estimates, the ultimate claim liability we incur for a particular period is likely to be different than our initial estimate. Our insurance policy benefits reflected reserve redundancies (deficiencies) from prior years of $(3.8) million, $(2.1) million and $1.1 million in 2010, 2009 and 2008, respectively. Excluding the effects of prior year claim reserve redundancies (deficiencies), our benefit ratio s would have been 198.1 percent, 180.1 percent and 172.8 percent in 2010, 2009 and 2008, respectively. These ratios reflect the level of incurred claims experienced in recent periods, adverse development on claims incurred in prior periods and changes in policy income. The prior period deficiencies have primarily resulted from the impact of paid claim experience being different than prior estimates.
The net cash flows from long-term care products generally cause an accumulation of amounts in the early years of a policy (reflected in our earnings as reserve increases) which will be paid out as benefits in later policy years (reflected in our earnings as reserve decreases which offset the recording of benefit payments). Accordingly, as the policies age, the benefit ratio will typically increase, but the increase in benefits will be partially offset by investment income earned on the assets which have accumulated. The interest-adjusted benefit ratio for long-term care products is calculated by dividing the insurance product’s insurance policy benefits less interest income on the accumulated assets backing the insurance liabilities by insurance policy income. The interest-adjusted benefit ratio on this business was 123.8 percent, 107.9 percent and 93.5 percent in 2010, 2009 and 2008, respectively. Excluding the effects of prior year claim reserve redundancies (deficiencies), our interest-adjusted benefit ratios would have been 111.1 percent, 101.5 percent and 96.7 percent in 2010, 2009 and 2008, respectively.
In each quarterly period, we calculate our best estimate of claim reserves based on all of the information available to us at that time, which necessarily takes into account new experience emerging during the period. Our actuaries estimate these claim reserves using various generally recognized actuarial methodologies which are based on informed estimates and judgments that are believed to be appropriate. As additional experience emerges and other data become available, these estimates and judgments are reviewed and may be revised. Significant assumptions made in estimating claim reserves for
long-term care policies include expectations about the: (i) future duration of existing claims; (ii) cost of care and benefit utilization; (iii) interest rate utilized to discount claim reserves; (iv) claims that have been incurred but not yet reported; (v) claim status on the reporting date; (vi) claims that have been closed but are expected to reopen; and (vii) correspondence that has been received that will ultimately become claims that have payments associated with them.
The benefit ratios on Other CNO Business’ other products are subject to fluctuations due to the smaller size of these blocks of business.
Amounts added to policyholder account balances for annuity products and interest-sensitive life products were $127.6 million, $138.8 million and $152.1 million in 2010, 2009 and 2008, respectively. The decrease was primarily due to a smaller block of annuity and interest-sensitive life business inforce due to: (i) lapses exceeding new sales in recent periods; and (ii) the completion of the coinsurance transaction with Wilton Re in 2009. The weighted average crediting rates for these products were 4.0 percent, 4.1 percent and 4.2 percent in 2010, 2009 and 2008, respectively.
Amounts added to fixed index products generally fluctuate with the corresponding related investment income accounts described above.
Amortization related to operations includes amortization of insurance acquisition costs. Insurance acquisition costs are generally amortized either: (i) in relation to the estimated gross profits for universal life and investment-type products; or (ii) in relation to actual and expected premium revenue for other products. In addition, for universal life and investment-type products, we are required to adjust the total amortization recorded to date through the statement of operations if actual experience or other evidence suggests that earlier estimates of future gross profits should be revised. Accordingly, amortization for universal life and investment-type products is dependent on the profits realized during the period and on ou r expectation of future profits. For other products, we amortize insurance acquisition costs in relation to actual and expected premium revenue, and amortization is only adjusted if expected premium revenue changes. The assumptions we use to estimate our future gross profits and premiums involve significant judgment. A revision to our current assumptions could result in increases or decreases to amortization expense in future periods. Earnings on our universal life products, which comprise a significant part of this block, are subject to volatility since our insurance acquisition costs are equal to the value of future estimated gross profits. Accordingly, the impact of adverse changes in our earlier estimates of future gross profits is generally reflected in earnings in the period such differences occur.
During 2010, we were required to recognize $13 million of additional amortization expense resulting from decreased projected future investment yields related to interest-sensitive insurance products. Also in 2010, amortization increased by $6 million representing the write-off of the balance of the present value of future profits related to this segment’s long-term care insurance block. Such write-off was based on actuarial studies indicating such balance was no longer expected to be recoverable from future profits. Amortization on our annuity block of business decreased $15 million in 2010, primarily due to better persistency.
During 2009, we were required to accelerate the amortization of insurance acquisition costs by approximately $25 million for the changes in three assumptions related to future profits from our universal life products in this segment. The first change resulted in additional amortization expense of $24 million and relates to the investment earnings assumption for the entire interest-sensitive block of life insurance business. The average yield on our general account invested assets decreased during 2009 reflecting lower new money rates. Accordingly, the future weighted average investment earnings assumptions were reduced reflecting the lower portfolio earnings. The second change resulted from refinements to our estimates of premium taxes expected to be incurred in the future, and resulted in a re duction to amortization expense of $8 million. The third change resulted in additional amortization expense of $9 million and relates to the assumption of when we will ultimately increase certain non-guaranteed premium rates related to the Lifetrend insurance products. As described in the note to the consolidated financial statements entitled “Commitments and Contingencies - Litigation and Other Legal Proceedings – Regulatory Examinations and Fines,” we have entered into a settlement agreement with the regulators regarding this issue.
We were also required to accelerate the amortization of insurance acquisition costs due to changes in our assumptions related to future profits on our universal life products in this segment during 2008. During 2008, an analysis was performed on a universal life block of business that led to changes in our assumptions of future mortality, surrenders, premium persistency, expenses and investment income. We recognized additional amortization expense of approximately $8 million to reflect these changes. The additional amortization expense in 2008 was net of planned increases to associated policyholder charges.
During the last three years, we were required to accelerate the amortization of insurance acquisition costs due to the experience of a block of fixed index annuities. This block of business has experienced higher than anticipated surrenders and
we have increased our expected surrender assumptions in future periods. These annuities also have a MVA feature, which effectively reduced (or in some cases, eliminated) the charges paid upon the surrender of these policies in the recent periods as the 10-year treasury rate dropped. The impact of both the historical experience and the projected increased surrender activity and higher MVA benefits has reduced our expectations on the profitability of this block to approximately break-even. We recognized additional amortization of approximately $6.8 million, $8.5 million and $5 million in 2010, 2009 and 2008, respectively, related to the actual and expected future changes in the experience of this block. We continue to hold insurance acquisition costs of approximately $52 million related to these p roducts. Results for this block are expected to exhibit increased volatility in the future, because the difference between our assumptions and actual experience will be reflected in earnings in the period such differences occur.
Interest expense on investment borrowings includes $19.8 million, $20.3 million and $21.9 million of interest expense on collateralized borrowings in 2010, 2009 and 2008, respectively, as further described in the note to the consolidated financial statements entitled “Summary of Significant Accounting Policies - Investment Borrowings”.
Other operating costs and expenses were $81.4 million, $102.1 million and $97.2 million in 2010, 2009 and 2008, respectively. Other operating costs and expenses include commission expense of $6.2 million, $8.0 million and $11.7 million in 2010, 2009 and 2008, respectively. These amounts fluctuate as a result of consulting and legal costs which often vary from period to period.
Net realized investment gains (losses) fluctuate each period. During 2010, net realized investment losses in this segment included $30.9 million of net gains from the sales of investments (primarily fixed maturities) and $58.5 million of writedowns of investments for other than temporary declines in fair value recognized through net income ($59.0 million, prior to the $.5 million of impairment losses recognized through accumulated other comprehensive income (loss)). During 2009, net realized investment losses in this segment included $29.4 million of net gains from the sales of investments (primarily fixed maturities) and $53.0 million of writedowns of investments for other than temporary declines in fair value recognized through net income ($120.3 million, prior to the $67.3 million of impairment losses recognized through accumulated other comprehensive income (loss)). During 2008, net realized investment losses included $36.9 million of net losses from the sales of investments (primarily fixed maturities) and $40.2 million of writedowns of investments resulting from declines in fair value that we concluded were other than temporary.
Amortization related to net realized investment losses is the increase or decrease in the amortization of insurance acquisition costs which results from realized investment gains or losses. When we sell securities which back our universal life and investment-type products at a gain (loss) and reinvest the proceeds at a different yield (or when we have the intent to sell the impaired investments before an anticipated recovery in value occurs, we increase (reduce) the amortization of insurance acquisition costs in order to reflect the change in estimated gross profits due to the gains (losses) realized and the resulting effect on estimated future yields. Sales of fixed maturity investments resulted in an increase (decrease) in the amortization of insurance acquisition costs of $1.3 million, $(4.2) million and $(5.7) million in 2010, 2009 and 2008, respectively.
Corporate Operations (dollars in millions)
| | | 2010 | | | 2009 | | | 2008 | |
| | | | | | | | | | |
| Corporate operations: | | | | | | | | | |
| Interest expense on corporate debt | | $ | (79.3 | ) | | $ | (84.7 | ) | | $ | (67.9 | ) |
| Net investment income: | | | | | | | | | | | | |
| General account invested assets | | | .1 | | | | .3 | | | | 4.9 | |
| Other special-purpose portfolios | | | (1.5 | ) | | | 1.4 | | | | - | |
| Fee revenue and other income | | | 1.6 | | | | 2.7 | | | | 4.7 | |
| Net operating results of variable interest entities | | | 7.2 | | | | .8 | | | | 7.2 | |
| Other operating costs and expenses | | | (50.2 | ) | | | (42.9 | ) | | | (43.5 | ) |
| Gain (loss) on extinguishment or modification of debt | | | (6.8 | ) | | | (22.2 | ) | | | 21.2 | |
| | | | | | | | | | | | | |
| Loss before net realized investment losses and income taxes | | | (128.9 | ) | | | (144.6 | ) | | | (73.4 | ) |
| | | | | | | | | | | | | |
| Net realized investment losses | | | (3.5 | ) | | | (7.4 | ) | | | (50.8 | ) |
| | | | | | | | | | | | | |
| Loss before income taxes | | $ | (132.4 | ) | | $ | (152.0 | ) | | $ | (124.2 | ) |
Interest expense on corporate debt has been impacted by: (i) an amendment to our Previous Senior Credit Agreement in 2009; (ii) repayments of our Previous Senior Credit Agreement; (iii) the issuance in 2008 of the Senior Health Note; (iv) repurchases of 3.5% Convertible Debentures due September 30, 2035 (the “3.5% Debentures”); (v) completion of a cash tender offer (the “Tender Offer”) for $176.5 million aggregate principal amount of the 3.5% Debentures; (vi) the issuances of 7.0% Debentures; and (vii) the issuance of 9.0% Senior Secured Notes. Such transactions are further discussed in the note to the consolidated financial statements entitled “Notes Payable – Direct Corporate Obligations”. � 60;Our average corporate debt outstanding was $1,036.5 million, $1,275.8 million and $1,219.3 million in 2010, 2009 and 2008, respectively. The average interest rate on our debt was 7.3 percent, 5.7 percent and 4.6 percent in 2010, 2009 and 2008, respectively.
Net investment income primarily included income earned on short-term investments, changes in the underlying value of certain investments held by the Corporate segment and miscellaneous other income and fluctuated along with the change in the amount of invested assets in this segment.
Net investment income on other special-purpose portfolios includes the income (loss) on investments (including the change in the estimated fair value of the underlying investments) related to an employee deferred compensation plan held in a rabbi trust. An offsetting amount is included in other operating costs and expenses as the investment results are allocated to the participants’ account balances.
Fee revenue and other income includes: (i) revenues we receive for managing investments for other companies; and (ii) fees received for marketing insurance products of other companies. Fee revenue and other income has decreased primarily as a result of a decrease in investments managed for others.
Net operating results of variable interest entities represent the operating results of variable interest entities (“VIEs”). The VIEs are consolidated in accordance with GAAP. These entities were established to issue securities and use the proceeds to invest in loans and other permitted assets. Refer to the note to the consolidated financial statements entitled “Investments in Variable Interest Entities” for more information on the VIEs.
Other operating costs and expenses include general corporate expenses, net of amounts charged to subsidiaries for services provided by the corporate operations. These amounts fluctuate as a result of expenses such as consulting, legal and severance costs which often vary from period to period.
Gain (loss) on extinguishment or modification of debt of $6.8 million in 2010 resulted from the write-off of unamortized discount and issuance costs related to: (i) the repurchases of 3.5% Debentures; and (ii) the repayment of our Previous Senior Credit Agreement. The loss on extinguishment or modification of debt in 2009 consisted of expenses incurred and the write-off of unamortized discount or issuance costs totaling $22.2 million related to the following transactions: (i) the Tender Offer; (ii) repayment of principal amounts on the Previous Senior Credit Agreement from the proceeds from the issuance of common stock; and (iii) modifications to our Previous Senior Credit Agreement in March 2009 and December 2009. The gain on extinguishment of debt of $21.2 million in 2008 resulted from the repurchase of $37.0 million par value of 3.5% Debentures for $15.3 million plus accrued interest. These transactions are further discussed in the note to the consolidated financial statements entitled “Notes Payable – Direct Corporate Obligations”.
Net realized investment losses often fluctuate each period. During 2010, net realized investment losses in this segment included $.2 million of net losses from the sales of investments (of which $.4 million were losses recognized by VIEs) and $3.3 million of writedowns of investments (all of which were recognized by VIEs) due to other-than-temporary declines in value. During 2009, net realized investment losses in this segment included $6.1 million of net gains from the sales of investments (of which $.7 million were losses recognized by a VIE) and $13.5 million of writedowns of investments (all of which were recognized by a VIE) due to other-tha n-temporary declines in value. During 2008, net realized investment losses included $36.1 million from the sale of investments ($14.1 million of such losses were recognized by a VIE) and $14.7 million of writedowns ($10.8 million of such writedowns were recognized by a VIE) of investments resulting from declines in fair value that we concluded were other than temporary due to declines in value on certain securities.
PREMIUM COLLECTIONS
In accordance with GAAP, insurance policy income in our consolidated statement of operations consists of premiums earned for traditional insurance policies that have life contingencies or morbidity features. For annuity and universal life contracts, premiums collected are not reported as revenues, but as deposits to insurance liabilities. We recognize revenues for these products over time in the form of investment income and surrender or other charges.
Our insurance segments sell products through three primary distribution channels — career agents (our Bankers Life segment), direct marketing (our Colonial Penn segment) and independent producers (our Washington National segment). Our career agency force in the Bankers Life segment sells primarily Medicare supplement and long-term care insurance policies, Medicare Part D contracts, life insurance and annuities. These agents visit the customer’s home, which permits one-on-one contact with potential policyholders and promotes strong personal relationships with existing policyholders. Our direct marketing distribution channel in the Colonial Penn segment is engaged primarily in the sale of graded benefit life and simplified issue life insurance policies which are sold directly to the policyholder. Our independent producer distribution channel in the Washington National segment consists of a general agency and insurance brokerage distribution system comprised of independent licensed agents doing business in all fifty states, the District of Columbia, and certain protectorates of the United States. Independent producers are a diverse network of independent agents, insurance brokers and marketing organizations. Our independent producer distribution channel sells primarily supplemental health and Medicare supplement insurance policies, universal life insurance and annuities. Washington National also markets its products through PMA which specializes in marketing and distributing health products.
Agents, insurance brokers and marketing companies who market our products and prospective purchasers of our products use the financial strength ratings of our insurance subsidiaries as an important factor in determining whether to market or purchase. Ratings have the most impact on our annuity, interest-sensitive life insurance and long-term care products. The current financial strength ratings of our primary insurance subsidiaries from A.M. Best, S&P and Moody’s are “B+ (Good)” (except Conseco Life), “BB” and “Ba1”, respectively. The current financial strength rating of Conseco Life from A.M. Best is “B-”. For a description of these ratings and additional information on our ratings, see “Management’s Discussion and Analysis of Consolidated Financial Condition and Results of Operations — Liquidity for Insurance Operations.”
We set premium rates on our health insurance policies based on facts and circumstances known at the time we issue the policies using assumptions about numerous variables, including the actuarial probability of a policyholder incurring a claim, the probable size of the claim, and the interest rate earned on our investment of premiums. We also consider historical claims information, industry statistics, the rates of our competitors and other factors. If our actual claims experience is less favorable than we anticipated and we are unable to raise our premium rates, our financial results may be adversely affected. We generally cannot raise our health insurance premiums in any state until we obtain the approval of the state insurance regulator. We review the adequacy of our premium rates regularly and file for rate increases on our products when we believe such rates are too low. It is likely that we will not be able to obtain approval for all requested premium rate increases. If such requests are denied in one or more states, our net income may decrease. If such requests are approved, increased premium rates may reduce the volume of our new sales and may cause existing policyholders to lapse their policies. If the healthier policyholders allow their policies to lapse, this would reduce our premium income and profitability in the future.
Total premium collections were as follows:
Bankers Life (dollars in millions)
| | | 2010 | | | 2009 | | | 2008 | |
| Premiums collected by product: | | | | | | | | | |
| | | | | | | | | | |
| Annuities: | | | | | | | | | |
| Fixed index (first-year) | | $ | 577.7 | | | $ | 350.1 | | | $ | 522.8 | |
| | | | | | | | | | | | | |
| Other fixed (first-year) | | | 423.5 | | | | 707.0 | | | | 697.8 | |
| Other fixed (renewal) | | | 4.3 | | | | 3.3 | | | | 3.5 | |
| Subtotal - other fixed annuities | | | 427.8 | | | | 710.3 | | | | 701.3 | |
| | | | | | | | | | | | | |
Total annuities | | | 1,005.5 | | | | 1,060.4 | | | | 1,224.1 | |
| | | | | | | | | | | | | |
| Health: | | | | | | | | | | | | |
| Medicare supplement (first-year) | | | 116.4 | | | | 91.7 | | | | 81.3 | |
| Medicare supplement (renewal) | | | 581.4 | | | | 562.0 | | | | 555.3 | |
| Subtotal - Medicare supplement | | | 697.8 | | | | 653.7 | | | | 636.6 | |
| Long-term care (first-year) | | | 22.2 | | | | 17.7 | | | | 42.7 | |
| Long-term care (renewal) | | | 562.4 | | | | 583.9 | | | | 583.0 | |
| Subtotal - long-term care | | | 584.6 | | | | 601.6 | | | | 625.7 | |
| PDP and PFFS (first year) | | | 3.7 | | | | 96.0 | | | | 353.3 | |
| PDP and PFFS (renewal) | | | 62.7 | | | | 348.4 | | | | 260.7 | |
| Subtotal – PDP and PFFS | | | 66.4 | | | | 444.4 | | | | 614.0 | |
| Other health (first-year) | | | 2.1 | | | | 2.7 | | | | 2.1 | |
| Other health (renewal) | | | 9.2 | | | | 9.3 | | | | 8.6 | |
| Subtotal - other health | | | 11.3 | | | | 12.0 | | | | 10.7 | |
| | | | | | | | | | | | | |
| Total health | | | 1,360.1 | | | | 1,711.7 | | | | 1,887.0 | |
| | | | | | | | | | | | | |
| Life insurance: | | | | | | | | | | | | |
| First-year | | | 97.7 | | | | 82.6 | | | | 80.7 | |
| Renewal | | | 111.9 | | | | 146.2 | | | | 128.7 | |
| | | | | | | | | | | | | |
| Total life insurance | | | 209.6 | | | | 228.8 | | | | 209.4 | |
| | | | | | | | | | | | | |
| Collections on insurance products: | | | | | | | | | | | | |
| | | | | | | | | | | | | |
| Total first-year premium collections on insurance products | | | 1,243.3 | | | | 1,347.8 | | | | 1,780.7 | |
| Total renewal premium collections on insurance products | | | 1,331.9 | | | | 1,653.1 | | | | 1,539.8 | |
| | | | | | | | | | | | | |
| Total collections on insurance products | | $ | 2,575.2 | | | $ | 3,000.9 | | | $ | 3,320.5 | |
Annuities in this segment include fixed index and other fixed annuities sold to the senior market. Annuity collections in this segment decreased 5.2 percent, to $1,005.5 million, in 2010 and 13 percent, to $1,060.4 million, in 2009. The change in mix of premium collections between our fixed index products and our fixed annuity products has fluctuated due to volatility in the financial markets in recent periods. In addition, premium collections from Bankers Life’s fixed annuity products decreased in 2010 as low new money interest rates negatively impacted our sales and the overall sales in the fixed annuity market. A new product, which provides more flexibility in setting the bonus interest rates, was launched in early 2010.
Health products include Medicare supplement, Medicare Part D contracts, long-term care and other insurance products. Our profits on health policies depend on the overall level of sales, the length of time the business remains inforce, investment yields, claims experience and expense management.
Collected premiums on Medicare supplement policies in the Bankers Life segment increased 6.7 percent, to $697.8 million, in 2010 and 2.7 percent, to $653.7 million, in 2009.
Premiums collected on Bankers Life’s long-term care policies decreased 2.8 percent, to $584.6 million, in 2010 and 3.9 percent, to $601.6 million, in 2009. The decrease in 2010 was primarily attributable to higher lapses following premium rate increases in recent periods. The decrease in 2009 was primarily attributable to a long-term care reinsurance agreement pursuant to which we reinsured 70 percent of Bankers Life’s new 2009 long-term care business. The amount reinsured decreased to 50 percent for the first quarter of 2010 and to 25 percent thereafter.
Premiums collected on PDP and PFFS business relate to various quota-share reinsurance agreements with Coventry. In order to reduce the required statutory capital associated with the assumption of group PFFS business, we terminated two group policy quota-share agreements as of December 31, 2008 and terminated the last agreement on June 30, 2009. Coventry decided to cease selling PFFS plans effective January 1, 2010. Effective January 1, 2010, the Company no longer assumes the underwriting risk related to PFFS business. In the third quarter of 2009, Bankers Life began offering Humana’s Medicare Advantage plans to its policyholders and consumers nationwide through its career agency force and receives marketing fees based on sales. Premiums collected on the PFFS business were $1.1 million, $369.0 million and $542.4 million in 2010, 2009 and 2008, respectively. The PFFS premiums recognized in 2010 related to adjustments to prior year contracts. These agreements are described in “Management’s Discussion and Analysis of Consolidated Financial Condition and Results of Operations - Critical Accounting Policies”.
Other health products relate to collected premiums on other health products which we no longer actively market.
Life products in this segment are sold primarily to the senior market through our career agents. Life premiums collected in this segment decreased 8.4 percent, to $209.6 million, in 2010 and increased 9.3 percent, to $228.8 million, in 2009. Collected premiums have been impacted by the reinsurance agreement with Wilton Re completed in the fourth quarter of 2009.
Washington National (dollars in millions)
| | | 2010 | | | 2009 | | | 2008 | |
| Premiums collected by product: | | | | | | | | | |
| | | | | | | | | | |
| Health: | | | | | | | | | |
| Medicare supplement (first-year) | | $ | 3.8 | | | $ | 7.2 | | | $ | 9.6 | |
| Medicare supplement (renewal) | | | 151.0 | | | | 170.6 | | | | 194.2 | |
| Subtotal - Medicare supplement | | | 154.8 | | | | 177.8 | | | | 203.8 | |
| Supplemental health (first-year) | | | 52.0 | | | | 45.4 | | | | 39.4 | |
| Supplemental health (renewal) | | | 353.5 | | | | 337.9 | | | | 335.2 | |
| Subtotal – supplemental health | | | 405.5 | | | | 383.3 | | | | 374.6 | |
| Other health (first-year) | | | - | | | | - | | | | .1 | |
| Other health (renewal) | | | 4.6 | | | | 5.2 | | | | 6.4 | |
| Subtotal – other health | | | 4.6 | | | | 5.2 | | | | 6.5 | |
| | | | | | | | | | | | | |
| Total health | | | 564.9 | | | | 566.3 | | | | 584.9 | |
| | | | | | | | | | | | | |
| Life insurance: | | | | | | | | | | | | |
| First-year | | | .8 | | | | .8 | | | | .6 | |
| Renewal | | | 15.4 | | | | 29.3 | | | | 35.1 | |
| | | | | | | | | | | | | |
| Total life insurance | | | 16.2 | | | | 30.1 | | | | 35.7 | |
| | | | | | | | | | | | | |
| Collections on insurance products: | | | | | | | | | | | | |
| | | | | | | | | | | | | |
| Total first-year premium collections on insurance products | | | 56.6 | | | | 53.4 | | | | 49.7 | |
| Total renewal premium collections on insurance products | | | 524.5 | | | | 543.0 | | | | 570.9 | |
| | | | | | | | | | | | | |
| Total collections on insurance products | | $ | 581.1 | | | $ | 596.4 | | | $ | 620.6 | |
Health products in the Washington National segment include Medicare supplement, supplemental health and other insurance products. Our profits on health policies depend on the overall level of sales, the length of time the business remains inforce, investment yields, claim experience and expense management.
Collected premiums on Medicare supplement policies in the Washington National segment decreased 13 percent, to $154.8 million, in 2010 and 13 percent, to $177.8 million, in 2009. We have experienced lower sales and higher lapses of these products due to premium rate increases implemented in recent periods and competition from companies offering Medicare Advantage products.
Premiums collected on supplemental health products (including specified disease, accident and hospital indemnity insurance products) increased 5.8 percent, to $405.5 million, in 2010 and 2.3 percent, to $383.3 million, in 2009. Such increases are due to higher new sales in each year and an improvement in persistency.
Life products in the Washington National segment are primarily traditional life products. Life premiums collected decreased 46 percent, to $16.2 million, in 2010 and 16 percent, to $30.1 million, in 2009, reflecting the completion of the coinsurance transaction with Wilton Re in the third quarter of 2009.
Colonial Penn (dollars in millions)
| | | 2010 | | | 2009 | | | 2008 | |
| Premiums collected by product: | | | | | | | | | |
| | | | | | | | | | |
| Life insurance: | | | | | | | | | |
| First-year | | $ | 32.3 | | | $ | 33.0 | | | $ | 35.0 | |
| Renewal | | | 155.4 | | | | 154.3 | | | | 139.1 | |
| | | | | | | | | | | | | |
| Total life insurance | | | 187.7 | | | | 187.3 | | | | 174.1 | |
| | | | | | | | | | | | | |
| Health (all of which are renewal premiums): | | | | | | | | | | | | |
| Medicare supplement | | | 6.0 | | | | 7.0 | | | | 8.1 | |
| Other health | | | .4 | | | | .5 | | | | .8 | |
| | | | | | | | | | | | | |
| Total health | | | 6.4 | | | | 7.5 | | | | 8.9 | |
| | | | | | | | | | | | | |
| Collections on insurance products: | | | | | | | | | | | | |
| | | | | | | | | | | | | |
| Total first-year premium collections on insurance products | | | 32.3 | | | | 33.0 | | | | 35.0 | |
| Total renewal premium collections on insurance products | | | 161.8 | | | | 161.8 | | | | 148.0 | |
| | | | | | | | | | | | | |
| Total collections on insurance products | | $ | 194.1 | | | $ | 194.8 | | | $ | 183.0 | |
Life products in this segment are sold primarily to the senior market. Life premiums collected in this segment increased .2 percent, to $187.7 million, in 2010 and 7.6 percent, to $187.3 million, in 2009. Graded benefit life products sold through our direct response marketing channel accountedfor $184.1 million, $180.5 million and $168.5 million of collected premiums in 2010, 2009 and 2008, respectively. In 2009, renewal premiums for our life insurance products include the receipt of a $3.4 million final distribution and commutation payment following the termination of a group insurance pool that Colonial Penn previously participated i n.
Health products include Medicare supplement and other insurance products. Our profits on health policies depend on the overall level of sales, the length of time the business remains inforce, investment yields, claims experience and expense management. Premiums collected on these products have decreased as we do not currently market these products through this segment.
Other CNO Business (dollars in millions)
| | | 2010 | | | 2009 | | | 2008 | |
| Premiums collected by product: | | | | | | | | | |
| | | | | | | | | | |
| Annuities: | | | | | | | | | |
| Fixed index (first-year) | | $ | 10.3 | | | $ | 71.0 | | | $ | 116.1 | |
| Fixed index (renewal) | | | 4.6 | | | | 5.6 | | | | 7.6 | |
| Subtotal – fixed index annuities | | | 14.9 | | | | 76.6 | | | | 123.7 | |
| Other fixed (first-year) | | | .9 | | | | .8 | | | | 3.8 | |
| Other fixed (renewal) | | | .6 | | | | 1.0 | | | | 2.3 | |
| Subtotal - other fixed annuities | | | 1.5 | | | | 1.8 | | | | 6.1 | |
| | | | | | | | | | | | | |
| Total annuities | | | 16.4 | | | | 78.4 | | | | 129.8 | |
| | | | | | | | | | | | | |
| Health: | | | | | | | | | | | | |
| Long-term care (all of which are renewal) | | | 29.2 | | | | 31.4 | | | | 33.7 | |
| Other health (all of which are renewal) | | | 2.5 | | | | 2.7 | | | | 3.2 | |
| | | | | | | | | | | | | |
| Total health | | | 31.7 | | | | 34.1 | | | | 36.9 | |
| | | | | | | | | | | | | |
| Life insurance: | | | | | | | | | | | | |
| First-year | | | 2.3 | | | | 2.2 | | | | 3.7 | |
| Renewal | | | 189.3 | | | | 208.0 | | | | 230.4 | |
| | | | | | | | | | | | | |
| Total life insurance | | | 191.6 | | | | 210.2 | | | | 234.1 | |
| | | | | | | | | | | | | |
| Collections on insurance products: | | | | | | | | | | | | |
| | | | | | | | | | | | | |
| Total first-year premium collections on insurance products | | | 13.5 | | | | 74.0 | | | | 123.6 | |
| Total renewal premium collections on insurance products | | | 226.2 | | | | 248.7 | | | | 277.2 | |
| | | | | | | | | | | | | |
| Total collections on insurance products | | $ | 239.7 | | | $ | 322.7 | | | $ | 400.8 | |
Annuities in this segment include fixed index and other fixed annuities. We are no longer actively pursuing sales of annuity products in this segment. Total annuity collected premiums in this segment decreased 79 percent, to $16.4 million, in 2010 and 40 percent, to $78.4 million, in 2009.
Our fixed index annuities have guaranteed minimum cash surrender values, but have potentially higher returns based on a percentage of the change in one of several equity market indices during each year of their term. We purchase options in an effort to hedge increases to policyholder benefits resulting from increases in the indices. Collected premiums for these products decreased 81 percent, to $14.9 million, in 2010 and 38 percent, to $76.6 million, in 2009.
Health products in the Other CNO Business segment include long-term care and other health insurance products. Our profits on health policies depend on the overall level of sales, the length of time the business remains inforce, investment yields, claim experience and expense management.
The long-term care premiums in this segment relate to blocks of business that we no longer market or underwrite. As a result, we expect this segment’s long-term care premiums to continue to decline, reflecting additional policy lapses in the future, partially offset by premium rate increases.
Life products in the Other CNO Business segment include primarily universal life products. Life premiums collected decreased 8.8 percent, to $191.6 million, in 2010 and 10 percent, to $210.2 million, in 2009, reflecting the completion of the coinsurance transaction with Wilton Re in the third quarter of 2009.
INVESTMENTS
Our investment strategy is to: (i) maintain a predominately investment-grade fixed income portfolio; (ii) provide liquidity to meet our cash obligations to policyholders and others; and (iii) generate stable and predictable investment income through active investment management. Consistent with this strategy, investments in fixed maturity securities, mortgage loans and policy loans made up 95 percent of our $23.8 billion investment portfolio at December 31, 2010. The remainder of the invested assets was trading securities, investments held by variable interest entities, equity securities and other invested assets.
The following table summarizes the composition of our investment portfolio as of December 31, 2010 (dollars in millions):
| | | Carrying | | | Percent of | |
| | | value | | | total investments | |
| | | | | | | |
| Fixed maturities, available for sale | | $ | 20,633.9 | | | | 87 | % |
| Equity securities | | | 68.1 | | | | - | |
| Mortgage loans | | | 1,761.2 | | | | 7 | |
| Policy loans | | | 284.4 | | | | 1 | |
| Trading securities | | | 372.6 | | | | 2 | |
| Investments held by variable interest entities | | | 420.9 | | | | 2 | |
| Partnership investments | | | 20.7 | | | | - | |
| Other invested assets | | | 220.2 | | | | 1 | |
| | | | | | | | | |
| Total investments | | $ | 23,782.0 | | | | 100 | % |
Insurance statutes regulate the types of investments that our insurance subsidiaries are permitted to make and limit the amount of funds that may be used for any one type of investment. In light of these statutes and regulations and our business and investment strategy, we generally seek to invest in United States government and government-agency securities and corporate securities rated investment grade by established nationally recognized rating organizations or in securities of comparable investment quality, if not rated.
The following table summarizes the carrying value of our fixed maturity securities, available for sale, by category as of December 31, 2010 (dollars in millions):
| | | | | | | | | | | | Percent of | |
| | | | | | | | | Gross | | | gross | |
| | | | | | Percent of | | | unrealized | | | unrealized | |
| | | Carrying value | | | fixed maturities | | | losses | | | losses | |
| | | | | | | | | | | | | |
| Energy/pipelines | | $ | 2,001.1 | | | | 9.7 | % | | $ | 14.3 | | | | 4.2 | % |
| Collateralized mortgage obligations | | | 1,912.5 | | | | 9.3 | | | | 35.5 | | | | 10.5 | |
| Utilities | | | 1,826.6 | | | | 8.9 | | | | 5.7 | | | | 1.7 | |
| States and political subdivisions | | | 1,783.5 | | | | 8.6 | | | | 100.7 | | | | 29.9 | |
| Commercial mortgage-backed securities | | | 1,363.7 | | | | 6.6 | | | | 12.5 | | | | 3.7 | |
| Insurance | | | 1,227.1 | | | | 5.9 | | | | 19.7 | | | | 5.8 | |
| Food/beverage | | | 1,085.2 | | | | 5.3 | | | | 9.8 | | | | 2.9 | |
| Healthcare/pharmaceuticals | | | 907.4 | | | | 4.4 | | | | 5.7 | | | | 1.7 | |
| Banks | | | 869.1 | | | | 4.2 | | | | 44.1 | | | | 13.1 | |
| Cable/media | | | 794.0 | | | | 3.9 | | | | 11.5 | | | | 3.4 | |
| Real estate/REITs | | | 760.0 | | | | 3.7 | | | | 6.1 | | | | 1.8 | |
| Asset-backed securities | | | 644.1 | | | | 3.1 | | | | 6.3 | | | | 1.9 | |
| Transportation | | | 544.6 | | | | 2.6 | | | | 3.2 | | | | 1.0 | |
| Capital goods | | | 495.6 | | | | 2.4 | | | | 4.0 | | | | 1.2 | |
| Building materials | | | 439.8 | | | | 2.1 | | | | 12.4 | | | | 3.7 | |
| Telecom | | | 423.1 | | | | 2.1 | | | | 9.1 | | | | 2.7 | |
| Aerospace/defense | | | 349.2 | | | | 1.7 | | | | 1.2 | | | | .4 | |
| Metals and mining | | | 333.5 | | | | 1.6 | | | | 2.1 | | | | .6 | |
| Chemicals | | | 309.5 | | | | 1.5 | | | | 2.2 | | | | .6 | |
| U.S. Treasury and Obligations | | | 294.2 | | | | 1.4 | | | | 11.8 | | | | 3.5 | |
| Paper | | | 272.2 | | | | 1.3 | | | | 4.8 | | | | 1.4 | |
| Collateralized debt obligations | | | 256.5 | | | | 1.2 | | | | 1.1 | | | | .3 | |
| Brokerage | | | 238.1 | | | | 1.2 | | | | 3.0 | | | | .9 | |
| Consumer products | | | 229.4 | | | | 1.1 | | | | 5.0 | | | | 1.5 | |
| Entertainment/hotels | | | 218.5 | | | | 1.1 | | | | .9 | | | | .3 | |
| Other | | | 1,055.4 | | | | 5.1 | | | | 4.2 | | | | 1.3 | |
| | | | | | | | | | | | | | | | | |
| Total fixed maturities, available for sale | | $ | 20,633.9 | | | | 100.0 | % | | $ | 336.9 | | | | 100.0 | % |
Our fixed maturity securities consist predominantly of publicly traded securities. We classify securities issued in the Rule 144A market as publicly traded. Securities not publicly traded comprise approximately 11 percent of our total fixed maturity securities portfolio.
Fair Value of Investments
Fair value is the price that would be received to sell an asset or paid to transfer a liability in an orderly transaction between market participants at the measurement date and, therefore, represents an exit price, not an entry price. We hold fixed maturities, equity securities, trading securities, investments held by variable interest entities, derivatives and separate account assets, which are carried at fair value.
The degree of judgment utilized in measuring the fair value of financial instruments is largely dependent on the level to which pricing is based on observable inputs. Observable inputs reflect market data obtained from independent sources, while unobservable inputs reflect our view of market assumptions in the absence of observable market information. Financial instruments with readily available active quoted prices would be considered to have fair values based on the highest level of observable inputs, and little judgment would be utilized in measuring fair value. Financial instruments that rarely trade would be considered to have fair value based on a lower level of observable inputs, and more judgment would be utilized in measuring fair value.
There is a three-level hierarchy for valuing assets or liabilities at fair value based on whether inputs are observable or unobservable.
| · | Level 1 – includes assets and liabilities valued using inputs that are quoted prices in active markets for identical assets or liabilities. Our Level 1 assets include exchange traded securities. |
| · | Level 2 – includes assets and liabilities valued using inputs that are quoted prices for similar assets in an active market, quoted prices for identical or similar assets in a market that is not active, observable inputs, or observable inputs that can be corroborated by market data. Level 2 assets and liabilities include those financial instruments that are valued by independent pricing services using models or other valuation methodologies. These models are primarily industry-standard models that consider various inputs such as interest rate, credit spread, reported trades, broker/dealer quotes, issuer spreads and other inputs that are observable or derived from observable information in the marketplace or are supported by observable levels at which transactions are executed in the marketplace. Financial instr uments in this category primarily include: certain public and private corporate fixed maturity securities; certain government or agency securities; certain mortgage and asset-backed securities; and non-exchange-traded derivatives such as call options to hedge liabilities related to our fixed index annuity products. |
| · | Level 3 – includes assets and liabilities valued using unobservable inputs that are used in model-based valuations that contain management assumptions. Level 3 assets and liabilities include those financial instruments whose fair value is estimated based on non-binding broker prices or internally developed models or methodologies utilizing significant inputs not based on, or corroborated by, readily available market information. Financial instruments in this category include certain corporate securities (primarily private placements), certain mortgage and asset-backed securities, and other less liquid securities. Additionally, the Company’s liabilities for embedded derivatives (including embedded derivatives related to our fixed index annuity products and to a modified coinsurance arrangement) are classif ied in Level 3 since their values include significant unobservable inputs including actuarial assumptions. |
At each reporting date, we classify assets and liabilities into the three input levels based on the lowest level of input that is significant to the measurement of fair value for each asset and liability reported at fair value. This classification is impacted by a number of factors, including the type of financial instrument, whether the financial instrument is new to the market and not yet established, the characteristics specific to the transaction and overall market conditions. Our assessment of the significance of a particular input to the fair value measurement and the ultimate classification of each asset and liability requires judgment.
The vast majority of our fixed maturity securities and separate account assets use Level 2 inputs for the determination of fair value. These fair values are obtained primarily from independent pricing services, which use Level 2 inputs for the determination of fair value. Substantially all of our Level 2 fixed maturity securities and separate account assets were valued from independent pricing services. Third party pricing services normally derive the security prices through recently reported trades for identical or similar securities making adjustments through the reporting date based upon available market observable information. If there are no recently reported trades, the third party pricing services may use matrix or model processes to develop a security price where future cash flow expect ations are developed and discounted at an estimated risk-adjusted market rate. The number of prices obtained is dependent on the Company’s analysis of such prices as further described below.
For securities that are not priced by pricing services and may not be reliably priced using pricing models, we obtain broker quotes. These broker quotes are non-binding and represent an exit price, but assumptions used to establish the fair value may not be observable and therefore represent Level 3 inputs. Approximately 16 percent and 1 percent of our Level 3 fixed maturity securities were valued using broker quotes or independent pricing services, respectively. The remaining Level 3 fixed maturity investments do not have readily determinable market prices and/or observable inputs. For these securities, we use internally developed valuations. Key assumptions used to determine fair value for these securities may include ri sk-free rates, risk premiums, performance of underlying collateral and other factors involving significant assumptions which may not be reflective of an active market. For certain investments, we use a matrix or model process to develop a security price where future cash flow expectations are developed and discounted at an estimated market rate. The pricing matrix utilizes a spread level to determine the market price for a security. The credit spread generally incorporates the issuer’s credit rating and other factors relating to the issuer’s industry and the security’s maturity. In some instances, issuer-specific spread adjustments, which can be positive or negative, are made based upon internal analysis of security specifics such as liquidity, deal size and time to maturity.
Privately placed securities comprise approximately 66 percent of our fixed maturities, available for sale, classified as Level 3. Privately placed securities are classified as Level 3 when their valuation is based on internal valuation models which rely on significant inputs that are not observable in the market. Our model applies spreads above the risk-free rate
which are determined based on comparison to securities with similar ratings, maturities and industries that are rated by independent third party rating agencies. Our process also considers the ratings assigned by the NAIC to the Level 3 securities on an annual basis. Each quarter, a review is performed to determine the reasonableness of the initial valuations from the model. If an initial valuation appears unreasonable based on our knowledge of a security and current market conditions, we make appropriate adjustments to our valuation inputs. The remaining securities classified as Level 3 are primarily valued based on non-binding broker quotes or internally developed models using estimated future cash flows. We recognized other-than-temporary impairments on securities classified as Lev el 3 investments of $75.9 million during 2010 ($72.0 million, prior to the $(3.9) million of impairment losses recognized through accumulated other comprehensive income (loss)).
As the Company is responsible for the determination of fair value, we perform monthly quantitative and qualitative analysis on the prices received from third parties to determine whether the prices are reasonable estimates of fair value. The Company’s analysis includes: (i) a review of the methodology used by third party pricing services; (ii) a comparison of pricing services’ valuation to other pricing services’ valuations for the same security; (iii) a review of month to month price fluctuations; (iv) a review to ensure valuations are not unreasonably stale; and (v) back testing to compare actual purchase and sale transactions with valuations received from third parties. As a result of such procedures, the Company may conclude the prices received from third parties are not reflective o f current market conditions. In those instances, we may request additional pricing quotes or apply internally developed valuations. However, the number of instances is insignificant and the aggregate change in value of such investments is not materially different from the original prices received.
The categorization of the fair value measurements of our investments priced by independent pricing services was based upon the Company’s judgment of the inputs or methodologies used by the independent pricing services to value different asset classes. Such inputs include: benchmark yields, reported trades, broker dealer quotes, issuer spreads, benchmark securities, bids, offers and reference data. The Company categorizes such fair value measurements based upon asset classes and the underlying observable or unobservable inputs used to value such investments.
The classification of fair value measurements for derivative instruments, including embedded derivatives requiring bifurcation, is determined based on the consideration of several inputs including closing exchange or over-the-counter market price quotations; time value and volatility factors underlying options; market interest rates; and non-performance risk. For certain embedded derivatives, we may use actuarial assumptions in the determination of fair value.
The categorization of fair value measurements, by input level, for our fixed maturity securities, equity securities, trading securities, certain other invested assets and assets held in separate accounts at December 31, 2010 is as follows (dollars in millions):
| | | Quoted prices in active markets for identical assets or liabilities (Level 1) | | | Significant other observable inputs (Level 2) | | | Significant unobservable inputs (Level 3) | | | Total | |
| Assets: | | | | | | | | | | | | |
| Fixed maturities, available for sale: | | | | | | | | | | | | |
Corporate securities | | $ | - | | | $ | 12,254.7 | | | $ | 2,092.5 | | | $ | 14,347.2 | |
| United States Treasury securities and obligations of United States government corporations and agencies | | | 10.0 | | | | 282.2 | | | | 2.0 | | | | 294.2 | |
States and political subdivisions | | | - | | | | 1,772.1 | | | | 11.4 | | | | 1,783.5 | |
Debt securities issued by foreign governments | | | - | | | | .9 | | | | - | | | | .9 | |
Asset-backed securities | | | - | | | | 638.1 | | | | 6.0 | | | | 644.1 | |
Collateralized debt obligations | | | - | | | | - | | | | 256.5 | | | | 256.5 | |
Commercial mortgage-backed securities | | | - | | | | 1,363.7 | | | | - | | | | 1,363.7 | |
Mortgage pass-through securities | | | 27.8 | | | | - | | | | 3.5 | | | | 31.3 | |
Collateralized mortgage obligations | | | - | | | | 1,715.4 | | | | 197.1 | | | | 1,912.5 | |
Total fixed maturities, available for sale | | | 37.8 | | | | 18,027.1 | | | | 2,569.0 | | | | 20,633.9 | |
| | | | | | | | | | | | | | | | | |
Equity securities | | | - | | | | 37.5 | | | | 30.6 | | | | 68.1 | |
| | | | | | | | | | | | | | | | | |
| Trading securities: | | | | | | | | | | | | | | | | |
Corporate securities | | | 3.2 | | | | 47.5 | | | | 4.3 | | | | 55.0 | |
| United States Treasury securities and obligations of United States government corporations and agencies | | | - | | | | 293.8 | | | | - | | | | 293.8 | |
States and political subdivisions | | | - | | | | 16.1 | | | | - | | | | 16.1 | |
Asset-backed securities | | | - | | | | .6 | | | | - | | | | .6 | |
Commercial mortgage-backed securities | | | - | | | | 5.2 | | | | - | | | | 5.2 | |
Mortgage pass-through securities | | | .3 | | | | - | | | | - | | | | .3 | |
Collateralized mortgage obligations | | | - | | | | 1.2 | | | | .4 | | | | 1.6 | |
Total trading securities | | | 3.5 | | | | 364.4 | | | | 4.7 | | | | 372.6 | |
Investments held by variable interest entities | | | - | | | | 414.2 | | | | 6.7 | | | | 420.9 | |
Other invested assets | | | - | | | | 192.0 | | | | - | | | | 192.0 | |
Assets held in separate accounts | | | - | | | | 17.5 | | | | - | | | | 17.5 | |
The following table presents additional information about assets measured at fair value on a recurring basis and for which we have utilized significant unobservable (Level 3) inputs to determine fair value for the year ended December 31, 2010 (dollars in millions):
| | | | | | | | | | | | | | | | | | | | | | | | | | | |
| | | December 31, 2010 | | Amount of total gains (losses) for the year ended December 31, 2010 included in our net income relating to assets and liabilities still held as of the reporting date |
| | | Beginning balance as of December 31, 2009 | | | Cumulative effect of accounting change (a) | | | Purchases, sales, issuances and settlements, net | | | Total realized and unrealized gains (losses) included in net income | | | Total realized and unrealized gains (losses) included in accumulated other comprehensive income (loss) | | | Transfers into Level 3 (b) | | | Transfers out of Level 3 (b) (c) | | | Ending balance as of December 31, 2010 | |
| Assets: | | | | | | | | | | | | | | | | | | | | | | | | | | |
| Fixed maturities, available for sale: | | | | | | | | | | | | | | | | | | | | | | | | | | |
Corporate securities | | $ | 2,247.1 | | | $ | (5.9 | ) | | $ | 148.8 | | | $ | (72.7 | ) | | $ | 74.5 | | | $ | 19.6 | | | $ | (318.9 | ) | | $ | 2,092.5 | | | $ | - | |
| United States Treasury securities and obligations of United States government corporations and agencies | | | 2.2 | | | | - | | | | (.1 | ) | | | - | | | | (.1 | ) | | | - | | | | - | | | | 2.0 | | | | - | |
States and political subdivisions | | | 10.7 | | | | - | | | | - | | | | - | | | | .4 | | | | 2.1 | | | | (1.8 | ) | | | 11.4 | | | | - | |
Asset-backed securities | | | 15.8 | | | | - | | | | (12.3 | ) | | | (11.4 | ) | | | 13.9 | | | | - | | | | - | | | | 6.0 | | | | - | |
Collateralized debt obligations | | | 92.8 | | | | (5.7 | ) | | | 160.2 | | | | (.3 | ) | | | 9.5 | | | | - | | | | - | | | | 256.5 | | | | - | |
Commercial mortgage-backed securities | | | 13.7 | | | | - | | | | - | | | | - | | | | - | | | | - | | | | (13.7 | ) | | | - | | | | - | |
Mortgage pass-through securities | | | 4.2 | | | | - | | | | (.7 | ) | | | - | | | | - | | | | - | | | | - | | | | 3.5 | | | | - | |
Collateralized mortgage obligations | | | 11.4 | | | | - | | | | 174.8 | | | | (.8 | ) | | | 5.5 | | | | 17.3 | | | | (11.1 | ) | | | 197.1 | | | | - | |
Total fixed maturities, available for sale | | | 2,397.9 | | | | (11.6 | ) | | | 470.7 | | | | (85.2 | ) | | | 103.7 | | | | 39.0 | | | | (345.5 | ) | | | 2,569.0 | | | | - | |
Equity securities | | | 30.9 | | | | - | | | | .1 | | | | - | | | | (.4 | ) | | | - | | | | - | | | | 30.6 | | | | - | |
| Trading securities: | | | | | | | | | | | | | | | | | | | | | | | | | | | | | | | | | | | | |
Corporate securities | | | 3.7 | | | | - | | | | - | | | | - | | | | .6 | | | | - | | | | - | | | | 4.3 | | | | .6 | |
Collateralized mortgage obligations | | | - | | | | - | | | | - | | | | - | | | | .1 | | | | .3 | | | | - | | | | .4 | | | | .1 | |
Total trading securities | | | 3.7 | | | | - | | | | - | | | | - | | | | .7 | | | | .3 | | | | - | | | | 4.7 | | | | .7 | |
| Investments held by variable interest entities: | | | | | | | | | | | | | | | | | | | | | | | | | | | | | | | | | | | | |
| Corporate securities | | | - | | | | 6.9 | | | | (1.0 | ) | | | - | | | | .8 | | | | - | | | | - | | | | 6.7 | | | | - | |
| Securities lending collateral: | | | | | | | | | | | | | | | | | | | | | | | | | | | | | | | | | | | | |
Corporate securities | | | 13.7 | | | | - | | | | (13.7 | ) | | | - | | | | - | | | | - | | | | - | | | | - | | | | - | |
Asset-backed securities | | | 22.9 | | | | - | | | | (20.9 | ) | | | - | | | | - | | | | - | | | | (2.0 | ) | | | - | | | | - | |
Total securities lending collateral | | | 36.6 | | | | - | | | | (34.6 | ) | | | - | | | | - | | | | - | | | | (2.0 | ) | | | - | | | | - | |
Other invested assets | | | 2.4 | | | | (2.4 | ) | | | - | | | | - | | | | - | | | | - | | | | - | | | | - | | | | - | |
________
| (a) | Amounts represent adjustments to investments related to a variable interest entity that was required to be consolidated effective January 1, 2010, as well as the reclassification of investments of a variable interest entity which was consolidated at December 31, 2009. |
| (b) | Transfers in/out of Level 3 are reported as having occurred at the beginning of the period. |
| (c) | Included in the transfers out of Level 3 is approximately $282 million of privately issued securities that were priced using observable market data at December 31, 2010 and were, therefore, transferred to Level 2. |
At December 31, 2010, 86 percent of our Level 3 fixed maturities, available for sale, were investment grade and 81 percent of our Level 3 fixed maturities, available for sale, consisted of corporate securities.
Realized and unrealized investment gains and losses presented in the preceding table represent gains and losses during the time the applicable financial instruments were classified as Level 3.
Realized and unrealized gains (losses) on Level 3 assets are primarily reported in either net investment income for policyholder and reinsurer accounts and other special-purpose portfolios, net realized investment gains (losses) or insurance policy benefits within the consolidated statement of operations or accumulated other comprehensive income (loss) within shareholders’ equity based on the appropriate accounting treatment for the instrument.
Purchases, sales, issuances and settlements, net, represent the activity that occurred during the period that results in a change of the asset or liability but does not represent changes in fair value for the instruments held at the beginning of the period. Such activity primarily consists of purchases and sales of fixed maturity, equity and trading securities and purchases and settlements of derivative instruments.
We review the fair value hierarchy classifications each reporting period. Transfers in and/or (out) of Level 3 in 2010 were primarily due to changes in the observability of the valuation attributes resulting in a reclassification of certain financial assets or liabilities. Such reclassifications are reported as transfers in and out of Level 3 at the beginning fair value for the reporting period in which the changes occur.
Investment ratings are assigned the second lowest rating by a nationally recognized statistical rating organization (primarily Moody’s, S&P or Fitch Ratings (“Fitch”)), or if not rated by such firms, the rating assigned by the NAIC. NAIC designations of “1” or “2” include fixed maturities generally rated investment grade (rated “Baa3” or higher by Moody’s or rated “BBB-” or higher by S&P and Fitch. NAIC designations of “3” through “6” are referred to as below investment grade (which generally are rated “Ba1” or lower by Moody’s or rated “BB+” or lower by S&P and Fitch). References to investment grade or below investment grade throughout our consolidated financial statem ents are based on such nationally recognized statistical ratings. The following table sets forth fixed maturity investments at December 31, 2010, classified by ratings (dollars in millions):
| | | | | | | Estimated fair value | |
| | | | | | | | | | Percent of | |
| | | | Amortized | | | | | | fixed | |
| Investment rating | | | cost | | | Amount | | | maturities | |
| | | | | | | | | | | |
| AAA | | | $ | 2,798.3 | | | $ | 2,849.8 | | | | 14 | % |
| AA | | | | 2,024.6 | | | | 2,004.0 | | | | 10 | |
| A | | | | | 4,639.7 | | | | 4,810.4 | | | | 23 | |
| BBB+ | | | | 2,281.3 | | | | 2,356.5 | | | | 11 | |
| BBB | | | | 3,623.6 | | | | 3,756.6 | | | | 18 | |
| BBB- | | | | 2,983.1 | | | | 3,065.1 | | | | 15 | |
| | | | | | | | | | | | | | | |
| Investment grade | | | | 18,350.6 | | | | 18,842.4 | | | | 91 | |
| | | | | | | | | | | | | | | |
| BB+ | | | | 303.4 | | | | 300.5 | | | | 2 | |
| BB | | | | 218.6 | | | | 220.5 | | | | 1 | |
| BB- | | | | 669.3 | | | | 666.3 | | | | 3 | |
| B+ and below | | | | 613.9 | | | | 604.2 | | | | 3 | |
| | | | | | | | | | | | | | | |
| Below-investment grade | | | | 1,805.2 | | | | 1,791.5 | | | | 9 | |
| | | | | | | | | | | | | | | |
| Total fixed maturity securities | | | $ | 20,155.8 | | | $ | 20,633.9 | | | | 100 | % |
The following table summarizes investment yields earned over the past three years on the general account invested assets of our insurance subsidiaries. General account investments exclude the value of options (dollars in millions).
| | | 2010 | | | 2009 | | | 2008 | |
| | | | | | | | | | |
| Weighted average general account invested assets as defined: | | | | | | | | | |
| As reported | | $ | 22,965.8 | | | $ | 20,196.7 | | | $ | 19,597.9 | |
| Excluding unrealized appreciation (depreciation) (a) | | | 22,117.9 | | | | 21,667.7 | | | | 21,323.3 | |
| Net investment income on general account invested assets | | | 1,294.9 | | | | 1,230.6 | | | | 1,248.3 | |
| | | | | | | | | | | | | |
| Yields earned: | | | | | | | | | | | | |
| As reported | | | 5.64 | % | | | 6.09 | % | | | 6.37 | % |
| Excluding unrealized appreciation (depreciation) (a) | | | 5.85 | % | | | 5.68 | % | | | 5.85 | % |
| | | | | | | | | | | | | |
____________________
| | (a) | Excludes the effect of reporting fixed maturities at fair value as described in the note to our consolidated financial statements entitled “Investments”. |
Although investment income is a significant component of total revenues, the profitability of certain of our insurance products is determined primarily by the spreads between the interest rates we earn and the rates we credit or accrue to our insurance liabilities. At December 31, 2010 and 2009, the average yield, computed on the cost basis of our fixed maturity portfolio, was 5.9 percent and 5.7 percent, respectively, and the average interest rate credited or accruing to our total insurance liabilities (excluding interest rate bonuses for the first policy year only and excluding the effect of credited rates attributable to variable or fixed index products) was 4.5 percent and 4.5 percent, respectively.
Fixed Maturities, Available for Sale
Our fixed maturity portfolio at December 31, 2010, included primarily debt securities of the United States government, various corporations, and structured securities. Asset-backed securities, collateralized debt obligations, commercial mortgage-backed securities, mortgage pass-through securities and collateralized mortgage obligations are collectively referred to as “structured securities”.
At December 31, 2010, our fixed maturity portfolio had $815.0 million of unrealized gains and $336.9 million of unrealized losses, for a net unrealized gain of $478.1 million. Estimated fair values of fixed maturity investments were determined based on estimates from: (i) nationally recognized pricing services (85 percent of the portfolio); (ii) broker-dealer market makers (3 percent of the portfolio); and (iii) internally developed methods (12 percent of the portfolio).
At December 31, 2010, approximately 7.5 percent of our invested assets (8.7 percent of fixed maturity investments) were fixed maturities rated below-investment grade. Our level of investments in below-investment-grade fixed maturities could change based on market conditions or changes in our management policies. Below-investment grade corporate debt securities have different characteristics than investment grade corporate debt securities. Based on historical performance, probability of default by the borrower is significantly greater for below-investment grade securities and in many cases severity of loss is relatively greater as such securities are often subordinated to other indebtedness of the issuer. Also, issuers of below-investment grade securities frequently have higher levels of debt re lative to investment-grade issuers, hence, all other things being equal, are more sensitive to adverse economic conditions, such as recession or increasing interest rates. The Company attempts to reduce the overall risk related to its investment in below-investment grade securities, as in all investments, through careful credit analysis, strict investment policy guidelines, and diversification by issuer and/or guarantor and by industry. At December 31, 2010, our below-investment-grade fixed maturity investments had an amortized cost of $1,805.2 million and an estimated fair value of $1,791.5 million.
We continually evaluate the creditworthiness of each issuer whose securities we hold. We pay special attention to large investments and to those securities whose fair values have declined materially for reasons other than changes in interest rates or other general market conditions. We evaluate the realizable value of the investment, the specific condition of the issuer and the issuer’s ability to comply with the material terms of the security. We review the recent operational results and financial position of the issuer, information about its industry, information about factors affecting the issuer’s performance and other information. 40|86 Advisors employs experienced securities analysts in a variety of specialty areas who compile and review such data. If evidence does not exist to support a realizable value equal to or greater than the amortized cost of the investment, and such decline in fair value is determined to be other than temporary, we reduce the amortized cost to its fair value, which becomes the new cost basis. We report the amount of the reduction as a realized loss. We recognize any
recovery of such reductions as investment income over the remaining life of the investment (but only to the extent our current valuations indicate such amounts will ultimately be collected), or upon the repayment of the investment. During 2010, we recognized net realized investment gains of $30.2 million, which were comprised of $180.0 million of net gains from the sales of investments (primarily fixed maturities) with proceeds of $8.6 billion and $149.8 million of writedowns of investments for other than temporary declines in fair value recognized through net income ($146.8 million, prior to the $(3.0) million of impairment losses recognized through accumulated other comprehensive income (loss)). Our investment portfolio is subject to the risks of further declines in realizable value. However, we attempt to mitigate this risk through the diversification and active management of our portfolio.
Our investment strategy is to maximize, over a sustained period and within acceptable parameters of risk, investment income and total investment return through active investment management. Accordingly, we may sell securities at a gain or a loss to enhance the total return of the portfolio as market opportunities change or to better match certain characteristics of our investment portfolio with the corresponding characteristics of our insurance liabilities. While we do not have the intent to sell securities with unrealized losses and it is not more likely than not that we will be required to sell securities with unrealized losses prior to their anticipated recovery, we may sell securities at a loss in the future because of actual or expected changes in our view of the particular investment, its industry, its type or the general investment environment.
As of December 31, 2010, we had investments in substantive default (i.e., in default due to nonpayment of interest or principal) that had an estimated fair value of $0.6 million. 40|86 Advisors employs professionals with experience in managing non-performing and impaired investments. There were no other fixed maturity investments about which we had serious doubts as to the recoverability of the carrying value of the investment.
When a security defaults or securities (other than structured securities) are other-than-temporarily impaired, our policy is to discontinue the accrual of interest and eliminate all previous interest accruals, if we determine that such amounts will not be ultimately realized in full. Investment income forgone on nonperforming investments was $2.7 million, $6.7 and $.9 for the years ended December 31, 2010, 2009 and 2008, respectively.
At December 31, 2010, fixed maturity investments included structured securities with an estimated fair value of $4.2 billion (or 20 percent of all fixed maturity securities). The yield characteristics of structured securities can differ in some respects from those of traditional fixed-income securities. For example, interest and principal payments on structured securities may occur more frequently, often monthly. In many instances, we are subject to the risk that the amount and timing of principal and interest payments may vary from expectations. For example, in many cases, partial prepayments may occur at the option of the issuer and prepayment rates are influenced by a number of factors that cannot be predicted with certainty, including: the relative sensitivity of the underlying a ssets backing the security to changes in interest rates; a variety of economic, geographic and other factors; the timing and pace of liquidations of defaulted collateral; the amount of loan maturities; and various security-specific structural considerations (for example, the repayment priority of a given security in a securitization structure). In addition, the total amount of payments for non-government structured securities may be affected by changes to cumulative default rates or loss severities of the related collateral.
In general, the rate of prepayments on structured securities increases when prevailing interest rates decline significantly in absolute terms and also relative to the interest rates on the underlying assets. The yields recognized on structured securities purchased at a discount to par will increase (relative to the stated rate) when the underlying assets prepay faster than expected. The yield recognized on structured securities purchased at a premium will decrease (relative to the stated rate) when the underlying assets prepay faster than expected. When interest rates decline, the proceeds from prepayments may be reinvested at lower rates than we were earning on the prepaid securities. When interest rates increase, prepayments may decrease. When this occurs, the average maturity and duration of the structured securities increase, which decreases the yield on structured securities purchased at a discount because the discount is realized as income at a slower rate, and it increases the yield on those purchased at a premium because of a decrease in the annual amortization of the premium.
For structured securities included in fixed maturities, available for sale, that were purchased at a discount or premium, we recognize investment income using an effective yield based on anticipated future prepayments and the estimated final maturity of the securities. Actual prepayment experience is periodically reviewed and effective yields are recalculated when differences arise between the prepayments originally anticipated and the actual prepayments received and currently anticipated. For credit sensitive mortgage-backed and asset-backed securities, and for securities that can be prepaid or settled in a way that we would not recover substantially all of our investment, the effective yield is recalculated on a prospective basis. Under this method, the amortized cost basis in the security is not immedi ately adjusted and a new yield is applied prospectively. For all other structured and asset-backed securities, the effective yield is recalculated when changes in assumptions are made, and reflected in our income on a retrospective basis. Under this method, the amortized cost basis of the investment in the securities is adjusted to the amount that would have existed had the new effective yield been applied since the acquisition of the securities. Such adjustments were not significant in 2010.
The following table sets forth the par value, amortized cost and estimated fair value of structured securities, summarized by interest rates on the underlying collateral at December 31, 2010 (dollars in millions):
| | | Par | | | Amortized | | | Estimated | |
| | | value | | | cost | | | fair value | |
| | | | | | | | | | |
| Below 4 percent | | $ | 370.0 | | | $ | 328.0 | | | $ | 331.8 | |
| 4 percent – 5 percent | | | 516.5 | | | | 506.2 | | | | 484.0 | |
| 5 percent – 6 percent | | | 2,364.2 | | | | 2,289.4 | | | | 2,359.2 | |
| 6 percent – 7 percent | | | 891.6 | | | | 841.0 | | | | 865.4 | |
| 7 percent – 8 percent | | | 83.3 | | | | 84.5 | | | | 85.0 | |
| 8 percent and above | | | 84.9 | | | | 83.3 | | | | 82.7 | |
| | | | | | | | | | | | | |
| Total structured securities | | $ | 4,310.5 | | | $ | 4,132.4 | | | $ | 4,208.1 | |
The amortized cost and estimated fair value of structured securities at December 31, 2010, summarized by type of security, were as follows (dollars in millions):
| | | | | | Estimated fair value | |
| | | | | | | | | Percent | |
| | | Amortized | | | | | | of fixed | |
| Type | | cost | | | Amount | | | maturities | |
| | | | | | | | | | |
| Pass-throughs, sequential and equivalent securities | | $ | 1,347.9 | | | $ | 1,354.0 | | | | 6.6 | % |
| Planned amortization classes, target amortization classes and accretion-directed bonds | | | 568.9 | | | | 565.4 | | | | 2.7 | |
| Commercial mortgage-backed securities | | | 1,299.8 | | | | 1,363.7 | | | | 6.6 | |
| Asset-backed securities | | | 639.0 | | | | 644.1 | | | | 3.1 | |
| Collateralized debt obligations | | | 253.0 | | | | 256.5 | | | | 1.2 | |
| Other | | | 23.8 | | | | 24.4 | | | | .2 | |
| | | | | | | | | | | | | |
| Total structured securities | | $ | 4,132.4 | | | $ | 4,208.1 | | | | 20.4 | % |
Pass-throughs, sequentials and equivalent securities have unique prepayment variability characteristics. Pass-through securities typically return principal to the holders based on cash payments from the underlying mortgage obligations. Sequential securities return principal to tranche holders in a detailed hierarchy. Planned amortization classes, targeted amortization classes and accretion-directed bonds adhere to fixed schedules of principal payments as long as the underlying mortgage loans experience prepayments within certain estimated ranges. In most circumstances, changes in prepayment rates are first absorbed by support or companion classes insulating the timing of receipt of cash flows from the consequences of both faster prepayments (average life shortening) and slower prepayments (aver age life extension).
Commercial mortgage-backed securities are secured by commercial real estate mortgages, generally income producing properties that are managed for profit. Property types include multi-family dwellings including apartments, retail centers, hotels, restaurants, hospitals, nursing homes, warehouses, and office buildings. Most commercial mortgage-backed securities have call protection features whereby underlying borrowers may not prepay their mortgages for stated periods of time without incurring prepayment penalties.
During 2010, we sold $1.4 billion of fixed maturity investments which resulted in gross investment losses (before income taxes) of $147.7 million. We sell securities at a loss for a number of reasons including, but not limited to: (i) changes in the investment environment; (ii) expectation that the fair value could deteriorate further; (iii) desire to reduce our exposure to an asset class, an issuer or an industry; (iv) changes in credit quality; or (v) changes in expected liability cash flows. As discussed in the notes to our consolidated financial statements, the realization of gains and losses affects the timing of the amortization of insurance acquisition costs related to universal life and investment products.
Other Investments
At December 31, 2010, we held commercial mortgage loan investments with a carrying value of $1,761.2 million (or 7 percent of total invested assets) and a fair value of $1,762.6 million. None of the commercial mortgage loan balance was noncurrent at December 31, 2010. During 2010, we recognized $40.8 million of writedowns of commercial mortgage loans resulting from declines in fair value that we concluded were other than temporary. During 2009, we recognized $40.9 million of writedowns of commercial mortgage loans resulting from declines in fair value that we concluded were other than temporary. During 2008, we recognized $5.8 million of writedowns of commercial mortgage loans for other-than-temporary declines in fair value and recognized losses of $22.1 million from the liquidation of several delinquent commercial mortgage loans. We had no allowance for loss on mortgage loans at both December 31, 2010 and 2009. Approximately 7 percent, 7 percent, 6 percent, 6 percent, 5 percent and 5 percent of the mortgage loan balance were on properties located in Minnesota, California, Arizona, Florida, North Carolina and Indiana, respectively. No other state comprised greater than five percent of the mortgage loan balance.
The following table shows the distribution of our commercial mortgage loan portfolio by property type as of December 31, 2010 (dollars in millions):
| | | Number of | | | Carrying | |
| | | loans | | | value | |
| | | | | | | |
| Retail | | | 239 | | | $ | 700.3 | |
| Office building | | | 83 | | | | 656.0 | |
| Industrial | | | 43 | | | | 316.0 | |
| Multi-family | | | 20 | | | | 85.4 | |
| Other | | | 1 | | | | 3.5 | |
| | | | | | | | | |
| Total commercial mortgage loans | | | 386 | | | $ | 1,761.2 | |
The following table shows our commercial mortgage loan portfolio by loan size as of December 31, 2010 (dollars in millions):
| | | Number | | | Carrying | |
| | | of loans | | | value | |
| | | | | | | |
| Under $5 million | | | 279 | | | $ | 484.3 | |
| $5 million but less than $10 million | | | 58 | | | | 412.8 | |
| $10 million but less than $20 million | | | 31 | | | | 400.4 | |
| Over $20 million | | | 18 | | | | 463.7 | |
| | | | | | | | | |
| Total commercial mortgage loans | | | 386 | | | $ | 1,761.2 | |
The following table summarizes the distribution of maturities of our commercial mortgage loans as of December 31, 2010 (dollars in millions):
| | | Number | | | Carrying | |
| | | of loans | | | value | |
| | | | | | | |
| 2011 | | | 11 | | | $ | 25.1 | |
| 2012 | | | 16 | | | | 40.2 | |
| 2013 | | | 16 | | | | 154.8 | |
| 2014 | | | 24 | | | | 88.7 | |
| 2015 | | | 29 | | | | 123.1 | |
| after 2015 | | | 290 | | | | 1,329.3 | |
| | | | | | | | | |
| Total commercial mortgage loans | | | 386 | | | $ | 1,761.2 | |
The following table provides the weighted average loan-to-value ratio for our outstanding mortgage loans as of December 31, 2010 (dollars in millions):
| | | | | | | |
| | | | | | Estimated fair | |
| Loan-to-value ratio (a) | | Carrying value | | | value | |
| | | | | | | |
| Less than 60% | | $ | 705.9 | | | $ | 752.5 | |
| 60% to 70% | | | 657.2 | | | | 630.7 | |
| 70% to 80% | | | 296.5 | | | | 286.5 | |
| 80% to 90% | | | 46.3 | | | | 43.9 | |
| Greater than 90% | | | 55.3 | | | | 49.0 | |
| | | | | | | | | |
| Total | | $ | 1,761.2 | | | $ | 1,762.6 | |
__________
| (a) | Loan-to-value ratios are calculated as the ratio of: (i) the carrying value of the commercial mortgage loans; to (ii) the estimated fair value of the underlying commercial property. |
At December 31, 2010, we held $372.6 million of trading securities. We carry trading securities at estimated fair value; changes in fair value are reflected in the statement of operations. Our trading securities are held to act as hedges for embedded derivatives related to our fixed index annuity products and certain modified coinsurance agreements. See the note to the consolidated financial statements entitled “Summary of Significant Accounting Policies - Accounting for Derivatives” for further discussion regarding the embedded derivatives and the trading accounts. In addition, the trading account includes investments backing the market strategies of our multibucket annuity products.
Other invested assets also include options backing our fixed index products, futures, credit default swaps, forward contracts and certain nontraditional investments, including investments in limited partnerships, promissory notes and real estate investments held for sale.
At December 31, 2010, we held investments with an amortized cost of $428.0 million and an estimated fair value of $420.9 million related to variable interest entities that we are required to consolidate. The investment portfolio held by the variable interest entities is primarily comprised of corporate fixed maturity securities which are almost entirely rated as below-investment grade securities. Refer to the note to the consolidated financial statements entitled “Investments in Variable Interest Entities” for additional information on these investments.
The Company participated in a securities lending program whereby certain fixed maturity securities from our investment portfolio were loaned to third parties via a lending agent for a short period of time. We maintained ownership of the loaned securities. We required collateral equal to 102 percent of the fair value of the loaned securities. The collateral was invested by the lending agent in accordance with our guidelines. The fair value of the loaned securities was monitored on a daily basis with additional collateral obtained as necessary. In the third quarter of 2010, the Company discontinued its securities lending program. As of December 31, 2009, the fair value of the loaned securities was $178.5 million. As of December 31, 2009, the Company had received c ollateral of $185.7 million. Income generated from the program, net of expenses is recorded as net investment income and totaled $.2 million, $1.2 million and $2.4 million in 2010, 2009 and 2008, respectively.
CONSOLIDATED FINANCIAL CONDITION
Changes in the Consolidated Balance Sheet
Changes in our consolidated balance sheet between December 31, 2010 and December 31, 2009, primarily reflect: (i) our net income for 2010; (ii) changes in the fair value of our fixed maturity securities, available for sale; and (iii) the changes to corporate notes payable in 2010 as further described in the note to the consolidated financial statements entitled “Notes Payable – Direct Corporate Obligations”.
In accordance with GAAP, we record our fixed maturity securities, available for sale, equity securities and certain other invested assets at estimated fair value with any unrealized gain or loss (excluding impairment losses, which are recognized through earnings), net of tax and related adjustments, recorded as a component of shareholders’ equity. At December 31, 2010, we increased the carrying value of such investments by $.5 billion as a result of this fair value adjustment.
Our capital structure as of December 31, 2010 and 2009 was as follows (dollars in millions):
| | | 2010 | | | 2009 | |
| Total capital: | | | | | | |
| Corporate notes payable | | $ | 998.5 | | | $ | 1,037.4 | |
| | | | | | | | | |
| Shareholders’ equity: | | | | | | | | |
| Common stock | | | 2.5 | | | | 2.5 | |
| Additional paid-in capital | | | 4,424.2 | | | | 4,408.8 | |
| Accumulated other comprehensive income (loss) | | | 238.3 | | | | (264.3 | ) |
| Accumulated deficit | | | (339.7 | ) | | | (614.6 | ) |
| | | | | | | | | |
| Total shareholders’ equity | | | 4,325.3 | | | | 3,532.4 | |
| | | | | | | | | |
| Total capital | | $ | 5,323.8 | | | $ | 4,569.8 | |
The following table summarizes certain financial ratios as of and for the years ended December 31, 2010 and 2009:
| | | 2010 | | | 2009 | |
| | | | | | | |
| Book value per common share | | $ | 17.23 | | | $ | 14.09 | |
| Book value per common share, excluding accumulated other comprehensive income (loss) (a) | | | 16.28 | | | | 15.14 | |
| | | | | | | | | |
| Ratio of earnings to fixed charges | | | 1.68 | X | | | 1.38 | X |
| | | | | | | | | |
| Debt to total capital ratios: | | | | | | | | |
| Corporate debt to total capital | | | 18.76 | % | | | 22.70 | % |
| Corporate debt to total capital, as defined in our senior secured credit facility (b) | | | 19.99 | % | | | 21.63 | % |
____________________
| (a) | This non-GAAP measure differs from the corresponding GAAP measure presented immediately above, because accumulated other comprehensive income (loss) has been excluded from the value of capital used to determine this measure. Management believes this non-GAAP measure is useful because it removes the volatility that arises from changes in accumulated other comprehensive income (loss). Such volatility is often caused by changes in the estimated fair value of our investment portfolio resulting from changes in general market interest rates rather than the business decisions made by management. However, this measure does not replace the corresponding GAAP measure. |
| (b) | Such ratio excludes accumulated other comprehensive income (loss) from total capital. In addition, debt is defined as par value plus accrued interest and certain other items. Management believes this non-GAAP measure is useful as the level of such ratio impacts certain provisions in our senior secured credit facility. |
Contractual Obligations
The Company’s significant contractual obligations as of December 31, 2010, were as follows (dollars in millions):
| | | | | | Payment due in | |
| | | Total | | | 2011 | | | | 2012-2013 | | | | 2014-2015 | | | Thereafter | |
| | | | | | | | | | | | | | | | | | |
| Insurance liabilities (a) | | $ | 54,449.6 | | | $ | 3,591.5 | | | $ | 7,135.4 | | | $ | 7,126.0 | | | $ | 36,596.7 | |
| Notes payable (b) | | | 1,430.3 | | | | 121.7 | | | | 286.4 | | | | 278.2 | | | | 744.0 | |
| Investment borrowings (c) | | | 1,420.6 | | | | 35.0 | | | | 258.1 | | | | 877.2 | | | | 250.3 | |
| Borrowings related to variable interest entities (d) | | | 429.2 | | | | 6.1 | | | | 12.2 | | | | 12.2 | | | | 398.7 | |
| Postretirement plans (e) | | | 196.9 | | | | 4.7 | | | | 10.2 | | | | 12.1 | | | | 169.9 | |
| Operating leases and certain other | | | | | | | | | | | | | | | | | | | | |
| contractual commitments (f) | | | 189.5 | | | | 45.0 | | | | 60.8 | | | | 38.1 | | | | 45.6 | |
| | | | | | | | | | | | | | | | | | | | | |
| Total | | $ | 58,116.1 | | | $ | 3,804.0 | | | $ | 7,763.1 | | | $ | 8,343.8 | | | $ | 38,205.2 | |
____________________
| | (a) | These cash flows represent our estimates of the payments we expect to make to our policyholders, without consideration of future premiums or reinsurance recoveries. These estimates are based on numerous assumptions (depending on the product type) related to mortality, morbidity, lapses, withdrawals, future premiums, future deposits, interest rates on investments, credited rates, expenses and other factors which affect our future payments. The cash flows presented are undiscounted for interest. As a result, total outflows for all years exceed the corresponding liabilities of $24.5 billion included in our consolidated balance sheet as of December 31, 2010. As such payments are based on numerous assumptions, the actual payments may vary significantly from the amounts shown. |
In estimating the payments we expect to make to our policyholders, we considered the following:
| · | For products such as immediate annuities and structured settlement annuities without life contingencies, the payment obligation is fixed and determinable based on the terms of the policy. |
| · | For products such as universal life, ordinary life, long-term care, supplemental health and fixed rate annuities, the future payments are not due until the occurrence of an insurable event (such as death or disability) or a triggering event (such as a surrender or partial withdrawal). We estimated these payments using actuarial models based on historical experience and our expectation of the future payment patterns. |
| · | For short-term insurance products such as Medicare supplement insurance, the future payments relate only to amounts necessary to settle all outstanding claims, including those that have been incurred but not reported as of the balance sheet date. We estimated these payments based on our historical experience and our expectation of future payment patterns. |
| · | The average interest rate we assumed would be credited to our total insurance liabilities (excluding interest rate bonuses for the first policy year only and excluding the effect of credited rates attributable to variable or fixed index products) over the term of the contracts was 4.5 percent. |
| (b) | Includes projected interest payments based on market rates, as applicable, as of December 31, 2010. Refer to the note to the consolidated financial statements entitled “Notes Payable – Direct Corporate Obligations” for additional information on notes payable. |
| (c) | These borrowings primarily represent collateralized borrowings from the Federal Home Loan Bank (“FHLB”). |
| (d) | These borrowings represent the securities issued by VIEs and include projected interest payments based on market rates, as applicable, as of December 31, 2010. |
| (e) | Includes benefits expected to be paid pursuant to our deferred compensation plan and postretirement plans based on numerous actuarial assumptions and interest credited at 5.50 percent. |
| (f) | Refer to the notes to the consolidated financial statements entitled “Commitments and Contingencies” for additional information on operating leases and certain other contractual commitments. |
It is possible that the ultimate outcomes of various uncertainties could affect our liquidity in future periods. For example, the following events could have a material adverse effect on our cash flows:
| · | An adverse decision in pending or future litigation. |
| · | An inability to obtain rate increases on certain of our insurance products. |
| · | Worse than anticipated claims experience. |
| · | Lower than expected dividends and/or surplus debenture interest payments from our insurance subsidiaries (resulting from inadequate earnings or capital or regulatory requirements). |
| · | An inability to meet and/or maintain the covenants in our New Senior Secured Credit Agreement. |
| · | A significant increase in policy surrender levels. |
| · | A significant increase in investment defaults. |
| · | An inability of our reinsurers to meet their financial obligations. |
While we seek to balance the duration and cash flows of our invested assets with the estimated duration and cash flows of benefit payments arising from contract liabilities, there could be significant variations in the timing of such cash flows. Although we believe our current estimates properly project future claim experience, if these estimates prove to be wrong, and our experience worsens (as it did in some prior periods), our future liquidity could be adversely affected.
Liquidity for Insurance Operations
Our insurance companies generally receive adequate cash flows from premium collections and investment income to meet their obligations. Life insurance, long-term care insurance and annuity liabilities are generally long-term in nature. Life and annuity policyholders may, however, withdraw funds or surrender their policies, subject to any applicable penalty provisions; there are generally no withdrawal or surrender benefits for long-term care insurance. We seek to balance the duration of our invested assets with the estimated duration of benefit payments arising from contract liabilities.
Two of the Company’s insurance subsidiaries (Conseco Life and Bankers Life) are members of the FHLB. As members of the FHLB, Conseco Life and Bankers Life have the ability to borrow on a collateralized basis from FHLB. Conseco Life and Bankers Life are required to hold certain minimum amounts of FHLB common stock as a requirement of membership in the FHLB, and additional amounts based on the amount of the borrowings. At December 31, 2010, the carrying value of the FHLB common stock was $60.0 million. As of December 31, 2010, collateralized borrowings from the FHLB totaled $1.2 billion (of which, $750.0 million was borrowed in 2010) and the proceeds were used to purchase fixed maturity securities. The borrowings are classified as investment borrowings in the accompanying consoli dated balance sheet. The borrowings are collateralized by investments with an estimated fair value of $1.5 billion at December 31, 2010, which are maintained in a custodial account for the benefit of the FHLB.
The following summarizes the terms of the borrowings (dollars in millions):
| Amount | | Maturity | | Interest rate |
| borrowed | | date | | at December 31, 2010 |
| | | | | |
| $ | 54.0 | | May 2012 | | Variable rate – 0.284% |
| | 13.0 | | July 2012 | | Variable rate – 0.349% |
| | 100.0 | | October 2013 | | Variable rate – 0.591% |
| | 100.0 | | September 2015 | | Variable rate – 0.611% |
| | 100.0 | | September 2015 | | Variable rate – 0.588% |
| | 100.0 | | October 2015 | | Variable rate – 0.616% |
| | 150.0 | | October 2015 | | Variable rate – 0.610% |
| | 146.0 | | November 2015 | | Fixed rate – 5.300% |
| | 100.0 | | November 2015 | | Fixed rate – 4.890% |
| | 100.0 | | December 2015 | | Fixed rate – 4.710% |
| | 50.0 | | November 2016 | | Variable rate – 0.573% |
| | 50.0 | | November 2016 | | Variable rate – 0.731% |
| | 100.0 | | October 2017 | | Variable rate – 0.715% |
| | 37.0 | | November 2017 | | Fixed rate – 3.750% |
| | | | | | |
| $ | 1,200.0 | | | | |
State laws generally give state insurance regulatory agencies broad authority to protect policyholders in their jurisdictions. Regulators have used this authority in the past to restrict the ability of our insurance subsidiaries to pay any dividends or other amounts without prior approval. We cannot be assured that the regulators will not seek to assert greater supervision and control over our insurance subsidiaries’ businesses and financial affairs.
During 2010, the financial statements of one of our subsidiaries prepared in accordance with statutory accounting practices prescribed or permitted by regulatory authorities reflected asset adequacy or premium deficiency reserves. Total asset adequacy and premium deficiency reserves for Washington National were $75.3 million at December 31, 2010. Due to differences between statutory and GAAP insurance liabilities, we were not required to recognize a similar premium deficiency reserve in our consolidated financial statements prepared in accordance with GAAP. The determination of the need for and amount of asset adequacy reserves is subject to numerous actuarial assumptions, including the Company’s ability to change nonguaranteed elements related to certain products consistent with contract provisions .
Financial Strength Ratings of our Insurance Subsidiaries
Financial strength ratings provided by A.M. Best, S&P and Moody’s are the rating agency’s opinions of the ability of our insurance subsidiaries to repay policyholder claims and obligations when due.
On December 22, 2010, A.M. Best upgraded the financial strength ratings of our primary insurance subsidiaries, except Conseco Life, to “B+” from “B”. A.M. Best also affirmed the financial strength rating of “B-“ of Conseco Life and revised the outlook for the rating of Conseco Life to stable from negative. On March 23, 2010, A.M. Best affirmed the financial strength rating of “B” of our primary insurance subsidiaries, except Conseco Life, whose “B” rating was downgraded to “B-”. A.M. Best also revised the outlook for the ratings of our primary insurance subsidiaries to stable from negative, except for Conseco Life, whose outlook of negative was affirmed. A “stable” designation means that there is a low likelihoo d of a rating change due to stable financial market trends. The “B+” rating is assigned to companies that have a good ability, in A.M. Best’s opinion, to meet their ongoing obligations to policyholders. A “B-” rating is assigned to companies that have a fair ability, in A.M. Best’s opinion, to meet their current obligations to policyholders, but are financially vulnerable to adverse changes in underwriting and economic conditions. A.M. Best ratings for the industry currently range from “A++ (Superior)” to “F (In Liquidation)” and some companies are not rated. An “A++” rating indicates a superior ability to meet ongoing obligations to policyholders. A.M. Best has sixteen possible ratings. There are five ratings above the “B+” rating of our primary insurance subsidiaries, other than Conseco Life, and ten ratings that are below that rating. There are se ven ratings above the “B-” rating of Conseco Life and eight ratings that are below that rating.
On December 21, 2010, S&P upgraded the financial strength ratings of our primary insurance subsidiaries to “BB” from “BB-” and the outlook for such ratings is stable. A “stable” designation means that a rating is not likely to change. S&P financial strength ratings range from “AAA” to “R” and some companies are not rated. An insurer rated “BB” or lower is regarded as having vulnerable characteristics that may outweigh its strengths. A “BB” rating indicates the least degree of
vulnerability within the range; a “CC” rating indicates the highest degree of vulnerability. Pluses and minuses show the relative standing within a category. In S&P’s view, an insurer rated “BB” has marginal financial security characteristics and although positive attributes exist, adverse business conditions could lead to an insufficient ability to meet financial commitments. S&P has twenty-one possible ratings. There are eleven ratings above our “BB” rating and nine ratings that are below our rating.
On November 30, 2010, Moody’s affirmed the financial strength rating of “Ba1” of our primary insurance subsidiaries with a stable outlook. On May 26, 2010, Moody’s upgraded the financial strength ratings of our primary insurance subsidiaries to “Ba1” from “Ba2”. Moody’s also revised the outlook for the ratings of our primary insurance subsidiaries to stable from positive. A “stable” designation means that a rating is not likely to change. Moody’s financial strength ratings range from “Aaa” to “C”. Rating categories from “Aaa” to “Baa” are classified as “secure” by Moody’s and rating categories from “Ba” to “C” are considered “vulnerable” and these ratings may be supplemented with numbers “1”, “2”, or “3” to show relative standing within a category. In Moody’s view, an insurer rated “Ba1” offers questionable financial security and, often, the ability of these companies to meet policyholders’ obligations may be very moderate and thereby not well safeguarded in the future. Moody’s has twenty-one possible ratings. There are ten ratings above our “Ba1” rating and ten ratings that are below our rating.
In light of the difficulties experienced recently by many financial institutions, including insurance companies, rating agencies have increased the frequency and scope of their credit reviews and requested additional information from the companies that they rate, including us. They may also adjust upward the capital and other requirements employed in the rating agency models for maintenance of certain ratings levels. We cannot predict what actions rating agencies may take, or what actions we may take in response. Accordingly, downgrades and outlook revisions related to us or the life insurance industry may occur in the future at any time and without notice by any rating agency. These could increase policy surrenders and withdrawals, adversely affect relationships with our distribution channels, reduce new sales, reduce our ability to borrow and increase our future borrowing costs.
Liquidity of the Holding Companies
Availability and Sources and Uses of Holding Company Liquidity; Limitations on Ability of Insurance Subsidiaries to Make Dividend and Surplus Debenture Interest Payments to the Holding Companies
At December 31, 2010, CNO, CDOC (our wholly owned subsidiary and a guarantor under the New Senior Credit Agreement) and our other non-insurance subsidiaries held unrestricted cash of $161 million. CNO and CDOC are holding companies with no business operations of their own; they depend on their operating subsidiaries for cash to make principal and interest payments on debt, and to pay administrative expenses and income taxes. CNO and CDOC receive cash from insurance subsidiaries, consisting of dividends and distributions, interest payments on surplus debentures and tax-sharing payments, as well as cash from non-insurance subsidiaries consisting of dividends, distributions, loans and advances. The principal non-insurance subsidiaries that provide cash to CNO and CDOC are 40|86 Advisors, which receives fees from the insurance subsidiaries for investment services, and CNO Services, LLC which receives fees from the insurance subsidiaries for providing administrative services. The agreements between our insurance subsidiaries and CNO Services, LLC and 40|86 Advisors, respectively, were previously approved by the domestic insurance regulator for each insurance company, and any payments thereunder do not require further regulatory approval.
The following summarizes the current legal ownership structure of CNO’s primary subsidiaries:
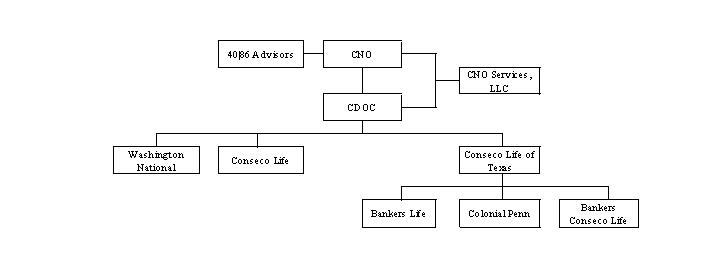
The ability of our insurance subsidiaries to pay dividends is subject to state insurance department regulations and is based on the financial statements of our insurance subsidiaries prepared in accordance with statutory accounting practices prescribed or permitted by regulatory authorities, which differ from GAAP. These regulations generally permit dividends to be paid from statutory earned surplus of the insurance company for any 12-month period in amounts equal to the greater of (or in a few states, the lesser of): (i) statutory net gain from operations or net income for the prior year; or (ii) 10 percent of statutory capital and surplus as of the end of the preceding year (excluded from this calculation would be the $76.1 million of additi onal surplus recognized due to temporary modifications in statutory prescribed practices related to certain deferred tax assets). These types of dividends are referred to as “ordinary dividends”. Any dividends in excess of these levels require the approval of the director or commissioner of the applicable state insurance department. These types of dividends are referred to as “extraordinary dividends”. Each of the direct insurance subsidiaries of CDOC has significant negative earned surplus and any dividend payments from the subsidiaries of CDOC would be considered extraordinary dividends and therefore require the approval of the director or commissioner of the applicable state insurance department. We generally maintain capital and surplus levels in our insurance subsidiaries in an amount that is sufficient to maintain a minimum consolidated RBC ratio of approximately 300% and will typically cause our insurance subsidiaries to pay ordinary dividends or request regulatory approval for extraordinary dividends when the consolidated RBC ratio exceeds such level and we have concluded the capital level in each of our insurance subsidiaries is adequate to support their business and projected growth. The consolidated RBC ratio of our insurance subsidiaries was 332% at December 31, 2010. We expect to receive regulatory approval for future dividends from our subsidiaries, but there can be no assurance that such payments will be approved or that the financial condition of our insurance subsidiaries will not change, making future approvals less likely.
CDOC holds surplus debentures from Conseco Life of Texas with an aggregate principal amount of $749.6 million. Interest payments on surplus debentures from Conseco Life of Texas do not require additional approval provided the RBC ratio of Conseco Life of Texas exceeds 100 percent (but do require prior written notice to the Texas state insurance department). The RBC ratio of Conseco Life of Texas was 262% at December 31, 2010. Dividends and other payments from our non-insurance subsidiaries, including 40|86 Advisors and CNO Services, LLC, to CNO or CDOC do not require approval by any regulatory authority or other third party. However, insurance regulators may prohibit payments by our insurance subsidiaries to parent companies if they determine that such payments could be adverse to our policyhol ders or contractholders.
The insurance subsidiaries of CDOC receive funds to pay dividends primarily from: (i) the earnings of their direct businesses; (ii) tax sharing payments received from subsidiaries (if applicable); and (iii) with respect to Conseco Life of Texas, dividends received from subsidiaries. At December 31, 2010, the subsidiaries of Conseco Life of Texas had earned surplus (deficit) as summarized below (dollars in millions):
| | | Earned surplus | | |
| Subsidiary of CDOC | | (deficit) | | Additional information |
| | | | | |
| Subsidiaries of Conseco Life of Texas: | | | | |
| Bankers Life | | $ | 146.6 | | | (a) |
| Colonial Penn | | | (243.4 | ) | | (b) |
___________
| (a) | Bankers Life paid ordinary dividends of $86.0 million to Conseco Life of Texas in 2010. |
| (b) | The deficit is primarily due to transactions which occurred several years ago, including a tax planning transaction and the fee paid to recapture a block of business previously ceded to an unaffiliated insurer. |
A significant deterioration in the financial condition, earnings or cash flow of the material subsidiaries of CNO or CDOC for any reason could hinder such subsidiaries’ ability to pay cash dividends or other disbursements to CNO and/or CDOC, which, in turn, could limit CNO’s ability to meet debt service requirements and satisfy other financial obligations. In addition, we may choose to retain capital in our insurance subsidiaries or to contribute additional capital to our insurance subsidiaries to strengthen their surplus, and these decisions could limit the amount available at our top tier insurance subsidiaries to pay dividends to the holding companies. In the past, we have made capital contributions to our insurance subsidiaries to meet debt covenants and minimum capital levels required by certain reg ulators and it is possible we will be required to do so in the future. In 2010, the cash dividends we received from our insurance subsidiaries exceeded capital contributions to such subsidiaries by $51.6 million.
The scheduled principal and interest payments on our direct corporate obligations (including payments required under the New Senior Credit Agreement, the Senior Health Note, the 9.0% Senior Secured Notes and the 7.0% Debentures) are as follows (dollars in millions):
| | | Principal | | | Interest (a) | |
| | | | | | | |
| 2011 | | $ | 55.0 | | | $ | 66.7 | |
| 2012 | | | 65.0 | | | | 73.2 | |
| 2013 | | | 80.0 | | | | 68.2 | |
| 2014 | | | 75.0 | | | | 62.1 | |
| 2015 | | | 85.0 | | | | 56.1 | |
| 2016 | | | 383.0 | | | | 48.7 | |
| 2017 | | | - | | | | 24.7 | |
| 2018 | | | 275.0 | | | | 12.6 | |
| | | | | | | | | |
| | | $ | 1,018.0 | | | $ | 412.3 | |
_______
| (a) | Based on interest rates as of December 31, 2010. |
In connection with the Transfer further discussed in the note to the consolidated financial statements entitled “Transfer of Senior Health Insurance Company of Pennsylvania to an Independent Trust”, the Company issued the Senior Health Note. The Senior Health Note has a 6 percent interest rate and requires annual principal payments of $25.0 million. Such amounts are expected to be funded by the Company’s operating activities. CNO agreed that it would not pay cash dividends on its common stock while any portion of the Senior Health Note remained outstanding. At December 31, 2010, the outstanding balance under the Senior Health Note was $75.0 million.
New Senior Secured Credit Agreement
On December 21, 2010, the Company entered the New Senior Secured Credit Agreement. The net proceeds of $363.6 million were used to repay a portion of the amount outstanding under the Previous Senior Credit Agreement.
The interest rate applicable to the New Senior Secured Credit Agreement is, at our option (in most instances), a Eurodollar rate of Libor plus 6.00 percent (subject to a Libor “floor” of 1.5 percent) or a Base Rate plus 5.00 percent (subject to a Base Rate “floor” of 2.5 percent). The pricing terms for the New Senior Secured Credit Agreement included upfront fees of 1.25 percent paid to the lenders. At December 31, 2010, the interest rate on our New Senior Secured Credit Agreement was 7.5 percent. The New Senior Secured Credit Agreement is guaranteed by the Subsidiary Guarantors and secured by substantially all of our and the Subsidiary Guarantors’ assets.
The New Senior Credit Agreement contains covenants that limit the Company’s ability to take certain actions and perform certain activities, including (each subject to exceptions as set forth in the New Senior Credit Agreement):
| · | limitations on debt (including, without limitation, guarantees and other contingent obligations); |
| · | limitations on issuances of disqualified capital stock; |
| · | limitations on liens and further negative pledges; |
| · | limitations on sales, transfers and other dispositions of assets; |
| · | limitations on transactions with affiliates; |
| · | limitations on changes in the nature of the Company’s business; |
| · | limitations on mergers, consolidations and acquisitions; |
| · | limitations on dividends and other distributions, stock repurchases and redemptions and other restricted payments; |
| · | limitations on investments and acquisitions; |
| · | limitations on prepayment of certain debt; |
| · | limitations on modifications or waivers of certain debt documents and charter documents; |
| · | investment portfolio requirements for insurance subsidiaries; |
| · | limitations on restrictions affecting subsidiaries; |
| · | limitations on holding company activities; and |
| · | limitations on changes in accounting policies. |
In addition, the New Senior Secured Credit Agreement requires the Company to maintain: (i) a debt to total capitalization ratio of not more than 30 percent (such ratio was 19.99 percent at December 31, 2010); (ii) an interest coverage ratio of not less than 2.00 to 1.00 for each rolling four quarters (or, if less, the number of full fiscal quarters commencing after the effective date of the New Senior Secured Credit Agreement) (such ratio was not applicable for the period ended December 31, 2010); (iii) an aggregate ratio of total adjusted capital to company action level risk-based capital for the Company’s insurance subsidiaries of not less than 225 percent on or prior to December 31, 2011 and 250 percent thereafter (such ratio was 332 percent at December 31, 2010); and (iv) a combined statutory capital and surplus for the Company’s insurance subsidiaries of at least $1,200.0 million (combined statutory capital and surplus at December 31, 2010, was $1,596.4 million).
We may prepay, in whole or in part, the New Senior Secured Credit Agreement, together with any accrued and unpaid interest, with prior notice but without premium or penalty in minimum amounts of $1.0 million or any multiple thereof.
Mandatory prepayments of the New Senior Secured Credit Agreement will be required in an amount equal to: (i) 100 percent of the net cash proceeds from certain asset sales or casualty events; (ii) 100 percent of the net cash proceeds received by the Company or any of its subsidiaries from certain debt issuances; (iii) 50 percent of the net cash proceeds received from certain equity issuances; and (iv) 100 percent of the amount of certain restricted payments made (including any common stock dividends and share repurchases) as defined in the New Senior Secured Credit Agreement.
Notwithstanding the foregoing, no mandatory prepayments pursuant to items (i) or (iii) in the preceding paragraph shall be required if: (x) the debt to total capitalization ratio is equal or less than 20 percent; and (y) either (A) the financial strength rating of certain insurance subsidiaries is equal or better than A- (stable) from A.M. Best or (B) the New Senior Secured Credit Agreement is rated equal or better than BBB- (stable) from S&P and Baa3 (stable) by Moody’s.
In connection with the execution of the New Senior Secured Credit Agreement, the Company and the Subsidiary Guarantors entered into a guarantee and security agreement, dated as of December 21, 2010 (the “Guarantee and Security Agreement”), by and among the Company, the Subsidiary Guarantors and Morgan Stanley Senior Funding, Inc., as Agent, pursuant to which the Subsidiary Guarantors guaranteed all of the obligations of the Company under the New Senior Secured Credit Agreement and the Company and the Subsidiary Guarantors pledged substantially all of their assets to secure the New Senior Secured Credit Agreement, subject to certain exceptions as set forth in the Guarantee and Security Agreement.
9.0% Senior Secured Notes
On December 21, 2010, we issued $275.0 million aggregate principal amount of 9.0% Senior Secured Notes. The net proceeds of $267.0 million were used to repay a portion of the amount outstanding under the Previous Senior Credit Agreement.
The 9.0% Senior Secured Notes were issued pursuant to an indenture governing the 9.0% Senior Secured Notes dated as of December 21, 2010 (the “Indenture”), by and among the Company, the Subsidiary Guarantors and Wilmington Trust FSB, as trustee and collateral agent (the “Trustee”).
The 9.0% Senior Secured Notes will mature on January 15, 2018. Interest on the 9.0% Senior Secured Notes accrues at a rate of 9.0% per annum and is payable semiannually in arrears on January 15 and July 15 of each year, commencing on July 15, 2011. The 9.0% Senior Secured Notes and the guarantees thereof (the “Guarantee”) are senior secured obligations of the Company and the Subsidiary Guarantors and rank equally in right of payment with all of the Company’s and the Subsidiary Guarantor’s existing and future senior obligations, and senior to all of the Company’s and the Subsidiary Guarantors’ existing and future subordinated indebtedness. The 9.0% Senior Secured Notes are secured by substantially all of the assets of the Company and the Subsidiary Guarantors, subject to certain exceptions. The 9.0% Senior Secured Notes and the Guarantees are pari passu to all of the Company’s and the Subsidiary Guarantors’ existing and future secured indebtedness under the New Senior Secured Credit Agreement.
The Company may redeem all or part of the 9.0% Senior Secured Notes beginning on January 15, 2014, at the redemption prices set forth in the Indenture. The Company may also redeem all or part of the 9.0% Senior Secured Notes at any time and from time to time prior to January 15, 2014, at a price equal to 100% of the aggregate principal amount of the 9.0% Senior Secured Notes to be redeemed plus a “make-whole” premium and accrued and unpaid interest. In addition, prior to January 15, 2014, the Company may redeem up to 35% of the aggregate principal amounts of the 9.0% Senior Secured Notes with the net cash proceeds of certain equity offerings at a price equal to 109.000% of the aggregate principal amount of the 9.0% Senior Secured Notes to be redeemed plus accrued and unpaid interest.
Upon the occurrence of a change of control (as defined in the Indenture), each holder of the 9.0% Senior Secured Notes may require the Company to repurchase all or a portion of the 9.0% Senior Secured Notes in cash at a price equal to 101% of the aggregate principal amount of the 9.0% Senior Secured Notes to be repurchased, plus accrued and unpaid interest, if any, to the date of repurchase.
The Indenture contains covenants that, among other things, limit (subject to certain exceptions) the Company’s ability and the ability of the Company’s Restricted Subsidiaries (as defined in the Indenture) to:
| · | incur or guarantee additional indebtedness or issue preferred stock; |
| · | pay dividends or make other distributions to shareholders; |
| · | purchase or redeem capital stock or subordinated indebtedness; |
| · | incur restrictions on the Company’s ability and the ability of the Restricted Subsidiaries to pay dividends or make other payments to the Company; |
| · | sell assets, including capital stock of the Company’s subsidiaries; |
| · | consolidate or merge with or into other companies or transfer all or substantially all of the Company’s assets; and |
| · | engage in transactions with affiliates. |
The Indenture provides for customary events of default (subject in certain cases to customary grace and cure periods), which include nonpayment, breach of covenants in the Indenture, failure to pay at maturity or acceleration of other indebtedness, a failure to pay certain judgments and certain events of bankruptcy and insolvency. Generally, if an event of default occurs, the Trustee or holders of at least 25% in principal amount of the then outstanding 9.0% Senior Secured Notes may declare the principal of and accrued but unpaid interest, including any additional interest, on all of the 9.0% Senior Secured Notes to be due and payable.
In connection with the issuance of the 9.0% Senior Secured Notes and execution of the Indenture, the Company and the Subsidiary Guarantors entered into a security agreement, dated as of December 21, 2010 (the “Security Agreement”), by and among the Company, the Subsidiary Guarantors and Wilmington Trust FSB, as collateral agent, pursuant to which the Company and the Subsidiary Guarantors pledged substantially all of their assets to secure their obligations under the Indenture, subject to certain exceptions as set forth in the Security Agreement.
Intercreditor Agreement
In connection with the issuance of the 9.0% Senior Secured Notes and entry into the New Senior Secured Credit Agreement, the Agent and Wilmington Trust FSB, as collateral agent and authorized representative with respect to the 9.0% Senior Secured Notes, entered into an Intercreditor Agreement, dated as of December 21, 2010 (the “Intercreditor Agreement”), which sets forth agreements with respect to the first-priority liens granted by the Company and the Subsidiary Guarantors pursuant to the Indenture and the New Senior Secured Credit Agreement.
Under the Intercreditor Agreement, any actions that may be taken with respect to the collateral that secures the 9.0% Senior Secured Notes and the New Senior Secured Credit Agreement, including the ability to cause the commencement of enforcement proceedings against such collateral, to control such proceedings and to approve amendments to releases of such collateral from the lien of, and waive past defaults under, such documents relating to such collateral, will be at the direction of the authorized representative of the lenders under the New Senior Secured Credit Agreement until the earlier of: (i) the Company’s obligations under the New Senior Secured Credit Agreement (or refinancings thereof) are discharged; (ii) the date on which the outstanding principal amount of loans and commitments under the New Senior Secured C redit Agreement is less than $25.0 million; and (iii) 180 days after the occurrence of both an event of default under the Indenture and the authorized representative of the holders of the 9.0% Senior Secured Notes making certain representations as described in the Intercreditor Agreement, unless the authorized representative of the lenders under the New Senior Secured Credit Agreement has commenced and is diligently pursuing enforcement action with respect to the collateral or the grantor of the security interest in that collateral (whether the Company or the applicable Subsidiary Guarantor) is then a debtor under or with respect to (or otherwise subject to) any insolvency or liquidation proceeding.
Previous Senior Credit Agreement
In December 2010, we repaid the $652.1 million outstanding principal balance under our Previous Credit Agreement using: (i) the proceeds from the New Senior Secured Credit Agreement and the issuance of the 9.0% Senior Secured Notes; and (ii) available cash.
3.5% Debentures and 7.0% Debentures
In February 2010, we repurchased $64.0 million aggregate principal amount of our 3.5% Debentures in a privately-negotiated transaction. In connection with the repurchase of the 3.5% Debentures, we completed a second closing of $64 million aggregate principal amount of our 7.0% Debentures. The net proceeds from the issuance of the 7.0% Debentures were used to fund a substantial portion of the consideration payable in connection with the repurchase of the 3.5% Debentures. The purchase price for the $64.0 million of 3.5% Debentures was equal to 100 percent of the aggregate principal amount plus accrued and unpaid interest.
In May 2010, we repurchased $52.5 million aggregate principal amount of our 3.5% Debentures in a privately-negotiated transaction. In connection with the repurchase of the 3.5% Debentures, we completed a third closing of $52.5 million aggregate principal amount of our 7.0% Debentures. The net proceeds from the issuance of the 7.0% Debentures were used to fund a substantial portion of the consideration payable in connection with the repurchase of the 3.5% Debentures. The purchase price for the $52.5 million of 3.5% Debentures was equal to 100 percent of the aggregate principal amount plus accrued and unpaid interest.
At December 31, 2010, as a result of the transactions described above, we had an aggregate $293.0 million principal amount of the 7.0% Debentures outstanding and none of the 3.5% Debentures. See the note to the consolidated financial statements entitled “Notes Payable – Direct Corporate Obligations” for further information on the 3.5% Debentures and 7.0% Debentures.
Outlook
We believe that the existing cash available to the holding company, the cash flows to be generated from operations and other transactions will be sufficient to allow us to meet our debt service obligations, pay corporate expenses and satisfy other financial obligations. However, our cash flow is affected by a variety of factors, many of which are outside of our control, including insurance regulatory issues, competition, financial markets and other general business conditions. We cannot provide assurance that we will possess sufficient income and liquidity to meet all of our debt service requirements and other holding company obligations. For additional discussion regarding the liquidity and other risks that we face, see “Risk Factors”.
MARKET-SENSITIVE INSTRUMENTS AND RISK MANAGEMENT
Our spread-based insurance business is subject to several inherent risks arising from movements in interest rates, especially if we fail to anticipate or respond to such movements. First, interest rate changes can cause compression of our net spread between interest earned on investments and interest credited on customer deposits, thereby adversely affecting our results. Second, if interest rate changes produce an unanticipated increase in surrenders of our spread-based products, we may be forced to sell investment assets at a loss in order to fund such surrenders. Many of our products include surrender charges, market interest rate adjustments or other features to encourage persistency; however at December 31, 2010, approximately 23 percent of our total ins urance liabilities, or approximately $5.6 billion, could be surrendered by the policyholder without penalty. Finally, changes in interest rates can have significant effects on the performance of our structured securities portfolio as a result of changes in the prepayment rate of the loans underlying such securities. We follow asset/liability strategies that are designed to mitigate the effect of interest rate changes on our profitability. However, there can be no assurance that management will be successful in implementing such strategies and achieving adequate investment spreads.
We seek to invest our available funds in a manner that will fund future obligations to policyholders, subject to appropriate risk considerations. We seek to meet this objective through investments that: (i) have similar cash flow characteristics with the liabilities they support; (ii) are diversified among industries, issuers and geographic locations; and (iii) are predominantly investment-grade fixed maturity securities.
Our investment strategy is to maximize, over a sustained period and within acceptable parameters of risk, investment income and total investment return through active investment management. Accordingly, our entire portfolio of fixed maturity securities is available to be sold in response to: (i) changes in market interest rates; (ii) changes in relative values of individual securities and asset sectors; (iii) changes in prepayment risks; (iv) changes in credit quality outlook for certain securities; (v) liquidity needs; and (vi) other factors. From time to time, we invest in securities for trading purposes, although such investments are a relatively small portion of our total portfolio.
The profitability of many of our products depends on the spread between the interest earned on investments and the rates credited on our insurance liabilities. In addition, changes in competition and other factors, including the level of surrenders and withdrawals, may limit our ability to adjust or to maintain crediting rates at levels necessary to avoid narrowing of spreads under certain market conditions. As of December 31, 2010, approximately 40 percent of our insurance liabilities had interest rates that may be reset annually; 41 percent had a fixed explicit interest rate for the duration of the contract; 14 percent had credited rates which approximate the income earned by the Company; and the remainder had no explicit interest rates. At December 31, 2010, the average yield, computed on the cost basi s of our fixed maturity portfolio, was 5.9 percent, and the average interest rate credited or accruing to our total insurance liabilities (excluding interest rate bonuses for the first policy year only and excluding the effect of credited rates attributable to variable or fixed index products) was 4.5 percent.
We use computer models to simulate the cash flows expected from our existing insurance business under various interest rate scenarios. These simulations help us to measure the potential gain or loss in fair value of our interest rate-sensitive investments and to manage the relationship between the interest sensitivity of our assets and liabilities. When the estimated durations of assets and liabilities are similar, a change in the value of assets should be largely offset by a change in the value of liabilities. At December 31, 2010, the adjusted modified duration of our fixed income securities (as modified to reflect payments and potential calls) was approximately 8.8 years and the duration of our insurance liabilities was approximately 8.7 years. We estimate that our fixed maturity securities and short-term investments (net of corresponding changes in insurance acquisition costs) would decline in fair value by approximately $405 million if interest rates were to increase by 10 percent from their levels at December 31, 2010. This compares to a decline in fair value of $455 million based on amounts and rates at December 31, 2009. Our computer simulated calculations include numerous assumptions, require significant estimates and assume an immediate change in interest rates without any management of the investment portfolio in reaction to such change. Consequently, potential changes in value of our financial instruments indicated by the simulations will likely be different from the actual changes experienced under given interest rate scenarios, and the differences may be material. Because we actively manage our investments and liabilities, our net exposure to interest rates can vary over time.
We are subject to the risk that our investments will decline in value. This has occurred in the past and may occur again. During 2010, we recognized net realized investment gains of $30.2 million, which were comprised of $180.0 million of net gains from the sales of investments (primarily fixed maturities) and $149.8 million of writedowns of investments for other than temporary declines in fair value recognized through net income ($146.8 million, prior to the $(3.0) million of impairment losses recognized through accumulated other comprehensive income (loss)). During 2009, we recognized net realized investment losses of $60.5 million, which were comprised of $134.9 million of net gains from the sales of investments (primarily fixed maturities) and $195.4 million of writedowns of investments for other than temporary declines in fair value recognized through net income ($385.0 million, prior to the $189.6 million of impairment losses recognized through accumulated other comprehensive loss). During 2008, we recognized net realized investment losses of $262.4 million, which were comprised of: (i) $100.1 million of net losses from the sales of investments (primarily fixed maturities) and; (ii) $162.3 million of writedowns of investments for other than temporary declines in fair value.
The Company is subject to risk resulting from fluctuations in market prices of our equity securities. In general, these investments have more year-to-year price variability than our fixed maturity investments. However, returns over longer time frames have been consistently higher. We manage this risk by limiting our equity securities to a relatively small portion of our total investments.
Our investment in options backing our equity-linked products is closely matched with our obligation to fixed index annuity holders. Fair value changes associated with that investment are substantially offset by an increase or decrease in the amounts added to policyholder account balances for fixed index products.
Inflation
Inflation rates may impact the financial statements and operating results in several areas. Inflation influences interest rates, which in turn impact the fair value of the investment portfolio and yields on new investments. Inflation also impacts a portion of our insurance policy benefits affected by increased medical coverage costs. Operating expenses, including payrolls, are impacted to a certain degree by the inflation rate.
RESULTS OF DISCONTINUED OPERATIONS
As further discussed in the note to the consolidated financial statements entitled “Transfer of Senior Health Insurance Company of Pennsylvania to an Independent Trust”, the long-term care business of Senior Health is reflected as a discontinued operation in all periods presented. As a result, the comparison of the 2008 operating results to prior periods is impacted by the Transfer. The following summarizes the operating results of our discontinued operations (dollars in millions):
| | | 2008 | |
| | | | |
| Premium collections (all of which are renewal premiums): | | | |
| Long-term care | | $ | 225.9 | |
| | | | | |
| Average liabilities for insurance products, net of reinsurance ceded: | | | | |
| Long-term care | | $ | 2,881.2 | |
| | | | | |
| Revenues: | | | | |
| Insurance policy income | | $ | 227.9 | |
| Net investment income on general account | | | | |
| invested assets | | | 156.9 | |
| | | | | |
| Total revenues | | | 384.8 | |
| | | | | |
| Expenses: | | | | |
| Insurance policy benefits | | | 311.2 | |
| Amortization related to operations | | | 16.7 | |
| Gain on reinsurance recapture | | | (29.7 | ) |
| Loss on Transfer and transaction expenses | | | 363.6 | |
| Other operating costs and expenses | | | 54.0 | |
| | | | | |
| Total benefits and expenses | | | 715.8 | |
| | | | | |
| Income (loss) before net realized investment | | | | |
| gains (losses) and income taxes | | | (331.0 | ) |
| | | | | |
| Net realized investment gains (losses) | | | (380.1 | ) |
| | | | | |
| Income (loss) before income taxes | | $ | (711.1 | ) |
| | | | | |
| Health benefit ratios: | | | | |
| Insurance policy benefits | | $ | 311.2 | |
| Benefit ratio (a) | | | 136.6 | % |
| Interest-adjusted benefit ratio (b) | | | 67.7 | % |
____________________
| (a) | We calculate benefit ratios by dividing the related product’s insurance policy benefits by insurance policy income. |
| (b) | We calculate the interest-adjusted benefit ratio (a non-GAAP measure) for long-term care products by dividing such product’s insurance policy benefits less interest income on the accumulated assets backing the insurance liabilities by policy income. These are considered non-GAAP financial measures. A non-GAAP measure is a numerical measure of a company’s performance, financial position, or cash flows that excludes or includes amounts that are normally excluded or included in the most directly comparable measure calculated and presented in accordance with GAAP. |
These non-GAAP financial measures of “interest-adjusted benefit ratios” differ from “benefit ratios” due to the deduction of interest income on the accumulated assets backing the insurance liabilities from the product’s insurance policy benefits used to determine the ratio. Interest income is an important factor in measuring the performance of health products that are expected to be inforce for a longer duration of time, are not subject to unilateral changes in provisions (such as non-cancelable or guaranteed renewable contracts) and require the performance of various functions and services (including insurance protection) for an extended period of time. The net cash flows from long-term care products generally cause an accumulation of amounts in the early years of a policy (accounted f or as reserve increases) that will be paid out as benefits in later policy years (accounted for as reserve decreases). Accordingly, as the policies age, the benefit ratio will typically increase, but the increase in benefits will be partially offset by interest income earned on the accumulated assets. The interest-adjusted benefit ratio reflects the effects of the interest income offset. Since interest income is an important factor in measuring the performance of this product, management believes a benefit ratio that includes the effect of interest income is useful in analyzing product performance. We utilize the interest-adjusted benefit ratio in measuring segment performance because we believe that this performance measure is a better indicator of the ongoing businesses and trends in the business. However, the “interest-adjusted benefit ratio” does not replace the “benefit ratio” as a measure of current period benefits to curren t period insurance policy income. Accordingly, management reviews both “benefit ratios” and “interest-adjusted benefit ratios” when analyzing the financial results attributable to these products. The investment income earned on the accumulated assets backing long-term care reserves in our discontinued operations was $156.9 million in 2008.
Total premium collections were $225.9 million in 2008. We ceased marketing this long-term care business in 2003. Accordingly, collected premiums have decreased over time as policies lapsed, partially offset by premium rate increases.
Average liabilities for insurance products, net of reinsurance ceded were approximately $2.9 billion in 2008.
Insurance policy income is comprised of premiums earned on these long-term care policies.
Net investment income on general account invested assets was $156.9 million in 2008. The average balance of general account invested assets was $2.5 billion in 2008. The average yield on these assets was 6.22 percent in 2008. The yield in 2008 reflects the decrease in the cost basis of investments as a result of the recognition of other-than-temporary impairments as further discussed below under net realized investment gains (losses).
Insurance policy benefits fluctuated primarily as a result of the factors summarized below.
Insurance policy benefits were $311.2 million in 2008.
The benefit ratio on this block of business was 136.6 percent in 2008. Benefit ratios are calculated by dividing the product’s insurance policy benefits by insurance policy income. Since the insurance product liabilities we establish for long-term care business are subject to significant estimates, the ultimate claim liability we incur for a particular period is likely to be different than our initial estimate. Our insurance policy benefits reflected reserve deficiencies from prior years of $21.8 million in 2008. Excluding the effects of prior year claim reserve deficiencies, our benefit ratios would have been 127.0 percent in 2008. These ratios reflect the significantly higher level of incurred claims experienced in 2007 resulting in increases in reserves for future benefits a s discussed below, adverse development on claims incurred in prior periods as discussed below, and decreases in policy income. The prior period deficiencies have resulted from the impact of paid claim experience being different than prior estimates, changes in actuarial assumptions and refinements to claimant data used to determine claim reserves.
The net cash flows from long-term care products generally cause an accumulation of amounts in the early years of a policy (accounted for as reserve increases) which will be paid out as benefits in later policy years (accounted for as reserve decreases). Accordingly, as the policies age, the benefit ratio will typically increase, but the increase in benefits will be partially offset by investment income earned on the assets which have accumulated. The interest-adjusted benefit ratio for long-term care products is calculated by dividing the insurance product’s insurance policy benefits less interest income on the accumulated assets backing the insurance liabilities by insurance policy income. The interest-adjusted benefit ratio on this business was 67.7 percent in 2008. Excluding the effect s of prior year claim reserve deficiencies, our interest-adjusted benefit ratios would have been 58.1 percent in 2008.
This long-term care business was primarily issued by Senior Health prior to its acquisition by our Predecessor in 1996. The loss experience on these products has been worse than we originally expected. Although we anticipated a higher level of benefits to be paid on these products as the policies aged, the paid claims have exceeded our expectations. In addition, there has been an increase in the incidence and duration of claims in recent periods. This adverse experience is reflected in the higher insurance policy benefits experienced in 2008.
In each quarterly period, we calculated our best estimate of claim reserves based on all of the information available to us at that time, which necessarily takes into account new experience emerging during the period. Our actuaries estimated these claim reserves using various generally recognized actuarial methodologies which are based on informed estimates and judgments that are believed to be appropriate. Additionally, an external actuarial firm provided consulting services which involved a review of the Company’s judgments and estimates for claim reserves on this long-term care block of business on a periodic basis. As additional experience emerges and other data become available, these estimates and judgments are reviewed and may be revised. Significant assumptions made in estimating claim reserves for long-term care policies include expectations about the: (i) future duration of existing claims; (ii) cost of care and benefit utilization; (iii) interest rate utilized to discount claim reserves; (iv) claims that have been incurred but not yet reported; (v) claim status on the reporting date; (vi) claims that have been closed but are expected to reopen; and (vii) correspondence that has been received that will ultimately become claims that have payments associated with them.
We had been aggressively seeking actuarially justified rate increases and pursuing other actions on our long-term care policies. During the third quarter of 2006, we began a new program to file requests for rate increases on various long-term care products of Senior Health as we believed the existing rates were too low to fund expected future benefits. These filings were expected to be the first of three rounds of rate increase filings for many of the same policies, and in some cases we requested three years of successive rate increases. We chose to request a series of smaller rate increases, rather than a single large increase, to limit the impact on a policyholder’s premiums in any single year. The effects of the first round of rate filings were partially realized in our premium reven ue. In the second quarter of 2007, we began filing requests for the second round of rate increases on many of the same policies. The full effect of all three rounds of rate increases was not expected to be fully realized until 2011.
On April 20, 2004, the Florida Office of Insurance Regulation issued an order to Senior Health, that affected approximately 12,600 home health care policies issued in Florida by Senior Health and its predecessor companies. Pursuant to the order, Senior Health offered the following three alternatives to holders of these policies subject to rate increases as follows:
| · | retention of their current policy with a rate increase of 50 percent in the first year and actuarially justified increases in subsequent years (which is also the default election for policyholders who failed to make an election by 30 days prior to the anniversary date of their policies) (“option one”); |
| · | receipt of a replacement policy with reduced benefits and a rate increase in the first year of 25 percent and no more than 15 percent in subsequent years (“option two”); or |
| · | receipt of a paid-up policy, allowing the holder to file future claims up to 100 percent of the amount of premiums paid since the inception of the policy (“option three”). |
Policyholders selecting option one or option two are entitled to receive a contingent non-forfeiture benefit if their policy subsequently lapses. In addition, policyholders could change their initial election any time up to 30 days prior to the anniversary date of their policies. We began to implement premium adjustments with respect to policyholder elections in the fourth quarter of 2005 and the implementation of these premium adjustments was completed in 2007. We did not make any adjustments to the insurance liabilities when these elections were made. Reserves for all three groups of policies under the order were prospectively adjusted using the prospective revision methodology described in the “Critical Accounting Policies – Accounting for Long-term Care Premium Rate Increases� 221; in “Management’s Discussion and Analysis of Consolidated Financial Condition and Results of Operations”.
Amortization related to operations includes amortization of insurance acquisition costs. Fluctuations in amortization of insurance acquisition costs generally correspond with changes in lapse experience.
Gain on reinsurance recapture resulted from the recapture of a block of previously reinsured long-term care business in the third quarter of 2008. Such business was included in the Transfer.
Loss on Transfer and transaction expenses relates to the loss on the transfer of Senior Health to an independent trust as further discussed in the note to the consolidated financial statements entitled “Transfer of Senior Health Insurance Company of Pennsylvania to an Independent Trust”.
Other operating costs and expenses were $54.0 million in 2008. Other operating costs and expenses, excluding commission expenses, for this segment were $29.7 million in 2008.
Net realized investment gains (losses) fluctuated each period. During 2008, net realized investment losses included $.4 million of net gains from the sales of investments (primarily fixed maturities) and $380.5 million of writedowns of investments (which were transferred to the Independent Trust) as a result of our intent not to hold such investments for a period of time sufficient to allow for a full recovery in value.
ITEM 7A. QUANTITATIVE AND QUALITATIVE DISCLOSURES ABOUT MARKET RISK.
The information included under the caption “Market-Sensitive Instruments and Risk Management” in Item 7. “Management’s Discussion and Analysis of Consolidated Financial Condition and Results of Operations” is incorporated herein by reference.
ITEM 8. CONSOLIDATED FINANCIAL STATEMENTS
| Index to Consolidated Financial Statements |
| | |
| | Page |
| | |
| Report of Independent Registered Public Accounting Firm � 60; | 118 |
| | |
| Consolidated Balance Sheet at December 31, 2010 and 2009 &# 160; | 119 |
| | |
| Consolidated Statement of Operations for the years ended December 31, 2010, 2009 and 2008 | 121 |
| | |
| Consolidated Statement of Shareholders’ Equity for the years ended December 31, 2010, 2009 and 2008 | 122 |
| | |
| Consolidated Statement of Cash Flows for the years ended December 31, 2010, 2009 and 2008 | 124 |
| | |
| Notes to Consolidated Financial Statements | 125 |
Report of Independent Registered Public Accounting Firm
To the Shareholders and Board of Directors CNO Financial Group, Inc.:
In our opinion, the consolidated financial statements listed in the accompanying index present fairly, in all material respects, the financial position of CNO Financial Group, Inc. and its subsidiaries at December 31, 2010 and 2009, and the results of their operations and their cash flows for each of the three years in the period ended December 31, 2010 in conformity with accounting principles generally accepted in the United States of America. Also in our opinion, the Company maintained, in all material respects, effective internal control over financial reporting as of December 31, 2010, based on criteria established in Internal Control - Integrated Framework issued by the Committee of Sponsoring Organizations of the Treadway Commission (COSO). The Company's management is responsi ble for these financial statements, for maintaining effective internal control over financial reporting and for its assessment of the effectiveness of internal control over financial reporting included in Management's Report on Internal Control Over Financial Reporting appearing under Item 9A. Our responsibility is to express opinions on these financial statements and on the Company's internal control over financial reporting based on our integrated audits. We conducted our audits in accordance with the standards of the Public Company Accounting Oversight Board (United States). Those standards require that we plan and perform the audits to obtain reasonable assurance about whether the financial statements are free of material misstatement and whether effective internal control over financial reporting was maintained in all material respects. Our audits of the financial statements included examining, on a test basis, evidence supporting the amounts and disclosures in the financial statements, assessing the ac counting principles used and significant estimates made by management, and evaluating the overall financial statement presentation. Our audit of internal control over financial reporting included obtaining an understanding of internal control over financial reporting, assessing the risk that a material weakness exists, and testing and evaluating the design and operating effectiveness of internal control based on the assessed risk. Our audits also included performing such other procedures as we considered necessary in the circumstances. We believe that our audits provide a reasonable basis for our opinions.
A company’s internal control over financial reporting is a process designed to provide reasonable assurance regarding the reliability of financial reporting and the preparation of financial statements for external purposes in accordance with generally accepted accounting principles. A company’s internal control over financial reporting includes those policies and procedures that (i) pertain to the maintenance of records that, in reasonable detail, accurately and fairly reflect the transactions and dispositions of the assets of the company; (ii) provide reasonable assurance that transactions are recorded as necessary to permit preparation of financial statements in accordance with generally accepted accounting principles, and that receipts and expenditures of the company are being made only in accordance with authorizations of management and directors of the company; and (iii) provide reasonable assurance regarding prevention or timely detection of unauthorized acquisition, use, or disposition of the company’s assets that could have a material effect on the financial statements.
Because of its inherent limitations, internal control over financial reporting may not prevent or detect misstatements. Also, projections of any evaluation of effectiveness to future periods are subject to the risk that controls may become inadequate because of changes in conditions, or that the degree of compliance with the policies or procedures may deteriorate.
/s/ PricewaterhouseCoopers LLP
Indianapolis, Indiana
February 24, 2011
CNO FINANCIAL GROUP, INC. AND SUBSIDIARIES
CONSOLIDATED BALANCE SHEET
December 31, 2010 and 2009
(Dollars in millions)
ASSETS
| | | 2010 | | | 2009 | |
| | | | | | | |
| Investments: | | | | | | |
| Fixed maturities, available for sale, at fair value (amortized cost: 2010 - $20,155.8; 2009 - $18,998.0) | | $ | 20,633.9 | | | $ | 18,528.4 | |
| Equity securities at fair value (cost: 2010 - $68.2; 2009 - $30.7) | | | 68.1 | | | | 31.0 | |
| Mortgage loans | | | 1,761.2 | | | | 1,965.5 | |
| Policy loans | | | 284.4 | | | | 295.2 | |
| Trading securities | | | 372.6 | | | | 293.3 | |
| Investments held by variable interest entities | | | 420.9 | | | | - | |
| Securities lending collateral | | | - | | | | 180.0 | |
| Other invested assets | | | 240.9 | | | | 236.8 | |
| | | | | | | | | |
| Total investments | | | 23,782.0 | | | | 21,530.2 | |
| | | | | | | | | |
| Cash and cash equivalents - unrestricted | | | 571.9 | | | | 523.4 | |
| Cash and cash equivalents held by variable interest entities | | | 26.8 | | | | 3.4 | |
| Accrued investment income | | | 327.8 | | | | 309.0 | |
| Present value of future profits | | | 1,008.6 | | | | 1,175.9 | |
| Deferred acquisition costs | | | 1,764.2 | | | | 1,790.9 | |
| Reinsurance receivables | | | 3,256.3 | | | | 3,559.0 | |
| Income tax assets, net | | | 839.4 | | | | 1,124.0 | |
| Assets held in separate accounts | | | 17.5 | | | | 17.3 | |
| Other assets | | | 305.1 | | | | 310.7 | |
| | | | | | | | | |
| Total assets | | $ | 31,899.6 | | | $ | 30,343.8 | |
(continued on next page)
The accompanying notes are an integral part
of the consolidated financial statements.
CNO FINANCIAL GROUP, INC. AND SUBSIDIARIES
CONSOLIDATED BALANCE SHEET (Continued)
December 31, 2010 and 2009
(Dollars in millions)
LIABILITIES AND SHAREHOLDERS’ EQUITY
| | | 2010 | | | 2009 | |
| Liabilities: | | | | | | |
| Liabilities for insurance products: | | | | | | |
| Interest-sensitive products | | $ | 13,194.7 | | | $ | 13,219.2 | |
| Traditional products | | | 10,307.6 | | | | 10,063.5 | |
| Claims payable and other policyholder funds | | | 968.7 | | | | 994.0 | |
| Liabilities related to separate accounts | | | 17.5 | | | | 17.3 | |
| Other liabilities | | | 496.3 | | | | 610.4 | |
| Investment borrowings | | | 1,204.1 | | | | 683.9 | |
| Borrowings related to variable interest entities | | | 386.9 | | | | - | |
| Securities lending payable | | | - | | | | 185.7 | |
| Notes payable – direct corporate obligations | | | 998.5 | | | | 1,037.4 | |
| | | | | | | | | |
| Total liabilities | | | 27,574.3 | | | | 26,811.4 | |
| | | | | | | | | |
| Commitments and Contingencies (Note 8) | | | | | | | | |
| | | | | | | | | |
| Shareholders' equity: | | | | | | | | |
Common stock ($0.01 par value, 8,000,000,000 shares authorized, shares issued and outstanding: 2010 – 251,084,174; 2009 – 250,786,216) | | | 2.5 | | | | 2.5 | |
| Additional paid-in capital | | | 4,424.2 | | | | 4,408.8 | |
| Accumulated other comprehensive income (loss) | | | 238.3 | | | | (264.3 | ) |
| Accumulated deficit | | | (339.7 | ) | | | (614.6 | ) |
| | | | | | | | | |
| Total shareholders' equity | | | 4,325.3 | | | | 3,532.4 | |
| Total liabilities and shareholders' equity | | $ | 31,899.6 | | | $ | 30,343.8 | |
The accompanying notes are an integral part
of the consolidated financial statements.
CNO FINANCIAL GROUP, INC. AND SUBSIDIARIES
CONSOLIDATED STATEMENT OF OPERATIONS
for the years ended December 31, 2010, 2009 and 2008
(Dollars in millions, except per share data)
| | | 2010 | | | 2009 | | | 2008 | |
| Revenues: | | | | | | | | | |
| Insurance policy income | | $ | 2,670.0 | | | $ | 3,093.6 | | | $ | 3,253.6 | |
| Net investment income (loss): | | | | | | | | | | | | |
| General account assets | | | 1,295.0 | | | | 1,230.9 | | | | 1,254.5 | |
| Policyholder and reinsurer accounts and other special-purpose portfolios | | | 71.9 | | | | 61.8 | | | | (75.7 | ) |
| Realized investment gains (losses): | | | | | | | | | | | | |
| Net realized investment gains (losses), excluding impairment losses | | | 180.0 | | | | 134.9 | | | | (100.1 | ) |
| Other-than-temporary impairment losses: | | | | | | | | | | | | |
| Total other-than-temporary impairment losses | | | (146.8 | ) | | | (385.0 | ) | | | (162.3 | ) |
Change in other-than-temporary impairment losses recognized in accumulated other comprehensive income (loss) | | | (3.0 | ) | | | 189.6 | | | | - | |
| Net impairment losses recognized | | | (149.8 | ) | | | (195.4 | ) | | | (162.3 | ) |
| Total realized gains (losses) | | | 30.2 | | | | (60.5 | ) | | | (262.4 | ) |
| Fee revenue and other income | | | 16.8 | | | | 15.6 | | | | 19.7 | |
| | | | | | | | | | | | | |
| Total revenues | | | 4,083.9 | | | | 4,341.4 | | | | 4,189.7 | |
| | | | | | | | | | | | | |
| Benefits and expenses: | | | | | | | | | | | | |
| Insurance policy benefits | | | 2,723.7 | | | | 3,066.7 | | | | 3,212.5 | |
| Interest expense | | | 113.2 | | | | 117.9 | | | | 106.5 | |
| Amortization | | | 443.8 | | | | 432.7 | | | | 367.9 | |
| (Gain) loss on extinguishment or modification of debt | | | 6.8 | | | | 22.2 | | | | (21.2 | ) |
| Other operating costs and expenses | | | 502.9 | | | | 528.3 | | | | 520.3 | |
| | | | | | | | | | | | | |
| Total benefits and expenses | | | 3,790.4 | | | | 4,167.8 | | | | 4,186.0 | |
| | | | | | | | | | | | | |
| Income before income taxes and discontinued operations | | | 293.5 | | | | 173.6 | | | | 3.7 | |
| | | | | | | | | | | | | |
| Income tax expense: | | | | | | | | | | | | |
| Tax expense on period income | | | 103.9 | | | | 60.1 | | | | 9.4 | |
| Valuation allowance for deferred tax assets | | | (95.0 | ) | | | 27.8 | | | | 403.9 | |
| | | | | | | | | | | | | |
| Income (loss) before discontinued operations | | | 284.6 | | | | 85.7 | | | | (409.6 | ) |
| | | | | | | | | | | | | |
| Discontinued operations, net of income taxes | | | - | | | | - | | | | (722.7 | ) |
| | | | | | | | | | | | | |
| Net income (loss) | | $ | 284.6 | | | $ | 85.7 | | | $ | (1,132.3 | ) |
| | | | | | | | | | | | | |
| | | | | | | | | | | | | |
| Earnings (loss) per common share: | | | | | | | | | | | | |
| Basic: | | | | | | | | | | | | |
| Weighted average shares outstanding | | | 250,973,000 | | | | 188,365,000 | | | | 184,704,000 | |
| | | | | | | | | | | | | |
| Income (loss) before discontinued operations | | $ | 1.13 | | | $ | .45 | | | $ | (2.22 | ) |
| Discontinued operations | | | - | | | | - | | | | (3.91 | ) |
| Net income (loss) | | $ | 1.13 | | | $ | .45 | | | $ | (6.13 | ) |
| | | | | | | | | | | | | |
| Diluted: | | | | | | | | | | | | |
| Weighted average shares outstanding | | | 301,858,000 | | | | 193,340,000 | | | | 184,704,000 | |
| | | | | | | | | | | | | |
| Income (loss) before discontinued operations | | $ | .99 | | | $ | .45 | | | $ | (2.22 | ) |
| Discontinued operations | | | - | | | | - | | | | (3.91 | ) |
| Net income (loss) | | $ | .99 | | | $ | .45 | | | $ | (6.13 | ) |
The accompanying notes are an integral part
of the consolidated financial statements.
CNO FINANCIAL GROUP, INC. AND SUBSIDIARIES
CONSOLIDATED STATEMENT OF SHAREHOLDERS' EQUITY
(Dollars in millions)
| | | Common stock and additional paid-in capital | | | Accumulated other comprehensive income (loss) | | | Retained earnings (accumulated deficit) | | | Total | |
| | | | | | | | | | | | | |
Balance, December 31, 2007 | | $ | 4,098.5 | | | $ | (273.3 | ) | | $ | 427.1 | | | $ | 4,252.3 | |
| Comprehensive loss, net of tax: | | | | | | | | | | | | | | | | |
Net loss | | | - | | | | - | | | | (1,132.3 | ) | | | (1,132.3 | ) |
| Change in unrealized appreciation (depreciation) of investments (net of applicable income tax benefit of $833.9) | | | - | | | | (1,496.9 | ) | | | - | | | | (1,496.9 | ) |
| Change in unrecognized net loss related to deferred compensation plan (net of applicable income tax benefit of $.2 million) | | | - | | | | (.5 | ) | | | - | | | | (.5 | ) |
| | | | | | | | | | | | | | | | | |
| Total comprehensive loss | | | | | | | | | | | | | | | (2,629.7 | ) |
| | | | | | | | | | | | | | | | | |
| Stock option and restricted stock plans | | | 7.4 | | | | - | | | | - | | | | 7.4 | |
| | | | | | | | | | | | | | | | | |
Balance, December 31, 2008 | | | 4,105.9 | | | | (1,770.7 | ) | | | (705.2 | ) | | | 1,630.0 | |
| | | | | | | | | | | | | | | | | |
| Comprehensive income, net of tax: | | | | | | | | | | | | | | | | |
Net income | | | - | | | | - | | | | 85.7 | | | | 85.7 | |
| Change in unrealized appreciation (depreciation) of investments (net of applicable income tax expense of $879.6) | | | - | | | | 1,576.5 | | | | - | | | | 1,576.5 | |
| Noncredit component of impairment losses on fixed maturities, available for sale (net of applicable income tax benefit of $36.4) | | | - | | | | (65.2 | ) | | | - | | | | (65.2 | ) |
| | | | | | | | | | | | | | | | | |
| Total comprehensive income | | | | | | | | | | | | | | | 1,597.0 | |
| | | | | | | | | | | | | | | | | |
| Issuance of common stock, net | | | 296.3 | | | | - | | | | - | | | | 296.3 | |
| Stock option and restricted stock plans | | | 9.1 | | | | - | | | | - | | | | 9.1 | |
| Effect of reclassifying noncredit component of previously recognized impairment losses on fixed maturities, available for sale (net of applicable income tax benefit of $2.6) | | | - | | | | (4.9 | ) | | | 4.9 | | | | - | |
| | | | | | | | | | | | | | | | | |
Balance, December 31, 2009 | | | 4,411.3 | | | | (264.3 | ) | | | (614.6 | ) | | | 3,532.4 | |
(continued on following page)
The accompanying notes are an integral part
of the consolidated financial statements.
CNO FINANCIAL GROUP, INC. AND SUBSIDIARIES
CONSOLIDATED STATEMENT OF SHAREHOLDERS' EQUITY (continued)
(Dollars in millions)
| | | Common stock and additional paid-in capital | | | Accumulated other comprehensive income (loss) | | | Retained earnings (accumulated deficit) | | | Total | |
| | | | | | | | | | | | | |
| Balance, December 31, 2009 (carried forward from prior page) | | $ | 4,411.3 | | | $ | (264.3 | ) | | $ | (614.6 | ) | | $ | 3,532.4 | |
| | | | | | | | | | | | | | | | | |
| Comprehensive income, net of tax: | | | | | | | | | | | | | | | | |
Net income | | | - | | | | - | | | | 284.6 | | | | 284.6 | |
| Change in unrealized appreciation (depreciation) of investments (net of applicable income tax expense of $241.5) | | | - | | | | 441.3 | | | | - | | | | 441.3 | |
| Noncredit component of impairment losses on fixed maturities, available for sale (net of applicable income tax expense of $37.6) | | | - | | | | 67.5 | | | | - | | | | 67.5 | |
| | | | | | | | | | | | | | | | | |
| Total comprehensive income | | | | | | | | | | | | | | | 793.4 | |
| | | | | | | | | | | | | | | | | |
| Cumulative effect of accounting change | | | - | | | | (6.2 | ) | | | (9.7 | ) | | | (15.9 | ) |
| Beneficial conversion feature related to the issuance of convertible debentures | | | 4.0 | | | | - | | | | - | | | | 4.0 | |
| Stock option and restricted stock plans | | | 11.4 | | | | - | | | | - | | | | 11.4 | |
| | | | | | | | | | | | | | | | | |
Balance, December 31, 2010 | | $ | 4,426.7 | | | $ | 238.3 | | | $ | (339.7 | ) | | $ | 4,325.3 | |
The accompanying notes are an integral part
of the consolidated financial statements.
CNO FINANCIAL GROUP, INC. AND SUBSIDIARIES
CONSOLIDATED STATEMENT OF CASH FLOWS
for the years ended December 31, 2010, 2009 and 2008
(Dollars in millions)
| | | 2010 | | | 2009 | | | 2008 | |
| Cash flows from operating activities: | | | | | | | | | |
| Insurance policy income | | $ | 2,359.3 | | | $ | 2,747.1 | | | $ | 3,140.7 | |
| Net investment income | | | 1,304.9 | | | | 1,167.3 | | | | 1,339.6 | |
| Fee revenue and other income | | | 16.8 | | | | 15.6 | | | | 19.7 | |
| Insurance policy benefits | | | (1,975.4 | ) | | | (2,298.8 | ) | | | (2,722.3 | ) |
| Interest expense | | | (108.2 | ) | | | (109.0 | ) | | | (95.4 | ) |
| Policy acquisition costs | | | (418.2 | ) | | | (407.5 | ) | | | (459.1 | ) |
| Other operating costs | | | (444.8 | ) | | | (495.8 | ) | | | (587.0 | ) |
| Taxes | | | (.4 | ) | | | (7.2 | ) | | | 4.1 | |
| | | | | | | | | | | | | |
| Net cash provided by operating activities | | | 734.0 | | | | 611.7 | | | | 640.3 | |
| | | | | | | | | | | | | |
| Cash flows from investing activities: | | | | | | | | | | | | |
| Sales of investments | | | 8,632.6 | | | | 10,709.6 | | | | 6,832.7 | |
| Maturities and redemptions of investments | | | 894.0 | | | | 917.3 | | | | 695.1 | |
| Purchases of investments | | | (10,739.2 | ) | | | (12,540.4 | ) | | | (8,193.7 | ) |
| Net sales (purchases) of trading securities | | | (51.7 | ) | | | 32.3 | | | | 346.5 | |
| Change in cash and cash equivalents held by variable interest entities | | | (19.6 | ) | | | 1.4 | | | | 11.3 | |
| Change in cash held by discontinued operations | | | - | | | | - | | | | 45.6 | |
| Other | | | (14.7 | ) | | | (10.6 | ) | | | (20.8 | ) |
| | | | | | | | | | | | | |
| Net cash used by investing activities | | | (1,298.6 | ) | | | (890.4 | ) | | | (283.3 | ) |
| | | | | | | | | | | | | |
| Cash flows from financing activities: | | | | | | | | | | | | |
| Issuance of notes payable, net | | | 756.1 | | | | 172.0 | | | | 75.0 | |
| Issuance of common stock | | | - | | | | 296.3 | | | | - | |
| Payments on notes payable | | | (793.6 | ) | | | (461.2 | ) | | | (44.0 | ) |
| Expenses related to debt modification and extinguishment of debt | | | - | | | | (14.7 | ) | | | - | |
| Amounts received for deposit products | | | 1,730.1 | | | | 1,668.9 | | | | 1,863.4 | |
| Withdrawals from deposit products | | | (1,704.4 | ) | | | (1,670.1 | ) | | | (1,573.3 | ) |
| Investment borrowings and borrowings related to variable interest entities | | | 624.9 | | | | (83.6 | ) | | | (145.5 | ) |
| | | | | | | | | | | | | |
| Net cash provided (used) by financing activities | | | 613.1 | | | | (92.4 | ) | | | 175.6 | |
| | | | | | | | | | | | | |
| Net increase (decrease) in cash and cash equivalents | | | 48.5 | | | | (371.1 | ) | | | 532.6 | |
| | | | | | | | | | | | | |
| Cash and cash equivalents, beginning of year | | | 523.4 | | | | 894.5 | | | | 361.9 | |
| | | | | | | | | | | | | |
| Cash and cash equivalents, end of year | | $ | 571.9 | | | $ | 523.4 | | | $ | 894.5 | |
The accompanying notes are an integral part
of the consolidated financial statements.
CNO FINANCIAL GROUP, INC. AND SUBSIDIARIES
Notes to Consolidated Financial Statements
___________________
1. BUSINESS AND BASIS OF PRESENTATION
CNO Financial Group, Inc., a Delaware corporation (“CNO”), (formerly known as Conseco, Inc. prior to its name change in May 2010) is a holding company for a group of insurance companies operating throughout the United States that develop, market and administer health insurance, annuity, individual life insurance and other insurance products. CNO became the successor to Conseco, Inc., an Indiana corporation (our “Predecessor”), in connection with our bankruptcy reorganization which became effective on September 10, 2003 (the “Effective Date”). The terms “CNO Financial Group, Inc.”, the “Company”, “we”, “us”, and “our” as used in these financial statements refer to CNO and its subsidiaries or, when the context requires othe rwise, our Predecessor and its subsidiaries. We focus on serving the senior and middle-income markets, which we believe are attractive, underserved, high growth markets. We sell our products through three distribution channels: career agents, independent producers (some of whom sell one or more of our product lines exclusively) and direct marketing.
Beginning July 1, 2010, management changed the manner in which it disaggregates the Company’s operations for making operating decisions and assessing performance. As a result, the Company manages its business through the following operating segments: Bankers Life, Colonial Penn and Washington National, which are defined on the basis of product distribution; Other CNO Business, comprised primarily of products we no longer sell actively; and corporate operations, comprised of holding company activities and certain noninsurance company businesses. Our segments are described below.
| · | Bankers Life, which markets and distributes Medicare supplement insurance, interest-sensitive life insurance, traditional life insurance, fixed annuities and long-term care insurance products to the middle-income senior market through a dedicated field force of career agents and sales managers supported by a network of community-based branch offices. The Bankers Life segment includes primarily the business of Bankers Life and Casualty Company (“Bankers Life”). Bankers Life also markets and distributes Medicare Advantage plans primarily through a distribution arrangement with Humana, Inc. (“Humana”) and Medicare Part D prescription drug plans through a distribution and reinsurance arrangement with Coventry Health Care (“Covent ry”). |
| · | Washington National, which markets and distributes supplemental health (including specified disease, accident and hospital indemnity insurance products) and life insurance to middle-income consumers at home and at the worksite. These products are marketed through Performance Matters Associates, Inc., a wholly owned subsidiary, and through independent marketing organizations and insurance agencies, including worksite marketing. The products being marketed are underwritten by Washington National Insurance Company (“Washington National”). |
| · | Colonial Penn, which markets primarily graded benefit and simplified issue life insurance directly to customers through television advertising, direct mail, the internet and telemarketing. The Colonial Penn segment includes primarily the business of Colonial Penn Life Insurance Company (“Colonial Penn”). |
| · | Other CNO Business, which consists of blocks of interest-sensitive life insurance, traditional life insurance, annuities, long-term care insurance and other supplemental health products. These blocks of business are not being actively marketed and were primarily issued or acquired by Conseco Life Insurance Company (“Conseco Life”) and Washington National. |
We prepare our financial statements in accordance with accounting principles generally accepted in the United States of America (“GAAP”). We follow the accounting standards established by the Financial Accounting Standards Board (“FASB”) and the Securities and Exchange Commission (the “SEC”).
The accompanying financial statements include the accounts of the Company and its subsidiaries. Our consolidated financial statements exclude the results of material transactions between us and our consolidated affiliates, or among our consolidated affiliates.
When we prepare financial statements in conformity with GAAP, we are required to make estimates and assumptions that significantly affect reported amounts of various assets and liabilities and the disclosure of contingent assets and liabilities at the date of the financial statements and revenues and expenses during the reporting periods. For example, we use significant estimates and assumptions to calculate values for deferred acquisition costs, the present value of future profits, certain investments (including derivatives), assets and liabilities related to income taxes, liabilities for insurance products, liabilities related to litigation, guaranty fund assessment accruals and amounts recoverable from loans to certain former directors and former employees. If our future experience differs from these estimates a nd assumptions, our financial statements would be materially affected.
CNO FINANCIAL GROUP, INC. AND SUBSIDIARIES
Notes to Consolidated Financial Statements
___________________
| | 2. | TRANSFER OF SENIOR HEALTH INSURANCE COMPANY OF PENNSYLVANIA TO AN INDEPENDENT TRUST |
On November 12, 2008, CNO and CDOC, Inc. (“CDOC”), a wholly owned subsidiary of CNO, completed the transfer (the “Transfer”) of the stock of Senior Health Insurance Company of Pennsylvania (“Senior Health”) to Senior Health Care Oversight Trust, an independent trust (the “Independent Trust”) for the exclusive benefit of Senior Health’s long-term care policyholders. The Transfer was approved by the Pennsylvania Insurance Department.
In connection with the Transfer, the Company entered into a $125.0 million Senior Note due November 12, 2013 (the “Senior Health Note”), payable to Senior Health. The note has a five-year maturity date; a 6 percent interest rate; and requires annual principal payments of $25.0 million. As a condition of the order from the Pennsylvania Insurance Department approving the Transfer, CNO agreed that it would not pay cash dividends on its common stock while any portion of the $125.0 million note remained outstanding.
CNO recorded accounting charges totaling $1.0 billion related to the transaction, comprised of Senior Health’s equity (as calculated in accordance with generally accepted accounting principles), an additional valuation allowance for deferred tax assets, the capital contribution to Senior Health and the Independent Trust and transaction expenses. The accounting charges are summarized as follows (dollars in millions):
| | | | | |
| Recognition of unrealized losses on investments transferred to the Independent Trust | | $ | 380.5 | | (a) |
| | | | | | |
| Gain on reinsurance recapture, net of tax | | | (19.3 | ) | |
| | | | | | |
| Increase to deferred tax valuation allowance based on recent results which have had a significant impact on taxable income and the effects of the transaction | | | 298.0 | | |
| | | | | | |
| Write-off of remaining shareholder’s equity of Senior Health | | | 159.2 | | (a) |
| | | | | | |
| Additional capital contribution and transaction expenses | | | 204.4 | | (a) |
| | | | | | |
| Total charges | | $ | 1,022.8 | | |
_________________
| | (a) | Amount is before the potential tax benefit. A deferred tax valuation allowance was established for all future potential tax benefits generated by these charges since management had concluded that it is more likely than not that such tax benefits would not be utilized to offset future taxable income. |
CNO FINANCIAL GROUP, INC. AND SUBSIDIARIES
Notes to Consolidated Financial Statements
___________________
As a result of the Transfer, Senior Health’s long-term care business is presented as a discontinued operation for all periods presented. The operating results from the discontinued operations are as follows (dollars in millions):
| | | 2008 | |
| | | | |
| Revenues: | | | |
| Insurance policy income | | $ | 227.9 | |
| Net investment income | | | 156.9 | |
| Net realized investment losses | | | (380.1 | ) |
| | | | | |
| Total revenues | | | 4.7 | |
| | | | | |
| Benefits and expenses: | | | | |
| Insurance policy benefits | | | 311.2 | |
| Amortization | | | 16.7 | |
| Gain on reinsurance recapture (a) | | | (29.7 | ) |
| Loss on Transfer and transaction expenses | | | 363.6 | |
| Other operating costs and expenses | | | 54.0 | |
| | | | | |
| Total benefits and expenses | | | 715.8 | |
| | | | | |
| Loss before income taxes | | | (711.1 | ) |
| | | | | |
| Income tax expense (benefit): | | | | |
| | | | | |
| Tax benefit on period income | | | (440.7 | ) |
| | | | | |
| Valuation allowance for deferred tax assets | | | 452.3 | |
| | | | | |
| Net loss from discontinued operations | | $ | (722.7 | ) |
_______________
| (a) | In the third quarter of 2008, Senior Health recaptured a block of previously reinsured long-term care business which was included in the business transferred to the Independent Trust. |
| | 3. | SUMMARY OF SIGNIFICANT ACCOUNTING POLICIES |
The following summary explains the significant accounting policies we use to prepare our financial statements.
Investments
We classify our fixed maturity securities into one of three categories: (i) “available for sale” (which we carry at estimated fair value with any unrealized gain or loss, net of tax and related adjustments, recorded as a component of shareholders’ equity); (ii) “trading” (which we carry at estimated fair value with changes in such value recognized as trading income); or (iii) “held to maturity” (which we carry at amortized cost). We had no fixed maturity securities classified as held to maturity during the periods presented in these financial statements.
Equity securities include investments in common stock and non-redeemable preferred stock. We carry these investments at estimated fair value. We record any unrealized gain or loss, net of tax and related adjustments, as a component of shareholders’ equity. When declines in value considered to be other than temporary occur, we reduce the amortized cost to estimated fair value and recognize a loss in the statement of operations.
Mortgage loans held in our investment portfolio are carried at amortized unpaid balances, net of provisions for estimated losses. Interest income is accrued on the principal amount of the loan based on the loan’s contractual interest rate. Payment terms specified for mortgage loans may include a prepayment penalty for unscheduled payoff of the investment. Prepayment penalties are recognized as investment income when received.
CNO FINANCIAL GROUP, INC. AND SUBSIDIARIES
Notes to Consolidated Financial Statements
___________________
Policy loans are stated at current unpaid principal balances.
Certain of our trading securities are held in an effort to offset the portion of the income statement volatility caused by the effect of interest rate fluctuations on the value of certain embedded derivatives related to our fixed index annuity products and certain modified coinsurance agreements. See the sections of this note entitled “Accounting for Derivatives” and “Investment Borrowings” for further discussion regarding embedded derivatives and the trading accounts. In addition, the trading account includes investments backing the market strategies of our multibucket annuity products. The change in fair value of these securities, which is recognized currently in income from policyholder and reinsurer accounts and other spe cial-purpose portfolios (a component of investment income), is substantially offset by the change in insurance policy benefits for these products. Our trading securities totaled $372.6 million and $293.3 million at December 31, 2010 and 2009, respectively.
Securities lending collateral primarily consisted of fixed maturities, equity securities and cash and cash equivalents. We carried these investments at estimated fair value. We recorded any unrealized gain or loss, net of tax, as a component of shareholders’ equity. In the third quarter of 2010, the Company discontinued its securities lending program.
Other invested assets include: (i) certain call options purchased in an effort to hedge the effects of certain policyholder benefits related to our fixed index annuity and life insurance products; and (ii) certain non-traditional investments. We carry the call options at estimated fair value as further described in the section of this note entitled “Accounting for Derivatives”. Non-traditional investments include investments in certain limited partnerships, which are accounted for using the equity method, and promissory notes, which are accounted for using the cost method.
We defer any fees received or costs incurred when we originate investments. We amortize fees, costs, discounts and premiums as yield adjustments over the contractual lives of the investments without anticipation of prepayments. We consider anticipated prepayments on mortgage-backed securities in determining estimated future yields on such securities.
When we sell a security (other than trading securities), we report the difference between the sale proceeds and amortized cost (determined based on specific identification) as a realized investment gain or loss.
We regularly evaluate our investments for possible impairment as further described in the note to the consolidated financial statements entitled “Investments”.
Cash and Cash Equivalents
Cash and cash equivalents include commercial paper, invested cash and other investments purchased with original maturities of less than three months. We carry them at amortized cost, which approximates estimated fair value.
Deferred Acquisition Costs
The costs that vary with, and are primarily related to, producing new insurance business subsequent to September 10, 2003 are referred to as deferred acquisition costs. For universal life or investment products, we amortize these costs in relation to the estimated gross profits using the interest rate credited to the underlying policies. For other products, we amortize these costs in relation to future anticipated premium revenue using the projected investment earnings rate.
When we realize a gain or loss on investments backing our universal life or investment-type products, we adjust the amortization to reflect the change in estimated gross profits from the products due to the gain or loss realized and the effect on future investment yields. We also adjust deferred acquisition costs for the change in amortization that would have been recorded if our fixed maturity securities, available for sale, had been sold at their stated aggregate fair value and the proceeds reinvested at current yields. We limit the total adjustment related to the impact of unrealized losses to the total of costs capitalized plus interest related to insurance policies issued in a particular year. We include the impact of this adjustment in accumulated other comprehensive income (loss) within shareholde rs’ equity.
The investment environment during the fourth quarter of 2008 resulted in significant net unrealized losses in our fixed maturity investment portfolio. The total adjustment to accumulated other comprehensive income (loss) related to the change in deferred acquisition costs for the negative amortization that would have been recorded if the fixed maturity securities had been sold at their stated aggregate fair value would have resulted in the balance of deferred acquisition costs exceeding the total of
CNO FINANCIAL GROUP, INC. AND SUBSIDIARIES
Notes to Consolidated Financial Statements
___________________
costs capitalized plus interest for annuity blocks of business issued in certain years. Accordingly, the adjustment made to deferred acquisition costs and accumulated other comprehensive income (loss) was reduced by $206 million.
We regularly evaluate the recoverability of the unamortized balance of the deferred acquisition costs. We consider estimated future gross profits or future premiums, expected mortality or morbidity, interest earned and credited rates, persistency and expenses in determining whether the balance is recoverable. If we determine a portion of the unamortized balance is not recoverable, it is charged to amortization expense. In certain cases, the unamortized balance of the deferred acquisition costs may not be deficient in the aggregate, but our estimates of future earnings indicate that profits would be recognized in early periods and losses in later periods. In this case, we increase the amortization of the deferre d acquisition costs over the period of profits, by an amount necessary to offset losses that are expected to be recognized in the later years.
Present Value of Future Profits
The value assigned to the right to receive future cash flows from contracts existing at September 10, 2003 is referred to as the present value of future profits. We also defer renewal commissions paid in excess of ultimate commission levels related to the existing policies in this account. The balance of this account is amortized and evaluated for recovery in the same manner as described above for deferred acquisition costs. We also adjust the present value of future profits for the change in amortization that would have been recorded if the fixed maturity securities, available for sale, had been sold at their stated aggregate fair value and the proceeds reinvested at current yields, similar to the manner described above for deferred acquisition costs. We limit the total adjustment related to the impact of unrealized losses to the total present value of future profits plus interest.
The discount rate we used to determine the present value of future profits was 12 percent.
The Company expects to amortize the balance of the present value of future profits as of December 31, 2010 as follows: 13 percent in 2011, 11 percent in 2012, 10 percent in 2013, 8 percent in 2014 and 7 percent in 2015.
Assets Held in Separate Accounts
Separate accounts are funds on which investment income and gains or losses accrue directly to certain policyholders. The assets of these accounts are legally segregated. They are not subject to the claims that may arise out of any other business of CNO. We report separate account assets at fair value; the underlying investment risks are assumed by the contractholders. We record the related liabilities at amounts equal to the separate account assets. We record the fees earned for administrative and contractholder services performed for the separate accounts in insurance policy income.
Recognition of Insurance Policy Income and Related Benefits and Expenses on Insurance Contracts
For universal life and investment contracts that do not involve significant mortality or morbidity risk, the amounts collected from policyholders are considered deposits and are not included in revenue. Revenues for these contracts consist of charges for policy administration, cost of insurance charges and surrender charges assessed against policyholders’ account balances. Such revenues are recognized when the service or coverage is provided, or when the policy is surrendered.
We establish liabilities for investment and universal life products equal to the accumulated policy account values, which include an accumulation of deposit payments plus credited interest, less withdrawals and the amounts assessed against the policyholder through the end of the period. Sales inducements provided to the policyholders of these products are recognized as liabilities over the period that the contract must remain in force to qualify for the inducement. The options attributed to the policyholder related to our fixed index annuity products are accounted for as embedded derivatives as described in the section of this note entitled “Accounting for Derivatives”.
Traditional life and the majority of our accident and health products (including long-term care, Medicare supplement and supplemental health products) are long duration insurance contracts. Premiums on these products are recognized as revenues when due from the policyholders.
We also have a small block of short duration accident and health products. Premiums on these products are recognized as revenue over the premium coverage period.
We establish liabilities for traditional life, accident and health insurance, and life contingent payment annuity products
CNO FINANCIAL GROUP, INC. AND SUBSIDIARIES
Notes to Consolidated Financial Statements
___________________
using mortality tables in general use in the United States, which are modified to reflect the Company’s actual experience when appropriate. We establish liabilities for accident and health insurance products using morbidity tables based on the Company’s actual or expected experience. These reserves are computed at amounts that, with additions from estimated future premiums received and with interest on such reserves at estimated future rates, are expected to be sufficient to meet our obligations under the terms of the policy. Liabilities for future policy benefits are computed on a net-level premium method based upon assumptions as to future claim costs, investment yields, mortality, morbidity, withdrawals, policy dividends and maintenance expenses determined when the policies were issued (or w ith respect to policies inforce at August 31, 2003, the Company’s best estimate of such assumptions on the Effective Date). We make an additional provision to allow for potential adverse deviation for some of our assumptions. Once established, assumptions on these products are generally not changed unless a premium deficiency exists. In that case, a premium deficiency reserve is recognized and the future pattern of reserve changes are modified to reflect the relationship of premiums to benefits based on the current best estimate of future claim costs, investment yields, mortality, morbidity, withdrawals, policy dividends and maintenance expenses, determined without an additional provision for potential adverse deviation.
We establish claim reserves based on our estimate of the loss to be incurred on reported claims plus estimates of incurred but unreported claims based on our past experience.
Accounting for Long-term Care Premium Rate Increases
Many of our long-term care policies were subject to premium rate increases in the three years ending December 31, 2010. In some cases, these premium rate increases were materially consistent with the assumptions we used to value the particular block of business at the fresh-start date. With respect to the 2006 premium rate increases, some of our policyholders were provided an option to cease paying their premiums and receive a non-forfeiture option in the form of a paid-up policy with limited benefits. In addition, our policyholders could choose to reduce their coverage amounts and premiums in the same proportion, when permitted by our contracts or as required by regulators. The following describes how we account for these policyholder options:
| · | Premium rate increases – If premium rate increases reflect a change in our previous rate increase assumptions, the new assumptions are not reflected prospectively in our reserves. Instead, the additional premium revenue resulting from the rate increase is recognized as earned and original assumptions continue to be used to determine changes to liabilities for insurance products unless a premium deficiency exists. |
| · | Benefit reductions – A policyholder may choose reduced coverage with a proportionate reduction in premium, when permitted by our contracts. This option does not require additional underwriting. Benefit reductions are treated as a partial lapse of coverage, and the balance of our reserves and deferred insurance acquisition costs is reduced in proportion to the reduced coverage. |
| · | Non-forfeiture benefits offered in conjunction with a rate increase – In some cases, non-forfeiture benefits are offered to policyholders who wish to lapse their policies at the time of a significant rate increase. In these cases, exercise of this option is treated as an extinguishment of the original contract and issuance of a new contract. The balance of our reserves and deferred insurance acquisition costs are released, and a reserve for the new contract is established. |
| · | Florida Order – In 2004, the Florida Office of Insurance Regulation issued an order to Washington National, regarding home health care business in Florida. The order required Washington National to offer a choice of three alternatives to holders of home health care policies in Florida subject to premium rate increases as follows: |
| · | retention of their current policy with a rate increase of 50 percent in the first year and actuarially justified increases in subsequent years; |
| · | receipt of a replacement policy with reduced benefits and a rate increase in the first year of 25 percent and no more than 15 percent in subsequent years; or |
| · | receipt of a paid-up policy, allowing the holder to file future claims up to 100 percent of the amount of premiums paid since the inception of the policy. |
Reserves for all three groups of policies under the order were prospectively adjusted using a prospective revision methodology, as these alternatives were required by the Florida Office of Insurance Regulation. These policies had
CNO FINANCIAL GROUP, INC. AND SUBSIDIARIES
Notes to Consolidated Financial Statements
___________________
no insurance acquisition costs established at the Effective Date.
Some of our policyholders may receive a non-forfeiture benefit if they cease paying their premiums pursuant to their original contract (or pursuant to changes made to their original contract as a result of a litigation settlement made prior to the Effective Date or an order issued by the Florida Office of Insurance Regulation). In these cases, exercise of this option is treated as the exercise of a policy benefit, and the reserve for premium paying benefits is reduced, and the reserve for the non-forfeiture benefit is adjusted to reflect the election of this benefit.
Accounting for marketing and reinsurance agreements with Coventry
Prescription Drug Benefit
The Medicare Prescription Drug, Improvement and Modernization Act of 2003 provided for the introduction of a prescription drug benefit (“PDP”). In order to offer this product to our current and potential future policyholders without investing in management and infrastructure, we entered into a national distribution agreement with Coventry to use our career and independent agents to distribute Coventry’s prescription drug plan, Advantra Rx. We receive a fee based on the premiums collected on plans sold through our distribution channels. In addition, CNO has a quota-share reinsurance agreement with Coventry for CNO enrollees that provides CNO with 50 percent of net premiums and related policy benefits subject to a risk corridor. The Part D program was effective January 1, 2006.
The following describes how we account for and report our PDP business:
Our accounting for the national distribution agreement
| · | For contracts sold prior to 2009, we recognize distribution and licensing fee income from Coventry based upon negotiated percentages of collected premiums on the underlying Medicare Part D contracts. For contracts sold in 2009 and thereafter, we recognize distribution income based on a fixed fee per PDP contract. This fee income is recognized over the calendar year term as premiums are collected. |
| · | We also pay commissions to our agents who sell the plans on behalf of Coventry. These payments are deferred and amortized over the remaining term of the initial enrollment period (the one-year life of the initial policy). |
Our accounting for the quota-share agreement
| · | We recognize premium revenue evenly over the period of the underlying Medicare Part D contracts. |
| · | We recognize policyholder benefits and ceding commission expense as incurred. |
| · | We recognize risk-share premium adjustments consistent with Coventry’s risk-share agreement with the Centers for Medicare and Medicaid Services. |
Private-Fee-For-Service
CNO expanded its strategic alliance with Coventry by entering into a national distribution agreement under which our career agents began distributing Coventry’s Private-Fee-For-Service (“PFFS”) plan, beginning January 1, 2007. The Advantra Freedom product is a Medicare Advantage plan designed to provide seniors with more choices and better coverage at lower cost than original Medicare and Medicare Advantage plans offered through HMOs. Under the agreement, we received a fee based on the number of PFFS plans sold through our distribution channels. In addition, CNO had a quota-share reinsurance agreement with Coventry for CNO enrollees that provided CNO with a specified percentage of the net premiums and related profits. Coventry decided to cease selling PFFS plans effective Janu ary 1, 2010. In July 2009, we announced a strategic alliance under which we would offer Humana’s Medicare Advantage plans to our policyholders and consumers through our career agency force and will receive marketing fees based on sales. Effective January 1, 2010, we no longer assumed the underwriting risk related to PFFS business.
We received distribution fees from Coventry and we paid sales commissions to our agents for these enrollments. In addition, we received a specified percentage of the income (loss) related to this business pursuant to a quota-share agreement with Coventry.
CNO FINANCIAL GROUP, INC. AND SUBSIDIARIES
Notes to Consolidated Financial Statements
___________________
The following summarizes our accounting and reporting practices for the PFFS business.
Our accounting for the distribution agreement
| · | We received distribution income from Coventry and other parties based on a fixed fee per PFFS contract. This income was deferred and recognized over the remaining calendar year term of the initial enrollment period. |
| · | We also paid commissions to our agents who sell the plans on behalf of Coventry and other parties. These payments were deferred and amortized over the remaining term of the initial enrollment period (the one-year life of the initial policy). |
Our accounting for the quota-share agreement
| · | We recognized revenue evenly over the period of the underlying PFFS contracts. |
| · | We recognized policyholder benefits and ceding commission expense as incurred. |
Large Group Private-Fee-For-Service Blocks
During 2007 and 2008, CNO entered into three quota-share reinsurance agreements with Coventry related to the PFFS business written by Coventry under two large group policies. CNO received a specified percentage of the net premiums and related profits associated with this business as long as the ceded revenue margin (as defined in the quota-share reinsurance agreements) was less than or equal to five percent. CNO also received a specified percentage of the net premiums and related profits on the ceded margin in excess of five percent. In order to reduce the required statutory capital associated with the assumption of this business, CNO terminated two group policy quota-share agreements as of December 31, 2008 and terminated the last agreement on June 30, 2009. Premiums assumed through these rein surance agreements totaled $47.5 million in 2009. The income before income taxes related to the assumed business was $14.0 million during the year ended December 31, 2009.
Reinsurance
In the normal course of business, we seek to limit our loss exposure on any single insured or to certain groups of policies by ceding reinsurance to other insurance enterprises. We currently retain no more than $.8 million of mortality risk on any one policy. We diversify the risk of reinsurance loss by using a number of reinsurers that have strong claims-paying ratings. In each case, the ceding CNO subsidiary is directly liable for claims reinsured in the event the assuming company is unable to pay.
The cost of reinsurance on life and health coverages is recognized over the life of the reinsured policies using assumptions consistent with those used to account for the underlying policy. The cost of reinsurance ceded totaled $258.6 million, $179.4 million and $164.0 million in 2010, 2009 and 2008, respectively. We deduct this cost from insurance policy income. Reinsurance recoveries netted against insurance policy benefits totaled $471.6 million, $477.2 million and $536.3 million in 2010, 2009 and 2008, respectively.
From time-to-time, we assume insurance from other companies. Any costs associated with the assumption of insurance are amortized consistent with the method used to amortize deferred acquisition costs described above. Reinsurance premiums assumed totaled $92.6 million, $475.5 million and $641.0 million in 2010, 2009 and 2008, respectively. Reinsurance premiums included amounts assumed pursuant to marketing and quota-share agreements with Coventry of $67.2 million, $444.3 million and $609.5 million in 2010, 2009 and 2008, respectively. Such premiums assumed included group policy quota-share agreements whereby we assumed: (i) a specified percentage of the PFFS business written by Coventry under a large group policy effective July 1, 2007 (which was terminated on June 30, 2009); and (ii) a specifie d percentage of the PFFS business written by Coventry under another large group policy effective May 1, 2008 (which was terminated on December 31, 2008). Coventry decided to cease selling PFFS plans effective January 1, 2010. In July 2009, Bankers Life entered into an agreement with Humana under which it offers Humana’s Medicare Advantage/PFFS plans to its policyholders and consumers nationwide through its career agency force and receives marketing fees based on sales. Effective January 1, 2010, the Company no longer assumes the underwriting risk related to PFFS business.
CNO FINANCIAL GROUP, INC. AND SUBSIDIARIES
Notes to Consolidated Financial Statements
___________________
See the section of this note entitled “Accounting for Derivatives” for a discussion of the derivative embedded in the payable related to certain modified coinsurance agreements.
In 2008, Bankers Life entered into a reinsurance agreement, as amended, pursuant to which it ceded 70 percent of its new 2008 and 2009 long-term care business, excluding certain business sold in the state of Florida. The amount reinsured decreased to 50 percent in the first quarter of 2010 and to 25 percent thereafter. The pre-tax impact of this reinsurance agreement was not significant in 2008.
In September 2009, we completed a transaction under which Washington National and Conseco Insurance Company coinsured, with an effective date of January 1, 2009, about 104,000 non-core life insurance policies in the Other CNO Business segment with Wilton Reassurance Company (“Wilton Re”). In the transaction, Wilton Re paid a ceding commission of $55.8 million and coinsures and administers 100 percent of these policies. The CNO insurance companies transferred to Wilton Re $401.6 million in cash and policy loans and $457.4 million of policy and other reserves. Most of the policies involved in the transaction were issued by companies prior to their acquisition by CNO. We recorded a deferred gain of approximately $26 million in 2009 which is being recognized over the remaining life of t he block of insurance policies coinsured with Wilton Re. We also increased our deferred tax valuation allowance by $20 million in 2009 as a result of reassessing the recovery of our deferred tax assets upon completion of the transaction.
In November 2009, we entered into a transaction under which Bankers Life coinsured, with an effective date of October 1, 2009, about 234,000 life insurance policies with Wilton Re. In the transaction, Wilton Re paid a ceding commission of $44 million and is 50% coinsuring these policies, which continue to be administered by Bankers Life. In the transaction, Bankers Life transferred to Wilton Re $73 million in investment securities and policy loans and $117 million of policy and other reserves. As a result of the transaction, we recorded an increase to our deferred tax valuation allowance of $18 million in 2009, as a result of reassessing the recovery of our deferred tax assets upon completion of the transaction. We also recorded a pre-tax deferred cost of reinsurance of $32 million in 2009, whi ch, in accordance with GAAP, is being amortized over the life of the block.
Income Taxes
Our income tax expense includes deferred income taxes arising from temporary differences between the financial reporting and tax bases of assets and liabilities, capital loss carryforwards and net operating loss carryforwards (“NOLs”). Deferred tax assets and liabilities are measured using enacted tax rates expected to apply in the years in which temporary differences are expected to be recovered or paid. The effect of a change in tax rates on deferred tax assets and liabilities is recognized in earnings in the period when the changes are enacted.
A reduction of the carrying amount of deferred tax assets by establishing a valuation allowance is required if, based on the available evidence, it is more likely than not that such assets will not be realized. We evaluate the need to establish a valuation allowance for our deferred income tax assets on an ongoing basis. In evaluating our deferred income tax assets, we consider whether the deferred income tax assets will be realized, based on the more-likely-than-not realization threshold criterion. The ultimate realization of our deferred income tax assets depends upon generating sufficient future taxable income during the periods in which our temporary differences become deductible and before our capital loss carryforwards and NOLs expire. This assessment requires significant judgment. & #160;In assessing the need for a valuation allowance, appropriate consideration is given to all positive and negative evidence related to the realization of the deferred tax assets. This assessment considers, among other matters, the nature, frequency and severity of current and cumulative losses, forecasts of future profitability, excess appreciated asset value over the tax basis of net assets, the duration of carryforward periods, our experience with operating loss and tax credit carryforwards expiring unused, and tax planning alternatives.
At December 31, 2010, our valuation allowance for our net deferred tax assets was $1.1 billion, as we have determined that it is more likely than not that a portion of our deferred tax assets will not be realized. This determination was made by evaluating each component of the deferred tax asset and assessing the effects of limitations and/or interpretations on the value of such component to be fully recognized in the future.
Investment Borrowings
Two of the Company’s insurance subsidiaries (Conseco Life and Bankers Life) are members of the Federal Home Loan Bank (“FHLB”). As members of the FHLB, Conseco Life and Bankers Life have the ability to borrow on a collateralized basis from FHLB. Conseco Life and Bankers Life are required to hold certain minimum amounts of FHLB
CNO FINANCIAL GROUP, INC. AND SUBSIDIARIES
Notes to Consolidated Financial Statements
___________________
common stock as a requirement of membership in the FHLB, and additional amounts based on the amount of the borrowings. At December 31, 2010, the carrying value of the FHLB common stock was $60.0 million. As of December 31, 2010, collateralized borrowings from the FHLB totaled $1.2 billion (of which, $750.0 million was borrowed in 2010) and the proceeds were used to purchase fixed maturity securities. The borrowings are classified as investment borrowings in the accompanying consolidated balance sheet. The borrowings are collateralized by investments with an estimated fair value of $1.5 billion at December 31, 2010, which are maintained in a custodial account for the benefit of the FHLB. Such investments are classified as fixed maturities, available for sale, in our consolidated balanc e sheet. Interest expense of $20.8 million, $20.3 million and $21.9 million in 2010, 2009 and 2008, respectively, was recognized related to the borrowings.
The following summarizes the terms of the borrowings (dollars in millions):
| Amount | | Maturity | | Interest rate |
| borrowed | | date | | at December 31, 2010 |
| | | | | |
| $ | 54.0 | | May 2012 | | Variable rate – 0.284% |
| | 13.0 | | July 2012 | | Variable rate – 0.349% |
| | 100.0 | | October 2013 | | Variable rate – 0.591% |
| | 100.0 | | September 2015 | | Variable rate – 0.611% |
| | 100.0 | | September 2015 | | Variable rate – 0.588% |
| | 100.0 | | October 2015 | | Variable rate – 0.616% |
| | 150.0 | | October 2015 | | Variable rate – 0.610% |
| | 146.0 | | November 2015 | | Fixed rate – 5.300% |
| | 100.0 | | November 2015 | | Fixed rate – 4.890% |
| | 100.0 | | December 2015 | | Fixed rate – 4.710% |
| | 50.0 | | November 2016 | | Variable rate – 0.573% |
| | 50.0 | | November 2016 | | Variable rate – 0.731% |
| | 100.0 | | October 2017 | | Variable rate – 0.715% |
| | 37.0 | | November 2017 | | Fixed rate – 3.750% |
| | | | | | |
| $ | 1,200.0 | | | | |
The variable rate borrowings are pre-payable on each interest reset date without penalty. The fixed rate borrowings are pre-payable subject to payment of a yield maintenance fee based on current market interest rates. At December 31, 2010, the aggregate fee to prepay all fixed rate borrowings was $61.2 million.
At December 31, 2010, investment borrowings consisted of: (i) collateralized borrowings from the FHLB of $1.2 billion; and (ii) other borrowings of $4.1 million.
At December 31, 2009, investment borrowings consisted of: (i) collateralized borrowings from the FHLB of $450.0 million; (ii) $229.1 million of securities issued to other entities by a variable interest entity (“VIE”) which is consolidated in our financial statements as further discussed in the note to the consolidated financial statements entitled “Investments in Variable Interest Entities”; and (iii) other borrowings of $4.8 million.
Accounting for Derivatives
Our fixed index annuity products provide a guaranteed minimum rate of return and a higher potential return that is based on a percentage (the “participation rate”) of the amount of increase in the value of a particular index, such as the Standard & Poor’s 500 Index, over a specified period. Typically, on each policy anniversary date, a new index period begins. We are generally able to change the participation rate at the beginning of each index period during a policy year, subject to contractual minimums. We typically buy call options (including call spreads) referenced to the applicable indices in an effort to hedge potential increases to policyholder benefits resulting from increases in the particular index to which the policy’s return is linked. We reflect changes in the estimated fair value of these options in net investment income (classified as investment income from policyholder and reinsurer accounts and other special-purpose portfolios). Net investment gains (losses) related to fixed index products were $28.2 million, $50.7 million and $(104.3) million in 2010, 2009 and 2008, respectively. These amounts were substantially offset by a corresponding change to insurance policy benefits. The estimated fair value of these options was $89.4 million and $114.9 million at December 31, 2010 and 2009, respectively. We classify these instruments as other invested assets.
CNO FINANCIAL GROUP, INC. AND SUBSIDIARIES
Notes to Consolidated Financial Statements
___________________
The Company accounts for the options attributed to the policyholder for the estimated life of the annuity contract as embedded derivatives. The expected future cost of options on fixed index annuity products is used to determine the value of embedded derivatives. The Company purchases options to hedge liabilities for the next policy year on each policy anniversary date and must estimate the fair value of the forward embedded options related to the policies. These accounting requirements often create volatility in the earnings from these products. We record the changes in the fair values of the embedded derivatives in current earnings as a component of policyholder benefits. Effective January 1, 2008, we adopted authoritative guidance related to fair value measurements which required us to value the embedded derivatives reflecting a hypothetical market perspective for fair value measurement. We recorded a charge of $1.8 million to net income (after the effects of the amortization of the present value of future profits and deferred acquisition costs (collectively referred to as “amortization of insurance acquisition costs”) and income taxes), attributable to changes in the fair value of the embedded derivatives as a result of adopting such guidance. The fair value of these derivatives, which are classified as “liabilities for interest-sensitive products”, was $553.6 million and $494.4 million at December 31, 2010 and 2009, respectively. We maintain a specific block of investments in our trading securities account, which we carry at estimated fair value with changes in such value recognized as investment income (classified as investment income from policyholder and reinsurer accounts and other special-purpose portfolios). The change in value of these trading securities attributable to interest fluctuations is intended to offset a portion of the change in the value of the embedded derivative.
If the counterparties for the call options we hold fail to meet their obligations, we may have to recognize a loss. We limit our exposure to such a loss by diversifying among several counterparties believed to be strong and creditworthy. At December 31, 2010, all of our counterparties were rated “BBB+” or higher by Standard & Poor’s Corporation (“S&P”).
Certain of our reinsurance payable balances contain embedded derivatives. Such derivatives had an estimated fair value of $(.4) million and $1.6 million at December 31, 2010 and 2009, respectively. We record the change in the fair value of these derivatives as a component of investment income (classified as investment income from policyholder and reinsurer accounts and other special-purpose portfolios). We maintain a specific block of investments related to these agreements in our trading securities account, which we carry at estimated fair value with changes in such value recognized as investment income (also classified as investment income from policyholder and reinsurer accounts and other special-purpose portfolios). The change in value of these trading securities attributable to interest fl uctuations is intended to offset the change in value of the embedded derivatives. However, differences will occur as corporate spreads change.
Multibucket Annuity Product
The Company’s multibucket annuity is an annuity product that credits interest based on the experience of a particular market strategy. Policyholders allocate their annuity premium payments to several different market strategies based on different asset classes within the Company’s investment portfolio. Interest is credited to this product based on the market return of the given strategy, less management fees, and funds may be moved between different strategies. The Company guarantees a minimum return of premium plus approximately 3 percent per annum over the life of the contract. The investments backing the market strategies of these products are designated by the Company as trading securities. The change in the fair value of these securities is recognized as investment income (classified as income from policyholder and reinsurer accounts and other special-purpose portfolios), which is substantially offset by the change in insurance policy benefits for these products. As of December 31, 2010, we hold insurance liabilities of $63.7 million related to multibucket annuity products.
Stock Based Compensation
In December 2004, the FASB issued authoritative guidance which provided additional guidance on accounting for share-based payments and required all such awards to be measured at fair value with the related compensation cost recognized in the statement of operations over the related service period. CNO implemented the guidance using the modified prospective method on January 1, 2006. Under this method, the Company began recognizing compensation cost for all awards granted on or after January 1, 2006. In addition, we are required to recognize compensation cost over the remaining requisite service period for the portion of outstanding awards that were not vested as of January 1, 2006 and were not previously expensed on a pro forma basis pursuant to the guidance. The guidance also requires the bene fits of tax deductions in excess of recognized compensation cost to be reported as a financing cash flow rather than as an operating cash flow, as previously required. During 2010, 2009 and 2008, we did not capitalize any stock-based compensation expense as deferred acquisition costs or any other asset category.
CNO FINANCIAL GROUP, INC. AND SUBSIDIARIES
Notes to Consolidated Financial Statements
___________________
Fair Value Measurements
Effective January 1, 2008, we adopted authoritative guidance which clarifies a number of considerations with respect to fair value measurement objectives for financial reporting and expands disclosures about the use of fair value measurements. The guidance is intended to increase consistency and comparability among fair value estimates used in financial reporting and the disclosure requirements are intended to provide users of financial statements with the ability to assess the reliability of an entity’s fair value measurements. The initial adoption of the guidance resulted in a charge of $1.8 million to net income (after the effects of the amortization of insurance acquisition costs and income taxes) in the first quarter of 2008, attributable to changes in the liability for the embedded derivatives associated with our fixed index annuity products. The change resulted from the incorporation of risk margins into the estimated fair value calculation for this liability.
Definition of Fair Value
Fair value is the price that would be received to sell an asset or paid to transfer a liability in an orderly transaction between market participants at the measurement date and, therefore, represents an exit price, not an entry price. We hold fixed maturities, equity securities, trading securities, investments held by variable interest entities, derivatives, separate account assets and embedded derivatives, which are carried at fair value.
The degree of judgment utilized in measuring the fair value of financial instruments is largely dependent on the level to which pricing is based on observable inputs. Observable inputs reflect market data obtained from independent sources, while unobservable inputs reflect our view of market assumptions in the absence of observable market information. Financial instruments with readily available active quoted prices would be considered to have fair values based on the highest level of observable inputs, and little judgment would be utilized in measuring fair value. Financial instruments that rarely trade would often have fair value based on a lower level of observable inputs, and more judgment would be utilized in measuring fair value.
Valuation Hierarchy
There is a three-level hierarchy for valuing assets or liabilities at fair value based on whether inputs are observable or unobservable.
| · | Level 1 – includes assets and liabilities valued using inputs that are quoted prices in active markets for identical assets or liabilities. Our Level 1 assets include exchange traded securities. |
| · | Level 2 – includes assets and liabilities valued using inputs that are quoted prices for similar assets in an active market, quoted prices for identical or similar assets in a market that is not active, observable inputs, or observable inputs that can be corroborated by market data. Level 2 assets and liabilities include those financial instruments that are valued by independent pricing services using models or other valuation methodologies. These models are primarily industry-standard models that consider various inputs such as interest rate, credit spread, reported trades, broker/dealer quotes, issuer spreads and other inputs that are observable or derived from observable information in the marketplace or are supported by observable levels at which transactions are executed in the marketplace. Financial instr uments in this category primarily include: certain public and private corporate fixed maturity securities; certain government or agency securities; certain mortgage and asset-backed securities; and non-exchange-traded derivatives such as call options to hedge liabilities related to our fixed index annuity products. |
| · | Level 3 – includes assets and liabilities valued using unobservable inputs that are used in model-based valuations that contain management assumptions. Level 3 assets and liabilities include those financial instruments whose fair value is estimated based on non-binding broker prices or internally developed models or methodologies utilizing significant inputs not based on, or corroborated by, readily available market information. Financial instruments in this category include certain corporate securities (primarily private placements), certain mortgage and asset-backed securities, and other less liquid securities. Additionally, the Company’s liabilities for embedded derivatives (including embedded derivatives related to our fixed index annuity products and to a modified coinsurance arrangement) are classif ied in Level 3 since their values include significant unobservable inputs including actuarial assumptions. |
At each reporting date, we classify assets and liabilities into the three input levels based on the lowest level of input that is significant to the measurement of fair value for each asset and liability reported at fair value. This classification is impacted
CNO FINANCIAL GROUP, INC. AND SUBSIDIARIES
Notes to Consolidated Financial Statements
___________________
by a number of factors, including the type of financial instrument, whether the financial instrument is new to the market and not yet established, the characteristics specific to the transaction and overall market conditions. Our assessment of the significance of a particular input to the fair value measurement and the ultimate classification of each asset and liability requires judgment.
The vast majority of our fixed maturity securities and separate account assets use Level 2 inputs for the determination of fair value. These fair values are obtained primarily from independent pricing services, which use Level 2 inputs for the determination of fair value. Substantially all of our Level 2 fixed maturity securities and separate account assets were valued from independent pricing services. Third party pricing services normally derive the security prices through recently reported trades for identical or similar securities making adjustments through the reporting date based upon available market observable information. If there are no recently reported trades, the third party pricing services may use matrix or model processes to develop a security price where future cash flow expect ations are developed and discounted at an estimated risk-adjusted market rate. The number of prices obtained is dependent on the Company’s analysis of such prices as further described below.
For securities that are not priced by pricing services and may not be reliably priced using pricing models, we obtain broker quotes. These broker quotes are non-binding and represent an exit price, but assumptions used to establish the fair value may not be observable and therefore represent Level 3 inputs. Approximately 16 percent and 1 percent of our Level 3 fixed maturity securities were valued using broker quotes or independent pricing services, respectively. The remaining Level 3 fixed maturity investments do not have readily determinable market prices and/or observable inputs. For these securities, we use internally developed valuations. Key assumptions used to determine fair value for these securities may include ri sk-free rates, risk premiums, performance of underlying collateral and other factors involving significant assumptions which may not be reflective of an active market. For certain investments, we use a matrix or model process to develop a security price where future cash flow expectations are developed and discounted at an estimated market rate. The pricing matrix utilizes a spread level to determine the market price for a security. The credit spread generally incorporates the issuer’s credit rating and other factors relating to the issuer’s industry and the security’s maturity. In some instances, issuer-specific spread adjustments, which can be positive or negative, are made based upon internal analysis of security specifics such as liquidity, deal size and time to maturity.
Privately placed securities comprise approximately 66 percent of our fixed maturities, available for sale, classified as Level 3. Privately placed securities are classified as Level 3 when their valuation is based on internal valuation models which rely on significant inputs that are not observable in the market. Our model applies spreads above the risk-free rate which are determined based on comparison to securities with similar ratings, maturities and industries that are rated by independent third party rating agencies. Our process also considers the ratings assigned by the National Association of Insurance Commissioners (the “NAIC”) to the Level 3 securities on an annual basis. Each quarter, a review is performed to determine the reasonableness of the initial valuations from the model. If an initial valuation appears unreasonable based on our knowledge of a security and current market conditions, we make appropriate adjustments to our valuation inputs. The remaining securities classified as Level 3 are primarily valued based on internally developed models using estimated future cash flows. We recognized other-than-temporary impairments on securities classified as Level 3 investments of $75.9 million during 2010 ($72.0 million, prior to the $(3.9) million of impairment losses recognized through accumulated other comprehensive income (loss)).
As the Company is responsible for the determination of fair value, we perform monthly quantitative and qualitative analysis on the prices received from third parties to determine whether the prices are reasonable estimates of fair value. The Company’s analysis includes: (i) a review of the methodology used by third party pricing services; (ii) a comparison of pricing services’ valuation to other pricing services’ valuations for the same security; (iii) a review of month to month price fluctuations; (iv) a review to ensure valuations are not unreasonably stale; and (v) back testing to compare actual purchase and sale transactions with valuations received from third parties. As a result of such procedures, the Company may conclude the prices received from third parties are not reflective o f current market conditions. In those instances, we may request additional pricing quotes or apply internally developed valuations. However, the number of instances is insignificant and the aggregate change in value of such investments is not materially different from the original prices received.
The categorization of the fair value measurements of our investments priced by independent pricing services was based upon the Company’s judgment of the inputs or methodologies used by the independent pricing services to value different asset classes. Such inputs include: benchmark yields, reported trades, broker dealer quotes, issuer spreads, benchmark securities, bids, offers and reference data. The Company categorizes such fair value measurements based upon asset classes and the underlying observable or unobservable inputs used to value such investments.
CNO FINANCIAL GROUP, INC. AND SUBSIDIARIES
Notes to Consolidated Financial Statements
___________________
The classification of fair value measurements for derivative instruments, including embedded derivatives requiring bifurcation, is determined based on the consideration of several inputs including closing exchange or over-the-counter market price quotations; time value and volatility factors underlying options; market interest rates; and non-performance risk. For certain embedded derivatives, we may use actuarial assumptions in the determination of fair value.
The categorization of fair value measurements, by input level, for our fixed maturity securities, equity securities, trading securities, certain other invested assets, assets held in separate accounts and embedded derivative instruments included in liabilities for insurance products at December 31, 2010 is as follows (dollars in millions):
| | | Quoted prices in active markets for identical assets or liabilities (Level 1) | | | Significant other observable inputs (Level 2) | | | | Significant unobservable inputs (Level 3) | | | | Total | |
| Assets: | | | | | | | | | | | | | | |
| Fixed maturities, available for sale: | | | | | | | | | | | | | | |
Corporate securities | | $ | - | | | $ | 12,254.7 | | | | $ | 2,092.5 | | | | $ | 14,347.2 | |
| United States Treasury securities and obligations of United States government corporations and agencies | | | 10.0 | | | | 282.2 | | | | | 2.0 | | | | | 294.2 | |
States and political subdivisions | | | - | | | | 1,772.1 | | | | | 11.4 | | | | | 1,783.5 | |
Debt securities issued by foreign governments | | | - | | | | .9 | | | | | - | | | | | .9 | |
Asset-backed securities | | | - | | | | 638.1 | | | | | 6.0 | | | | | 644.1 | |
Collateralized debt obligations | | | - | | | | - | | | | | 256.5 | | | | | 256.5 | |
Commercial mortgage-backed securities | | | - | | | | 1,363.7 | | | | | - | | | | | 1,363.7 | |
Mortgage pass-through securities | | | 27.8 | | | | - | | | | | 3.5 | | | | | 31.3 | |
Collateralized mortgage obligations | | | - | | | | 1,715.4 | | | | | 197.1 | | | | | 1,912.5 | |
Total fixed maturities, available for sale | | | 37.8 | | | | 18,027.1 | | | | | 2,569.0 | | | | | 20,633.9 | |
| | | | | | | | | | | | | | | | | | | |
Equity securities | | | - | | | | 37.5 | | | | | 30.6 | | | | | 68.1 | |
| | | | | | | | | | | | | | | | | | | |
| Trading securities: | | | | | | | | | | | | | | | | | | |
Corporate securities | | | 3.2 | | | | 47.5 | | | | | 4.3 | | | | | 55.0 | |
| United States Treasury securities and obligations of United States government corporations and agencies | | | - | | | | 293.8 | | | | | - | | | | | 293.8 | |
States and political subdivisions | | | - | | | | 16.1 | | | | | - | | | | | 16.1 | |
Asset-backed securities | | | - | | | | .6 | | | | | - | | | | | .6 | |
Commercial mortgage-backed securities | | | - | | | | 5.2 | | | | | - | | | | | 5.2 | |
Mortgage pass-through securities | | | .3 | | | | - | | | | | - | | | | | .3 | |
Collateralized mortgage obligations | | | - | | | | 1.2 | | | | | .4 | | | | | 1.6 | |
Total trading securities | | | 3.5 | | | | 364.4 | | | | | 4.7 | | | | | 372.6 | |
Investments held by variable interest entities | | | - | | | | 414.2 | | | | | 6.7 | | | | | 420.9 | |
Other invested assets | | | - | | | | 192.0 | | (a) | | | - | | | | | 192.0 | |
Assets held in separate accounts | | | - | | | | 17.5 | | | | | - | | | | | 17.5 | |
| | | | | | | | | | | | | | | | | | | |
| Liabilities: | | | | | | | | | | | | | | | | | | |
| Liabilities for insurance products: | | | | | | | | | | | | | | | | | | |
Interest-sensitive products | | | - | | | | - | | | | | 553.2 | | (b) | | | 553.2 | |
_____________
| (a) | Includes company-owned life insurance and derivatives. |
| (b) | Includes $553.6 million of embedded derivatives associated with our fixed index annuity products and $(.4) million of embedded derivatives associated with a modified coinsurance agreement. |
CNO FINANCIAL GROUP, INC. AND SUBSIDIARIES
Notes to Consolidated Financial Statements
___________________
The categorization of fair value measurements, by input level, for our fixed maturity securities, equity securities, trading securities, certain other invested assets, assets held in separate accounts and embedded derivative instruments included in liabilities for insurance products at December 31, 2009 is as follows (dollars in millions):
| | | Quoted prices in active markets for identical assets or liabilities (Level 1) | | | Significant other observable inputs (Level 2) | | | | Significant unobservable inputs (Level 3) | | | | Total | |
| Assets: | | | | | | | | | | | | | | |
| Fixed maturities, available for sale: | | | | | | | | | | | | | | |
Corporate securities | | $ | - | | | $ | 12,044.3 | | | | $ | 2,247.1 | | | | $ | 14,291.4 | |
| United States Treasury securities and obligations of United States government corporations and agencies | | | 19.4 | | | | 248.0 | | | | | 2.2 | | | | | 269.6 | |
States and political subdivisions | | | - | | | | 842.9 | | | | | 10.7 | | | | | 853.6 | |
Debt securities issued by foreign governments | | | - | | | | 5.1 | | | | | - | | | | | 5.1 | |
Asset-backed securities | | | - | | | | 176.3 | | | | | 15.8 | | | | | 192.1 | |
Collateralized debt obligations | | | - | | | | - | | | | | 92.8 | | | | | 92.8 | |
Commercial mortgage-backed securities | | | - | | | | 752.3 | | | | | 13.7 | | | | | 766.0 | |
Mortgage pass-through securities | | | 37.1 | | | | 1.3 | | | | | 4.2 | | | | | 42.6 | |
Collateralized mortgage obligations | | | - | | | | 2,003.8 | | | | | 11.4 | | | | | 2,015.2 | |
Total fixed maturities, available for sale | | | 56.5 | | | | 16,074.0 | | | | | 2,397.9 | | | | | 18,528.4 | |
| | | | | | | | | | | | | | | | | | | |
Equity securities | | | .1 | | | | - | | | | | 30.9 | | | | | 31.0 | |
| | | | | | | | | | | | | | | | | | | |
| Trading securities: | | | | | | | | | | | | | | | | | | |
Corporate securities | | | 3.8 | | | | 49.4 | | | | | 3.7 | | | | | 56.9 | |
| United States Treasury securities and obligations of United States government corporations and agencies | | | - | | | | 220.3 | | | | | - | | | | | 220.3 | |
States and political subdivisions | | | - | | | | 4.4 | | | | | - | | | | | 4.4 | |
Asset-backed securities | | | - | | | | .6 | | | | | - | | | | | .6 | |
Commercial mortgage-backed securities | | | - | | | | 4.9 | | | | | - | | | | | 4.9 | |
Mortgage pass-through securities | | | .5 | | | | - | | | | | - | | | | | .5 | |
Collateralized mortgage obligations | | | - | | | | 5.7 | | | | | - | | | | | 5.7 | |
Total trading securities | | | 4.3 | | | | 285.3 | | | | | 3.7 | | | | | 293.3 | |
| | | | | | | | | | | | | | | | | | | |
| Securities lending collateral: | | | | | | | | | | | | | | | | | | |
Corporate securities | | | - | | | | 81.0 | | | | | 13.7 | | | | | 94.7 | |
Asset-backed securities | | | - | | | | 16.2 | | | | | 22.9 | | | | | 39.1 | |
Total securities lending collateral | | | - | | | | 97.2 | | | | | 36.6 | | | | | 133.8 | |
| | | | | | | | | | | | | | | | | | | |
Other invested assets | | | - | | | | 192.6 | | (a) | | | 2.4 | | (b) | | | 195.0 | |
Assets held in separate accounts | | | - | | | | 17.3 | | | | | - | | | | | 17.3 | |
| | | | | | | | | | | | | | | | | | | |
| Liabilities: | | | | | | | | | | | | | | | | | | |
| Liabilities for insurance products: | | | | | | | | | | | | | | | | | | |
Interest-sensitive products | | | - | | | | - | | | | | 496.0 | | (c) | | | 496.0 | |
CNO FINANCIAL GROUP, INC. AND SUBSIDIARIES
Notes to Consolidated Financial Statements
___________________
| (a) | Includes company-owned life insurance and derivatives. |
| (b) | Includes equity-like holdings in special-purpose entities. |
| (c) | Includes $494.4 million of embedded derivatives associated with our fixed index annuity products and $1.6 million of embedded derivatives associated with a modified coinsurance agreement. |
CNO FINANCIAL GROUP, INC. AND SUBSIDIARIES
Notes to Consolidated Financial Statements
___________________
The following table presents additional information about assets and liabilities measured at fair value on a recurring basis and for which we have utilized significant unobservable (Level 3) inputs to determine fair value for the year ended December 31, 2010 (dollars in millions):
| | | December 31, 2010 | | Amount of total gains (losses) for the year ended December 31, 2010 included in our net income relating to assets and liabilities still held as of the reporting date |
| | | Beginning balance as of December 31, 2009 | | | Cumulative effect of accounting change (a) | | | Purchases, sales, issuances and settlements, net | | | Total realized and unrealized gains (losses) included in net income | | | Total realized and unrealized gains (losses) included in accumulated other comprehensive income (loss) | | | Transfers into Level 3 (b) | | | Transfers out of Level 3 (b) (c) | | | Ending balance as of December 31, 2010 | |
| Assets: | | | | | | | | | | | | | | | | | | | | | | | | | | | |
| Fixed maturities, available for sale: | | | | | | | | | | | | | | | | | | | | | | | | | | | |
Corporate securities | | $ | 2,247.1 | | | $ | (5.9 | ) | | $ | 148.8 | | | $ | (72.7 | ) | | $ | 74.5 | | | $ | 19.6 | | | $ | (318.9 | ) | | $ | 2,092.5 | | | | $ | - | | |
| United States Treasury securities and obligations of United States government corporations and agencies | | | 2.2 | | | | - | | | | (.1 | ) | | | - | | | | (.1 | ) | | | - | | | | - | | | | 2.0 | | | | | - | | |
States and political subdivisions | | | 10.7 | | | | - | | | | - | | | | - | | | | .4 | | | | 2.1 | | | | (1.8 | ) | | | 11.4 | | | | | - | | |
Asset-backed securities | | | 15.8 | | | | - | | | | (12.3 | ) | | | (11.4 | ) | | | 13.9 | | | | - | | | | - | | | | 6.0 | | | | | - | | |
Collateralized debt obligations | | | 92.8 | | | | (5.7 | ) | | | 160.2 | | | | (.3 | ) | | | 9.5 | | | | - | | | | - | | | | 256.5 | | | | | - | | |
Commercial mortgage-backed securities | | | 13.7 | | | | - | | | | - | | | | - | | | | - | | | | - | | | | (13.7 | ) | �� | | - | | | | | - | | |
Mortgage pass-through securities | | | 4.2 | | | | - | | | | (.7 | ) | | | - | | | | - | | | | - | | | | - | | | | 3.5 | | | | | - | | |
Collateralized mortgage obligations | | | 11.4 | | | | - | | | | 174.8 | | | | (.8 | ) | | | 5.5 | | | | 17.3 | | | | (11.1 | ) | | | 197.1 | | | | | - | | |
Total fixed maturities, available for sale | | | 2,397.9 | | | | (11.6 | ) | | | 470.7 | | | | (85.2 | ) | | | 103.7 | | | | 39.0 | | | | (345.5 | ) | | | 2,569.0 | | | | | - | | |
Equity securities | | | 30.9 | | | | - | | | | .1 | | | | - | | | | (.4 | ) | | | - | | | | - | | | | 30.6 | | | | | - | | |
| Trading securities: | | | | | | | | | | | | | | | | | | | | | | | | | | | | | | | | | | | | | | |
Corporate securities | | | 3.7 | | | | - | | | | - | | | | - | | | | .6 | | | | - | | | | - | | | | 4.3 | | | | | .6 | | |
Collateralized mortgage obligations | | | - | | | | - | | | | - | | | | - | | | | .1 | | | | .3 | | | | - | | | | .4 | | | | | .1 | | |
Total trading securities | | | 3.7 | | | | - | | | | - | | | | - | | | | .7 | | | | .3 | | | | - | | | | 4.7 | | | | | .7 | | |
Investments held by variable interest entities: | | | | | | | | | | | | | | | | | | | | | | | | | | | | | | | | | | | | | | |
| Corporate securities | | | - | | | | 6.9 | | | | (1.0 | ) | | | - | | | | .8 | | | | - | | | | - | | | | 6.7 | | | | | - | | |
| Securities lending collateral: | | | | | | | | | | | | | | | | | | | | | | | | | | | | | | | | | | | | | | |
Corporate securities | | | 13.7 | | | | - | | | | (13.7 | ) | | | - | | | | - | | | | - | | | | - | | | | - | | | | | - | | |
Asset-backed securities | | | 22.9 | | | | - | | | | (20.9 | ) | | | - | | | | - | | | | - | | | | (2.0 | ) | | | - | | | | | - | | |
Total securities lending collateral | | | 36.6 | | | | - | | | | (34.6 | ) | | | - | | | | - | | | | - | | | | (2.0 | ) | | | - | | | | | - | | |
Other invested assets | | | 2.4 | | | | (2.4 | ) | | | - | | | | - | | | | - | | | | - | | | | - | | | | - | | | | | - | | |
| Liabilities: | | | | | | | | | | | | | | | | | | | | | | | | | | | | | | | | | | | | | | |
| Liabilities for insurance products: | | | | | | | | | | | | | | | | | | | | | | | | | | | | | | | | | | | | | | |
Interest-sensitive products | | | (496.0 | ) | | | - | | | | (20.0 | ) | | | (37.2 | ) | | | - | | | | - | | | | - | | | | (553.2 | ) | | | | (37.2 | ) | |
CNO FINANCIAL GROUP, INC. AND SUBSIDIARIES
Notes to Consolidated Financial Statements
___________________
________
| (a) | Amounts represent adjustments to investments related to a variable interest entity that was required to be consolidated effective January 1, 2010, as well as the reclassification of investments of a variable interest entity which was consolidated at December 31, 2009. |
| (b) | Transfers in/out of Level 3 are reported as having occurred at the beginning of the period. |
| (c) | Included in the transfers out of Level 3 is approximately $282 million of privately issued securities that were priced using observable market data at December 31, 2010 and were, therefore, transferred to Level 2. |
The following table presents additional information about assets and liabilities measured at fair value on a recurring basis and for which we have utilized significant unobservable (Level 3) inputs to determine fair value for the year ended December 31, 2009 (dollars in millions):
| | | December 31, 2009 | | | |
| | | Beginning balance as of December 31, 2008 | | | Purchases, sales, issuances and settlements, net | | | Total realized and unrealized gains (losses) included in net income | | | Total realized and unrealized gains (losses) included in accumulated other comprehensive income (loss) | | | Transfers into Level 3 (a) | | | Transfers out of Level 3 (a) | | | Ending balance as of December 31, 2009 | | Amount of total gains (losses) for the year ended December 31, 2009 included in our net income relating to assets and liabilities still held as of the reporting date | |
| Assets: | | | | | | | | | | | | | | | | | | | | | | | | |
| Fixed maturities, available for sale: | | | | | | | | | | | | | | | | | | | | | | | | |
Corporate securities | | $ | 1,715.6 | | | $ | 231.1 | | | $ | (5.2 | ) | | $ | 284.8 | | | $ | 30.3 | | | $ | (9.5 | ) | | $ | 2,247.1 | | | $ | - | |
| United States Treasury securities and obligations of United States government corporations and agencies | | | 2.6 | | | | (.1 | ) | | | - | | | | (.3 | ) | | | - | | | | - | | | | 2.2 | | | | - | |
States and political subdivisions | | | 10.5 | | | | (.5 | ) | | | - | | | | (1.1 | ) | | | 1.8 | | | | - | | | | 10.7 | | | | - | |
Asset-backed securities | | | 27.5 | | | | (4.4 | ) | | | (5.2 | ) | | | 2.0 | | | | - | | | | (4.1 | ) | | | 15.8 | | | | (1.2 | ) |
Collateralized debt obligations | | | 96.7 | | | | (36.3 | ) | | | (4.2 | ) | | | 36.6 | | | | - | | | | - | | | | 92.8 | | | | (2.7 | ) |
Commercial mortgage-backed securities | | | 9.6 | | | | (.7 | ) | | | (.6 | ) | | | 5.4 | | | | - | | | | - | | | | 13.7 | | | | - | |
Mortgage pass-through securities | | | 4.9 | | | | (.8 | ) | | | - | | | | - | | | | .1 | | | | - | | | | 4.2 | | | | - | |
Collateralized mortgage obligations | | | 8.7 | | | | 10.8 | | | | - | | | | .1 | | | | - | | | | (8.2 | ) | | | 11.4 | | | | - | |
Total fixed maturities, available for sale | | | 1,876.1 | | | | 199. | l | | | (15.2 | ) | | | 327.5 | | | | 32.2 | | | | (21.8 | ) | | | 2,397.9 | | | | (3.9 | ) |
Equity securities | | | 32.4 | | | | (.3 | ) | | | - | | | | (1.2 | ) | | | - | | | | - | | | | 30.9 | | | | - | |
| Trading securities: | | | | | | | | | | | | | | | | | | | | | | | | | | | | | | | | |
Corporate securities | | | 2.7 | | | | - | | | | 1.0 | | | | - | | | | - | | | | - | | | | 3.7 | | | | 1.0 | |
| Securities lending collateral: | | | | | | | | | | | | | | | | | | | | | | | | | | | | | | | | |
Corporate securities | | | 34.9 | | | | (17.0 | ) | | | - | | | | .3 | | | | - | | | | (4.5 | ) | | | 13.7 | | | | - | |
Equity securities | | | .1 | | | | (.1 | ) | | | (.3 | ) | | | .3 | | | | - | | | | - | | | | - | | | | (.3 | ) |
Asset-backed securities | | | 13.1 | | | | - | | | | (.6 | ) | | | (10.0 | ) | | | 20.4 | | | | - | | | | 22.9 | | | | (.6 | ) |
Total securities lending collateral | | | 48.1 | | | | (17.1 | ) | | | (.9 | ) | | | (9.4 | ) | | | 20.4 | | | | (4.5 | ) | | | 36.6 | | | | (.9 | ) |
Other invested assets | | | 2.3 | | | | - | | | | (3.4 | ) | | | 3.5 | | | | - | | | | - | | | | 2.4 | | | | (3.4 | ) |
| Liabilities: | | | | | | | | | | | | | | | | | | | | | | | | | | | | | | | | |
| Liabilities for insurance products: | | | | | | | | | | | | | | | | | | | | | | | | | | | | | | | | |
Interest-sensitive products | | | (437.2 | ) | | | (63.8 | ) | | | 5.0 | | | | - | | | | - | | | | - | | | | (496.0 | ) | | | 7.3 | |
_________
| (a) | Transfers in/out of Level 3 are reported as having occurred at the beginning of the period. |
At December 31, 2010, 86 percent of our Level 3 fixed maturities, available for sale, were investment grade and 81 percent of our Level 3 fixed maturities, available for sale, consisted of corporate securities.
Realized and unrealized investment gains and losses presented in the preceding tables represent gains and losses during the time the applicable financial instruments were classified as Level 3.
CNO FINANCIAL GROUP, INC. AND SUBSIDIARIES
Notes to Consolidated Financial Statements
___________________
Realized and unrealized gains (losses) on Level 3 assets are primarily reported in either net investment income for policyholder and reinsurer accounts and other special-purpose portfolios, net realized investment gains (losses) or insurance policy benefits within the consolidated statement of operations or accumulated comprehensive income (loss) within shareholders’ equity based on the appropriate accounting treatment for the instrument.
Purchases, sales, issuances and settlements, net, represent the activity that occurred during the period that results in a change of the asset or liability but does not represent changes in fair value for the instruments held at the beginning of the period. Such activity primarily consists of purchases and sales of fixed maturity, equity and trading securities, purchases and settlements of derivative instruments, and changes to embedded derivative instruments related to insurance products resulting from the issuance of new contracts, or changes to existing contracts.
We review the fair value hierarchy classifications each reporting period. Transfers in and/or (out) of Level 3 in 2010 and 2009 were primarily due to changes in the observability of the valuation attributes resulting in a reclassification of certain financial assets or liabilities. Such reclassifications are reported as transfers in and out of Level 3 at the beginning fair value for the reporting period in which the changes occur. There were no significant transfers between Level 1 and Level 2 in 2010.
The amount presented for gains (losses) included in our net loss for assets and liabilities still held as of the reporting date primarily represents impairments for fixed maturities, available for sale, changes in fair value of trading securities and certain derivatives and changes in fair value of embedded derivative instruments included in liabilities for insurance products that exist as of the reporting date.
We use the following methods and assumptions to determine the estimated fair values of other financial instruments:
Cash and cash equivalents. The carrying amount for these instruments approximates their estimated fair value.
Mortgage loans and policy loans. We discount future expected cash flows for loans included in our investment portfolio based on interest rates currently being offered for similar loans to borrowers with similar credit ratings. We aggregate loans with similar characteristics in our calculations. The fair value of policy loans approximates their carrying value.
Other invested assets. We use quoted market prices, where available. When quotes are not available, we estimate the fair value based on discounted future expected cash flows or independent transactions which establish a value for our investment. Investments in limited partnerships are accounted for under the equity method which approximates estimated fair value.
Insurance liabilities for interest-sensitive products. We discount future expected cash flows based on interest rates currently being offered for similar contracts with similar maturities.
Investment borrowings, notes payable and borrowings related to variable interest entities. For publicly traded debt, we use current fair values. For other notes, we use discounted cash flow analyses based on our current incremental borrowing rates for similar types of borrowing arrangements.
CNO FINANCIAL GROUP, INC. AND SUBSIDIARIES
Notes to Consolidated Financial Statements
___________________
The estimated fair values of our financial instruments at December 31, 2010 and 2009, were as follows (dollars in millions):
| | | 2010 | | | 2009 | |
| | | Carrying | | | Fair | | | Carrying | | | Fair | |
| | | Amount | | | Value | | | Amount | | | Value | |
| | | | | | | | | | | | | |
| Financial assets: | | | | | | | | | | | | |
| Fixed maturities, available for sale | | $ | 20,633.9 | | | $ | 20,633.9 | | | $ | 18,528.4 | | | $ | 18,528.4 | |
| Equity securities | | | 68.1 | | | | 68.1 | | | | 31.0 | | | | 31.0 | |
| Mortgage loans | | | 1,761.2 | | | | 1,762.6 | | | | 1,965.5 | | | | 1,756.8 | |
| Policy loans | | | 284.4 | | | | 284.4 | | | | 295.2 | | | | 295.2 | |
| Trading securities | | | 372.6 | | | | 372.6 | | | | 293.3 | | | | 293.3 | |
| Investments held by securitization entities | | | 420.9 | | | | 420.9 | | | | - | | | | - | |
| Securities lending collateral | | | - | | | | - | | | | 180.0 | | | | 180.0 | |
| Other invested assets | | | 240.9 | | | | 240.9 | | | | 236.8 | | | | 236.8 | |
| Cash and cash equivalents | | | 598.7 | | | | 598.7 | | | | 526.8 | | | | 526.8 | |
| | | | | | | | | | | | | | | | | |
| Financial liabilities: | | | | | | | | | | | | | | | | |
| Insurance liabilities for interest-sensitive products (a) | | $ | 13,194.7 | | | $ | 13,194.7 | | | $ | 13,219.2 | | | $ | 13,219.2 | |
| Investment borrowings | | | 1,204.1 | | | | 1,265.3 | | | | 683.9 | | | | 677.6 | |
| Borrowings related to securitization entities | | | 386.9 | | | | 345.1 | | | | - | | | | - | |
| Notes payable – direct corporate obligations | | | 998.5 | | | | 1,166.4 | | | | 1,037.4 | | | | 1,041.7 | |
____________________
| (a) | The estimated fair value of insurance liabilities for interest-sensitive products was approximately equal to its carrying value at December 31, 2010 and 2009. This was because interest rates credited on the vast majority of account balances approximate current rates paid on similar products and because these rates are not generally guaranteed beyond one year. |
Sales Inducements
Certain of our annuity products offer sales inducements to contract holders in the form of enhanced crediting rates or bonus payments in the initial period of the contract. Certain of our life insurance products offer persistency bonuses credited to the contract holders balance after the policy has been outstanding for a specified period of time. These enhanced rates and persistency bonuses are considered sales inducements in accordance with GAAP. Such amounts are deferred and amortized in the same manner as deferred acquisition costs. Sales inducements deferred totaled $20.0 million, $28.4 million and $47.1 million in 2010, 2009 and 2008, respectively. Amounts amortized totaled $31.2 million, $30.2 million and $16.7 million in 2010, 2009 and 2008, respectively. The unamor tized balance of deferred sales inducements was $166.4 million and $177.6 million at December 31, 2010 and 2009, respectively. The balance of insurance liabilities for persistency bonus benefits was $85.3 million and $136.2 million at December 31, 2010 and 2009, respectively.
Out-of-Period Adjustments
We recorded the net effects of certain out-of-period adjustments which decreased our net income by $5.5 million (or two cents per diluted share) in 2010. We evaluated these errors taking into account both qualitative and quantitative factors and considered the impact of these errors in relation to 2010, as well as the materiality to the periods in which they originated. Management believes these errors are immaterial to the consolidated annual financial statements.
CNO FINANCIAL GROUP, INC. AND SUBSIDIARIES
Notes to Consolidated Financial Statements
___________________
Recently Issued Accounting Standards
Pending Accounting Standards
In October 2010, the FASB issued authoritative guidance that modifies the definition of the types of costs incurred by insurance entities that can be capitalized in the acquisition of new and renewal contracts. The guidance specifies that an insurance entity shall only capitalize incremental direct costs related to the successful acquisition of new or renewal insurance contracts. The guidance also states that advertising costs should be included in deferred acquisition costs only if the capitalization criteria in the direct-response advertising guidance are met. The guidance is effective for fiscal years, and interim periods within those fiscal years, beginning after December 15, 2011. The guidance should be applied prospectively upon adoption. Retrospective application to all prior periods presented upon the date of adoption also is permitted, but not required. We are in the process of evaluating the impact the guidance will have on our consolidated financial statements and we believe that the guidance will reduce the amount of costs that we can capitalize.
In January 2010, the FASB issued authoritative guidance which requires additional disclosures related to purchases, sales, issuances and settlements in the rollforward of Level 3 fair value measurements. This guidance is effective for reporting periods beginning after December 15, 2010. We do not expect the adoption of this guidance to have a material impact on our consolidated financial statements.
Adopted Accounting Standards
In March 2010, the FASB issued authoritative guidance clarifying the scope exception for embedded credit derivatives and when those features would be bifurcated from the host contract. Under the new guidance, only embedded credit derivative features that are in the form of subordination of one financial instrument to another would not be subject to the bifurcation requirements. Accordingly, entities will be required to bifurcate any embedded credit derivative features that no longer qualify under the amended scope exception, or, for certain investments, an entity can elect the fair value option and record the entire investment at fair value. This guidance is effective for fiscal quarters beginning after June 15, 2010. The adoption of this guidance did not have a material impact on our consolid ated financial statements.
In January 2010, the FASB issued authoritative guidance which requires new disclosures and clarifies existing disclosure requirements related to fair value. An entity is also required to disclose significant transfers in and out of Levels 1 and 2 of the fair value hierarchy. In addition, the guidance amends the fair value disclosure requirement for pension and postretirement benefit plan assets to require this disclosure at the investment class level. The guidance is effective for interim and annual reporting periods beginning after December 15, 2009. Such disclosures are included in the note to the consolidated financial statements entitled “Fair Value Measurements”. The adoption of this guidance did not have a material impact on our consolidated financial statements.
In June 2009, the FASB issued authoritative guidance that is intended to improve the relevance, representational faithfulness, and comparability of the information that a reporting entity provides in its financial statements about a transfer of financial assets; the effects of a transfer on its financial position, financial performance, and cash flows; and a transferor’s continuing involvement, if any, in transferred financial assets. The guidance must be applied as of the beginning of each reporting entity’s first annual reporting period that begins after November 15, 2009, for interim periods within that first annual reporting period and for interim and annual reporting periods thereafter. The guidance must be applied to transfers occurring on or after the effective date. The adoption of thi s guidance did not have a material impact on our consolidated financial statements.
CNO FINANCIAL GROUP, INC. AND SUBSIDIARIES
Notes to Consolidated Financial Statements
___________________
In June 2009, the FASB issued authoritative guidance that requires an entity to perform a qualitative analysis to determine whether a primary beneficiary interest is held in a VIE. Under the new qualitative model, the primary beneficiary must have both the power to direct the activities of the VIE and the obligation to absorb either losses or gains that could be significant to the VIE. The guidance also requires ongoing reassessments to determine whether a primary beneficiary interest is held and additional disclosures, including the financial statement effects of the entity’s involvement with VIEs. The guidance is effective as of the beginning of each reporting entity’s first annual reporting period that begins after November 15, 2009, for interim periods within that first annual reporting pe riod, and for interim and annual reporting periods thereafter. The impact of adoption of this guidance is as follows (dollars in millions):
| | | January 1, 2010 | |
| | | Amounts prior to effect of adoption of authoritative | | | Effect of adoption of authoritative | | | As | |
| | | guidance | | | guidance | | | adjusted | |
| | | | | | | | | | |
Total investments | | $ | 21,530.2 | | | $ | 247.6 | | | $ | 21,777.8 | |
| | | | | | | | | | | | | |
| Cash and cash equivalents held by variable interest entities | | | 3.4 | | | | 3.8 | | | | 7.2 | |
Accrued investment income | | | 309.0 | | | | .9 | | | | 309.9 | |
Income tax assets, net | | | 1,124.0 | | | | 8.6 | | | | 1,132.6 | |
Other assets | | | 310.7 | | | | 14.2 | | | | 324.9 | |
Total assets | | | 30,343.8 | | | | 275.1 | | | | 30,618.9 | |
| | | | | | | | | | | | | |
Other liabilities | | | 610.4 | | | | 8.8 | | | | 619.2 | |
Borrowings related to variable interest entities | | | 229.1 | | | | 282.2 | | | | 511.3 | |
Total liabilities | | | 26,811.4 | | | | 291.0 | | | | 27,102.4 | |
| | | | | | | | | | | | | |
Accumulated other comprehensive income (loss) | | | (264.3 | ) | | | (6.2 | ) | | | (270.5 | ) |
Accumulated deficit | | | (614.6 | ) | | | (9.7 | ) | | | (624.3 | ) |
Total shareholders’ equity | | | 3,532.4 | | | | (15.9 | ) | | | 3,516.5 | |
| | | | | | | | | | | | | |
Total liabilities and shareholders’ equity | | | 30,343.8 | | | | 275.1 | | | | 30,618.9 | |
On April 9, 2009, the FASB issued authoritative guidance regarding the recognition and presentation of an other-than-temporary impairment and requires additional disclosures. The recognition provision within this guidance applies only to fixed maturity investments that are subject to the other-than-temporary impairments. If an entity intends to sell or if it is more likely than not that it will be required to sell an impaired security prior to recovery of its cost basis, the security is other-
than-temporarily impaired and the full amount of the impairment is recognized as a loss through earnings. Otherwise, losses on securities which are other-than-temporarily impaired are separated into: (i) the portion of loss which represents the credit loss; and (ii) the portion which is due to other factors. The credit loss portion is recognized as a loss through earnings while the loss due to other factors is recognized in accumulated other comprehensive income (loss), net of taxes and related amortization. The guidance requires a cumulative effect adjustment to accumulated deficit and a corresponding adjustment to accumulated other comprehensive income (loss) to reclassify the non-credit portion of previously other-than-temporarily impaired securities which were held at the beginning of the pe riod of adoption and for which we do not intend to sell and it is more likely than not that we will not be required to sell such securities before recovery of the amortized cost basis. We adopted the guidance effective January 1, 2009. The cumulative effect of adopting this guidance was a $4.9 million net decrease to accumulated deficit and a corresponding increase to accumulated other comprehensive income (loss).
On April 9, 2009, the FASB issued authoritative guidance which provided additional guidance on estimating fair value when the volume and level of activity for an asset or liability have significantly decreased in relation to normal market activity for the asset or liability and clarifies that the use of multiple valuation techniques may be appropriate. The guidance also discusses circumstances that may indicate a transaction is not orderly. The guidance re-emphasizes that fair value continues to be the exit price in an orderly market. Further, this guidance requires additional disclosures about fair value measurement in annual and interim reporting periods. The guidance is effective for interim and annual reporting periods ending after June 15, 2009 with early adoption permitted. We adopted the guidance effective for the period ending March 31,
CNO FINANCIAL GROUP, INC. AND SUBSIDIARIES
Notes to Consolidated Financial Statements
___________________
2009, and this guidance did not have a material effect on our consolidated financial statements.
On April 9, 2009, the FASB issued authoritative guidance which requires that the fair value of financial instruments be disclosed in an entity’s financial statements in both interim and annual periods. The guidance also requires disclosure of methods and assumptions used to estimate fair values. The guidance is effective for interim reporting periods ending after June 15, 2009, with early adoption permitted for periods ending after March 15, 2009. We adopted the guidance for the quarter ended June 30, 2009, which did not have a material effect on our consolidated balance sheet or statement of operations.
In May 2008, the FASB issued authoritative guidance that specifies that issuers of convertible debt instruments that may be settled in cash upon conversion (including partial cash settlement) should separately account for the liability and equity components in a manner that will reflect the entity’s nonconvertible debt borrowing rate when interest cost is recognized in subsequent periods. The guidance is effective for financial statements issued for fiscal years beginning after December 15, 2008, and interim periods within those fiscal years. The guidance was applied retrospectively to all periods presented unless instruments were not outstanding during any period included in the financial statements. In October 2009, the Company reissued its financial statements as December 31, 2008 and 2007, and f or the three years ended December 31, 2008, to reflect the adoption of this authoritative guidance on a retrospective basis. The adoption of the guidance affected the accounting for our 3.5% Convertible Debentures due September 30, 2035 (the “3.5% Debentures”). Upon adoption of the guidance, the effective interest rate on our 3.5% Debentures increased to 7.4 percent, which resulted in the recognition of a $45 million discount to these notes with the offsetting after tax amount recorded to paid-in capital. Such discount is amortized as interest expense over the remaining life of the 3.5% Debentures.
Amounts related to the 3.5% Debentures are reflected in our consolidated balance sheet at December 31, 2009, as follows (dollars in millions):
| | | December 31, | |
| | | 2009 | |
| | | | |
| Increase to additional paid-in capital | | $ | 28.0 | |
| | | | | |
| Par value of 3.5% Debentures | | $ | 116.5 | |
| Unamortized discount | | | (3.3 | ) |
| | | | | |
| Carrying value of 3.5% Debentures | | $ | 113.2 | |
Interest expense related to the 3.5% Debentures includes the following at December 31, 2009 and 2008 (dollars in millions):
| | | 2009 | | | 2008 | |
| | | | | | | |
| Contractual interest expense | | $ | 9.4 | | | $ | 11.3 | |
| Amortization of discount | | | 9.4 | | | | 9.5 | |
| Amortization of debt issue costs | | | 1.1 | | | | 1.3 | |
| | | | | | | | | |
| Total interest expense | | $ | 19.9 | | | $ | 22.1 | |
In January 2009, the FASB issued authoritative guidance which amended certain impairment guidance by removing the exclusive reliance upon market participant assumptions about future cash flows when evaluating the impairment of certain securities. The guidance permits the use of reasonable management judgment of the probability that the holder will be unable to collect all amounts due. The guidance is effective prospectively for interim and annual reporting periods ending after December 15, 2008. The Company adopted the guidance on December 31, 2008 and the adoption did not have a material effect on our consolidated financial statements.
In March 2008, the FASB issued authoritative guidance regarding whether unvested share based payment awards that contain non-forfeitable rights to dividends or dividend equivalents (whether paid or unpaid) are to be treated as participating securities prior to vesting and, therefore, must be included in the earnings allocation in calculating earnings per share under the two-class method. The guidance is effective for financial statements issued for fiscal years beginning after December 15,
CNO FINANCIAL GROUP, INC. AND SUBSIDIARIES
Notes to Consolidated Financial Statements
___________________
2008, and interim periods within those years and requires retrospective application. Our adoption of the guidance did not have a material effect on our earnings per share calculations due to the immateriality of unvested restricted shares that are considered to be participating securities.
In March 2008, the FASB issued authoritative guidance which required enhanced disclosures about an entity’s derivative and hedging activities. The guidance is effective for financial statements issued for fiscal years and interim periods beginning after November 15, 2008. The adoption of the guidance did not have a material effect on our consolidated financial statements.
In December 2007, the FASB issued authoritative guidance which establishes new standards governing the accounting for and reporting of noncontrolling interests (previously referred to as minority interests). The guidance establishes reporting requirements which include, among other things, that noncontrolling interests be reflected as a separate component of equity, not as a liability. It also requires that the interests of the parent and the noncontrolling interest be clearly identifiable. Additionally, increases and decreases in a parent’s ownership interest that leave control intact shall be reflected as equity transactions, rather than step acquisitions or dilution gains or losses. The guidance is effective for fiscal years beginning on or after December 15, 2008. The initi al adoption of this guidance had no effect on our consolidated financial statements.
In December 2007, the FASB issued authoritative guidance which requires the acquiring entity in a business combination to recognize all assets acquired and liabilities assumed in a transaction at the acquisition date fair value, with certain exceptions. Additionally, the guidance requires changes to the accounting treatment of acquisition related items, including, among other items, transaction costs, contingent consideration, restructuring costs, indemnification assets and tax benefits. The guidance also provides for a substantial number of new disclosure requirements. The guidance is effective for business combinations initiated on or after the first annual reporting period beginning after December 15, 2008. We expect that the guidance will have an effect on our accounting for business combin ations, if any, that are made in the future. In addition, the guidance changes the previous requirement that reductions in a valuation allowance for deferred tax assets established in conjunction with the implementation of fresh-start accounting be recognized as a direct increase to additional paid-in capital. Instead, the revised standard requires that any such reduction be reported as a decrease to income tax expense through the consolidated statement of operations. Accordingly, any reductions to our valuation allowance for deferred tax assets will be reported as a decrease to income tax expense, after the effective date of the guidance.
In December 2008, the FASB issued authoritative guidance which required public entities to provide additional disclosures about transferors’ continuing involvements with transferred financial assets and to provide additional disclosures about their involvement with VIEs. The guidance was effective for financial statements issued for fiscal years and interim periods ending after December 15, 2008. We adopted the guidance on December 31, 2008 and it did not have a material effect on our consolidated financial statements.
In February 2007, the FASB issued authoritative guidance which allows entities to choose to measure many financial instruments and certain other items, including insurance contracts, at fair value (on an instrument-by-instrument basis) that are not currently required to be measured at fair value. The objective is to improve financial reporting by providing entities with the opportunity to mitigate volatility in reported earnings caused by measuring related assets and liabilities differently without having to apply complex hedge accounting provisions. We adopted the guidance on January 1, 2008. We did not elect the fair value option for any of our financial assets or liabilities.
In April 2007, FASB issued authoritative guidance which allows fair value amounts recognized for collateral to be offset against fair value amounts recognized for derivative instruments that are executed with the same counterparty under certain circumstances. The guidance also requires an entity to disclose the accounting policy decision to offset, or not to offset, fair value amounts. We do not, and have not previously, offset the fair value amounts recognized for derivatives with the amounts recognized as collateral. All collateral is maintained in a tri-party custodial account. At December 31, 2008, $11.4 million of derivative liabilities had been offset against derivative assets executed with the same counterparty under master netting arrangements. There were no such derivative l iabilities offset against derivative assets at December 31, 2010 or 2009. We adopted the guidance on January 1, 2008, and it did not have a material effect on our consolidated financial statements.
CNO FINANCIAL GROUP, INC. AND SUBSIDIARIES
Notes to Consolidated Financial Statements
___________________
At December 31, 2010, the amortized cost and estimated fair value of fixed maturities, available for sale, and equity securities were as follows (dollars in millions):
| | | | | | Gross | | | Gross | | | Estimated | |
| | | Amortized | | | unrealized | | | unrealized | | | fair | |
| | | cost | | | gains | | | losses | | | value | |
| Investment grade (a): | | | | | | | | | | | | |
| Corporate securities | | $ | 12,605.5 | | | $ | 645.2 | | | $ | (128.6 | ) | | $ | 13,122.1 | |
| United States Treasury securities and obligations of United States government corporations and agencies | | | 300.3 | | | | 5.7 | | | | (11.8 | ) | | | 294.2 | |
| States and political subdivisions | | | 1,871.0 | | | | 8.5 | | | | (99.2 | ) | | | 1,780.3 | |
| Debt securities issued by foreign governments | | | .8 | | | | .1 | | | | - | | | | .9 | |
| Asset-backed securities | | | 595.3 | | | | 9.9 | | | | (5.1 | ) | | | 600.1 | |
| Collateralized debt obligations | | | 238.7 | | | | 3.4 | | | | (1.1 | ) | | | 241.0 | |
| Commercial mortgage-backed securities | | | 1,292.8 | | | | 76.4 | | | | (9.0 | ) | | | 1,360.2 | |
| Mortgage pass-through securities | | | 29.5 | | | | 1.8 | | | | - | | | | 31.3 | |
| Collateralized mortgage obligations | | | 1,416.7 | | | | 25.7 | | | | (30.1 | ) | | | 1,412.3 | |
| | | | | | | | | | | | | | | | | |
| Total investment grade fixed maturities, available for sale | | | 18,350.6 | | | | 776.7 | | | | (284.9 | ) | | | 18,842.4 | |
| | | | | | | | | | | | | | | | | |
| Below-investment grade (a): | | | | | | | | | | | | | | | | |
| Corporate securities | | | 1,241.1 | | | | 24.4 | | | | (40.4 | ) | | | 1,225.1 | |
| States and political subdivisions | | | 4.7 | | | | - | | | | (1.5 | ) | | | 3.2 | |
| Asset-backed securities | | | 43.7 | | | | 1.5 | | | | (1.2 | ) | | | 44.0 | |
| Collateralized debt obligations | | | 14.3 | | | | 1.2 | | | | - | | | | 15.5 | |
| Commercial mortgage-backed securities | | | 7.0 | | | | - | | | | (3.5 | ) | | | 3.5 | |
| Collateralized mortgage obligations | | | 494.4 | | | | 11.2 | | | | (5.4 | ) | | | 500.2 | |
| | | | | | | | | | | | | | | | | |
| Total below-investment grade fixed maturities, available for sale | | | 1,805.2 | | | | 38.3 | | | | (52.0 | ) | | | 1,791.5 | |
| | | | | | | | | | | | | | | | | |
| Total fixed maturities, available for sale | | $ | 20,155.8 | | | $ | 815.0 | | | $ | (336.9 | ) | | $ | 20,633.9 | |
| | | | | | | | | | | | | | | | | |
| Equity securities | | $ | 68.2 | | | $ | .8 | | | $ | (.9 | ) | | $ | 68.1 | |
______________
| | (a) | Investment ratings – Investment ratings are assigned the second lowest rating by a nationally recognized statistical rating organization (Moody’s Investor Services, Inc. (“Moody’s”), S&P or Fitch Ratings (“Fitch”)), or if not rated by such firms, the rating assigned by the NAIC. NAIC designations of “1” or “2” include fixed maturities generally rated investment grade (rated “Baa3” or higher by Moody’s or rated “BBB-” or higher by S&P and Fitch). NAIC designations of “3” through “6” are referred to as below-investment grade (which generally are rated “Ba1” or lower by Moody’s or rated “BB+” or lower by S&P and Fitch). References to investment grade or below investment grade throughout our consolidated financial statements ar e determined as described above. |
CNO FINANCIAL GROUP, INC. AND SUBSIDIARIES
Notes to Consolidated Financial Statements
___________________
At December 31, 2009, the amortized cost and estimated fair value of fixed maturities, available for sale, and equity securities were as follows (dollars in millions):
| | | | | | Gross | | | Gross | | | Estimated | |
| | | Amortized | | | unrealized | | | unrealized | | | fair | |
| | | cost | | | gains | | | losses | | | value | |
| Investment grade: | | | | | | | | | | | | |
| Corporate securities | | $ | 13,069.8 | | | $ | 371.9 | | | $ | (315.4 | ) | | $ | 13,126.3 | |
| United States Treasury securities and obligations of United States government corporations and agencies | | | 268.5 | | | | 4.6 | | | | (3.5 | ) | | | 269.6 | |
| States and political subdivisions | | | 924.2 | | | | 3.0 | | | | (78.4 | ) | | | 848.8 | |
| Debt securities issued by foreign governments | | | 4.8 | | | | .3 | | | | - | | | | 5.1 | |
| Asset-backed securities | | | 154.1 | | | | 1.7 | | | | (17.9 | ) | | | 137.9 | |
| Collateralized debt obligations | | | 84.1 | | | | 1.2 | | | | (.6 | ) | | | 84.7 | |
| Commercial mortgage-backed securities | | | 867.7 | | | | 6.2 | | | | (108.2 | ) | | | 765.7 | |
| Mortgage pass-through securities | | | 41.1 | | | | 1.6 | | | | (.1 | ) | | | 42.6 | |
| Collateralized mortgage obligations | | | 1,801.4 | | | | 4.2 | | | | (81.0 | ) | | | 1,724.6 | |
| | | | | | | | | | | | | | | | | |
| Total investment grade fixed maturities, available for sale | | | 17,215.7 | | | | 394.7 | | | | (605.1 | ) | | | 17,005.3 | |
| | | | | | | | | | | | | | | | | |
| Below-investment grade: | | | | | | | | | | | | | | | | |
| Corporate securities | | | 1,275.4 | | | | 5.8 | | | | (116.1 | ) | | | 1,165.1 | |
| States and political subdivisions | | | 6.9 | | | | - | | | | (2.1 | ) | | | 4.8 | |
| Asset-backed securities | | | 90.9 | | | | - | | | | (36.7 | ) | | | 54.2 | |
| Collateralized debt obligations | | | 12.8 | | | | - | | | | (4.7 | ) | | | 8.1 | |
| Commercial mortgage-backed securities | | | 1.6 | | | | - | | | | (1.3 | ) | | | .3 | |
| Collateralized mortgage obligations | | | 394.7 | | | | - | | | | (104.1 | ) | | | 290.6 | |
| | | | | | | | | | | | | | | | | |
| Total below-investment grade fixed maturities, available for sale | | | 1,782.3 | | | | 5.8 | | | | (265.0 | ) | | | 1,523.1 | |
| | | | | | | | | | | | | | | | | |
| Total fixed maturities, available for sale | | $ | 18,998.0 | | | $ | 400.5 | | | $ | (870.1 | ) | | $ | 18,528.4 | |
| | | | | | | | | | | | | | | | | |
| Equity securities | | $ | 30.7 | | | $ | .8 | | | $ | (.5 | ) | | $ | 31.0 | |
CNO FINANCIAL GROUP, INC. AND SUBSIDIARIES
Notes to Consolidated Financial Statements
___________________
At December 31, 2010, the amortized cost, gross unrealized gains and losses, other-than-temporary impairments in accumulated other comprehensive income (loss) and estimated fair value of fixed maturities, available for sale, were as follows (dollars in millions):
| | | | | | | | | | | | | | | Other-than- |
| | | | | | | | | | | | | | | temporary |
| | | | | | | | | | | | | | | impairments |
| | | | | | | | | | | | | | | included in |
| | | | | | Gross | | | Gross | | | | | | accumulated other |
| | | Amortized | | | unrealized | | | unrealized | | | Estimated | | | comprehensive |
| | | cost | | | gains | | | losses | | | fair value | | | income (loss) |
| | | | | | | | | | | | | | | |
Corporate securities | | $ | 13,846.6 | | | $ | 669.6 | | | $ | (169.0 | ) | | $ | 14,347.2 | | | $ | - | |
| United States Treasury securities and obligations of United States government corporations and agencies | | | 300.3 | | | | 5.7 | | | | (11.8 | ) | | | 294.2 | | | | - | |
States and political subdivisions | | | 1,875.7 | | | | 8.5 | | | | (100.7 | ) | | | 1,783.5 | | | | - | |
Debt securities issued by foreign governments | | | .8 | | | | .1 | | | | - | | | | .9 | | | | - | |
Asset-backed securities | | | 639.0 | | | | 11.4 | | | | (6.3 | ) | | | 644.1 | | | | - | |
Collateralized debt obligations | | | 253.0 | | | | 4.6 | | | | (1.1 | ) | | | 256.5 | | | | - | |
Commercial mortgage-backed securities | | | 1,299.8 | | | | 76.4 | | | | (12.5 | ) | | | 1,363.7 | | | | (.1 | ) |
Mortgage pass-through securities | | | 29.5 | | | | 1.8 | | | | - | | | | 31.3 | | | | - | |
Collateralized mortgage obligations | | | 1,911.1 | | | | 36.9 | | | | (35.5 | ) | | | 1,912.5 | | | | (23.3 | ) |
| | | | | | | | | | | | | | | | | | | | | |
| Total fixed maturities, available for sale | | $ | 20,155.8 | | | $ | 815.0 | | | $ | (336.9 | ) | | $ | 20,633.9 | | | $ | (23.4 | ) |
At December 31, 2009, the amortized cost, gross unrealized gains and losses, other-than-temporary impairments in other comprehensive loss and estimated fair value of fixed maturities, available for sale, were as follows (dollars in millions):
| | | | | | | | | | | | | | | Other-than- |
| | | | | | | | | | | | | | | temporary |
| | | | | | | | | | | | | | | impairments |
| | | | | | Gross | | | Gross | | | | | | included in other |
| | | Amortized | | | unrealized | | | unrealized | | | Estimated | | | comprehensive |
| | | cost | | | gains | | | losses | | | fair value | | | loss |
| | | | | | | | | | | | | | | |
Corporate securities | | $ | 14,345.2 | | | $ | 377.7 | | | $ | (431.5 | ) | | $ | 14,291.4 | | | $ | - | |
| United States Treasury securities and obligations of United States government corporations and agencies | | | 268.5 | | | | 4.6 | | | | (3.5 | ) | | | 269.6 | | | | - | |
States and political subdivisions | | | 931.1 | | | | 3.0 | | | | (80.5 | ) | | | 853.6 | | | | - | |
Debt securities issued by foreign governments | | | 4.8 | | | | .3 | | | | - | | | | 5.1 | | | | - | |
Asset-backed securities | | | 245.0 | | | | 1.7 | | | | (54.6 | ) | | | 192.1 | | | | (35.1 | ) |
Collateralized debt obligations | | | 96.9 | | | | 1.2 | | | | (5.3 | ) | | | 92.8 | | | | - | |
Commercial mortgage-backed securities | | | 869.3 | | | | 6.2 | | | | (109.5 | ) | | | 766.0 | | | | (1.4 | ) |
Mortgage pass-through securities | | | 41.1 | | | | 1.6 | | | | (.1 | ) | | | 42.6 | | | | - | |
Collateralized mortgage obligations | | | 2,196.1 | | | | 4.2 | | | | (185.1 | ) | | | 2,015.2 | | | | (132.4 | ) |
| | | | | | | | | | | | | | | | | | | | | |
Total fixed maturities, available for sale | | $ | 18,998.0 | | | $ | 400.5 | | | $ | (870.1 | ) | | $ | 18,528.4 | | | $ | (168.9 | ) |
CNO FINANCIAL GROUP, INC. AND SUBSIDIARIES
Notes to Consolidated Financial Statements
___________________
Accumulated other comprehensive income (loss) is primarily comprised of the net effect of unrealized appreciation (depreciation) on our investments. These amounts, included in shareholders’ equity as of December 31, 2010 and 2009 were as follows (dollars in millions):
| | | 2010 | | | 2009 | |
| | | | | | | |
Net unrealized appreciation (depreciation) on fixed maturity securities, available for sale, on which an other-than-temporary impairment loss has been recognized | | $ | (4.4 | ) | | $ | (133.5 | ) |
| Net unrealized gains (losses) on all other investments | | | 476.5 | | | | (339.9 | ) |
| Adjustment to the present value of future profits (a) | | | (17.6 | ) | | | 10.7 | |
| Adjustment to deferred acquisition costs | | | (76.2 | ) | | | 59.8 | |
| Unrecognized net loss related to deferred compensation plan | | | (7.7 | ) | | | (8.2 | ) |
| Deferred income tax asset (liability) | | | (132.3 | ) | | | 146.8 | |
| | | | | | | | | |
| Accumulated other comprehensive income (loss) | | $ | 238.3 | | | $ | (264.3 | ) |
_________
| (a) | The present value of future profits is the value assigned to the right to receive future cash flows from contracts existing at September 10, 2003 (the date our Predecessor emerged from bankruptcy). |
CNO FINANCIAL GROUP, INC. AND SUBSIDIARIES
Notes to Consolidated Financial Statements
___________________
Concentration of Fixed Maturity Securities, Available for Sale
The following table summarizes the carrying values and gross unrealized losses of our fixed maturity securities, available for sale, by category as of December 31, 2010 (dollars in millions):
| | | | | | | | | | | | Percent of | |
| | | | | | | | | Gross | | | gross | |
| | | | | | Percent of | | | unrealized | | | unrealized | |
| | | Carrying value | | | fixed maturities | | | losses | | | losses | |
| | | | | | | | | | | | | |
| Energy/pipelines | | $ | 2,001.1 | | | | 9.7 | % | | $ | 14.3 | | | | 4.2 | % |
| Collateralized mortgage obligations | | | 1,912.5 | | | | 9.3 | | | | 35.5 | | | | 10.5 | |
| Utilities | | | 1,826.6 | | | | 8.9 | | | | 5.7 | | | | 1.7 | |
| States and political subdivisions | | | 1,783.5 | | | | 8.6 | | | | 100.7 | | | | 29.9 | |
| Commercial mortgage-backed securities | | | 1,363.7 | | | | 6.6 | | | | 12.5 | | | | 3.7 | |
| Insurance �� | | | 1,227.1 | | | | 5.9 | | | | 19.7 | | | | 5.8 | |
| Food/beverage | | | 1,085.2 | | | | 5.3 | | | | 9.8 | | | | 2.9 | |
| Healthcare/pharmaceuticals | | | 907.4 | | | | 4.4 | | | | 5.7 | | | | 1.7 | |
| Banks | | | 869.1 | | | | 4.2 | | | | 44.1 | | | | 13.1 | |
| Cable/media | | | 794.0 | | | | 3.9 | | | | 11.5 | | | | 3.4 | |
| Real estate/REITs | | | 760.0 | | | | 3.7 | | | | 6.1 | | | | 1.8 | |
| Asset-backed securities | | | 644.1 | | | | 3.1 | | | | 6.3 | | | | 1.9 | |
| Transportation | | | 544.6 | | | | 2.6 | | | | 3.2 | | | | 1.0 | |
| Capital goods | | | 495.6 | | | | 2.4 | | | | 4.0 | | | | 1.2 | |
| Building materials | | | 439.8 | | | | 2.1 | | | | 12.4 | | | | 3.7 | |
| Telecom | | | 423.1 | | | | 2.1 | | | | 9.1 | | | | 2.7 | |
| Aerospace/defense | | | 349.2 | | | | 1.7 | | | | 1.2 | | | | .4 | |
| Metals and mining | | | 333.5 | | | | 1.6 | | | | 2.1 | | | | .6 | |
| Chemicals | | | 309.5 | | | | 1.5 | | | | 2.2 | | | | .6 | |
| U.S. Treasury and Obligations | | | 294.2 | | | | 1.4 | | | | 11.8 | | | | 3.5 | |
| Paper | | | 272.2 | | | | 1.3 | | | | 4.8 | | | | 1.4 | |
| Collateralized debt obligations | | | 256.5 | | | | 1.2 | | | | 1.1 | | | | .3 | |
| Brokerage | | | 238.1 | | | | 1.2 | | | | 3.0 | | | | .9 | |
| Consumer products | | | 229.4 | | | | 1.1 | | | | 5.0 | | | | 1.5 | |
| Entertainment/hotels | | | 218.5 | | | | 1.1 | | | | .9 | | | | .3 | |
| Other | | | 1,055.4 | | | | 5.1 | | | | 4.2 | | | | 1.3 | |
| | | | | | | | | | | | | | | | | |
| Total fixed maturities, available for sale | | $ | 20,633.9 | | | | 100.0 | % | | $ | 336.9 | | | | 100.0 | % |
Below-Investment Grade Securities
At December 31, 2010, the amortized cost of the Company’s below-investment grade fixed maturity securities was $1,805.2 million, or 9.0 percent of the Company’s fixed maturity portfolio. The estimated fair value of the below-investment grade portfolio was $1,791.5 million, or 99 percent of the amortized cost.
Below-investment grade corporate debt securities have different characteristics than investment grade corporate debt securities. Based on historical performance, probability of default by the borrower is significantly greater for below-investment grade corporate debt securities and in many cases severity of loss is relatively greater as such securities are generally unsecured and often subordinated to other indebtedness of the issuer. Also, issuers of below-investment grade corporate debt securities frequently have higher levels of debt relative to investment-grade issuers, hence, all other things being equal, are generally more sensitive to adverse economic conditions. The Company attempts to reduce the overall risk related to its investment in below-investment grade securities, as in all investments, t hrough careful credit analysis, strict investment policy guidelines, and diversification by issuer and/or guarantor and by industry.
CNO FINANCIAL GROUP, INC. AND SUBSIDIARIES
Notes to Consolidated Financial Statements
___________________
Contractual Maturity
The following table sets forth the amortized cost and estimated fair value of fixed maturities, available for sale, at December 31, 2010, by contractual maturity. Actual maturities will differ from contractual maturities because certain borrowers may have the right to call or prepay obligations with or without penalties. In addition, structured securities (such as asset-backed securities, collateralized debt obligations, commercial mortgage-backed securities, mortgage pass-through securities and collateralized mortgage obligations, collectively referred to as “structured securities”) frequently permit periodic unscheduled payments throughout their lives (dollars in millions):
| | | | | | Estimated | |
| | | Amortized | | | fair | |
| | | cost | | | value | |
| | | | | | | |
| Due in one year or less | | $ | 146.4 | | | $ | 146.0 | |
| Due after one year through five years | | | 1,146.0 | | | | 1,202.8 | |
| Due after five years through ten years | | | 3,981.4 | | | | 4,195.0 | |
| Due after ten years | | | 10,749.6 | | | | 10,882.0 | |
| | | | | | | | | |
| Subtotal | | | 16,023.4 | | | | 16,425.8 | |
| | | | | | | | | |
| Structured securities | | | 4,132.4 | | | | 4,208.1 | |
| | | | | | | | | |
| Total fixed maturities, available for sale | | $ | 20,155.8 | | | $ | 20,633.9 | |
Net Investment Income
Net investment income consisted of the following (dollars in millions):
| | | 2010 | | | 2009 | | | 2008 | |
| | | | | | | | | | |
| Fixed maturities | | $ | 1,162.6 | | | $ | 1,083.7 | | | $ | 1,094.4 | |
| Trading income related to policyholder and reinsurer accounts and other special-purpose portfolios | | | 43.7 | | | | 11.1 | | | | 28.6 | |
| Equity securities | | | .8 | | | | 1.5 | | | | 1.4 | |
| Mortgage loans | | | 121.7 | | | | 130.8 | | | | 126.1 | |
| Policy loans | | | 18.2 | | | | 21.2 | | | | 23.6 | |
| Options related to fixed index products: | | | | | | | | | | | | |
| Option income (loss) | | | 57.3 | | | | (63.0 | ) | | | (71.9 | ) |
| Change in value of options | | | (29.1 | ) | | | 113.7 | | | | (32.4 | ) |
| Other invested assets | | | 9.1 | | | | 10.0 | | | | 13.8 | |
| Cash and cash equivalents | | | .5 | | | | 1.1 | | | | 11.9 | |
| | | | | | | | | | | | | |
| Gross investment income �� | | | 1,384.8 | | | | 1,310.1 | | | | 1,195.5 | |
| Less investment expenses | | | 17.9 | | | | 17.4 | | | | 16.7 | |
| | | | | | | | | | | | | |
| Net investment income | | $ | 1,366.9 | | | $ | 1,292.7 | | | $ | 1,178.8 | |
The estimated fair value of fixed maturity investments and mortgage loans not accruing investment income totaled $7.9 million and $39.8 million at December 31, 2010 and 2009, respectively.
CNO FINANCIAL GROUP, INC. AND SUBSIDIARIES
Notes to Consolidated Financial Statements
___________________
Net Realized Investment Gains (Losses)
The following table sets forth the net realized investment gains (losses) for the periods indicated (dollars in millions):
| | | 2010 | | | 2009 | | | 2008 | |
| | | | | | | | | | |
| Fixed maturity securities, available for sale: | | | | | | | | | |
| Realized gains on sale | | $ | 347.1 | | | $ | 367.9 | | | $ | 110.3 | |
| Realized losses on sale | | | (147.7 | ) | | | (233.9 | ) | | | (177.3 | ) |
| Impairments: | | | | | | | | | | | | |
| Total other-than-temporary impairment losses | | | (94.8 | ) | | | (337.8 | ) | | | (152.7 | ) |
| Other-than-temporary impairment losses recognized in other comprehensive loss | | | (4.7 | ) | | | 188.3 | | | | - | |
| | | | | | | | | | | | | |
| Net impairment losses recognized | | | (99.5 | ) | | | (149.5 | ) | | | (152.7 | ) |
| | | | | | | | | | | | | |
| Net realized investment gains (losses) from fixed maturities | | | 99.9 | | | | (15.5 | ) | | | (219.7 | ) |
| | | | | | | | | | | | | |
| Equity securities | | | .1 | | | | - | | | | - | |
| Commercial mortgage loans | | | (16.9 | ) | | | (13.5 | ) | | | (19.7 | ) |
| Impairments of mortgage loans and other investments | | | (50.3 | ) | | | (45.9 | ) | | | (9.6 | ) |
| Other | | | (2.6 | ) | | | 14.4 | | | | (13.4 | ) |
| | | | | | | | | | | | | |
| Net realized investment gains (losses) | | $ | 30.2 | | | $ | (60.5 | ) | | $ | (262.4 | ) |
During 2010, we recognized net realized investment gains of $30.2 million, which were comprised of $180.0 million of net gains from the sales of investments (primarily fixed maturities) with proceeds of $8.6 billion and $149.8 million of writedowns of investments for other than temporary declines in fair value recognized through net income ($146.8 million, prior to the $(3.0) million of impairment losses recognized through accumulated other comprehensive income (loss)).
During 2009, we recognized net realized investment losses of $60.5 million, which were comprised of $134.9 million of net gains from the sales of investments (primarily fixed maturities) with proceeds of $10.7 billion and $195.4 million of writedowns of investments for other than temporary declines in fair value recognized through net income ($385.0 million, prior to the $189.6 million of impairment losses recognized through other comprehensive loss).
During 2008, we recognized net realized investment losses of $262.4 million, which were comprised of: (i) $100.1 million of net losses from the sales of investments (primarily fixed maturities); and (ii) $162.3 million of writedowns of investments for other than temporary declines in fair value (no single investment accounted for more than $10 million of such writedowns).
At December 31, 2010, fixed maturity securities in default or considered nonperforming had both an aggregate amortized cost and carrying value of $.6 million.
During 2010, we recorded an impairment charge of $70.6 million on an investment made by our Predecessor in a guaranteed investment contract issued by a Bermuda insurance company. We recently decided to pursue the early commutation of this investment in exchange for interests in certain underlying invested assets held by the insurance company. Current information related to these underlying invested assets obtained in late December 2010 and early 2011 resulted in the recognition of the impairment charge. The guaranteed investment contract matures in December 2029 and had a projected future yield of 1.33% (the guaranteed minimum rate) immediately prior to the impairment charge. The estimated fair value of our investment in the guaranteed investment contract was $213 million at December 31, 2010.& #160; Also during 2010, other-than-temporary impairments recorded in earnings included: (i) $23.6 million of losses related to mortgage-backed and asset-backed securities, primarily reflecting changes related to the estimated future cash flows of the underlying assets and, for certain securities, changes in our intent to hold the securities; (ii) $40.8 million of losses related to commercial mortgage loans reflecting our concerns regarding the issuers’ ability to continue to make contractual payments related to these loans and our estimate of the value of the underlying properties; (iii) $1.6 million related to a home office building which is available for sale; and (iv) $13.2 million of additional losses primarily related to various corporate securities and other invested assets following unforeseen issue-specific events or conditions.
CNO FINANCIAL GROUP, INC. AND SUBSIDIARIES
Notes to Consolidated Financial Statements
___________________
During 2010, the $147.7 million of realized losses on sales of $1.4 billion of fixed maturity securities, available for sale, included: (i) $125.4 million of losses related to the sales of mortgage-backed securities and asset-backed securities; and (ii) $22.3 million of additional losses primarily related to various corporate securities. Securities are generally sold at a loss following unforeseen issue-specific events or conditions or shifts in perceived risks. These reasons include but are not limited to: (i) changes in the investment environment; (ii) expectation that the fair value could deteriorate further; (iii) desire to reduce our exposure to an asset class, an issuer or an industry; (iv) changes in credit quality; or (v) changes in expected liability cash flows.
During 2009, the $195.4 million of other-than-temporary impairments we recorded in earnings included: (i) $83.6 million of losses related to mortgage-backed and asset-backed securities, primarily reflecting changes related to the performance of the underlying assets and, for certain securities, changes in our intent regarding continuing to hold the securities; (ii) $40.9 million of losses related to commercial mortgage loans reflecting our concerns regarding the issuers’ ability to continue to make contractual payments related to these loans and our estimate of the value of the underlying properties; (iii) $13.8 million of losses related to securities issued by a large commercial lender that recently filed bankruptcy; and (iv) $57.1 million of additional losses primarily related to various corporate securities following unforeseen issue-specific events or conditions and shifts in risks or uncertainty of the issuer.
During 2009, the $233.9 million of realized losses on sales of $1.3 billion of fixed maturity securities, available for sale, included: (i) $178.3 million of losses related to the sales of mortgage-backed securities and asset-backed securities; (ii) $11.3 million of losses related to the sale of securities issued by providers of financial guarantees and mortgage insurance; and (iii) $44.3 million of additional losses primarily related to various corporate securities.
Our fixed maturity investments are generally purchased in the context of a long-term strategy to fund insurance liabilities, so we do not generally seek to purchase and sell such securities to generate short-term realized gains. In certain circumstances, including those in which securities are selling at prices which exceed our view of their underlying economic value, or when it is possible to reinvest the proceeds to better meet our long-term asset-liability matching objectives, we may sell certain securities.
The following summarizes the investments (including investments held by the VIEs) sold at a loss during 2010 which had been continuously in an unrealized loss position exceeding 20 percent of the amortized cost basis prior to the sale for the period indicated (dollars in millions):
| | | At date of sale | |
| | | Number of | | | Amortized | | Fair | |
| Period | | issuers | | | cost | | value | |
| | | | | | | | | |
| Less than 6 months prior to sale | | | 10 | | | $ | 56.9 | | | $ | 44.0 | |
| Greater than or equal to 6 and less than 12 months prior to sale | | | 2 | | | | 1.2 | | | | .8 | |
| Greater than 12 months | | | 43 | | | | 259.8 | | | | 174.4 | |
| | | | | | | | | | | | | |
| | | | 55 | | | $ | 317.9 | | | $ | 219.2 | |
During the first quarter of 2009, we adopted newly issued authoritative guidance, which changes the recognition and presentation of other-than-temporary impairments. Refer to the note to the consolidated financial statements entitled “Summary of Significant Accounting Policies - Adopted Accounting Standards” for additional information. The recognition provisions within this guidance apply only to our fixed maturity investments.
We regularly evaluate our investments for possible impairment. Our assessment of whether unrealized losses are “other than temporary” requires significant judgment. Factors considered include: (i) the extent to which fair value is less than the cost basis; (ii) the length of time that the fair value has been less than cost; (iii) whether the unrealized loss is event driven, credit-driven or a result of changes in market interest rates or risk premium; (iv) the near-term prospects for specific events, developments or circumstances likely to affect the value of the investment; (v) the investment’s rating and whether the investment is investment-grade and/or has been downgraded since its purchase; (vi) whether the issuer is current on all payments in accordance with the contractual terms of the investment and is expected to meet all of its obligations under the terms of the investment; (vii) whether we intend to sell the investment or it is more likely than not that circumstances will
CNO FINANCIAL GROUP, INC. AND SUBSIDIARIES
Notes to Consolidated Financial Statements
___________________
require us to sell the investment before recovery occurs; (viii) the underlying current and prospective asset and enterprise values of the issuer and the extent to which the recoverability of the carrying value of our investment may be affected by changes in such values; (ix) projections of, and unfavorable changes in, cash flows on structured securities including mortgage-backed and asset-backed securities; and (x) other objective and subjective factors.
Future events may occur, or additional information may become available, which may necessitate future realized losses of securities in our portfolio. Significant losses in the estimated fair values of our investments could have a material adverse effect on our earnings in future periods.
Impairment losses on equity securities are recognized in net income. The manner in which impairment losses on fixed maturity securities, available for sale, are recognized in the financial statements is dependent on the facts and circumstances related to the specific security. If we intend to sell a security or it is more likely than not that we would be required to sell a security before the recovery of its amortized cost, the security is other-than-temporarily impaired and the full amount of the impairment is recognized as a loss through earnings. If we do not expect to recover the amortized cost basis, we do not plan to sell the security, and if it is not more likely than not that we would be required to sell a security before the recovery of its amortized cost, less any current period credit loss, the recognition of the other-than-temporary impairment is bifurcated. We recognize the credit loss portion in net income and the noncredit loss portion in accumulated other comprehensive income (loss). Prior to 2009, such other-than-temporary impairments were recognized in their entirety through earnings and the amount recognized was the difference between amortized cost and estimated fair value.
We estimate the amount of the credit loss component of a fixed maturity security impairment as the difference between amortized cost and the present value of the expected cash flows of the security. The present value is determined using the best estimate of future cash flows discounted at the effective interest rate implicit to the security at the date of purchase or the current yield to accrete an asset-backed or floating rate security. The methodology and assumptions for establishing the best estimate of future cash flows vary depending on the type of security.
For most structured securities, cash flow estimates are based on bond specific facts and circumstances that may include collateral characteristics, expectations of delinquency and default rates, loss severity, prepayment speeds and structural support, including excess spread, subordination and guarantees. For corporate bonds, cash flow estimates are derived from scenario-based outcomes of expected corporate restructurings or the disposition of assets using bond specific facts and circumstances including timing, secured interest and loss severity. The previous amortized cost basis less the impairment recognized in net income becomes the security’s new cost basis. We accrete the new cost basis to the estimated future cash flows over the expected remaining life of the security.
The remaining non-credit impairment, which is recorded in accumulated other comprehensive income (loss), is the difference between the security’s estimated fair value and our best estimate of future cash flows discounted at the effective interest rate prior to impairment. The remaining non-credit impairment typically represents changes in the market interest rates, current market liquidity and risk premiums. As of December 31, 2010, other-than-temporary impairments included in accumulated other comprehensive income (loss) of $23.4 million (before taxes and related amortization) relate to structured securities.
Mortgage loans are impaired when it is probable that we will not collect the contractual principal and interest on the loan. We measure impairment based upon the difference between the carrying value of the loan and the estimated fair value of the collateral securing the loan less cost to sell.
CNO FINANCIAL GROUP, INC. AND SUBSIDIARIES
Notes to Consolidated Financial Statements
___________________
The following table summarizes the amount of credit losses recognized in earnings on fixed maturity securities, available for sale, held at the beginning of the period, for which a portion of the other-than-temporary impairment was also recognized in accumulated other comprehensive income (loss) for the years ended December 31, 2010 and 2009 (dollars in millions):
| | | Year ended | |
| | | December 31, | |
| | | 2010 | | | 2009 | |
| | | | | | | |
| Credit losses on fixed maturity securities, available for sale, beginning of year | | $ | (27.2 | ) | | $ | (.6 | ) |
| Add: credit losses on other-than-temporary impairments not previously recognized | | | (1.7 | ) | | | (20.7 | ) |
| Less: credit losses on securities sold | | | 33.3 | | | | 5.4 | |
| Less: credit losses on securities impaired due to intent to sell (a) | | | 1.9 | | | | - | |
| Add: credit losses on previously impaired securities | | | (12.4 | ) | | | (11.3 | ) |
| Less: increases in cash flows expected on previously impaired securities | | | - | | | | - | |
| | | | | | | | | |
| Credit losses on fixed maturity securities, available for sale, end of year | | $ | (6.1 | ) | | $ | (27.2 | ) |
__________
| (a) | Represents securities for which the amount previously recognized in accumulated other comprehensive income (loss) was recognized in earnings because we intend to sell the security or we more likely than not will be required to sell the security before recovery of its amortized cost basis. |
Investments with Unrealized Losses
The following table sets forth the amortized cost and estimated fair value of those fixed maturities, available for sale, with unrealized losses at December 31, 2010, by contractual maturity. Actual maturities will differ from contractual maturities because borrowers may have the right to call or prepay obligations with or without penalties. Structured securities frequently permit periodic unscheduled payments throughout their lives (dollars in millions):
| | | | | | Estimated | |
| | | Amortized | | | fair | |
| | | cost | | | value | |
| | | | | | | |
| Due in one year or less | | $ | 18.0 | | | $ | 16.4 | |
| Due after one year through five years | | | 204.5 | | | | 200.2 | |
| Due after five years through ten years | | | 663.7 | | | | 634.9 | |
| Due after ten years | | | 4,521.5 | | | | 4,274.7 | |
| | | | | | | | | |
| Subtotal | | | 5,407.7 | | | | 5,126.2 | |
| | | | | | | | | |
| Structured securities | | | 1,409.3 | | | | 1,353.9 | |
| | | | | | | | | |
| Total | | $ | 6,817.0 | | | $ | 6,480.1 | |
CNO FINANCIAL GROUP, INC. AND SUBSIDIARIES
Notes to Consolidated Financial Statements
___________________
The following summarizes the investments in our portfolio rated below-investment grade which have been continuously in an unrealized loss position exceeding 20 percent of the cost basis for the period indicated as of December 31, 2010 (dollars in millions):
| | | Number | | | Cost | | | Unrealized | | | Estimated | |
| Period | | of issuers | | | basis | | | loss | | | fair value | |
| | | | | | | | | | | | | |
| Less than 6 months | | | 7 | | | $ | 38.2 | | | $ | (9.7 | ) | | $ | 28.5 | |
| Greater than or equal to 6 months and less than 12 months | | | 1 | | | | .4 | | | | (.1 | ) | | | .3 | |
| Greater than 12 months | | | 4 | | | | 11.9 | | | | (5.0 | ) | | | 6.9 | |
| | | | | | | | | | | | | | | | | |
| | | | 12 | | | $ | 50.5 | | | $ | (14.8 | ) | | $ | 35.7 | |
The following table summarizes the gross unrealized losses of our fixed maturity securities, available for sale, by category and ratings category as of December 31, 2010 (dollars in millions):
| | | | | | | | | Below investment grade | | | Total gross | |
| | | Investment grade | | | | | | B+ and | | | unrealized | |
| | | AAA/AA/A | | | BBB | | | BB | | | below | | | losses | |
| | | | | | | | | | | | | | | | |
| States and political subdivisions | | $ | 68.1 | | | $ | 31.1 | | | $ | 1.5 | | | $ | - | | | $ | 100.7 | |
| Banks | | | 20.3 | | | | 19.6 | | | | 4.2 | | | | - | | | | 44.1 | |
| Collateralized mortgage obligations | | | 29.5 | | | | .6 | | | | - | | | | 5.4 | | | | 35.5 | |
| Insurance | | | 4.9 | | | | 11.9 | | | | 1.0 | | | | 1.9 | | | | 19.7 | |
| Energy/pipelines | | | .2 | | | | 13.9 | | | | .1 | | | | .1 | | | | 14.3 | |
| Commercial mortgage-backed securities | | | 4.2 | | | | 4.8 | | | | 3.5 | | | | - | | | | 12.5 | |
| Building materials | | | - | | | | 8.9 | | | | 3.1 | | | | .4 | | | | 12.4 | |
| U.S. Treasury and Obligations | | | 11.8 | | | | - | | | | - | | | | - | | | | 11.8 | |
| Cable/media | | | - | | | | 2.0 | | | | 3.5 | | | | 6.0 | | | | 11.5 | |
| Food/beverage | | | .3 | | | | 9.0 | | | | - | | | | .5 | | | | 9.8 | |
| Telecom | | | 4.3 | | | | 3.3 | | | | 1.5 | | | | - | | | | 9.1 | |
| Asset-backed securities | | | 3.0 | | | | 2.1 | | | | .1 | | | | 1.1 | | | | 6.3 | |
| Real estate/REITs | | | .1 | | | | 1.2 | | | | 3.2 | | | | 1.6 | | | | 6.1 | |
| Utilities | | | 2.4 | | | | 2.2 | | | | - | | | | 1.1 | | | | 5.7 | |
| Healthcare/pharmaceuticals | | | 1.2 | | | | 4.1 | | | | .3 | | | | .1 | | | | 5.7 | |
| Consumer products | | | - | | | | 2.4 | | | | 2.3 | | | | .3 | | | | 5.0 | |
| Paper | | | - | | | | 1.3 | | | | 3.5 | | | | - | | | | 4.8 | |
| Capital goods | | | .2 | | | | .9 | | | | 2.9 | | | | - | | | | 4.0 | |
| Transportation | | | .7 | | | | 1.3 | | | | 1.2 | | | | - | | | | 3.2 | |
| Brokerage | | | 1.9 | | | | 1.1 | | | | - | | | | - | | | | 3.0 | |
| Chemicals | | | - | | | | 2.2 | | | | - | | | | - | | | | 2.2 | |
| Metals and mining | | | - | | | | 2.1 | | | | - | | | | - | | | | 2.1 | |
| Aerospace/defense | | | 1.0 | | | | .2 | | | | - | | | | - | | | | 1.2 | |
| Collateralized debt obligations | | | 1.1 | | | | - | | | | - | | | | - | | | | 1.1 | |
| Technology | | | - | | | | .8 | | | | .1 | | | | .1 | | | | 1.0 | |
| Entertainment/hotels | | | - | | | | .9 | | | | - | | | | - | | | | .9 | |
| Gaming | | | - | | | | - | | | | - | | | | .7 | | | | .7 | |
| Textiles | | | - | | | | - | | | | - | | | | .3 | | | | .3 | |
| Retail | | | .2 | | | | - | | | | - | | | | - | | | | .2 | |
| Other | | | - | | | | 1.6 | | | | - | | | | .4 | | | | 2.0 | |
| | | | | | | | | | | | | | | | | | | | | |
| Total fixed maturities, available for sale | | $ | 155.4 | | | $ | 129.5 | | | $ | 32.0 | | | $ | 20.0 | | | $ | 336.9 | |
CNO FINANCIAL GROUP, INC. AND SUBSIDIARIES
Notes to Consolidated Financial Statements
___________________
Our investment strategy is to maximize, over a sustained period and within acceptable parameters of quality and risk, investment income and total investment return through active investment management. Accordingly, we may sell securities at a gain or a loss to enhance the projected total return of the portfolio as market opportunities change, to reflect changing perceptions of risk, or to better match certain characteristics of our investment portfolio with the corresponding characteristics of our insurance liabilities. While we do not have the intent to sell securities with unrealized losses and it is not more likely than not that we will be required to sell securities with unrealized losses prior to their anticipated recovery, we may sell securities at a loss in the future because of actual or expected changes in our view of the particular investment, its industry, its type or the general investment environment. If a loss is recognized from a sale subsequent to a balance sheet date due to these unexpected developments, the loss is recognized in the period in which we had the intent to sell the securities before their anticipated recovery.
The following table summarizes the gross unrealized losses and fair values of our investments with unrealized losses that are not deemed to be other-than-temporarily impaired, aggregated by investment category and length of time that such securities have been in a continuous unrealized loss position, at December 31, 2010 (dollars in millions):
| | | Less than 12 months | | | 12 months or greater | | | Total | |
| | | Fair | | | Unrealized | | | Fair | | | Unrealized | | | Fair | | | Unrealized | |
| Description of securities | | value | | | losses | | | value | | | losses | | | value | | | losses | |
| | | | | | | | | | | | | | | | | | | |
| United States Treasury securities and obligations of United States government corporations and agencies | | $ | 196.9 | | | $ | (11.8 | ) | | $ | .2 | | | $ | - | | | $ | 197.1 | | | $ | (11.8 | ) |
| States and political subdivisions | | | 1,201.9 | | | | (54.8 | ) | | | 229.6 | | | | (45.9 | ) | | | 1,431.5 | | | | (100.7 | ) |
| Corporate securities | | | 2,633.0 | | | | (80.6 | ) | | | 864.6 | | | | (88.4 | ) | | | 3,497.6 | | | | (169.0 | ) |
| Asset-backed securities | | | 272.2 | | | | (2.4 | ) | | | 54.0 | | | | (3.9 | ) | | | 326.2 | | | | (6.3 | ) |
| Collateralized debt obligations | | | 117.0 | | | | (.9 | ) | | | 5.8 | | | | (.2 | ) | | | 122.8 | | | | (1.1 | ) |
| Commercial mortgage-backed securities | | | 15.5 | | | | - | | | | 111.8 | | | | (12.5 | ) | | | 127.3 | | | | (12.5 | ) |
| Mortgage pass-through securities | | | .3 | | | | - | | | | 3.4 | | | | - | | | | 3.7 | | | | - | |
| Collateralized mortgage obligations | | | 661.0 | | | | (29.1 | ) | | | 112.9 | | | | (6.4 | ) | | | 773.9 | | | | (35.5 | ) |
| | | | | | | | | | | | | | | | | | | | | | | | | |
| Total fixed maturities, available for sale | | $ | 5,097.8 | | | $ | (179.6 | ) | | $ | 1,382.3 | | | $ | (157.3 | ) | | $ | 6,480.1 | | | $ | (336.9 | ) |
CNO FINANCIAL GROUP, INC. AND SUBSIDIARIES
Notes to Consolidated Financial Statements
___________________
The following table summarizes the gross unrealized losses and fair values of our investments with unrealized losses that were not deemed to be other-than-temporarily impaired, aggregated by investment category and length of time that such securities had been in a continuous unrealized loss position, at December 31, 2009 (dollars in millions):
| | | Less than 12 months | | | 12 months or greater | | | Total | |
| | | Fair | | | Unrealized | | | Fair | | | Unrealized | | | Fair | | | Unrealized | |
| Description of securities | | value | | | losses | | | value | | | losses | | | value | | | losses | |
| | | | | | | | | | | | | | | | | | | |
| United States Treasury securities and obligations of United States government corporations and agencies | | $ | 157.6 | | | $ | (3.5 | ) | | $ | - | | | $ | - | | | $ | 157.6 | | | $ | (3.5 | ) |
| States and political subdivisions | | | 375.1 | | | | (18.0 | ) | | | 291.5 | | | | (62.5 | ) | | | 666.6 | | | | (80.5 | ) |
| Corporate securities | | | 3,707.1 | | | | (109.0 | ) | | | 2,919.5 | | | | (322.5 | ) | | | 6,626.6 | | | | (431.5 | ) |
| Asset-backed securities | | | 7.2 | | | | (.3 | ) | | | 133.1 | | | | (54.3 | ) | | | 140.3 | | | | (54.6 | ) |
| Collateralized debt obligations | | | 34.5 | | | | (.6 | ) | | | 5.7 | | | | (4.7 | ) | | | 40.2 | | | | (5.3 | ) |
| Commercial mortgage-backed securities | | | 211.5 | | | | (4.3 | ) | | | 250.8 | | | | (105.2 | ) | | | 462.3 | | | | (109.5 | ) |
| Mortgage pass-through securities | | | - | | | | - | | | | 4.2 | | | | (.1 | ) | | | 4.2 | | | | (.1 | ) |
| Collateralized mortgage obligations | | | 1,301.3 | | | | (41.6 | ) | | | 460.3 | | | | (143.5 | ) | | | 1,761.6 | | | | (185.1 | ) |
| | | | | | | | | | | | | | | | | | | | | | | | | |
| Total fixed maturities, available for sale | | $ | 5,794.3 | | | $ | (177.3 | ) | | $ | 4,065.1 | | | $ | (692.8 | ) | | $ | 9,859.4 | | | $ | (870.1 | ) |
Based on management’s current assessment of investments with unrealized losses at December 31, 2010, the Company believes the issuers of the securities will continue to meet their obligations (or with respect to equity-type securities, the investment value will recover to its cost basis). While we do not have the intent to sell securities with unrealized losses and it is not more likely than not that we will be required to sell securities with unrealized losses prior to their anticipated recovery, our intent on an individual security may change, based upon market or other unforeseen developments. In such instances, if a loss is recognized from a sale subsequent to a balance sheet date due to these unexpected developments, the loss is recognized in the period in which we had the intent to sell the securities be fore their anticipated recovery.
Structured Securities
At December 31, 2010, fixed maturity investments included structured securities with an estimated fair value of $4.2 billion (or 20 percent of all fixed maturity securities). The yield characteristics of structured securities differ in some respects from those of traditional fixed-income securities. For example, interest and principal payments on structured securities may occur more frequently, often monthly. In many instances, we are subject to the risk that the amount and timing of principal and interest payments may vary from expectations. For example, in many cases, partial prepayments may occur at the option of the issuer and prepayment rates are influenced by a number of factors that cannot be predicted with certainty, including: the relative sensitivity of the underlying asset s backing the security to changes in interest rates; a variety of economic, geographic and other factors; the timing and pace of liquidations of defaulted collateral; the amount of loan maturities; and various security-specific structural considerations (for example, the repayment priority of a given security in a securitization structure). In addition, the total amount of payments for non-government structured securities may be affected by changes to cumulative default rates or loss severities of the related collateral.
In general, the rate of prepayments on structured securities increases when prevailing interest rates decline significantly in absolute terms and also relative to the interest rates on the underlying assets. The yields recognized on structured securities purchased at a discount to par will increase (relative to the stated rate) when the underlying assets prepay faster than expected. The yields recognized on structured securities purchased at a premium will decrease (relative to the stated rate) when the underlying assets prepay faster than expected. When interest rates decline, the proceeds from prepayments may be reinvested at lower rates than we were earning on the prepaid securities. When interest rates increase, prepayments may decrease. When this occurs, the average maturity and duration of the structured securities increase, which decreases the yield on structured securities purchased at a discount because the discount is realized as income at a slower rate,
CNO FINANCIAL GROUP, INC. AND SUBSIDIARIES
Notes to Consolidated Financial Statements
___________________
and it increases the yield on those purchased at a premium because of a decrease in the annual amortization of the premium.
For structured securities included in fixed maturities, available for sale, that were purchased at a discount or premium, we recognize investment income using an effective yield based on anticipated future prepayments and the estimated final maturity of the securities. Actual prepayment experience is periodically reviewed and effective yields are recalculated when differences arise between the prepayments originally anticipated and the actual prepayments received and currently anticipated. For credit sensitive mortgage-backed and asset-backed securities, and for securities that can be prepaid or settled in a way that we would not recover substantially all of our investment, the effective yield is recalculated on a prospective basis. Under this method, the amortized cost basis in the security is not immedi ately adjusted and a new yield is applied prospectively. For all other structured and asset-backed securities, the effective yield is recalculated when changes in assumptions are made, and reflected in our income on a retrospective basis. Under this method, the amortized cost basis of the investment in the securities is adjusted to the amount that would have existed had the new effective yield been applied since the acquisition of the securities. Such adjustments were not significant in 2010.
The following table sets forth the par value, amortized cost and estimated fair value of structured securities, summarized by interest rates on the underlying collateral, at December 31, 2010 (dollars in millions):
| | | Par | | | Amortized | | | Estimated | |
| | | value | | | cost | | | fair value | |
| | | | | | | | | | |
| Below 4 percent | | $ | 370.0 | | | $ | 328.0 | | | $ | 331.8 | |
| 4 percent – 5 percent | | | 516.5 | | | | 506.2 | | | | 484.0 | |
| 5 percent – 6 percent | | | 2,364.2 | | | | 2,289.4 | | | | 2,359.2 | |
| 6 percent – 7 percent | | | 891.6 | | | | 841.0 | | | | 865.4 | |
| 7 percent – 8 percent | | | 83.3 | | | | 84.5 | | | | 85.0 | |
| 8 percent and above | | | 84.9 | | | | 83.3 | | | | 82.7 | |
| | | | | | | | | | | | | |
| Total structured securities | | $ | 4,310.5 | | | $ | 4,132.4 | | | $ | 4,208.1 | |
The amortized cost and estimated fair value of structured securities at December 31, 2010, summarized by type of security, were as follows (dollars in millions):
| | | | | | Estimated fair value | |
| | | | | | | | | Percent | |
| | | Amortized | | | | | | of fixed | |
| Type | | cost | | | Amount | | | maturities | |
| | | | | | | | | | |
| Pass-throughs, sequential and equivalent securities | | $ | 1,347.9 | | | $ | 1,354.0 | | | | 6.6 | % |
| Planned amortization classes, target amortization classes and accretion-directed bonds | | | 568.9 | | | | 565.4 | | | | 2.7 | |
| Commercial mortgage-backed securities | | | 1,299.8 | | | | 1,363.7 | | | | 6.6 | |
| Asset-backed securities | | | 639.0 | | | | 644.1 | | | | 3.1 | |
| Collateralized debt obligations | | | 253.0 | | | | 256.5 | | | | 1.2 | |
| Other | | | 23.8 | | | | 24.4 | | | | .2 | |
| | | | | | | | | | | | | |
| Total structured securities | | $ | 4,132.4 | | | $ | 4,208.1 | | | | 20.4 | % |
Pass-throughs, sequentials and equivalent securities have unique prepayment variability characteristics. Pass-through securities typically return principal to the holders based on cash payments from the underlying mortgage obligations. Sequential securities return principal to tranche holders in a detailed hierarchy. Planned amortization classes, targeted amortization classes and accretion-directed bonds adhere to fixed schedules of principal payments as long as the underlying mortgage loans experience prepayments within certain estimated ranges. In most circumstances, changes in prepayment rates are first absorbed by support or companion classes insulating the timing of receipt of cash flows from the consequences of both faster prepayments (average life shortening) and slower prepayments (aver age life extension).
CNO FINANCIAL GROUP, INC. AND SUBSIDIARIES
Notes to Consolidated Financial Statements
___________________
Commercial mortgage-backed securities are secured by commercial real estate mortgages, generally income producing properties that are managed for profit. Property types include multi-family dwellings including apartments, retail centers, hotels, restaurants, hospitals, nursing homes, warehouses, and office buildings. Most commercial mortgage-backed securities have call protection features whereby underlying borrowers may not prepay their mortgages for stated periods of time without incurring prepayment penalties.
Commercial Mortgage Loans
At December 31, 2010, the mortgage loan balance was primarily comprised of commercial loans. Approximately 7 percent, 7 percent, 6 percent, 6 percent, 5 percent and 5 percent of the mortgage loan balance were on properties located in Minnesota, California, Arizona, Florida, North Carolina and Indiana, respectively. No other state comprised greater than five percent of the mortgage loan balance. None of the commercial mortgage loan balance was noncurrent at December 31, 2010. We had no allowance for losses on mortgage loans at both December 31, 2010 and 2009.
The following table provides the weighted average loan-to-value ratio for our outstanding mortgage loans as of December 31, 2010 (dollars in millions):
| | | | | | | |
| | | | | | Estimated fair | |
| Loan-to-value ratio (a) | | Carrying value | | | value | |
| | | | | | | |
| Less than 60% | | $ | 705.9 | | | $ | 752.5 | |
| 60% to 70% | | | 657.2 | | | | 630.7 | |
| 70% to 80% | | | 296.5 | | | | 286.5 | |
| 80% to 90% | | | 46.3 | | | | 43.9 | |
| Greater than 90% | | | 55.3 | | | | 49.0 | |
| | | | | | | | | |
| Total | | $ | 1,761.2 | | | $ | 1,762.6 | |
__________
| (a) | Loan-to-value ratios are calculated as the ratio of: (i) the carrying value of the commercial mortgage loans; to (ii) the estimated fair value of the underlying commercial property. |
Securities Lending
The Company participated in a securities lending program whereby certain fixed maturity securities from our investment portfolio were loaned to third parties via a lending agent for a short period of time. We maintain ownership of the loaned securities. We required collateral equal to 102 percent of the fair value of the loaned securities. The collateral was invested by the lending agent in accordance with our guidelines. The fair value of the loaned securities was monitored on a daily basis with additional collateral obtained as necessary. In the third quarter of 2010, the Company discontinued its securities lending program. As of December 31, 2009, the fair value of the loaned securities was $178.5 million. As of December 31, 2009, the Company had received co llateral of $185.7 million. Income generated from the program, net of expenses is recorded as net investment income and totaled $.2 million, $1.2 million and $2.4 million in 2010, 2009 and 2008, respectively.
Other Investment Disclosures
Life insurance companies are required to maintain certain investments on deposit with state regulatory authorities. Such assets had aggregate carrying values of $77.7 million and $83.3 million at December 31, 2010 and 2009, respectively.
CNO had no fixed maturity investments that were in excess of 10 percent of shareholders’ equity at December 31, 2010 and 2009 (other than investments issued or guaranteed by the United States government or a United States government agency).
CNO FINANCIAL GROUP, INC. AND SUBSIDIARIES
Notes to Consolidated Financial Statements
___________________
5. LIABILITIES FOR INSURANCE PRODUCTS
These liabilities consisted of the following (dollars in millions):
| | | | | | | | | Interest | | | | | | | |
| | | Withdrawal | | | Mortality | | | rate | | | | | | | |
| | | assumption | | | assumption | | | assumption | | | 2010 | | | 2009 | |
| | | | | | | | | | | | | | | | |
| Future policy benefits: | | | | | | | | | | | | | | | |
| Interest-sensitive products: | | | | | | | | | | | | | | | |
| Investment contracts | | | N/A | | | | N/A | | | (c) | | | $ | 9,742.9 | | | $ | 9,676.1 | |
| Universal life contracts | | | N/A | | | | N/A | | | | N/A | | | | 3,451.8 | | | | 3,543.1 | |
| | | | | | | | | | | | | | | | | | | | | |
| Total interest-sensitive products | | | | | | | | | | | | | | | 13,194.7 | | | | 13,219.2 | |
| | | | | | | | | | | | | | | | | | | | | |
| Traditional products: | | | | | | | | | | | | | | | | | | | | |
| Traditional life insurance contracts | | Company experience | | | (a) | | | | 5% | | | | 2,354.3 | | | | 2,325.4 | |
| | | | | | | | | | | | | | | | | | | | | |
| Limited-payment annuities | | Company experience, if applicable | | | (b) | | | | 4% | | | | 873.4 | | | | 892.8 | |
| | | | | | | | | | | | | | | | | | | | | |
| Individual and group accident and health | | Company experience | | | Company experience | | | | 6% | | | | 7,079.9 | | | | 6,845.3 | |
| | | | | | | | | | | | | | | | | | | | | |
| Total traditional products | | | | | | | | | | | | | | | 10,307.6 | | | | 10,063.5 | |
| | | | | | | | | | | | | | | | | | | | | |
| Claims payable and other policyholder funds | | | N/A | | | | N/A | | | | N/A | | | | 968.7 | | | | 994.0 | |
| Liabilities related to separate accounts | | | N/A | | | | N/A | | | | N/A | | | | 17.5 | | | | 17.3 | |
| | | | | | | | | | | | | | | | | | | | | |
| Total | | | | | | | | | | | | | | $ | 24,488.5 | | | $ | 24,294.0 | |
____________________
| | (a) | Principally, modifications of the 1965 - 70 and 1975 - 80 Basic, Select and Ultimate Tables. |
| | (b) | Principally, the 1984 United States Population Table and the NAIC 1983 Individual Annuitant Mortality Table. |
| | (c) | In 2010 and 2009, all of this liability represented account balances where future benefits are not guaranteed. |
The Company establishes reserves for insurance policy benefits based on assumptions as to investment yields, mortality, morbidity, withdrawals, lapses and maintenance expenses. These reserves include amounts for estimated future payment of claims based on actuarial assumptions. The balance is based on the Company’s best estimate of the future policyholder benefits to be incurred on this business, given recent and expected future changes in experience.
CNO FINANCIAL GROUP, INC. AND SUBSIDIARIES
Notes to Consolidated Financial Statements
___________________
Changes in the unpaid claims reserve (included in claims payable) and disabled life reserves related to accident and health insurance (included in individual and group accident and health liabilities) were as follows (dollars in millions):
| | | 2010 | | | 2009 | | | 2008 | |
| | | | | | | | | | |
| Balance, beginning of the year | | $ | 1,444.0 | | | $ | 1,341.3 | | | $ | 1,247.7 | |
| | | | | | | | | | | | | |
| Incurred claims (net of reinsurance) related to: | | | | | | | | | | | | |
| Current year | | | 1,505.8 | | | | 1,616.8 | | | | 1,729.3 | |
| Prior years (a) | | | (15.6 | ) | | | (32.3 | ) | | | (25.9 | ) |
| | | | | | | | | | | | | |
| Total incurred | | | 1,490.2 | | | | 1,584.5 | | | | 1,703.4 | |
| | | | | | | | | | | | | |
| Interest on claim reserves | | | 73.4 | | | | 69.3 | | | | 61.4 | |
| | | | | | | | | | | | | |
| Paid claims (net of reinsurance) related to: | | | | | | | | | | | | |
| Current year | | | 827.0 | | | | 910.7 | | | | 1,001.1 | |
| Prior years | | | 694.1 | | | | 691.6 | | | | 609.5 | |
| | | | | | | | | | | | | |
| Total paid | | | 1,521.1 | | | | 1,602.3 | | | | 1,610.6 | |
| | | | | | | | | | | | | |
| Net change in balance for reinsurance assumed and ceded | | | 57.2 | | | | 51.2 | | | | (60.6 | ) |
| | | | | | | | | | | | | |
| Balance, end of the year | | $ | 1,543.7 | | | $ | 1,444.0 | | | $ | 1,341.3 | |
___________
| | (a) | The reserves and liabilities we establish are necessarily based on estimates, assumptions and prior years’ statistics. Such amounts will fluctuate based upon the estimation procedures used to determine the amount of unpaid losses. It is possible that actual claims will exceed our reserves and have a material adverse effect on our results of operations and financial condition. |
6. INCOME TAXES
The components of income tax expense were as follows (dollars in millions):
| | | 2010 | | | 2009 | | | 2008 | |
| | | | | | | | | | |
| Current tax expense | | $ | 9.7 | | | $ | 9.3 | | | $ | 3.8 | |
| Deferred tax provision | | | 94.2 | | | | 50.8 | | | | 5.6 | |
| | | | | | | | | | | | | |
| Income tax expense on period income | | | 103.9 | | | | 60.1 | | | | 9.4 | |
| | | | | | | | | | | | | |
| Valuation allowance | | | (95.0 | ) | | | 27.8 | | | | 403.9 | |
| | | | | | | | | | | | | |
| Total income tax expense | | $ | 8.9 | | | $ | 87.9 | | | $ | 413.3 | |
CNO FINANCIAL GROUP, INC. AND SUBSIDIARIES
Notes to Consolidated Financial Statements
___________________
A reconciliation of the U.S. statutory corporate tax rate to the effective rate reflected in the consolidated statement of operations is as follows:
| | | 2010 | | | 2009 | | | 2008 | |
| | | | | | | | | | |
| U.S. statutory corporate rate | | | 35.0 | % | | | 35.0 | % | | | 35.0 | % |
| Valuation allowance | | | (32.4 | ) | | | 16.0 | | | | 10,916.2 | |
| Other nondeductible expenses (benefits) | | | (.3 | ) | | | (1.4 | ) | | | 125.9 | |
| State taxes | | | .8 | | | | 1.0 | | | | 78.0 | |
| Provision for tax issues, tax credits and other | | | (.1 | ) | | | - | | | | 15.2 | |
| | | | | | | | | | | | | |
| Effective tax rate | | | 3.0 | % | | | 50.6 | % | | | 11,170.3 | % |
The components of the Company’s income tax assets and liabilities were as follows (dollars in millions):
| | | 2010 | | | 2009 | |
| Deferred tax assets: | | | | | | |
| Net federal operating loss carryforwards attributable to: | | | | | | |
| Life insurance subsidiaries | | $ | 681.7 | | | $ | 745.3 | |
| Non-life companies | | | 870.6 | | | | 883.9 | |
| Net state operating loss carryforwards | | | 17.8 | | | | 19.1 | |
| Tax credits | | | 23.4 | | | | 18.5 | |
| Capital loss carryforwards | | | 339.7 | | | | 393.8 | |
| Deductible temporary differences: | | | | | | | | |
| Investments | | | 5.3 | | | | - | |
| Insurance liabilities | | | 738.9 | | | | 782.1 | |
| Unrealized depreciation of investments | | | - | | | | 146.8 | |
| Other | | | 62.8 | | | | 44.0 | |
| | | | | | | | | |
| Gross deferred tax assets | | | 2,740.2 | | | | 3,033.5 | |
| | | | | | | | | |
| Deferred tax liabilities: | | | | | | | | |
| Investments | | | - | | | | (38.1 | ) |
| Present value of future profits and deferred acquisition costs | | | (676.3 | ) | | | (694.0 | ) |
| Unrealized appreciation on investments | | | (132.3 | ) | | | - | |
| | | | | | | | | |
| Gross deferred tax liabilities | | | (808.6 | ) | | | (732.1 | ) |
| | | | | | | | | |
| Net deferred tax assets before valuation allowance | | | 1,931.6 | | | | 2,301.4 | |
| | | | | | | | | |
| Valuation allowance | | | (1,081.4 | ) | | | (1,176.4 | ) |
| | | | | | | | | |
| Net deferred tax assets | | | 850.2 | | | | 1,125.0 | |
| | | | | | | | | |
| Current income taxes accrued | | | (10.8 | ) | | | (1.0 | ) |
| | | | | | | | | |
| Income tax assets, net | | $ | 839.4 | | | $ | 1,124.0 | |
Our income tax expense includes deferred income taxes arising from temporary differences between the financial reporting and tax bases of assets and liabilities, capital loss carryforwards and NOLs. Deferred tax assets and liabilities are measured using enacted tax rates expected to apply in the years in which temporary differences are expected to be recovered or paid. The effect of a change in tax rates on deferred tax assets and liabilities is recognized in earnings in the period when the changes are enacted.
A reduction of the net carrying amount of deferred tax assets by establishing a valuation allowance is required if, based on the available evidence, it is more likely than not that such assets will not be realized. We evaluate the need to
CNO FINANCIAL GROUP, INC. AND SUBSIDIARIES
Notes to Consolidated Financial Statements
___________________
establish a valuation allowance for our deferred income tax assets on an ongoing basis. In evaluating our deferred income tax assets, we consider whether the deferred income tax assets will be realized, based on the more-likely-than-not realization threshold criterion. The ultimate realization of our deferred income tax assets depends upon generating sufficient future taxable income during the periods in which our temporary differences become deductible and before our capital loss carryforwards and NOLs expire. This assessment requires significant judgment. In assessing the need for a valuation allowance, appropriate consideration is given to all positive and negative evidence related to the realization of the deferred tax assets. This assessment considers, among other matters, the na ture, frequency and severity of current and cumulative losses, forecasts of future profitability, excess appreciated asset value over the tax basis of net assets, the duration of carryforward periods, our experience with operating loss and tax credit carryforwards expiring unused, and tax planning alternatives.
Concluding that a valuation allowance is not required is difficult when there has been significant negative evidence, such as cumulative losses in recent years. We utilize a three year rolling calculation of actual income before income taxes as our primary measure of cumulative losses in recent years. Our analysis of whether there needs to be any changes to the deferred tax valuation allowance recognizes that as of December 31, 2010, we have incurred a cumulative loss over the evaluation period, resulting from the substantial loss during 2008 primarily related to the Transfer of Senior Health to an independent trust as described in the note to these consolidated financial statements entitled “Transfer of Senior Health Insurance Company of Pennsylvania to an Independent Trust”. As a result of t he cumulative losses recognized in recent years, our evaluation of the need to increase the valuation allowance for deferred tax assets was primarily based on our historical taxable earnings. However, because a substantial portion of the cumulative losses for the three-year period ended December 31, 2010, relates to transactions to dispose of blocks of businesses, we have adjusted the three-year cumulative results for the income and losses from the blocks of business disposed of in the past and the business transferred as further described in the note to these financial statements entitled “Transfer of Senior Health Insurance Company of Pennsylvania to an Independent Trust”. We consider this to be non-recurring and have reflected our best estimates of when temporary differences will reverse over the carryforward periods.
At December 31, 2010, our valuation allowance for our net deferred tax assets was $1.1 billion, as we have determined that it is more likely than not that a portion of our deferred tax assets will not be realized. This determination was made by evaluating each component of the deferred tax asset and assessing the effects of limitations and/or interpretations on the value of such component to be fully recognized in the future. We have also evaluated the likelihood that we will have sufficient taxable income to offset the available deferred tax assets based on evidence which we consider to be objective and verifiable. Based upon our analysis completed at December 31, 2010, we believe that we will, more likely than not, recover $850.2 million of our deferred tax assets through reductions of our tax liabilities in futur e periods.
During 2010, we reduced the valuation allowance established in prior periods by $95 million. The decrease was primarily attributable to: revisions to projected future taxable income supported by our increased profitability in the past two years ($47 million); utilization of capital loss carryforwards with current capital gains ($30 million); and utilization of NOL carryforwards with higher taxable income than projected in our previous analysis of the valuation allowance ($18 million).
CNO FINANCIAL GROUP, INC. AND SUBSIDIARIES
Notes to Consolidated Financial Statements
___________________
Changes in our valuation allowance are summarized as follows (dollars in millions):
| Balance at December 31, 2007 | | $ | 672.9 | | |
| | | | | | |
| Increase in 2008 | | | 856.2 | | (a) |
| Expiration of capital loss carryforwards | | | (209.7 | ) | |
| Write-off of capital loss carryforwards related to Senior Health | | | (133.2 | ) | |
| Write-off of certain NOLs related to Senior Health | | | (5.5 | ) | |
| | | | | | |
| Balance at December 31, 2008 | | | 1,180.7 | | |
| | | | | | |
| Increase in 2009 | | | 27.8 | | (b) |
| Expiration of capital loss carryforwards | | | (32.1 | ) | |
| | | | | | |
| Balance at December 31, 2009 | | | 1,176.4 | | |
| | | | | | |
| Decrease in 2010 | | | (95.0 | ) | (c) |
| | | | | | |
| Balance at December 31, 2010 | | $ | 1,081.4 | | |
____________________
| (a) | The $856.2 million increase to our valuation allowance during 2008 included increases of: (i) $452 million of deferred tax assets related to Senior Health, which was transferred to an independent trust during 2008; (ii) $298 million related to our reassessment of the recovery of our deferred tax assets in accordance with GAAP, following the additional losses incurred as a result of the transaction to transfer Senior Health to an independent trust; (iii) $60 million related to the recognition of additional realized investment losses for which we are unlikely to receive any tax benefit; and (iv) $45 million related to the estimated additional future expense following the modifications to our Senior Credit Agreement as described in the note to these consolidated financial statements entitled “Notes Payable - Direct Corporate Obligations. ” |
| (b) | The $27.8 million increase to our valuation allowance during 2009 included increases of: (i) $23.0 million related to our reassessment of the recovery of our deferred tax assets following the completion of reinsurance transactions in 2009; and (ii) $4.8 million related to the recognition of additional realized investment losses for which we are unlikely to receive any tax benefit. |
| (c) | The $95.0 million reduction to the deferred tax valuation allowance during 2010 resulted from the utilization of NOLs and capital loss carryforwards and higher projections of future taxable income based on evidence we consider to be objective and verifiable. |
Recovery of our deferred tax assets is dependent on achieving the projections of future taxable income embedded in our analysis and failure to do so would result in an increase in the valuation allowance in a future period. Any future increase in the valuation allowance may result in additional income tax expense and reduce shareholders’ equity, and such an increase could have a significant impact upon our earnings in the future. In addition, the use of the Company’s NOLs is dependent, in part, on whether the Internal Revenue Service (the “IRS”) does not take an adverse position in the future regarding the tax position we have taken in our tax returns with respect to the allocation of a portion of the cancellation of indebtedness income resulting from the bankruptcy of our Predecessor and the classification of the loss we recognized as a result of the transfer of Senior Health to an Independent Trust (as further described below).
The Internal Revenue Code (the “Code”) limits the extent to which losses realized by a non-life entity (or entities) may offset income from a life insurance company (or companies) to the lesser of: (i) 35 percent of the income of the life insurance company; or (ii) 35 percent of the total loss of the non-life entities (including NOLs of the non-life entities). There is no similar limitation on the extent to which losses realized by a life insurance entity (or entities) may offset income from a non-life entity (or entities).
Section 382 imposes limitations on a corporation’s ability to use its NOLs when the company undergoes an ownership change. Future transactions and the timing of such transactions could cause an ownership change for Section 382 income tax purposes. Such transactions may include, but are not limited to, additional repurchases or issuances of common stock
CNO FINANCIAL GROUP, INC. AND SUBSIDIARIES
Notes to Consolidated Financial Statements
___________________
(including upon conversion of our outstanding 7.0% Convertible Senior Debentures due 2016 (the “7.0% Debentures”), or acquisitions or sales of shares of CNO stock by certain holders of our shares, including persons who have held, currently hold or may accumulate in the future five percent or more of our outstanding common stock for their own account. Many of these transactions are beyond our control. If an additional ownership change were to occur for purposes of Section 382, we would be required to calculate an annual restriction on the use of our NOLs to offset future taxable income. The annual restriction would be calculated based upon the value of CNO’s equity at the time of such ownership change, multiplied by a federal long-term tax exempt rate (3.67 percent at December 31, 2010), a nd the annual restriction could effectively eliminate our ability to use a substantial portion of our NOLs to offset future taxable income. We regularly monitor ownership change (as calculated for purposes of Section 382) and, as of December 31, 2010, we were below the 50 percent ownership change level that would trigger further impairment of our ability to utilize our NOLs.
On January 20, 2009, the Company’s Board of Directors adopted a Section 382 Rights Agreement which is designed to protect shareholder value by preserving the value of our tax assets primarily associated with tax NOLs under Section 382. The Section 382 Rights Agreement was adopted to reduce the likelihood of this occurring by deterring the acquisition of stock that would create “5 percent shareholders” as defined in Section 382.
Under the Section 382 Rights Agreement, one right was distributed for each share of our common stock outstanding as of the close of business on January 30, 2009. Effective January 20, 2009, if any person or group (subject to certain exemptions) becomes a “5 percent shareholder” of CNO without the approval of the Board of Directors, there would be a triggering event causing significant dilution in the voting power and economic ownership of that person or group. Existing shareholders who currently are “5 percent shareholders” will trigger a dilutive event only if they acquire additional shares exceeding one percent of our outstanding shares without prior approval from the Board of Directors.
The Section 382 Rights Agreement will continue in effect until January 20, 2012, unless earlier terminated or redeemed by the Board of Directors. The Company’s Audit Committee will review our NOLs on an annual basis and will recommend amending or terminating the Section 382 Rights Agreement based on its review. The Section 382 Rights Agreement was approved by a vote at the annual meeting of shareholders on May 12, 2009.
On May 11, 2010, our shareholders approved an amendment to CNO’s certificate of incorporation designed to prevent certain transfers of common stock which could otherwise adversely affect our ability to use our NOLs (the “Section 382 Charter Amendment”). Subject to the provisions set forth in the Section 382 Charter Amendment, transfers of our common stock would be void and of no effect if the effect of the purported transfer would be to: (i) increase the direct or indirect ownership of our common stock by any person or public group (as such term is defined in the regulations under Section 382) from less than 5% to 5% or more of our common stock; (ii) increase the percentage of our common stock owned directly or indirectly by a person or public group o wning or deemed to own 5% or more of our common stock; or (iii) create a new public group. The Section 382 Charter Amendment will continue in effect until December 31, 2013.
As of December 31, 2010, we had $4.4 billion of federal NOLs and $1.0 billion of capital loss carryforwards, which expire as follows (dollars in millions):
| Year of expiration | | Net operating loss carryforwards (a) | | Capital loss | | | Total loss | |
| | | Life | | Non-life | | carryforwards | | | carryforwards | |
| | | | | | | | | | | | | | | |
| 2011 | | $ | - | | | | $ | .1 | | | | $ | - | | | $ | .1 | |
| 2013 | | | - | | | | | - | | | | | 942.0 | | | | 942.0 | |
| 2014 | | | - | | | | | - | | | | | 28.7 | | | | 28.7 | |
| 2018 | | | 1,713.9 | | (a) | | | - | | | | | - | | | | 1,713.9 | |
| 2021 | | | 29.6 | | | | | - | | | | | - | | | | 29.6 | |
| 2022 | | | 204.1 | | | | | - | | | | | - | | | | 204.1 | |
| 2023 | | | - | | | | | 1,999.3 | | (a) | | | - | | | | 1,999.3 | |
| 2024 | | | - | | | | | 3.2 | | | | | - | | | | 3.2 | |
| 2025 | | | - | | | | | 118.8 | | | | | - | | | | 118.8 | |
| 2027 | | | - | | | | | 216.8 | | | | | - | | | | 216.8 | |
| 2028 | | | - | | | | | .5 | | | | | - | | | | .5 | |
| 2029 | | | - | | | | | 148.7 | | | | | - | | | | 148.7 | |
| | | | | | | | | | | | | | | | | | | |
| Total | | $ | 1,947.6 | | | | $ | 2,487.4 | | | | $ | 970.7 | | | $ | 5,405.7 | |
CNO FINANCIAL GROUP, INC. AND SUBSIDIARIES
Notes to Consolidated Financial Statements
___________________
____________________
| (a) | The allocation of the NOLs summarized above assumes the IRS does not take an adverse position in the future regarding the tax position we plan to take in our tax returns with respect to the allocation of cancellation of indebtedness income. If the IRS disagrees with the tax position we plan to take with respect to the allocation of cancellation of indebtedness income, and their position prevails, approximately $631 million of the NOLs expiring in 2018 would be characterized as non-life NOLs. |
We had deferred tax assets related to NOLs for state income taxes of $17.8 million and $19.1 million at December 31, 2010 and 2009, respectively. The related state NOLs are available to offset future state taxable income in certain states through 2015.
As more fully discussed below, the Company’s interpretation of the tax law, as it relates to the application of the cancellation of indebtedness income to its NOLs, is an uncertain tax position. Since all other life NOLs must be utilized prior to this portion of the NOL, it has not yet been utilized nor is it expected to be utilized within the next twelve months. As a result, an uncertain tax position has not yet been taken on the Company’s tax return.
Although authoritative guidance allowed a change in accounting, the Company has chosen to continue its past accounting policy of classifying interest and penalties as income tax expense in the consolidated statement of operations. No such amounts were recognized in 2010, 2009 or 2008. The liability for accrued interest and penalties was not significant at December 31, 2010 or December 31, 2009.
Tax years 2007 through 2009 are open to examination by the IRS, and tax year 2002 remains open only for potential adjustments related to certain partnership investments. The Company does not anticipate any material adjustments related to these partnership investments. The Company’s various state income tax returns are generally open for tax years 2007 through 2009 based on the individual state statutes of limitation.
In July 2006, the Joint Committee of Taxation accepted the audit and the settlement which characterized $2.1 billion of the tax losses on our Predecessor’s investment in Conseco Finance Corp. as life company losses and the remaining $3.8 billion as non-life losses prior to the application of the cancellation of indebtedness attribute reductions described below.
The Code provides that any income realized as a result of the cancellation of indebtedness in bankruptcy (cancellation of debt income or “CODI”) must reduce NOLs. We realized $2.5 billion of CODI when we emerged from bankruptcy. Pursuant to the Company’s interpretation of the tax law, the CODI reductions were all used to reduce non-life NOLs. However, if the IRS were to disagree with our interpretation and ultimately prevail, we believe $631 million of NOLs classified as life company NOLs would be re-characterized as non-life NOLs and subject to the 35% limitation discussed above. Such a re-characterization would also extend the year of expiration as life company NOLs expire after 15 years whereas non-life NOLs expire after 20 years. Due to uncertainties with respec t to the ultimate position the IRS may take and limitations on our ability to utilize NOLs based on projected life and non-life income, we have considered the $631 million of CODI to be a reduction to life NOLs when determining our valuation allowance. If we determine the IRS agrees with our position that the $631 million of CODI is a reduction to non-life NOLs, our valuation allowance would be reduced by approximately $140 million based on the income projection used in our valuation allowance at December 31, 2010.
We recognized a $742 million loss on our investment in Senior Health which was worthless when it was transferred to an Independent Trust in 2008. We have treated the loss as a capital loss when determining the deferred tax benefit we may receive. We also established a full valuation allowance as we believe we will not generate capital gains to utilize the benefit. However, due to uncertainties in the tax code, we have reflected this loss as an ordinary loss in our tax return, contrary to certain IRS rulings. If classifying this loss as ordinary is ultimately determined to be correct, our valuation allowance would be reduced by approximately $160 million based on income projections used in our valuation allowance at December 31, 2010.
In accordance with GAAP, we are precluded from recognizing the tax benefits of any tax windfall upon the exercise of a stock option or the vesting of restricted stock unless such deduction resulted in actual cash savings to the Company. Because of the Company’s NOLs, no cash savings have occurred. NOL carryforwards of $.6 million related to deductions for stock options and restricted stock will be reflected in additional paid-in capital if realized.
CNO FINANCIAL GROUP, INC. AND SUBSIDIARIES
Notes to Consolidated Financial Statements
___________________
7. NOTES PAYABLE - DIRECT CORPORATE OBLIGATIONS
The following notes payable were direct corporate obligations of the Company as of December 31, 2010 and 2009 (dollars in millions):
| | | 2010 | | | 2009 | |
| | | | | | | |
| 3.5% Debentures | | $ | - | | | $ | 116.5 | |
| 7.0% Debentures | | | 293.0 | | | | 176.5 | |
| New senior secured credit agreement | | | 375.0 | | | | - | |
| 9.0% Senior Secured Notes | | | 275.0 | | | | - | |
| Previous senior credit agreement | | | - | | | | 652.1 | |
| 6% Senior Health Note | | | 75.0 | | | | 100.0 | |
| Unamortized discount on 3.5% Debentures | | | - | | | | (3.3 | ) |
| Unamortized discount on 7.0% Debentures | | | (14.8 | ) | | | (4.4 | ) |
| Unamortized discount on new senior secured credit agreement | | | (4.7 | ) | | | - | |
| | | | | | | | | |
| Direct corporate obligations | | $ | 998.5 | | | $ | 1,037.4 | |
3.5% Debentures
In August 2005, we completed the private offering of $330 million of 3.5% Debentures. During 2008, we repurchased $37.0 million par value of such 3.5% Debentures for $15.3 million plus accrued interest. On November 13, 2009, we completed a cash tender offer (the “Tender Offer”) for $176.5 million aggregate principal amount of the 3.5% Debentures. The aggregate consideration for the 3.5% Debentures accepted by us in the Tender Offer, plus accrued and unpaid interest thereon, was $177.2 million. This amount was funded primarily from the net proceeds from the issuance of 7.0% Debentures as described below.
In February 2010, we repurchased $64.0 million aggregate principal amount of our 3.5% Debentures in a privately-negotiated transaction. In connection with the repurchase of the 3.5% Debentures, we completed a second closing of $64 million aggregate principal amount of our 7.0% Debentures. The net proceeds from the issuance of the 7.0% Debentures were used to fund a substantial portion of the consideration payable in connection with the repurchase of the 3.5% Debentures. The purchase price for the $64.0 million of 3.5% Debentures was equal to 100 percent of the aggregate principal amount plus accrued and unpaid interest.
In May 2010, we repurchased $52.5 million aggregate principal amount of our 3.5% Debentures in a privately-negotiated transaction. In connection with the repurchase of the 3.5% Debentures, we completed a third closing of $52.5 million aggregate principal amount of our 7.0% Debentures. The net proceeds from the issuance of the 7.0% Debentures were used to fund a substantial portion of the consideration payable in connection with the repurchase of the 3.5% Debentures. The purchase price for the $52.5 million of 3.5% Debentures was equal to 100 percent of the aggregate principal amount plus accrued and unpaid interest.
7.0% Debentures
On November 13, 2009, we issued $176.5 million aggregate principal amount of our 7.0% Debentures in the initial closing of our private offering of 7.0% Debentures to Morgan Stanley & Co. Incorporated, as the initial purchaser of the 7.0% Debentures. The net proceeds from the initial closing of the offering of our 7.0% Debentures, after deducting the initial purchaser’s discounts and commissions and before other offering expenses, totaled $172.0 million. The Company used the net proceeds to fund a substantial portion of the consideration payable in connection with the Tender Offer for the 3.5% Debentures.
In February 2010, we completed a second closing of $64 million aggregate principal amount of our 7.0% Debentures and in May 2010, we completed a third closing of $52.5 million aggregate principal amount of our 7.0% Debentures. These issuances were made pursuant to the purchase agreement that we entered into in October 2009 relating to the private offering of up to $293 million of 7.0% Debentures. We received aggregate net proceeds (after taking into account the discounted
CNO FINANCIAL GROUP, INC. AND SUBSIDIARIES
Notes to Consolidated Financial Statements
___________________
offering price less the initial purchaser’s discounts and commissions, but before expenses) of: (i) $61.4 million in the second closing of the 7.0% Debentures; and (ii) $49.4 million in the third closing of the 7.0% Debentures. At December 31, 2010 and 2009, unamortized issuance costs (classified as other assets) related to the 7.0% Debentures were $1.9 million and $2.1 million, respectively, and are amortized as an increase to interest expense over the term of the 7.0% Debentures.
The 7.0% Debentures rank equally in right of payment with all of the Company’s unsecured and unsubordinated obligations. The 7.0% Debentures are governed by an Indenture dated as of October 16, 2009 (the “7.0% Indenture”) between the Company and The Bank of New York Mellon Trust Company, N.A., as trustee (“Mellon”). The 7.0% Debentures bear interest at a rate of 7.0% per annum, payable semi-annually on June 30 and December 30 of each year, commencing on the interest payment date immediately succeeding the issuance date of such series. The 7.0% Debentures will mature on December 30, 2016, unless earlier converted. The 7.0% Debentures may not be redeemed at the Company’s election prior to the stated maturity date and the holders may not require the Company to r epurchase the 7.0% Debentures at any time. The 7.0% Debentures are not convertible prior to June 30, 2013, except under limited circumstances. Commencing on June 30, 2013, the 7.0% Debentures will be convertible into shares of our common stock at the option of the holder at any time, subject to certain exceptions and subject to our right to terminate such conversion rights under certain circumstances relating to the sale price of our common stock. If the holders elect to convert their 7.0% Debentures upon the occurrence of certain changes of control of CNO or certain other events, we will be required, under certain circumstances, to increase the conversion rate for such holders of the 7.0% Debentures who convert in connection with such events. Initially, the 7.0% Debentures will be convertible into 182.1494 shares of our common stock for each $1,000 principal amount of 7.0% Debentures, which is equivalent to an initial conversion price of approximate ly $5.49 per share. The conversion rate is subject to adjustment following the occurrence of certain events in accordance with the terms of the 7.0% Indenture.
The 7.0% Debenture provides for customary events of default (subject in certain cases to customary grace and cure periods), which include nonpayment, breach of covenants in the 7.0% Debenture, failure to pay at maturity or acceleration of other indebtedness and certain events of bankruptcy and insolvency. Generally, if an event of default occurs, Mellon or holders of at least 50% in principal amount of the then outstanding 7.0% Debentures may declare the principal of, and accrued but unpaid interest on all of the 7.0% Debentures to be immediately due and payable.
The 7.0% Indenture provides that on and after the date of the 7.0% Indenture, the Company may not: (i) consolidate with or merge into any other person or sell, convey, lease or transfer the Company’s consolidated properties and assets substantially as an entirety to any other person in any one transaction or series of related transactions; or (ii) permit any person to consolidate with or merge into the Company, unless certain requirements set forth in the 7.0% Indenture are satisfied.
In accordance with GAAP, we are required to consider on each issuance date whether the 7.0% Debentures issued on such date are issued with a beneficial conversion feature. A beneficial conversion feature will exist if the 7.0% Debentures may be convertible into common stock at an effective conversion price (calculated by dividing the proceeds from the issuance of 7.0% Debentures issued on that date (per $1,000 principal amount of debentures) by the then effective conversion rate) that is lower than the market price of a share of common stock on the date of issuance. When a beneficial conversion feature exists, we are required to separately recognize the beneficial conversion feature at issuance by allocating a portion of the proceeds to the intrinsic value of that feature. The value of the beneficial conv ersion feature is recorded, net of taxes, as an increase to additional paid-in capital. If a beneficial conversion feature exists on the actual date(s) of issuance, a discount equal to the intrinsic value of the beneficial conversion feature will be recorded against the carrying value of the 7.0% Debentures. Such discount will be amortized from the actual date(s) of issuance to the stated maturity date of the 7.0% Debentures using the effective interest method. Accordingly, the interest expense we recognize related to the 7.0% Debentures will be dependent upon whether a beneficial conversion feature exists on the actual date(s) of issuance and the amount by which the market price(s) of our common stock exceeds the effective conversion price on such actual date(s) of issuance.
The closing market price of our common stock on May 4, 2010 (the last closing price prior to the issuance of $52.5 million of the 7.0% Debentures) was $5.81. Because this amount was higher than the effective conversion price of $5.17 on that date, a beneficial conversion feature existed with respect to the 7.0% Debentures we issued. The beneficial conversion feature related to the 7.0% Debentures issued on May 5, 2010 of $4.0 million, net of tax, was recorded as an increase to additional paid-in capital.
CNO FINANCIAL GROUP, INC. AND SUBSIDIARIES
Notes to Consolidated Financial Statements
___________________
New Senior Secured Credit Agreement
On December 21, 2010, the Company entered into a $375 million senior secured term loan facility maturing on September 30, 2016, pursuant to an agreement among the Company, Morgan Stanley Senior Funding, Inc., as administrative agent (the “Agent”), and the lenders from time to time party thereto (the “New Senior Secured Credit Agreement”). The net proceeds of $363.6 million were used to repay a portion of the amount outstanding under our Second Amended and Restated Credit Agreement dated as of October 10, 2006 among CNO, Bank of America, N.A. as agent, J.P. Morgan Chase Bank, N.A., as Syndication Agent and other parties (the “Previous Senior Credit Agreement”).
The interest rate applicable to the New Senior Secured Credit Agreement is, at our option (in most instances), a Eurodollar rate of Libor plus 6.00 percent (subject to a Libor “floor” of 1.5 percent) or a Base Rate plus 5.00 percent (subject to a Base Rate “floor” of 2.5 percent). The pricing terms for the New Senior Secured Credit Agreement included upfront fees of 1.25 percent paid to the lenders. At December 31, 2010, the interest rate on our New Senior Secured Credit Agreement was 7.5 percent. The New Senior Secured Credit Agreement is guaranteed by our primary non-insurance company subsidiaries, as defined in the New Senior Secured Credit Agreement (collectively, the “Subsidiary Guarantors”) and secured by substantially all of our and the Subsidiary Guarantors̵ 7; assets.
The New Senior Credit Agreement contains covenants that limit the Company’s ability to take certain actions and perform certain activities, including (each subject to exceptions as set forth in the New Senior Credit Agreement):
| · | limitations on debt (including, without limitation, guarantees and other contingent obligations); |
| · | limitations on issuances of disqualified capital stock; |
| · | limitations on liens and further negative pledges; |
| · | limitations on sales, transfers and other dispositions of assets; |
| · | limitations on transactions with affiliates; |
| · | limitations on changes in the nature of the Company’s business; |
| · | limitations on mergers, consolidations and acquisitions; |
| · | limitations on dividends and other distributions, stock repurchases and redemptions and other restricted payments; |
| · | limitations on investments and acquisitions; |
| · | limitations on prepayment of certain debt; |
| · | limitations on modifications or waivers of certain debt documents and charter documents; |
| · | investment portfolio requirements for insurance subsidiaries; |
| · | limitations on restrictions affecting subsidiaries; |
| · | limitations on holding company activities; and |
| · | limitations on changes in accounting policies. |
In addition, the New Senior Secured Credit Agreement requires the Company to maintain: (i) a debt to total capitalization ratio of not more than 30 percent (such ratio was 19.99 percent at December 31, 2010); (ii) an interest coverage ratio of not less than 2.00 to 1.00 for each rolling four quarters (or, if less, the number of full fiscal quarters commencing after the effective date of the New Senior Secured Credit Agreement) (such ratio was not applicable for the period ended December 31, 2010); (iii) an aggregate ratio of total adjusted capital to company action level risk-based capital for the Company’s insurance subsidiaries of not less than 225 percent on or prior to December 31, 2011 and 250 percent thereafter
CNO FINANCIAL GROUP, INC. AND SUBSIDIARIES
Notes to Consolidated Financial Statements
___________________
(such ratio was 332 percent at December 31, 2010); and (iv) a combined statutory capital and surplus for the Company’s insurance subsidiaries of at least $1,200.0 million (combined statutory capital and surplus at December 31, 2010, was $1,596.4 million).
We may prepay, in whole or in part, the New Senior Secured Credit Agreement, together with any accrued and unpaid interest, with prior notice but without premium or penalty in minimum amounts of $1.0 million or any multiple thereof.
Mandatory prepayments of the New Senior Secured Credit Agreement will be required in an amount equal to: (i) 100 percent of the net cash proceeds from certain asset sales or casualty events; (ii) 100 percent of the net cash proceeds received by the Company or any of its subsidiaries from certain debt issuances; (iii) 50 percent of the net cash proceeds received from certain equity issuances; and (iv) 100 percent of the amount of certain restricted payments made (including any common stock dividends and share repurchases) as defined in the New Senior Secured Credit Agreement.
Notwithstanding the foregoing, no mandatory prepayments pursuant to items (i) or (iii) in the preceding paragraph shall be required if: (x) the debt to total capitalization ratio is equal or less than 20 percent; and (y) either (A) the financial strength rating of certain insurance subsidiaries is equal or better than A- (stable) from A.M. Best Company or (B) the New Senior Secured Credit Agreement is rated equal or better than BBB- (stable) from S&P and Baa3 (stable) by Moody’s.
In connection with the execution of the New Senior Secured Credit Agreement, the Company and the Subsidiary Guarantors entered into a guarantee and security agreement, dated as of December 21, 2010 (the “Guarantee and Security Agreement”), by and among the Company, the Subsidiary Guarantors and the Agent, pursuant to which the Subsidiary Guarantors guaranteed all of the obligations of the Company under the New Senior Secured Credit Agreement and the Company and the Subsidiary Guarantors pledged substantially all of their assets to secure the New Senior Secured Credit Agreement, subject to certain exceptions as set forth in the Guarantee and Security Agreement.
9.0% Senior Secured Notes
On December 21, 2010, we issued $275.0 million aggregate principal amount of 9.00% Senior Secured Notes due 2018 (the “9.0% Senior Secured Notes”). The net proceeds of $267.0 million were used to repay a portion of the amount outstanding under the Previous Senior Credit Agreement.
The 9.0% Senior Secured Notes were issued pursuant to an Indenture, dated as of December 21, 2010 (the “Indenture”), by and among the Company, the Subsidiary Guarantors and Wilmington Trust FSB, as trustee and collateral agent (“Wilmington”).
The 9.0% Senior Secured Notes will mature on January 15, 2018. Interest on the 9.0% Senior Secured Notes accrues at a rate of 9.0% per annum and is payable semiannually in arrears on January 15 and July 15 of each year, commencing on July 15, 2011. The 9.0% Senior Secured Notes and the guarantees thereof (the “Guarantee”) are senior secured obligations of the Company and the Subsidiary Guarantors and rank equally in right of payment with all of the Company’s and the Subsidiary Guarantor’s existing and future senior obligations, and senior to all of the Company’s and the Subsidiary Guarantors’ existing and future subordinated indebtedness. The 9.0% Senior Secured Notes are secured by substantially all of the assets of the Company and the Subsidiary Guarantors, subject to certain exceptions. The 9.0% Senior Secured Notes and the Guarantees are pari passu to all of the Company’s and the Subsidiary Guarantors’ existing and future secured indebtedness under the New Senior Secured Credit Agreement.
The Company may redeem all or part of the 9.0% Senior Secured Notes beginning on January 15, 2014, at the redemption prices set forth in the Indenture. The Company may also redeem all or part of the 9.0% Senior Secured Notes at any time and from time to time prior to January 15, 2014, at a price equal to 100% of the aggregate principal amount of the 9.0% Senior Secured Notes to be redeemed plus a “make-whole” premium and accrued and unpaid interest. In addition, prior to January 15, 2014, the Company may redeem up to 35% of the aggregate principal amounts of the 9.0% Senior Secured Notes with the net cash proceeds of certain equity offerings at a price equal to 109.000% of the aggregate principal amount of the 9.0% Senior Secured Notes to be redeemed plus accrued and unpaid interest.
Upon the occurrence of a change of control (as defined in the Indenture), each holder of the 9.0% Senior Secured Notes may require the Company to repurchase all or a portion of the 9.0% Senior Secured Notes in cash at a price equal to 101% of the aggregate principal amount of the 9.0% Senior Secured Notes to be repurchased, plus accrued and unpaid interest, if any, to the date of repurchase.
CNO FINANCIAL GROUP, INC. AND SUBSIDIARIES
Notes to Consolidated Financial Statements
___________________
The Indenture contains covenants that, among other things, limit (subject to certain exceptions) the Company’s ability and the ability of the Company’s Restricted Subsidiaries (as defined in the Indenture) to:
| · | incur or guarantee additional indebtedness or issue preferred stock; |
| · | pay dividends or make other distributions to shareholders; |
| · | purchase or redeem capital stock or subordinated indebtedness; |
| · | incur restrictions on the Company’s ability and the ability of the Restricted Subsidiaries to pay dividends or make other payments to the Company; |
| · | sell assets, including capital stock of the Company’s subsidiaries; |
| · | consolidate or merge with or into other companies or transfer all or substantially all of the Company’s assets; and |
| · | engage in transactions with affiliates. |
The Indenture provides for customary events of default (subject in certain cases to customary grace and cure periods), which include nonpayment, breach of covenants in the Indenture, failure to pay at maturity or acceleration of other indebtedness, a failure to pay certain judgments and certain events of bankruptcy and insolvency. Generally, if an event of default occurs, Wilmington or holders of at least 25% in principal amount of the then outstanding 9.0% Senior Secured Notes may declare the principal of and accrued but unpaid interest, including any additional interest, on all of the 9.0% Senior Secured Notes to be due and payable.
In connection with the issuance of the 9.0% Senior Secured Notes and execution of the Indenture, the Company and the Subsidiary Guarantors entered into a security agreement, dated as of December 21, 2010 (the “Security Agreement”), by and among the Company, the Subsidiary Guarantors and Wilmington Trust FSB, as collateral agent, pursuant to which the Company and the Subsidiary Guarantors pledged substantially all of their assets to secure their obligations under the Indenture, subject to certain exceptions as set forth in the Security Agreement.
Intercreditor Agreement
In connection with the issuance of the 9.0% Senior Secured Notes and entry into the New Senior Secured Credit Agreement, the Agent and Wilmington, as collateral agent and authorized representative with respect to the 9.0% Senior Secured Notes, entered into an Intercreditor Agreement, dated as of December 21, 2010 (the “Intercreditor Agreement”), which sets forth agreements with respect to the first-priority liens granted by the Company and the Subsidiary Guarantors pursuant to the Indenture and the New Senior Secured Credit Agreement.
Under the Intercreditor Agreement, any actions that may be taken with respect to the collateral that secures the 9.0% Senior Secured Notes and the New Senior Secured Credit Agreement, including the ability to cause the commencement of enforcement proceedings against such collateral, to control such proceedings and to approve amendments to releases of such collateral from the lien of, and waive past defaults under, such documents relating to such collateral, will be at the direction of the authorized representative of the lenders under the New Senior Secured Credit Agreement until the earlier of: (i) the Company’s obligations under the New Senior Secured Credit Agreement (or refinancings thereof) are discharged; (ii) the date on which the outstanding principal amount of loans and commitments under the New Senior Secured C redit Agreement is less than $25.0 million; and (iii) 180 days after the occurrence of both an event of default under the Indenture and the authorized representative of the holders of the 9.0% Senior Secured Notes making certain representations as described in the Intercreditor Agreement, unless the authorized representative of the lenders under the New Senior Secured Credit Agreement has commenced and is diligently pursuing enforcement action with respect to the collateral or the grantor of the security interest in that collateral (whether the Company or the applicable Subsidiary Guarantor) is then a debtor under or with respect to (or otherwise subject to) any insolvency or liquidation proceeding.
CNO FINANCIAL GROUP, INC. AND SUBSIDIARIES
Notes to Consolidated Financial Statements
___________________
Previous Senior Credit Agreement
In December 2010, we repaid the $652.1 million outstanding principal balance under our Previous Senior Credit Agreement using: (i) the proceeds from the New Senior Secured Credit Agreement and the issuance of the 9.0% Senior Secured Notes; and (ii) available cash.
On March 30, 2009, we completed Amendment No. 2 to our Previous Senior Credit Agreement, which provided for, among other things: (i) additional margins between our then current financial status and certain financial covenant requirements through June 30, 2010; (ii) higher interest rates and the payment of a fee; (iii) new restrictions on the ability of the Company to incur additional indebtedness; and (iv) the ability of the lender to appoint a financial advisor at the Company’s expense.
Pursuant to its amended terms, the applicable interest rate on the Previous Senior Credit Agreement (based on either a Eurodollar or base rate) was increased. The Eurodollar rate was equal to LIBOR plus 4 percent with a minimum LIBOR rate of 2.5 percent (such rate was previously LIBOR plus 2 percent with no minimum rate). The base rate was equal to 2.5 percent plus the greater of: (i) the Federal funds rate plus .50 percent; or (ii) Bank of America’s prime rate. In addition, the amended agreement required the Company to pay a fee equal to 1 percent of the outstanding principal balance under the Senior Credit Agreement, which fee was added to the principal balance outstanding and was payable at the maturity of the facility. This 1 percent fee was reported as non-cash interest expense.
On December 22, 2009, the Company entered into Amendment No. 3 to our Previous Senior Credit Agreement, which provided for, among other things:
| · | the minimum risk-based capital ratio requirement was 200% through December 31, 2010 and was to increase to 225% for 2011 and 250% for 2012 (the risk-based capital requirement was previously scheduled to return to 250% after June 30, 2010); |
| · | the required minimum level of statutory capital and surplus was $1.1 billion through December 31, 2010 and was to increase to $1.2 billion for 2011 and $1.3 billion for 2012 (the required minimum level of statutory capital and surplus was previously scheduled to return to $1.27 billion after June 30, 2010); |
| · | the interest coverage ratio requirement was 1.50 through December 31, 2010 and was to increase to 1.75 for 2011 and 2.00 for 2012 (the interest coverage ratio requirement was previously scheduled to return to 2.00 after June 30, 2010); and |
| · | the debt to total capital ratio requirement was 32.5% though December 31, 2009 and decreased to 30% thereafter (the debt to total capital ratio requirement was previously scheduled to return to 30% after June 30, 2010). |
The Company also agreed to pay $150 million of the first $200 million of net proceeds from its public offering of common stock (as further discussed below) to the lenders and, in addition, to pay 50% of any net proceeds in excess of $200 million from the offering. The credit facility previously required the Company to pay 50% of the net proceeds of any equity issuance to the lenders.
The amendment modified the Company’s principal repayment schedule and eliminated any principal payments in 2010. There were no changes to the maturity date of October 10, 2013. The Company was previously required to make principal repayments equal to 1% of the initial principal balance each year, subject to certain adjustments, and to make additional principal repayments from excess cash flow.
The amendment also provided that the 1% payment in kind, or PIK, interest that had accrued since March 30, 2009 as an addition to the principal balance under the Previous Senior Credit Agreement was replaced with a payment of an equal amount of cash interest. The amount of accrued PIK interest ($6.3 million) was paid in cash when the amendment became effective. The deletion of the 1% PIK interest and the payment of an equal amount of cash interest did not impact reported interest expense.
On November 13, 2009, we repaid $36.8 million of outstanding principal on the Previous Senior Credit Agreement from the proceeds of the issuance of common stock and warrants to Paulson & Co. Inc. (“Paulson”). On December 22, 2009,
CNO FINANCIAL GROUP, INC. AND SUBSIDIARIES
Notes to Consolidated Financial Statements
___________________
the Company repaid $161.4 million of outstanding principal on the Previous Senior Credit Agreement from proceeds of an equity offering. Such transactions are further discussed in the note to the consolidated financial statements entitled “Shareholders’ Equity.”
During 2009 and 2008, we made scheduled principal payments totaling $5.3 million and $8.7 million, respectively, on our Previous Senior Credit Agreement. Also, during 2009, we made a mandatory prepayment of $1.2 million based on the Company’s excess cash flows at December 31, 2008 as defined in the Previous Senior Credit Agreement. There were $5.4 million of unamortized issuance costs (classified as other assets) related to our Previous Senior Credit Agreement at December 31, 2009.
In accordance with Amendment No. 3 to our Previous Senior Credit Agreement, the applicable interest rate on the Previous Senior Credit Agreement, payable at least quarterly, was based on either a Eurodollar rate or a base rate. The Eurodollar rate was equal to LIBOR plus 5 percent with a minimum LIBOR rate of 2.5 percent. The base rate was equal to 4 percent plus the greater of: (i) the Federal funds rate plus .50 percent; or (ii) Bank of America’s prime rate.
The Previous Senior Credit Agreement included an $80.0 million revolving credit facility that could be used for general corporate purposes. In October 2008, the Company borrowed $75.0 million under the revolving credit facility to assure the future availability of this additional liquidity given our concerns with the ability of certain financial institutions to be able to provide funding in the future. In December 2008, we repaid $20.0 million of the revolving facility and reduced the maximum amount available under the revolving facility to $60.0 million. In April 2009, we repaid the remaining $55.0 million that was outstanding under the revolving facility portion of our Previous Senior Credit Agreement. The Company paid a commitment fee equal to .50 percent of the unused portion of the revolvi ng credit facility on an annualized basis.
Senior Health Note
In connection with the Transfer, the Company issued the Senior Health Note payable to Senior Health. The Senior Health Note is unsecured and bears interest at a rate of 6.0 percent per year payable quarterly, beginning on March 15, 2009. We are required to make annual principal payments of $25.0 million beginning on November 12, 2009. The Company made a $25.0 million scheduled payment on the Senior Health Note in both 2010 and 2009. The Company may redeem the Senior Health Note, in whole or in part, at any time by giving the holder 30 days notice (unless a shorter notice is satisfactory to the holder). The redemption amount is equal to the principal amount redeemed plus any accrued and unpaid interest thereon. Any outstanding amount under the Senior Health Note will be due and payabl e immediately if an event of default (as defined in the Senior Health Note) occurs and continues without remedy. As a condition of the order from the Pennsylvania Insurance Department approving the Transfer, we agreed that we would not pay cash dividends on our common stock while any portion of the Senior Health Note remained outstanding.
Gain (Loss) on Extinguishment or Modification of Debt
In 2010, we recognized an aggregate loss on the extinguishment of debt totaling $6.8 million representing the write-off of unamortized discount and issuance costs associated with: (i) the repurchases of 3.5% Debentures; and (ii) the repayment of the Previous Senior Credit Agreement, each as previously described above.
In 2009, we recognized an aggregate loss on the extinguishment or modification of debt totaling $22.2 million resulting from expenses incurred and the write-off of unamortized discount or issuance costs related to the following transactions which are described above: (i) the Tender Offer; (ii) repayment of principal amounts on the Previous Senior Credit Agreement from the issuance of common stock; and (iii) modifications to our Previous Senior Credit Agreement in March 2009 and December 2009.
In 2008, we repurchased $37.0 million par value of the 3.5% Debentures for $15.3 million plus accrued interest and recognized a gain on the extinguishment of debt of $21.2 million related to such repurchases.
CNO FINANCIAL GROUP, INC. AND SUBSIDIARIES
Notes to Consolidated Financial Statements
___________________
Scheduled Debt Repayments
The scheduled repayment of our direct corporate obligations is as follows (dollars in millions):
| 2011 | | $ | 55.0 | |
| 2012 | | | 65.0 | |
| 2013 | | | 80.0 | |
| 2014 | | | 75.0 | |
| 2015 | | | 85.0 | |
| 2016 | | | 383.0 | |
| 2018 | | | 275.0 | |
| | | | | |
| | | $ | 1,018.0 | |
| 8. | COMMITMENTS AND CONTINGENCIES |
Litigation and Other Legal Proceedings
The Company and its subsidiaries are involved in various legal actions in the normal course of business, in which claims for compensatory and punitive damages are asserted, some for substantial amounts. Some of the pending matters have been filed as purported class actions and some actions have been filed in certain jurisdictions that permit punitive damage awards that are disproportionate to the actual damages incurred. The amounts sought in certain of these actions are often large or indeterminate and the ultimate outcome of certain actions is difficult to predict. In the event of an adverse outcome in one or more of these matters, the ultimate liability may be in excess of the liabilities we have established and could have a material adverse effect on our business, financial condition, results of opera tions and cash flows. In addition, the resolution of pending or future litigation may involve modifications to the terms of outstanding insurance policies or could impact the timing and amount of rate increases, which could adversely affect the future profitability of the related insurance policies. Although there can be no assurances, at the present time the Company does not anticipate that the ultimate liability from either pending or threatened legal actions, after consideration of existing loss provisions, will have a material adverse effect on the financial condition, operating results or cash flows of the Company.
In the cases described below, we have disclosed any specific dollar amounts sought in the complaints. In our experience, monetary demands in complaints bear little relation to the ultimate loss, if any, to the Company. However, for the reasons stated above, it is not possible to make meaningful estimates of the amount or range of loss that could result from some of these matters at this time. The Company reviews these matters on an ongoing basis. When assessing reasonably possible and probable outcomes, the Company bases its assessment on the expected ultimate outcome following all appeals.
Securities Litigation
After our Predecessor announced its intention to restructure on August 9, 2002, eight purported securities fraud class action lawsuits were filed in the United States District Court for the Southern District of Indiana. The complaints named us as a defendant, along with certain of our former officers. These lawsuits were filed on behalf of persons or entities who purchased our Predecessor’s common stock on various dates between October 24, 2001 and August 9, 2002. The plaintiffs allege claims under Sections 10(b) and 20(a) of the Securities Exchange Act of 1934, as amended, and allege material omissions and dissemination of materially misleading statements regarding, among other things, the liquidity of our Predecessor and alleged problems in Conseco Finance Corp.’s manufactured housing divisi on, allegedly resulting in the artificial inflation of our Predecessor’s stock price. These cases were consolidated into one case in the United States District Court for the Southern District of Indiana, captioned Franz Schleicher, et al. v. Conseco, Inc., Gary Wendt, William Shea, Charles Chokel and James Adams, et al., Case No. 02-CV-1332 DFH-TAB. The complaint seeks an unspecified amount of damages. The plaintiffs filed an amended consolidated class action complaint with respect to the individual defendants on December 8, 2003. Our liability with respect to this lawsuit was discharged in our Predecessor’s plan of reorganization and our obligation to indemnify individual defendants who were not serving as an officer or director on the Effective Date is limited to $3 million in the aggregate under such plan. Our liability to indemnify individual defendants who were serving as an office r or director on the Effective Date, of which there is one such defendant, is not limited by such plan. The parties to this case have reached a settlement, which was approved by the court. The Company did not incur any additional liability in connection with the settlement.
CNO FINANCIAL GROUP, INC. AND SUBSIDIARIES
Notes to Consolidated Financial Statements
___________________
On August 6, 2009, a purported class action complaint was filed in the United States District Court for the Southern District of New York, Plumbers and Pipefitters Local Union No. 719 Pension Trust Fund, on behalf of itself and all others similarly situated v. Conseco, Inc., et al., Case No. 09-CIV-6966, on behalf of purchasers of our common stock during the period from August 4, 2005 to March 17, 2008 (the “Class Period”). The complaint charges CNO and certain of its officers and directors with violations of the Securities Exchange Act of 1934. On June 2, 2010, the plaintiff filed a second amended complaint. The amended complaint alleges that, during the Class Period, the defendants issued numerous statements regarding the Company’ ;s financial performance. As alleged in the complaint, these statements were materially false and misleading because the defendants misrepresented and/or failed to disclose the following adverse facts, among others: (i) that the Company was reporting materially inaccurate revenue figures; (ii) that the Company’s reported financial results were materially misstated and did not present the true operating performance of the Company; (iii) that the Company’s shareholders’ equity was materially overstated during the Class Period, including the overstatement of shareholders’ equity by $20.6 million at December 31, 2006; and (iv) as a result of the foregoing, the defendants lacked a reasonable basis for their positive statements about the Company, its corporate governance practices, its prospects and earnings growth. On August 2, 2010, we filed a motion to dismiss the amended complaint. We believe the action is without merit and intend to defend it vigorously. � 0;The ultimate outcome of the action cannot be predicted with certainty.
On June 2, 2010, a purported shareholder derivative complaint was filed in the Marion County Circuit/Superior Court, Indiana, William T. Carter, derivatively on behalf of CNO Financial Group, Inc. v. R. Glenn Hilliard, Donna A. James, R. Keith Long, Debra J. Perry, C. James Prieur, Neal C. Schneider, Michael T. Tokarz, John G. Turner, William Kirsch, Eugene Bullis, Michael Dubes, James Hohmann, Edward Bonach, Ali Inanilan, and John Wells, and CNO Financial Group, Inc., Cause No. 49D10 10 06 PL 024523, on behalf of nominal defendant CNO Financial Group, Inc. against certain current and/or former members of its Board of Directors and executive officers seeking to remedy defendant’s alleged breaches of fiduciary duties and unjust enrichment from August 2005 to the present. On November 1, 2010, the plaintiffs filed an amended complaint. The allegations in the complaint are similar to those described in the preceding paragraph. On December 17, 2010, we filed a motion to dismiss the amended complaint. We believe the action is without merit, and intend to defend it vigorously. The ultimate outcome of the action cannot be predicted with certainty.
Cost of Insurance Litigation
Two lawsuits are pending in Hawaii captioned AE Ventures for Archie Murakami, et al. v. Conseco, Inc., Conseco Life Insurance Company; and Doe Defendants 1-100, Case No. CV05-00594 and Clifford S. Arakaki et al. v. Conseco Life Insurance Company, Doe Defendants 1-100, Case No. CV05-00026 (United States District Court, District of Hawaii). These suits involve an aggregate of approximately 700 plaintiffs all of whom purport to have opted out of the previously settled In Re Conseco Life Insurance Co. Cost of Insurance Litigation multi-district action. The complaints allege nondisclosure, breach of fiduciary duty, violations of HRS 480 (unfair and/or deceptive business practices), declaratory and injunctive relief, insurance bad faith, punitive damages, and seeks to impose alter ego liability. A settlement in principle has been reached. The ultimate outcome of these lawsuits cannot be predicted with certainty and an adverse outcome could exceed the amount we have accrued and could have a material adverse impact on the Company’s consolidated financial condition, cash flows or results of operations.
Other Litigation
On November 17, 2005, a complaint was filed in the United States District Court for the Northern District of California, Robert H. Hansen, an individual, and on behalf of all others similarly situated v. Conseco Insurance Company, an Illinois corporation f/k/a Conseco Annuity Assurance Company, Cause No. C0504726. Plaintiff in this putative class action purchased an annuity in 2000 and is claiming relief on behalf of the proposed national class for alleged violations of the Racketeer Influenced and Corrupt Organizations Act; elder abuse; unlawful, deceptive and unfair business practices; unlawful, deceptive and misleading advertising; breach of fiduciary duty; aiding and abetting of breach of fiduciary duty; and unjust enrichment and imposition of constructive trust.� 0; On January 27, 2006, a similar complaint was filed in the same court entitled Friou P. Jones, on Behalf of Himself and All Others Similarly Situated v. Conseco Insurance Company, an Illinois company f/k/a Conseco Annuity Assurance Company, Cause No. C06-00537. Mr. Jones had purchased an annuity in 2003. Each case alleged that the annuity sold was inappropriate and that the annuity products in question are inherently unsuitable for seniors age 65 and older. On March 3, 2006 a first amended complaint was filed in the Hansen case adding causes of action for fraudulent concealment and breach of the duty of good faith and fair dealing. In an order dated April 14, 2006, the court consolidated the two cases under the original Hansen cause number and retitled the consolidated action: In re Conseco Insurance Co. Annuity Marketing & Sales Practice s Litig. A settlement in principle has been reached in this case, and the hearing for preliminary approval of the settlement is set for March 25, 2011.
CNO FINANCIAL GROUP, INC. AND SUBSIDIARIES
Notes to Consolidated Financial Statements
___________________
On March 4, 2008, a complaint was filed in the United States District Court for the Central District of California, Celedonia X. Yue, M. D. on behalf of the class of all others similarly situated, and on behalf of the General Public v. Conseco Life Insurance Company, successor to Philadelphia Life Insurance Company and formerly known as Massachusetts General Life Insurance Company, Cause No. CV08-01506 CAS. Plaintiff in this putative class action owns a Valulife universal life policy insuring the life of Ruth S. Yue originally issued by Massachusetts General Life Insurance Company in 1995. Plaintiff is claiming breach of contract on behalf of the proposed national class and seeks injunctive and restitutionary relief pursuant to California Business & Profes sions Code Section 17200 and declaratory relief. The putative class consists of all owners of Valulife and Valuterm universal life insurance policies issued by either Massachusetts General or Philadelphia Life and that were later acquired and serviced by Conseco Life. Plaintiff alleges that members of the class will be damaged by increases in the cost of insurance (a non-guaranteed element) that are set to take place in the twenty first policy year of Valulife and Valuterm policies. No such increases have yet been applied to the subject policies. During 2010, Conseco Life voluntarily agreed not to implement the cost of insurance rate increase at issue in this litigation and is following a process with respect to any future cost of insurance rate increases as set forth in the regulatory settlement agreement described below. Plaintiff filed a motion for certification of a nationwide class and a California state class. On December 7, 2009, the court gr anted that motion. On October 8, 2010, the court dismissed the causes of actions alleged in the California state class. On January 19, 2011, the court granted the plaintiff’s motion for summary judgment as to the declaratory relief claim and on February 2, 2011, the court issued an advisory opinion, in the form of a declaratory judgment, as to what, in its view, Conseco Life could consider in implementing future cost of insurance rate increases related to its Valulife and Valuterm block of policies. On February 17, 2011, Conseco Life filed notice that it is appealing the court’s decision. We believe the action is without merit, and intend to defend it vigorously. The ultimate outcome of the action cannot be predicted with certainty.
On December 8, 2008, a purported Florida state class action was filed in the U.S. District Court for the Southern District of Florida, Sydelle Ruderman individually and on behalf of all other similarly situated v. Washington National Insurance Company, Case No. 08-23401-CIV-Cohn/Selzer. In the complaint, plaintiff alleges that the inflation escalation rider on her policy of long-term care insurance operates to increase the policy’s lifetime maximum benefit, and that Washington National breached the contract by stopping her benefits when they reached the lifetime maximum. The Company takes the position that the inflation escalator only affects the per day maximum benefit. Plaintiffs filed their motion for class certification, and the motion has been fully briefed by both sides. The court has not yet ruled on the motion or set it for hearing. Additional parties have asked the court to allow them to intervene in the action, and on January 5, 2010, the court granted the motion to intervene and granted the plaintiff’s motion for class certification. The court certified a (B) (3) Florida state class alleging damages and a (B) (2) Florida state class alleging injunctive relief. The parties have reached a settlement in principle of the (B) (3) class. The plaintiffs filed a motion for summary judgment as to the (B) (2) class which was granted by the court on September 8, 2010. The Company filed a notice of appeal on October 6, 2010. We believe the action is without merit, and intend to defend it vigorously. The ultimate outcome of the action cannot be predicted with certainty.
On December 24, 2008, a purported class action was filed in the U.S. District Court for the Northern District of California, Cedric Brady, et. al. individually and on behalf of all other similarly situated v. Conseco, Inc. and Conseco Life Insurance Company Case No. 3:08-cv-05746. The plaintiffs allege that Conseco Life and Conseco, Inc. committed breach of contract and insurance bad faith and violated various consumer protection statutes in the administration of various interest sensitive whole life products sold primarily under the name “Lifetrend” by requiring the payment of additional cash amounts to maintain the policies in force and by making changes to certain non-guaranteed elements in their policies. On April 23, 2009, the plaintiffs filed an amended complaint adding the additional counts of breach of fiduciary duty, fraud, negligent misrepresentation, conversion and declaratory relief. On May 29, 2009, Conseco, Inc. and Conseco Life filed a motion to dismiss the amended complaint. On July 29, 2009, the court granted in part and denied in part the motion to dismiss. The court dismissed the allegations that Conseco Life violated various consumer protection statutes, the breach of fiduciary duty count, and dismissed Conseco, Inc. for lack of personal jurisdiction. On October 15, 2009, Conseco Life filed a motion with the Judicial Panel on Multidistrict Litigation (“MDL”), seeking the establishment of an MDL proceeding consolidating this case and the McFarland case described below into a single action. On February 3, 2010, the Judicial Panel on MDL ordered this case be consolidated for pretrial proceedings. On July 7, 2010, plaintiffs filed an amended motion for class certification of a nationwide class and a California state class. The Company filed its motion in opposition on July 21, 2010. On October 6, 2010, the court granted the motion for certification of a nationwide class and denied the motion for certification of a California state class. Trial is set for May 7, 2012. The Company believes the action is without merit and intends to defend it vigorously. The ultimate outcome of the action cannot be predicted with certainty.
CNO FINANCIAL GROUP, INC. AND SUBSIDIARIES
Notes to Consolidated Financial Statements
___________________
On July 2, 2009, a purported class action was filed in the U.S. District Court for the Middle District of Florida, Bill W. McFarland, and all those similarly situated v. Conseco Life Insurance Company, Case No. 3:09-cv-598-J-32MCR. The plaintiff alleges that Conseco Life committed breach of contract and has been unjustly enriched in the administration, including changes to certain non-guaranteed elements, of various interest sensitive whole life products sold primarily under the name “Lifetrend.” The plaintiff seeks declaratory and injunctive relief, compensatory damages, punitive damages and attorney fees. As described in the preceding paragraph, on February 3, 2010, the Judicial Panel on MDL ordered this case be consolidated with the B rady case for pretrial proceedings in the Northern District of California Federal Court. On July 7, 2010, plaintiffs filed an amended motion for class certification of a nationwide class and a California state class. The Company filed its motion in opposition on July 21, 2010. On October 6, 2010, the court granted the motion for certification of a nationwide class and denied the motion for certification of a California state class. Trial is set for May 7, 2012. The Company believes the action is without merit and intends to defend it vigorously. The ultimate outcome of the action cannot be predicted with certainty.
On January 26, 2009, a purported class action complaint was filed in the United States District Court for the Northern District of Illinois, Samuel Rowe and Estella Rowe, individually and on behalf of themselves and all others similarly situated v. Bankers Life & Casualty Company and Bankers Life Insurance Company of Illinois, Case No. 09CV491. The plaintiffs are alleging violation of California Business and Professions Code Sections 17200 et seq. and 17500 et seq., breach of common law fiduciary duty, breach of implied covenant of good faith and fair dealing and violation of California Welfare and Institutions Code Section 15600 on behalf of the proposed national class and seek injunctive relief, compensatory damages, punitive damages and attorney fees. T he plaintiff alleges that the defendants used an improper and misleading sales and marketing approach to seniors that fails to disclose all facts, misuses consumers’ confidential financial information, uses misleading sales and marketing materials, promotes deferred annuities that are fundamentally inferior and less valuable than readily available alternative investment products and fails to adequately disclose other principal risks including maturity dates, surrender penalties and other restrictions which limit access to annuity proceeds to a date beyond the applicants actuarial life expectancy. Plaintiffs have amended their complaint attempting to convert this from a California only class action to a national class action. In addition, the amended complaint adds causes of action under the Racketeer Influenced and Corrupt Organization Act (“RICO”); aiding and abetting breach of fiduciary duty and for unjust enrichment. On September 13, 2010, the court dismi ssed the plaintiff’s RICO claims. On October 25, 2010, the plaintiffs filed a second amended complaint re-alleging their RICO claims. A hearing date on the motion for class certification has not been set. We believe the action is without merit, and intend to defend it vigorously. The ultimate outcome of the action cannot be predicted with certainty.
In addition, the Company and its subsidiaries are involved on an ongoing basis in other lawsuits, including purported class actions, related to their operations. The ultimate outcome of all of these other legal matters pending against the Company or its subsidiaries cannot be predicted, and, although such lawsuits are not expected individually to have a material adverse effect on the Company, such lawsuits could have, in the aggregate, a material adverse effect on the Company’s consolidated financial condition, cash flows or results of operations.
Regulatory Examinations and Fines
Insurance companies face significant risks related to regulatory investigations and actions. Regulatory investigations generally result from matters related to sales or underwriting practices, payment of contingent or other sales commissions, claim payments and procedures, product design, product disclosure, additional premium charges for premiums paid on a periodic basis, denial or delay of benefits, charging excessive or impermissible fees on products, changing the way cost of insurance charges are calculated for certain life insurance products or recommending unsuitable products to customers. We are, in the ordinary course of our business, subject to various examinations, inquiries and information requests from state, federal and other authorities. The ultimate outcome of these regulatory actions canno t be predicted with certainty. In the event of an unfavorable outcome in one or more of these matters, the ultimate liability may be in excess of liabilities we have established and we could suffer significant reputational harm as a result of these matters, which could also have a material adverse effect on our business, financial condition, results of operations or cash flows.
The states of Pennsylvania, Illinois, Texas, Florida and Indiana led a multistate examination of the long-term care claims administration and complaint handling practices of Senior Health and Bankers Life, as well as the sales and marketing practices of Bankers Life. On May 7, 2008, we announced a settlement among the state insurance regulators and Senior Health and Bankers Life. This examination covered the years 2005, 2006 and 2007. More than 40 states are parties to the settlement, which included a Senior Health fine of up to $2.3 million, with up to an additional $10 million payable, on the part of either Senior Health and/or Bankers Life, in the event the process improvements and benchmarks are not met. The
CNO FINANCIAL GROUP, INC. AND SUBSIDIARIES
Notes to Consolidated Financial Statements
___________________
process improvement plan is being monitored by the lead states and pursuant to the settlement agreement, the lead states are conducting a re-examination of Bankers Life to confirm compliance with the process improvements and benchmarks.
In late October 2008, Conseco Life mailed notice to approximately 12,000 holders of its “Lifetrend” life insurance products to inform them of: (i) changes to certain “non-guaranteed elements” (“NGEs”) of their policies; and (ii) the fact that certain policyholders who were not paying premiums may have failed to receive a notice that their policy was underfunded and that additional premiums were required in order for the policyholders to maintain their guaranteed cash values. In December 2008, Conseco Life mailed notice to approximately 16,000 holders of its CIUL3+ universal life policies to inform them of an increase in certain NGEs with respect to their policies. Prior to or around the time that the notices were sent, Conseco Life had informed the insurance regulators in a number of states, including among others Indiana, Iowa and Florida, of these matters and the planned communication with the impacted policyholders. Several states initiated regulatory actions and inquiries after the notices were sent by Conseco Life, and Conseco Life agreed to take no further actions with respect to those policies during the pendency of a market conduct examination.
After working with various state insurance regulators to review the terms of the Lifetrend and CIUL3+ policies, Conseco Life reached a settlement in principle with the regulators regarding issues involving these policies. During this regulatory review process, Conseco Life had been allowed to move forward with implementing the NGE changes in its CIUL3+ policies while the regulators continued their review. Conseco Life had also resumed the administration of its Lifetrend policies with administrative changes in place but did not implement the NGE changes pending execution of the final settlement agreement with the regulators. On June 30, 2010, we announced that Conseco Life had finalized a regulatory settlement agreement that requires the establishment of a $10 million fund for certain owners of its Lifetrend life ins urance products and the payment of a $1 million assessment to participating jurisdictions. Over 45 jurisdictions, representing almost 98 percent of the Lifetrend policyholders, have signed the settlement agreement. Conseco Life is in the process of notifying consumers of the settlement and the increase in their non-guaranteed elements. As previously disclosed, we accrued for the financial impact of the settlement in our consolidated financial statements for year-end 2009.
Guaranty Fund Assessments
The balance sheet at December 31, 2010, included: (i) accruals of $21.8 million, representing our estimate of all known assessments that will be levied against the Company’s insurance subsidiaries by various state guaranty associations based on premiums written through December 31, 2010; and (ii) receivables of $16.2 million that we estimate will be recovered through a reduction in future premium taxes as a result of such assessments. At December 31, 2009, such guaranty fund assessment accruals were $22.1 million and such receivables were $16.9 million. These estimates are subject to change when the associations determine more precisely the losses that have occurred and how such losses will be allocated among the insurance companies. We recognized expense for such assessments of $2.4 million, $.3 m illion and $3.1 million in 2010, 2009 and 2008, respectively.
Guarantees
We held bank loans made to certain former directors and employees that enabled them to purchase common stock of our Predecessor. These loans, with a principal amount of $481.3 million, had been guaranteed by our Predecessor. We received all rights to collect the balances due pursuant to the original terms of these loans. In addition, we held loans to participants for interest on the loans. The loans and the interest loans are collectively referred to as the “D&O loans.” At December 31, 2010, we had reached settlements with the former directors and employees and had collected the remaining amounts outstanding related to the D&O loan settlements.
Pursuant to the settlement that was reached with the Official Committee of the Trust Originated Preferred Securities (“TOPrS”) Holders and the Official Committee of Unsecured Creditors in the Plan, the former holders of TOPrS (issued by our Predecessor’s subsidiary trusts and eliminated in our reorganization) who did not opt out of the bankruptcy settlement, were entitled to receive 45 percent of any net proceeds from the collection of certain D&O loans in an aggregate amount not to exceed $30 million. As of December 31, 2010, we had paid $20.5 million to the former holders of TOPrS and we have established a liability of $2.0 million (which is included in other liabilities), representing the final amount which will be paid to the former holders of TOPrS pursuant to the settlement.
In accordance with the terms of the employment agreements of two of the Company’s former chief executive officers, certain wholly-owned subsidiaries of the Company are the guarantors of the former executives’ nonqualified supplemental retirement benefits. The liability for such benefits was $22.6 million and $22.0 million at December 31, 2010 and 2009,
CNO FINANCIAL GROUP, INC. AND SUBSIDIARIES
Notes to Consolidated Financial Statements
___________________
respectively, and is included in the caption “Other liabilities” in the consolidated balance sheet.
Leases and Certain Other Long-Term Commitments
The Company rents office space, equipment and computer software under noncancellable operating lease agreements. In addition, the Company has entered into certain sponsorship agreements which require future payments. Total expense pursuant to these lease and sponsorship agreements was $42.8 million, $42.3 million and $44.1 million in 2010, 2009 and 2008, respectively. Future required minimum payments as of December 31, 2010, were as follows (dollars in millions):
| 2011 | | $ | 45.0 | |
| 2012 | | | 33.8 | |
| 2013 | | | 27.0 | |
| 2014 | | | 20.7 | |
| 2015 | | | 17.4 | |
| Thereafter | | | 45.6 | |
| | | | | |
| Total | | $ | 189.5 | |
Agent Deferred Compensation Plan
For our agent deferred compensation plan and postretirement plans, it is our policy to immediately recognize changes in the actuarial benefit obligation resulting from either actual experience being different than expected or from changes in actuarial assumptions.
One of our insurance subsidiaries has a noncontributory, unfunded deferred compensation plan for qualifying members of its career agency force. Benefits are based on years of service and career earnings. The actuarial measurement date of this deferred compensation plan is December 31. The liability recognized in the consolidated balance sheet for the agents’ deferred compensation plan was $114.4 million and $106.3 million at December 31, 2010 and 2009, respectively. Costs incurred on this plan were $13.0 million, $11.9 million and $7.7 million during 2010, 2009 and 2008, respectively (including the recognition of gains (losses) of $(3.6) million, $(3.3) million and $.6 million in 2010, 2009 and 2008, respectively, resulting from actual experience being different than expected or from changes in actuarial assumptions). The estimated net loss for the agent deferred compensation plan that will be amortized from accumulated other comprehensive income (loss) into the net periodic benefit cost during 2011 is $.8 million. In 2006, we purchased Company-owned life insurance (“COLI”) as an investment vehicle to fund the agent deferred compensation plan. The COLI assets are not assets of the agent deferred compensation plan, and as a result, are accounted for outside the plan and are recorded in the consolidated balance sheet as other invested assets. The carrying value of the COLI assets was $102.7 million and $78.0 million at December 31, 2010 and 2009, respectively. Changes in the cash surrender value (which approximates net realizable value) of the COLI assets are recorded as net investment income.
We used the following assumptions for the deferred compensation plan to calculate:
| | | 2010 | | | 2009 | |
| | | | | | | |
| Benefit obligations: | | | | | | |
Discount rate | | | 5.50 | % | | | 5.75 | % |
| | | | | | | | | |
| Net periodic cost: | | | | | | | | |
Discount rate | | | 5.75 | % | | | 6.03 | % |
The discount rate is based on the yield of a hypothetical portfolio of high quality debt instruments which could effectively settle plan benefits on a present value basis as of the measurement date. At December 31, 2010, for our deferred compensation plan for qualifying members of our career agency force, we assumed a 5 percent annual increase in compensation until the participant’s normal retirement date (age 65 and completion of five years of service).
CNO FINANCIAL GROUP, INC. AND SUBSIDIARIES
Notes to Consolidated Financial Statements
___________________
The benefits expected to be paid pursuant to our agent deferred compensation plan as of December 31, 2010 were as follows (dollars in millions):
| 2011 | | $ | 4.7 | |
| 2012 | | | 4.8 | |
| 2013 | | | 5.4 | |
| 2014 | | | 5.8 | |
| 2015 | | | 6.3 | |
| 2016 – 2020 | | | 36.5 | |
The Company has qualified defined contribution plans for which substantially all employees are eligible. Company contributions, which match certain voluntary employee contributions to the plan, totaled $4.1 million, $4.2 million and $4.4 million in 2010, 2009 and 2008, respectively. Employer matching contributions are discretionary.
Reclassification Adjustments Included in Accumulated Other Comprehensive Income (Loss)
The changes in unrealized appreciation (depreciation) included in accumulated other comprehensive income (loss) are net of reclassification adjustments for after-tax net gains (losses) from the sale of investments included in net income (loss) of approximately $(175) million, $(593) million and $(19) million for the years ended December 31, 2010, 2009 and 2008, respectively.
In December 2009, we completed the public offering, including underwriter over-allotments, of 49.5 million shares of our common stock at an offering price of $4.75 per share. The net proceeds to the Company from the offering, after deducting underwriting commissions and discounts and offering expenses totaled $222.7 million. The Company used $161.4 million of the net proceeds from the offering to reduce its indebtedness under its Previous Senior Credit Agreement and the remaining net proceeds were used for general corporate purposes.
In November 2009, we completed the private sale of 16.4 million shares of our common stock and warrants to purchase 5.0 million shares of our common stock to Paulson on behalf of several investment funds and accounts managed by Paulson. The net proceeds to the Company from the private placement, after deducting financial advisory fees and other offering expenses, totaled $73.6 million. The Company used $36.8 million of the net proceeds from the private placement to reduce its indebtedness under its Previous Senior Credit Agreement and used $10.5 million to fund the portion of the settlement of the Tender Offer that was not funded by the issuance of the 7.0% Debentures, as further described in the note to the consolidated financial statements entitled “Notes Payable – Direct Corporate Obligations”. The remaining proceeds were used: (i) to pay a portion of the purchase price of the 3.5% Debentures that were repurchased by us in 2010; and (ii) for general corporate purposes.
In November 2009, concurrently with the completion of the private placement of our common stock and warrants, we entered into an investor rights agreement with Paulson, pursuant to which we granted to Paulson, among other things, certain registration rights with respect to certain securities and certain preemptive rights, and Paulson agreed to, among other things, certain restrictions on transfer of certain securities, certain voting limitations and certain standstill provisions.
The warrants have an exercise price of $6.50 per share of common stock, subject to customary anti-dilution adjustments. Prior to June 30, 2013, the warrants are not exercisable, except under limited circumstances. Commencing on June 30, 2013, the warrants will be exercisable for shares of our common stock at the option of the holder at any time, subject to certain exceptions. The warrants expire on December 30, 2016.
Prior to completing the private placement with Paulson, our board of directors deemed Paulson an “Exempted Entity” and therefore not an “Acquiring Person” for purposes of our Section 382 Rights Agreement, with respect to the 16.4 million shares of common stock, any shares of common stock issued upon exercise of the warrants, any common stock issued upon conversion of the 7.0% Debentures owned by Paulson, as well as the shares of common stock Paulson owned prior to the private placement. See the note to the consolidated financial statements entitled “Income Taxes” for more information on the Section 382 Rights Agreement.
CNO FINANCIAL GROUP, INC. AND SUBSIDIARIES
Notes to Consolidated Financial Statements
___________________
Pursuant to the Plan, we issued warrants to purchase 6.0 million shares of our common stock (the “Series A Warrants”) entitling the holders to purchase shares of CNO common stock at a price of $27.60 per share. The Series A Warrants expired on September 10, 2008.
Changes in the number of shares of common stock outstanding were as follows (shares in thousands):
| | | 2010 | | | | 2009 | | | 2008 | | |
| | | | | | | | | | | | |
| Balance, beginning of year | | | 250,786 | | | | | 184,754 | | | | 184,652 | | |
| Issuance of common stock | | | - | | | | | 65,900 | | | | - | | |
| Shares issued under employee benefit compensation plans | | | 265 | | (a) | | | 132 | | | | 102 | | (a) |
| Stock options exercised | | | 33 | | | | | - | | | | - | | |
| | | | | | | | | | | | | | | |
| | | | | | | | | | | | | | | |
| Balance, end of year | | | 251,084 | | | | | 250,786 | | | | 184,754 | | |
____________________
| (a) | In 2010 and 2008, such amount was reduced by 74 thousand shares and 16 thousand shares, respectively, which were tendered for the payment of federal and state taxes owed on the issuance of restricted stock. |
The Company has a long-term incentive plan which permits the grant of CNO incentive or non-qualified stock options, restricted stock awards, stock appreciation rights, performance shares or units and certain other equity-based awards to certain directors, officers and employees of the Company and certain other individuals who perform services for the Company. In April 2009, the shareholders of the Company approved an increase in the number of shares authorized to be issued under the plan to a maximum of 25.8 million shares from 10 million shares. As of December 31, 2010, 9.3 million shares remained available for issuance under the plan. Our stock option awards are generally granted with an exercise price equal to the market price of the Company’s stock on the date of grant. For options gr anted in 2006 and prior years, our stock option awards generally vest on a graded basis over a four year service term and expire ten years from the date of grant. Our stock option awards granted in 2007 through 2009 generally vest on a graded basis over a three year service term and expire five years from the date of grant. Our stock options granted in 2010 vest on a graded basis over a three year service term and expire seven years from the date of grant. The vesting periods for our restricted stock awards range from immediate vesting to a period of four years.
A summary of the Company’s stock option activity and related information for 2010 is presented below (shares in thousands; dollars in millions, except per share amounts):
| | | | | | Weighted | | Weighted | | |
| | | | | | average | | average | | Aggregate |
| | | | | | exercise | | remaining | | intrinsic |
| | | Shares | | | price | | life | | value |
| | | | | | | | | | |
| Outstanding at the beginning of the year | | | 8,560 | | | $ | 11.65 | | | | | | |
| | | | | | | | | | | | | | |
| Options granted | | | 1,849 | | | | 6.43 | | | | | | |
| | | | | | | | | | | | | | |
| Exercised | | | (33 | ) | | | 2.83 | | | | | | $ | - | | |
| | | | | | | | | | | | | | | | | |
| Forfeited or terminated | | | (622 | ) | | | 8.81 | | | | | | | | | |
| | | | | | | | | | | | | | | | | |
| Outstanding at the end of the year | | | 9,754 | | | | 10.87 | | | | 3.6 years | | $ | 38.3 | | |
| | | | | | | | | | | | | | | | | |
| Options exercisable at the end of the year | | | 4,374 | | | | | | | | 2.9 years | | $ | 24.1 | | |
| | | | | | | | | | | | | | | | | |
| Available for future grant | | | 9,326 | | | | | | | | | | | | | |
CNO FINANCIAL GROUP, INC. AND SUBSIDIARIES
Notes to Consolidated Financial Statements
___________________
A summary of the Company’s stock option activity and related information for 2009 is presented below (shares in thousands; dollars in millions, except per share amounts):
| | | | | | Weighted | | Weighted | | | |
| | | | | | average | | average | | Aggregate | |
| | | | | | exercise | | remaining | | intrinsic | |
| | | Shares | | | price | | life | | value | |
| | | | | | | | | | | |
| Outstanding at the beginning of the year | | | 5,864 | | | $ | 16.94 | | | | | |
| | | | | | | | | | | | | |
| Options granted | | | 3,219 | | | | 2.64 | | | | | |
| | | | | | | | | | | | | |
| Exercised | | | - | | | | - | | | | $ | - | |
| | | | | | | | | | | | | | |
| Forfeited or terminated | | | (523 | ) | | | 15.52 | | | | | | |
| | | | | | | | | | | | | | |
| Outstanding at the end of the year | | | 8,560 | | | | 11.65 | | 4.1 years | | $ | 31.6 | |
| | | | | | | | | | | | | | |
| Options exercisable at the end of the year | | | 2,992 | | | | | | 4.4 years | | $ | 19.4 | |
| | | | | | | | | | | | | | |
| Available for future grant | | | 12,565 | | | | | | | | | | |
A summary of the Company’s stock option activity and related information for 2008 is presented below (shares in thousands; dollars in millions, except per share amounts):
| | | | | | Weighted | | Weighted | | | |
| | | | | | average | | average | | Aggregate | |
| | | | | | exercise | | remaining | | Intrinsic | |
| | | Shares | | | price | | life | | Value | |
| | | | | | | | | | | |
| Outstanding at the beginning of the year | | | 4,828 | | | $ | 19.82 | | | | | |
| | | | | | | | | | | | | |
| Options granted | | | 1,863 | | | | 10.27 | | | | | |
| | | | | | | | | | | | | |
| Exercised | | | - | | | | - | | | | $ | - | |
| | | | | | | | | | | | | | |
| Forfeited or terminated | | | (827 | ) | | | 18.69 | | | | | | |
| | | | | | | | | | | | | | |
| Outstanding at the end of the year | | | 5,864 | | | | 16.94 | | 4.8 years | | $ | 27.9 | |
| | | | | | | | | | | | | | |
| Options exercisable at the end of the year | | | 2,412 | | | | | | 5.5 years | | $ | 16.6 | |
| | | | | | | | | | | | | | |
| Available for future grant | | | 1,154 | | | | | | | | | | |
We recognized compensation expense related to stock options totaling $7.1 million ($4.6 million after income taxes) in 2010, $6.9 million ($4.5 million after income taxes) in 2009 and $6.0 million ($3.9 million after income taxes) in 2008. Compensation expense related to stock options reduced both basic and diluted earnings (loss) per share by 2 cents in 2010, 2009 and 2008. At December 31, 2010, the unrecognized compensation expense for non-vested stock options totaled $9.8 million which is expected to be recognized over a weighted average period of 1.8 years. Cash received from the exercise of stock options was $.1 million, nil and nil during 2010, 2009 and 2008, respectively.
CNO FINANCIAL GROUP, INC. AND SUBSIDIARIES
Notes to Consolidated Financial Statements
___________________
The fair value of each stock option grant is estimated on the date of grant using the Black-Scholes option valuation model with the following weighted average assumptions:
| | | 2010 Grants | | | 2009 Grantss | | | 2008 Grantss | |
| | | | | | | | | | |
| Weighted average risk-free interest rates | | | 2.5 | % | | | 1.6 | % | | | 2.5 | % |
| Weighted average dividend yields | | | 0.0 | % | | | 0.0 | % | | | 0.0 | % |
| Volatility factors | | | 105 | % | | | 108 | % | | | 24 | % |
| Weighted average expected life | | 4.7 years | | | 3.8 years | | | 3.7 years | |
| Weighted average fair value per share | | $ | 4.90 | | | $ | 1.89 | | | $ | 2.25 | |
The risk-free interest rate is based on the U.S. Treasury yield curve in effect at the time of grant. The dividend yield is based on the Company’s history and expectation of dividend payouts. Volatility factors are based on the weekly historical volatility of the Company’s common stock equal to the expected life of the option or since our emergence from bankruptcy in September 2003. The expected life is based on the average of the graded vesting period and the contractual terms of the option.
The exercise price was equal to the market price of our stock for all options granted in 2010, 2009 and 2008.
The following table summarizes information about stock options outstanding at December 31, 2010 (shares in thousands):
| | | | | Options outstanding | | | Options exercisable | |
| | | | Number | | | Remaining | | | Average exercise | | | Number | | | Average exercise | |
| Range of exercise prices | | | outstanding | | | life (in years) | | | price | | | exercisable | | | price | |
| | | | | | | | | | | | | | | | | |
| $ | 1.13 | | | | 647 | | | | 3.3 | | | $ | 1.13 | | | | - | | | $ | - | |
| $ | 2.83 - $3.11 | | | | 2,213 | | | | 3.4 | | | | 3.05 | | | | - | | | | - | |
| $ | 4.79 - $6.45 | | | | 1,788 | | | | 6.2 | | | | 6.41 | | | | - | | | | - | |
| $ | 8.91 - $12.96 | | | | 1,531 | | | | 2.2 | | | | 10.58 | | | | 799 | | | | 10.61 | |
| $ | 14.78 - $21.67 | | | | 3,098 | | | | 2.9 | | | | 19.32 | | | | 3,098 | | | | 19.32 | |
| $ | 22.42 - $25.45 | | | | 477 | | | | 4.8 | | | | 23.18 | | | | 477 | | | | 23.18 | |
| | | | | | | | | | | | | | | | | | | | | | | |
| | | | | | 9,754 | | | | | | | | | | | | 4,374 | | | | | |
During 2010, 2009 and 2008, the Company granted 1.0 million, .8 million and .1 million restricted shares, respectively, of CNO common stock to certain directors, officers and employees of the Company at a weighted average fair value of $6.28 per share, $1.67 per share and $9.75 per share, respectively. The fair value of such grants totaled $6.2 million, $1.4 million and $.8 million in 2010, 2009 and 2008, respectively. Such amounts are recognized as compensation expense over the vesting period of the restricted stock. A summary of the Company’s non-vested restricted stock activity for 2010 is presented below (shares in thousands):
| | | | | | Weighted | |
| | | | | | average | |
| | | | | | grant date | |
| | | Shares | | | fair value | |
| | | | | | | |
| Non-vested shares, beginning of year | | | 748 | | | $ | 2.15 | |
| Granted | | | 985 | | | | 6.28 | |
| Vested | | | (340 | ) | | | 3.89 | |
| Forfeited | | | (74 | ) | | | 4.61 | |
| | | | | | | | | |
| Non-vested shares, end of year | | | 1,319 | | | | 4.65 | |
At December 31, 2010, the unrecognized compensation expense for non-vested restricted stock totaled $4.4 million which is expected to be recognized over a weighted average period of 2.0 years. At December 31, 2009, the unrecognized compensation expense for non-vested restricted stock totaled $1.1 million. We recognized compensation expense related to
CNO FINANCIAL GROUP, INC. AND SUBSIDIARIES
Notes to Consolidated Financial Statements
___________________
restricted stock awards totaling $2.5 million, $.9 million and $1.4 million in 2010, 2009 and 2008, respectively. The fair value of restricted stock that vested during 2010, 2009 and 2008 was $1.3 million, $.8 million and $1.9 million, respectively.
Authoritative guidance also requires us to estimate the amount of unvested stock-based awards that will be forfeited in future periods and reduce the amount of compensation expense recognized over the applicable service period to reflect this estimate. We periodically evaluate our forfeiture assumptions to more accurately reflect our actual forfeiture experience.
The Company does not currently recognize tax benefits resulting from tax deductions in excess of the compensation expense recognized because of NOLs which are available to offset future taxable income.
As further discussed in the footnote to the consolidated financial statements entitled “Income Taxes”, the Company’s Board of Directors adopted the Section 382 Rights Agreement on January 20, 2009, which is designed to protect shareholder value by preserving the value of our tax assets primarily associated with NOLs. As a result, the Company declared a dividend of one preferred share purchase right (a “Right”) for each outstanding share of common stock. The dividend was payable on January 30, 2009, to the shareholders of record as of the close of business on that date. Each Right entitles the shareholder to purchase from the Company one one-thousandth of a share of Series A Junior Participating Preferred Stock, par value $.01 per share (the “Junior Preferred Stock” ;) of the Company at a price of $20.00 per one one-thousandth of a share of Junior Preferred Stock. The description and terms of the Rights are set forth in the Section 382 Rights Agreement. The Rights would become exercisable in the event any person or group (subject to certain exemptions) becomes a “5 percent shareholder” of CNO without the approval of the Board of Directors or an existing shareholder who is currently a “5 percent shareholder” acquires additional shares exceeding one percent of our outstanding shares without prior approval from the Board of Directors.
A reconciliation of net income (loss) and shares used to calculate basic and diluted earnings (loss) per share is as follows (dollars in millions and shares in thousands):
| | | 2010 | | | 2009 | | | 2008 | |
| | | | | | | | | | |
Income (loss) before discontinued operations | | $ | 284.6 | | | $ | 85.7 | | | $ | (409.6 | ) |
Discontinued operations | | | - | | | | - | | | | (722.7 | ) |
| | | | | | | | | | | | | |
Net income (loss) for basic earnings per share | | | 284.6 | | | | 85.7 | | | | (1,132.3 | ) |
| | | | | | | | | | | | | |
| Add: interest expense on 7.0% Debentures, net of income taxes | | | 13.3 | | | | 1.1 | | | | - | |
Net income (loss) for diluted earnings per share | | $ | 297.9 | | | $ | 86.8 | | | $ | (1,132.3 | ) |
| | | | | | | | | | | | | |
| Shares: | | | | | | | | | | | | |
| Weighted average shares outstanding for basic earnings per share | | | 250,973 | | | | 188,365 | | | | 184,704 | |
| | | | | | | | | | | | | |
| Effect of dilutive securities on weighted average shares: | | | | | | | | | | | | |
7% Debentures | | | 49,014 | | | | 4,281 | | | | - | |
Stock option and restricted stock plans | | | 1,871 | | | | 694 | | | | - | |
| | | | | | | | | | | | | |
Dilutive potential common shares | | | 50,885 | | | | 4,975 | | | | - | |
| | | | | | | | | | | | | |
| Weighted average shares outstanding for diluted earnings per share | | | 301,858 | | | | 193,340 | | | | 184,704 | |
There were no dilutive common stock equivalents during 2008 because of the net loss recognized by the Company during such period. Therefore, all potentially dilutive shares are excluded in the weighted average shares outstanding for diluted earnings per share.
CNO FINANCIAL GROUP, INC. AND SUBSIDIARIES
Notes to Consolidated Financial Statements
___________________
The following summarizes the equivalent common shares for securities that were not included in the computation of diluted earnings per share, because doing so would have been antidilutive in such periods (shares in thousands).
| | | 2008 | |
| | | | |
| Equivalent common shares that were antidilutive during the year: | | | |
| Stock option and restricted stock plans | | | 32 | |
| | | | | |
| Antidilutive equivalent common shares | | | 32 | |
In August 2005, we completed the private offering of the 3.5% Debentures. For periods in which the 3.5% Debentures were outstanding, the conversion feature of the 3.5% Debentures did not have a dilutive effect because the weighted average market price of our common stock did not exceed the initial conversion price of $26.66. Therefore, the 3.5% Debentures had no effect on our diluted shares outstanding or our diluted earnings per share in 2010, 2009 or 2008.
Basic earnings (loss) per common share is computed by dividing net income (loss) applicable to common stock by the weighted average number of common shares outstanding for the period. Restricted shares (including our performance shares) are not included in basic earnings (loss) per share until vested. Diluted earnings (loss) per share reflect the potential dilution that could occur if outstanding stock options were exercised and restricted stock was vested. The dilution from options and restricted shares is calculated using the treasury stock method. Under this method, we assume the proceeds from the exercise of the options (or the unrecognized compensation expense with respect to restricted stock) will be used to purchase shares of our common stock at the average market price during the period , reducing the dilutive effect of the exercise of the options (or the vesting of the restricted stock).
In 2010, 2009 and 2008, the Company granted performance shares totaling 686,900, 620,225 and 645,100, respectively, pursuant to its long-term incentive plan to certain officers of the Company. The criteria for payment for such awards are based on certain company-wide performance levels that must be achieved within a specified performance time, each as defined in the award. Unless antidilutive, the diluted weighted average shares outstanding would reflect the number of performance shares expected to be issued, using the treasury stock method.
A summary of the Company’s performance shares is presented below (shares in thousands):
| | | Total shareholder | | | Operating return | | | Pre-tax operating | |
| | | return awards | | | on equity awards | | | income awards | |
| | | | | | | | | | |
| Awards outstanding at December 31, 2007 | | | 218 | | | | 146 | | | | - | |
| | | | | | | | | | | | | |
Granted in 2008 | | | 387 | | | | 258 | | | | - | |
Forfeited | | | (54 | ) | | | (37 | ) | | | - | |
| | | | | | | | | | | | | |
| Awards outstanding at December 31, 2008 | | | 551 | | | | 367 | | | | - | |
| | | | | | | | | | | | | |
Granted in 2009 | | | - | | | | 620 | | | | - | |
Forfeited | | | (220 | ) | | | (162 | ) | | | - | |
| | | | | | | | | | | | | |
| Awards outstanding at December 31, 2009 | | | 331 | | | | 825 | | | | - | |
| | | | | | | | | | | | | |
Granted in 2010 | | | - | | | | - | | | | 687 | |
Forfeited | | | (331 | ) | | | (270 | ) | | | (35 | ) |
| | | | | | | | | | | | | |
| Awards outstanding at December 31, 2010 | | | - | | | | 555 | | | | 652 | |
The grant date fair value of the total shareholder return awards was $1.6 million in 2008. The grant date fair value of the operating return on equity awards was $1.9 million and $2.7 million in 2009 and 2008, respectively. The grant date fair value of the pre-tax operating income awards was $4.4 million in 2010. We recognized compensation expense of $2.2 million, $1.3 million and $.1 million in 2010, 2009 and 2008, respectively, related to the performance shares.
CNO FINANCIAL GROUP, INC. AND SUBSIDIARIES
Notes to Consolidated Financial Statements
___________________
11. OTHER OPERATING STATEMENT DATA
Insurance policy income consisted of the following (dollars in millions):
| | | 2010 | | | 2009 | | | 2008 | |
| Traditional products: | | | | | | | | | |
| Direct premiums collected | | $ | 4,252.0 | | | $ | 4,128.1 | | | $ | 4,313.5 | |
| Reinsurance assumed | | | 99.4 | | | | 476.5 | | | | 642.8 | |
| Reinsurance ceded | | | (264.7 | ) | | | (185.7 | ) | | | (164.3 | ) |
| | | | | | | | | | | | | |
| Premiums collected, net of reinsurance | | | 4,086.7 | | | | 4,418.9 | | | | 4,792.0 | |
| | | | | | | | | | | | | |
| Change in unearned premiums | | | 2.9 | | | | (2.1 | ) | | | (13.5 | ) |
| Less premiums on universal life and products without mortality and morbidity risk which are recorded as additions to insurance liabilities | | | (1,730.1 | ) | | | (1,668.9 | ) | | | (1,863.5 | ) |
| Premiums on traditional products with mortality or morbidity risk | | | 2,359.5 | | | | 2,747.9 | | | | 2,915.0 | |
| Fees and surrender charges on interest-sensitive products | | | 310.5 | | | | 345.7 | | | | 338.6 | |
| | | | | | | | | | | | | |
| Insurance policy income | | $ | 2,670.0 | | | $ | 3,093.6 | | | $ | 3,253.6 | |
The four states with the largest shares of 2010 collected premiums were Florida (7.8 percent), California (7.2 percent), Texas (6.1 percent) and Pennsylvania (6.1 percent). No other state accounted for more than five percent of total collected premiums.
Other operating costs and expenses were as follows (dollars in millions):
| | | 2010 | | | 2009 | | | 2008 | |
| | | | | | | | | | |
| Commission expense | | $ | 96.8 | | | $ | 114.3 | | | $ | 128.2 | |
| Salaries and wages | | | 175.6 | | | | 173.5 | | | | 160.5 | |
| Other | | | 230.5 | | | | 240.5 | | | | 231.6 | |
| | | | | | | | | | | | | |
| Total other operating costs and expenses | | $ | 502.9 | | | $ | 528.3 | | | $ | 520.3 | |
Changes in the present value of future profits were as follows (dollars in millions):
| | | 2010 | | | 2009 | | | 2008 | |
| | | | | | | | | | |
| Balance, beginning of year | | $ | 1,175.9 | | | $ | 1,477.8 | | | $ | 1,573.6 | |
| Amortization | | | (139.0 | ) | | | (177.5 | ) | | | (187.3 | ) |
| Effect of reinsurance transactions | | | - | | | | (24.1 | ) | | | - | |
| Amounts related to fair value adjustment of actively managed fixed maturities | | | (28.3 | ) | | | (100.3 | ) | | | 92.7 | |
| Other | | | - | | | | - | | | | (1.2 | ) |
| | | | | | | | | | | | | |
| Balance, end of year | | $ | 1,008.6 | | | $ | 1,175.9 | | | $ | 1,477.8 | |
CNO FINANCIAL GROUP, INC. AND SUBSIDIARIES
Notes to Consolidated Financial Statements
___________________
Based on current conditions and assumptions as to future events on all policies inforce, the Company expects to amortize approximately 13 percent of the December 31, 2010 balance of the present value of future profits in 2011, 11 percent in 2012, 10 percent in 2013, 8 percent in 2014 and 7 percent in 2015. The discount rate used to determine the amortization of the present value of future profits averaged approximately 5 percent in the years ended December 31, 2010, 2009 and 2008.
In accordance with authoritative guidance, we are required to amortize the present value of future profits in relation to estimated gross profits for universal life products and investment-type products. Such guidance also requires that estimates of expected gross profits used as a basis for amortization be evaluated regularly, and that the total amortization recorded to date be adjusted by a charge or credit to the statement of operations, if actual experience or other evidence suggests that earlier estimates should be revised.
Changes in deferred acquisition costs were as follows (dollars in millions):
| | | 2010 | | | 2009 | | | 2008 | |
| | | | | | | | | | |
Balance, beginning of year | | $ | 1,790.9 | | | $ | 1,812.6 | | | $ | 1,423.0 | |
Additions | | | 424.8 | | | | 407.5 | | | | 459.1 | |
Amortization | | | (304.8 | ) | | | (255.2 | ) | | | (180.6 | ) |
Effect of reinsurance transactions | | | - | | | | (79.0 | ) | | | - | |
| Amounts related to fair value adjustment of fixed maturities, available for sale | | | (136.0 | ) | | | (95.0 | ) | | | 111.1 | |
Other adjustments | | | (10.7 | ) | | | - | | | | - | |
| | | | | | | | | | | | | |
Balance, end of year | | $ | 1,764.2 | | | $ | 1,790.9 | | | $ | 1,812.6 | |
12. CONSOLIDATED STATEMENT OF CASH FLOWS
The following disclosures supplement our consolidated statement of cash flows:
Non-cash items not reflected in the investing and financing activities sections of the consolidated statement of cash flows (dollars in millions):
| | | 2010 | | | 2009 | | | 2008 | |
| | | | | | | | | | |
| Stock option and restricted stock plans | | $ | 11.4 | | | $ | 9.1 | | | $ | 7.4 | |
| Change in securities lending collateral | | | 103.7 | | | | 223.1 | | | | 51.6 | |
| Change in securities lending payable | | | (103.7 | ) | | | (223.1 | ) | | | (51.6 | ) |
The following reconciles net income (loss) to net cash provided by operating activities (dollars in millions):
| | | 2010 | | | 2009 | | | 2008 | |
| Cash flows from operating activities: | | | | | | | | | |
| Net income (loss) | | $ | 284.6 | | | $ | 85.7 | | | $ | (1,132.3 | ) |
| Adjustments to reconcile net income (loss) to net cash provided by operating activities: | | | | | | | | | | | | |
| Amortization and depreciation | | | 465.3 | | | | 460.9 | | | | 420.7 | |
| Income taxes | | | 8.5 | | | | 80.7 | | | | 429.0 | |
| Insurance liabilities | | | 437.6 | | | | 421.4 | | | | 460.6 | |
| Accrual and amortization of investment income | | | (62.0 | ) | | | (125.4 | ) | | | 3.9 | |
| Deferral of policy acquisition costs | | | (418.2 | ) | | | (407.5 | ) | | | (459.1 | ) |
| Net realized investment (gains) losses | | | (30.2 | ) | | | 60.5 | | | | 642.5 | |
| (Gain) loss on extinguishment of debt | | | 6.8 | | | | 22.2 | | | | (21.2 | ) |
| Loss on Transfer | | | - | | | | - | | | | 319.9 | |
| Gain on reinsurance recapture | | | - | | | | - | | | | (29.7 | ) |
| Other | | | 41.6 | | | | 13.2 | | | | 6.0 | |
| | | | | | | | | | | | | |
| Net cash provided by operating activities | | $ | 734.0 | | | $ | 611.7 | | | $ | 640.3 | |
CNO FINANCIAL GROUP, INC. AND SUBSIDIARIES
Notes to Consolidated Financial Statements
___________________
Our consolidated statement of cash flows for 2008 combines the cash flows from discontinued operations with the cash flows from continuing operations within each major category (operating, investing and financing) of the cash flow statement.
At December 31, 2010, restricted cash and cash equivalents consisted of $26.8 million held by VIEs.
At December 31, 2009, restricted cash and cash equivalents consisted of $3.4 million held by a VIE.
13. STATUTORY INFORMATION (BASED ON NON-GAAP MEASURES)
Statutory accounting practices prescribed or permitted by regulatory authorities for the Company’s insurance subsidiaries differ from GAAP. The Company’s insurance subsidiaries reported the following amounts to regulatory agencies, after appropriate elimination of intercompany accounts among such subsidiaries (dollars in millions):
| | | 2010 | | | 2009 | |
| | | | | | | |
| Statutory capital and surplus | | $ | 1,525.1 | | | $ | 1,410.7 | |
| Asset valuation reserve | | | 71.3 | | | | 28.2 | |
| Interest maintenance reserve | | | 428.1 | | | | 290.6 | |
| | | | | | | | | |
| Total | | $ | 2,024.5 | | | $ | 1,729.5 | |
Statutory capital and surplus included investments in upstream affiliates of $52.4 million at both December 31, 2010 and 2009, which was eliminated in the consolidated financial statements prepared in accordance with GAAP.
Statutory earnings build the capital required by ratings agencies and regulators. Statutory earnings, fees and interest paid by the insurance companies to the parent company create the “cash flow capacity” the parent company needs to meet its obligations, including debt service. The consolidated statutory net income (loss) (a non-GAAP measure) of our insurance subsidiaries was $181.9 million, $77.5 million and $(96.9) million in 2010, 2009 and 2008, respectively. Included in such net income (loss) were net realized capital losses, net of income taxes, of $79.6 million, $186.5 million and $217.1 million in 2010, 2009 and 2008, respectively. In addition, such net income (loss) included pre-tax amounts for fees and interest to CNO or its non-life subsidiaries totaling $132.4 million, $137.1 million and $139.6 million in 2010, 2009 and 2008, respectively.
Insurance regulators may prohibit the payment of dividends or other payments by our insurance subsidiaries to parent companies if they determine that such payment could be adverse to our policyholders or contract holders. Otherwise, the ability of our insurance subsidiaries to pay dividends is subject to state insurance department regulations. Insurance regulations generally permit dividends to be paid from statutory earned surplus of the insurance company without regulatory approval for any 12-month period in amounts equal to the greater of (or in a few states, the lesser of): (i) statutory net gain from operations or statutory net income for the prior year; or (ii) 10 percent of statutory capital and surplus as of the end of the preceding year, excluding $76.1 million of additional surplus recognized due to tempor ary modifications in statutory prescribed practices related to certain deferred tax assets. This type of dividend is referred to as “ordinary dividends”. Any dividends in excess of these levels require the approval of the director or commissioner of the applicable state insurance department. This type of dividend is referred to as “extraordinary dividends”. During 2010, our insurance subsidiaries paid extraordinary dividends of $166.0 million to CDOC (which is the immediate parent of Washington National, Conseco Life and Conseco Life Insurance Company of Texas).
Each of the immediate subsidiaries of CDOC have negative earned surplus at December 31, 2010. Accordingly, any dividend payments from these subsidiaries require the approval of the director or commissioner of the applicable state insurance department. During 2011, we are expecting our insurance subsidiaries to pay approximately $215 million of extraordinary dividends to CDOC (subject to approval by the applicable state insurance department) and CDOC expects to make capital contributions to our insurance subsidiaries totaling $160.0 million. In addition, we are expecting our insurance subsidiaries to pay interest on surplus debentures of $48.7 million in 2011, which will not require additional approval provided the risk-based capital (“RBC”) ratio of Conseco Life Insurance Company of Texas exce eds 100 percent (but will require prior written notice to the Texas state insurance department). Dividends and other payments from our non-insurance subsidiaries to CNO or CDOC do not require approval by any regulatory authority or other third party. Also, during 2010, CDOC made capital contributions of $114.4 million to our insurance subsidiaries.
CNO FINANCIAL GROUP, INC. AND SUBSIDIARIES
Notes to Consolidated Financial Statements
___________________
In accordance with an order from the Florida Office of Insurance Regulation, Washington National may not distribute funds to any affiliate or shareholder without prior notice to the Florida Office of Insurance Regulation. In addition, the RBC and other capital requirements described below can also limit, in certain circumstances, the ability of our insurance subsidiaries to pay dividends.
RBC requirements provide a tool for insurance regulators to determine the levels of statutory capital and surplus an insurer must maintain in relation to its insurance and investment risks and the need for possible regulatory attention. The RBC requirements provide four levels of regulatory attention, varying with the ratio of the insurance company’s total adjusted capital (defined as the total of its statutory capital and surplus, AVR and certain other adjustments) to its RBC (as measured on December 31 of each year) as follows: (i) if a company’s total adjusted capital is less than 100 percent but greater than or equal to 75 percent of its RBC, the company must submit a comprehensive plan to the regulatory authority proposing corrective actions aimed at improving its capital position (the “Compan y Action Level”); (ii) if a company’s total adjusted capital is less than 75 percent but greater than or equal to 50 percent of its RBC, the regulatory authority will perform a special examination of the company and issue an order specifying the corrective actions that must be taken; (iii) if a company’s total adjusted capital is less than 50 percent but greater than or equal to 35 percent of its RBC, the regulatory authority may take any action it deems necessary, including placing the company under regulatory control; and (iv) if a company’s total adjusted capital is less than 35 percent of its RBC, the regulatory authority must place the company under its control. In addition, the RBC requirements provide for a trend test if a company’s total adjusted capital is between 100 percent and 125 percent of its RBC at the end of the year. The trend test calculates the greater of the decrease in the margin of total adjusted capital over RBC: (i) betwe en the current year and the prior year; and (ii) for the average of the last 3 years. It assumes that such decrease could occur again in the coming year. Any company whose trended total adjusted capital is less than 95 percent of its RBC would trigger a requirement to submit a comprehensive plan as described above for the Company Action Level.
In addition, although we are under no obligation to do so, we may elect to contribute additional capital to strengthen the surplus of certain insurance subsidiaries. Any election regarding the contribution of additional capital to our insurance subsidiaries could affect the ability of our insurance subsidiaries to pay dividends to the holding company. The ability of our insurance subsidiaries to pay dividends is also impacted by various criteria established by rating agencies to maintain or receive higher ratings and by the capital levels that we target for our insurance subsidiaries.
At December 31, 2010, the consolidated RBC ratio of our insurance subsidiaries exceeded the minimum RBC requirement included in our New Senior Secured Credit Agreement. See the note to the consolidated financial statements entitled “Notes Payable - Direct Corporate Obligations” for further discussion of various financial ratios and balances we are required to maintain. We calculate the consolidated RBC ratio by assuming all of the assets, liabilities, capital and surplus and other aspects of the business of our insurance subsidiaries are combined together in one insurance subsidiary, with appropriate intercompany eliminations.
Beginning July 1, 2010, management changed the manner in which it disaggregates the Company’s operations for making operating decisions and assessing performance. As a result, the Company manages its business through the following operating segments: Bankers Life, Colonial Penn and Washington National, which are defined on the basis of product distribution; Other CNO Business, comprised primarily of products we no longer sell actively; and corporate operations, comprised of holding company activities and certain noninsurance company businesses.
We measure segment performance by excluding realized investment gains (losses) because we believe that this performance measure is a better indicator of the ongoing business and trends in our business. Our primary investment focus is on investment income to support our liabilities for insurance products as opposed to the generation of realized investment gains (losses), and a long-term focus is necessary to maintain profitability over the life of the business. Realized investment gains (losses) depend on market conditions and do not necessarily relate to the underlying business of our segments.
CNO FINANCIAL GROUP, INC. AND SUBSIDIARIES
Notes to Consolidated Financial Statements
___________________
Realized investment gains (losses) may affect future earnings levels since our underlying business is long-term in nature and changes in our investment portfolio may impact our ability to earn the assumed interest rates needed to maintain the profitability of our business.
Operating information by segment was as follows (dollars in millions):
| | | 2010 | | | 2009 | | | 2008 | |
| | | | | | | | | | |
| Revenues: | | | | | | | | | |
| Bankers Life: | | | | | | | | | |
| Insurance policy income: | | | | | | | | | |
Annuities | | $ | 39.5 | | | $ | 41.4 | | | $ | 49.2 | |
Health | | | 1,366.0 | | | | 1,711.7 | | | | 1,872.9 | |
Life | | | 190.7 | | | | 206.1 | | | | 187.8 | |
Net investment income (a) | | | 758.9 | | | | 678.1 | | | | 558.2 | |
Fee revenue and other income (a) | | | 12.8 | | | | 10.2 | | | | 11.0 | |
| | | | | | | | | | | | | |
Total Bankers Life revenues | | | 2,367.9 | | | | 2,647.5 | | | | 2,679.1 | |
| | | | | | | | | | | | | |
| Washington National: | | | | | | | | | | | | |
| Insurance policy income: | | | | | | | | | | | | |
Health | | | 559.3 | | | | 563.2 | | | | 574.8 | |
Life | | | 16.8 | | | | 29.4 | | | | 35.3 | |
Other | | | 4.9 | | | | 5.3 | | | | 7.1 | |
Net investment income (a) | | | 185.4 | | | | 188.9 | | | | 197.3 | |
Fee revenue and other income (a) | | | 1.1 | | | | 1.5 | | | | .7 | |
| | | | | | | | | | | | | |
Total Washington National revenues | | | 767.5 | | | | 788.3 | | | | 815.2 | |
| | | | | | | | | | | | | |
| Colonial Penn: | | | | | | | | | | | | |
| Insurance policy income: | | | | | | | | | | | | |
Health | | | 6.8 | | | | 8.1 | | | | 9.5 | |
Life | | | 188.1 | | | | 188.0 | | | | 175.3 | |
Net investment income (a) | | | 39.3 | | | | 38.7 | | | | 39.6 | |
Fee revenue and other income (a) | | | .7 | | | | .9 | | | | 1.8 | |
| | | | | | | | | | | | | |
Total Colonial Penn revenues | | | 234.9 | | | | 235.7 | | | | 226.2 | |
| | | | | | | | | | | | | |
| Other CNO Business: | | | | | | | | | | | | |
| Insurance policy income: | | | | | | | | | | | | |
Annuities | | | 12.9 | | | | 29.5 | | | | 14.1 | |
Health | | | 29.9 | | | | 32.1 | | | | 34.6 | |
Life | | | 252.5 | | | | 275.8 | | | | 289.7 | |
Other | | | 2.6 | | | | 3.0 | | | | 3.3 | |
Net investment income (a) | | | 364.6 | | | | 371.9 | | | | 355.2 | |
Fee revenue and other income (a) | | | - | | | | - | | | | 1.0 | |
| | | | | | | | | | | | | |
Total Other CNO Business revenues | | | 662.5 | | | | 712.3 | | | | 697.9 | |
| | | | | | | | | | | | | |
| Corporate operations: | | | | | | | | | | | | |
Net investment income | | | 18.7 | | | | 15.1 | | | | 28.5 | |
Fee and other income | | | 2.2 | | | | 3.0 | | | | 5.2 | |
| | | | | | | | | | | | | |
Total corporate revenues | | | 20.9 | | | | 18.1 | | | | 33.7 | |
| | | | | | | | | | | | | |
Total revenues | | | 4,053.7 | | | | 4,401.9 | | | | 4,452.1 | |
(continued on next page)
CNO FINANCIAL GROUP, INC. AND SUBSIDIARIES
Notes to Consolidated Financial Statements
___________________
(continued from previous page)
| | | 2010 | | | 2009 | | | 2008 | |
| Expenses: | | | | | | | | | |
| Bankers Life: | | | | | | | | | |
Insurance policy benefits | | $ | 1,607.3 | | | $ | 1,905.0 | | | $ | 2,090.4 | |
Amortization | | | 290.5 | | | | 267.9 | | | | 234.8 | |
Interest expense on investment borrowings | | | 1.0 | | | | - | | | | - | |
Other operating costs and expenses | | | 185.0 | | | | 196.6 | | | | 182.4 | |
| | | | | | | | | | | | | |
Total Bankers Life expenses | | | 2,083.8 | | | | 2,369.5 | | | | 2,507.6 | |
| | | | | | | | | | | | | |
| Washington National: | | | | | | | | | | | | |
Insurance policy benefits | | | 450.6 | | | | 467.0 | | | | 473.2 | |
Amortization | | | 56.9 | | | | 53.9 | | | | 54.0 | |
Other operating costs and expenses | | | 155.4 | | | | 156.5 | | | | 166.9 | |
| | | | | | | | | | | | | |
Total Washington National expenses | | | 662.9 | | | | 677.4 | | | | 694.1 | |
| | | | | | | | | | | | | |
| Colonial Penn: | | | | | | | | | | | | |
Insurance policy benefits | | | 144.8 | | | | 143.0 | | | | 139.4 | |
Amortization | | | 33.3 | | | | 33.3 | | | | 32.0 | |
Other operating costs and expenses | | | 30.3 | | | | 30.0 | | | | 29.6 | |
| | | | | | | | | | | | | |
Total Colonial Penn expenses | | | 208.4 | | | | 206.3 | | | | 201.0 | |
| | | | | | | | | | | | | |
| Other CNO Business: | | | | | | | | | | | | |
Insurance policy benefits | | | 521.0 | | | | 551.7 | | | | 509.5 | |
Amortization | | | 51.6 | | | | 81.6 | | | | 68.6 | |
Interest expense on investment borrowings | | | 20.0 | | | | 20.5 | | | | 22.4 | |
Other operating costs and expenses | | | 81.4 | | | | 102.1 | | | | 97.2 | |
| | | | | | | | | | | | | |
Total Other CNO Business expenses | | | 674.0 | | | | 755.9 | | | | 697.7 | |
| | | | | | | | | | | | | |
| Corporate operations: | | | | | | | | | | | | |
Interest expense on corporate debt | | | 79.3 | | | | 84.7 | | | | 67.9 | |
Interest expense on variable interest entities | | | 12.9 | | | | 12.7 | | | | 16.2 | |
Other operating costs and expenses | | | 50.8 | | | | 43.1 | | | | 44.2 | |
| (Gain) loss on extinguishment or modification of debt | | | 6.8 | | | | 22.2 | | | | (21.2 | ) |
| | | | | | | | | | | | | |
Total corporate expenses | | | 149.8 | | | | 162.7 | | | | 107.1 | |
| | | | | | | | | | | | | |
Total expenses | | | 3,778.9 | | | | 4,171.8 | | | | 4,207.5 | |
| | | | | | | | | | | | | |
| Income (loss) before net realized investment losses (net of related amortization), income taxes and discontinued operations: | | | | | | | | | | | | |
Bankers Life | | | 284.1 | | | | 278.0 | | | | 171.5 | |
Washington National | | | 104.6 | | | | 110.9 | | | | 121.1 | |
Colonial Penn | | | 26.5 | | | | 29.4 | | | | 25.2 | |
Other CNO Business | | | (11.5 | ) | | | (43.6 | ) | | | .2 | |
Corporate operations | | | (128.9 | ) | | | (144.6 | ) | | | (73.4 | ) |
| | | | | | | | | | | | | |
| Income before net realized investment losses (net of related amortization), income taxes and discontinued operations | | $ | 274.8 | | | $ | 230.1 | | | $ | 244.6 | |
| | | | | | | | | | | | | |
___________________
| (a) | It is not practicable to provide additional components of revenue by product or services. |
CNO FINANCIAL GROUP, INC. AND SUBSIDIARIES
Notes to Consolidated Financial Statements
___________________
A reconciliation of segment revenues and expenses to consolidated revenues and expenses is as follows (dollars in millions):
| | | 2010 | | | 2009 | | | 2008 | |
| | | | | | | | | | |
| Total segment revenues | | $ | 4,053.7 | | | $ | 4,401.9 | | | $ | 4,452.1 | |
| Net realized investment gains (losses) | | | 30.2 | | | | (60.5 | ) | | | (262.4 | ) |
| | | | | | | | | | | | | |
| Consolidated revenues | | $ | 4,083.9 | | | $ | 4,341.4 | | | $ | 4,189.7 | |
| | | | | | | | | | | | | |
| Total segment expenses | | $ | 3,778.9 | | | $ | 4,171.8 | | | $ | 4,207.5 | |
| Amortization related to net realized investment gains (losses) | | | 11.5 | | | | (4.0 | ) | | | (21.5 | ) |
| | | | | | | | | | | | | |
| Consolidated expenses | | $ | 3,790.4 | | | $ | 4,167.8 | | | $ | 4,186.0 | |
Segment balance sheet information was as follows (dollars in millions):
| | | 2010 | | | 2009 | |
| Assets: | | | | | | |
| Bankers Life | | $ | 16,150.0 | | | $ | 14,503.8 | |
| Washington National | | | 4,033.7 | | | | 4,070.7 | |
| Colonial Penn | | | 999.3 | | | | 971.4 | |
| Other CNO Business | | | 8,999.5 | | | | 9,254.6 | |
| Corporate operations | | | 1,717.1 | | | | 1,543.3 | |
| | | | | | | | | |
| Total assets | | $ | 31,899.6 | | | $ | 30,343.8 | |
| | | | | | | | | |
| Liabilities: | | | | | | | | |
| Bankers Life | | $ | 14,074.3 | | | $ | 12,832.4 | |
| Washington National | | | 3,170.7 | | | | 3,325.0 | |
| Colonial Penn | | | 733.9 | | | | 763.3 | |
| Other CNO Business | | | 8,152.1 | | | | 8,564.2 | |
| Corporate operations | | | 1,443.3 | | | | 1,326.5 | |
| | | | | | | | | |
| Total liabilities | | $ | 27,574.3 | | | $ | 26,811.4 | |
The following table presents selected financial information of our segments (dollars in millions):
| | | Present | | | Deferred | | | | |
| | | value of | | | acquisition | | | Insurance | |
| Segment | | future profits | | | costs | | | liabilities | |
| | | | | | | | | | |
| 2010 | | | | | | | | | |
| Bankers Life | | $ | 467.2 | | | $ | 1,149.5 | | | $ | 13,065.8 | |
| Washington National | | | 426.9 | | | | 212.3 | | | | 2,979.2 | |
| Colonial Penn | | | 81.7 | | | | 226.5 | | | | 717.8 | |
| Other CNO Business | | | 32.8 | | | | 175.9 | | | | 7,725.7 | |
| | | | | | | | | | | | | |
| Total | | $ | 1,008.6 | | | $ | 1,764.2 | | | $ | 24,488.5 | |
| | | | | | | | | | | | | |
| 2009 | | | | | | | | | | | | |
| Bankers Life | | $ | 569.5 | | | $ | 1,179.1 | | | $ | 12,384.8 | |
| Washington National | | | 455.1 | | | | 185.4 | | | | 3,117.2 | |
| Colonial Penn | | | 92.4 | | | | 199.8 | | | | 713.8 | |
| Other CNO Business | | | 58.9 | | | | 226.6 | | | | 8,078.2 | |
| | | | | | | | | | | | | |
| Total | | $ | 1,175.9 | | | $ | 1,790.9 | | | $ | 24,294.0 | |
CNO FINANCIAL GROUP, INC. AND SUBSIDIARIES
Notes to Consolidated Financial Statements
___________________
15. QUARTERLY FINANCIAL DATA (UNAUDITED)
We compute earnings per common share for each quarter independently of earnings per share for the year. The sum of the quarterly earnings per share may not equal the earnings per share for the year because of: (i) transactions affecting the weighted average number of shares outstanding in each quarter; and (ii) the uneven distribution of earnings during the year. Quarterly financial data (unaudited) were as follows (dollars in millions, except per share data).
| 2010 | | 1st Qtr. | | | 2nd Qtr. | | | 3rd Qtr. | | | 4th Qtr. | |
| | | | | | | | | | | | | |
| Revenues | | $ | 1,002.4 | | | $ | 953.2 | | | $ | 1,052.5 | | | $ | 1,075.8 | |
| | | | | | | | | | | | | | | | | |
| Income before income taxes | | $ | 53.1 | | | $ | 51.8 | | | $ | 77.3 | | | $ | 111.3 | |
| Income tax expense (benefit) | | | 19.2 | | | | 18.7 | | | | 27.9 | | | | (56.9 | ) |
| | | | | | | | | | | | | | | | | |
| Net income | | $ | 33.9 | | | $ | 33.1 | | | $ | 49.4 | | | $ | 168.2 | |
| | | | | | | | | | | | | | | | | |
| Income per common share: | | | | | | | | | | | | | | | | |
| Basic: | | | | | | | | | | | | | | | | |
| Net income | | $ | .14 | | | $ | .13 | | | $ | .20 | | | $ | .67 | |
| | | | | | | | | | | | | | | | | |
| Diluted: | | | | | | | | | | | | | | | | |
| Net income | | $ | .13 | �� | | $ | .12 | | | $ | .17 | | | $ | .56 | |
| 2009 | | 1st Qtr. | | | 2nd Qtr. | | | 3rd Qtr. | | | 4th Qtr. | |
| | | | | | | | | | | | | |
| Revenues | | $ | 1,069.5 | | | $ | 1,095.6 | | | $ | 1,118.6 | | | $ | 1,057.7 | |
| | | | | | | | | | | | | | | | | |
| Income before income taxes | | $ | 42.2 | | | $ | 49.6 | | | $ | 64.1 | | | $ | 17.7 | |
| Income tax expense (benefit) | | | 17.7 | | | | 22.0 | | | | 48.7 | | | | (.5 | ) |
| | | | | | | | | | | | | | | | | |
| Net income | | $ | 24.5 | | | $ | 27.6 | | | $ | 15.4 | | | $ | 18.2 | |
| | | | | | | | | | | | | | | | | |
| Income per common share: | | | | | | | | | | | | | | | | |
| Basic: | | | | | | | | | | | | | | | | |
| Net income | | $ | .13 | | | $ | .15 | | | $ | .08 | | | $ | .09 | |
| | | | | | | | | | | | | | | | | |
| Diluted: | | | | | | | | | | | | | | | | |
| Net income | | $ | .13 | | | $ | .15 | | | $ | .08 | | | $ | .09 | |
CNO FINANCIAL GROUP, INC. AND SUBSIDIARIES
Notes to Consolidated Financial Statements
___________________
| | 16. | INVESTMENTS IN VARIABLE INTEREST ENTITIES |
Effective January 1, 2010, the Company adopted authoritative guidance that requires an entity to perform a qualitative analysis to determine whether a primary beneficiary interest is held in a VIE. The guidance also requires ongoing reassessments to determine whether a primary beneficiary interest is held. Based on our assessment, we concluded that we were the primary beneficiary with respect to two VIEs which are consolidated in our financial statements. One of the VIEs was consolidated prior to 2010. The following is a description of our significant investments in VIEs:
Fall Creek CLO Ltd. (“Fall Creek”) and Eagle Creek CLO Ltd. (“Eagle Creek”) are collateralized loan trusts that were established to issue securities and use the proceeds to principally invest in corporate loans and other permitted investments. The assets held by the trusts are legally isolated and not available to the Company. The liabilities of Fall Creek and Eagle Creek are expected to be satisfied from the cash flows generated by the underlying loans, not from the assets of the Company. Repayment of the remaining principal balance of the borrowings of Fall Creek and Eagle Creek are based on available cash flows from the assets and such borrowings mature in 2017 and 2018, respectively. The Company has no further commitments to Fall Creek or Eagle Creek.
Certain of our subsidiaries are noteholders of the VIEs and, as a result, could absorb part of the losses of the VIEs. Another subsidiary of the Company is the investment manager for both Fall Creek and Eagle Creek. As such, it has the power to direct the most significant activities of the VIEs which materially impacts the economic performance of the VIEs.
The following table provides supplemental information about the assets and liabilities of Fall Creek and Eagle Creek which have been consolidated in accordance with authoritative guidance (dollars in millions):
| | | December 31, 2010 | |
| | | | | | | | | | |
| | | Fall Creek | | | | | | Net effect on | |
| | | and | | | | | | consolidated | |
| | | Eagle Creek | | | Eliminations | | | balance sheet | |
| | | | | | | | | | |
| Assets: | | | | | | | | | |
| Investments held by variable interest entities | | $ | 420.9 | | | $ | - | | | $ | 420.9 | |
| Notes receivable of VIEs held by insurance subsidiaries | | | - | | | | (96.8 | ) | | | (96.8 | ) |
| Cash and cash equivalents held by variable interest entities | | | 26.8 | | | | - | | | | 26.8 | |
| Accrued investment income | | | 1.4 | | | | (4.8 | ) | | | (3.4 | ) |
| Income tax assets, net | | | 20.9 | | | | (6.5 | ) | | | 14.4 | |
| Other assets | | | 15.9 | | | | - | | | | 15.9 | |
| | | | | | | | | | | | | |
| Total assets | | $ | 485.9 | | | $ | (108.1 | ) | | $ | 377.8 | |
| | | | | | | | | | | | | |
| Liabilities: | | | | | | | | | | | | |
| Other liabilities | | $ | 22.0 | | | $ | (4.6 | ) | | $ | 17.4 | |
| Borrowings related to variable interest entities | | | 386.9 | | | | - | | | | 386.9 | |
| Notes payable of VIEs held by insurance subsidiaries | | | 115.6 | | | | (115.6 | ) | | | - | |
| | | | | | | | | | | | | |
| Total liabilities | | $ | 524.5 | | | $ | (120.2 | ) | | $ | 404.3 | |
CNO FINANCIAL GROUP, INC. AND SUBSIDIARIES
Notes to Consolidated Financial Statements
___________________
| | | December 31, 2009 | |
| | | | | | | | | | |
| | | | | | | | | Net effect on | |
| | | | | | | | | consolidated | |
| | | Fall Creek | | | Eliminations | | | balance sheet | |
| | | | | | | | | | |
| Assets: | | | | | | | | | |
| Fixed maturities, available for sale | | $ | 268.0 | | | $ | - | | | $ | 268.0 | |
| Notes receivable of VIE held by insurance subsidiaries | | | - | | | | (81.9 | ) | | | (81.9 | ) |
| Cash and cash equivalents – restricted | | | 3.4 | | | | - | | | | 3.4 | |
| Accrued investment income | | | 1.2 | | | | (3.0 | ) | | | (1.8 | ) |
| Income tax assets, net | | | 19.3 | | | | (5.3 | ) | | | 14.0 | |
| Other assets | | | 8.0 | | | | - | | | | 8.0 | |
| | | | | | | | | | | | | |
| Total assets | | $ | 299.9 | | | $ | (90.2 | ) | | $ | 209.7 | |
| | | | | | | | | | | | | |
| Liabilities: | | | | | | | | | | | | |
| Other liabilities | | $ | 7.7 | | | $ | (3.2 | ) | | $ | 4.5 | |
| Investment borrowings | | | 229.1 | | | | - | | | | 229.1 | |
| Notes payable of VIE held by insurance subsidiaries | | | 99.2 | | | | (99.2 | ) | | | - | |
| | | | | | | | | | | | | |
| Total liabilities | | $ | 336.0 | | | $ | (102.4 | ) | | $ | 233.6 | |
The following table provides supplemental information about the revenues and expenses of Fall Creek and Eagle Creek which have been consolidated in accordance with authoritative guidance, after giving effect to the elimination of our investment in Fall Creek and Eagle Creek and investment management fees earned by a subsidiary of the Company (dollars in millions):
| | | 2010 | | | 2009 | | | 2008 | |
| | | | | | | | | | |
| Revenues: | | | | | | | | | |
| Net investment income – policyholder and reinsurer accounts and other special-purpose portfolios | | $ | 20.1 | | | $ | 13.4 | | | $ | 23.6 | |
Fee revenue and other income | | | .6 | | | | .3 | | | | .5 | |
| | | | | | | | | | | | | |
Total revenues | | | 20.7 | | | | 13.7 | | | | 24.1 | |
| | | | | | | | | | | | | |
| Expenses: | | | | | | | | | | | | |
Interest expense | | | 12.9 | | | | 12.7 | | | | 16.2 | |
Other operating expenses | | | .6 | | | | .2 | | | | .7 | |
| | | | | | | | | | | | | |
Total expenses | | | 13.5 | | | | 12.9 | | | | 16.9 | |
| | | | | | | | | | | | | |
Income (loss) before net realized investment losses and income taxes | | | 7.2 | | | | .8 | | | | 7.2 | |
| | | | | | | | | | | | | |
Net realized investment losses | | | (3.7 | ) | | | (14.2 | ) | | | (24.9 | ) |
| | | | | | | | | | | | | |
Income (loss) before income taxes | | $ | 3.5 | | | $ | (13.4 | ) | | $ | (17.7 | ) |
The investment portfolio held by the VIEs is primarily comprised of corporate fixed maturity securities which are almost entirely rated as below-investment grade securities. At December 31, 2010, such securities had an amortized cost of $428.0 million; gross unrealized gains of $3.7 million; gross unrealized losses of $10.8 million; and an estimated fair value of $420.9 million.
CNO FINANCIAL GROUP, INC. AND SUBSIDIARIES
Notes to Consolidated Financial Statements
___________________
The following table sets forth the amortized cost and estimated fair value of the investments held by the VIEs at December 31, 2010, by contractual maturity. Actual maturities will differ from contractual maturities because borrowers may have the right to call or prepay obligations with or without call or prepayment penalties.
| | | | | | Estimated | |
| | | Amortized | | | fair | |
| | | cost | | | value | |
| | | (Dollars in millions) | |
| | | | | | | |
| Due in one year or less | | $ | 11.9 | | | $ | 12.1 | |
| Due after one year through five years | | | 328.4 | | | | 320.1 | |
| Due after five years through ten years | | | 87.7 | | | | 88.7 | |
| | | | | | | | | |
| Total | | $ | 428.0 | | | $ | 420.9 | |
The following table summarizes the carrying values of the investments held by the VIEs by category as of December 31, 2010 (dollars in millions):
| | | | | | | | | | | | Percent of | |
| | | | | | Percent | | | Gross | | | gross | |
| | | | | | of fixed | | | unrealized | | | unrealized | |
| | | Carrying value | | | maturities | | | losses | | | losses | |
| | | | | | | | | | | | | |
| Cable/media | | $ | 70.7 | | | | 16.8 | % | | $ | 2.3 | | | | 21.5 | % |
| Healthcare/pharmaceuticals | | | 60.0 | | | | 14.2 | | | | 1.0 | | | | 9.2 | |
| Chemicals | | | 23.6 | | | | 5.6 | | | | .4 | | | | 3.4 | |
| Retail | | | 20.9 | | | | 5.0 | | | | .3 | | | | 2.7 | |
| Entertainment/hotels | | | 19.6 | | | | 4.7 | | | | .5 | | | | 4.4 | |
| Autos | | | 18.6 | | | | 4.4 | | | | .1 | | | | 1.4 | |
| Gaming | | | 18.4 | | | | 4.4 | | | | 1.1 | | | | 10.3 | |
| Utilities | | | 18.4 | | | | 4.4 | | | | 1.5 | | | | 14.0 | |
| Capital goods | | | 16.1 | | | | 3.8 | | | | .3 | | | | 2.6 | |
| Consumer products | | | 16.0 | | | | 3.8 | | | | .4 | | | | 3.9 | |
| Food/beverage | | | 15.9 | | | | 3.8 | | | | .1 | | | | 1.0 | |
| Aerospace/defense | | | 15.8 | | | | 3.8 | | | | - | | | | .5 | |
| Paper | | | 14.2 | | | | 3.4 | | | | .1 | | | | .6 | |
| Energy/pipelines | | | 12.1 | | | | 2.8 | | | | 1.0 | | | | 9.1 | |
| Technology | | | 11.0 | | | | 2.6 | | | | .2 | | | | 2.2 | |
| Insurance | | | 7.1 | | | | 1.7 | | | | - | | | | - | |
| Other | | | 62.5 | | | | 14.8 | | | | 1.5 | | | | 13.2 | |
| | | | | | | | | | | | | | | | | |
| Total | | $ | 420.9 | | | | 100.0 | % | | $ | 10.8 | | | | 100.0 | % |
The following table sets forth the amortized cost and estimated fair value of those investments held by the VIEs with unrealized losses at December 31, 2010, by contractual maturity. Actual maturities will differ from contractual maturities because borrowers may have the right to call or prepay obligations with or without call or prepayment penalties.
| | | | | | Estimated | |
| | | Amortized | | | fair | |
| | | cost | | | value | |
| | | (Dollars in millions) | |
| | | | | | | |
| Due in one year or less | | $ | 4.0 | | | $ | 3.9 | |
| Due after one year through five years | | | 234.4 | | | | 224.0 | |
| Due after five years through ten years | | | 28.2 | | | | 27.9 | |
| | | | | | | | | |
| Total | | $ | 266.6 | | | $ | 255.8 | |
CNO FINANCIAL GROUP, INC. AND SUBSIDIARIES
Notes to Consolidated Financial Statements
___________________
The following summarizes the investments in our portfolio held by the VIEs rated below-investment grade which have been continuously in an unrealized loss position exceeding 20 percent of the cost basis for the period indicated as of December 31, 2010 (dollars in millions):
| | | Number | | | Cost | | | Unrealized | | | Estimated | |
| | | of issuers | | | basis | | | loss | | | fair value | |
| | | | | | | | | | | | | |
Less than 6 months | | | 1 | | | $ | 2.0 | | | $ | ( .5 | ) | | $ | 1.5 | |
| Greater than or equal to 6 and less than 12 months | | | 5 | | | | 10.4 | | | | (2.6 | ) | | | 7.8 | |
Greater than 12 months | | | 1 | | | | 2.0 | | | | (.8 | ) | | | 1.2 | |
| | | | | | | | | | | | | | | | | |
| | | | 7 | | | $ | 14.4 | | | $ | (3.9 | ) | | $ | 10.5 | |
During 2010, we recognized net realized investment losses on the VIE investments of $3.7million, which were comprised of $.4 million of net losses from the sales of fixed maturities, and $3.3 million of writedowns of investments for other than temporary declines in fair value recognized through net income. During 2009, we recognized net realized investment losses on the VIE investments of $14.2 million, which were comprised of $.7 million of net losses from the sales of fixed maturities, and $13.5 million of writedowns of investments for other than temporary declines in fair value recognized through net income.
At December 31, 2010, investments held by the VIEs that were in default had an aggregate amortized cost of $6.8 million and a carrying value of $7.3 million, of which $2.3 million (carrying value) were subsequently sold.
During 2010, $36.1 million of investments held by the VIEs were sold which resulted in gross investment losses (before income taxes) of $4.2 million. The following summarizes the investments sold at a loss during 2010 which had been continuously in an unrealized loss position exceeding 20 percent of the amortized cost basis prior to the sale for the period indicated (dollars in millions):
| | | At date of sale | |
| | | Number | | | Amortized | | | Fair | |
| | | of issuers | | | cost | | | value | |
| | | | | | | | | | |
| Less than six months prior to sale | | | 2 | | | $ | .1 | | | $ | .1 | |
| Greater than or equal to 6 and less than 12 months prior to sale | | | 2 | | | | 1.2 | | | | .8 | |
| Greater than 12 months prior to sale | | | 2 | | | | 1.3 | | | | .4 | |
| | | | | | | | | | | | | |
| | | | 6 | | | $ | 2.6 | | | $ | 1.3 | |
At December 31, 2010, the VIEs held: (i) investments with a fair value of $26.7 million and gross unrealized losses of $.8 million that had been in an unrealized loss position for less than twelve months; and (ii) investments with a fair value of $229.1 million and gross unrealized losses of $10.0 million that had been in an unrealized loss position for greater than twelve months.
The investments held by the VIEs are evaluated for other-than-temporary declines in fair value in a manner that is consistent with the Company’s fixed maturities, available for sale.
In addition, the Company, in the normal course of business, makes passive investments in structured securities issued by VIEs for which the Company is not the investment manager. These structured securities include asset-backed securities, collateralized debt obligations, commercial mortgage-backed securities, residential mortgage-backed securities and collateralized mortgage obligations. Our maximum exposure to loss on these securities is limited to our cost basis in the investment. We have determined that we are not the primary beneficiary of these structured securities due to the relative size of our investment in comparison to the total principal amount of the individual structured securities and the level of credit subordination which reduces our obligation to absorb gains or losses.
At December 31, 2010, we hold investments in various limited partnerships, in which we are not the primary beneficiary, totaling $20.7 million (classified as other invested assets). At December 31, 2010, we had unfunded commitments to these partnerships of $14.7 million. Our maximum exposure to loss on these investments is limited to the amount of our investment.
| | ITEM 9. | CHANGES IN AND DISAGREEMENTS WITH ACCOUNTANTS ON ACCOUNTING AND FINANCIAL DISCLOSURE. |
None.
ITEM 9A. CONTROLS AND PROCEDURES.
Evaluation of Disclosure Controls and Procedures. Our management, under the supervision and with the participation of the Chief Executive Officer and the Chief Financial Officer, evaluated the effectiveness of our disclosure controls and procedures, as defined in Rules 13a-15(e) and 15d-15(e) under the Securities Exchange Act of 1934, as amended (the “Exchange Act”). Disclosure controls and procedures are designed to provide reasonable assurance that information required to be disclosed in reports filed or submitted under the Exchange Act is recorded, processed, summarized and reported within the time periods specified in SEC rules and forms and that such information is accumulated and communicated to management, including the Chief Executive Offic er and Chief Financial Officer, to allow timely decisions regarding required disclosures.
Limitations on the Effectiveness of Controls. Our management, including our Chief Executive Officer and Chief Financial Officer, does not expect that our disclosure controls over financial reporting will prevent all error and fraud. A control system, no matter how well designed and operated, can provide only reasonable, not absolute, assurance that the control system’s objectives will be met. Further, the design of a control system must reflect the fact that there are resource constraints, and the benefits of controls must be considered relative to their costs. Because of the inherent limitations in all control systems, no evaluation of controls can provide absolute assurance that all control issues and instances of fraud, if any, h ave been detected. These inherent limitations include the realities that judgments in decision-making can be faulty and that breakdowns can occur because of error or mistake. Controls can also be circumvented by the individual acts of some persons, by collusion of two or more people, or by management override of the controls. The design of any system of controls is based in part on certain assumptions about the likelihood of future events, and there can be no assurance that any design will succeed in achieving its stated goals under all potential future conditions. Over time, controls may become inadequate because of changes in conditions or deterioration in the degree of compliance with policies or procedures. Because of the inherent limitations in a cost-effective control system, misstatements due to error or fraud may occur and not be detected.
Conclusion Regarding the Effectiveness of Disclosure Controls and Procedures. Based on our controls evaluation, our Chief Executive Officer and Chief Financial Officer concluded that as of the end of the period covered by this annual report, our disclosure controls and procedures were effective to provide reasonable assurance that: (i) the information required to be disclosed by us in reports that we file or submit under the Exchange Act is recorded, processed, summarized and reported within the time periods specified in the SEC’s rules and forms; and (ii) material information is accumulated and communicated to our management, including our Chief Executive Officer and Chief Financial Officer, as appropriate to allow timely decisions regarding required di sclosure.
Management’s Report on Internal Control Over Financial Reporting. Our management is responsible for establishing and maintaining adequate internal control over financial reporting, as such term is defined in Rules 13a-15(f) and 15d-15(f) under the Securities Exchange Act of 1934. Under the supervision and with the participation of our management, including our Chief Executive Officer and Chief Financial Officer, we conducted an evaluation of the effectiveness of our internal control over financial reporting based on the framework in Internal Control – Integrated Framework issued by the Committee of Sponsoring Organizations of the Treadway Commission. Based on our evaluation under t he framework in Internal Control – Integrated Framework, our management concluded that our internal control over financial reporting was effective as of December 31, 2010.
The effectiveness of our internal control over financial reporting as of December 31, 2010 has been audited by PricewaterhouseCoopers LLP, an independent registered public accounting firm, as stated in their report which is included herein.
Remediation of Prior Material Weakness in Internal Control Over Financial Reporting. Our management previously identified and disclosed a material weakness in internal control over the actuarial reporting process related to certain supplemental health policies in our Washington National segment. A material weakness is a deficiency, or combination of deficiencies, in internal control over financial reporting, such that there is a reasonable possibility that a material misstatement of our annual or interim financial statements will not be prevented or detected on a timely basis.
We have devoted significant efforts and resources towards remediation of the material weakness that was in existence at December 31, 2009. These remediation efforts, outlined below, were specifically designed to address the material weakness previously identified by our management.
Our remediation efforts were under the direction of the Chief Financial Officer and the status of the efforts were regularly reviewed with management and the Company’s Audit and Enterprise Risk Committee of the Board of Directors who were advised of issues encountered and key decisions reached.
Prior to 2010, management enhanced the design of existing controls and implemented new controls to mitigate the risk of material misstatement related to certain supplemental health policies in our Washington National segment (formerly included in the Conseco Insurance Group segment before our segment changes made in the third quarter of 2010). However, the newly implemented controls had not operated effectively to demonstrate their effectiveness as of December 31, 2009. Our management took the following actions to remediate this material weakness during 2010:
| · | Developed enhancements to our actuarial valuation systems to eliminate the need for certain manual calculations and reduced the reliance on manual controls. |
| · | Enhanced our actuarial reporting systems to allow for better evaluation and monitoring of the reasonableness of our reserve estimates. |
| · | Assessed the design and tested the continued operating effectiveness of key controls over the actuarial reporting process. |
Based upon the significant actions taken and the testing and evaluation of the effectiveness of the enhanced and new controls, our management has concluded the material weakness in controls over the actuarial reporting process related to certain supplemental health policies in the Washington National segment no longer existed as of December 31, 2010.
Changes to Internal Control Over Financial Reporting. Other than the continued effective operation of controls implemented to address the material weakness described above, there were no other changes in the Company’s internal control over financial reporting (as defined in Rule 13a-15(f) under the Securities Exchange Act of 1934) during the quarter ended December 31, 2010, that have materially affected, or are reasonably likely to materially affect, our internal control over financial reporting.
ITEM 9B. OTHER INFORMATION.
None.
PART III
ITEM 10. DIRECTORS, EXECUTIVE OFFICERS AND CORPORATE GOVERNANCE.
We will provide information that is responsive to this Item 10 in our definitive proxy statement or in an amendment to this Annual Report not later than 120 days after the end of the fiscal year covered by this Annual Report. That information is incorporated by reference into this Item 10. Additional information called for by this item is contained in Part I of this Annual Report under the caption “Executive Officers of the Registrant.”
ITEM 11. EXECUTIVE COMPENSATION.
We will provide information that is responsive to this Item 11 in our definitive proxy statement or in an amendment to this Annual Report not later than 120 days after the end of the fiscal year covered by this Annual Report. That information is incorporated by reference into this Item 11.
ITEM 12. SECURITY OWNERSHIP OF CERTAIN BENEFICIAL OWNERS AND MANAGEMENT AND RELATED STOCKHOLDER MATTERS.
We will provide information that is responsive to this Item 12 in our definitive proxy statement or in an amendment to this Annual Report not later than 120 days after the end of the fiscal year covered by this Annual Report. That information is incorporated by reference into this item 12.
ITEM 13. CERTAIN RELATIONSHIPS AND RELATED TRANSACTIONS, AND DIRECTOR INDEPENDENCE.
We will provide information that is responsive to this Item 13 in our definitive proxy statement or in an amendment to this Annual Report not later than 120 days after the end of the fiscal year covered by this Annual Report. That information is incorporated by reference into this Item 13.
ITEM 14. PRINCIPAL ACCOUNTANT FEES AND SERVICES.
We will provide information that is responsive to this Item 14 in our definitive proxy statement or in an amendment to this Annual Report not later than 120 days after the end of the fiscal year covered by this Annual Report. That information is incorporated by reference into this Item 14.
PART IV
ITEM 15.EXHIBITS AND FINANCIAL STATEMENT SCHEDULES.
| (a) | 1. | Financial Statements. See Index to Consolidated Financial Statements on page 117 for a list of financial statements included in this Report. |
| | | |
| | 2. | Financial Statement Schedules. The following financial statement schedules are included as part of this Report immediately following the signature page: |
| | | |
| | | Schedule II -- Condensed Financial Information of Registrant (Parent Company) |
| | | |
| | | Schedule IV -- Reinsurance |
All other schedules are omitted, either because they are not applicable, not required, or because the information they contain is included elsewhere in the consolidated financial statements or notes.
3. Exhibits. See Exhibit Index immediately preceding the Exhibits filed with this report.
SIGNATURES
Pursuant to the requirements of Section 13 of the Securities Exchange Act of 1934, the Registrant has duly caused this report to be signed on its behalf by the undersigned, thereunto duly authorized, this 24th day of February, 2011.
CNO FINANCIAL GROUP, INC.
By: /s/ C. James Prieur
C. James Prieur
Chief Executive Officer
Pursuant to the requirements of the Securities Exchange Act of 1934, this Report has been signed below by the following persons on behalf of the Registrant and in the capacities and on the dates indicated:
| Signature | | Title (Capacity) | | Date |
| | | | | |
| /s / C. JAMES PRIEUR | | Director and Chief Executive Officer | | February 24, 2011 |
| C. James Prieur | | (Principal Executive Officer) | | |
| | | | | |
| /s / EDWARD J. BONACH | | Executive Vice President | | February 24, 2011 |
| Edward J. Bonach | | and Chief Financial Officer | | |
| | | (Principal Financial Officer) | | |
| | | | | |
| /s / JOHN R. KLINE | | Senior Vice President | | February 24, 2011 |
| John R. Kline | | and Chief Accounting Officer | | |
| | | (Principal Accounting Officer) | | |
| | | | | |
| /s / R. GLENN HILLIARD | | Director | | February 24, 2011 |
| R. Glenn Hilliard | | | | |
| | | | | |
| /s / DONNA A. JAMES | | Director | | February 24, 2011 |
| Donna A. James | | | | |
| | | | | |
| /s / R. KEITH LONG | | Director | | February 24, 2011 |
| R. Keith Long | | | | |
| | | | | |
| /s / CHARLES W. MURPHY | | Director | | February 24, 2011 |
| Charles W. Murphy | | | | |
| | | | | |
| /s / DEBRA J. PERRY | | Director | | February 24, 2011 |
| Debra J. Perry | | | | |
| | | | | |
| /s / NEAL C. SCHNEIDER | | Director | | February 24, 2011 |
| Neal C. Schneider | | | | |
| | | | | |
| /s / MICHAEL T. TOKARZ | | Director | | February 24, 2011 |
| Michael T. Tokarz | | | | |
| | | | | |
| /s / JOHN G. TURNER | | Director | | February 24, 2011 |
| John G. Turner | | | | |
| | | | | |
| /s / DAVID K. ZWIENER | | Director | | February 24, 2011 |
| David K. Zwiener | | | | |
Report of Independent Registered Public Accounting Firm on
Financial Statement Schedules
To the Shareholders and Board of Directors
CNO Financial Group, Inc.:
Our audits of the consolidated financial statements and of the effectiveness of internal control over financial reporting of CNO Financial Group, Inc. and subsidiaries referred to in our report dated February 24, 2011 appearing under Item 8 of this Form 10-K also included an audit of the financial statement schedules at December 31, 2010 and 2009 and for the years ended December 31, 2010, 2009 and 2008 listed in Item 15(a)(2) of this Form 10-K. In our opinion, these financial statement schedules present fairly, in all material respects, the information set forth therein when read in conjunction with the related consolidated financial statements.
/s/ PricewaterhouseCoopers LLP
Indianapolis, Indiana
February 24, 2011
CNO FINANCIAL GROUP, INC. AND SUBSIDIARIES
SCHEDULE II
Condensed Financial Information of Registrant (Parent Company)
Balance Sheet
as of December 31, 2010 and 2009
(Dollars in millions)
| ASSETS |
| | | 2010 | | | 2009 | |
| | | | | | | |
| Cash and cash equivalents - unrestricted | | $ | 160.0 | | | $ | 145.3 | |
| Other invested assets | | | .2 | | | | .2 | |
| Investment in wholly-owned subsidiaries (eliminated in consolidation) | | | 5,362.0 | | | | 4,902.4 | |
| Receivable from subsidiaries (eliminated in consolidation) | | | 2.3 | | | | .9 | |
| Other assets | | | 20.5 | | | | 16.1 | |
| | | | | | | | | |
| Total assets | | $ | 5,545.0 | | | $ | 5,064.9 | |
| | | | | | | | | |
| | | | | | | | | |
| |
| | | | | | | | | |
| Liabilities: | | | | | | | | |
| Notes payable | | $ | 998.5 | | | $ | 1,037.4 | |
| Payable to subsidiaries (eliminated in consolidation) | | | 78.3 | | | | 360.2 | |
| Income tax liabilities, net | | | 87.2 | | | | 76.2 | |
| Other liabilities | | | 55.7 | | | | 58.7 | |
| | | | | | | | | |
| Total liabilities | | | 1,219.7 | | | | 1,532.5 | |
| | | | | | | | | |
| | | | | | | | | |
| Commitments and Contingencies | | | | | | | | |
| | | | | | | | | |
| Shareholders’ equity: | | | | | | | | |
Common stock and additional paid-in capital ($.01 par value, 8,000,000,000 shares authorized, shares issued and outstanding: 2010 – 251,084,174; 2009 – 250,786,216) | | $ | 4,426.7 | | | | 4,411.3 | |
| Accumulated other comprehensive income (loss) | | | 238.3 | | | | (264.3 | ) |
| Accumulated deficit | | | (339.7 | ) | | | (614.6 | ) |
| | | | | | | | | |
| Total shareholders’ equity | | | 4,325.3 | | | | 3,532.4 | |
| | | | | | | | | |
| Total liabilities and shareholders’ equity | | $ | 5,545.0 | | | $ | 5,064.9 | |
The accompanying notes are an integral part
of the condensed financial information.
CNO FINANCIAL GROUP, INC. AND SUBSIDIARIES
SCHEDULE II
Condensed Financial Information of Registrant (Parent Company)
Statement of Operations
for the years ended December 31, 2010, 2009 and 2008
(Dollars in millions)
| | | 2010 | | | 2009 | | | 2008 | |
| | | | | | | | | | |
| Revenues: | | | | | | | | | |
| Net investment income | | $ | - | | | $ | - | | | $ | 2.3 | |
| Net realized investment losses | | | - | | | | (.2 | ) | | | (25.9 | ) |
| Fee and interest income from subsidiaries (eliminated in consolidation) | | | - | | | | - | | | | .7 | |
| | | | | | | | | | | | | |
| Total revenues | | | - | | | | (.2 | ) | | | (22.9 | ) |
| | | | | | | | | | | | | |
| Expenses: | | | | | | | | | | | | |
| Interest expense on notes payable | | | 79.3 | | | | 84.7 | | | | 67.9 | |
| Intercompany expenses (eliminated in consolidation) | | | 1.3 | | | | 2.4 | | | | 8.3 | |
| Operating costs and expenses | | | 49.3 | | | | 45.6 | | | | 34.2 | |
| (Gain) loss on extinguishment or modification of debt | | | 6.8 | | | | 22.2 | | | | (21.2 | ) |
| | | | | | | | | | | | | |
| Total expenses | | | 136.7 | | | | 154.9 | | | | 89.2 | |
| | | | | | | | | | | | | |
| Loss before income taxes and equity in undistributed earnings of subsidiaries | | | (136.7 | ) | | | (155.1 | ) | | | (112.1 | ) |
| | | | | | | | | | | | | |
| Income tax expense (benefit): | | | | | | | | | | | | |
| Income tax benefit on period income | | | (50.8 | ) | | | (57.8 | ) | | | (39.1 | ) |
| Valuation allowance for deferred tax assets | | | - | | | | - | | | | 54.1 | |
| | | | | | | | | | | | | |
| Loss before equity in undistributed earnings of subsidiaries and discontinued operations | | | (85.9 | ) | | | (97.3 | ) | | | (127.1 | ) |
| | | | | | | | | | | | | |
| Equity in undistributed earnings of subsidiaries (eliminated in consolidation) | | | 370.5 | | | | 183.0 | | | | (282.5 | ) |
| | | | | | | | | | | | | |
| Income (loss) before discontinued operations | | | 284.6 | | | | 85.7 | | | | (409.6 | ) |
| Discontinued operations, net of income taxes: | | | | | | | | | | | | |
| Parent company | | | - | | | | - | | | | (166.3 | ) |
| Subsidiary | | | - | | | | - | | | | (556.4 | ) |
| | | | | | | | | | | | | |
| Net income (loss) | | $ | 284.6 | | | $ | 85.7 | | | $ | (1,132.3 | ) |
The accompanying notes are an integral part
of the condensed financial information.
CNO FINANCIAL GROUP, INC. AND SUBSIDIARIES
SCHEDULE II
Condensed Financial Information of Registrant (Parent Company)
Statement of Cash Flows
for the years ended December 31, 2010, 2009 and 2008
(Dollars in millions)
| | | 2010 | | | 2009 | | | 2008 | |
| | | | | | | | | | |
| Cash flows used by operating activities | | $ | (119.1 | ) | | $ | (110.7 | ) | | $ | (97.4 | ) |
| | | | | | | | | | | | | |
| Cash flows from investing activities: | | | | | | | | | | | | |
| Sales of investments | | | - | | | | - | | | | 13.9 | |
| Purchases of investments | | | - | | | | - | | | | (39.8 | ) |
| Investments and advances to consolidated subsidiaries* | | | 26.6 | | | | - | | | | (24.0 | ) |
| Change in restricted cash �� | | | - | | | | - | | | | 1.9 | |
| | | | | | | | | | | | | |
| Net cash used by investing activities | | | 26.6 | | | | - | | | | (48.0 | ) |
| | | | | | | | | | | | | |
| Cash flows from financing activities: | | | | | | | | | | | | |
| Issuance of notes payable, net | | | 756.1 | | | | 172.0 | | | | 75.0 | |
| Issuance of common stock | | | - | | | | 296.3 | | | | - | |
| Payments on notes payable | | | (793.6 | ) | | | (461.2 | ) | | | (44.0 | ) |
| Expenses related to debt modification or extinguishment of debt | | | - | | | | (14.7 | ) | | | - | |
| Issuance of notes payable to affiliates* | | | 177.0 | | | | 266.9 | | | | 148.0 | |
| Payments on notes payable to affiliates* | | | (32.3 | ) | | | (59.8 | ) | | | (61.4 | ) |
| | | | | | | | | | | | | |
| Net cash provided by financing activities | | | 107.2 | | | | 199.5 | | | | 117.6 | |
| | | | | | | | | | | | | |
| Net increase (decrease) in cash and cash equivalents | | | 14.7 | | | | 88.8 | | | | (27.8 | ) |
| | | | | | | | | | | | | |
| Cash and cash equivalents, beginning of the year | | | 145.3 | | | | 56.5 | | | | 84.3 | |
| | | | | | | | | | | | | |
| Cash and cash equivalents, end of the year | | $ | 160.0 | | | $ | 145.3 | | | $ | 56.5 | |
* Eliminated in consolidation
The accompanying notes are an integral part
of the condensed financial information.
CNO FINANCIAL GROUP, INC. AND SUBSIDIARIES
SCHEDULE II
Notes to Condensed Financial Information
1. Basis of Presentation
The condensed financial information should be read in conjunction with the consolidated financial statements of CNO Financial Group, Inc. The condensed financial information includes the accounts and activity of the parent company.
CNO FINANCIAL GROUP, INC. AND SUBSIDIARIES
SCHEDULE IV
Reinsurance
for the years ended December 31, 2010, 2009 and 2008
(Dollars in millions)
| | | 2010 | | | 2009 | | | 2008 | |
| Life insurance inforce: | | | | | | | | | |
| Direct | | $ | 59,388.5 | | | $ | 61,814.4 | | | $ | 65,271.1 | |
| Assumed | | | 374.2 | | | | 403.5 | | | | 1,129.8 | |
| Ceded | | | (14,800.9 | ) | | | (16,461.5 | ) | | | (13,805.9 | ) |
| | | | | | | | | | | | | |
| Net insurance inforce | | $ | 44,961.8 | | | $ | 45,756.4 | | | $ | 52,595.0 | |
| | | | | | | | | | | | | |
| Percentage of assumed to net | | | .8 | % | | | .9 | % | | | 2.1 | % |
| | | | | | | | | | | | | |
| | | | | | | | | | | | | |
| | | 2010 | | | 2009 | | | 2008 | |
| Insurance policy income: | | | | | | | | | |
| Direct | | $ | 2,525.5 | | | $ | 2,451.8 | | | $ | 2,438.0 | |
| Assumed | | | 92.6 | | | | 475.5 | | | | 641.0 | |
| Ceded | | | (258.6 | ) | | | (179.4 | ) | | | (164.0 | ) |
| | | | | | | | | | | | | |
| Net premiums | | $ | 2,359.5 | | | $ | 2,747.9 | | | $ | 2,915.0 | |
| | | | | | | | | | | | | |
| Percentage of assumed to net | | | 3.9 | % | | | 17.3 | % | | | 22.0 | % |
EXHIBIT INDEX
Exhibit
No. Description
| 3.1 | Amended and Restated Certificate of Incorporation of CNO Financial Group, Inc., incorporated by reference to Exhibit 3.1 of our Current Report on Form 8-K filed May 12, 2010. |
| 3.2 | Amended and Restated Bylaws of CNO Financial Group, Inc. dated as of May 11, 2010, incorporated by reference to Exhibit 3.2 of our Current Report on Form 8-K filed May 12, 2010. |
| 4.1 | Section 382 Rights Agreement, dated as of January 20, 2009, between the Corporation and American Stock Transfer & Trust Company, LLC, as Rights Agent, which includes the Certificate of Designations for the Series A Junior Participating Preferred Stock as Exhibit A, the Form of Right Certificate as Exhibit B and the Summary of Rights to Purchase Preferred Shares as Exhibit C, incorporated by reference to Exhibit 4.1 of our Current Report on Form 8-K filed January 20, 2009. |
| 4.2 | Form of specimen stock certificate, incorporated by reference to Exhibit 4.1 of our Current Report on Form 8-K filed May 12, 2010. |
| 4.3 | Form of Warrant, incorporated by reference to Exhibit 10.13 of our Current Report on Form 8-K filed October 13, 2009. |
| 4.4 | Indenture dated as of August 15, 2005 for 3.50% Convertible Debentures due September 30, 2035 between the Corporation and The Bank of New York Trust Company, N.A., as Trustee, incorporated by reference to Exhibit 4.4 of our Current Report on Form 8-K filed August 16, 2005. |
| 4.5 | Indenture dated as of October 16, 2009, between the Corporation and The Bank of New York Mellon Trust Company, N.A., as trustee, incorporated by reference to Exhibit 4.1 of our Current Report on Form 8-K filed October 19, 2009, as amended by First Supplemental Indenture dated as of February 3, 2010, incorporated by reference to Exhibit 4.2 of our Current Report on Form 8-K filed February 5, 2010. |
| 4.6 | Form of 7.0% Convertible Senior Debentures due 2016, incorporated by reference to Exhibit 4.1 of our Current Report on Form 8-K filed October 19, 2009. |
| 4.7 | Indenture dated as of December 21, 2010, by and among CNO Financial Group, Inc., the subsidiary guarantors party thereto and Wilmington Trust FSB, as trustee and collateral agent, incorporated by reference to Exhibit 4.1 of our Current Report on Form 8-K filed December 22, 2010. |
| 4.8 | Form of 9.00% Senior Secured Note due 2018 (included in the Indenture described in Exhibit 4.7 above). |
| 10.1 | Credit Agreement dated as of December 21, 2010 by and among CNO Financial Group, Inc., Morgan Stanley Senior Funding, Inc., as Agent, and the lenders from time to time parties thereto, incorporated by reference to Exhibit 10.1 of our Current Report on Form 8-K filed December 22, 2010. |
| 10.2 | Pari Passu Intercreditor Agreement dated as of December 21, 2010 by and among Morgan Stanley Senior Funding, Inc., as Administrative Agent, and Wilmington Trust FSB, as collateral agent and authorized representative with respect to the 9.00% Senior Secured Notes due 2018, incorporated by reference to Exhibit 10.2 of our Current Report on Form 8-K filed December 22, 2010. |
| 10.3 | Guarantee and Security Agreement dated as of December 21, 2010 by and among CNO Financial Group, Inc., the subsidiary guarantors party thereto and Morgan Stanley Senior Funding, Inc., as Agent, incorporated by reference to Exhibit 10.3 of our Current Report on Form 8-K filed December 22, 2010. |
| 10.4 | Security Agreement dated as of December 21, 2010 by and among CNO Financial Group, Inc., the subsidiary guarantors party thereto and Wilmington Trust FSB, as Collateral Agent, incorporated by reference to Exhibit 10.4 of our Current Report on Form 8-K filed December 22, 2010. |
| 10.5 | Stock and Warrant Purchase Agreement dated as of October 13, 2009 by and between the Corporation and Paulson & Co. Inc. on behalf of several investment funds and accounts managed by it, incorporated by reference to Exhibit 10.1 of our Current Report on Form 8-K filed October 13, 2009. |
| 10.6 | Purchase Agreement, dated as of October 14, 2009, between Conseco, Inc. and Morgan Stanley & Co. Incorporated, incorporated by reference to Exhibit (b)(1) of our Schedule TO filed on October 15, 2009, as amended by Amendment Number One dated as of February 3, 2010, incorporated by reference to Exhibit 10.1 to our Current Report on Form 8-K filed February 5, 2010. |
| 10.7 | Investor Rights Agreement dated as of November 13, 2009 by and between the Corporation and Paulson & Co. Inc. on behalf of the several investment funds and accounts managed by it, incorporated by reference to Exhibit 10.3 of our Annual Report on Form 10-K for the year ended December 31, 2009. |
| 10.8 | Underwriting Agreement dated as of December 16, 2009 between Conseco, Inc. and Morgan Stanley & Co. Incorporated, incorporated by reference to Exhibit 10.6 of our Annual Report on Form 10-K for the year ended December 31, 2009. |
| 10.9 | Purchase Agreement dated December 14, 2010 by and among CNO Financial Group, Inc., Morgan Stanley & Co. Incorporated, Barclays Capital Inc., FBR Capital Markets & Co. and the guarantors party thereto, incorporated by reference to Exhibit 10.1 to our Current Report on Form 8-K filed December 16, 2010. |
| 10.11 | Letter of agreement dated as of August 3, 2007 between Conseco Services, LLC and John R. Kline, incorporated by reference to Exhibit 10.11 of our Quarterly Report on Form 10-Q for the quarter ended September 30, 2007. |
| 10.12 | Amended and Restated Employment Agreement dated as of December 21, 2009 between 40|86 Advisors, Inc. and Eric R. Johnson, incorporated by reference to Exhibit 10.12 of our Annual Report on Form 10-K for the year ended December 31, 2009, as amended by Amendment to Employment Agreement dated February 7, 2011 filed herewith. |
| 10.13 | CNO Financial Group, Inc. (formerly Conseco, Inc.) Amended and Restated Long-Term Incentive Plan, incorporated by reference to Annex B to our Proxy Statement filed on April 23, 2009. |
| 10.14 | Form of executive stock option agreement under Amended and Restated Long-Term Incentive Plan, incorporated by reference to Exhibit 10.14 of our Annual Report on Form 10-K for the year ended December 31, 2005. |
| 10.15 | Form of executive restricted stock agreement under Amended and Restated Long-Term Incentive Plan, incorporated by reference to Exhibit 10.15 of our Annual Report on Form 10-K for the year ended December 31, 2004. |
| 10.16 | Form of Indemnification Agreement among the Corporation, CDOC, Inc., CNO Services, LLC (formerly Conseco Services, LLC) and each director of Conseco, Inc., incorporated by reference to Exhibit 10.16 of our Annual Report on Form 10-K for the year ended December 31, 2008. |
| 10.18 | Closing Agreement on Final Determination Covering Specific Matters, incorporated by reference to Exhibit 10.14 of our Current Report on Form 8-K filed September 14, 2004. |
| 10.20 | 2010 Pay for Performance Incentive Plan, incorporated by reference to Annex B to our proxy statement filed April 14, 2010. |
| 10.21 | Closing Agreement on Final Determination Covering Specific Matters, incorporated by reference to Exhibit 10.21 of our Current Report on Form 8-K filed August 1, 2006. |
| 10.22 | Form of performance unit award agreement under the Amended and Restated Long-Term Incentive Plan, incorporated by reference to Exhibit 10.22 of our Quarterly Report on Form 10-Q for the quarter ended June 30, 2006. |
| 10.24 | Deferred Compensation Plan effective January 1, 2007, incorporated by reference to Exhibit 10.24 of our Quarterly Report on Form 10-Q for the quarter ended September 30, 2006, as amended by First Amendment of the Conseco Deferred Compensation Plan, effective January 1, 2007, incorporated by reference to Exhibit 10.24 of our Annual Report on Form 10-K for the year ended December 31, 2007. |
| 10.25 | Amended and Restated Employment Agreement dated as of May 25, 2010 between CNO Services, LLC (formerly Conseco Services, LLC) and Susan L. Menzel, incorporated by reference to Exhibit 10.25 of our Quarterly Report on Form 10-Q for the quarter ended June 30, 2010. |
| 10.27 | Amended and Restated Employment Agreement dated as of November 1, 2009 between CNO Services, LLC (formerly Conseco Services, LLC) and Christopher J. Nickele, incorporated by reference to Exhibit 10.27 of our Annual Report on Form 10-K for the year ended December 31, 2009, as amended by Amendment to Employment Agreement dated May 1, 2010, incorporated by reference to Exhibit 10.27 of our Quarterly Report on Form 10-Q for the quarter ended June 30, 2010. |
| 10.28 | Amended and Restated Employment Agreement dated as of December 10, 2010 between CNO Services, LLC and Scott R. Perry, filed herewith. |
| 10.31 | Stipulation of Settlement - In Re Conseco Life Insurance Co. Cost of Insurance Litigation, Cause No. MDL 1610 (Central District, California), incorporated by reference to Exhibit 10.31 of our Annual Report on Form 10-K for the year ended December 31, 2006. |
| 10.32 | Amended and Restated Employment Agreement dated as of May 26, 2010 between CNO Financial Group, Inc. and Edward J. Bonach, incorporated by reference to Exhibit 10.32 of our Quarterly Report on Form 10-Q for the quarter ended June 30, 2010. |
| 10.34 | Coinsurance and Administration Agreement between Conseco Insurance Company and Reassure American Life Insurance Company, incorporated by reference to Exhibit 10.34 of our Quarterly Report on Form 10-Q for the quarter ended June 30, 2007. |
| 10.36 | Amended and Restated Employment Agreement dated as of May 26, 2010 between CNO Services, LLC (formerly Conseco Services, LLC) and Steven M. Stecher, incorporated by reference to Exhibit 10.36 of our Quarterly Report on Form 10-Q for the quarter ended June 30, 2010. |
| 10.38 | Employment Agreement dated as of June 11, 2008 between Conseco Services, LLC and Matthew J. Zimpfer, incorporated by reference to Exhibit 10.38 of our Quarterly Report on Form 10-Q for the quarter ended June 30, 2008, as amended by Amendment to Employment Agreement dated as of May 29, 2009, incorporated by reference to Exhibit 10.38 of our Quarterly Report on Form 10-Q for the quarter ended June 30, 2009. |
| 12.1 | Computation of Ratio of Earnings to Fixed Charges and Preferred Dividends. |
| 21 | Subsidiaries of the Registrant. |
| 23.1 | Consent of PricewaterhouseCoopers LLP. |
| 31.1 | Certification Pursuant to the Securities Exchange Act Rule 13a-14(a)/15d-14(a), as Adopted Pursuant to Section 302 of the Sarbanes-Oxley Act of 2002. |
| 31.2 | Certification Pursuant to the Securities Exchange Act Rule 13a-14(a)/15d-14(a), as Adopted Pursuant to Section 302 of the Sarbanes-Oxley Act of 2002. |
| 32.1 | Certification Pursuant to 18 U.S.C. Section 1350, as Adopted Pursuant to Section 906 of the Sarbanes-Oxley Act of 2002. |
| 32.2 | Certification Pursuant to 18 U.S.C. Section 1350, as Adopted Pursuant to Section 906 of the Sarbanes-Oxley Act of 2002. |
| | COMPENSATION PLANS AND ARRANGEMENTS |
| 10.11 | Letter of agreement dated as of August 3, 2007 between Conseco Services, LLC and John R. Kline, incorporated by reference to Exhibit 10.11 of our Quarterly Report on Form 10-Q for the quarter ended September 30, 2007. |
| 10.12 | Amended and Restated Employment Agreement dated as of December 21, 2009 between 40|86 Advisors, Inc. and Eric R. Johnson, incorporated by reference to Exhibit 10.12 of our Annual Report on Form 10-K for the year ended December 31, 2009, as amended by Amendment to Employment Agreement dated February 7, 2011 filed herewith. |
| 10.13 | CNO Financial Group, Inc. (formerly Conseco, Inc.) Amended and Restated Long-Term Incentive Plan, incorporated by reference to Annex B to our Proxy Statement filed on April 23, 2009. |
| 10.14 | Form of executive stock option agreement under Amended and Restated Long-Term Incentive Plan, incorporated by reference to Exhibit 10.14 of our Annual Report on Form 10-K for the year ended December 31, 2005. |
| 10.15 | Form of executive restricted stock agreement under Amended and Restated Long-Term Incentive Plan, incorporated by reference to Exhibit 10.15 of our Annual Report on Form 10-K for the year ended December 31, 2004. |
| 10.20 | 2010 Pay for Performance Incentive Plan, incorporated by reference to Annex B to our proxy statement filed April 14, 2010. |
| 10.22 | Form of performance unit award agreement under the Amended and Restated Long-Term Incentive Plan, incorporated by reference to Exhibit 10.22 of our Quarterly Report on Form 10-Q for the quarter ended June 30, 2006. |
| 10.24 | Deferred Compensation Plan effective January 1, 2007, incorporated by reference to Exhibit 10.24 of our Quarterly Report on Form 10-Q for the quarter ended September 30, 2006, as amended by First Amendment of the Conseco Deferred Compensation Plan, effective January 1, 2007, incorporated by reference to Exhibit 10.24 of our Annual Report on Form 10-K for the year ended December 31, 2007. |
| 10.25 | Amended and Restated Employment Agreement dated as of May 25, 2010 between CNO Services, LLC (formerly Conseco Services, LLC) and Susan L. Menzel, incorporated by reference to Exhibit 10.25 of our Quarterly Report on Form 10-Q for the quarter ended June 30, 2010. |
| 10.27 | Amended and Restated Employment Agreement dated as of November 1, 2009 between CNO Services, LLC (formerly Conseco Services, LLC) and Christopher J. Nickele, incorporated by reference to Exhibit 10.27 of our Annual Report on Form 10-K for the year ended December 31, 2009, as amended by Amendment to Employment Agreement dated May 1, 2010, incorporated by reference to Exhibit 10.27 of our Quarterly Report on Form 10-Q for the quarter ended June 30, 2010. |
| 10.28 | Amended and Restated Employment Agreement dated as of December 10, 2010 between CNO Services, LLC and Scott R. Perry, filed herewith. |
| 10.32 | Amended and Restated Employment Agreement dated as of May 26, 2010 between CNO Financial Group, Inc. and Edward J. Bonach, incorporated by reference to Exhibit 10.32 of our Quarterly Report on Form 10-Q for the quarter ended June 30, 2010. |
| 10.36 | Amended and Restated Employment Agreement dated as of May 26, 2010 between CNO Services, LLC (formerly Conseco Services, LLC) and Steven M. Stecher, incorporated by reference to Exhibit 10.36 of our Quarterly Report on Form 10-Q for the quarter ended June 30, 2010. |
| 10.38 | Employment Agreement dated as of June 11, 2008 between Conseco Services, LLC and Matthew J. Zimpfer, incorporated by reference to Exhibit 10.38 of our Quarterly Report on Form 10-Q for the quarter ended June 30, 2008, as amended by Amendment to Employment Agreement dated as of May 29, 2009, incorporated by reference to Exhibit 10.38 of our Quarterly Report on Form 10-Q for the quarter ended June 30, 2009. |