4Q12 Financial and operating results for the period ended December 31, 2012 February 12, 2013 Unless otherwise specified, comparisons in this presentation are between 4Q12 and 4Q11. Exhibit 99.1

CNO Financial Group | 4Q2012 Earnings | February 12, 2013 2 Forward-Looking Statements Certain statements made in this presentation should be considered forward-looking statements as defined in the Private Securities Litigation Reform Act of 1995. These include statements about future results of operations and capital plans. We caution investors that these forward- looking statements are not guarantees of future performance, and actual results may differ materially. Investors should consider the important risks and uncertainties that may cause actual results to differ, including those included in our press release issued on February 11, 2013, our Quarterly Reports on Form 10-Q, our Annual Report on Form 10-K and other filings we make with the Securities and Exchange Commission. We assume no obligation to update this presentation, which speaks as of today’s date.
CNO Financial Group | 4Q2012 Earnings | February 12, 2013 3 Non-GAAP Measures This presentation contains the following financial measures that differ from the comparable measures under Generally Accepted Accounting Principles (GAAP): operating earnings measures; book value, excluding accumulated other comprehensive income (loss) per share; operating return measures; earnings before net realized investment gains (losses) and corporate interest and taxes; and debt to capital ratios, excluding accumulated other comprehensive income (loss). Reconciliations between those non-GAAP measures and the comparable GAAP measures are included in the Appendix, or on the page such measure is presented. While management believes these measures are useful to enhance understanding and comparability of our financial results, these non-GAAP measures should not be considered substitutes for the most directly comparable GAAP measures. Additional information concerning non-GAAP measures is included in our periodic filings with the Securities and Exchange Commission that are available in the “Investors – SEC Filings” section of CNO’s website, www.CNOinc.com.
CNO Financial Group | 4Q2012 Earnings | February 12, 2013 4
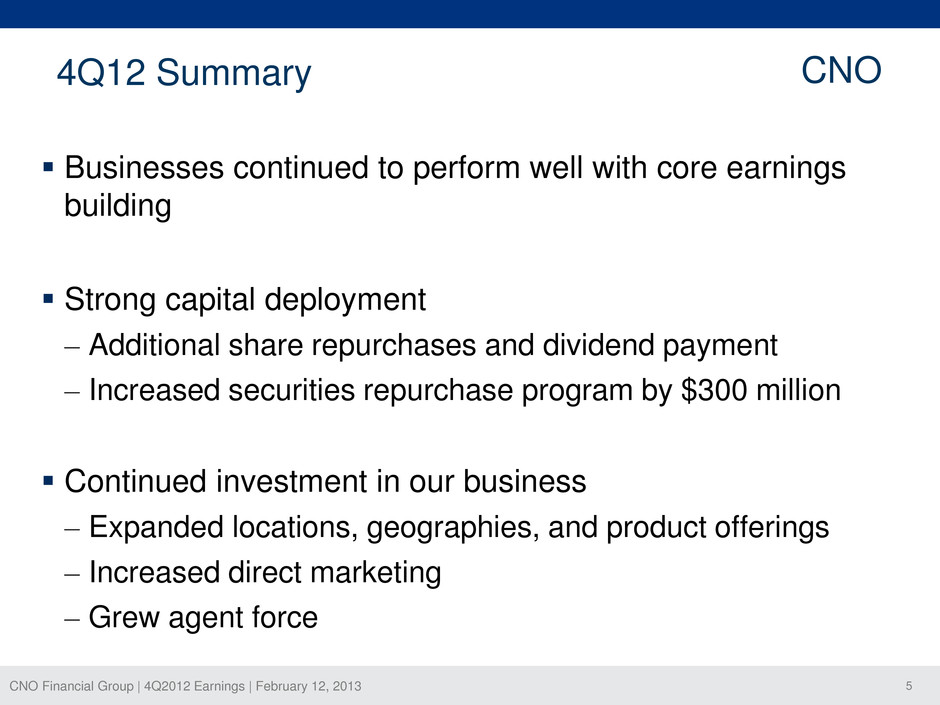
CNO Financial Group | 4Q2012 Earnings | February 12, 2013 5 Businesses continued to perform well with core earnings building Strong capital deployment – Additional share repurchases and dividend payment – Increased securities repurchase program by $300 million Continued investment in our business – Expanded locations, geographies, and product offerings – Increased direct marketing – Grew agent force 4Q12 Summary CNO
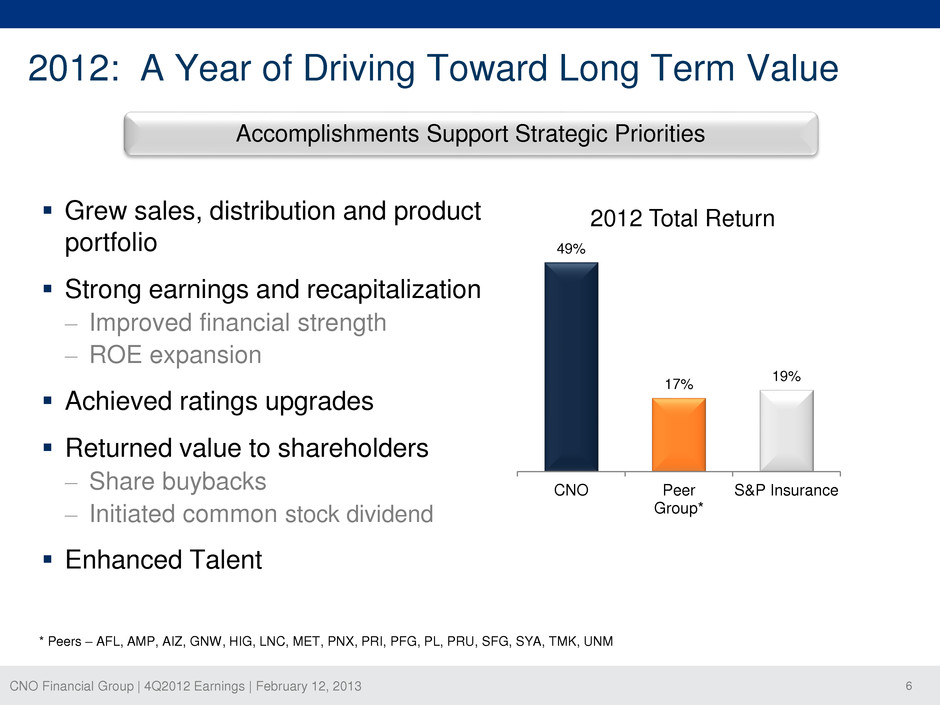
CNO Financial Group | 4Q2012 Earnings | February 12, 2013 6 2012: A Year of Driving Toward Long Term Value Grew sales, distribution and product portfolio Strong earnings and recapitalization – Improved financial strength – ROE expansion Achieved ratings upgrades Returned value to shareholders – Share buybacks – Initiated common stock dividend Enhanced Talent Accomplishments Support Strategic Priorities 49% 17% 19% CNO Peer Group* S&P Insurance 2012 Total Return * Peers – AFL, AMP, AIZ, GNW, HIG, LNC, MET, PNX, PRI, PFG, PL, PRU, SFG, SYA, TMK, UNM
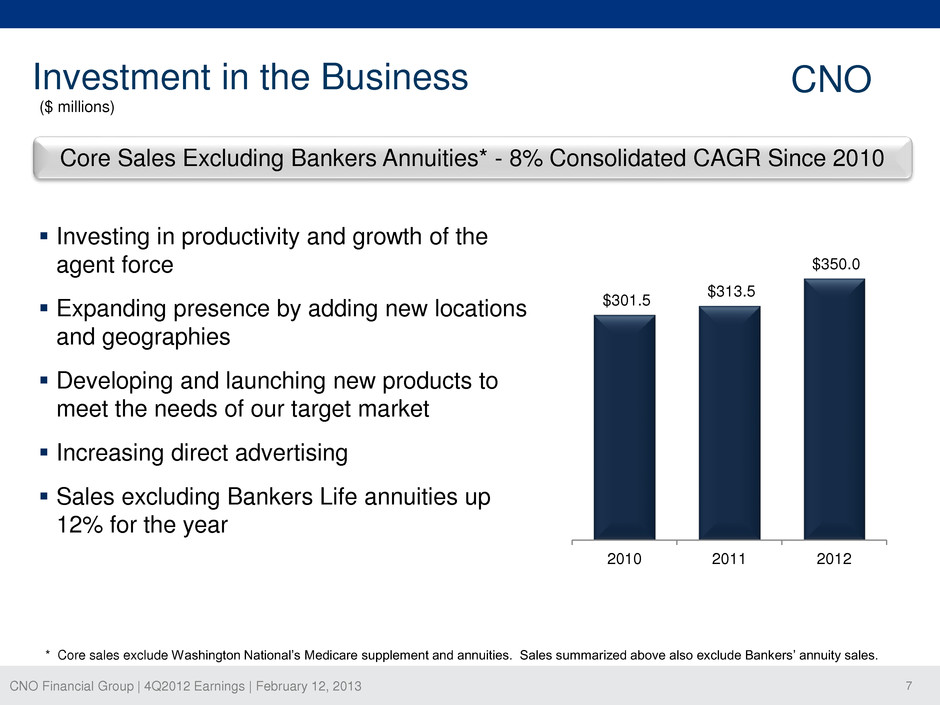
CNO Financial Group | 4Q2012 Earnings | February 12, 2013 7 Investment in the Business CNO Investing in productivity and growth of the agent force Expanding presence by adding new locations and geographies Developing and launching new products to meet the needs of our target market Increasing direct advertising Sales excluding Bankers Life annuities up 12% for the year * Core sales exclude Washington National’s Medicare supplement and annuities. Sales summarized above also exclude Bankers’ annuity sales. ($ millions) Core Sales Excluding Bankers Annuities* - 8% Consolidated CAGR Since 2010 $301.5 $313.5 $350.0 2010 2011 2012
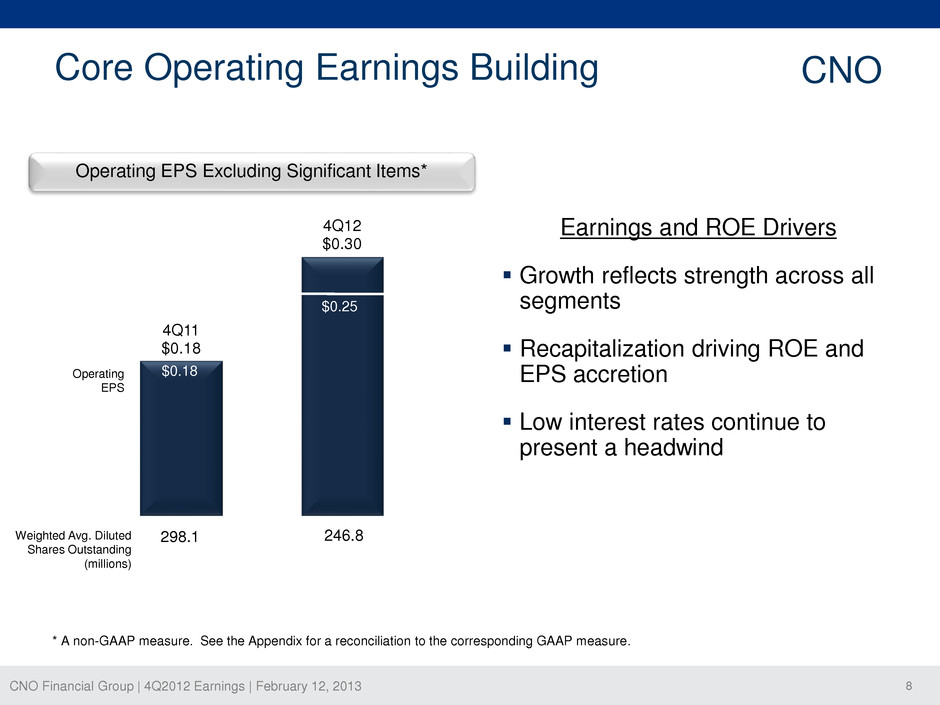
CNO Financial Group | 4Q2012 Earnings | February 12, 2013 8 4Q11 $0.18 4Q12 $0.30 Core Operating Earnings Building * A non-GAAP measure. See the Appendix for a reconciliation to the corresponding GAAP measure. Earnings and ROE Drivers Growth reflects strength across all segments Recapitalization driving ROE and EPS accretion Low interest rates continue to present a headwind CNO Operating EPS $0.18 $0.25 298.1 Weighted Avg. Diluted Shares Outstanding (millions) 246.8 Operating EPS Excluding Significant Items*
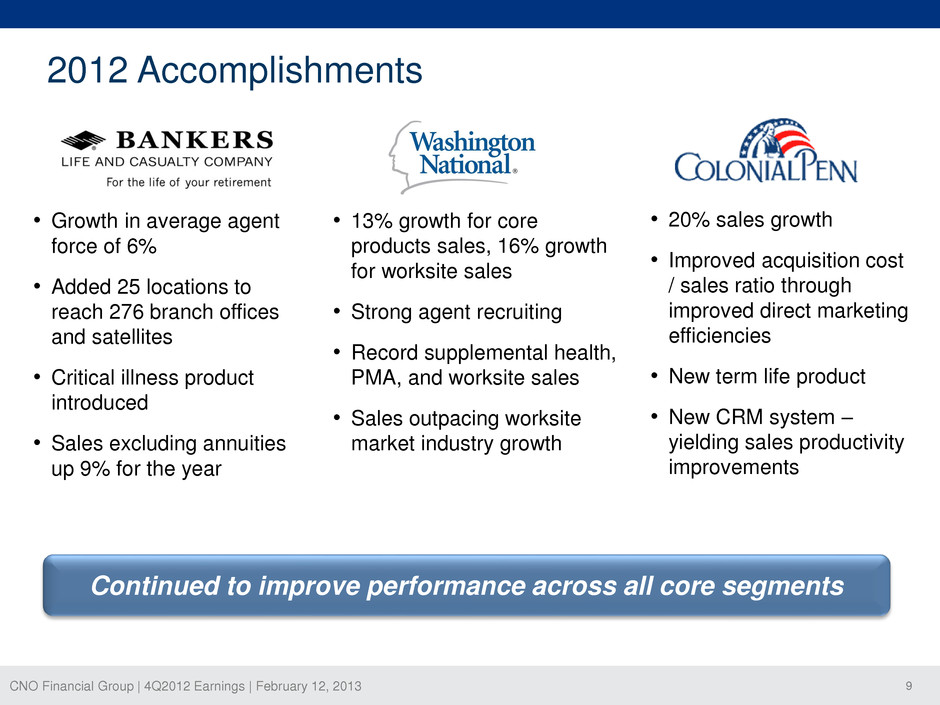
CNO Financial Group | 4Q2012 Earnings | February 12, 2013 9 • 20% sales growth • Improved acquisition cost / sales ratio through improved direct marketing efficiencies • New term life product • New CRM system – yielding sales productivity improvements 2012 Accomplishments Continued to improve performance across all core segments • 13% growth for core products sales, 16% growth for worksite sales • Strong agent recruiting • Record supplemental health, PMA, and worksite sales • Sales outpacing worksite market industry growth • Growth in average agent force of 6% • Added 25 locations to reach 276 branch offices and satellites • Critical illness product introduced • Sales excluding annuities up 9% for the year
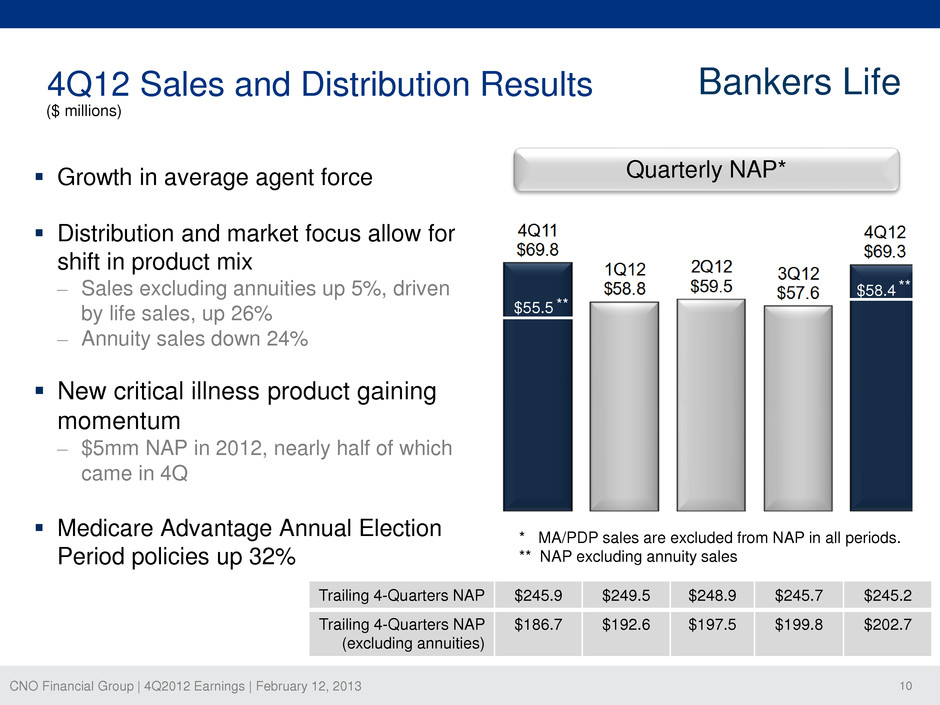
CNO Financial Group | 4Q2012 Earnings | February 12, 2013 10 4Q12 Sales and Distribution Results Growth in average agent force Distribution and market focus allow for shift in product mix – Sales excluding annuities up 5%, driven by life sales, up 26% – Annuity sales down 24% New critical illness product gaining momentum – $5mm NAP in 2012, nearly half of which came in 4Q Medicare Advantage Annual Election Period policies up 32% Bankers Life * MA/PDP sales are excluded from NAP in all periods. ** NAP excluding annuity sales ($ millions) $55.5 $58.4 ** ** Quarterly NAP* Trailing 4-Quarters NAP $245.9 $249.5 $248.9 $245.7 $245.2 Trailing 4-Quarters NAP (excluding annuities) $186.7 $192.6 $197.5 $199.8 $202.7
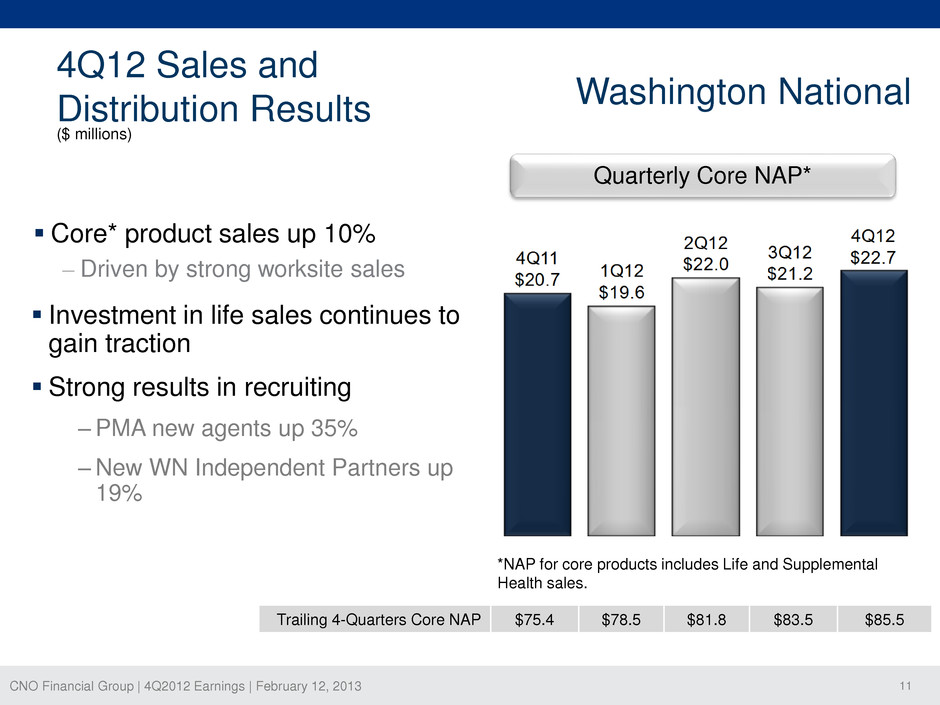
CNO Financial Group | 4Q2012 Earnings | February 12, 2013 11 Washington National 4Q12 Sales and Distribution Results ($ millions) *NAP for core products includes Life and Supplemental Health sales. Quarterly Core NAP* Core* product sales up 10% – Driven by strong worksite sales Investment in life sales continues to gain traction Strong results in recruiting ‒PMA new agents up 35% ‒New WN Independent Partners up 19% Trailing 4-Quarters Core NAP $75.4 $78.5 $81.8 $83.5 $85.5
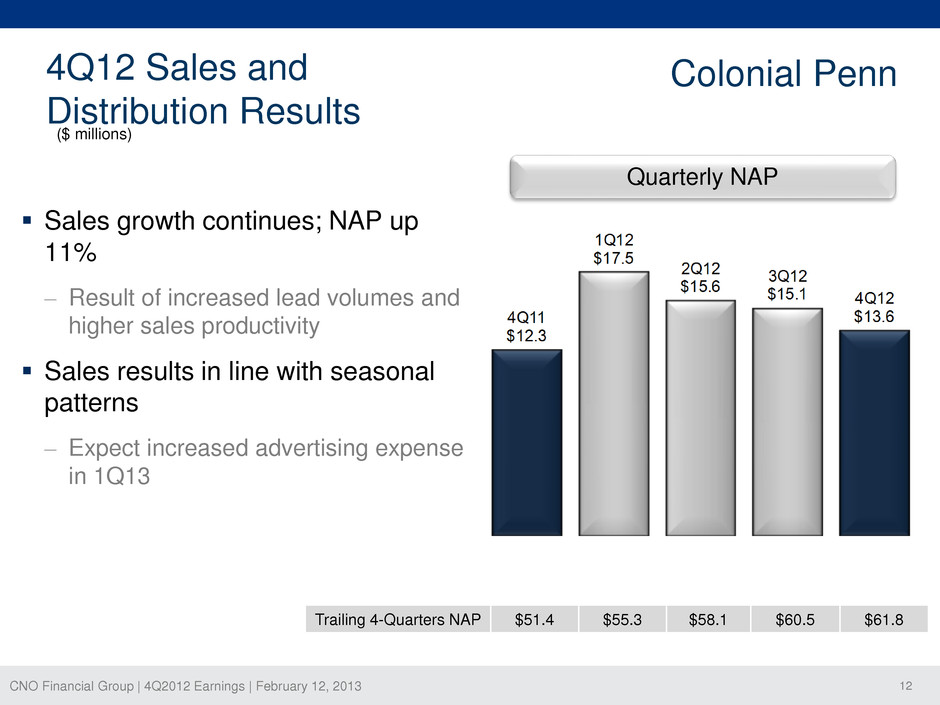
CNO Financial Group | 4Q2012 Earnings | February 12, 2013 12 Sales growth continues; NAP up 11% – Result of increased lead volumes and higher sales productivity Sales results in line with seasonal patterns – Expect increased advertising expense in 1Q13 4Q12 Sales and Distribution Results Colonial Penn ($ millions) Quarterly NAP Trailing 4-Quarters NAP $51.4 $55.3 $58.1 $60.5 $61.8
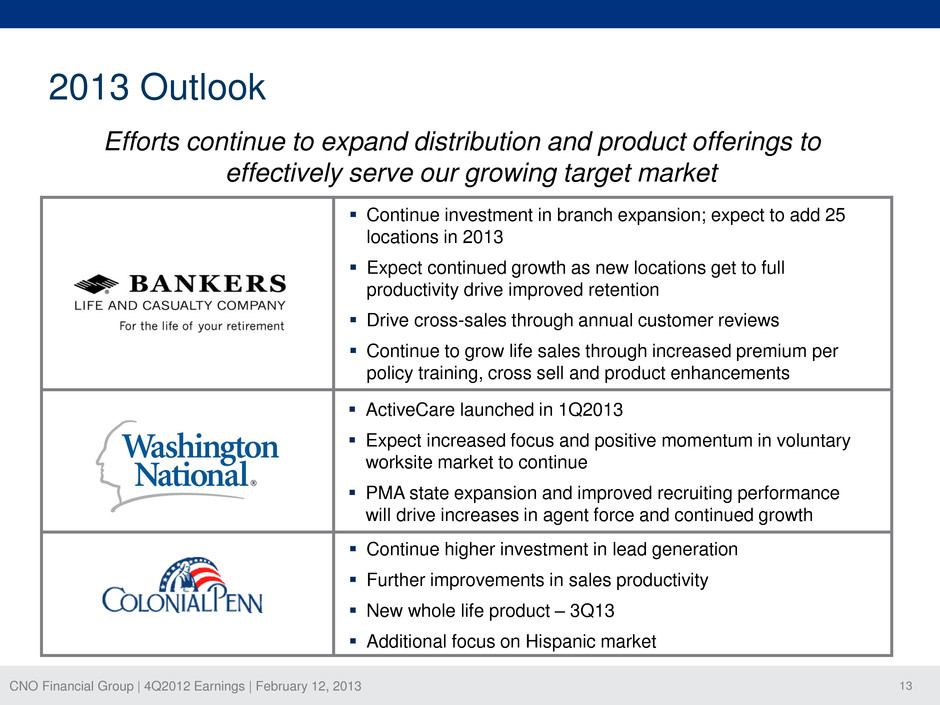
CNO Financial Group | 4Q2012 Earnings | February 12, 2013 13 2013 Outlook Efforts continue to expand distribution and product offerings to effectively serve our growing target market ActiveCare launched in 1Q2013 Expect increased focus and positive momentum in voluntary worksite market to continue PMA state expansion and improved recruiting performance will drive increases in agent force and continued growth Continue higher investment in lead generation Further improvements in sales productivity New whole life product – 3Q13 Additional focus on Hispanic market Continue investment in branch expansion; expect to add 25 locations in 2013 Expect continued growth as new locations get to full productivity drive improved retention Drive cross-sales through annual customer reviews Continue to grow life sales through increased premium per policy training, cross sell and product enhancements
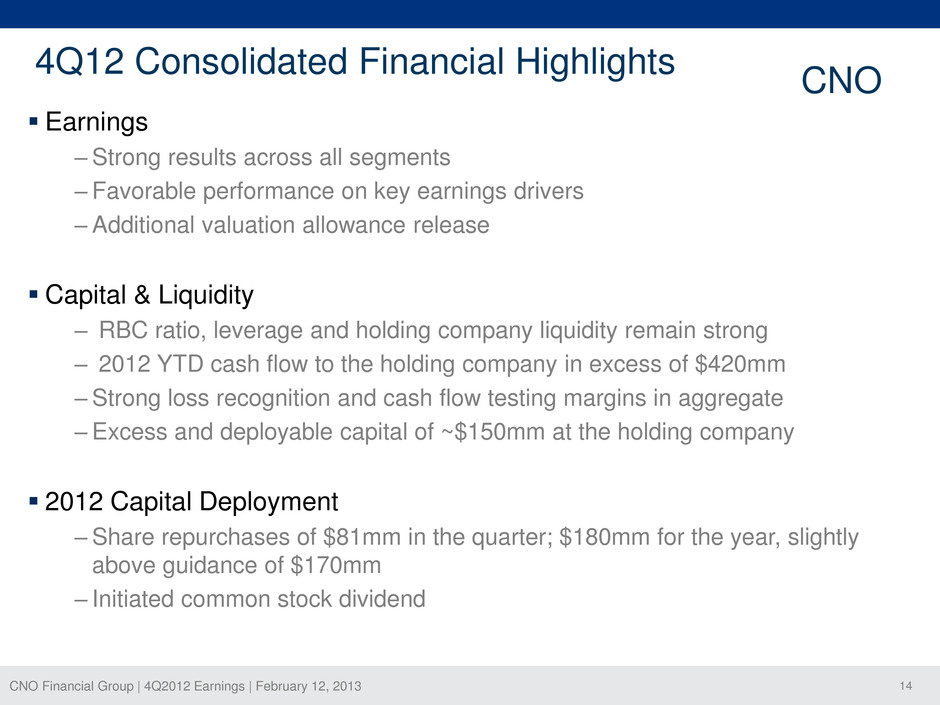
CNO Financial Group | 4Q2012 Earnings | February 12, 2013 14 4Q12 Consolidated Financial Highlights CNO Earnings ‒ Strong results across all segments ‒ Favorable performance on key earnings drivers ‒Additional valuation allowance release Capital & Liquidity ‒ RBC ratio, leverage and holding company liquidity remain strong ‒ 2012 YTD cash flow to the holding company in excess of $420mm ‒ Strong loss recognition and cash flow testing margins in aggregate ‒Excess and deployable capital of ~$150mm at the holding company 2012 Capital Deployment ‒Share repurchases of $81mm in the quarter; $180mm for the year, slightly above guidance of $170mm ‒ Initiated common stock dividend
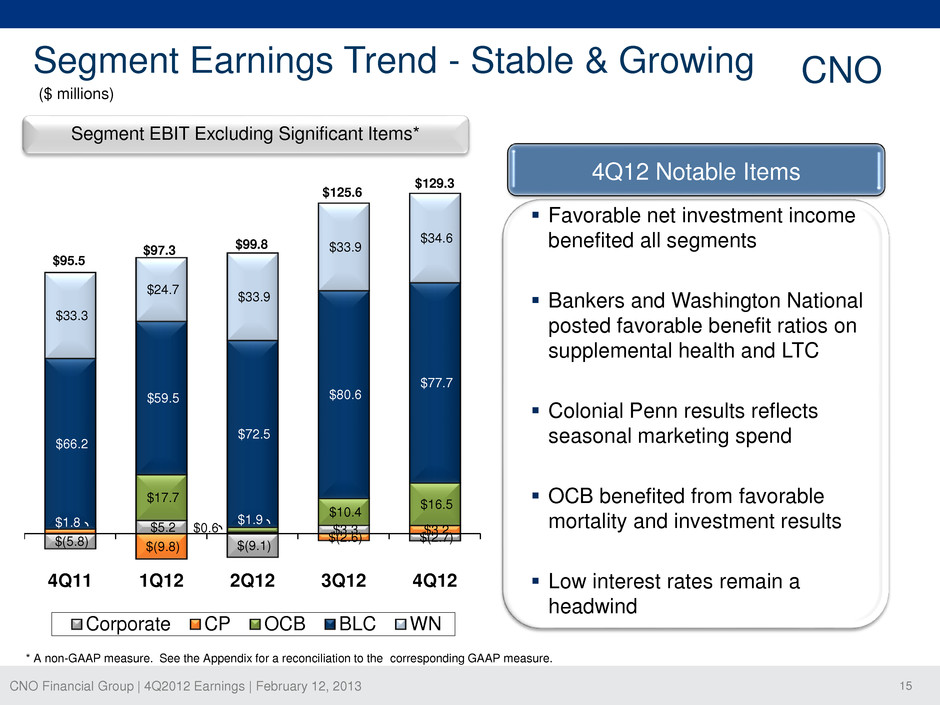
CNO Financial Group | 4Q2012 Earnings | February 12, 2013 15 $(5.8) $5.2 $(9.1) $3.3 $(2.7) $1.8 $(9.8) $0.6 $(2.6) $3.2 $17.7 $1.9 $10.4 $16.5 $66.2 $59.5 $72.5 $80.6 $77.7 $33.3 $24.7 $33.9 $33.9 $34.6 4Q11 1Q12 2Q12 3Q12 4Q12 Corporate CP OCB BLC WN ($ millions) * A non-GAAP measure. See the Appendix for a reconciliation to the corresponding GAAP measure. Segment Earnings Trend - Stable & Growing 4Q12 Notable Items $95.5 $97.3 $99.8 $125.6 $129.3 Segment EBIT Excluding Significant Items* Favorable net investment income benefited all segments Bankers and Washington National posted favorable benefit ratios on supplemental health and LTC Colonial Penn results reflects seasonal marketing spend OCB benefited from favorable mortality and investment results Low interest rates remain a headwind CNO
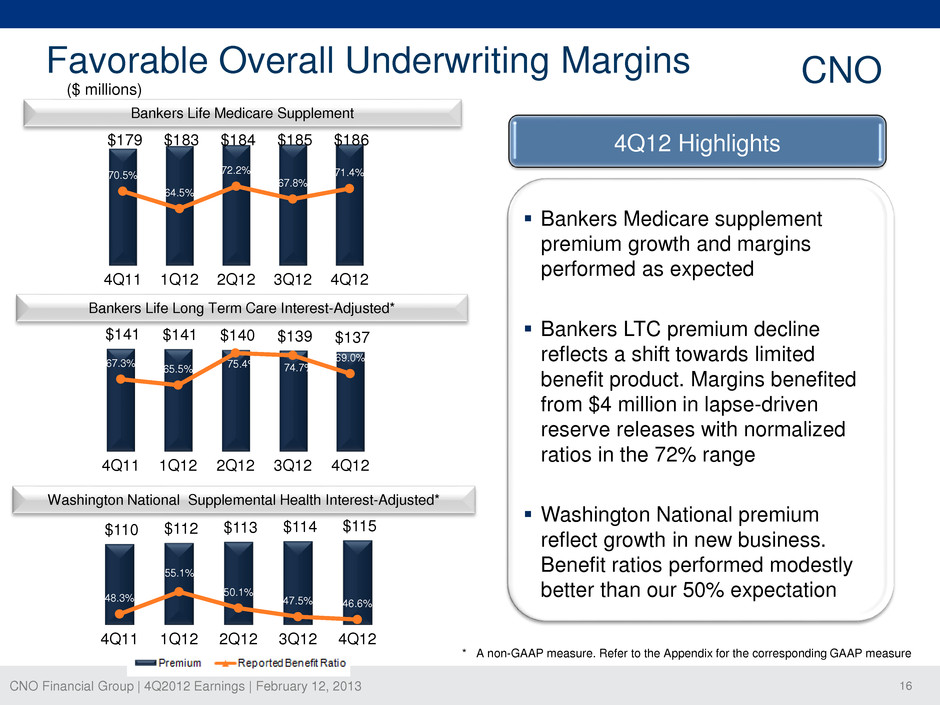
CNO Financial Group | 4Q2012 Earnings | February 12, 2013 16 $141 $141 $140 $139 $137 67.3% 65.5% 75.4% 74.7% 69.0% 4Q11 1Q12 2Q12 3Q12 4Q12 ($ millions) Bankers Life Medicare Supplement Washington National Supplemental Health Interest-Adjusted* * A non-GAAP measure. Refer to the Appendix for the corresponding GAAP measure Bankers Life Long Term Care Interest-Adjusted* $179 $183 $184 $185 $186 70.5% 64.5% 72.2% 67.8% 71.4% 4Q11 1Q12 2Q12 3Q12 4Q12 $110 $112 $113 $114 $115 48.3% 55.1% 50.1% 47.5% 46.6% 4Q11 1Q12 2Q12 3Q12 4Q12 Favorable Overall Underwriting Margins 4Q12 Highlights Bankers Medicare supplement premium growth and margins performed as expected Bankers LTC premium decline reflects a shift towards limited benefit product. Margins benefited from $4 million in lapse-driven reserve releases with normalized ratios in the 72% range Washington National premium reflect growth in new business. Benefit ratios performed modestly better than our 50% expectation CNO
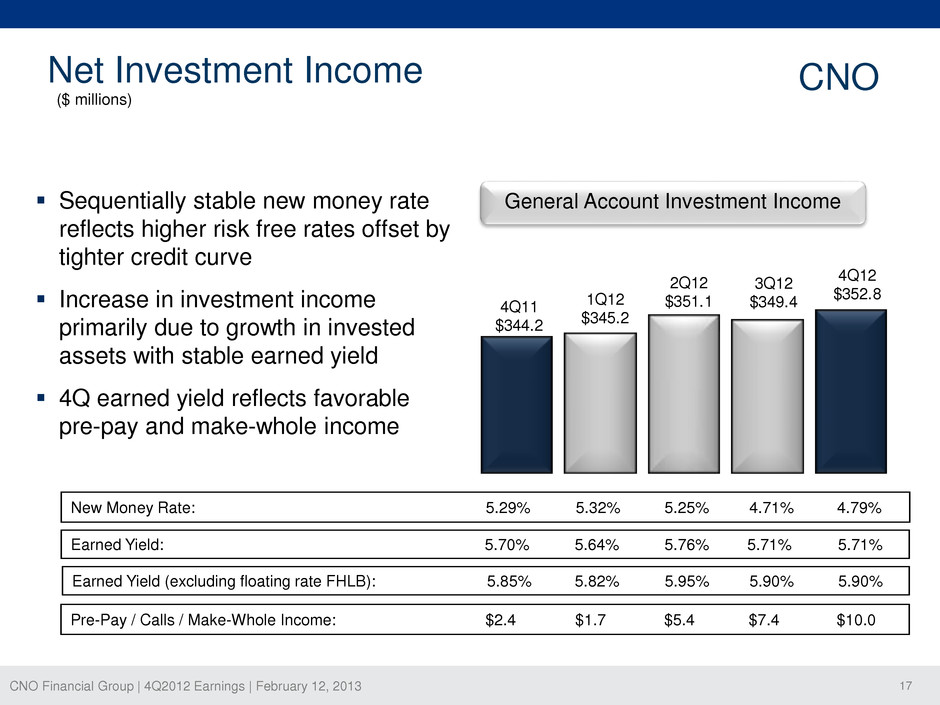
CNO Financial Group | 4Q2012 Earnings | February 12, 2013 17 Net Investment Income CNO 4Q11 $344.2 1Q12 $345.2 2Q12 $351.1 3Q12 $349.4 4Q12 $352.8 Earned Yield: 5.70% 5.64% 5.76% 5.71% 5.71% ($ millions) Earned Yield (excluding floating rate FHLB): 5.85% 5.82% 5.95% 5.90% 5.90% New Money Rate: 5.29% 5.32% 5.25% 4.71% 4.79% General Account Investment Income Pre-Pay / Calls / Make-Whole Income: $2.4 $1.7 $5.4 $7.4 $10.0 Sequentially stable new money rate reflects higher risk free rates offset by tighter credit curve Increase in investment income primarily due to growth in invested assets with stable earned yield 4Q earned yield reflects favorable pre-pay and make-whole income
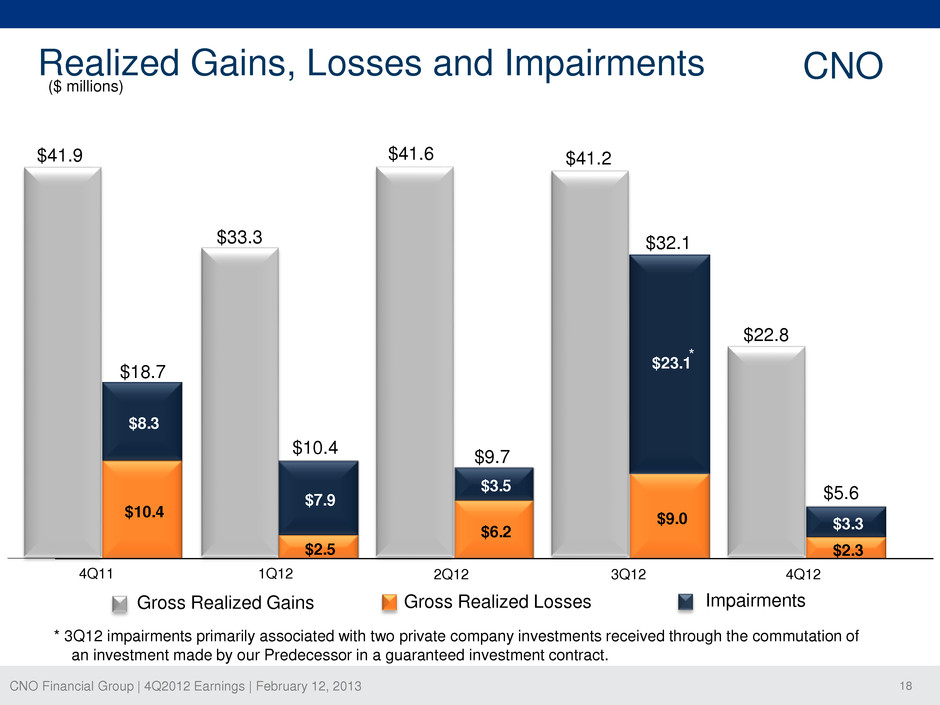
CNO Financial Group | 4Q2012 Earnings | February 12, 2013 18 $10.4 $2.5 $6.2 $9.0 $2.3 $8.3 $7.9 $3.5 $23.1 $3.3 Realized Gains, Losses and Impairments ($ millions) CNO 4Q11 3Q12 4Q12 1Q12 2Q12 Gross Realized Gains Gross Realized Losses Impairments $41.9 $18.7 $33.3 $41.6 $41.2 $10.4 $9.7 $32.1 * 3Q12 impairments primarily associated with two private company investments received through the commutation of an investment made by our Predecessor in a guaranteed investment contract. * $22.8 $5.6
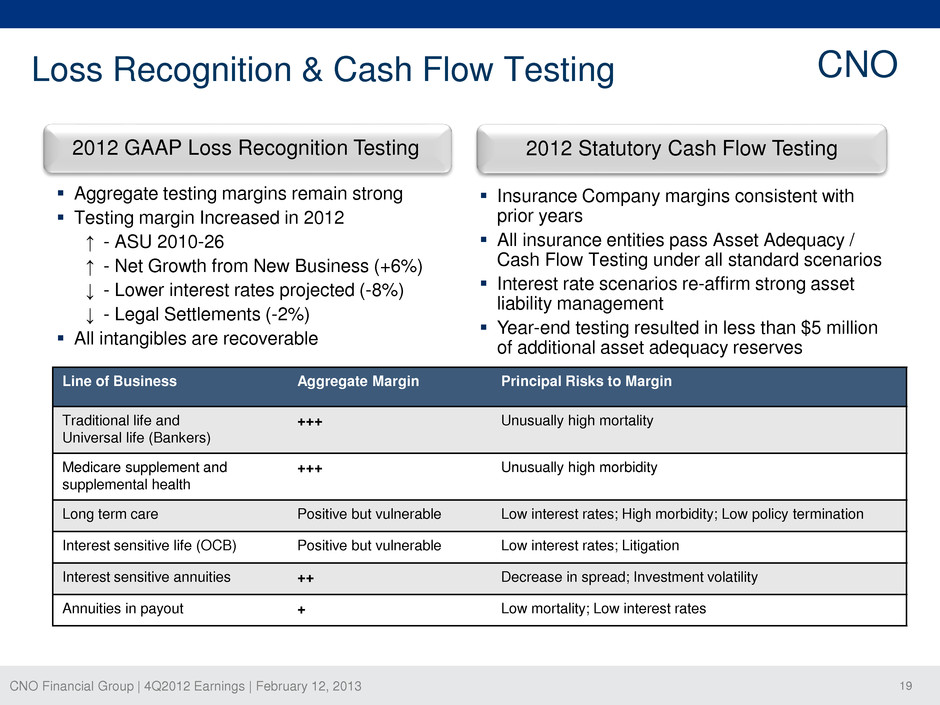
CNO Financial Group | 4Q2012 Earnings | February 12, 2013 19 Loss Recognition & Cash Flow Testing 2012 Statutory Cash Flow Testing 2012 GAAP Loss Recognition Testing Aggregate testing margins remain strong Testing margin Increased in 2012 ↑ - ASU 2010-26 ↑ - Net Growth from New Business (+6%) ↓ - Lower interest rates projected (-8%) ↓ - Legal Settlements (-2%) All intangibles are recoverable Insurance Company margins consistent with prior years All insurance entities pass Asset Adequacy / Cash Flow Testing under all standard scenarios Interest rate scenarios re-affirm strong asset liability management Year-end testing resulted in less than $5 million of additional asset adequacy reserves Line of Business Aggregate Margin Principal Risks to Margin Traditional life and Universal life (Bankers) +++ Unusually high mortality Medicare supplement and supplemental health +++ Unusually high morbidity Long term care Positive but vulnerable Low interest rates; High morbidity; Low policy termination Interest sensitive life (OCB) Positive but vulnerable Low interest rates; Litigation Interest sensitive annuities ++ Decrease in spread; Investment volatility Annuities in payout + Low mortality; Low interest rates CNO
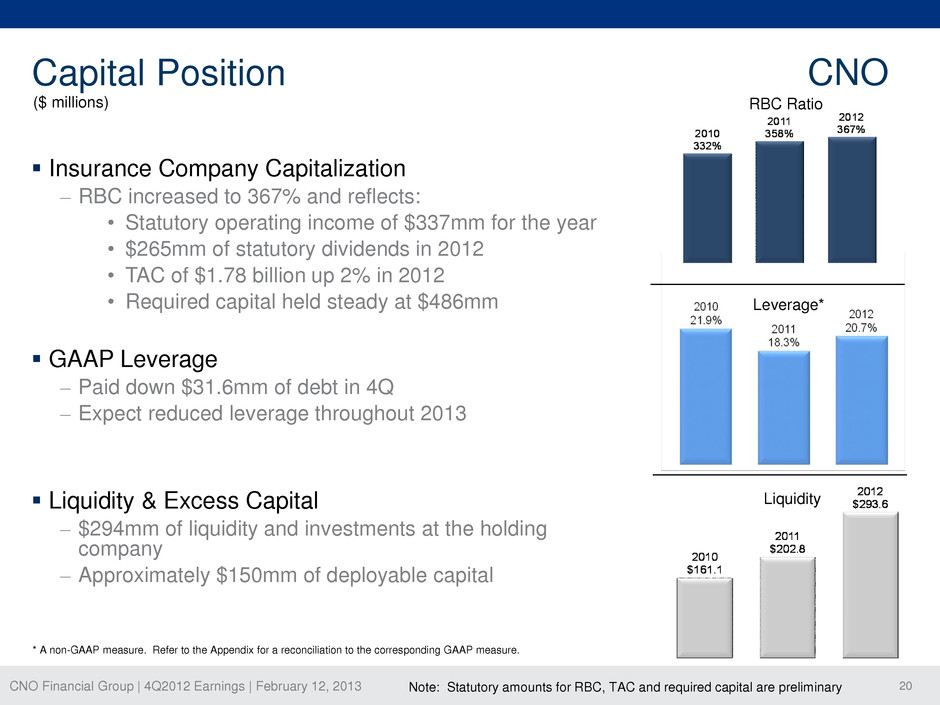
CNO Financial Group | 4Q2012 Earnings | February 12, 2013 20 Capital Position CNO Leverage* RBC Ratio Liquidity ($ millions) Insurance Company Capitalization – RBC increased to 367% and reflects: • Statutory operating income of $337mm for the year • $265mm of statutory dividends in 2012 • TAC of $1.78 billion up 2% in 2012 • Required capital held steady at $486mm GAAP Leverage – Paid down $31.6mm of debt in 4Q – Expect reduced leverage throughout 2013 Liquidity & Excess Capital – $294mm of liquidity and investments at the holding company – Approximately $150mm of deployable capital Note: Statutory amounts for RBC, TAC and required capital are preliminary * A non-GAAP measure. Refer to the Appendix for a reconciliation to the corresponding GAAP measure.
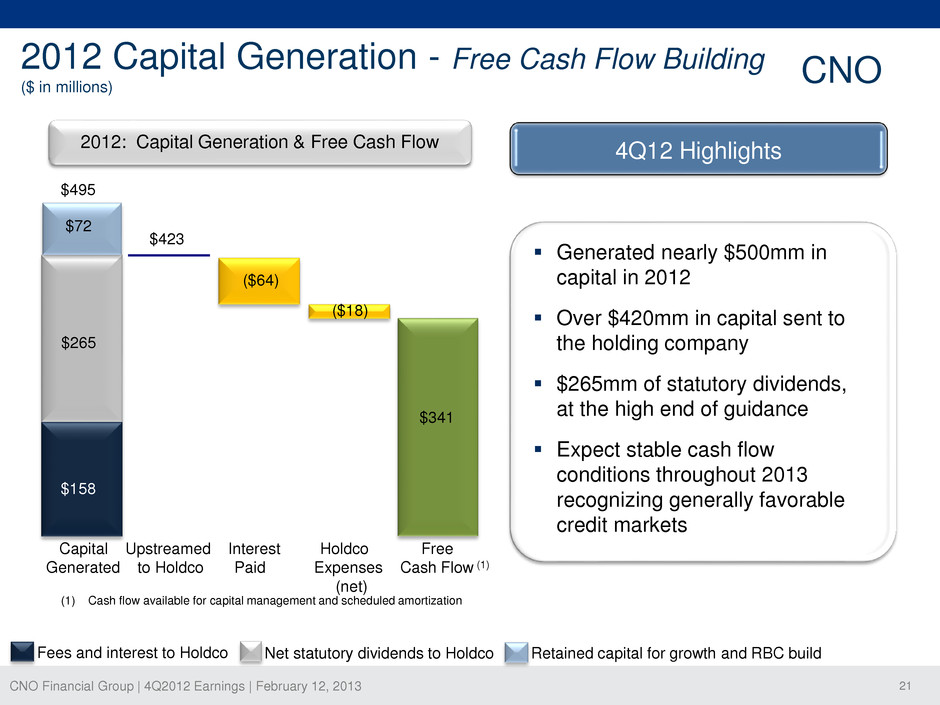
CNO Financial Group | 4Q2012 Earnings | February 12, 2013 21 2012 Capital Generation - Free Cash Flow Building ($ in millions) Fees and interest to Holdco Net statutory dividends to Holdco Retained capital for growth and RBC build $495 ($64) ($18) Capital Upstreamed Interest Holdco Free Generated to Holdco Paid Expenses Cash Flow (1) (net) $341 $265 $72 $423 $158 (1) Cash flow available for capital management and scheduled amortization 2012: Capital Generation & Free Cash Flow 4Q12 Highlights Generated nearly $500mm in capital in 2012 Over $420mm in capital sent to the holding company $265mm of statutory dividends, at the high end of guidance Expect stable cash flow conditions throughout 2013 recognizing generally favorable credit markets CNO
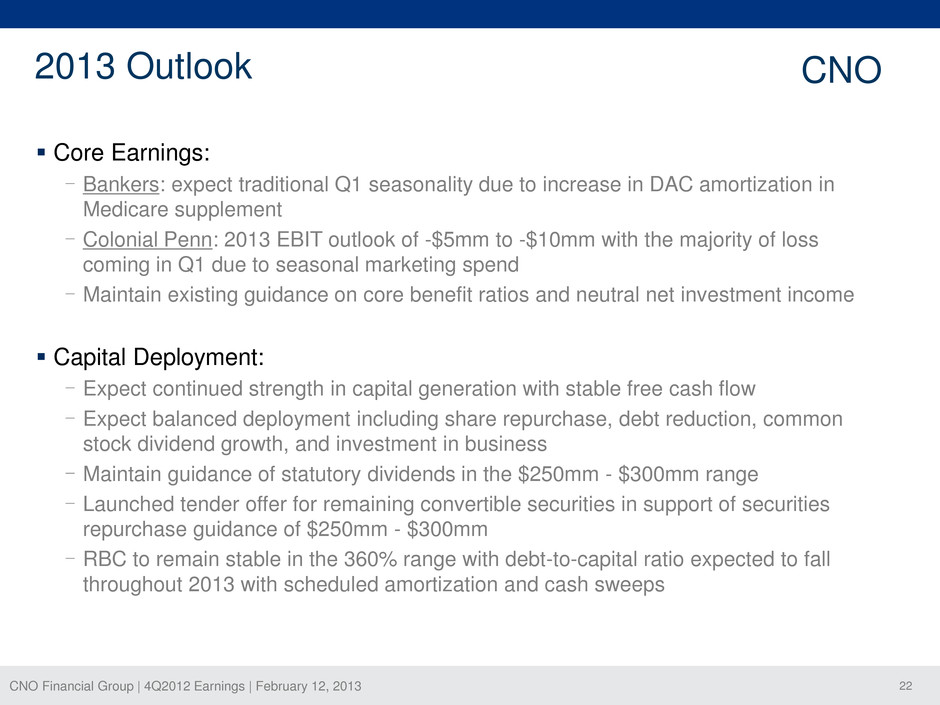
CNO Financial Group | 4Q2012 Earnings | February 12, 2013 22 2013 Outlook Core Earnings: - Bankers: expect traditional Q1 seasonality due to increase in DAC amortization in Medicare supplement - Colonial Penn: 2013 EBIT outlook of -$5mm to -$10mm with the majority of loss coming in Q1 due to seasonal marketing spend - Maintain existing guidance on core benefit ratios and neutral net investment income Capital Deployment: - Expect continued strength in capital generation with stable free cash flow - Expect balanced deployment including share repurchase, debt reduction, common stock dividend growth, and investment in business - Maintain guidance of statutory dividends in the $250mm - $300mm range - Launched tender offer for remaining convertible securities in support of securities repurchase guidance of $250mm - $300mm - RBC to remain stable in the 360% range with debt-to-capital ratio expected to fall throughout 2013 with scheduled amortization and cash sweeps CNO
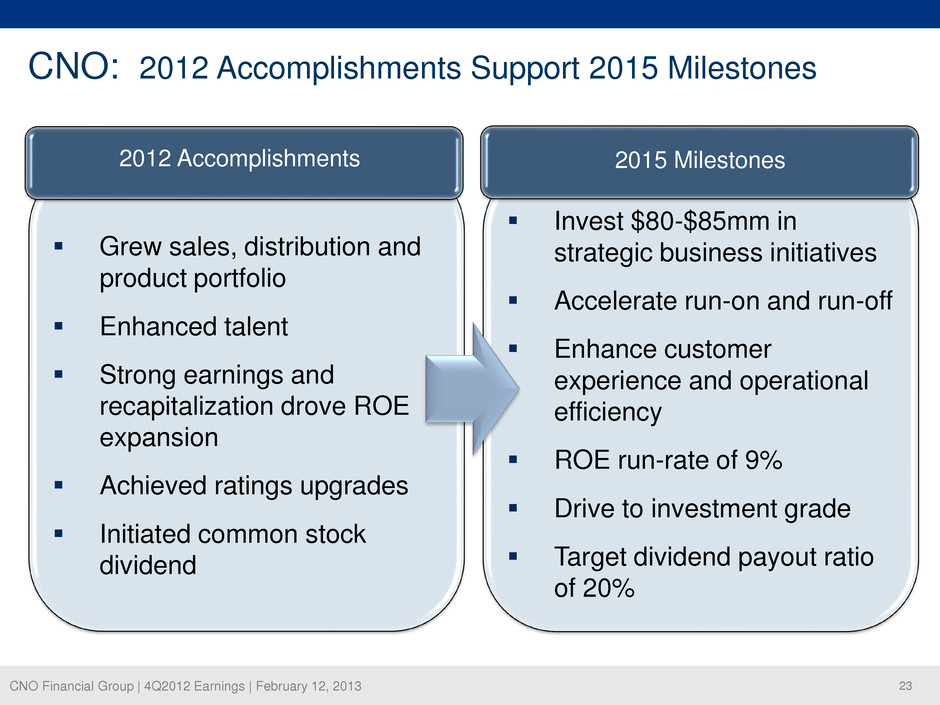
CNO Financial Group | 4Q2012 Earnings | February 12, 2013 23 Grew sales, distribution and product portfolio Enhanced talent Strong earnings and recapitalization drove ROE expansion Achieved ratings upgrades Initiated common stock dividend Invest $80-$85mm in strategic business initiatives Accelerate run-on and run-off Enhance customer experience and operational efficiency ROE run-rate of 9% Drive to investment grade Target dividend payout ratio of 20% CNO: 2012 Accomplishments Support 2015 Milestones 2015 Milestones 2012 Accomplishments

CNO Financial Group | 4Q2012 Earnings | February 12, 2013 24 Questions and Answers
CNO Financial Group | 4Q2012 Earnings | February 12, 2013 25 Appendix
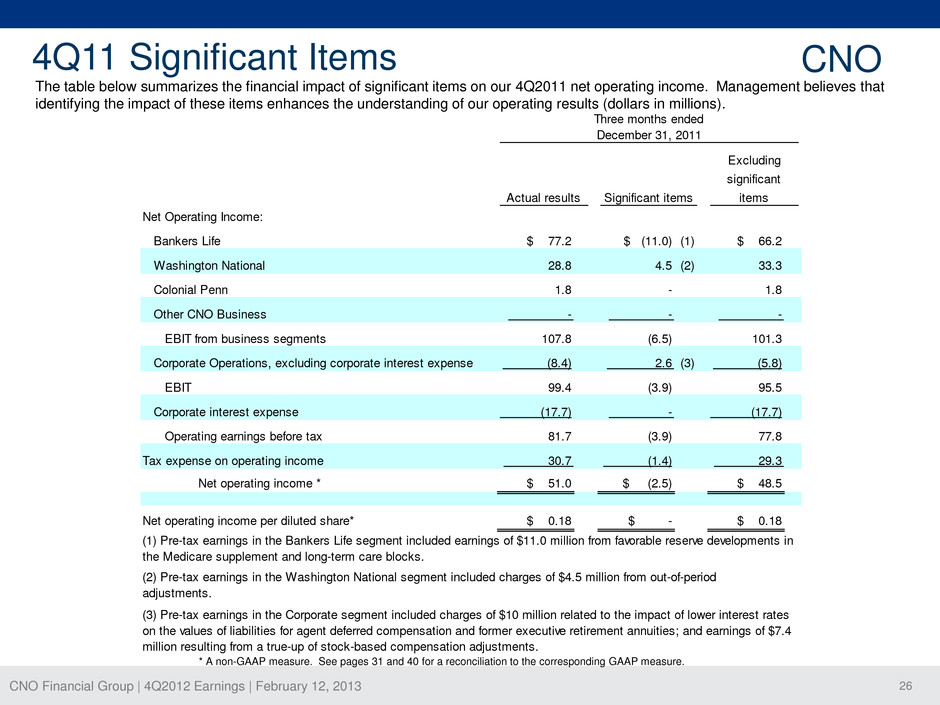
CNO Financial Group | 4Q2012 Earnings | February 12, 2013 26 The table below summarizes the financial impact of significant items on our 4Q2011 net operating income. Management believes that identifying the impact of these items enhances the understanding of our operating results (dollars in millions). Net Operating Income: Bankers Life $ 77.2 $ (11.0) (1) $ 66.2 Washington National (2) Colonial Penn Other CNO Business EBIT from business segments Corporate Operations, excluding corporate interest expense (3) EBIT Corporate interest expense Operating earnings before tax Tax expense on operating income Net operating income * $ 51.0 $ (2.5) $ 48.5 Net operating income per diluted share* $ 0.18 $ - $ 0.18 81.7 (3.9) 77.8 30.7 (1.4) 29.3 (5.8) 99.4 (3.9) 95.5 (17.7) - (17.7) (8.4) 2.6 - - - 107.8 (6.5) 101.3 28.8 4.5 33.3 1.8 - 1.8 (2) Pre-tax earnings in the Washington National segment included charges of $4.5 million from out-of-period adjustments. (1) Pre-tax earnings in the Bankers Life segment included earnings of $11.0 million from favorable reserve developments in the Medicare supplement and long-term care blocks. (3) Pre-tax earnings in the Corporate segment included charges of $10 million related to the impact of lower interest rates on the values of liabilities for agent deferred compensation and former executive retirement annuities; and earnings of $7.4 million resulting from a true-up of stock-based compensation adjustments. Three months ended December 31, 2011 Actual results Significant items Excluding significant items * A non-GAAP measure. See pages 31 and 40 for a reconciliation to the corresponding GAAP measure. 4Q11 Significant Items CNO
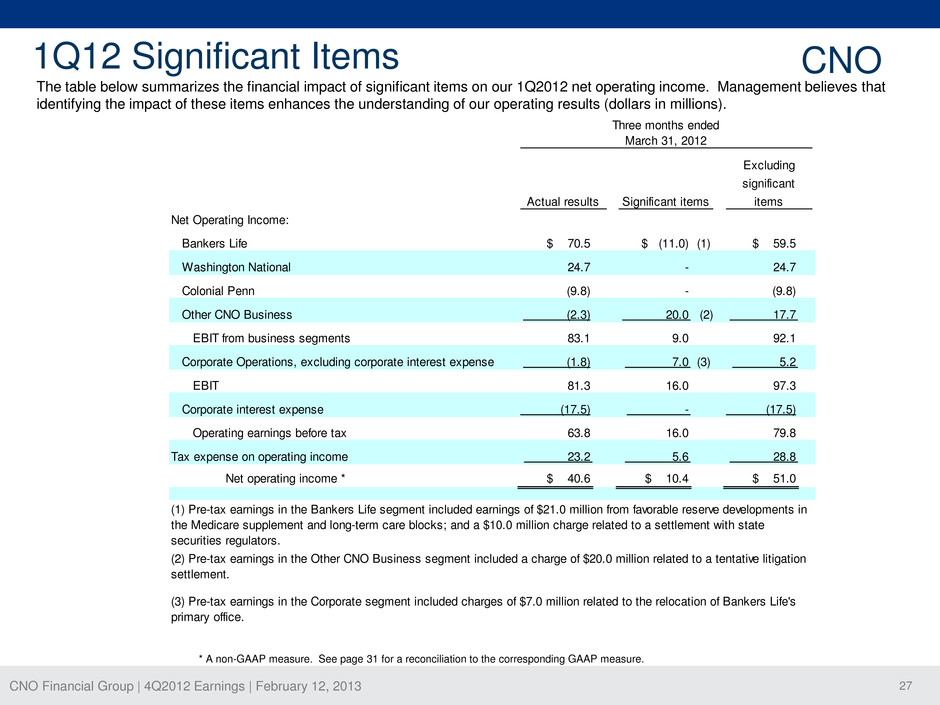
CNO Financial Group | 4Q2012 Earnings | February 12, 2013 27 The table below summarizes the financial impact of significant items on our 1Q2012 net operating income. Management believes that identifying the impact of these items enhances the understanding of our operating results (dollars in millions). Net Operating Income: Bankers Life $ 70.5 $ (11.0) (1) $ 59.5 Washington National Colonial Penn Other CNO Business (2) EBIT from business segments Corporate Operations, excluding corporate interest expense (3) EBIT Corporate interest expense Operating earnings before tax Tax expense on operating income Net operating income * $ 40.6 $ 10.4 $ 51.0 Three months ended March 31, 2012 Actual results Significant items Excluding significant items 24.7 - 24.7 (9.8) - (9.8) (2.3) 20.0 17.7 83.1 9.0 92.1 (1.8) 7.0 5.2 81.3 16.0 97.3 (17.5) - (17.5) 63.8 16.0 79.8 23.2 5.6 28.8 (1) Pre-tax earnings in the Bankers Life segment included earnings of $21.0 million from favorable reserve developments in the Medicare supplement and long-term care blocks; and a $10.0 million charge related to a settlement with state securities regulators. (3) Pre-tax earnings in the Corporate segment included charges of $7.0 million related to the relocation of Bankers Life's primary office. (2) Pre-tax earnings in the Other CNO Business segment included a charge of $20.0 million related to a tentative litigation settlement. * A non-GAAP measure. See page 31 for a reconciliation to the corresponding GAAP measure. 1Q12 Significant Items CNO
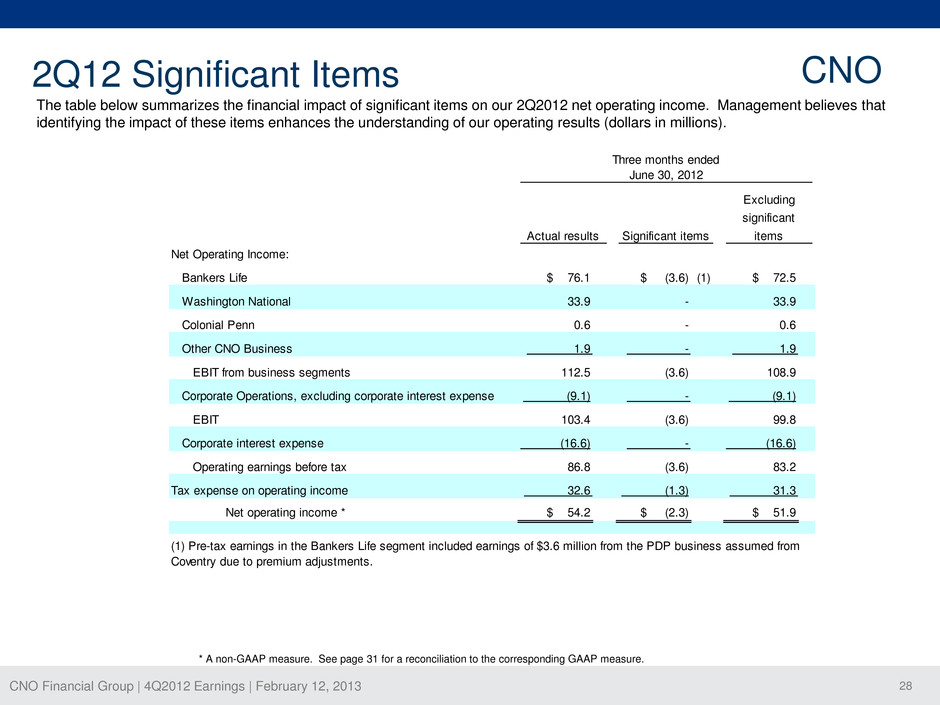
CNO Financial Group | 4Q2012 Earnings | February 12, 2013 28 The table below summarizes the financial impact of significant items on our 2Q2012 net operating income. Management believes that identifying the impact of these items enhances the understanding of our operating results (dollars in millions). Net Operating Income: Bankers Life $ 76.1 $ (3.6) (1) $ 72.5 Washington National Colonial Penn Other CNO Business EBIT from business segments Corporate Operations, excluding corporate interest expense EBIT Corporate interest expense Operating earnings before tax Tax expense on operating income Net operating income * $ 54.2 $ (2.3) $ 51.9 (1) Pre-tax earnings in the Bankers Life segment included earnings of $3.6 million from the PDP business assumed from Coventry due to premium adjustments. 86.8 (3.6) 83.2 32.6 (1.3) 31.3 103.4 (3.6) 99.8 (16.6) - (16.6) 112.5 (3.6) 108.9 (9.1) - (9.1) 0.6 - 0.6 1.9 - 1.9 33.9 - 33.9 Three months ended June 30, 2012 Actual results Significant items Excluding significant items * A non-GAAP measure. See page 31 for a reconciliation to the corresponding GAAP measure. 2Q12 Significant Items CNO
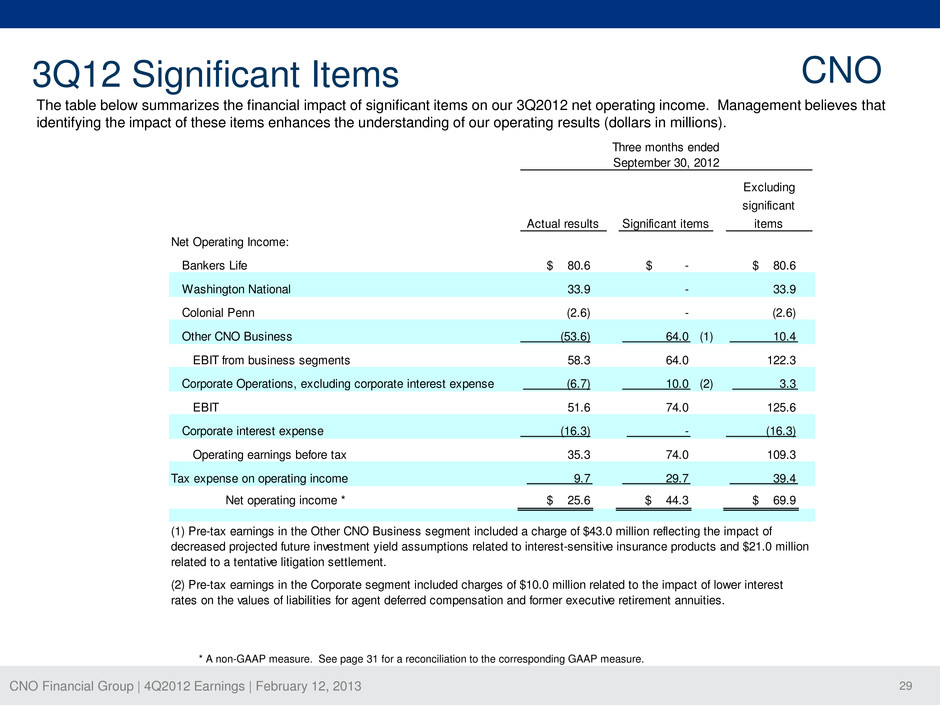
CNO Financial Group | 4Q2012 Earnings | February 12, 2013 29 The table below summarizes the financial impact of significant items on our 3Q2012 net operating income. Management believes that identifying the impact of these items enhances the understanding of our operating results (dollars in millions). Net Operating Income: Bankers Life $ 80.6 $ - $ 80.6 Washington National Colonial Penn Other CNO Business (1) EBIT from business segments Corporate Operations, excluding corporate interest expense (2) EBIT Corporate interest expense Operating earnings before tax Tax expense on operating income Net operating income * $ 25.6 $ 44.3 $ 69.9 Three months ended September 30, 2012 Actual results Significant items Excluding significant items 33.9 - 33.9 (2.6) - (2.6) (53.6) 64.0 10.4 58.3 64.0 122.3 (6.7) 10.0 3.3 39.4 51.6 74.0 125.6 (16.3) - (16.3) (2) Pre-tax earnings in the Corporate segment included charges of $10.0 million related to the impact of lower interest rates on the values of liabilities for agent deferred compensation and former executive retirement annuities. (1) Pre-tax earnings in the Other CNO Business segment included a charge of $43.0 million reflecting the impact of decreased projected future investment yield assumptions related to interest-sensitive insurance products and $21.0 million related to a tentative litigation settlement. 35.3 74.0 109.3 9.7 29.7 * A non-GAAP measure. See page 31 for a reconciliation to the corresponding GAAP measure. 3Q12 Significant Items CNO
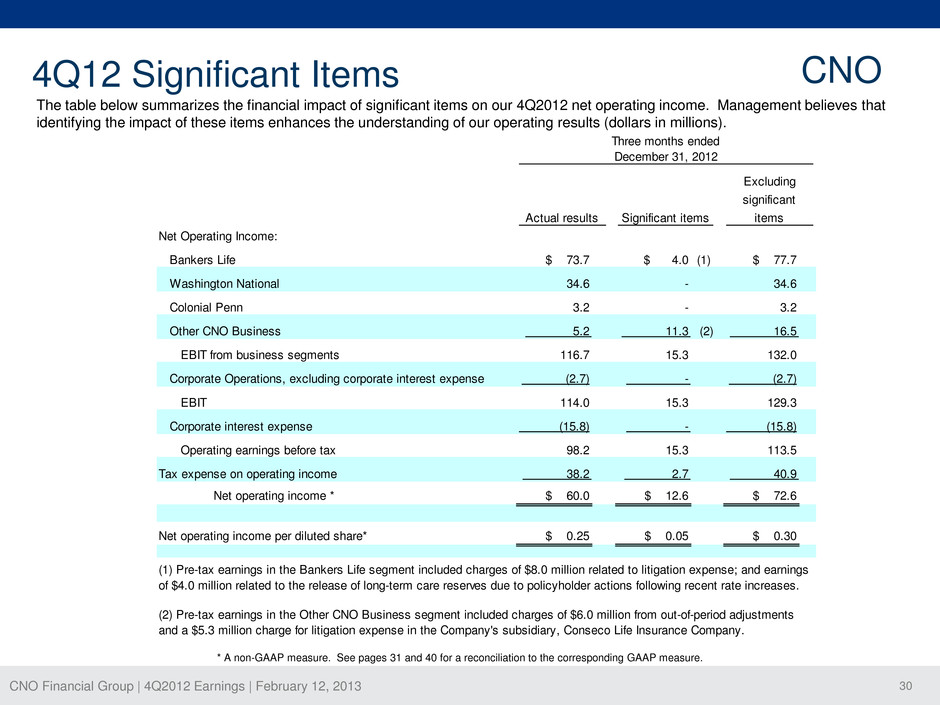
CNO Financial Group | 4Q2012 Earnings | February 12, 2013 30 The table below summarizes the financial impact of significant items on our 4Q2012 net operating income. Management believes that identifying the impact of these items enhances the understanding of our operating results (dollars in millions). Net Operating Income: Bankers Life $ 73.7 $ 4.0 (1) $ 77.7 Washington National Colonial Penn Other CNO Business (2) EBIT from business segments Corporate Operations, excluding corporate interest expense EBIT Corporate interest expense Operating earnings before tax Tax expense on operating income Net operating income * $ 60.0 $ 12.6 $ 72.6 Net operating income per diluted share* $ 0.25 $ 0.05 $ 0.30 Three months ended December 31, 2012 Actual results Significant items Excluding significant items 34.6 - 34.6 3.2 - 3.2 5.2 11.3 16.5 116.7 15.3 132.0 (2.7) - (2.7) 40.9 114.0 15.3 129.3 (15.8) - (15.8) (2) Pre-tax earnings in the Other CNO Business segment included charges of $6.0 million from out-of-period adjustments and a $5.3 million charge for litigation expense in the Company's subsidiary, Conseco Life Insurance Company. (1) Pre-tax earnings in the Bankers Life segment included charges of $8.0 million related to litigation expense; and earnings of $4.0 million related to the release of long-term care reserves due to policyholder actions following recent rate increases. 98.2 15.3 113.5 38.2 2.7 * A non-GAAP measure. See pages 31 and 40 for a reconciliation to the corresponding GAAP measure. 4Q12 Significant Items CNO
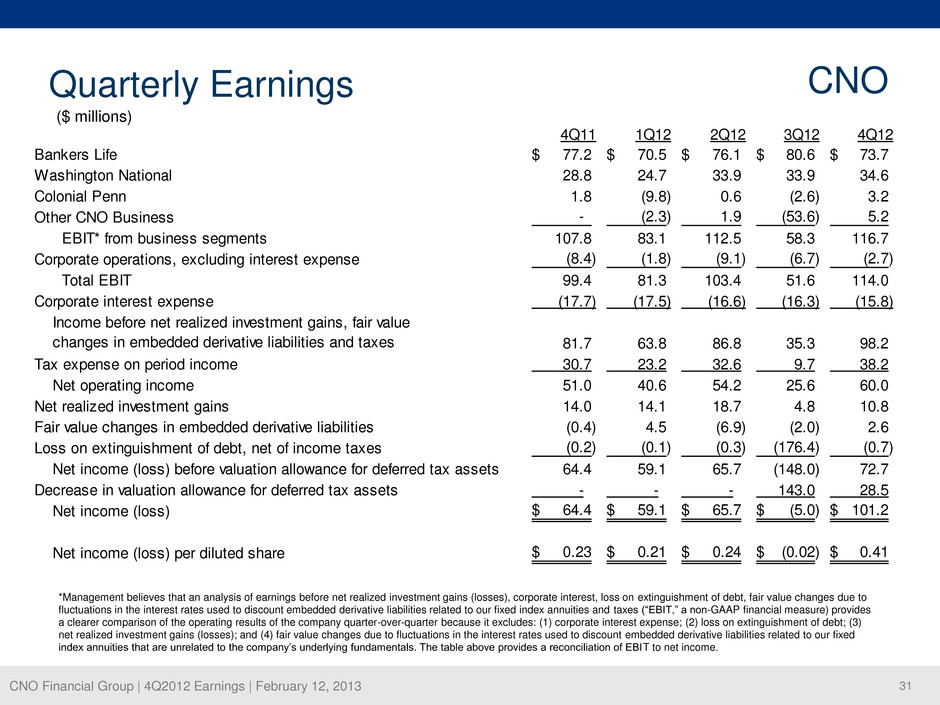
CNO Financial Group | 4Q2012 Earnings | February 12, 2013 31 Quarterly Earnings CNO *Management believes that an analysis of earnings before net realized investment gains (losses), corporate interest, loss on extinguishment of debt, fair value changes due to fluctuations in the interest rates used to discount embedded derivative liabilities related to our fixed index annuities and taxes (“EBIT,” a non-GAAP financial measure) provides a clearer comparison of the operating results of the company quarter-over-quarter because it excludes: (1) corporate interest expense; (2) loss on extinguishment of debt; (3) net realized investment gains (losses); and (4) fair value changes due to fluctuations in the interest rates used to discount embedded derivative liabilities related to our fixed index annuities that are unrelated to the company’s underlying fundamentals. The table above provides a reconciliation of EBIT to net income. 4Q11 1Q12 2Q12 3Q12 4Q12 Bankers Life 77.2$ 70.5$ 76.1$ 80.6$ 73.7$ Washington National 28.8 24.7 33.9 33.9 34.6 Colonial Penn 1.8 (9.8) 0.6 (2.6) 3.2 Other CNO Business - (2.3) 1.9 (53.6) 5.2 EBIT* from business segments 107.8 83.1 112.5 58.3 116.7 Corporate operations, excluding interest expense (8.4) (1.8) (9.1) (6.7) (2.7) Total EBIT 99.4 81.3 103.4 51.6 114.0 Corporate interest expense (17.7) (17.5) (16.6) (16.3) (15.8) 81.7 63.8 86.8 35.3 98.2 Tax expense on period income 30.7 23.2 32.6 9.7 38.2 Net operating income 51.0 40.6 54.2 25.6 60.0 Net realized investment gains 14.0 14.1 18.7 4.8 10.8 Fair value changes in embedded derivative liabilities (0.4) 4.5 (6.9) (2.0) 2.6 Loss on extinguishment of debt, net of income taxes (0.2) (0.1) (0.3) (176.4) (0.7) Net income (loss) before valuation allowance for deferred tax assets 64.4 59.1 65.7 (148.0) 72.7 Decrease in valuation allowance for deferred tax assets - - - 143.0 28.5 Net income (loss) 64.4$ 59.1$ 65.7$ (5.0)$ 101.2$ Net income (loss) per diluted share 0.23$ 0.21$ 0.24$ (0.02)$ 0.41$ Income before net realized investment gains, fair value changes in embedded derivative liabilities and taxes ($ millions)
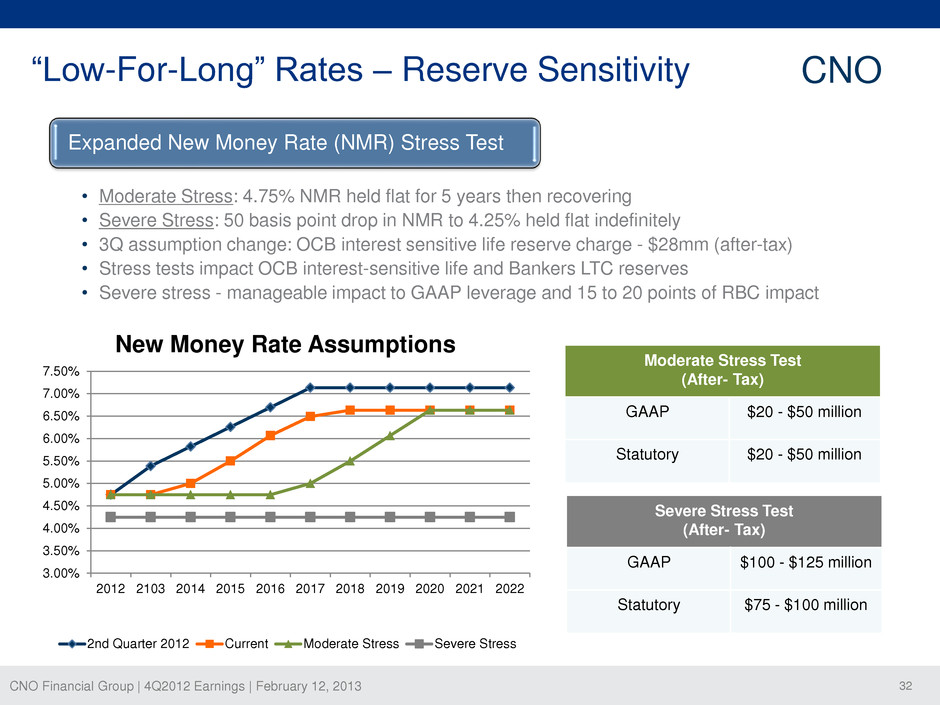
CNO Financial Group | 4Q2012 Earnings | February 12, 2013 32 • Moderate Stress: 4.75% NMR held flat for 5 years then recovering • Severe Stress: 50 basis point drop in NMR to 4.25% held flat indefinitely • 3Q assumption change: OCB interest sensitive life reserve charge - $28mm (after-tax) • Stress tests impact OCB interest-sensitive life and Bankers LTC reserves • Severe stress - manageable impact to GAAP leverage and 15 to 20 points of RBC impact Severe Stress Test (After- Tax) GAAP $100 - $125 million Statutory $75 - $100 million “Low-For-Long” Rates – Reserve Sensitivity Expanded New Money Rate (NMR) Stress Test Moderate Stress Test (After- Tax) GAAP $20 - $50 million Statutory $20 - $50 million 3.00% 3.50% 4.00% 4.50% 5.00% 5.50% 6.00% 6.50% 7.00% 7.50% 2012 2103 2014 2015 2016 2017 2018 2019 2020 2021 2022 New Money Rate Assumptions 2nd Quarter 2012 Current Moderate Stress Severe Stress CNO
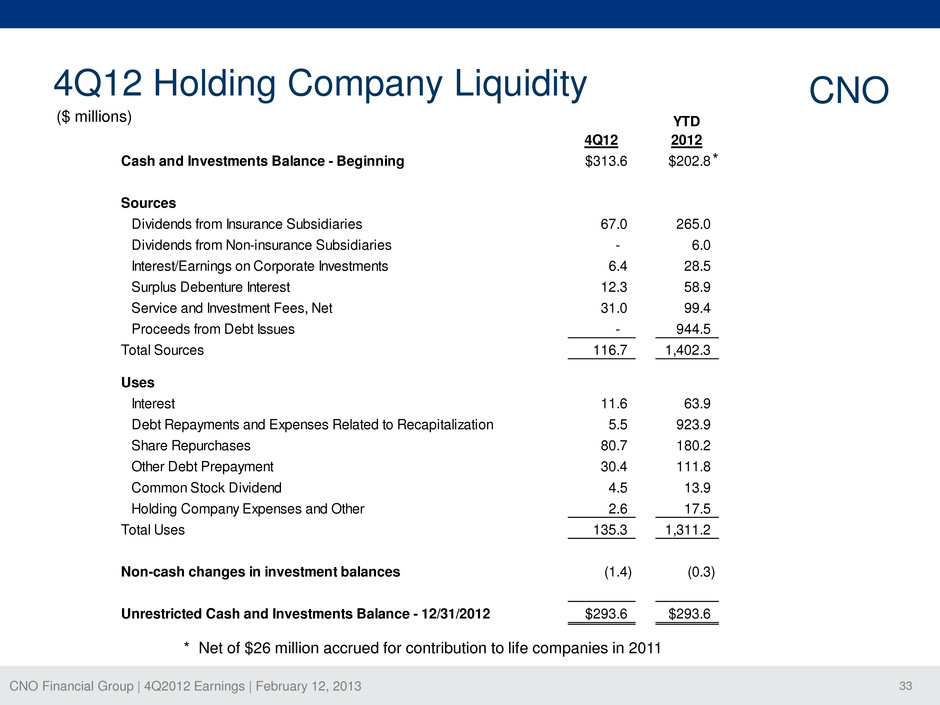
CNO Financial Group | 4Q2012 Earnings | February 12, 2013 33 4Q12 Holding Company Liquidity CNO ($ millions) 4Q12 YTD 2012 Cash and Investments Balance - Beginning $313.6 $202.8 Sources Dividends from Insurance Subsidiaries 67.0 265.0 Dividends from Non-insurance Subsidiaries - 6.0 Interest/Earnings on Corporate Investments 6.4 28.5 Surplus Debenture Interest 12.3 58.9 Service and Investment Fees, Net 31.0 99.4 Proceeds from Debt Issues - 944.5 Total Sources 116.7 1,402.3 Uses Interest 11.6 63.9 Debt Repayments and Expenses Related to Recapitalization 5.5 923.9 Share Repurchases 80.7 180.2 Other Debt Prepayment 30.4 111.8 Common Stock Dividend 4.5 13.9 Holding Company Expenses and Other 2.6 17.5 Total Uses 135.3 1,311.2 Non-cash changes in investment balances (1.4) (0.3) Unrestricted Cash and Investments Balance - 12/31/2012 $293.6 $293.6 * * Net of $26 million accrued for contribution to life companies in 2011
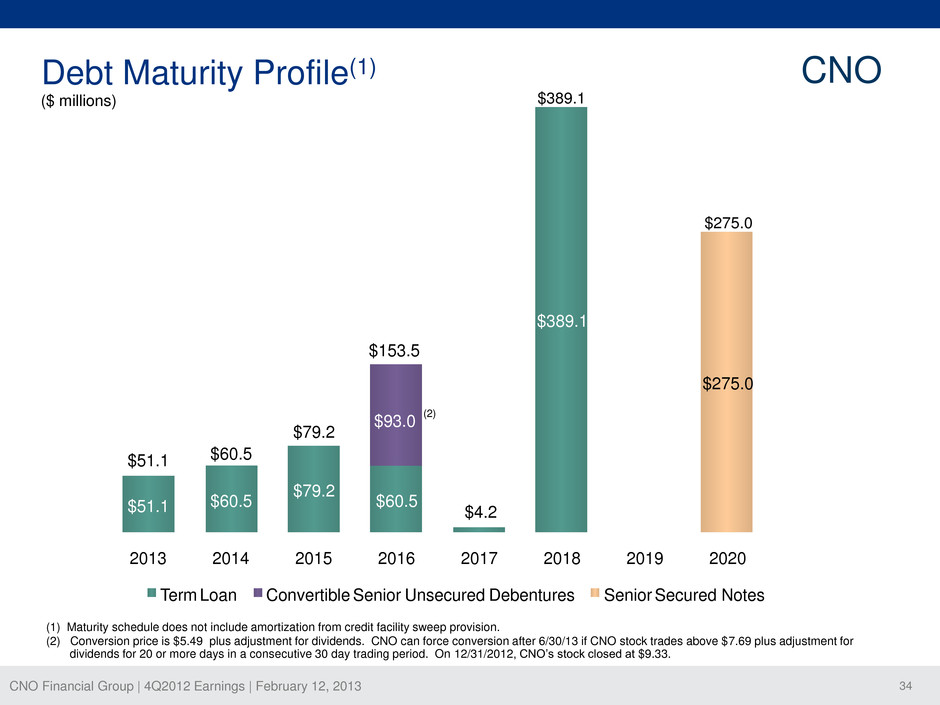
CNO Financial Group | 4Q2012 Earnings | February 12, 2013 34 $51.1 $60.5 $79.2 $60.5 $389.1 $93.0 $275.0 $51.1 $60.5 $79.2 $153.5 $4.2 2013 2014 2015 2016 2017 2018 2019 2020 Term Loan Convertible Senior Unsecured Debentures Senior Secured Notes Debt Maturity Profile(1) (1) Maturity schedule does not include amortization from credit facility sweep provision. (2) Conversion price is $5.49 plus adjustment for dividends. CNO can force conversion after 6/30/13 if CNO stock trades above $7.69 plus adjustment for dividends for 20 or more days in a consecutive 30 day trading period. On 12/31/2012, CNO’s stock closed at $9.33. (2) ($ millions) $389.1 $275.0 CNO
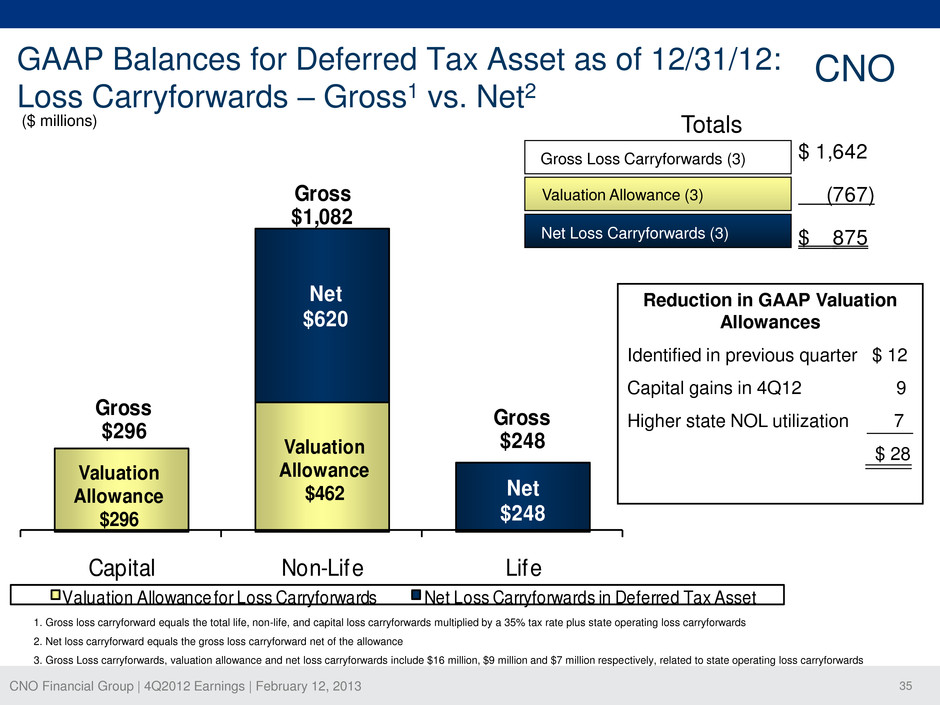
CNO Financial Group | 4Q2012 Earnings | February 12, 2013 35 1,642$ (767) 875$ Valuation Allowance $462 Valuation Allowance $296 Net $248 Net $620 Capital Non-Life Life Valuation Allowance for Loss Carryforwards Net Loss Carryforwards in Deferred Tax Asset Gross $248 Gross $296 Gross $1,082 GAAP Balances for Deferred Tax Asset as of 12/31/12: Loss Carryforwards – Gross1 vs. Net2 ($ millions) 1. Gross loss carryforward equals the total life, non-life, and capital loss carryforwards multiplied by a 35% tax rate plus state operating loss carryforwards 2. Net loss carryforward equals the gross loss carryforward net of the allowance 3. Gross Loss carryforwards, valuation allowance and net loss carryforwards include $16 million, $9 million and $7 million respectively, related to state operating loss carryforwards Totals Gross Loss Carryforwards (3) Net Loss Carryforwards (3) Valuation Allowance (3) Reduction in GAAP Valuation Allowances Identified in previous quarter $ 12 Capital gains in 4Q12 9 Higher state NOL utilization 7 $ 28 CNO
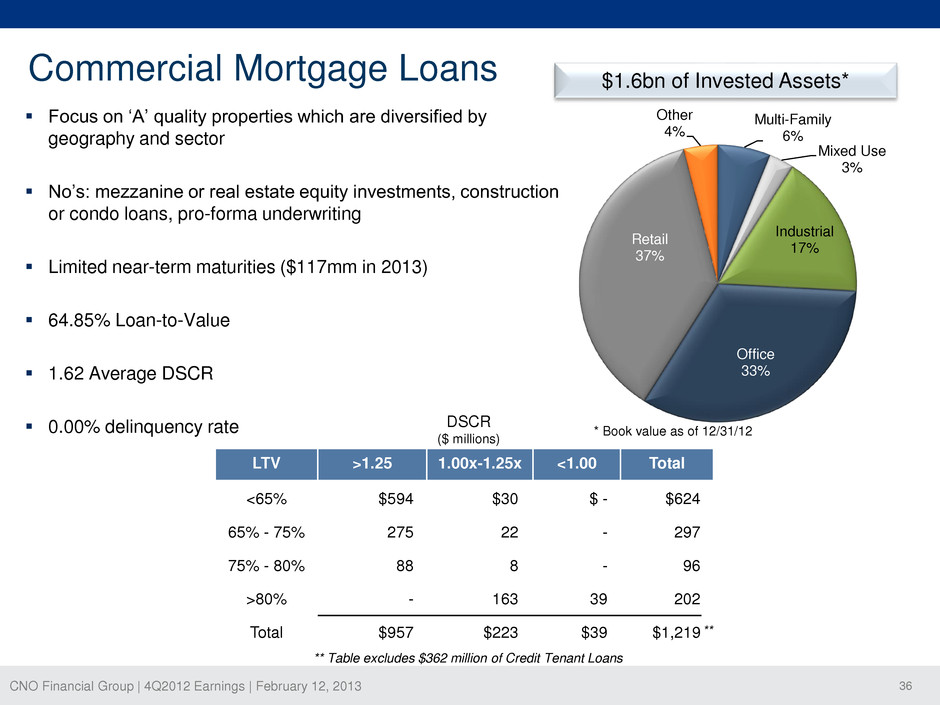
CNO Financial Group | 4Q2012 Earnings | February 12, 2013 36 LTV >1.25 1.00x-1.25x <1.00 Total <65% $594 $30 $ - $624 65% - 75% 275 22 - 297 75% - 80% 88 8 - 96 >80% - 163 39 202 Total $957 $223 $39 $1,219 Multi-Family 6% Mixed Use 3% Industrial 17% Office 33% Retail 37% Other 4% Commercial Mortgage Loans Focus on ‘A’ quality properties which are diversified by geography and sector No’s: mezzanine or real estate equity investments, construction or condo loans, pro-forma underwriting Limited near-term maturities ($117mm in 2013) 64.85% Loan-to-Value 1.62 Average DSCR 0.00% delinquency rate ** Table excludes $362 million of Credit Tenant Loans * Book value as of 12/31/12 DSCR ($ millions) $1.6bn of Invested Assets* **
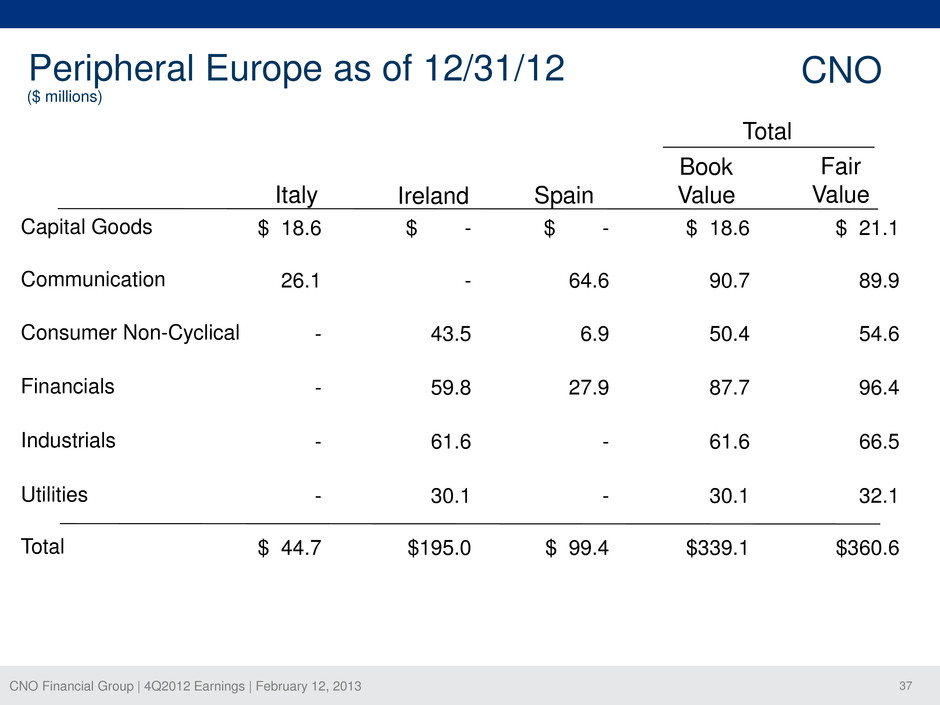
CNO Financial Group | 4Q2012 Earnings | February 12, 2013 37 Peripheral Europe as of 12/31/12 ($ millions) Capital Goods $ 18.6 $ - $ - $ 18.6 $ 21.1 Communication 26.1 - 64.6 90.7 89.9 Consumer Non-Cyclical - 43.5 6.9 50.4 54.6 Financials - 59.8 27.9 87.7 96.4 Industrials - 61.6 - 61.6 66.5 Utilities - 30.1 - 30.1 32.1 Total $ 44.7 $195.0 $ 99.4 $339.1 $360.6 Book Value Fair Value Total Italy Ireland Spain CNO
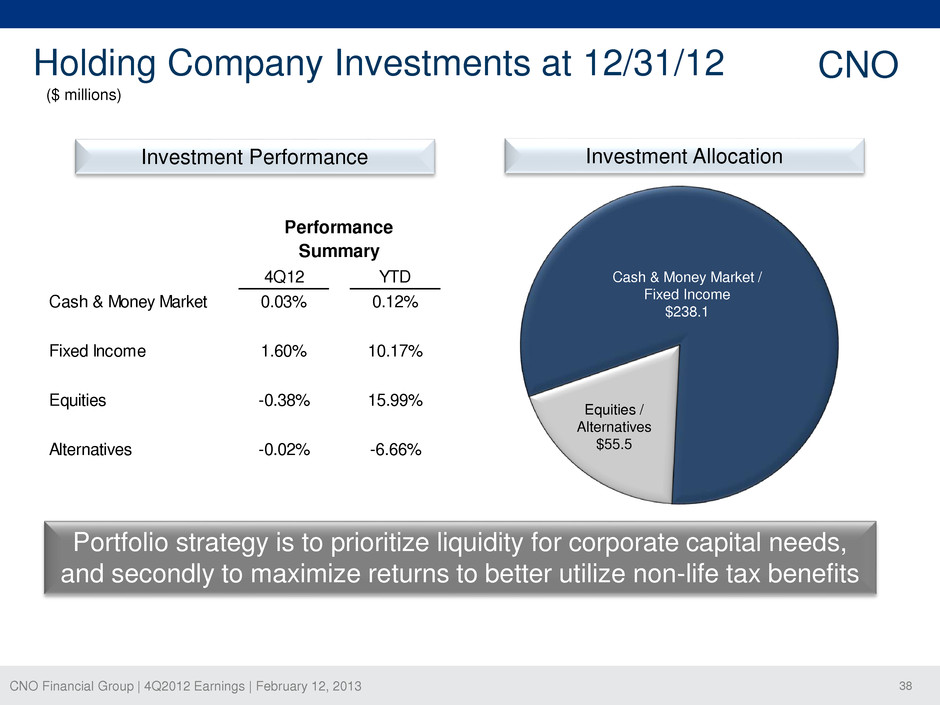
CNO Financial Group | 4Q2012 Earnings | February 12, 2013 38 Holding Company Investments at 12/31/12 CNO ($ millions) Cash & Money Market / Fixed Income $238.1 Equities / Alternatives $55.5 Portfolio strategy is to prioritize liquidity for corporate capital needs, and secondly to maximize returns to better utilize non-life tax benefits Cash & Money Market Fixed Income Equities Alternatives 10.17% Performance Summary 4Q12 YTD 0.03% 0.12% 15.99% -6.66% 1.60% -0.38% -0.02% Investment Allocation Investment Performance
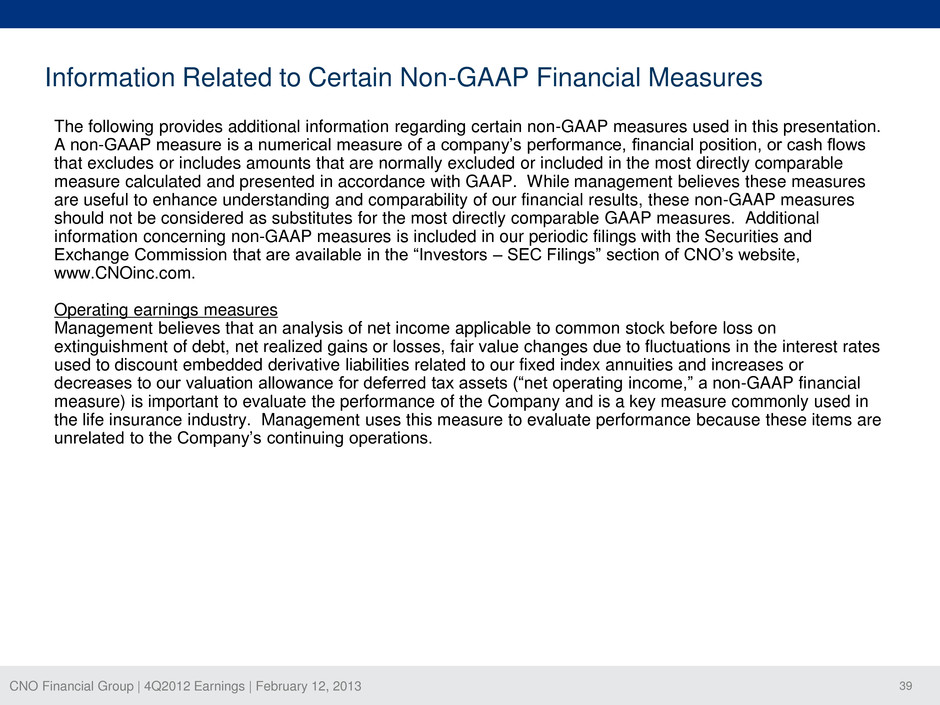
CNO Financial Group | 4Q2012 Earnings | February 12, 2013 39 The following provides additional information regarding certain non-GAAP measures used in this presentation. A non-GAAP measure is a numerical measure of a company’s performance, financial position, or cash flows that excludes or includes amounts that are normally excluded or included in the most directly comparable measure calculated and presented in accordance with GAAP. While management believes these measures are useful to enhance understanding and comparability of our financial results, these non-GAAP measures should not be considered as substitutes for the most directly comparable GAAP measures. Additional information concerning non-GAAP measures is included in our periodic filings with the Securities and Exchange Commission that are available in the “Investors – SEC Filings” section of CNO’s website, www.CNOinc.com. Operating earnings measures Management believes that an analysis of net income applicable to common stock before loss on extinguishment of debt, net realized gains or losses, fair value changes due to fluctuations in the interest rates used to discount embedded derivative liabilities related to our fixed index annuities and increases or decreases to our valuation allowance for deferred tax assets (“net operating income,” a non-GAAP financial measure) is important to evaluate the performance of the Company and is a key measure commonly used in the life insurance industry. Management uses this measure to evaluate performance because these items are unrelated to the Company’s continuing operations. Information Related to Certain Non-GAAP Financial Measures
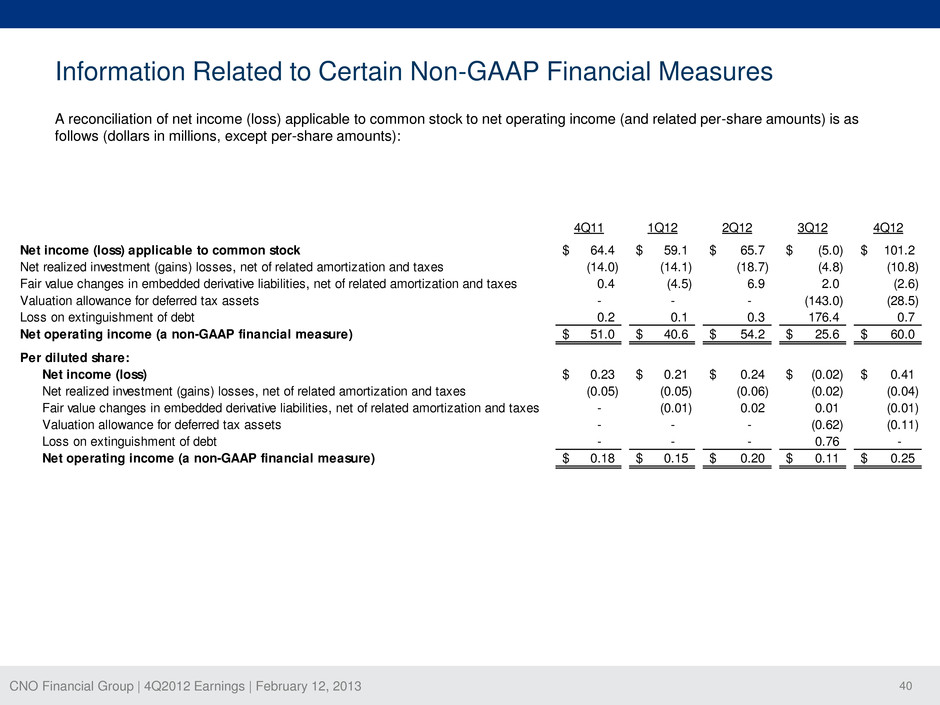
CNO Financial Group | 4Q2012 Earnings | February 12, 2013 40 Information Related to Certain Non-GAAP Financial Measures A reconciliation of net income (loss) applicable to common stock to net operating income (and related per-share amounts) is as follows (dollars in millions, except per-share amounts): 4Q11 1Q12 2Q12 3Q12 4Q12 Net income (loss) applicable to common stock 64.4$ 59.1$ 65.7$ (5.0)$ 101.2$ Net realized investment (gains) losses, net of related amortization and taxes (14.0) (14.1) (18.7) (4.8) (10.8) Fair value changes in embedded derivative liabilities, net of related amortization and taxes 0.4 (4.5) 6.9 2.0 (2.6) Valuation allowance for deferred tax assets - - - (143.0) (28.5) Loss on extinguishment of debt 0.2 0.1 0.3 176.4 0.7 Net operating income (a non-GAAP financial measure) 51.0$ 40.6$ 54.2$ 25.6$ 60.0$ Per diluted share: Net income (loss) 0.23$ 0.21$ 0.24$ (0.02)$ 0.41$ N t realized investment (gains) losses, net of related amortization and taxes (0.05) (0.05) (0.06) (0.02) (0.04) Fair value changes in embedded derivative liabilities, net of related amortization and taxes - (0.01) 0.02 0.01 (0.01) Valuation allowance for deferred tax assets - - - (0.62) (0.11) Loss on extinguishment of debt - - - 0.76 - Net operating income (a non-GAAP financial measure) 0.18$ 0.15$ 0.20$ 0.11$ 0.25$
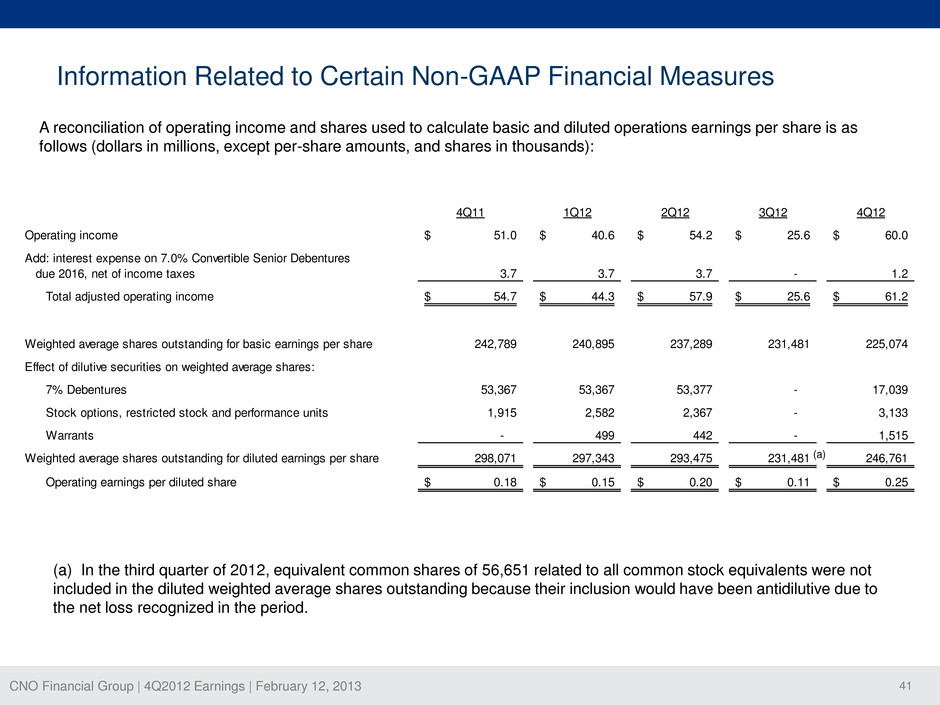
CNO Financial Group | 4Q2012 Earnings | February 12, 2013 41 4Q11 1Q12 2Q12 3Q12 4Q12 Operating income 51.0$ 40.6$ 54.2$ 25.6$ 60.0$ Add: interest expense on 7.0% Convertible Senior Debentures due 2016, net of income taxes 3.7 3.7 3.7 - 1.2 Total adjusted operating income 54.7$ 44.3$ 57.9$ 25.6$ 61.2$ Weighted average shares outstanding for basic earnings per share 242,789 240,895 237,289 231,481 225,074 Effect of dilutive securities on weighted average shares: 7% Debentures 53,367 53,367 53,377 - 17,039 Stock options, restricted stock and performance units 1,915 2,582 2,367 - 3,133 Warrants - 499 442 - 1,515 Weighted average shares outstanding for diluted earnings per share 298,071 297,343 293,475 231,481 246,761 Operating earnings per diluted share 0.18$ 0.15$ 0.20$ 0.11$ 0.25$ A reconciliation of operating income and shares used to calculate basic and diluted operations earnings per share is as follows (dollars in millions, except per-share amounts, and shares in thousands): (a) (a) In the third quarter of 2012, equivalent common shares of 56,651 related to all common stock equivalents were not included in the diluted weighted average shares outstanding because their inclusion would have been antidilutive due to the net loss recognized in the period. Information Related to Certain Non-GAAP Financial Measures
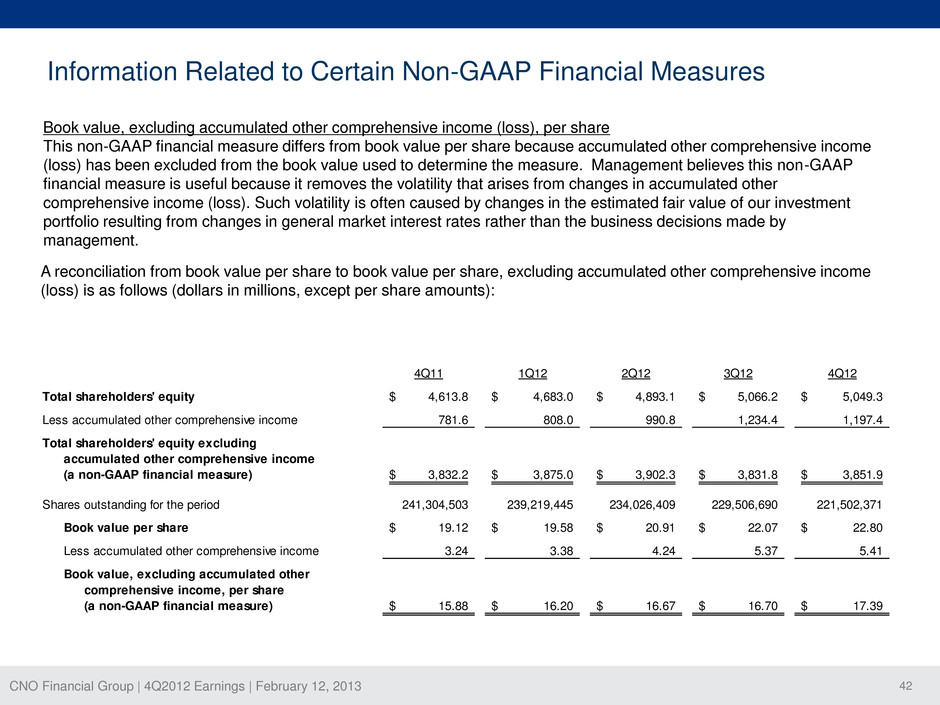
CNO Financial Group | 4Q2012 Earnings | February 12, 2013 42 Book value, excluding accumulated other comprehensive income (loss), per share This non-GAAP financial measure differs from book value per share because accumulated other comprehensive income (loss) has been excluded from the book value used to determine the measure. Management believes this non-GAAP financial measure is useful because it removes the volatility that arises from changes in accumulated other comprehensive income (loss). Such volatility is often caused by changes in the estimated fair value of our investment portfolio resulting from changes in general market interest rates rather than the business decisions made by management. 4Q11 1Q12 2Q12 3Q12 4Q12 Total shareholders' equity 4,613.8$ 4,683.0$ 4,893.1$ 5,066.2$ 5,049.3$ Less accumulated other comprehensive income 781.6 808.0 990.8 1,234.4 1,197.4 Total shareholders' equity excluding cumulat d other comprehensive income ( non-GA P financial measure) 3,832.2$ 3,875.0$ 3,902.3$ 3,831.8$ 3,851.9$ Shares outstanding for the period 241,304,503 239,219,445 234,026,409 229,506,690 221,502,371 Book value per share 19.12$ 19.58$ 20.91$ 22.07$ 22.80$ Less accumulated other comprehensive income 3.24 3.38 4.24 5.37 5.41 Book value, excluding accumulated other comprehensive income, per share (a non-GAAP financial measure) 15.88$ 16.20$ 16.67$ 16.70$ 17.39$ A reconciliation from book value per share to book value per share, excluding accumulated other comprehensive income (loss) is as follows (dollars in millions, except per share amounts): Information Related to Certain Non-GAAP Financial Measures
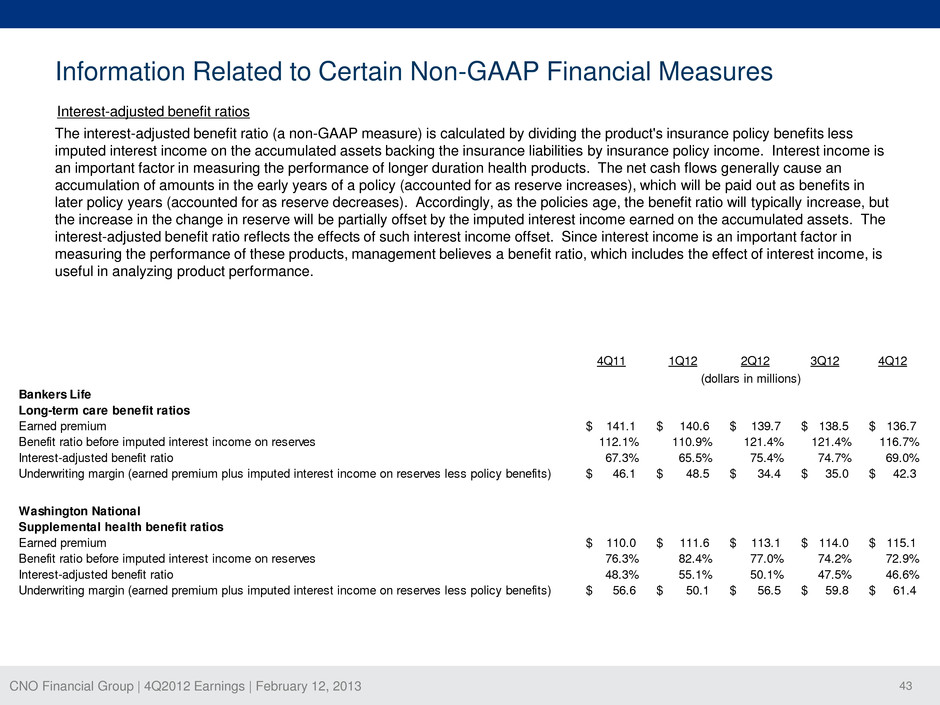
CNO Financial Group | 4Q2012 Earnings | February 12, 2013 43 Information Related to Certain Non-GAAP Financial Measures The interest-adjusted benefit ratio (a non-GAAP measure) is calculated by dividing the product's insurance policy benefits less imputed interest income on the accumulated assets backing the insurance liabilities by insurance policy income. Interest income is an important factor in measuring the performance of longer duration health products. The net cash flows generally cause an accumulation of amounts in the early years of a policy (accounted for as reserve increases), which will be paid out as benefits in later policy years (accounted for as reserve decreases). Accordingly, as the policies age, the benefit ratio will typically increase, but the increase in the change in reserve will be partially offset by the imputed interest income earned on the accumulated assets. The interest-adjusted benefit ratio reflects the effects of such interest income offset. Since interest income is an important factor in measuring the performance of these products, management believes a benefit ratio, which includes the effect of interest income, is useful in analyzing product performance. 4Q11 1Q12 2Q12 3Q12 4Q12 (dollars in millions) Bankers Life Long-term care benefit ratios Earned premium 141.1$ 140.6$ 139.7$ 138.5$ 136.7$ Benefit ratio before imputed interest income on reserves 112.1% 110.9% 121.4% 121.4% 116.7% Interest-adjusted benefit ratio 67.3% 65.5% 75.4% 74.7% 69.0% Underwriting margin (earned premium plus imputed interest income on reserves less policy benefits) 46.1$ 48.5$ 34.4$ 35.0$ 42.3$ Was ington National Supplemental health benefit ratios Earned premium 110.0$ 111.6$ 113.1$ 114.0$ 115.1$ Benefit ratio before imputed interest income on reserves 76.3% 82.4% 77.0% 74.2% 72.9% Interest-adjusted benefit ratio 48.3% 55.1% 50.1% 47.5% 46.6% Underwriting margin (earned premium plus imputed interest income on reserves less policy benefits) 56.6$ 50.1$ 56.5$ 59.8$ 61.4$ Interest-adjusted benefit ratios
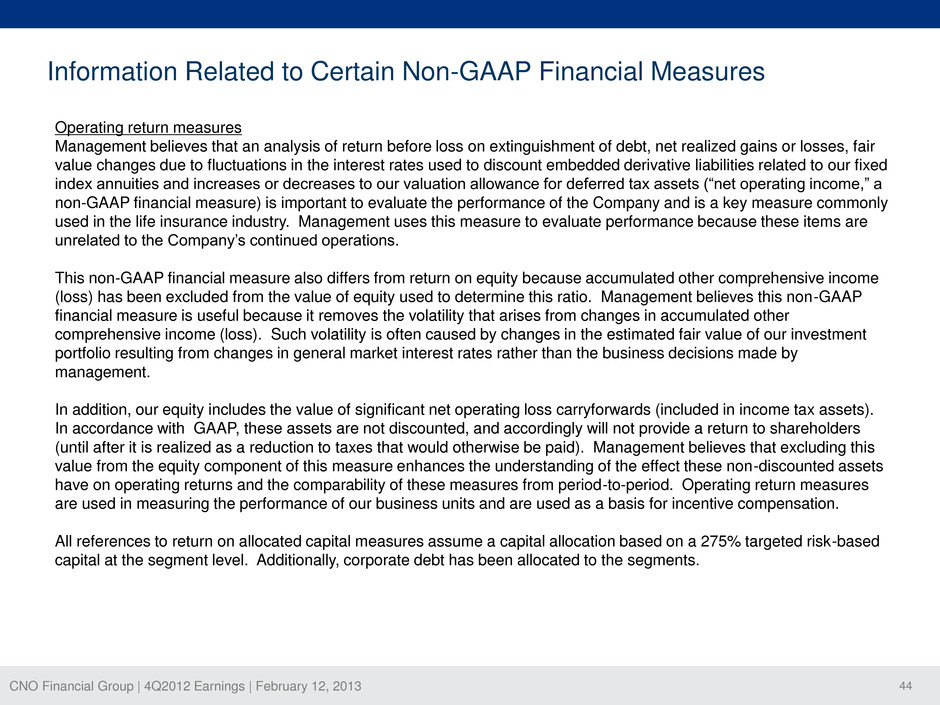
CNO Financial Group | 4Q2012 Earnings | February 12, 2013 44 Information Related to Certain Non-GAAP Financial Measures Operating return measures Management believes that an analysis of return before loss on extinguishment of debt, net realized gains or losses, fair value changes due to fluctuations in the interest rates used to discount embedded derivative liabilities related to our fixed index annuities and increases or decreases to our valuation allowance for deferred tax assets (“net operating income,” a non-GAAP financial measure) is important to evaluate the performance of the Company and is a key measure commonly used in the life insurance industry. Management uses this measure to evaluate performance because these items are unrelated to the Company’s continued operations. This non-GAAP financial measure also differs from return on equity because accumulated other comprehensive income (loss) has been excluded from the value of equity used to determine this ratio. Management believes this non-GAAP financial measure is useful because it removes the volatility that arises from changes in accumulated other comprehensive income (loss). Such volatility is often caused by changes in the estimated fair value of our investment portfolio resulting from changes in general market interest rates rather than the business decisions made by management. In addition, our equity includes the value of significant net operating loss carryforwards (included in income tax assets). In accordance with GAAP, these assets are not discounted, and accordingly will not provide a return to shareholders (until after it is realized as a reduction to taxes that would otherwise be paid). Management believes that excluding this value from the equity component of this measure enhances the understanding of the effect these non-discounted assets have on operating returns and the comparability of these measures from period-to-period. Operating return measures are used in measuring the performance of our business units and are used as a basis for incentive compensation. All references to return on allocated capital measures assume a capital allocation based on a 275% targeted risk-based capital at the segment level. Additionally, corporate debt has been allocated to the segments.
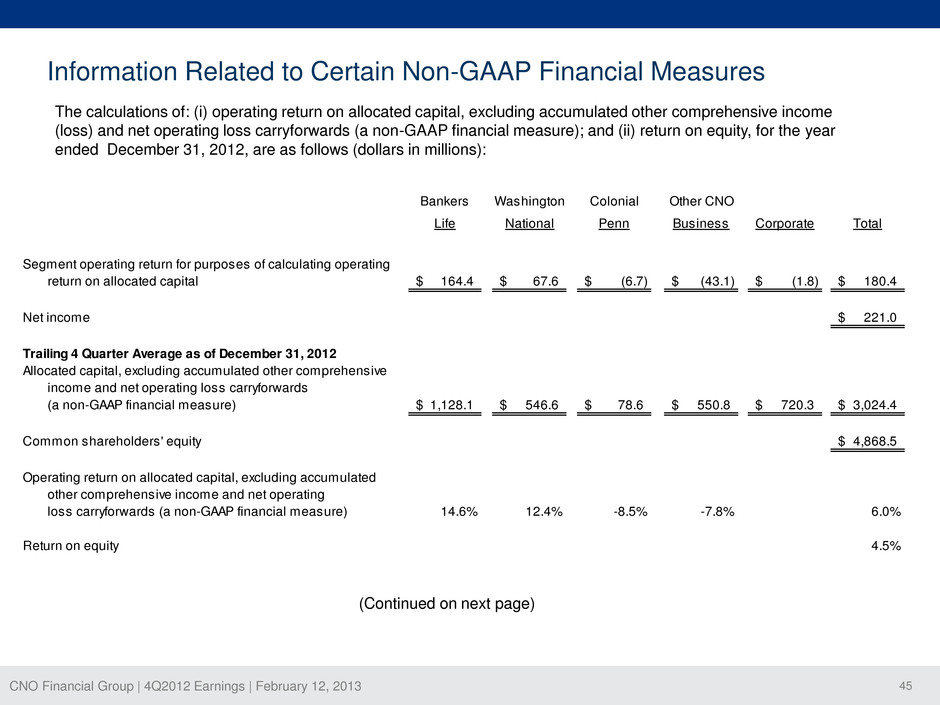
CNO Financial Group | 4Q2012 Earnings | February 12, 2013 45 Information Related to Certain Non-GAAP Financial Measures The calculations of: (i) operating return on allocated capital, excluding accumulated other comprehensive income (loss) and net operating loss carryforwards (a non-GAAP financial measure); and (ii) return on equity, for the year ended December 31, 2012, are as follows (dollars in millions): Bankers Washington Colonial Other CNO Life National Penn Business Corporate Total Segment operating return for purposes of calculating operating return on allocated capital 164.4$ 67.6$ (6.7)$ (43.1)$ (1.8)$ 180.4$ Net income 221.0$ Trailing 4 Quarter Average as of December 31, 2012 Allocated capital, excluding accumulated other comprehensive income and net operating loss carryforwards (a non-GAAP financial measure) 1,128.1$ 546.6$ 78.6$ 550.8$ 720.3$ 3,024.4$ Commo shareholders' equity 4,868.5$ Operating return on allocated capital, excluding accumulated other comprehensive income and net operating loss carryforwards (a non-GAAP financial measure) 14.6% 12.4% -8.5% -7.8% 6.0% Return on equity 4.5% (Continued on next page)
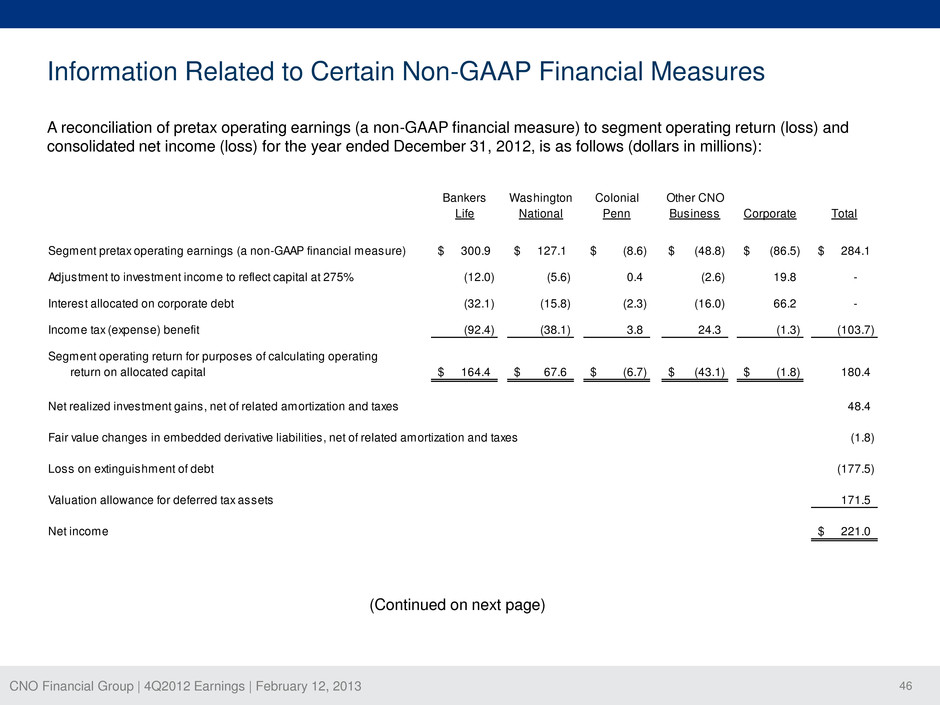
CNO Financial Group | 4Q2012 Earnings | February 12, 2013 46 Information Related to Certain Non-GAAP Financial Measures A reconciliation of pretax operating earnings (a non-GAAP financial measure) to segment operating return (loss) and consolidated net income (loss) for the year ended December 31, 2012, is as follows (dollars in millions): Bankers Washington Colonial Other CNO Life National Penn Business Corporate Total Segment pretax operating earnings (a non-GAAP financial measure) 300.9$ 127.1$ (8.6)$ (48.8)$ (86.5)$ 284.1$ Adjustment to investment income to reflect capital at 275% (12.0) (5.6) 0.4 (2.6) 19.8 - Interest allocated on corporate debt (32.1) (15.8) (2.3) (16.0) 66.2 - Income tax (expense) benefit (92.4) (38.1) 3.8 24.3 (1.3) (103.7) Segment operating return for purposes of calculating operating return on allocated capital 164.4$ 67.6$ (6.7)$ (43.1)$ (1.8)$ 180.4 Net realized investment gains, net of related amortization and taxes 48.4 Fair value changes in embedded derivative liabilities, net of related amortization and taxes (1.8) Loss on extinguishment of debt (177.5) Valuation allowance for deferred tax assets 171.5 Net income 221.0$ (Continued on next page)
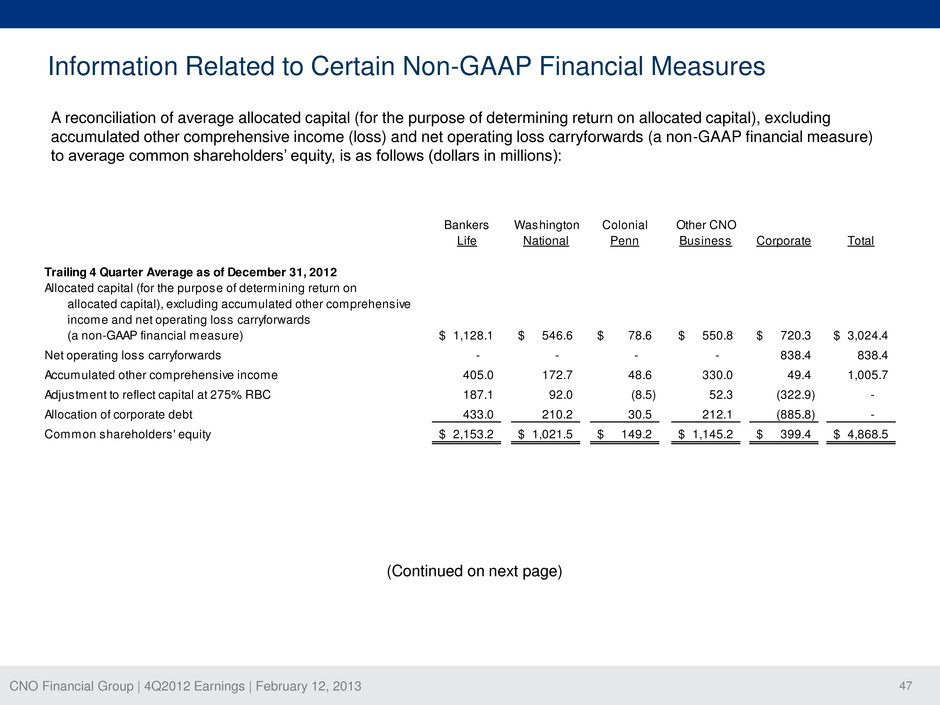
CNO Financial Group | 4Q2012 Earnings | February 12, 2013 47 Information Related to Certain Non-GAAP Financial Measures A reconciliation of average allocated capital (for the purpose of determining return on allocated capital), excluding accumulated other comprehensive income (loss) and net operating loss carryforwards (a non-GAAP financial measure) to average common shareholders’ equity, is as follows (dollars in millions): Bankers Washington Colonial Other CNO Life National Penn Business Corporate Total Trailing 4 Quarter Average as of December 31, 2012 Allocated capital (for the purpose of determining return on allocated capital), excluding accumulated other comprehensive income and net operating loss carryforwards (a non-GAAP financial measure) 1,128.1$ 546.6$ 78.6$ 550.8$ 720.3$ 3,024.4$ Net operating loss carryforwards - - - - 838.4 838.4 Accumulated other comprehensive income 405.0 172.7 48.6 330.0 49.4 1,005.7 Adjustment to reflect capital at 275% RBC 187.1 92.0 (8.5) 52.3 (322.9) - Allocation of corporate debt 433.0 210.2 30.5 212.1 (885.8) - Common shareholders' equity 2,153.2$ 1,021.5$ 149.2$ 1,145.2$ 399.4$ 4,868.5$ (Continued on next page)
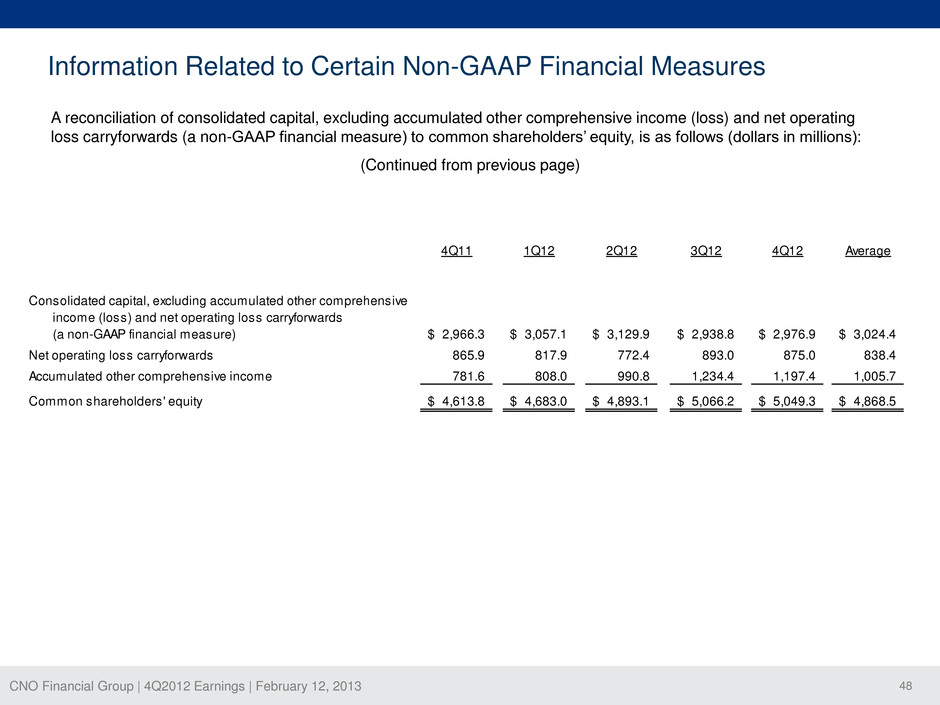
CNO Financial Group | 4Q2012 Earnings | February 12, 2013 48 Information Related to Certain Non-GAAP Financial Measures A reconciliation of consolidated capital, excluding accumulated other comprehensive income (loss) and net operating loss carryforwards (a non-GAAP financial measure) to common shareholders’ equity, is as follows (dollars in millions): 4Q11 1Q12 2Q12 3Q12 4Q12 Average Consolidated capital, excluding accumulated other comprehensive income (loss) and net operating loss carryforwards (a non-GAAP financial measure) 2,966.3$ 3,057.1$ 3,129.9$ 2,938.8$ 2,976.9$ 3,024.4$ Net operating loss carryforwards 865.9 817.9 772.4 893.0 875.0 838.4 Accumulated other comprehensive income 781.6 808.0 990.8 1,234.4 1,197.4 1,005.7 Common shareholders' equity 4,613.8$ 4,683.0$ 4,893.1$ 5,066.2$ 5,049.3$ 4,868.5$ (Continued from previous page)
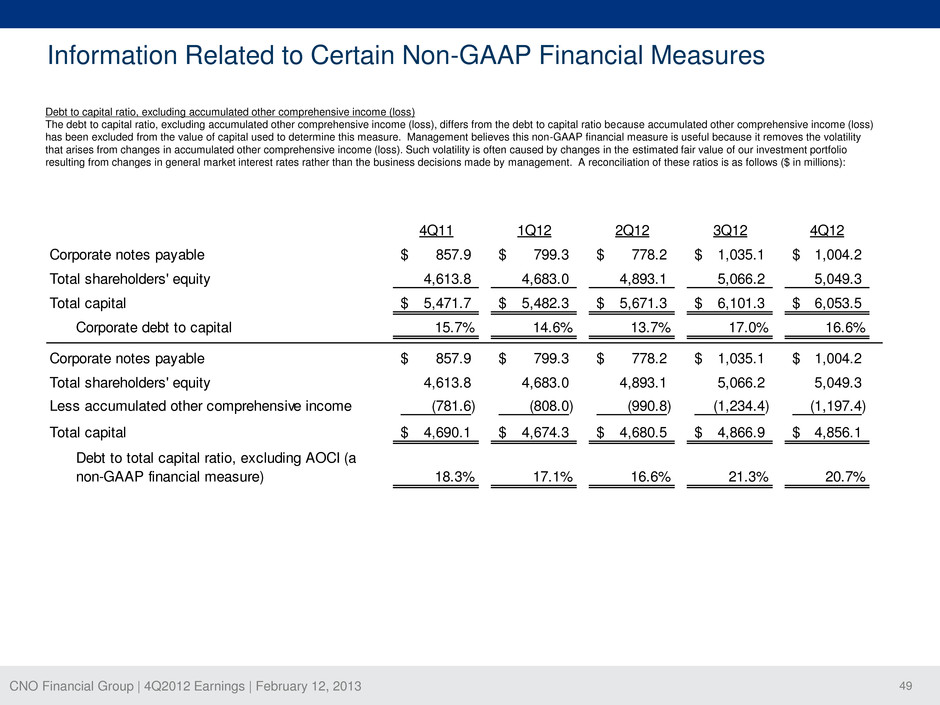
CNO Financial Group | 4Q2012 Earnings | February 12, 2013 49 Information Related to Certain Non-GAAP Financial Measures 4Q11 1Q12 2Q12 3Q12 4Q12 Corporate notes payable 857.9$ 799.3$ 778.2$ 1,035.1$ 1,004.2$ Total shareholders' equity 4,613.8 4,683.0 4,893.1 5,066.2 5,049.3 Total capital 5,471.7$ 5,482.3$ 5,671.3$ 6,101.3$ 6,053.5$ Corporate debt to capital 15.7% 14.6% 13.7% 17.0% 16.6% Corporate notes payable 857.9$ 799.3$ 778.2$ 1,035.1$ 1,004.2$ Total shareholders' equity 4,613.8 4,683.0 4,893.1 5,066.2 5,049.3 Less accumulated other comprehensive income (781.6) (808.0) (990.8) (1,234.4) (1,197.4) Total capital 4,690.1$ 4,674.3$ 4,680.5$ 4,866.9$ 4,856.1$ Debt to total capital ratio, excluding AOCI (a non-GAAP financial measure) 18.3% 17.1% 16.6% 21.3% 20.7% Debt to capital ratio, excluding accumulated other comprehensive income (loss) The debt to capital ratio, excluding accumulated other comprehensive income (loss), differs from the debt to capital ratio because accumulated other comprehensive income (loss) has been excluded from the value of capital used to determine this measure. Management believes this non-GAAP financial measure is useful because it removes the volatility that arises from changes in accumulated other comprehensive income (loss). Such volatility is often caused by changes in the estimated fair value of our investment portfolio resulting from changes in general market interest rates rather than the business decisions made by management. A reconciliation of these ratios is as follows ($ in millions):


