
Exhibit 99.1 Investor Overview September 2019

Forward-Looking Statements Certain statements made in this presentation should be considered forward-looking statements as defined in the Private Securities Litigation Reform Act of 1995. These include statements about future results of operations and capital plans. We caution investors that these forward-looking statements are not guarantees of future performance, and actual results may differ materially. Investors should consider the important risks and uncertainties that may cause actual results to differ, including those included in our Quarterly Reports on Form 10-Q, our Annual Report on Form 10-K and other filings we make with the Securities and Exchange Commission. We assume no obligation to update this presentation, which speaks as of today’s date. CNO Financial Group | Investor Overview 2
Non-GAAP Measures This presentation contains the following financial measures that differ from the comparable measures under Generally Accepted Accounting Principles (GAAP): operating earnings measures; book value, excluding accumulated other comprehensive income (loss) per share; operating return measures; earnings before net realized investment gains (losses) from sales and impairments, net change in market value of investments recognized in earnings, fair value changes in embedded derivative liabilities, fair value changes related to the agent deferred compensation plan, loss on extinguishment of debt, loss related to reinsurance transaction, other non-operating items, corporate interest expense and taxes; and debt to capital ratios, excluding accumulated other comprehensive income (loss). Reconciliations between those non-GAAP measures and the comparable GAAP measures are included in the Appendix, or on the page such measure is presented. While management believes these measures are useful to enhance understanding and comparability of our financial results, these non-GAAP measures should not be considered substitutes for the most directly comparable GAAP measures. Additional information concerning non-GAAP measures is included in our periodic filings with the Securities and Exchange Commission that are available in the “Investors – SEC Filings” section of CNO’s website, www.CNOinc.com. CNO Financial Group | Investor Overview 3
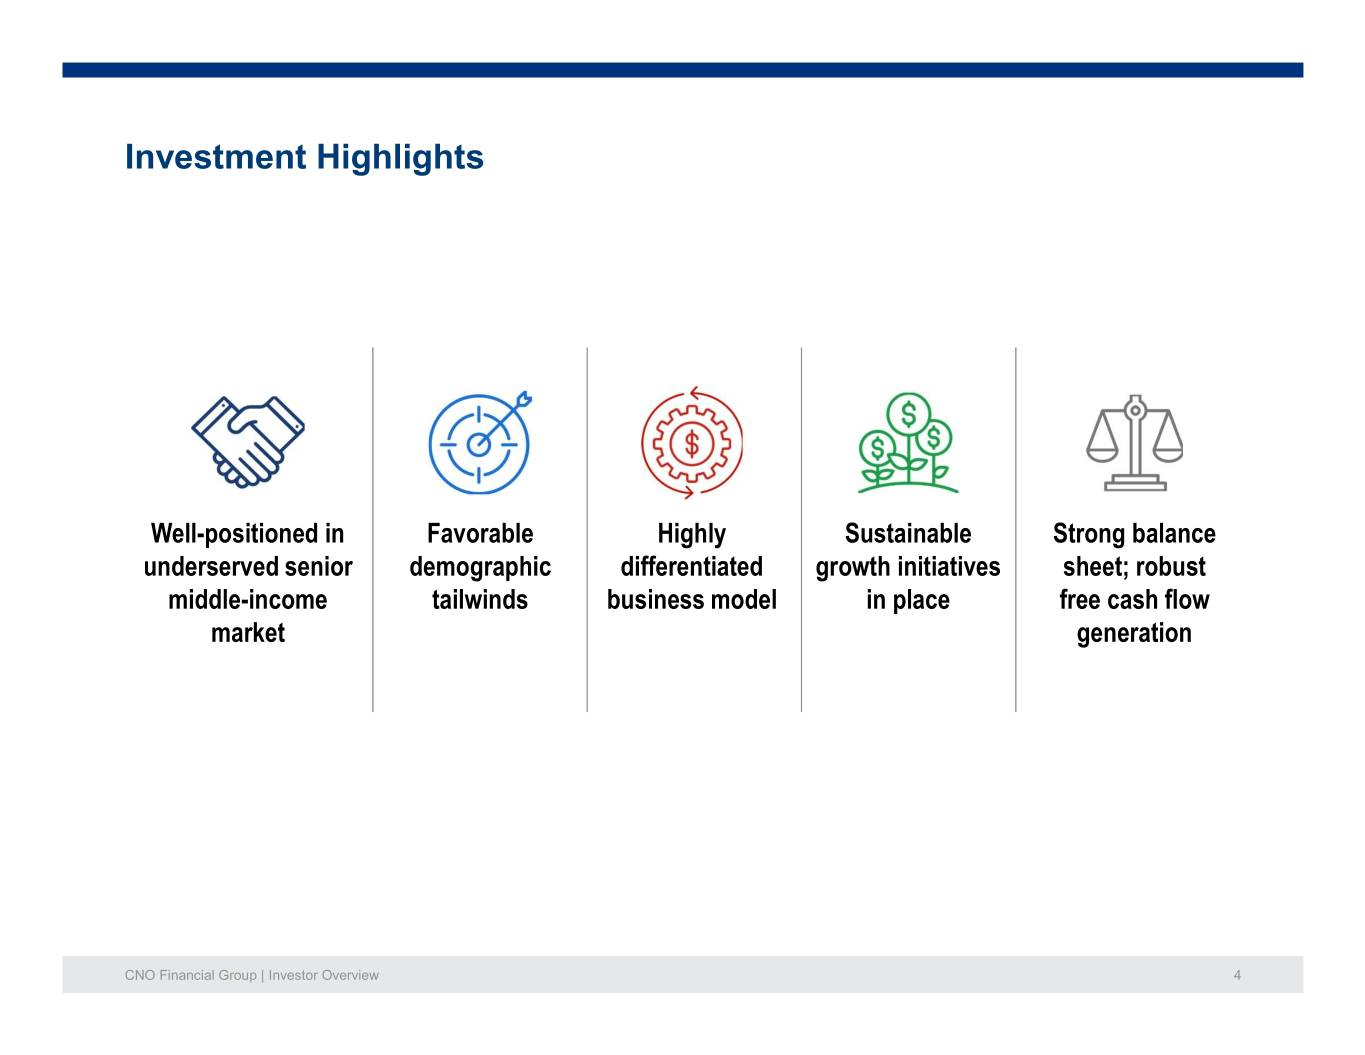
Investment Highlights Well-positioned in Favorable Highly Sustainable Strong balance underserved senior demographic differentiated growth initiatives sheet; robust middle-income tailwinds business model in place free cash flow market generation CNO Financial Group | Investor Overview 4
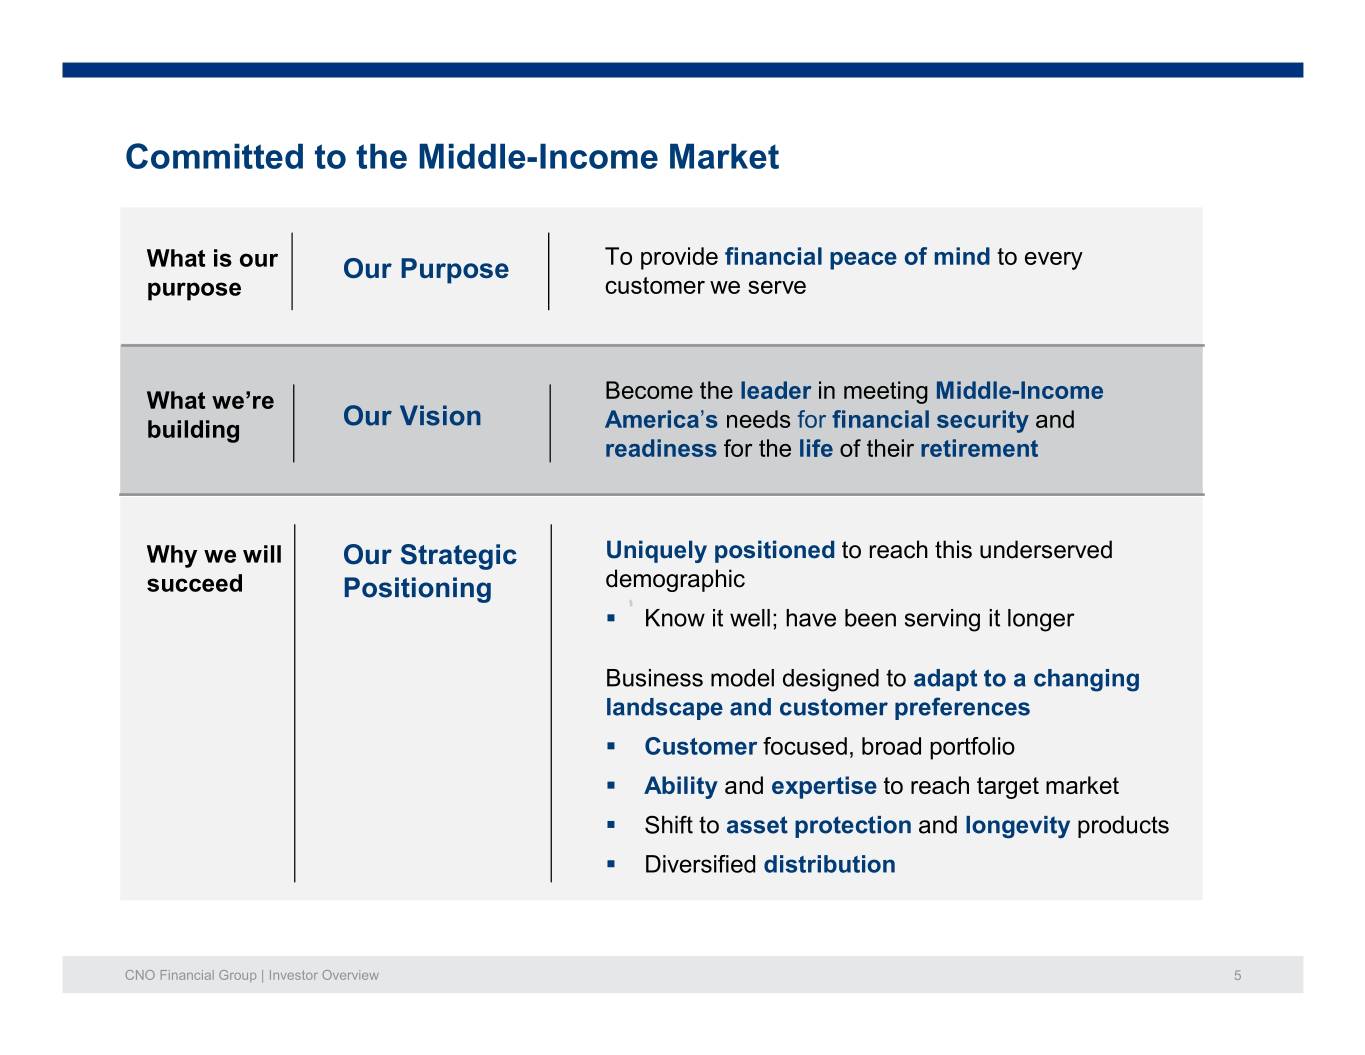
Committed to the Middle-Income Market What is our Our Purpose To provide financial peace of mind to every purpose customer we serve What we’re Become the leader in meeting Middle-Income building Our Vision America’s needs for financial security and readiness for the life of their retirement Why we will Our Strategic Uniquely positioned to reach this underserved succeed Positioning demographic . Know it well; have been serving it longer Business model designed to adapt to a changing landscape and customer preferences . Customer focused, broad portfolio . Ability and expertise to reach target market . Shift to asset protection and longevity products . Diversified distribution CNO Financial Group | Investor Overview 5
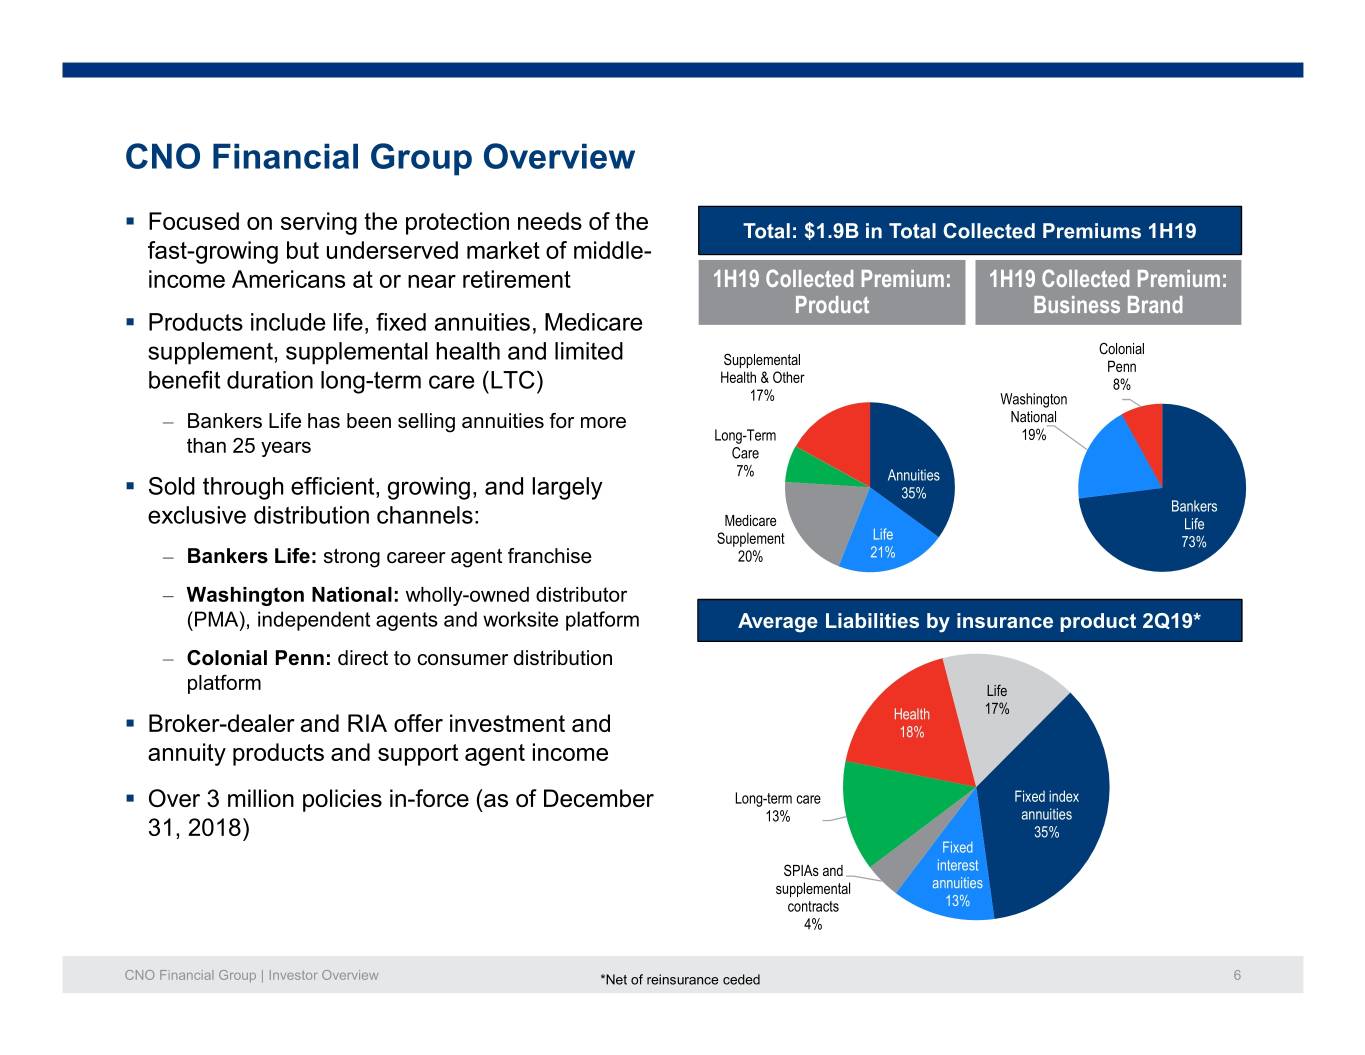
CNO Financial Group Overview . Focused on serving the protection needs of the Total: $1.9B in Total Collected Premiums 1H19 fast-growing but underserved market of middle- income Americans at or near retirement 1H19 Collected Premium: 1H19 Collected Premium: Product Business Brand . Products include life, fixed annuities, Medicare supplement, supplemental health and limited Colonial Supplemental Penn benefit duration long-term care (LTC) Health & Other 8% 17% Washington – Bankers Life has been selling annuities for more National Long-Term 19% than 25 years Care 7% Annuities . Sold through efficient, growing, and largely 35% Bankers exclusive distribution channels: Medicare Life Supplement Life 73% – Bankers Life: strong career agent franchise 20% 21% – Washington National: wholly-owned distributor (PMA), independent agents and worksite platform Average Liabilities by insurance product 2Q19* – Colonial Penn: direct to consumer distribution platform Life Health 17% . Broker-dealer and RIA offer investment and 18% annuity products and support agent income . Over 3 million policies in-force (as of December Long-term care Fixed index 13% annuities 31, 2018) 35% Fixed SPIAs and interest supplemental annuities contracts 13% 4% CNO Financial Group | Investor Overview*Net of reinsurance ceded 6

What Makes CNO Different Our Focus on Middle-Income Our Diverse Distribution America Insurance and Securities Health and Wealth Solutions Solutions Strong Cash Flow Generation CNO Financial Group | Investor Overview 7

Well-Positioned in the Attractive Senior Middle Market 63% of middle-income households are underinsured; ~60% of baby boomers lack financial advisors(1) Percentage of Population Age 65+ CNO Solutions without a Financial Product CNO Solutions . Extensive experience and understanding of the middle market Other Health 84% . Differentiated with our market vs. product focus LTC 83% . Diversification of products and distribution provides sustainable Annuities 78% competitive advantage . Positioned to help customers to address main concerns of outliving Medicare Supplement 60% their assets and dealing with rising healthcare costs as they age Life Insurance 40% (1) Bankers Life Center for a Secure Retirement 2017 CNO Financial Group | Investor Overview 8

Highly Diversified Product Mix Focused on protection needs Product Offering Key Points . Basic products that meet the insurance 1 Life Insurance needs of the middle-market . Attractive and predictable return 2 Annuities characteristics . Mix of protection and accumulation 3 Medicare products to serve varied customer needs . Product mix balances interest rate risk 4 Supplemental Health with shorter duration pure mortality and morbidity insurance . Lower risk long-term care products with 5 Long-Term Care short-duration benefit period CNO Financial Group | Investor Overview 9
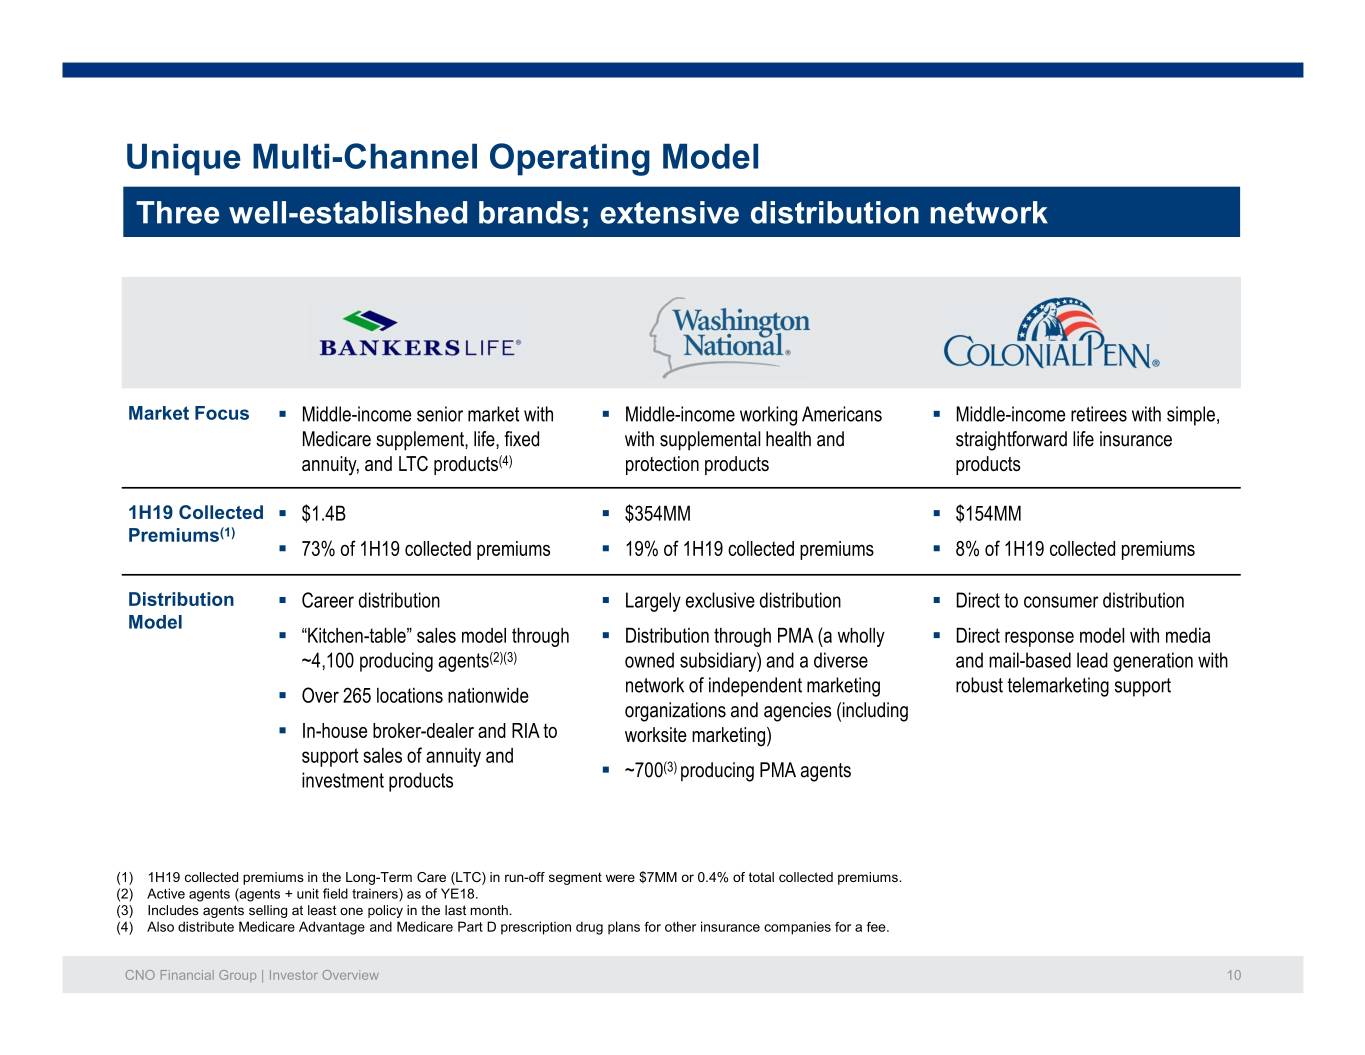
Unique Multi-Channel Operating Model Three well-established brands; extensive distribution network Market Focus . Middle-income senior market with . Middle-income working Americans . Middle-income retirees with simple, Medicare supplement, life, fixed with supplemental health and straightforward life insurance annuity, and LTC products(4) protection products products 1H19 Collected . $1.4B . $354MM . $154MM Premiums(1) . 73% of 1H19 collected premiums . 19% of 1H19 collected premiums . 8% of 1H19 collected premiums Distribution . Career distribution . Largely exclusive distribution . Direct to consumer distribution Model . “Kitchen-table” sales model through . Distribution through PMA (a wholly . Direct response model with media ~4,100 producing agents(2)(3) owned subsidiary) and a diverse and mail-based lead generation with . Over 265 locations nationwide network of independent marketing robust telemarketing support organizations and agencies (including . In-house broker-dealer and RIA to worksite marketing) support sales of annuity and . ~700(3) producing PMA agents investment products (1) 1H19 collected premiums in the Long-Term Care (LTC) in run-off segment were $7MM or 0.4% of total collected premiums. (2) Active agents (agents + unit field trainers) as of YE18. (3) Includes agents selling at least one policy in the last month. (4) Also distribute Medicare Advantage and Medicare Part D prescription drug plans for other insurance companies for a fee. CNO Financial Group | Investor Overview 10

Executing on Proven Growth Strategy Ongoing initiatives to accelerate profitable growth in all segments Broaden core customer Leverage technology to Engage in opportunistic Enhance product demographic/ boost efficiency and M&A to add capabilities portfolio move to the right drive productivity as appropriate . Continue building broker- dealer and RIA . Simplified issue underwriting . Broaden geographic reach . Reshape agency with enhancements enhanced new agent support . Advance worksite capabilities . Expand web / digital presence / training, and push for more . Expand independent . Leverage lead-sharing cross- financial advisors distribution sales opportunities . Improve retention of . Improve brand awareness experienced agents . Augment cross-selling efforts . Enhanced use of data for improved underwriting CNO Financial Group | Investor Overview 11

Comprehensive and Active Risk Management Strategy Strong and effective ERM decision framework . Business plan supports strong overall risk management strategy – Disciplined pricing and review of actuarial assumptions – Consistent application of company-wide stress tests1 – Ongoing monitoring of emerging actuarial experience, asset exposures and operational risks . Series of transactions have led to a reduction of complex policies – Ceded approximately $2.7bn of legacy LTC statutory reserves in 2018 – Sale of Conseco Life Insurance Company (CLIC) in 2014 – Separation of closed block LTC company in 2008 – Ceded $3bn annuity block in 2007 . Healthy consolidated RBC ratio of 409% at June 30, 2019 – Target RBC ratio of 400-425% over time – Maintain minimum $150 million of liquidity at the holding company 1 Financial implications remain limited in stressed scenarios. CNO Financial Group | Investor Overview 12
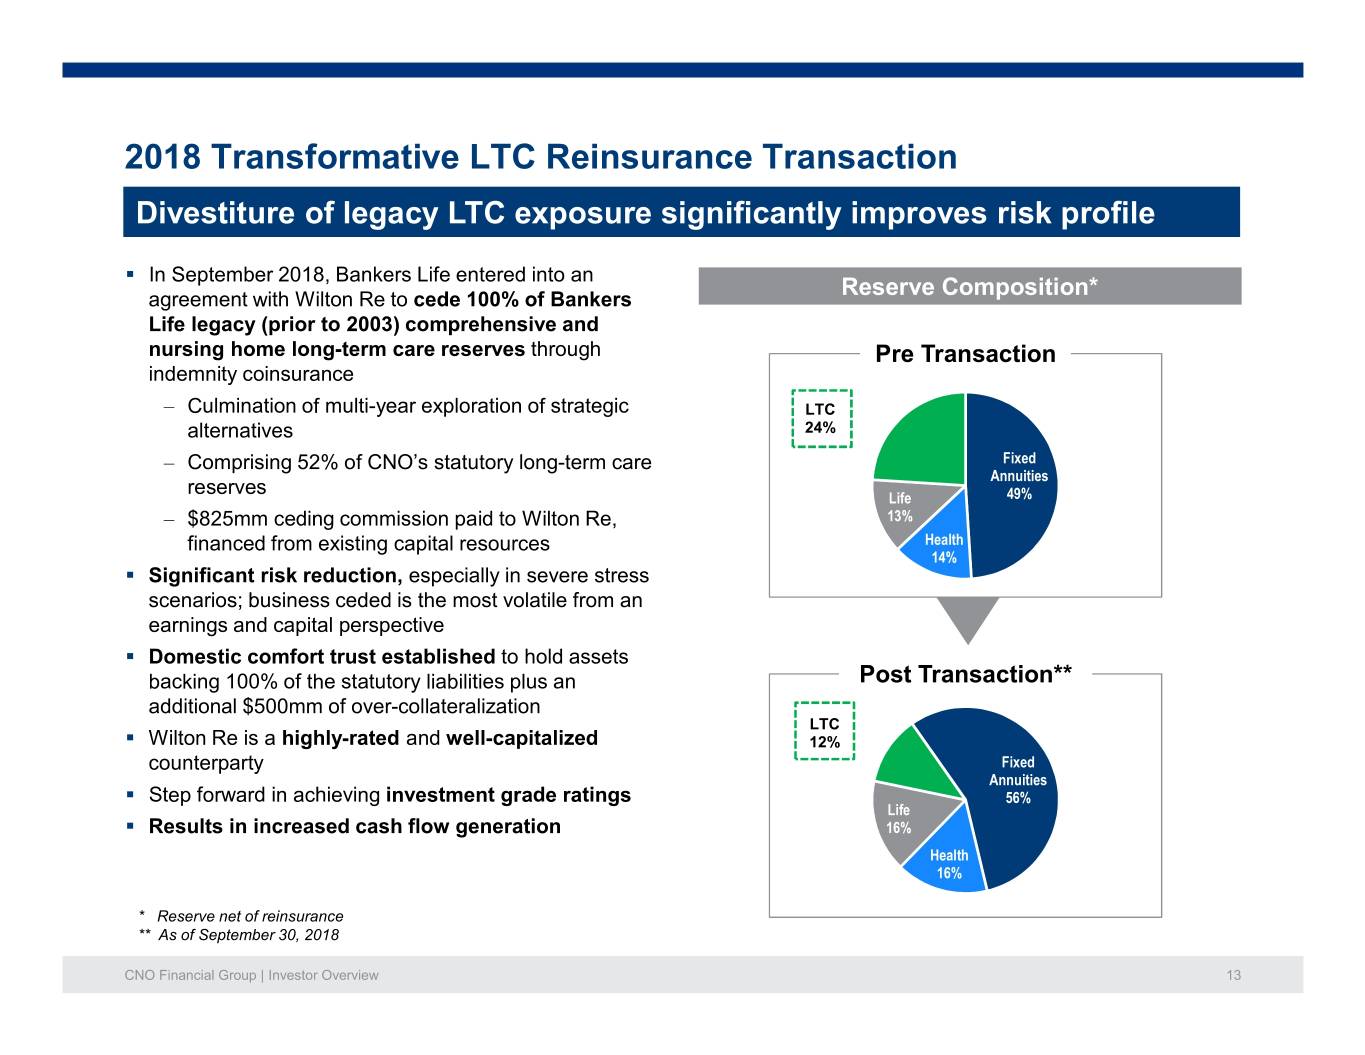
2018 Transformative LTC Reinsurance Transaction Divestiture of legacy LTC exposure significantly improves risk profile . In September 2018, Bankers Life entered into an Reserve Composition* agreement with Wilton Re to cede 100% of Bankers Life legacy (prior to 2003) comprehensive and nursing home long-term care reserves through Pre Transaction indemnity coinsurance – Culmination of multi-year exploration of strategic LTC alternatives 24% – Comprising 52% of CNO’s statutory long-term care Fixed Annuities reserves Life 49% – $825mm ceding commission paid to Wilton Re, 13% financed from existing capital resources Health 14% . Significant risk reduction, especially in severe stress scenarios; business ceded is the most volatile from an earnings and capital perspective . Domestic comfort trust established to hold assets backing 100% of the statutory liabilities plus an Post Transaction** additional $500mm of over-collateralization LTC . Wilton Re is a highly-rated and well-capitalized 12% counterparty Fixed Annuities . Step forward in achieving investment grade ratings 56% Life . Results in increased cash flow generation 16% Health 16% * Reserve net of reinsurance ** As of September 30, 2018 CNO Financial Group | Investor Overview 13

Holistic Approach to Managing Bankers Retained LTC Business Focus on senior middle-market drives reduced tail risk . Significant claims data on older ages drives reliable studies and estimates – No mortality or morbidity improvements assumed – Minimal future rate increases projected – Ultimate new money rate lowered to 6.0% from 6.5% at year end 2018 . Manage new business risk through focus on short duration of policies, use of reinsurance, and control over distribution – Average benefit period for new sales is ~10 months; no longer sell LTC with benefit periods longer than 3 years – Continue to reinsure 25% of new business . Company’s proactive in-force management – Comprehensive claim persistency studies conducted and refreshed regularly – 2018 LRT margin of $235 million or ~13% of Net GAAP Liabilities – Stat reserves ~$46MM higher than GAAP; Total LTC is just 13% of overall CNO reserves – 56% of retained policies have benefit periods of one year or less; an additional 38% having benefit periods of one to four years CNO Financial Group | Investor Overview 14

Experienced Management Team With a Proven Track Record 10-year average tenure; 21-year average service in the insurance sector Years in Insurance Name Title Years with CNO Age Sector Gary C. Bhojwani Chief Executive Officer 3 29 51 Paul H. McDonough Chief Financial Officer <1* 17 54 Eric Johnson Chief Investment Officer 22 22 58 Bruce Baude Chief Operations and Technology Officer 7 14 54 Matt Zimpfer GeneralCounsel 21 26 51 Yvonne Franzese Chief Human Resources Officer 1 29 60 John Kline Chief Accounting Officer 28 39 61 Rocco F. Tarasi Chief Marketing Officer 2 2 47 Karen DeToro Chief Actuary <1** 25 48 Tim Bischof Chief Risk Officer 18 23 47 Scott Goldberg President, Bankers Life 14 18 48 Mike Heard President, Washington National 5 21 53 Joel Schwartz President, Colonial Penn 5 13 56 *Mr. McDonough was appointed Chief Financial Officer effective April 1, 2019. **Ms. DeToro was appointed Chief Actuary effective September 30, 2019. CNO Financial Group | Investor Overview 15

Strong Track Record of Execution Steady improvement in financial strength; successful pivot to growth Q1 2012 Q1 2015 Began buying back stock Enter strategic Q3 2018 under repurchase plan technology Completed LTC (and making commensurate partnership reinsurance prepayments on the Senior with Cognizant transaction with Credit Facility) Wilton Re Q2 2016 Q2 2019 Q3 2012 Strategic Q4 2017 Received Q1 2011 Recapitalization - new Q3 2014 Pre-paid $50 Sale of Conseco Life investment in Amend & extend investment grade debt structure and million on Senior Insurance Company Tennenbaum revolving credit ratings from S&P retired Paulson Credit Facility to Wilton Re Capital Partners facility and Fitch convertible investment 2010 2011 2012 2013 2014 2015 2016 2017 2018 2019 Q2 2016 Q2 2012 Launch of in- Q4 2017 Q2 2019 Initiation of house BD/RIA Successful Completed dividend platform CEO transition acquisition of program Web Benefits Design Q4 2010 Q2 2015 Q1 2012 Q4 2016 Q3 2018 Q2 2019 Refinanced $650 Refinance of debt with Retired early $50 Recaptured Sale of Refinanced million of debt $150mm senior unsecured million Senior closed block Tennenbaum $500mm of senior revolver and $825mm Health Note long-term care Capital Partners unsecured notes senior unsecured notes business investment at gain incl. incremental $75mm CNO Financial Group | Investor Overview 16

Portfolio Composition Conservative construction; recent up in quality repositioning $24 billion of Invested Assets Fixed Maturity Securities by Ratings (Fair Value as of 6/30/2019) Mortgage Loans, HY Corporates, 7.0% 3.4% CMO, 3.2% CMBS, 7.7% Municipals, 8.8% NAIC 2, 39.0% ABS, 11.6% Govts/Agency, NAIC 1, 57.0% IG Corporates, 1.2% 48.5% CDO, 1.2% Equities, 0.2% OIA, 4.2% NAIC 3, 3.1% Policy Loans, NAIC 4, 0.9% 0.5% Cash, 2.5% NAIC 5, 0.0% General Approach . Positioned for stable performance across . Low impairments through multiple cycles credit cycles . Lower than average allocation to most higher risk . Emphasizing quality categories – all carefully calibrated . Keen focus on performance management and . Recession stress test scenarios continually positive selection updated and results manageable CNO Financial Group | Investor Overview 17

Strong and Stable Capital Profile Well-positioned to navigate the current environment Risk Based Capital (“RBC”) Ratio1 459% 446% Robust capitalization with $1.7bn statutory capital 409% 393% Target consolidated RBC of ~400-425% 24 points decrease in RBC from Q3 to Q4 2018 from market volatility 2016 2017 2018 2Q19 Debt to Capital2 22.3% 23.9% 19.1% 20.1% Conservative approach to capital structure with targeted holding company liquidity of > $150mm Target leverage of 22.5 – 25.0% 2016 2017 2018 2Q19 Interest Coverage3 x 10.8x 10.0 8.9x 8.3x Stable earnings profile drives consistently high interest coverage metrics 2016 2017 2018 1H19 (1) The ratio of the combined capital of the insurance companies to the minimum amount of capital appropriate to support the overall business operations, as determined based on the methodology developed by the National Association of Insurance Commissioners. (2) Excluding accumulated other comprehensive income (a non-GAAP measure). See the Appendix for a reconciliation to the corresponding GAAP measure. (3) Calculated as Adjusted EBIT divided by interest expense (a non-GAAP measure). See the Appendix for a reconciliation to the corresponding GAAP measure. CNO Financial Group | Investor Overview 18

Robust Cash Flow Generation Cash flow conversion rate among highest in industry 2016 2017 2018 1H19 1 Consistently Net Operating Income $ 262.5 $ 300.9 $ 303.1 $ 142.2 profitable operating subs provide strong 2 Holding Company Cash Flows, Excluding Capital Transactions dividend capacity Dividends from Insurance Subsidiaries$ 274.3 $ 357.7 $ 213.9 $ 130.9 Management and Investment Fees 78.6 108.1 108.9 57.5 Cash flows from Surplus Debenture Interest 56.0 56.8 58.2 24.9 fees and interest Earnings on Corporate Investments 34.1 16.6 14.6 8.6 that are Dividends from Non-Insurance Subsidiaries 16.5 5.8 11.0 8.0 substantially more Gross Proceeds from New Debt 0.0 0.0 0.0 500.0 than interest expenses and Other 7.8 6.1 7.9 12.7 Holding Company Holding Company Sources of Cash, Excluding Capital Transactions$ 467.3 $ 551.1 $ 414.5 $ 742.6 expenses Holding Company Expenses and Other (34.3) (62.4) (72.6) (42.8) Intercompany Tax Settlements (40.7) (31.8) (12.4) (8.1) During 2018, Tax Payments 0.0 (71.3) (26.0) 0.0 contributed Interest Expense (43.5) (43.9) (44.8) (22.8) $265mm to the Cash Flow to Holding Company, Excluding Capital Transactions$ 348.8 $ 341.7 $ 258.7 $ 668.9 OpCos to improve Contributions to Insurance Subsidiaries (200.0) 0.0 (265.0) 0.0 the capital profile of the business in Dividend Payments to Stockholders (54.8) (59.6) (64.8) (33.7) connection with the Share Repurchases (206.7) (166.1) (100.9) (100.0) Wilton Re LTC Acquisition 0.0 0.0 0.0 (66.7) reinsurance Debt Repayments 0.0 0.0 0.0 (425.0) transaction and reduced Dividends Net Change in Holding Company Cash$ (112.7) $ 116.0 $ (172.0) $ 43.5 from Insurance Non-Cash Changes in Investment Balances (5.9) 17.0 (4.2) 0.2 Subs further Cash and Investments, Beginning of Period 382.2 263.6 396.6 220.4 supporting Cash and Investments, End of Period$ 263.6 $ 396.6 $ 220.4 $ 264.1 capitalization 1 A non-GAAP measure. See the Appendix for a reconciliation to the corresponding GAAP measure. 2 Cash flows exclude stock repurchases, capital contributions to insurance subsidiaries and dividend payments. CNO Financial Group | Investor Overview 19
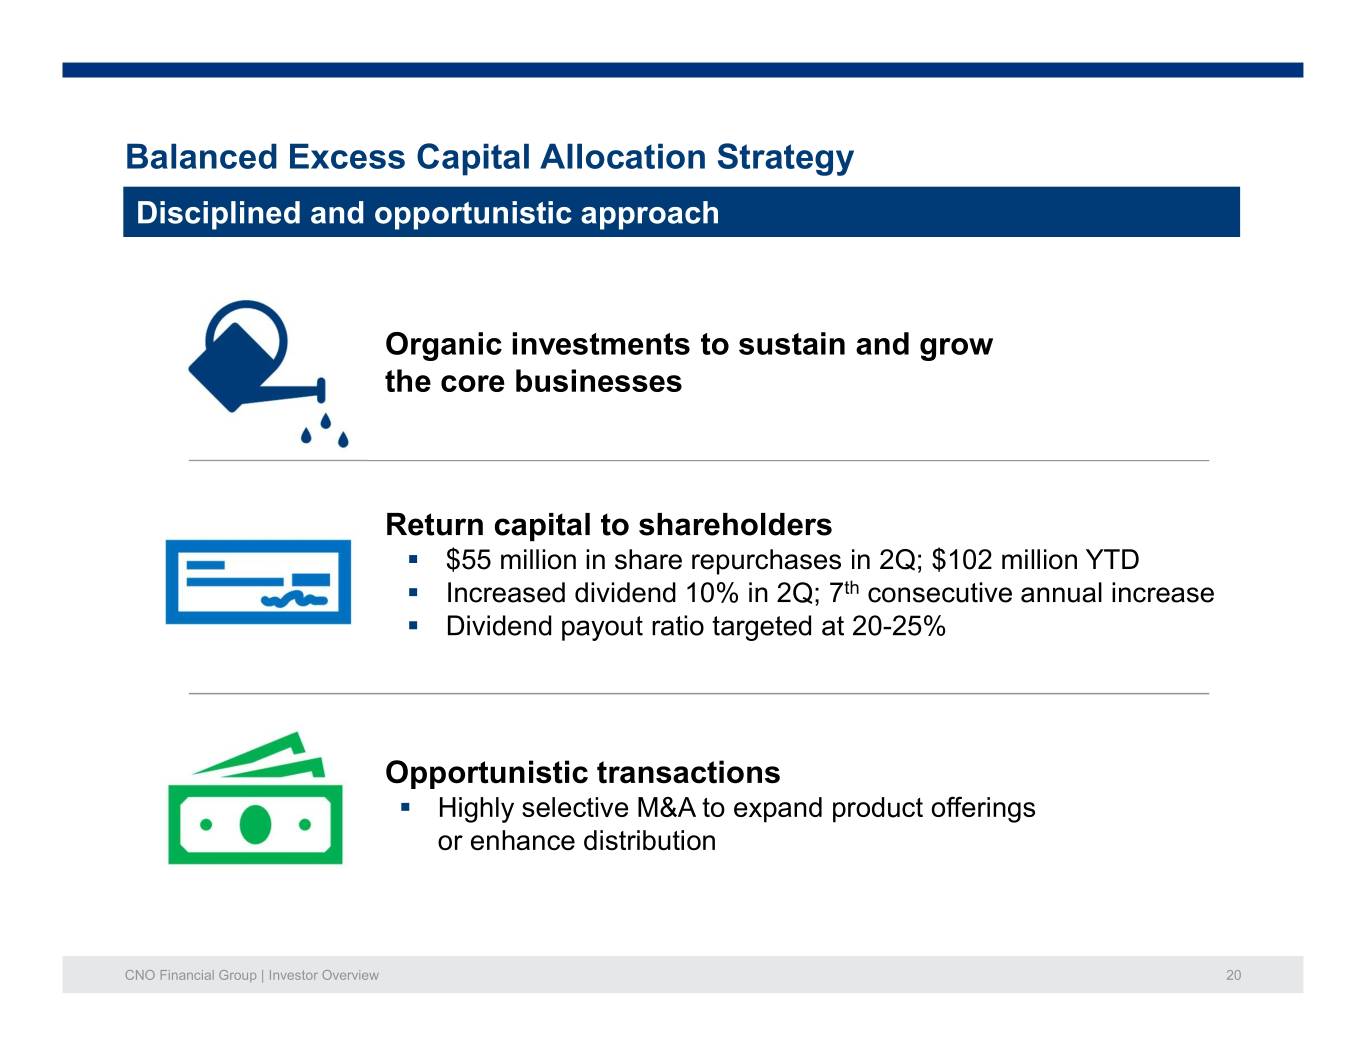
Balanced Excess Capital Allocation Strategy Disciplined and opportunistic approach Organic investments to sustain and grow the core businesses Return capital to shareholders . $55 million in share repurchases in 2Q; $102 million YTD . Increased dividend 10% in 2Q; 7th consecutive annual increase . Dividend payout ratio targeted at 20-25% Opportunistic transactions . Highly selective M&A to expand product offerings or enhance distribution CNO Financial Group | Investor Overview 20
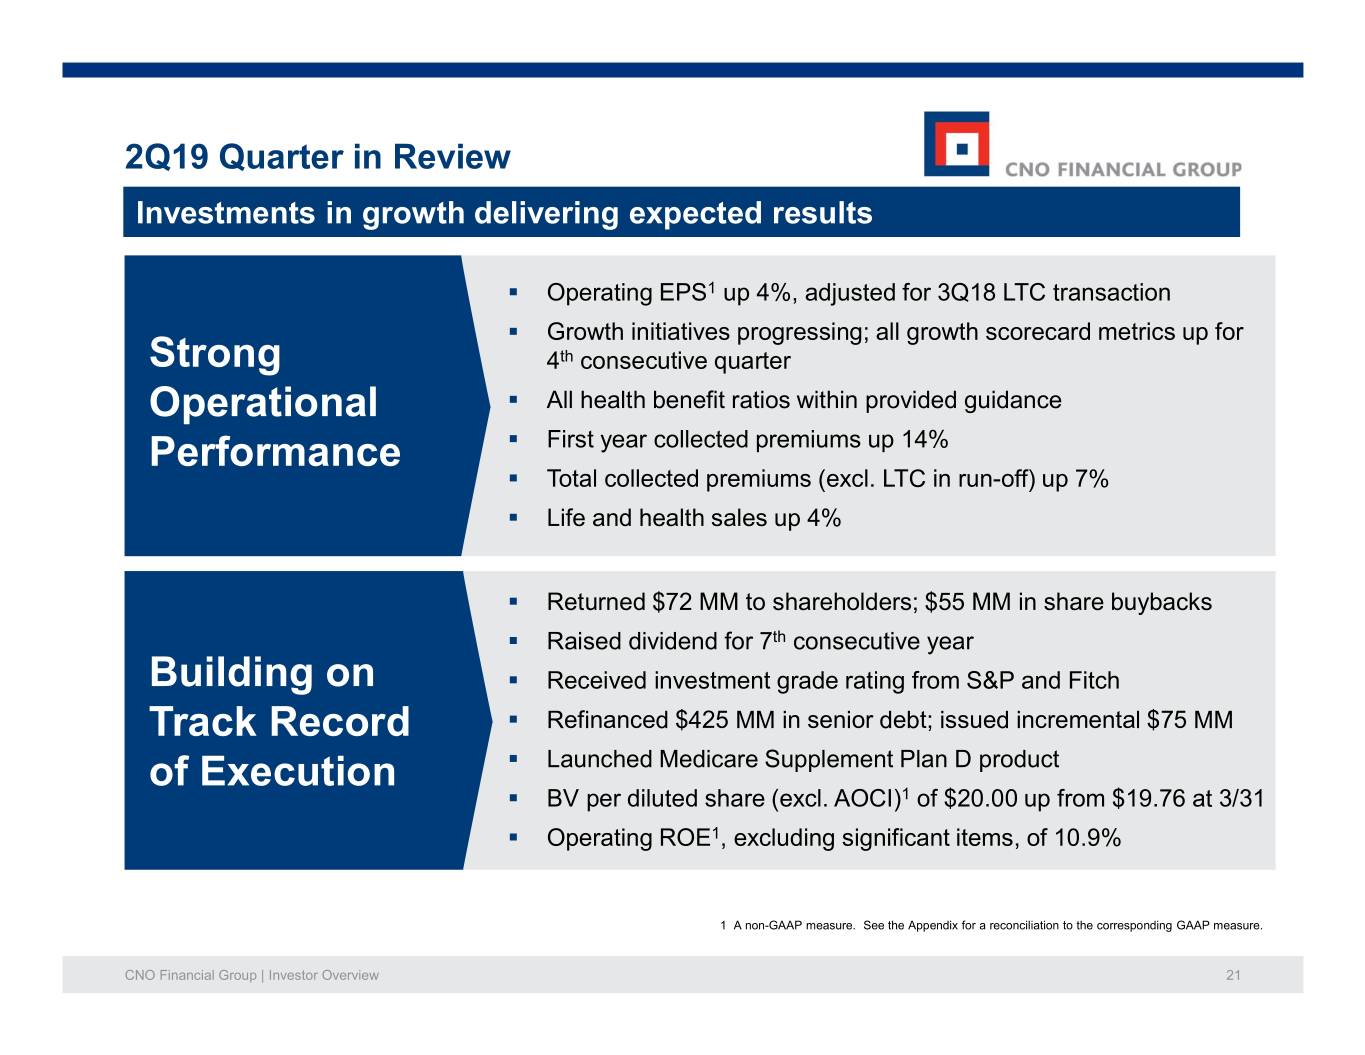
2Q19 Quarter in Review Investments in growth delivering expected results . Operating EPS1 up 4%, adjusted for 3Q18 LTC transaction . Growth initiatives progressing; all growth scorecard metrics up for Strong 4th consecutive quarter Operational . All health benefit ratios within provided guidance Performance . First year collected premiums up 14% . Total collected premiums (excl. LTC in run-off) up 7% . Life and health sales up 4% . Returned $72 MM to shareholders; $55 MM in share buybacks . Raised dividend for 7th consecutive year Building on . Received investment grade rating from S&P and Fitch Track Record . Refinanced $425 MM in senior debt; issued incremental $75 MM of Execution . Launched Medicare Supplement Plan D product . BV per diluted share (excl. AOCI)1 of $20.00 up from $19.76 at 3/31 . Operating ROE1, excluding significant items, of 10.9% 1 A non-GAAP measure. See the Appendix for a reconciliation to the corresponding GAAP measure. CNO Financial Group | Investor Overview 21
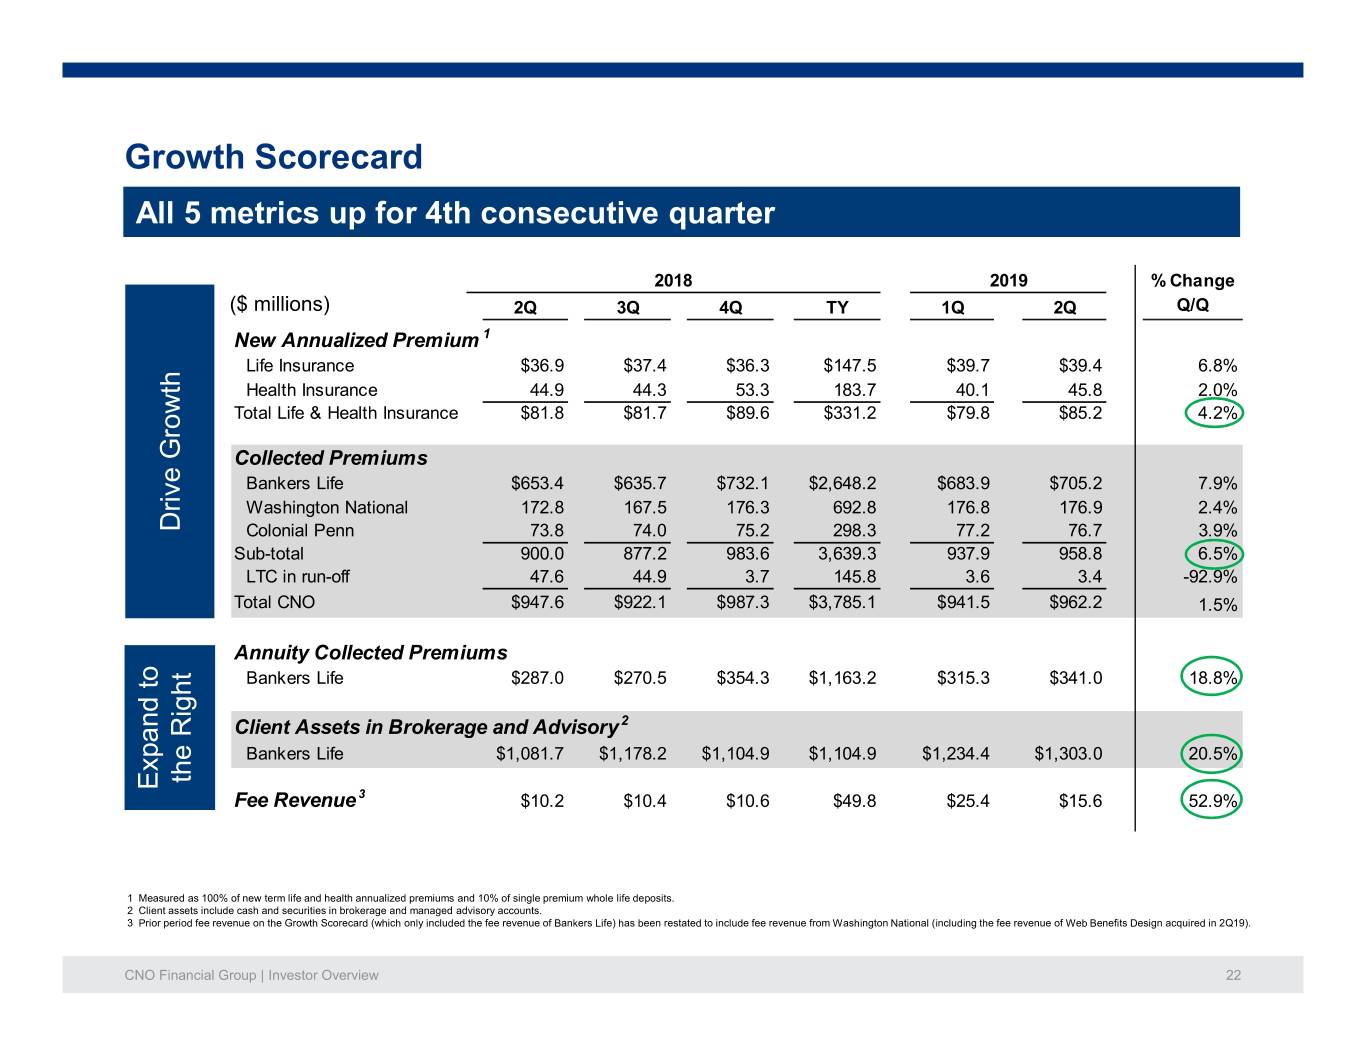
Growth Scorecard All 5 metrics up for 4th consecutive quarter 2018 2019 % Change ($ millions) 2Q 3Q 4Q TY 1Q 2Q Q/Q New Annualized Premium 1 Life Insurance $36.9 $37.4 $36.3 $147.5 $39.7 $39.4 6.8% Health Insurance 44.9 44.3 53.3 183.7 40.1 45.8 2.0% Total Life & Health Insurance $81.8 $81.7 $89.6 $331.2 $79.8 $85.2 4.2% Collected Premiums Bankers Life $653.4 $635.7 $732.1 $2,648.2 $683.9 $705.2 7.9% Washington National 172.8 167.5 176.3 692.8 176.8 176.9 2.4% Drive Growth Drive Colonial Penn 73.8 74.0 75.2 298.3 77.2 76.7 3.9% Sub-total 900.0 877.2 983.6 3,639.3 937.9 958.8 6.5% LTC in run-off 47.6 44.9 3.7 145.8 3.6 3.4 -92.9% Total CNO $947.6 $922.1 $987.3 $3,785.1 $941.5 $962.2 1.5% Annuity Collected Premiums Bankers Life $287.0 $270.5 $354.3 $1,163.2 $315.3 $341.0 18.8% Client Assets in Brokerage and Advisory 2 Bankers Life $1,081.7 $1,178.2 $1,104.9 $1,104.9 $1,234.4 $1,303.0 20.5% the Right the Expand to Expand Fee Revenue 3 $10.2 $10.4 $10.6 $49.8 $25.4 $15.6 52.9% 1 Measured as 100% of new term life and health annualized premiums and 10% of single premium whole life deposits. 2 Client assets include cash and securities in brokerage and managed advisory accounts. 3 Prior period fee revenue on the Growth Scorecard (which only included the fee revenue of Bankers Life) has been restated to include fee revenue from Washington National (including the fee revenue of Web Benefits Design acquired in 2Q19). CNO Financial Group | Investor Overview 22

Segment Update Solid execution fueling continued growth momentum Key Initiatives Second Quarter Highlights . First year collected premiums up 15%; total collected premiums up 8% Reinvigorate . Health NAP up 6%; Life NAP down 4% growth . Launched Medicare Supplement Plan D . Med Advantage issued policies up 13%; third party fee revenue up 25% . Total client assets up 20% at BD/RIA to $1.3 billion Expand . FA count up 17%; 14% of agent force dually licensed to the right . Annuity collected premiums up 19%; average collected premium per policy up 5% Reshape the agent . Quarterly average producing agent count up 3% force and optimize . Continued positive impact from agent force initiatives productivity . Ongoing agent productivity improvement CNO Financial Group | Investor Overview 23

Segment Update Worksite strength offset by Individual market challenges Key Initiatives Second Quarter Highlights Maintain growth . Life NAP up 29%; Life collected premiums up 11% . Worksite producing agent count up 28% momentum . Plan underway to reinvigorate growth in Individual business Expand . Continued expansion into six underpenetrated territories geographically . $1.3 million in NAP from geographic expansion Enhance product . Life products now 12% of overall NAP portfolio . Short-term care pilot / Hospital Indemnity NAP progressing Advance worksite . Worksite NAP up 15% . Worksite comprised roughly 50% of NAP capabilities . WBD integration on plan CNO Financial Group | Investor Overview 24

Segment Update Cost effective marketing driving sales growth Key Initiatives Second Quarter Highlights Continue . NAP up 16% . Total collected premiums up 4% sales growth . First year collected premiums up 16% Improve sales productivity and . Realizing operating leverage in sales acquisition costs . Technology enhancements driving further productivity gains expand web/digital . Launched web chat capabilities capabilities Enhance product . Living Insurance™ currently available in 21 states portfolio CNO Financial Group | Investor Overview 25

Financial Highlights Adj. operating income per share up 4%; operating ROE up 150 bps Second Quarter 2019 Financial Results ($ millions, except where noted) . Net operating income per diluted share1 of $0.48, up 4.3% on an adjusted basis 2Q18 2Q19 . Adjusted to remove the earnings from the $0.49 $0.48 LTC business that was ceded in 3Q18, 2Q18 $0.03 $0.03 net operating income per diluted share was Earnings on long- $0.46 term care block $0.46 ceded in 3Q18 . $39 million in net non-operating losses; $443 Net Operating Income million increase in accumulated other Per Share¹ comprehensive income . Operating ROE1, excluding significant items, of 10.9% Net Operating . Holding company cash and investments of $264 $81.9 $76.4 million Income1 Net Operating Income . Estimated consolidated RBC ratio of 409% $76.4 Adj. for Ceded LTC $77.7 Business . Statutory operating income of $79 million; Statutory capital and surplus of $1.7 billion Weighted Average Shares Outstanding 168.0 159.7 (in millions) 1 A non-GAAP measure. See the Appendix for a reconciliation to the corresponding GAAP measure. CNO Financial Group | Investor Overview 26
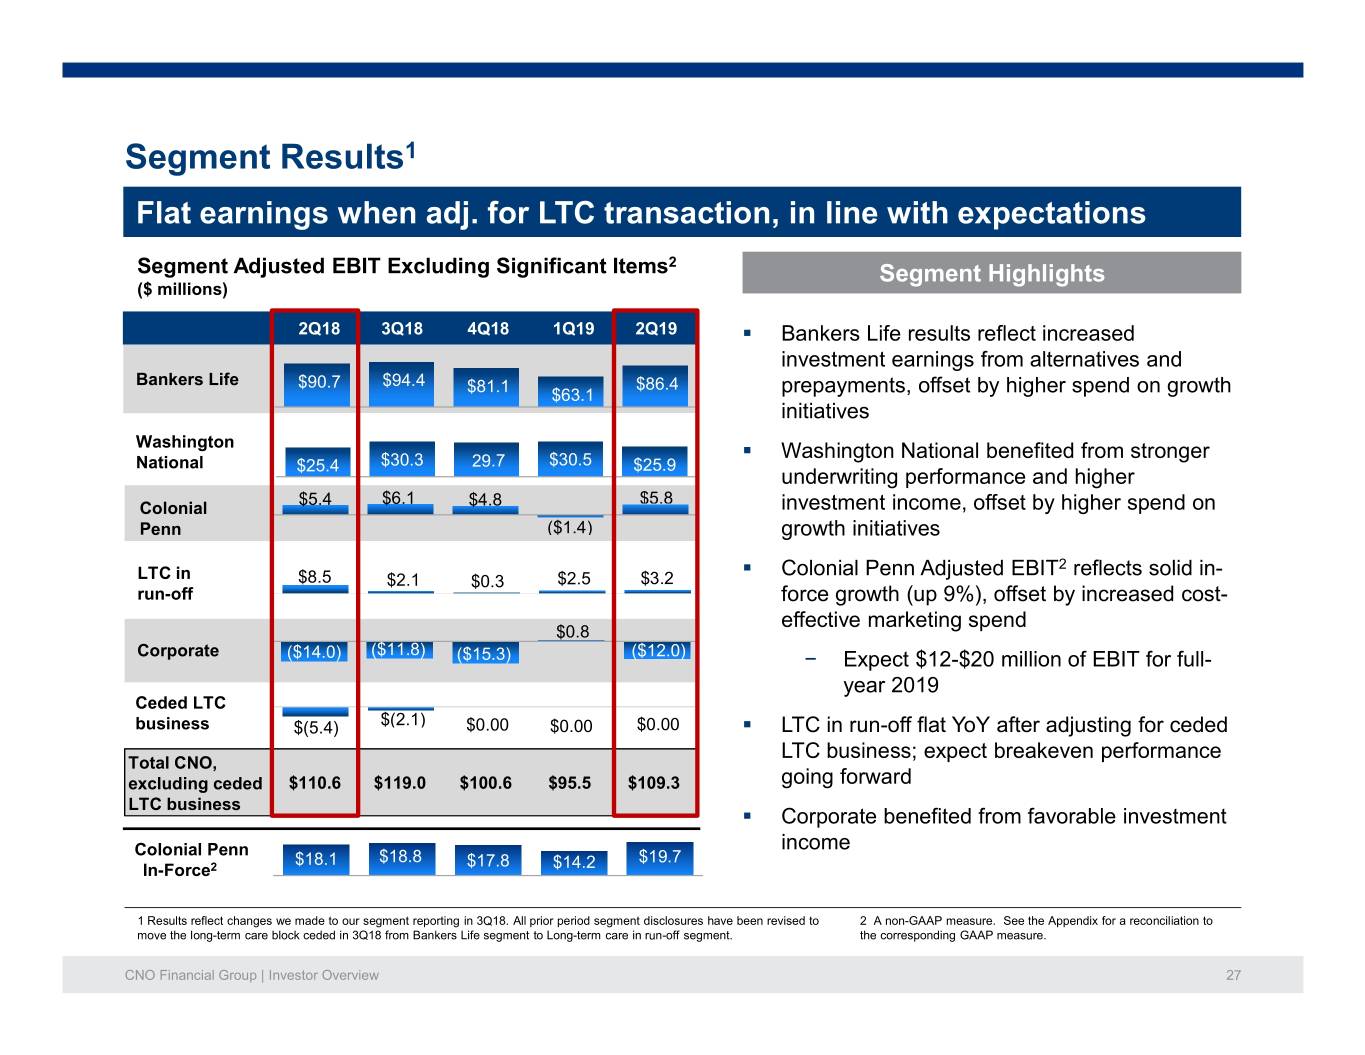
Segment Results1 Flat earnings when adj. for LTC transaction, in line with expectations Segment Adjusted EBIT Excluding Significant Items2 Segment Highlights ($ millions) 2Q18 3Q18 4Q18 1Q19 2Q19 . Bankers Life results reflect increased investment earnings from alternatives and Bankers Life $90.7 $94.4 $81.1 $86.4 $63.1 prepayments, offset by higher spend on growth initiatives Washington . Washington National benefited from stronger National $25.4 $30.3 29.7 $30.5 $25.9 underwriting performance and higher $5.4 $6.1 $5.8 Colonial $4.8 investment income, offset by higher spend on Penn ($1.4) growth initiatives . Colonial Penn Adjusted EBIT2 reflects solid in- LTC in $8.5 $2.1 $0.3 $2.5 $3.2 run-off force growth (up 9%), offset by increased cost- effective marketing spend $0.8 Corporate ($14.0) ($11.8) ($15.3) ($12.0) − Expect $12-$20 million of EBIT for full- year 2019 Ceded LTC business $(5.4) $(2.1) $0.00 $0.00 $0.00 . LTC in run-off flat YoY after adjusting for ceded LTC business; expect breakeven performance Total CNO, excluding ceded $110.6 $119.0 $100.6 $95.5 $109.3 going forward LTC business . Corporate benefited from favorable investment Colonial Penn income $18.1 $18.8 $17.8 $19.7 In-Force2 $14.2 1 Results reflect changes we made to our segment reporting in 3Q18. All prior period segment disclosures have been revised to 2 A non-GAAP measure. See the Appendix for a reconciliation to move the long-term care block ceded in 3Q18 from Bankers Life segment to Long-term care in run-off segment. the corresponding GAAP measure. CNO Financial Group | Investor Overview 27
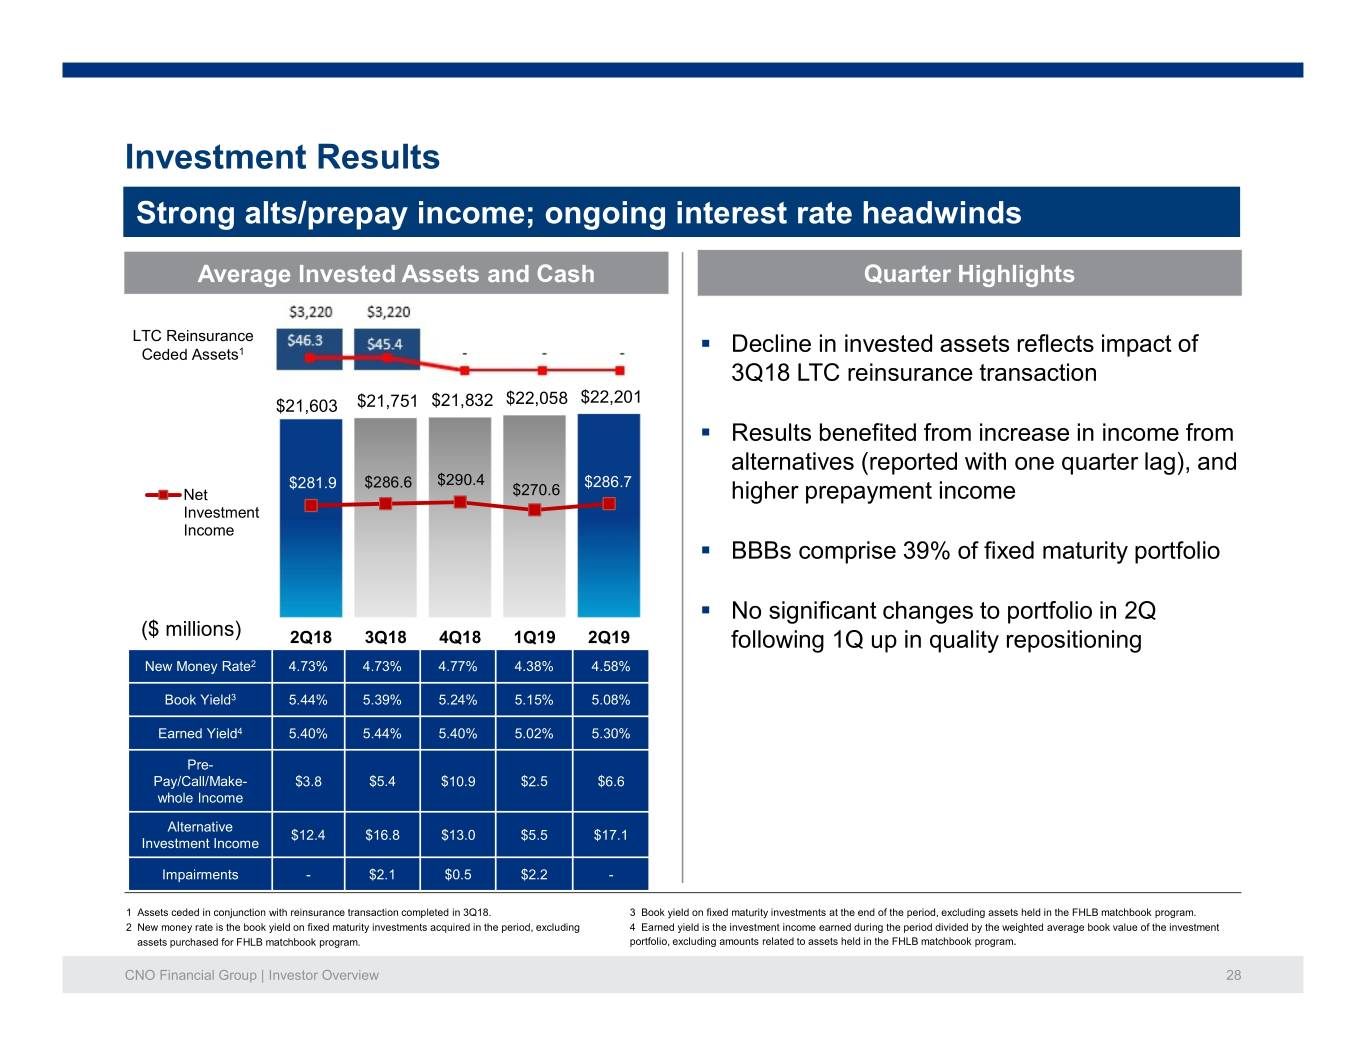
Investment Results Strong alts/prepay income; ongoing interest rate headwinds Average Invested Assets and Cash Quarter Highlights LTC Reinsurance Ceded Assets1 . Decline in invested assets reflects impact of 3Q18 LTC reinsurance transaction $22,201 $21,603 $21,751 $21,832 $22,058 . Results benefited from increase in income from alternatives (reported with one quarter lag), and $281.9 $286.6 $290.4 $286.7 Net $270.6 higher prepayment income Investment Income . BBBs comprise 39% of fixed maturity portfolio . No significant changes to portfolio in 2Q ($ millions) 2Q18 3Q18 4Q18 1Q19 2Q19 following 1Q up in quality repositioning New Money Rate2 4.73% 4.73% 4.77% 4.38% 4.58% Book Yield3 5.44% 5.39% 5.24% 5.15% 5.08% Earned Yield4 5.40% 5.44% 5.40% 5.02% 5.30% Pre- Pay/Call/Make- $3.8 $5.4 $10.9 $2.5 $6.6 whole Income Alternative $12.4 $16.8 $13.0 $5.5 $17.1 Investment Income Impairments - $2.1 $0.5 $2.2 - 1 Assets ceded in conjunction with reinsurance transaction completed in 3Q18. 3 Book yield on fixed maturity investments at the end of the period, excluding assets held in the FHLB matchbook program. 2 New money rate is the book yield on fixed maturity investments acquired in the period, excluding 4 Earned yield is the investment income earned during the period divided by the weighted average book value of the investment assets purchased for FHLB matchbook program. portfolio, excluding amounts related to assets held in the FHLB matchbook program. CNO Financial Group | Investor Overview 28

Committed to Long-term Shareholder Value Creation Continued progress on strategic initiatives Leverage diverse Enhance Effectively Extend depth distribution Expand to customer deploy excess and breadth of channels and the right experience capital product offerings unique product combination Growth in sales, earnings, FCF, and ROE CNO Financial Group | Investor Overview 29

Appendix 1: Quarter in Review Building on Strong Track Record of Execution . Web Benefits Design Transaction Slide 31 . Bankers Life Retained LTC Insurance Slide 32 Strong Operational Performance . Broker-Dealer/Registered Investment Advisor Slide 33 . Agent Counts Slide 34 CNO Financial Group | Investor Overview 30

Web Benefits Design (“WBD”)Transaction Strategic acquisition to accelerate worksite growth Strategic acquisition to accelerate worksite growth 2Q19 Transaction Summary Strategic Rationale . Adds leading online benefits administration with . Accelerates Worksite technology capabilities best-in-class proprietary technology platform for . High margin business employer benefits programs . Significant source of fee income . Invests in key growth area within CNO . Boosts ROE . $66.7 million purchase price paid with HoldCo cash; represents less than one quarter of FCF . Enhances Washington National’s technology capabilities with proven tested platform in area . Nominally accretive to earnings by 2020 before outside core IT capabilities inclusion of revenue synergies . Expands WN’s market reach; opens door to tech- . Allows use of non-life NOLs savvy clients . Creates significant cross-sell opportunities . Limited execution risk as WBD’s management team remains . Consistent with acquisition playbook CNO Financial Group | Investor Overview 31
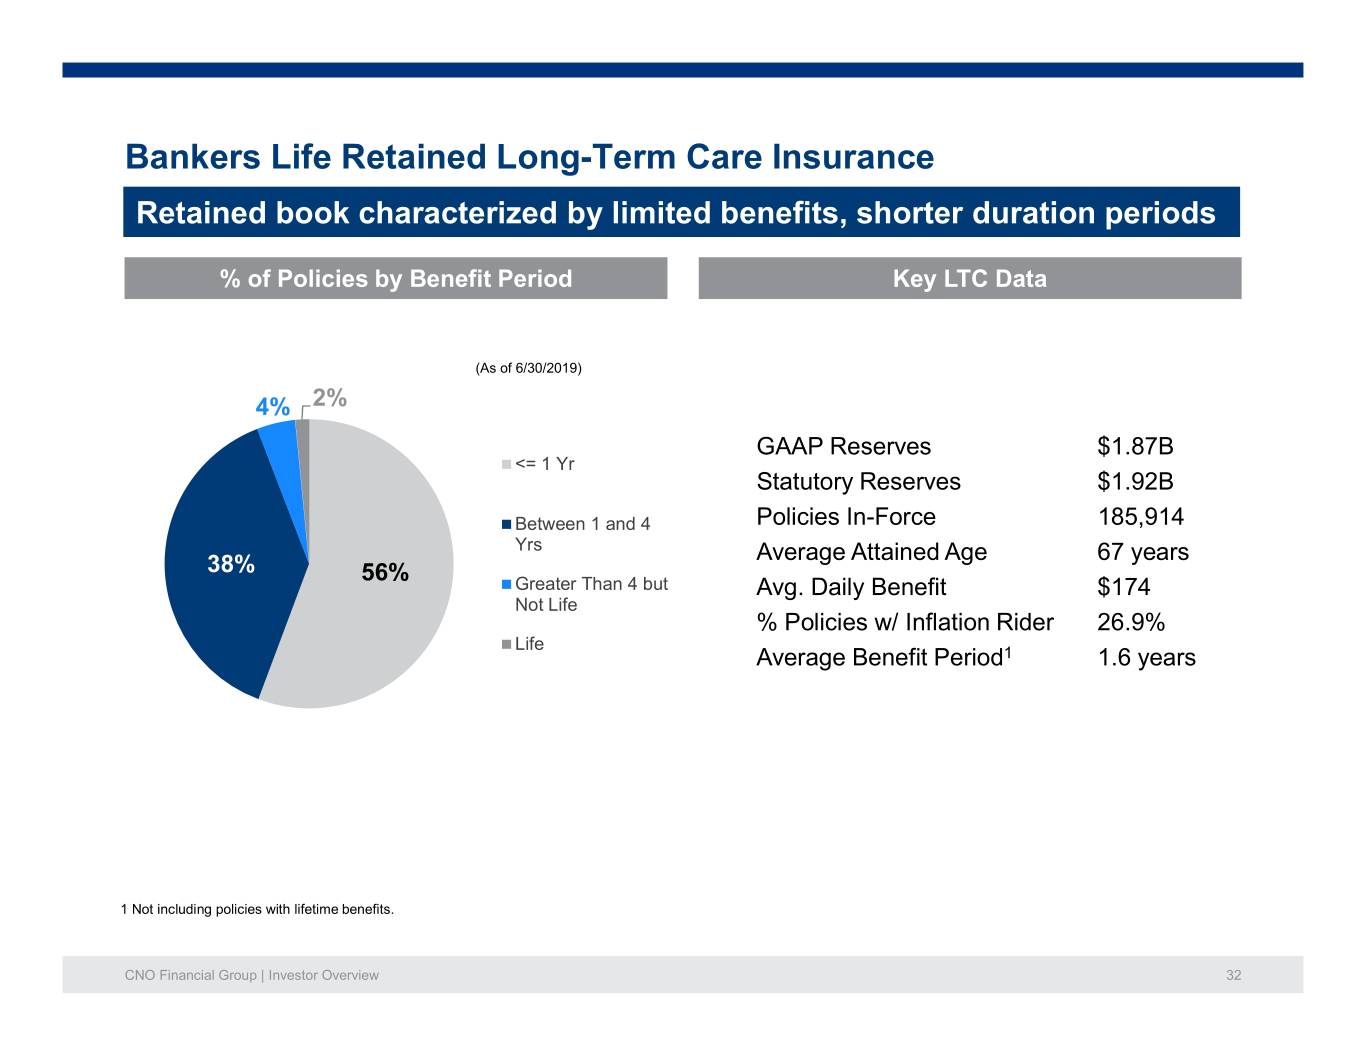
Bankers Life Retained Long-Term Care Insurance Retained book characterized by limited benefits, shorter duration periods % of Policies by Benefit Period Key LTC Data (As of 6/30/2019) 4% 2% GAAP Reserves $1.87B <= 1 Yr Statutory Reserves $1.92B Between 1 and 4 Policies In-Force 185,914 Yrs Average Attained Age 67 years 38% 56% Greater Than 4 but Avg. Daily Benefit $174 Not Life % Policies w/ Inflation Rider 26.9% Life Average Benefit Period1 1.6 years 1 Not including policies with lifetime benefits. CNO Financial Group | Investor Overview 32

Broker-Dealer/Registered Investment Advisor Account value tops $1.3 billion; up 20% YoY ($ millions) 2018 2019 2Q 3Q 4Q 1Q 2Q Net New Client Assets in Brokerage$ 3.1 $ 26.3 $ (1.1) $ (3.0) $ 5.1 Brokerage and Advisory1 Advisory 49.1 44.2 13.2 35.7 33.2 Total$ 52.2 $ 70.5 $ 12.1 $ 32.7 $ 38.3 Client Assets in Brokerage and Brokerage$ 813.6 $ 860.4 $ 794.1 $ 861.6 $ 886.0 Advisory1 at end of period Advisory 268.1 317.8 310.8 372.8 417.0 Total$ 1,081.7 $ 1,178.2 $ 1,104.9 $ 1,234.4 $ 1,303.0 1 Client assets include cash and securities in brokerage and managed advisory accounts. Net new client assets includes total inflows of cash and securities into brokerage and managed advisory accounts less outflows. Inflows include interest and dividends and exclude changes due to market fluctuations. Bankers Life is the marketing brand of various affiliated companies of CNO Financial Group including, Bankers Life and Casualty Company, Bankers Life Securities, Inc., and Bankers Life Advisory Services, Inc. Non-affiliated insurance products are offered through Bankers Life General Agency, Inc. (dba BL General Insurance Agency, Inc., AK, AL, CA, NV, PA). Agents who are financial advisors are registered with Bankers Life Securities, Inc. Securities and variable annuity products and services are offered by Bankers Life Securities, Inc. Member FINRA/SIPC, (dba BL Securities, Inc., AL, GA, IA, IL, MI, NV, PA). Advisory products and services are offered by Bankers Life Advisory Services, Inc. SEC Registered Investment Adviser (dba BL Advisory Services, Inc., AL, GA, IA, MT, NV, PA). Home Office: 111 East Wacker Drive, Suite 1900, Chicago, IL 60601 CNO Financial Group | Investor Overview 33

Agent Counts Bankers Life producing agent count up for fourth consecutive quarter 2018 2019 % Change Bankers Life 2Q 3Q 4Q 1Q 2Q Q/Q Total Quarterly Average Producing Agents1,3 4,167 4,168 4,177 4,125 4,294 3.0% Quarterly Average Financial Advisors2,3 499 534 560 583 595 19.2% Washington National Total Quarterly Average Producing Agents1,3 676 710 730 682 726 7.4% 1 Producing Agents are agents that have submitted at least one policy in the month. 2 Financial advisors are agents who are licensed to sell certain securities brokerage products and services. 3 Quarterly average agent and advisor counts represent the average of the last 3 months. CNO Financial Group | Investor Overview 34

Appendix 2: Financial Exhibits • Tax Asset Summary Slide 36 • Non-GAAP Financial Measures Slides 37-52 CNO Financial Group | Investor Overview 35

Tax Asset Summary ($ millions) Loss Carryforwards Details $632 . Total estimated economic value of NOLs of Life $322 million @ 10% discount rate (~$2.04 on $153 per share basis) . Life NOLs are expected to offset 80% of life taxable income until fully utilized. Non-life NOLs are expected to offset 100% of non-life Non- taxable income and 35% of the remaining life Life taxable income not offset by life NOLs $479 through 2023. Non-Life $190 Loss Carryforwards (1) Valuation Allowance 1 Excludes $13 million related to state operating loss carryforwards. CNO Financial Group | Investor Overview 36

4Q18 Significant Items The table below summarizes the financial impact of significant items on our 4Q18 net operating income. Management believes that identifying the impact of these items enhances the understanding of our operating results (dollars in millions). Three months ended December 31, 2018 Excluding significant Actual results Significant items items Net Operating Income: Bankers Life $ 78.0 $ 3.1 (1) $ 81.1 Washington National 31.9 (2.2) (1) 29.7 Colonial Penn 4.8 - 4.8 Long-term care in run-off 0.3 - 0.3 Adjusted EBIT from business segments 115.0 0.9 115.9 Corporate Operations, excluding corporate interest expense (29.7) 14.4 (2) (15.3) Adjusted EBIT 85.3 15.3 100.6 Corporate interest expense (12.1) - (12.1) Operating earnings before tax 73.2 15.3 88.5 Tax expense on operating income 13.4 0.2 13.6 Net operating income * $ 59.8 $ 15.1 $ 74.9 Net operating income per diluted share* $ 0.36 $ 0.09 $ 0.45 (1) Adjustments arising from our comprehensive annual actuarial review of assumptions including $3.1 million of unfavorable impacts in the Bankers Life segment and $2.2 million of favorable impacts in the Washington National segment. (2) $14.4 million unfavorable impact of current market conditions on the value of investments backing our Company-owned life insurance (COLI) used as a vehicle to fund Bankers Life's agent deferred compensation plan. Changes in the value of COLI investments are not subject to income taxes. * A non-GAAP measure. See pages 38 and 41 for a reconciliation to the corresponding GAAP measure. CNO Financial Group | Investor Overview 37

Quarterly Earnings ($ millions) 2Q18 3Q18 4Q18 1Q19 2Q19 Bankers Life$ 90.7 $ 94.4 $ 78.0 $ 63.1 $ 86.4 Washington National 25.4 30.3 31.9 30.5 25.9 Colonial Penn 5.4 6.1 4.8 (1.4) 5.8 Long-term care in run-off 8.5 2.1 0.3 2.5 3.2 Adjusted EBIT from business segments 130.0 132.9 115.0 94.7 121.3 Corporate operations, excluding interest expense (14.0) (11.8) (29.7) 0.8 (12.0) Adjusted EBIT* 116.0 121.1 85.3 95.5 109.3 Corporate interest expense (11.9) (12.1) (12.1) (12.1) (12.6) Operating earnings before taxes 104.1 109.0 73.2 83.4 96.7 Tax expense on period income 22.2 21.5 13.4 17.6 20.3 Net operating income 81.9 87.5 59.8 65.8 76.4 Net realized investment gains (losses) from sales and impairments, net of related amortization 10.9 37.0 (10.5) (0.7) (1.7) Net change in market value of investments recognized in earnings (0.3) (5.3) (27.5) 16.6 6.8 Fair value changes in embedded derivative liabilities, net of related amortization 8.3 22.9 (0.8) (29.6) (35.9) Fair value changes related to the agent deferred compensation plan 11.0 - 0.9 (5.3) (11.6) Loss on extinguishment of debt - - - - (7.3) Loss related to reinsurance transaction - (704.2) - - - Other (4.2) 0.8 1.8 1.2 0.7 Non-operating income (loss) before taxes 25.7 (648.8) (36.1) (17.8) (49.0) Income tax expense (benefit): On non-operating income (loss) 5.4 (136.3) (7.6) (3.8) (10.2) Valuation allowance for deferred tax assets and other tax items - 104.8 3.0 - - Net non-operating income (loss) 20.3 (617.3) (31.5) (14.0) (38.8) Net income (loss) $ 102.2 $ (529.8) $ 28.3 $ 51.8 $ 37.6 *Management believes that an analysis of earnings before net realized investment gains (losses) from sales and impairments, net change in market value of investments recognized in earnings, fair value changes in embedded derivative liabilities, fair value changes related to the agent deferred compensation plan, loss on extinguishment of debt, loss related to reinsurance transaction, other non-operating items, corporate interest expense and taxes (“Adjusted EBIT,” a non-GAAP financial measure) provides a clearer comparison of the operating results of the company quarter-over-quarter because it excludes: (1) net realized investment gains (losses) from sales and impairments; (2) net change in market value of investments recognized in earnings; (3) fair value changes due to fluctuations in the interest rates used to discount embedded derivative liabilities related to our fixed index annuities that are unrelated to the company’s underlying fundamentals; (4) loss on extinguishment of debt; (5) fair value changes related to the agent deferred compensation plan; (6) loss related to reinsurance transaction; (7) charges in the valuation allowance for deferred tax assets and other tax items; and (8) other non-operating items consisting primarily of earnings attributable to variable interest entities. The table above provides a reconciliation of Adjusted EBIT to net income. CNO Financial Group | Investor Overview 38

Colonial Penn Segment Adjusted EBIT Summarized by In-Force and New Business An analysis of Adjusted EBIT for Colonial Penn, separated between in-force and new business, provides increased clarity for this segment as the vast majority of the costs to generate new business in this segment are not deferrable and Adjusted EBIT will fluctuate based on management's decisions on how much marketing costs to incur in each period. Adjusted EBIT from new business includes pre-tax revenues and expenses associated with new sales of our insurance products during the first year after the sale is completed. Adjusted EBIT from in-force business includes all pre-tax revenues and expenses associated with sales of insurance products that were completed more than one year before the end of the reporting period. The allocation of certain revenues and expenses between new and in-force business is based on estimates, which we believe are reasonable (dollars in millions): Adjusted EBIT from Inforce Business Adjusted EBIT from New Business Adjusted EBIT from Inforce and New Business 2Q18 3Q18 4Q18 1Q19 2Q19 2Q18 3Q18 4Q18 1Q19 2Q19 2Q18 3Q18 4Q18 1Q19 2Q19 Revenues Insurance policy income$ 62.9 $ 63.3 $ 62.9 $ 64.0 $ 64.3 $ 11.6 $ 11.8 $ 12.0 $ 12.7 $ 13.3 $ 74.5 $ 75.1 $ 74.9 $ 76.7 $ 77.6 Net investment income 11.3 11.1 11.2 10.7 10.8 - - - - - 11.3 11.1 11.2 10.7 10.8 Fee revenue and other income 0.4 0.5 0.4 0.5 0.4 - - - - - 0.4 0.5 0.4 0.5 0.4 Total revenues 74.6 74.9 74.5 75.2 75.5 11.6 11.8 12.0 12.7 13.3 86.2 86.7 86.5 87.9 88.8 Benefits and expenses Insurance policy benefits 43.5 42.6 42.8 48.2 44.1 7.1 7.2 7.3 8.0 8.4 50.6 49.8 50.1 56.2 52.5 Interest expense 0.4 0.3 0.4 0.4 0.4 - - - - - 0.4 0.3 0.4 0.4 0.4 Amortization 4.0 4.0 4.8 4.1 3.2 0.1 0.2 0.1 0.4 0.4 4.1 4.2 4.9 4.5 3.6 Other operating costs and expenses 8.6 9.2 8.7 8.3 8.1 17.1 17.1 17.6 19.9 18.4 25.7 26.3 26.3 28.2 26.5 Total benefits and expenses 56.5 56.1 56.7 61.0 55.8 24.3 24.5 25.0 28.3 27.2 80.8 80.6 81.7 89.3 83.0 Adjusted EBIT from Inforce Business$ 18.1 $ 18.8 $ 17.8 $ 14.2 $ 19.7 $ (12.7) $ (12.7) $ (13.0) $ (15.6) $ (13.9) $ 5.4 $ 6.1 $ 4.8 $ (1.4) $ 5.8 CNO Financial Group | Investor Overview 39
Information Related to Certain Non-GAAP Financial Measures The following provides additional information regarding certain non-GAAP measures used in this presentation. A non-GAAP measure is a numerical measure of a company’s performance, financial position, or cash flows that excludes or includes amounts that are normally excluded or included in the most directly comparable measure calculated and presented in accordance with GAAP. While management believes these measures are useful to enhance understanding and comparability of our financial results, these non-GAAP measures should not be considered as substitutes for the most directly comparable GAAP measures. Additional information concerning non-GAAP measures is included in our periodic filings with the Securities and Exchange Commission that are available in the “Investors – SEC Filings” section of CNO’s website, www.CNOinc.com. Operating earnings measures Management believes that an analysis of net income applicable to common stock before net realized investment gains or losses from sales and impairments, net change in market value of investments recognized in earnings, fair value changes due to fluctuations in the interest rates used to discount embedded derivative liabilities related to our fixed index annuities, fair value changes related to the agent deferred compensation plan, loss on extinguishment of debt, loss related to reinsurance transaction, changes in the valuation allowance for deferred tax assets and other tax items and other non-operating items consisting primarily of earnings attributable to variable interest entities (“net operating income,” a non-GAAP financial measure) is important to evaluate the financial performance of the Company and is a key measure commonly used in the life insurance industry. Management uses this measure to evaluate performance because the items excluded from net operating income can be affected by events that are unrelated to the Company’s underlying fundamentals. CNO Financial Group | Investor Overview 40
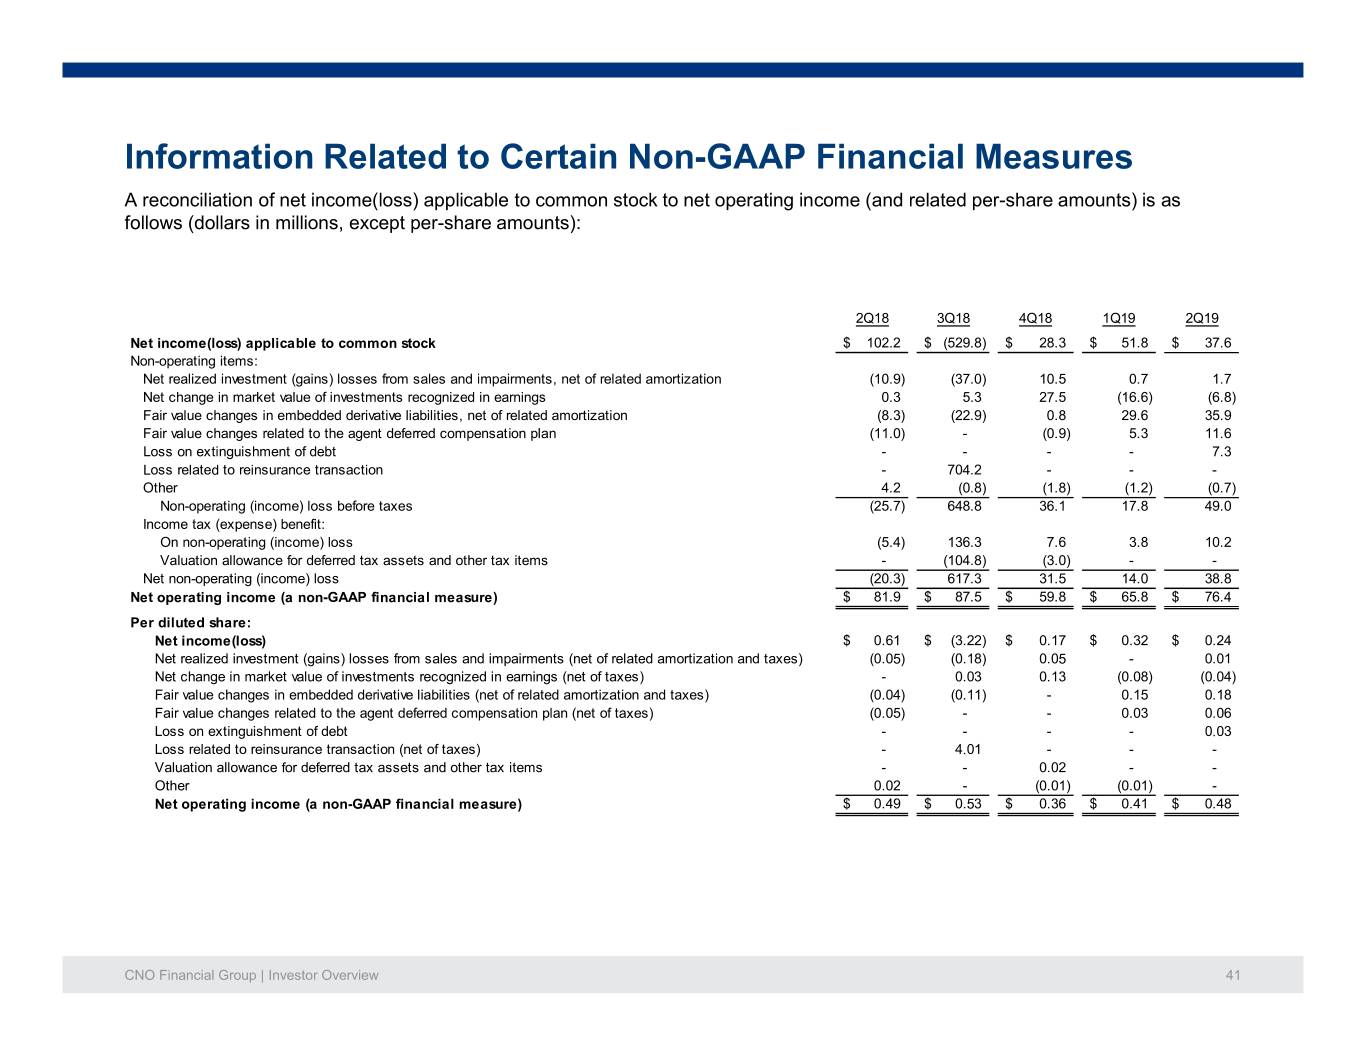
Information Related to Certain Non-GAAP Financial Measures A reconciliation of net income(loss) applicable to common stock to net operating income (and related per-share amounts) is as follows (dollars in millions, except per-share amounts): 2Q18 3Q18 4Q18 1Q19 2Q19 Net income(loss) applicable to common stock $ 102.2 $ (529.8) $ 28.3 $ 51.8 $ 37.6 Non-operating items: Net realized investment (gains) losses from sales and impairments, net of related amortization (10.9) (37.0) 10.5 0.7 1.7 Net change in market value of investments recognized in earnings 0.3 5.3 27.5 (16.6) (6.8) Fair value changes in embedded derivative liabilities, net of related amortization (8.3) (22.9) 0.8 29.6 35.9 Fair value changes related to the agent deferred compensation plan (11.0) - (0.9) 5.3 11.6 Loss on extinguishment of debt - - - - 7.3 Loss related to reinsurance transaction - 704.2 - - - Other 4.2 (0.8) (1.8) (1.2) (0.7) Non-operating (income) loss before taxes (25.7) 648.8 36.1 17.8 49.0 Income tax (expense) benefit: On non-operating (income) loss (5.4) 136.3 7.6 3.8 10.2 Valuation allowance for deferred tax assets and other tax items - (104.8) (3.0) - - Net non-operating (income) loss (20.3) 617.3 31.5 14.0 38.8 Net operating income (a non-GAAP financial measure) $ 81.9 $ 87.5 $ 59.8 $ 65.8 $ 76.4 Per diluted share: Net income(loss) $ 0.61 $ (3.22) $ 0.17 $ 0.32 $ 0.24 Net realized investment (gains) losses from sales and impairments (net of related amortization and taxes) (0.05) (0.18) 0.05 - 0.01 Net change in market value of investments recognized in earnings (net of taxes) - 0.03 0.13 (0.08) (0.04) Fair value changes in embedded derivative liabilities (net of related amortization and taxes) (0.04) (0.11) - 0.15 0.18 Fair value changes related to the agent deferred compensation plan (net of taxes) (0.05) - - 0.03 0.06 Loss on extinguishment of debt - - - - 0.03 Loss related to reinsurance transaction (net of taxes) - 4.01 - - - Valuation allowance for deferred tax assets and other tax items - - 0.02 - - Other 0.02 - (0.01) (0.01) - Net operating income (a non-GAAP financial measure) $ 0.49 $ 0.53 $ 0.36 $ 0.41 $ 0.48 CNO Financial Group | Investor Overview 41

Information Related to Certain Non-GAAP Financial Measures A reconciliation of operating income and shares used to calculate basic and diluted operating earnings per share is as follows (dollars in millions, except per-share amounts, and shares in thousands): 2Q18 3Q18 (a) 4Q18 1Q19 2Q19 Operating income$ 81.9 $ 87.5 $ 59.8 $ 65.8 $ 76.4 Weighted average shares outstanding for basic earnings per share 166,098 164,551 164,118 160,948 158,816 Effect of dilutive securities on weighted average shares: Stock options, restricted stock and performance units 1,880 - 1,772 1,241 919 Weighted average shares outstanding for diluted earnings per share 167,978 164,551 165,890 162,189 159,735 Net operating income per diluted share$ 0.49 $ 0.53 $ 0.36 $ 0.41 $ 0.48 (a) Equivalent common shares of 2,146 were not included in the diluted weighted average shares outstanding due to the net loss recognized in 3Q18. CNO Financial Group | Investor Overview 42

Information Related to Certain Non-GAAP Financial Measures Book value per diluted share Book value per diluted share reflects the potential dilution that could occur if outstanding stock options were exercised, restricted stock and performance units were vested and convertible securities were converted. The dilution from options, restricted shares and performance units is calculated using the treasury stock method. Under this method, we assume the proceeds from the exercise of the options (or the unrecognized compensation expense with respect to restricted stock and performance units) will be used to purchase shares of our common stock at the closing market price on the last day of the period. In addition, the calculation of this non-GAAP measure differs from the corresponding GAAP measure because accumulated other comprehensive income (loss) has been excluded from the value of capital used to determine this measure. Management believes this non-GAAP measure is useful because it removes the volatility that arises from changes in the unrealized appreciation (depreciation) of our investments. Management believes this adjustment to the December 31, 2017 non-GAAP measure is useful because it removes the tax effects stranded in accumulated other comprehensive income as a result of accounting rules which require the effects of the Tax Reform Act on deferred tax balances to be recorded in earnings, even if the balance was originally recorded in accumulated other comprehensive income. A reconciliation from book value per share to book value per diluted share, excluding accumulated other comprehensive income (loss) is as follows (dollars in millions, except per share amounts): 2Q18 3Q18 4Q18 1Q19 2Q19 Total shareholders' equity$ 4,454.9 $ 3,619.9 $ 3,370.9 $ 3,837.9 $ 4,252.2 Shares outstanding for the period 164,433,085 164,634,365 162,201,692 159,955,172 156,768,002 Book value per share$ 27.09 $ 21.99 $ 20.78 $ 23.99 $ 27.12 Total shareholders' equity$ 4,454.9 $ 3,619.9 $ 3,370.9 $ 3,837.9 $ 4,252.2 Less accumulated other comprehensive income (700.2) (403.5) (177.7) (654.9) (1,098.2) Adjusted shareholders' equity excluding AOCI$ 3,754.7 $ 3,216.4 $ 3,193.2 $ 3,183.0 $ 3,154.0 Shares outstanding for the period 164,433,085 164,634,365 162,201,692 159,955,172 156,768,002 Dilutive common stock equivalents related to: Stock options, restricted stock and performance units 1,537,947 2,189,022 1,391,458 1,168,027 894,456 Diluted shares outstanding 165,971,032 166,823,387 163,593,150 161,123,199 157,662,458 Book value per diluted share (a non-GAAP financial measure)$ 22.62 $ 19.28 $ 19.52 $ 19.76 $ 20.00 CNO Financial Group | Investor Overview 43

Information Related to Certain Non-GAAP Financial Measures Operating return measures Management believes that an analysis of net income applicable to common stock before net realized investment gains or losses from sales and impairments, net change in market value of investments recognized in earnings, fair value changes due to fluctuations in the interest rates used to discount embedded derivative liabilities related to our fixed index annuities, fair value changes related to the agent deferred compensation plan, loss on extinguishment of debt, loss on reinsurance transaction, changes in the valuation allowance for deferred tax assets and other tax items, loss on extinguishment of debt and other non-operating items consisting primarily of earnings attributable to variable interest entities (“net operating income,” a non-GAAP financial measure) is important to evaluate the financial performance of the Company and is a key measure commonly used in the life insurance industry. Management uses this measure to evaluate performance because the items excluded from net operating income can be affected by events that are unrelated to the Company’s underlying fundamentals. Management also believes that an operating return, excluding significant items, is important as the impact of these items enhances the understanding of our operating results. This non-GAAP financial measure also differs from return on equity because accumulated other comprehensive income (loss) has been excluded from the value of equity used to determine this ratio. Management believes this non-GAAP financial measure is useful because it removes the volatility that arises from changes in accumulated other comprehensive income (loss). Such volatility is often caused by changes in the estimated fair value of our investment portfolio resulting from changes in general market interest rates rather than the business decisions made by management. In addition, our equity includes the value of significant net operating loss carryforwards (included in income tax assets). In accordance with GAAP, these assets are not discounted, and accordingly will not provide a return to shareholders (until after it is realized as a reduction to taxes that would otherwise be paid). Management believes that excluding this value from the equity component of this measure enhances the understanding of the effect these non-discounted assets have on operating returns and the comparability of these measures from period-to-period. Operating return measures are used in measuring the performance of our business units and are used as a basis for incentive compensation. CNO Financial Group | Investor Overview 44
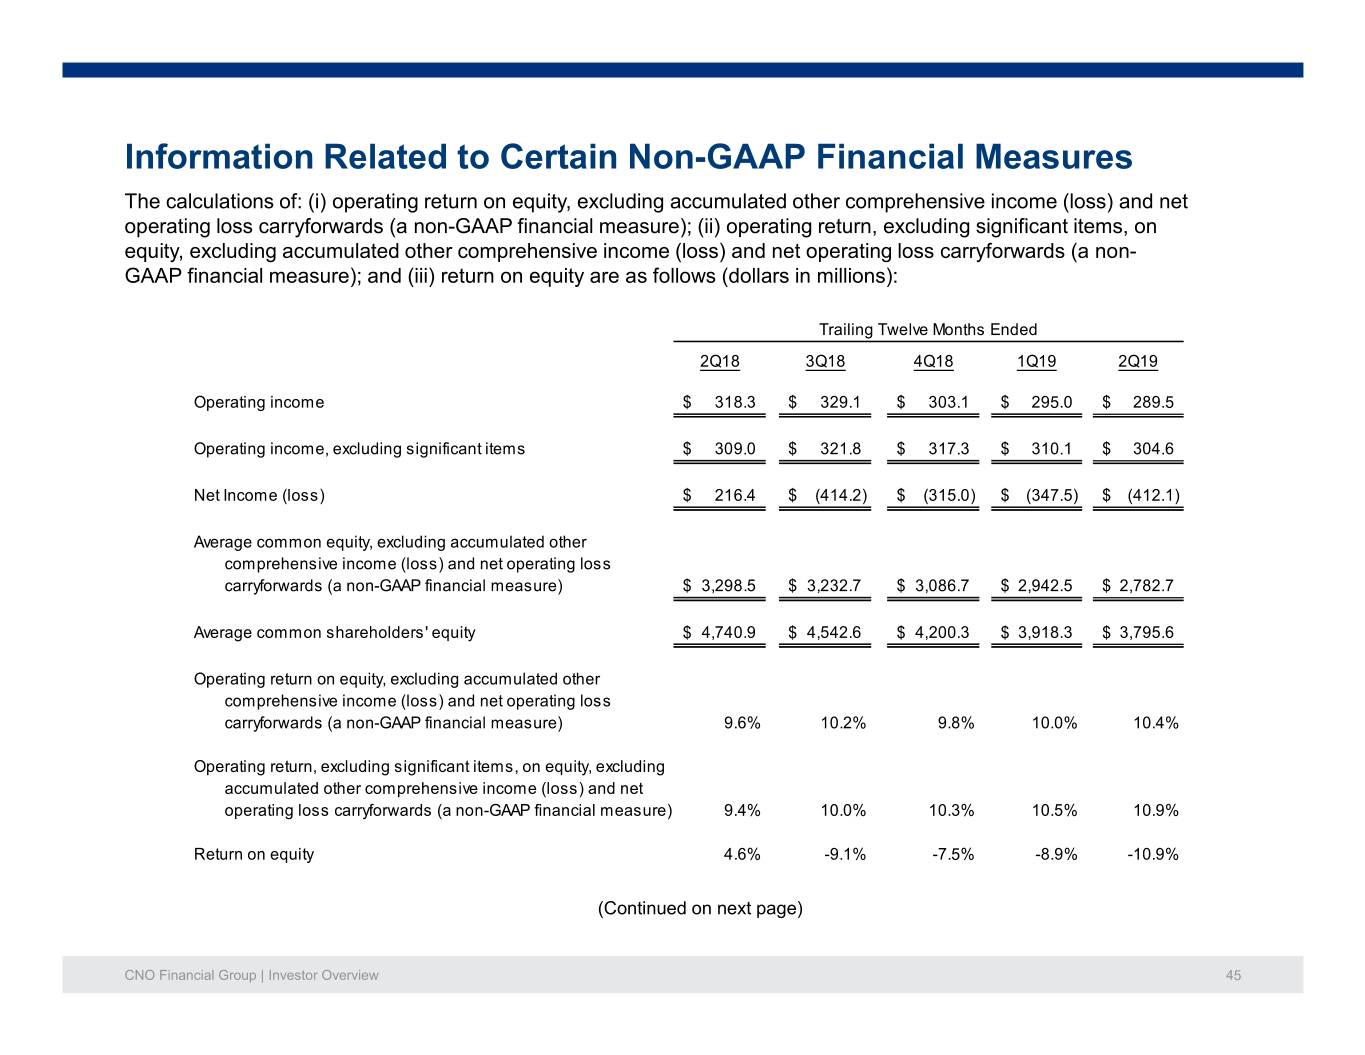
Information Related to Certain Non-GAAP Financial Measures The calculations of: (i) operating return on equity, excluding accumulated other comprehensive income (loss) and net operating loss carryforwards (a non-GAAP financial measure); (ii) operating return, excluding significant items, on equity, excluding accumulated other comprehensive income (loss) and net operating loss carryforwards (a non- GAAP financial measure); and (iii) return on equity are as follows (dollars in millions): Trailing Twelve Months Ended 2Q18 3Q18 4Q18 1Q19 2Q19 Operating income$ 318.3 $ 329.1 $ 303.1 $ 295.0 $ 289.5 Operating income, excluding significant items$ 309.0 $ 321.8 $ 317.3 $ 310.1 $ 304.6 Net Income (loss)$ 216.4 $ (414.2) $ (315.0) $ (347.5) $ (412.1) Average common equity, excluding accumulated other comprehensive income (loss) and net operating loss carryforwards (a non-GAAP financial measure)$ 3,298.5 $ 3,232.7 $ 3,086.7 $ 2,942.5 $ 2,782.7 Average common shareholders' equity$ 4,740.9 $ 4,542.6 $ 4,200.3 $ 3,918.3 $ 3,795.6 Operating return on equity, excluding accumulated other comprehensive income (loss) and net operating loss carryforwards (a non-GAAP financial measure) 9.6% 10.2% 9.8% 10.0% 10.4% Operating return, excluding significant items, on equity, excluding accumulated other comprehensive income (loss) and net operating loss carryforwards (a non-GAAP financial measure) 9.4% 10.0% 10.3% 10.5% 10.9% Return on equity 4.6% -9.1% -7.5% -8.9% -10.9% (Continued on next page) CNO Financial Group | Investor Overview 45

Information Related to Certain Non-GAAP Financial Measures The following summarizes: (i) operating earnings; (ii) significant items; (iii) operating earnings, excluding significant items; and (iv) net income(loss) (dollars in millions): Net Operating Net Operating Income, income, excluding Net excluding significant income (loss) - Net Operating Significant significant items - trailing Net trailing income items (a) items four quarters income (loss) four quarters 3Q17$ 76.7 $ (2.0) $ 74.7 $ 269.7 $ 100.8 $ 480.7 4Q17 85.8 (6.4) 79.4 288.3 (70.9) 175.6 1Q18 73.9 (0.9) 73.0 299.6 84.3 197.6 2Q18 81.9 - 81.9 309.0 102.2 216.4 3Q18 87.5 - 87.5 321.8 (529.8) (414.2) 4Q18 59.8 15.1 74.9 317.3 28.3 (315.0) 1Q19 65.8 - 65.8 310.1 51.8 (347.5) 2Q19 76.4 - 76.4 304.6 37.6 (412.1) (a) The significant items have been discussed in prior press releases. (Continued on next page) CNO Financial Group | Investor Overview 46
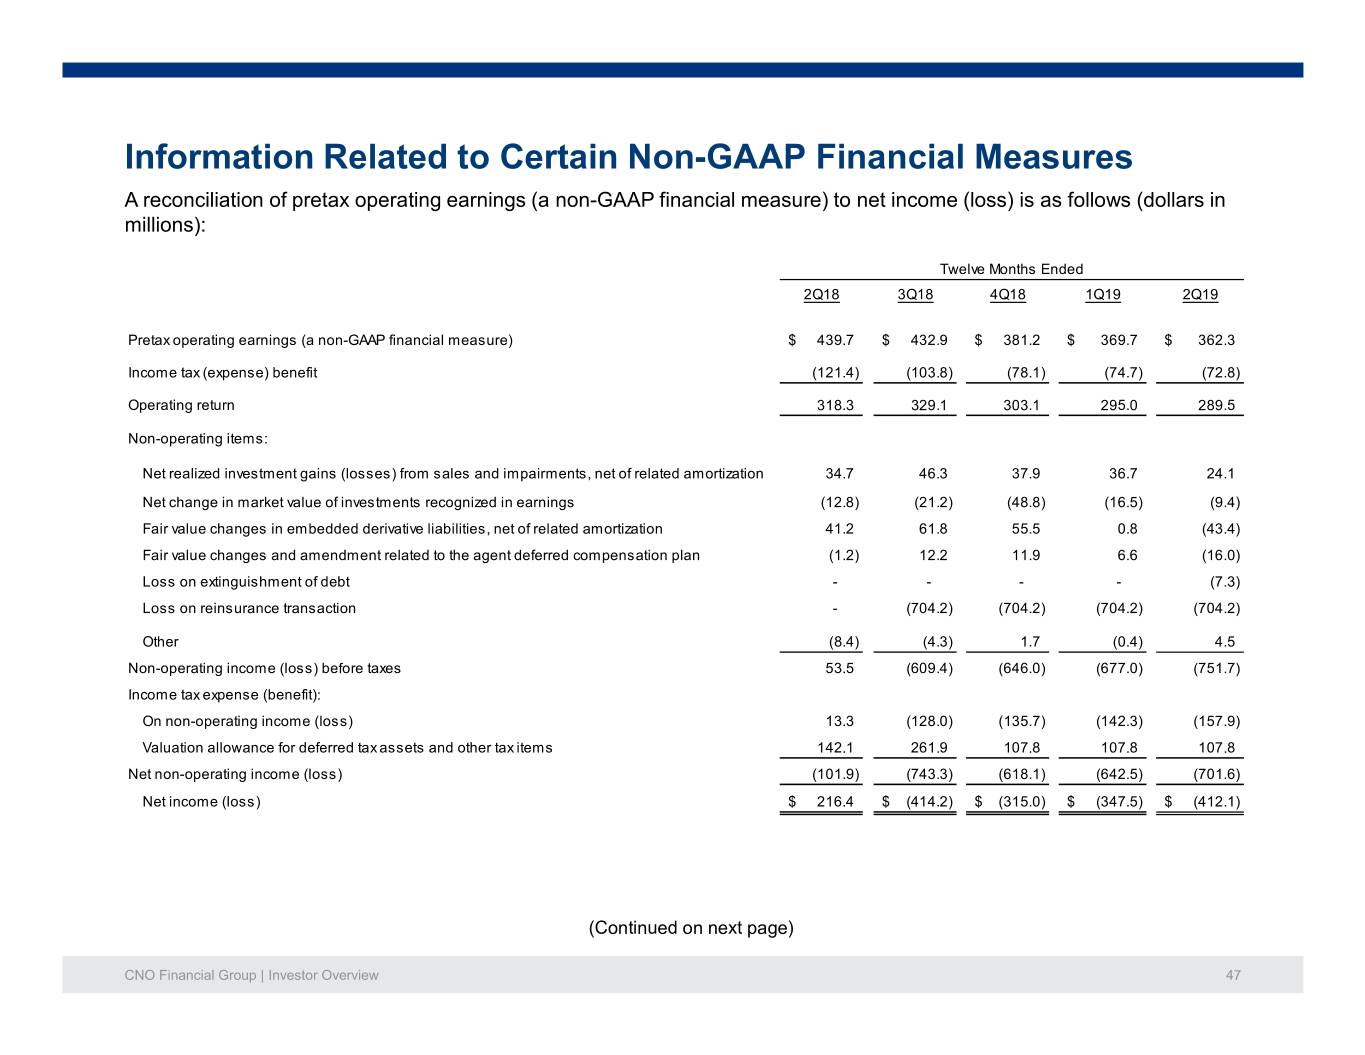
Information Related to Certain Non-GAAP Financial Measures A reconciliation of pretax operating earnings (a non-GAAP financial measure) to net income (loss) is as follows (dollars in millions): Twelve Months Ended 2Q18 3Q18 4Q18 1Q19 2Q19 Pretax operating earnings (a non-GAAP financial measure)$ 439.7 $ 432.9 $ 381.2 $ 369.7 $ 362.3 Income tax (expense) benefit (121.4) (103.8) (78.1) (74.7) (72.8) Operating return 318.3 329.1 303.1 295.0 289.5 Non-operating items: Net realized investment gains (losses) from sales and impairments, net of related amortization 34.7 46.3 37.9 36.7 24.1 Net change in market value of investments recognized in earnings (12.8) (21.2) (48.8) (16.5) (9.4) Fair value changes in embedded derivative liabilities, net of related amortization 41.2 61.8 55.5 0.8 (43.4) Fair value changes and amendment related to the agent deferred compensation plan (1.2) 12.2 11.9 6.6 (16.0) Loss on extinguishment of debt - - - - (7.3) Loss on reinsurance transaction - (704.2) (704.2) (704.2) (704.2) Other (8.4) (4.3) 1.7 (0.4) 4.5 Non-operating income (loss) before taxes 53.5 (609.4) (646.0) (677.0) (751.7) Income tax expense (benefit): On non-operating income (loss) 13.3 (128.0) (135.7) (142.3) (157.9) Valuation allowance for deferred tax assets and other tax items 142.1 261.9 107.8 107.8 107.8 Net non-operating income (loss) (101.9) (743.3) (618.1) (642.5) (701.6) Net income (loss)$ 216.4 $ (414.2) $ (315.0) $ (347.5) $ (412.1) (Continued on next page) CNO Financial Group | Investor Overview 47

Information Related to Certain Non-GAAP Financial Measures A reconciliation of consolidated capital, excluding accumulated other comprehensive income (loss) and net operating loss carryforwards (a non-GAAP financial measure) to common shareholders’ equity, is as follows (dollars in millions): 1Q17 2Q17 3Q17 4Q17 Consolidated capital, excluding accumulated other comprehensive income (loss) and net operating loss carryforwards (a non-GAAP financial measure)$ 3,236.6 $ 3,263.2 $ 3,335.0 $ 3,225.6 Net operating loss carryforwards 640.6 621.6 613.1 409.8 Accumulated other comprehensive income 729.6 894.5 933.6 1,212.1 Common shareholders' equity$ 4,606.8 $ 4,779.3 $ 4,881.7 $ 4,847.5 1Q18 2Q18 3Q18 4Q18 Consolidated capital, excluding accumulated other comprehensive income (loss) and net operating loss carryforwards (a non-GAAP financial measure)$ 3,318.7 $ 3,366.0 $ 2,705.8 $ 2,687.3 Net operating loss carryforwards 404.2 388.7 510.6 505.9 Accumulated other comprehensive income 894.3 700.2 403.5 177.7 Common shareholders' equity$ 4,617.2 $ 4,454.9 $ 3,619.9 $ 3,370.9 1Q19 2Q19 Consolidated capital, excluding accumulated other comprehensive income (loss) and net operating loss carryforwards (a non-GAAP financial measure)$ 2,703.4 $ 2,702.9 Net operating loss carryforwards 479.6 451.1 Accumulated other comprehensive income 654.9 1,098.2 Common shareholders' equity$ 3,837.9 $ 4,252.2 CNO Financial Group | Investor Overview 48

Information Related to Certain Non-GAAP Financial Measures A reconciliation of consolidated capital, excluding accumulated other comprehensive income (loss) and net operating loss carryforwards (a non-GAAP financial measure) to common shareholders’ equity, is as follows (dollars in millions): Trailing Four Quarter Average 2Q18 3Q18 4Q18 1Q19 2Q19 Consolidated capital, excluding accumulated other comprehensive income (loss) and net operating loss carryforwards (a non-GAAP financial measure)$ 3,298.5 $ 3,232.7 $ 3,086.7 $ 2,942.5 $ 2,782.7 Net operating loss carryforwards 483.1 441.1 440.4 461.8 479.0 Accumulated other comprehensive income 959.3 868.8 673.2 514.0 533.8 Common shareholders' equity$ 4,740.9 $ 4,542.6 $ 4,200.3 $ 3,918.3 $ 3,795.5 CNO Financial Group | Investor Overview 49

Debt to Capital Ratio (Ex. AOCI) ($ millions) 4Q16 4Q17 4Q18 2Q19 Corporate notes payable$ 912.9 $ 914.6 $ 916.8 $ 988.3 Total shareholders' equity 4,486.9 4,847.5 3,370.9 4,252.2 Total capital$ 5,399.8 $ 5,762.1 $ 4,287.7 $ 5,240.5 Corporate debt to capital 16.9% 15.9% 21.4% 18.9% Corporate notes payable$ 912.9 $ 914.6 $ 916.8 $ 988.3 Total shareholders' equity 4,486.9 4,847.5 3,370.9 4,252.2 Less accumulated other comprehensive income (622.4) (1,212.1) (177.7) (1,098.2) Total capital$ 4,777.4 $ 4,550.0 $ 4,110.0 $ 4,142.3 Debt to capital ratio, excluding AOCI (a non-GAAP financial measure) 19.1% 20.1% 22.3% 23.9% The debt to capital ratio, excluding accumulated other comprehensive income (loss), differs from the debt to capital ratio because accumulated other comprehensive income (loss) has been excluded from the value of capital used to determine this measure. Management believes this non- GAAP financial measure is useful because it removes the volatility that arises from changes in accumulated other comprehensive income (loss). Such volatility is often caused by changes in the estimated fair value of our investment portfolio resulting from changes in general market interest rates rather than the business decisions made by management. CNO Financial Group | Investor Overview 50

Interest Coverage ($ millions) 2016 2017 2018 1H19 Net income (loss)$ 358.2 $ 175.6 $ (315.0) $ 89.4 Add income tax expense (benefit) (5.0) 304.9 50.2 23.9 Income (loss) before income tax expense (benefit) 353.2 480.5 (264.8) 113.3 Interest expense on corporate debt 45.8 46.5 48.0 24.7 Interest expense on investment borrowings and borrowings related to variable interest entities 70.6 77.2 101.8 54.9 Total interest expense 116.4 123.7 149.8 79.6 Income (loss) before interest and taxes$ 469.6 $ 604.2 $ (115.0) $ 192.9 Interest coverage ratio 4.0 4.9 (a) 2.4 Adjusted EBIT (b)$ 456.1 $ 501.2 $ 429.2 $ 204.8 Interest expense on corporate debt 45.8 46.5 48.0 24.7 Adjusted EBIT divided by interest expense on corporate debt (a non-GAAP financial measure) 10.0 10.8 8.9 8.3 (a) For such ratio, earnings were $264.8 million less than interest expense primarily due to the loss related to the long-term care reinsurance transaction completed in September 2018. (b) See page 52 for a reconciliation of Adjusted EBIT to net income. CNO Financial Group | Investor Overview 51

Earnings Measures ($ millions) 2016 2017 2018 1H19 Bankers Life$ 375.6 $ 367.5 $ 340.6 $ 149.5 Washington National 102.9 98.3 121.9 56.4 Colonial Penn 1.7 22.6 14.8 4.4 Long-term care in run-off 18.4 53.1 22.9 5.7 Adjusted EBIT from business segments 498.6 541.5 500.2 216.0 Corporate operations, excluding interest expense (42.5) (40.3) (71.0) (11.2) Adjusted EBIT* 456.1 501.2 429.2 204.8 Corporate interest expense (45.8) (46.5) (48.0) (24.7) Operating earnings before taxes 410.3 454.7 381.2 180.1 Tax expense on period income 147.8 153.8 78.1 37.9 Net operating income 262.5 300.9 303.1 142.2 Net realized investment gains (losses), net of related amortization 7.6 49.3 37.9 (2.4) Net change in market value of investments recognized in earnings - - (48.8) 23.4 Fair value changes in embedded derivative liabilities, net of related amortization 9.6 (2.5) 55.5 (65.5) Fair value changes related to the agent deferred compensation plan 3.1 (12.2) 11.9 (16.9) Loss related to reinsurance transactions (75.4) - (704.2) - Loss on extinguishment of debt - - - (7.3) Other (2.0) (8.8) 1.7 1.9 Non-operating income (loss) before taxes (57.1) 25.8 (646.0) (66.8) Income tax expense (benefit): On non-operating income (loss) (20.0) 9.0 (135.7) (14.0) Valuation allowance for deferred tax assets and other tax items (132.8) 142.1 107.8 - Net non-operating income (loss) 95.7 (125.3) (618.1) (52.8) Net income (loss)$ 358.2 $ 175.6 $ (315.0) $ 89.4 *Management believes that an analysis of earnings before net realized investment gains (losses) from sales and impairments, net change in market value of investments recognized in earnings, fair value changes in embedded derivative liabilities, fair value changes and amendment related to the agent deferred compensation plan, loss related to reinsurance transactions, loss on extinguishment of debt, other non-operating items, corporate interest expense and taxes (“Adjusted EBIT,” a non-GAAP financial measure) provides a clearer comparison of the operating results of the company quarter-over-quarter because it excludes: (1) net realized investment gains (losses) from sales and impairments; (2) net change in market value of investments recognized in earnings; (3) fair value changes due to fluctuations in the interest rates used to discount embedded derivative liabilities related to our fixed index annuities that are unrelated to the company’s underlying fundamentals; (4) loss on extinguishment of debt; (5) fair value changes related to the agent deferred compensation plan; (6) loss related to reinsurance transactions; (7) changes in the valuation allowance for deferred tax assets and other tax items; and (8) other non-operating items consisting primarily of earnings attributable to variable interest entities. The table above provides a reconciliation of Adjusted EBIT to net income. CNO Financial Group | Investor Overview 52


