
Exhibit 99.3 First Quarter 2020 Financial and operating results for the period ended March 31, 2020 May 5, 2020 Unless otherwise specified, comparisons in this presentation are between 1Q19 and 1Q20.
Important Legal Information Forward-Looking Statements Certain statements made in this presentation should be considered forward-looking statements as defined in the Private Securities Litigation Reform Act of 1995. These include statements about future results of operations and capital plans. We caution investors that these forward-looking statements are not guarantees of future performance, and actual results may differ materially. Investors should consider the important risks and uncertainties that may cause actual results to differ, including those included in our press release issued on May 5, 2020, our Quarterly Reports on Form 10-Q, our Annual Report on Form 10-K and other filings we make with the Securities and Exchange Commission. We assume no obligation to update this presentation, which speaks as of today’s date. Non-GAAP Measures This presentation contains financial measures that differ from the comparable measures under Generally Accepted Accounting Principles (GAAP). Reconciliations between those non-GAAP measures and the comparable GAAP measures are included in the Appendix, or on the page such measure is presented. While management believes the measures are useful to enhance understanding and comparability of our financial results, these non-GAAP measures should not be considered substitutes for the most directly comparable GAAP measures. Additional information concerning non-GAAP measures is included in our periodic filings with the Securities and Exchange Commission that are available in the “Investors – SEC Filings” section of CNO’s website, CNOinc.com. CNO Financial Group | First Quarter 2020 Earnings | May 5, 2020 2

CNO Financial Group | First Quarter 2020 Earnings | May 5, 2020 3
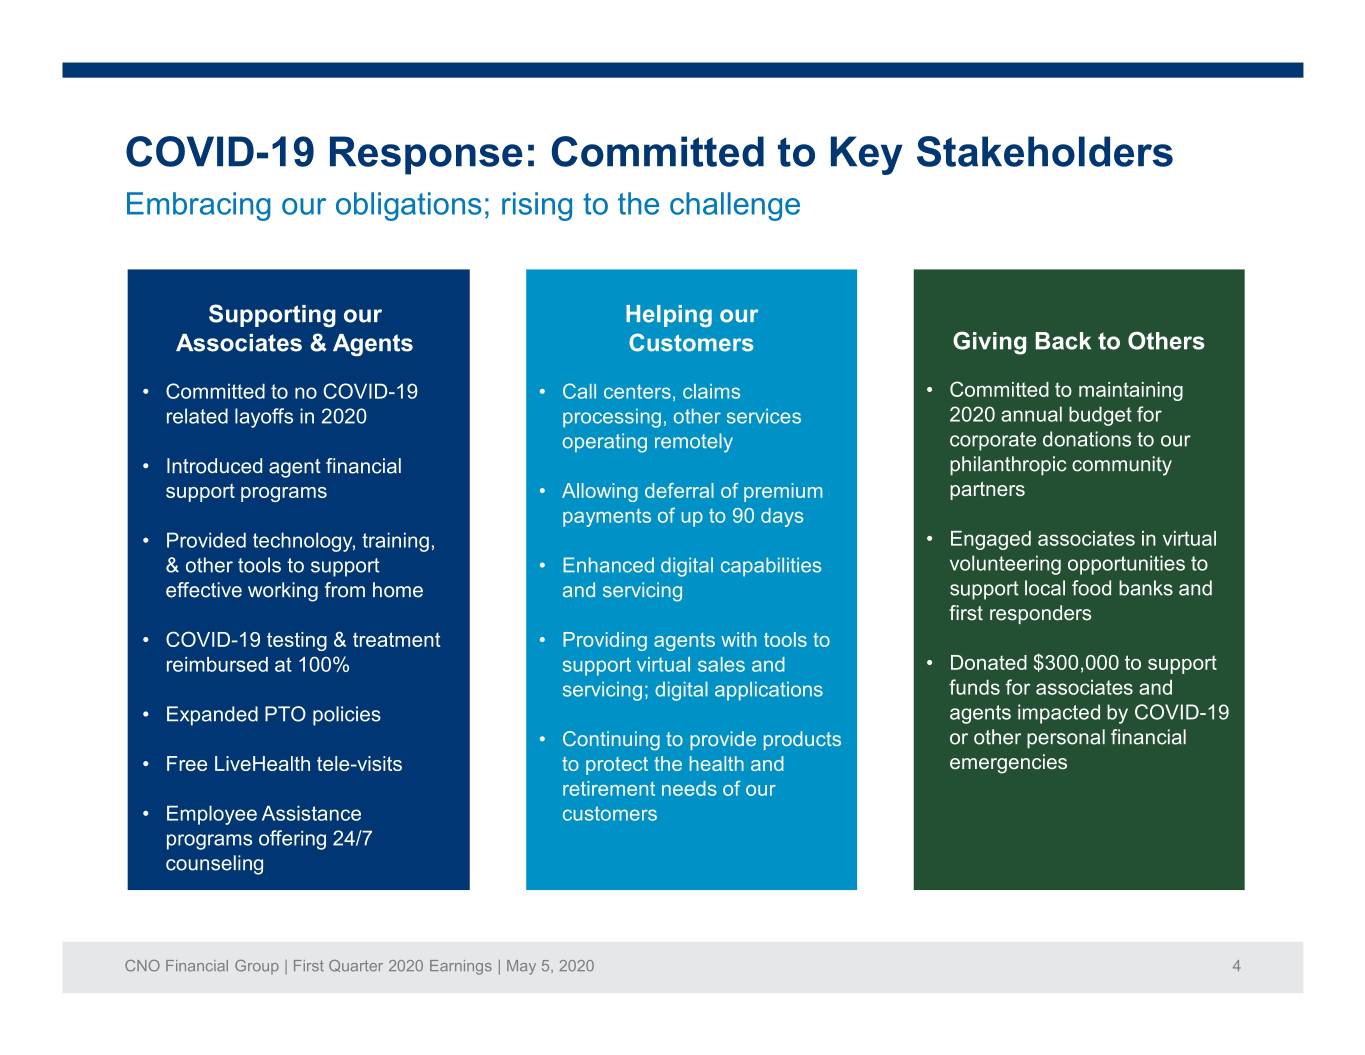
COVID-19 Response: Committed to Key Stakeholders Embracing our obligations; rising to the challenge Supporting our Helping our Associates & Agents Customers Giving Back to Others • Committed to no COVID-19 • Call centers, claims • Committed to maintaining related layoffs in 2020 processing, other services 2020 annual budget for operating remotely corporate donations to our • Introduced agent financial philanthropic community support programs • Allowing deferral of premium partners payments of up to 90 days • Provided technology, training, • Engaged associates in virtual & other tools to support • Enhanced digital capabilities volunteering opportunities to effective working from home and servicing support local food banks and first responders • COVID-19 testing & treatment • Providing agents with tools to reimbursed at 100% support virtual sales and • Donated $300,000 to support servicing; digital applications funds for associates and • Expanded PTO policies agents impacted by COVID-19 • Continuing to provide products or other personal financial • Free LiveHealth tele-visits to protect the health and emergencies retirement needs of our • Employee Assistance customers programs offering 24/7 counseling CNO Financial Group | First Quarter 2020 Earnings | May 5, 2020 4
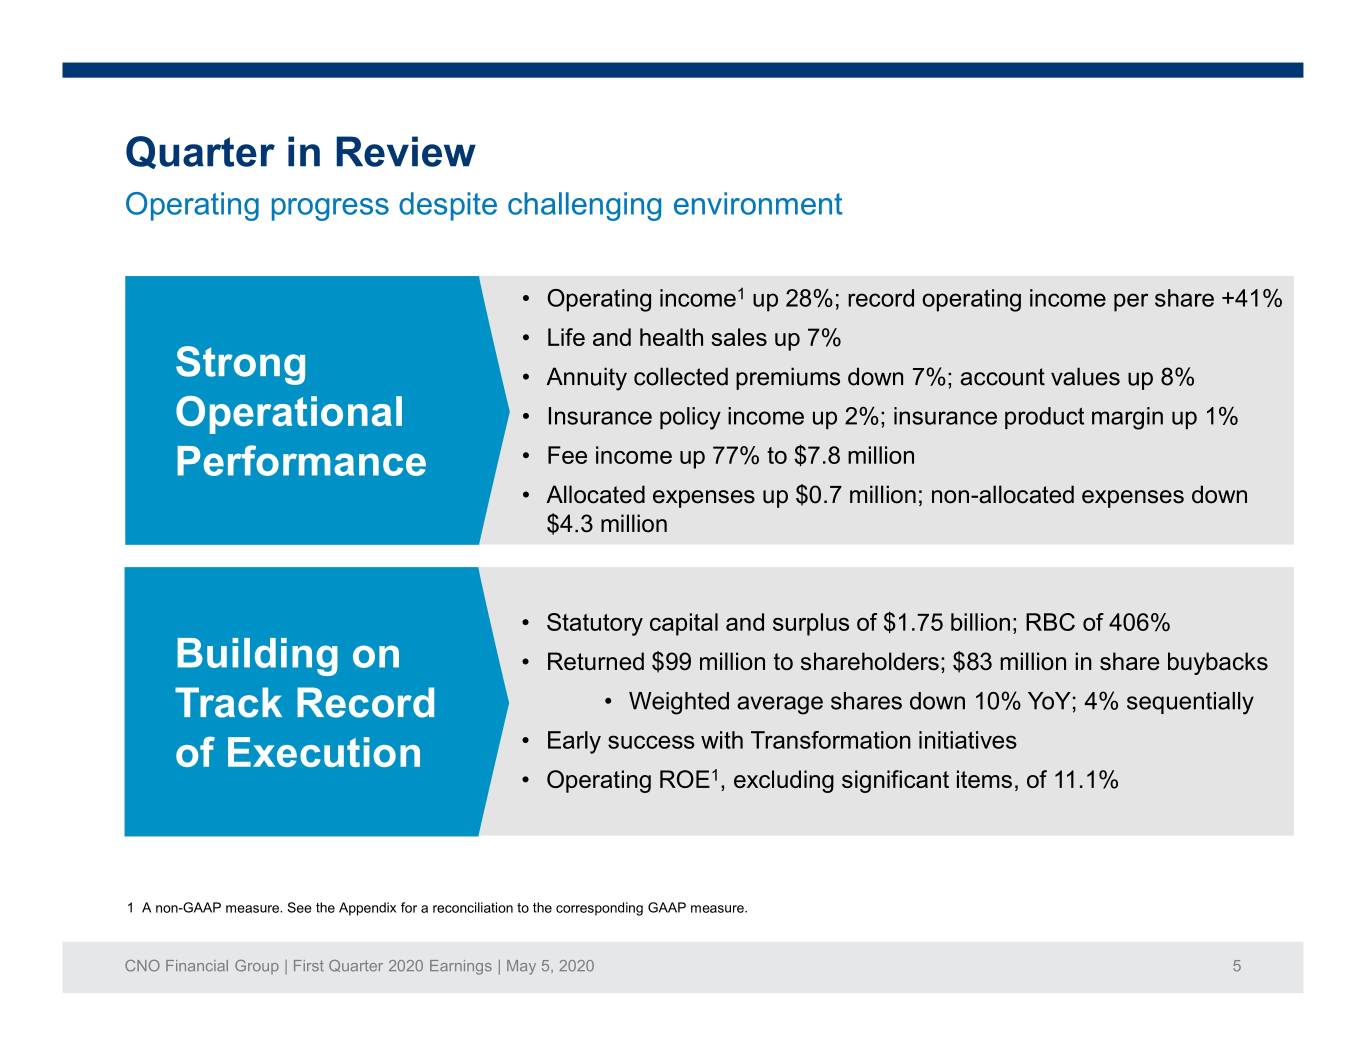
Quarter in Review Operating progress despite challenging environment • Operating income1 up 28%; record operating income per share +41% • Life and health sales up 7% Strong • Annuity collected premiums down 7%; account values up 8% Operational • Insurance policy income up 2%; insurance product margin up 1% Performance • Fee income up 77% to $7.8 million • Allocated expenses up $0.7 million; non-allocated expenses down $4.3 million • Statutory capital and surplus of $1.75 billion; RBC of 406% Building on • Returned $99 million to shareholders; $83 million in share buybacks Track Record • Weighted average shares down 10% YoY; 4% sequentially of Execution • Early success with Transformation initiatives • Operating ROE1, excluding significant items, of 11.1% 1 A non-GAAP measure. See the Appendix for a reconciliation to the corresponding GAAP measure. CNO Financial Group | First Quarter 2020 Earnings | May 5, 2020 5

Growth Scorecard Four of five metrics up Q/Q (dollars in millions) 2019 2020 % Change 1Q 2Q 3Q 4Q TY 1Q Q/Q New Annualized Premium 1 Life Insurance $39.7 $39.4 $37.3 $34.9 $151.3 $41.1 3.5% Health Insurance 40.1 45.8 46.7 62.7 195.3 44.0 9.7% Total Life & Health Insurance $79.8 $85.2 $84.0 $97.6 $346.6 $85.1 6.6% Insurance Policy Income Health $358.2 $358.1 $358.1 $359.0 $1,433.4 $362.1 1.1% Life 187.2 189.0 189.6 192.3 758.1 194.1 3.7% Drive Growth Drive Long-term Care 67.3 67.0 67.2 66.7 268.2 66.9 -0.6% Total Life & Health $612.7 $614.1 $614.9 $618.0 $2,459.7 $623.1 1.7% Annuity Collected Premiums $315.7 $341.2 $325.2 $324.3 $1,306.4 $292.2 -7.4% Client Assets in BD and Advisory 2 $1,234.4 $1,303.0 $1,362.7 $1,515.0 $1,515.0 $1,358.7 10.1% the Right the 3 Expand to Expand Fee Income $4.4 $4.4 $3.0 $11.7 $23.5 $7.8 77.3% 1 Measured as 100% of new term life and health annualized premiums and 10% of single premium whole life deposits. 2 Client assets include cash and securities in brokerage and managed advisory accounts. 3 Represents fee income, net of related expenses, from the sales of third-party insurance products, services provided by WBD, our broker-dealer and registered investment advisor. CNO Financial Group | First Quarter 2020 Earnings | May 5, 2020 6
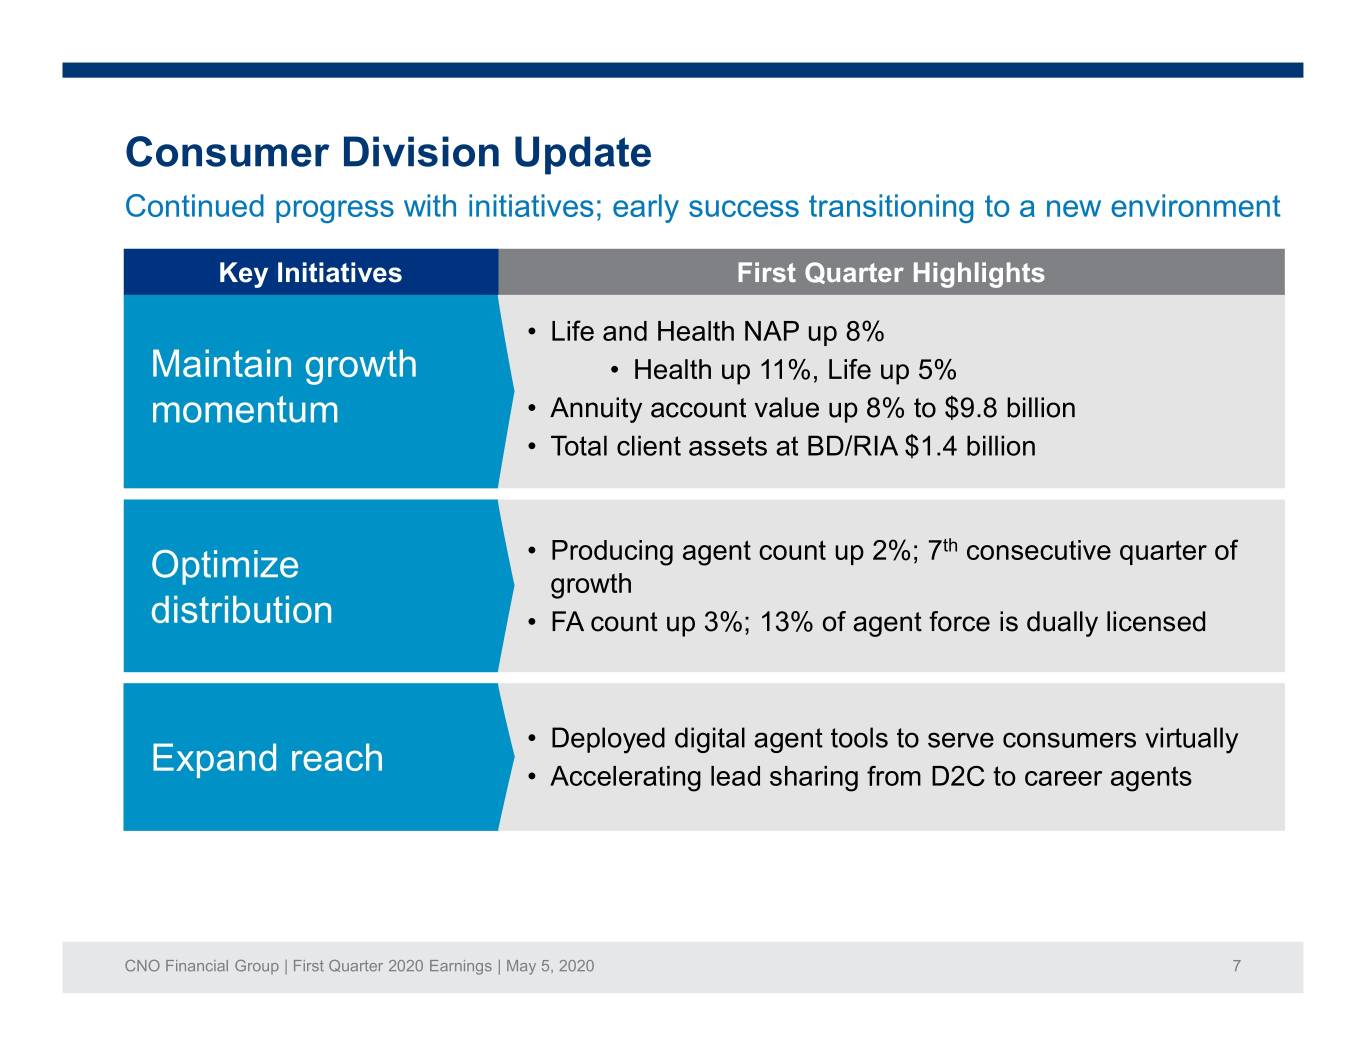
Consumer Division Update Continued progress with initiatives; early success transitioning to a new environment Key Initiatives First Quarter Highlights • Life and Health NAP up 8% Maintain growth • Health up 11%, Life up 5% momentum • Annuity account value up 8% to $9.8 billion • Total client assets at BD/RIA $1.4 billion • Producing agent count up 2%; 7th consecutive quarter of Optimize growth distribution • FA count up 3%; 13% of agent force is dually licensed • Deployed digital agent tools to serve consumers virtually Expand reach • Accelerating lead sharing from D2C to career agents CNO Financial Group | First Quarter 2020 Earnings | May 5, 2020 7

Worksite Division Update 2020 off to strong start through mid-March; significant near-term challenges Key Initiatives First Quarter Highlights Continue worksite • Worksite NAP up 12% through mid-March; down 1% total growth in small • Worksite producing agent count up 13% employer market • Independent producer sales up 16% • WBD integration progressing; fees +8%; drove 6% of sales Expand to larger • Growth in benefit broker relationships small businesses • Continued success in government-like entities: education, public administration and utilities • New Hospital Indemnity product delivered $0.9mm; +34% Enhance portfolio • 3% of new sales from enrollment solution offering • Additional group product development underway CNO Financial Group | First Quarter 2020 Earnings | May 5, 2020 8
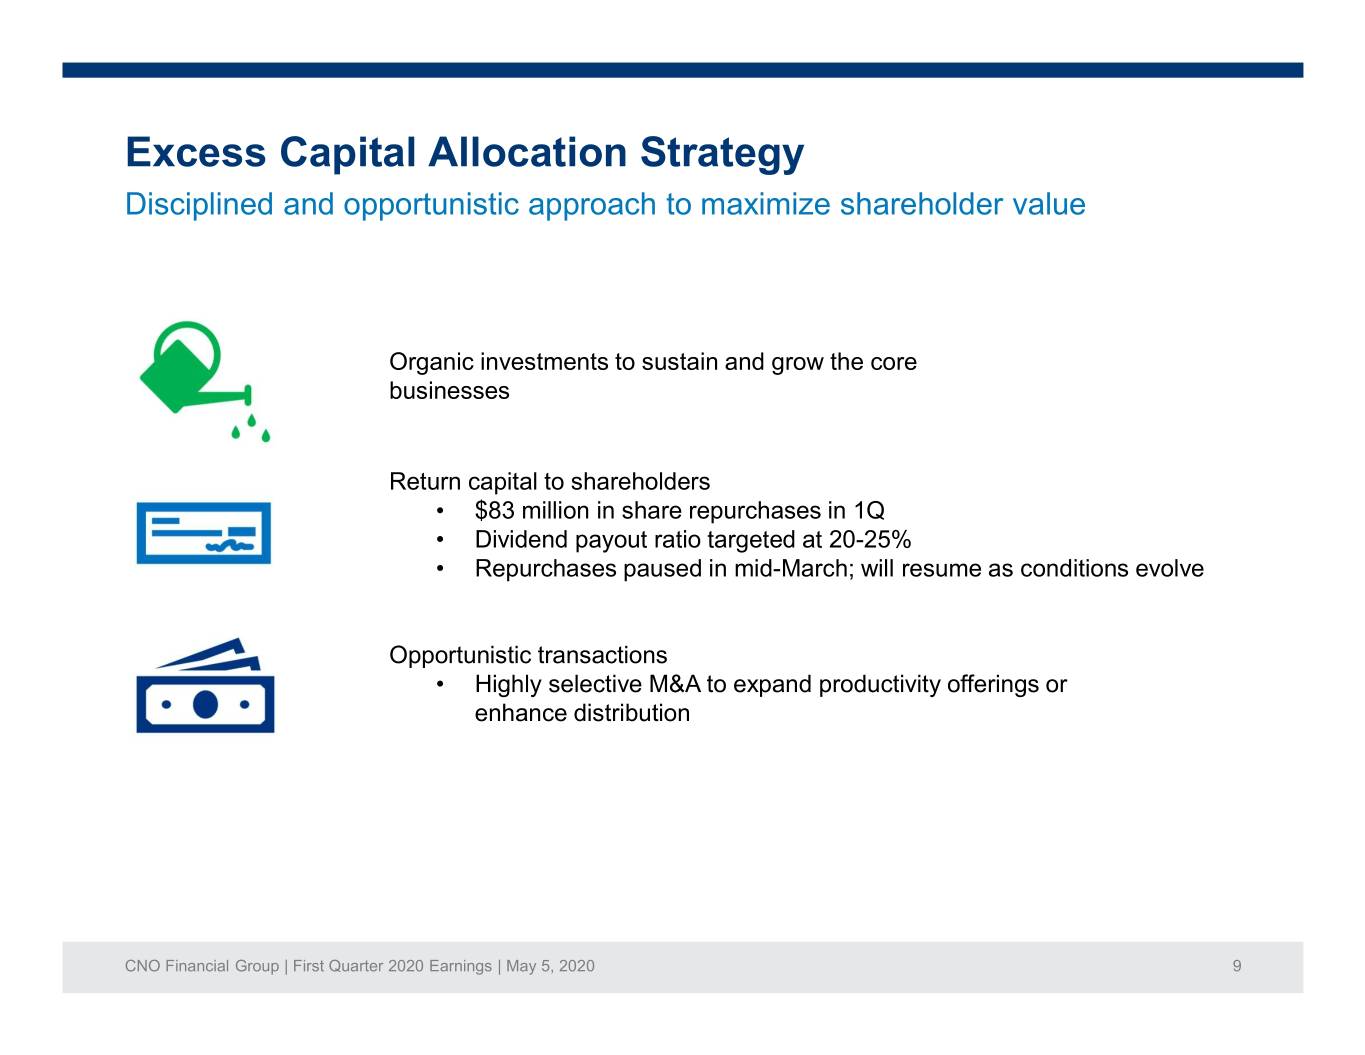
Excess Capital Allocation Strategy Disciplined and opportunistic approach to maximize shareholder value Organic investments to sustain and grow the core businesses Return capital to shareholders • $83 million in share repurchases in 1Q • Dividend payout ratio targeted at 20-25% • Repurchases paused in mid-March; will resume as conditions evolve Opportunistic transactions • Highly selective M&A to expand productivity offerings or enhance distribution CNO Financial Group | First Quarter 2020 Earnings | May 5, 2020 9
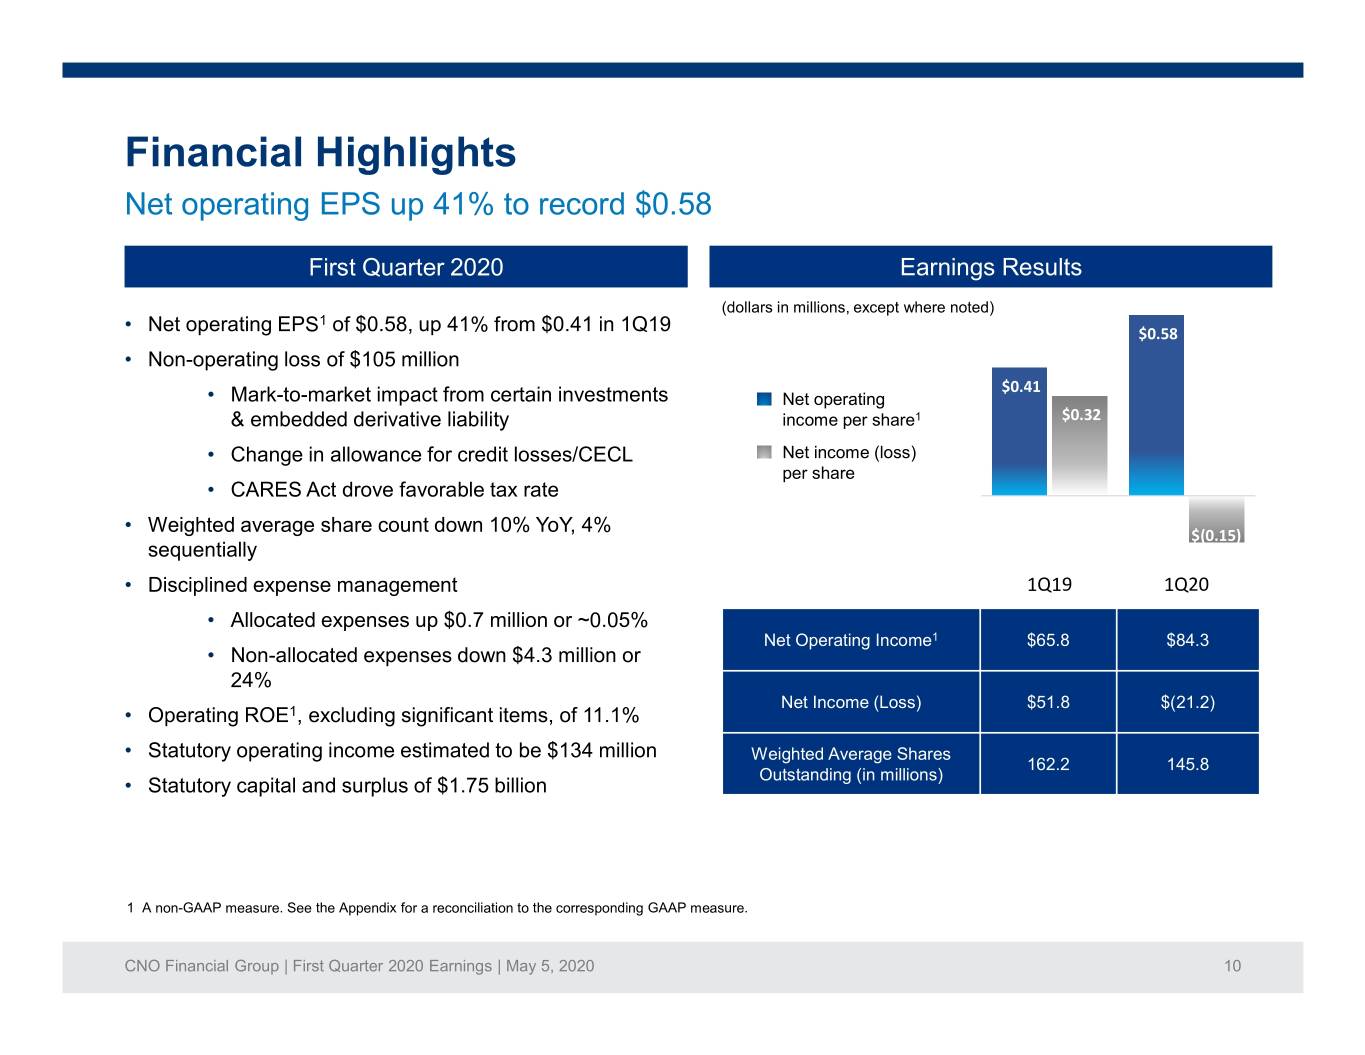
Financial Highlights Net operating EPS up 41% to record $0.58 First Quarter 2020 Earnings Results (dollars in millions, except where noted) 1 • Net operating EPS of $0.58, up 41% from $0.41 in 1Q19 $0.58 • Non-operating loss of $105 million $0.41 • Mark-to-market impact from certain investments Net operating & embedded derivative liability income per share1 $0.32 • Change in allowance for credit losses/CECL Net income (loss) per share • CARES Act drove favorable tax rate • Weighted average share count down 10% YoY, 4% $(0.15) sequentially • Disciplined expense management 1Q19 1Q20 • Allocated expenses up $0.7 million or ~0.05% Net Operating Income1 $65.8 $84.3 • Non-allocated expenses down $4.3 million or 24% Net Income (Loss) $51.8 $(21.2) • Operating ROE1, excluding significant items, of 11.1% • Statutory operating income estimated to be $134 million Weighted Average Shares 162.2 145.8 Outstanding (in millions) • Statutory capital and surplus of $1.75 billion 1 A non-GAAP measure. See the Appendix for a reconciliation to the corresponding GAAP measure. CNO Financial Group | First Quarter 2020 Earnings | May 5, 2020 10

Insurance Product Margin Margin continues to be strong; growth in core blocks offsets lower book yields (dollars in millions) Insurance Product Margin1 1Q19 2Q19 3Q19 4Q19 1Q20 Highlights Annuity $56.2 $57.2 $56.2 $60.8 $59.5 • Total margin up 1% Margin / average net insurance liabilities 2.45% 2.46% 2.39% 2.54% 2.47% • Annuity results reflect growth in fixed index $78.9 $78.3 $77.0 $79.0 $73.6 • Annuity margin up 6%; annuity Health margin / average net insurance Margin / insurance policy 22% 22% 22% 22% 20% income liabilities essentially flat at 2.47% • Health results Life $43.1 $51.7 $54.6 $56.4 $44.3 ISL: Margin / average net • Solid Supplemental Health results 0.75% 0.60% 0.55% 0.68% 0.67% insurance liabilities despite YoY decline; significant ISL: Underwriting margin / 37% 41% 45% 26% 42% insurance policy income outperformance in 1Q19 Trad: Margin / insurance 19% 23% 24% 23% 17% • Medicare Supplement in line with policy income seasonally lower 1Q; margin flat Trad: Margin ex. Adv. Exp. / 30% 33% 35% 32% 30% insurance policy income • Life results reflect growth in ISL block; higher advertising expense in Traditional Long-term Care $11.5 $11.9 $12.3 $14.0 $13.3 Margin / insurance policy 17% 18% 18% 21% 20% • LTC margin benefited from favorable income persistency Total Margin $189.7 $199.1 $200.1 $210.2 $190.7 1 Excluding significant items. CNO Financial Group | First Quarter 2020 Earnings | May 5, 2020 11

Investment Results Steady NII allocated to product lines; variable investment returns boost overall results (dollars in millions) Investment Income Allocated Investment Income Not to Product Lines Allocated to Product Lines Total Net Investment Income1 $400.0 $400.0 $400.0 $279.5 $300.0 $300.0 $300.0 $263.1 $219.8 $222.1 $200.0 $200.0 $200.0 $100.0 $100.0 $100.0 $43.3 $57.4 $- $- $- 1Q 2019 1Q 2020 1Q 2019 1Q 2020 1Q 2019 1Q 2020 Annuity Health Life LTC Annuity Health Life LTC Not Allocated • Total Net Investment Income up 6.2% on 2.4% increase in invested assets • Investment Income Allocated to Product Lines steady despite lower interest rates • Investment Income Not Allocated to Product Lines increased by 32.6% due to strong alternatives results and higher prepayments and calls • New money rate of 4.46% reflects selective opportunistic investments during market dislocation • Average yield on allocated investments was 4.97% compared to 5.16% in 1Q19 1 Reflects sum of allocated and non-allocated investment income. Refer to pages 16-18 of the financial supplement for more information on the components of net investment income. CNO Financial Group | First Quarter 2020 Earnings | May 5, 2020 12
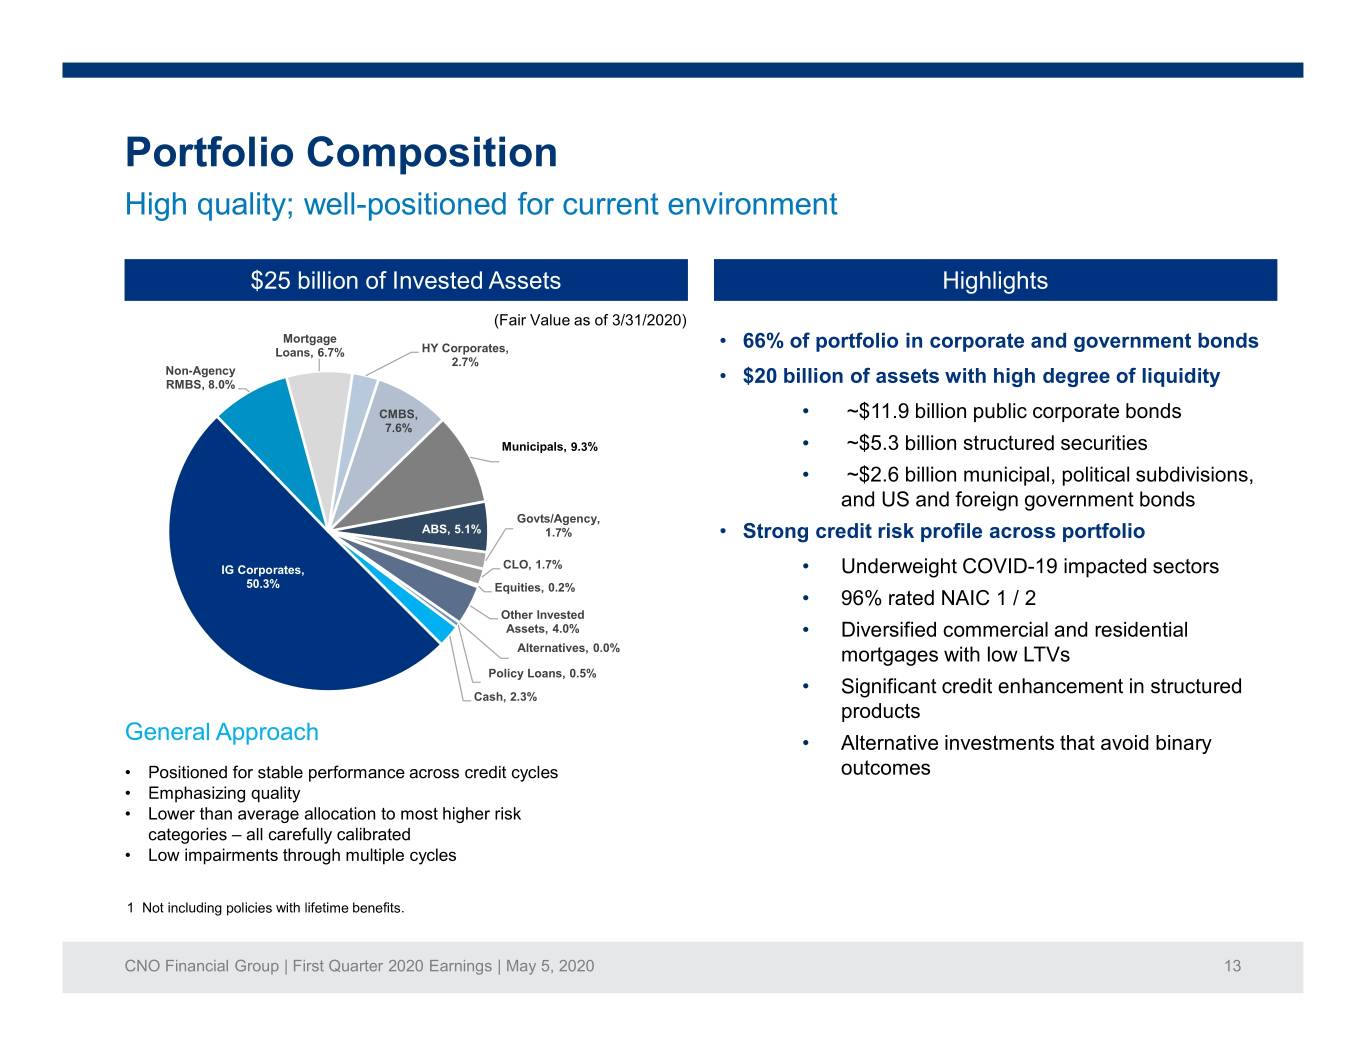
Portfolio Composition High quality; well-positioned for current environment $25 billion of Invested Assets Highlights (Fair Value as of 3/31/2020) Mortgage • 66% of portfolio in corporate and government bonds Loans, 6.7% HY Corporates, 2.7% Non-Agency RMBS, 8.0% • $20 billion of assets with high degree of liquidity CMBS, • ~$11.9 billion public corporate bonds 7.6% Municipals, 9.3% • ~$5.3 billion structured securities • ~$2.6 billion municipal, political subdivisions, and US and foreign government bonds Govts/Agency, ABS, 5.1% 1.7% • Strong credit risk profile across portfolio IG Corporates, CLO, 1.7% • Underweight COVID-19 impacted sectors 50.3% Equities, 0.2% • 96% rated NAIC 1 / 2 Other Invested Assets, 4.0% • Diversified commercial and residential Alternatives, 0.0% mortgages with low LTVs Policy Loans, 0.5% Cash, 2.3% • Significant credit enhancement in structured products General Approach • Alternative investments that avoid binary • Positioned for stable performance across credit cycles outcomes • Emphasizing quality • Lower than average allocation to most higher risk categories – all carefully calibrated • Low impairments through multiple cycles 1 Not including policies with lifetime benefits. CNO Financial Group | First Quarter 2020 Earnings | May 5, 2020 13

Update on Tax Assets CARES Act NOL utilization provisions provide benefits (dollars in millions) CARES Act Impacts Life Non-life • Repeal of the 80% limitation for utilization of NOLs created after 2017 NOL deferred tax assets at December 31, 2019$ 110.0 $ 422.0 • Accelerates the utilization of $105 million of Impacts of CARES Act life NOLs and restores $35 million of non- Repeal of 80% limitation (22.0) 8.0 life NOLs Allow NOL carrybacks (78.0) 27.0 • Allows NOLs created after 2017 to be carried Impacts of 1Q 2020 taxable income - (7.0) back NOL deferred tax assets at March 31, 2020$ 10.0 $ 450.0 • Accelerates the utilization of $375 million of life NOLs and restores $130 million of non- life NOLs • Tax rate differential between current 21% rate and 35% rate in carryback years results in a $34 million permanent tax benefit CNO Financial Group | First Quarter 2020 Earnings | May 5, 2020 14

Cash Flow Profile Strong free cash flow generation and conversion (dollars in millions) For the Quarter 1Q19 1Q20 Net Operating Income1 $ 65.8 $ 84.3 Holding Company Cash Flows: Dividends from Subsidiaries$ 49.0 $ 87.8 Management Fees 29.2 29.8 Surplus Debenture Interest 12.6 12.1 Earnings on Corporate Investments 5.1 15.1 Tax Refund 5.8 - Other (9.5) (22.9) Holding Company Sources of Cash 92.2 121.9 Holding Company Expenses and Other (24.4) (39.3) Interest Payments (1.0) (0.2) Excess Cash Flow to Holding Company 66.8 82.4 Share Repurchases (41.0) (84.8) Dividend Payments to Stockholders (16.4) (16.2) Net Change in Holding Company Cash and Investments 9.4 (18.6) Cash and Investments, Beginning of Period 220.4 186.7 Cash and Investments, End of Period$ 229.8 $ 168.1 1 A non-GAAP measure. See the Appendix for a reconciliation to the corresponding GAAP measure. CNO Financial Group | First Quarter 2020 Earnings | May 5, 2020 15
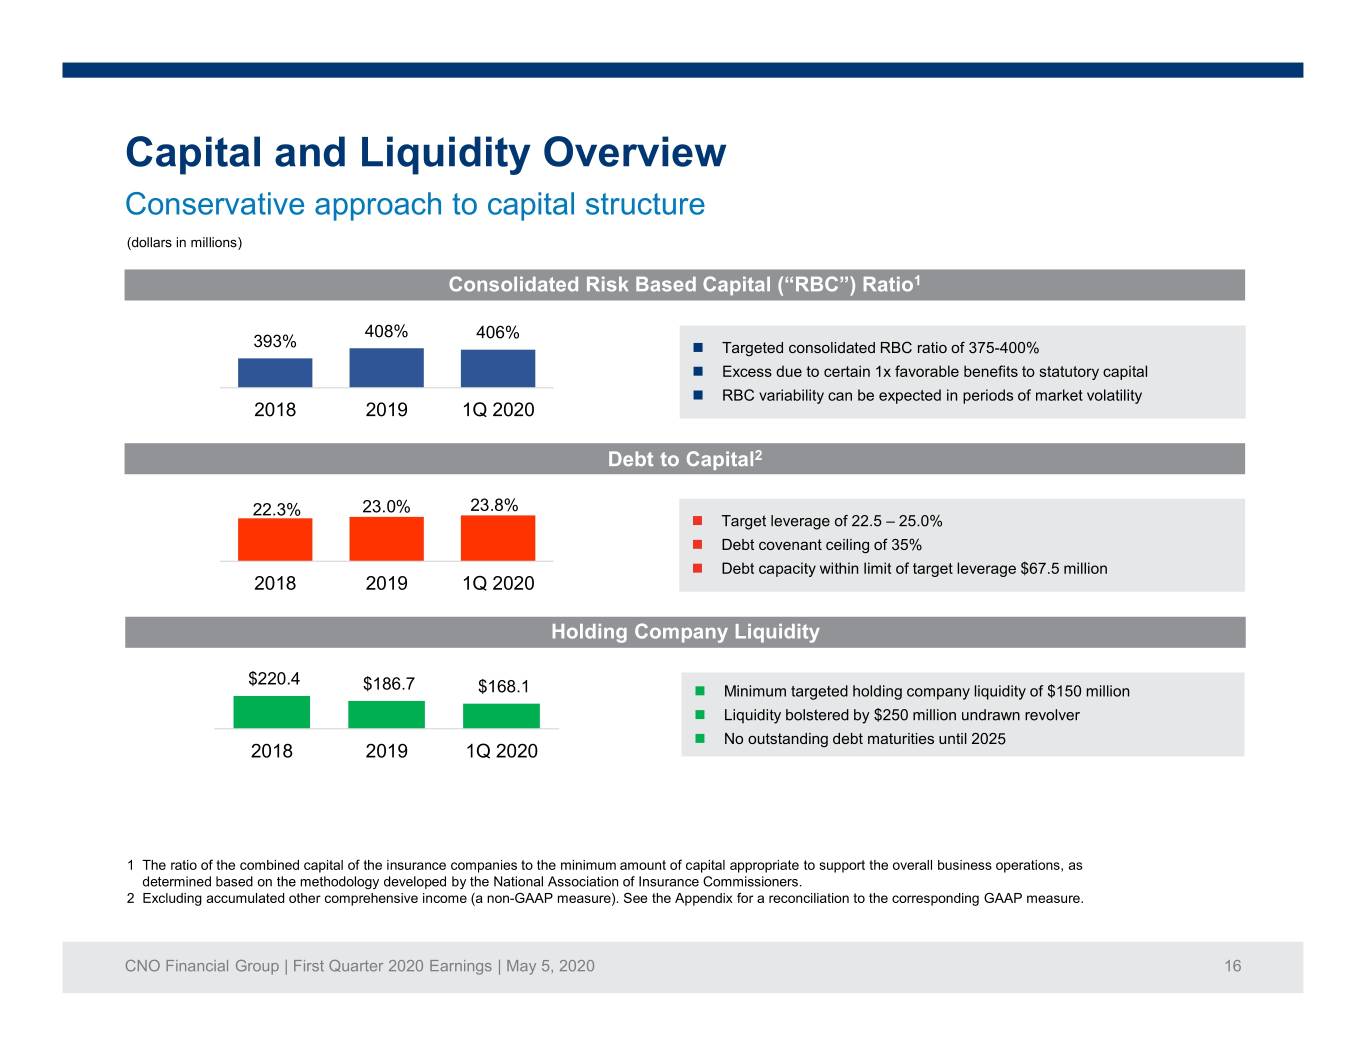
Capital and Liquidity Overview Conservative approach to capital structure (dollars in millions) Consolidated Risk Based Capital (“RBC”) Ratio1 408% 406% 393% Targeted consolidated RBC ratio of 375-400% Excess due to certain 1x favorable benefits to statutory capital RBC variability can be expected in periods of market volatility 2018 2019 1Q 2020 Debt to Capital2 22.3% 23.0% 23.8% Target leverage of 22.5 – 25.0% Debt covenant ceiling of 35% Debt capacity within limit of target leverage $67.5 million 2018 2019 1Q 2020 x Holding Company Liquidity $220.4 $186.7 $168.1 Minimum targeted holding company liquidity of $150 million Liquidity bolstered by $250 million undrawn revolver No outstanding debt maturities until 2025 2018 2019 1Q 2020 1 The ratio of the combined capital of the insurance companies to the minimum amount of capital appropriate to support the overall business operations, as determined based on the methodology developed by the National Association of Insurance Commissioners. 2 Excluding accumulated other comprehensive income (a non-GAAP measure). See the Appendix for a reconciliation to the corresponding GAAP measure. CNO Financial Group | First Quarter 2020 Earnings | May 5, 2020 16

2020 Outlook – Maintain RBC, Liquidity, Leverage Targets Maintaining dividend; capacity to resume modest share repurchases • Base case scenario • Assumes social distancing through June • Economy picks up thereafter • 80,000 U.S. COVID-19 deaths • Alt case scenario • Assumes second wave of COVID-19 in mid-July • 120,000 U.S. COVID-19 deaths • Shelter-in-place restrictions reintroduced until 1Q21 when vaccine produced • Other assumptions • GDP, equity market downturn, housing market correction, interest rates, spreads, default rates/fallen angels approximate GFC levels; unemployment worse • 2020 impacts • 2Q20 earnings depressed from projected alts performance and anticipated COVID-19 claims • 2H20 earnings potentially impacted from lower interest rates, COVID-19 margin pressure; higher lapse rates could counterbalance • Offsetting impacts to capital from credit migration and lower sales/less capital strain CNO Financial Group | First Quarter 2020 Earnings | May 5, 2020 17

Delivering On Our Commitments Maximize Turnaround / De-risking Pivot to Growth Profitability Pre 2017 2017-2019 2020 and Beyond Reinsured life block (2009) Completed Senior Leadership Customer-centric business Recapitalized company (2012) additions realignment Initiated dividend (2012) Reinsured LTC block Omnichannel delivery model Sold Legacy Life Insurance Block Achieved investment grade Enhance growth and margin (2014) credit ratings profile Migrated ratings upwards–within Up-in-quality portfolio repositioning Maximize distributable cash flow non-investment grade ratings Sustainable momentum in recruiting Accelerate pace of capital classes and sales deployment Reduced risk and volatility Leverage technology CNO Financial Group | First Quarter 2020 Earnings | May 5, 2020 18

Investment Highlights Well-positioned in Favorable Highly Sustainable Strong balance underserved senior demographic differentiated growth initiatives sheet; robust middle-income tailwinds business model in place free cash flow market generation CNO Financial Group | First Quarter 2020 Earnings | May 5, 2020 19

Questions and Answers CNO Financial Group | First Quarter 2020 Earnings | May 5, 2020 20
Appendix 1: Quarter in Review Strong Operational Performance • Broker-Dealer/Registered Investment Advisor Slide 22 • Agent Counts Slide 23 Building on Strong Track Record of Execution • Retained LTC Insurance Slide 24 • Portfolio Overview Slides 25-27 CNO Financial Group | First Quarter 2020 Earnings | May 5, 2020 21

Broker-Dealer/Registered Investment Advisor Account values up YoY; $1.4 billion in client assets (dollars in millions) 2019 2020 1Q 2Q 3Q 4Q 1Q Net New Client Assets in Brokerage -$3.0 $5.1 $13.4 $17.4 $15.3 Brokerage and Advisory1 Advisory 35.7 33.2 29.9 45.4 65.7 Total $32.7 $38.3 $43.3 $62.8 $81.0 Client Assets in Brokerage and Brokerage $861.6 $886.0 $913.7 $982.9 $842.3 Advisory1 at end of period Advisory 372.8 417.0 449.0 532.1 516.4 Total $1,234.4 $1,303.0 $1,362.7 $1,515.0 $1,358.7 1 Client assets include cash and securities in brokerage and managed advisory accounts. Net new client assets includes total inflows of cash and securities into brokerage and managed advisory accounts less outflows. Inflows include interest and dividends and exclude changes due to market fluctuations. Bankers Life is the marketing brand of various affiliated companies of CNO Financial Group including, Bankers Life and Casualty Company, Bankers Life Securities, Inc., and Bankers Life Advisory Services, Inc. Non-affiliated insurance products are offered through Bankers Life General Agency, Inc. (dba BL General Insurance Agency, Inc., AK, AL, CA, NV, PA). Agents who are financial advisors are registered with Bankers Life Securities, Inc. Securities and variable annuity products and services are offered by Bankers Life Securities, Inc. Member FINRA/SIPC, (dba BL Securities, Inc., AL, GA, IA, IL, MI, NV, PA). Advisory products and services are offered by Bankers Life Advisory Services, Inc. SEC Registered Investment Adviser (dba BL Advisory Services, Inc., AL, GA, IA, MT, NV, PA). Home Office: 111 East Wacker Drive, Suite 1900, Chicago, IL 60601 CNO Financial Group | First Quarter 2020 Earnings | May 5, 2020 22
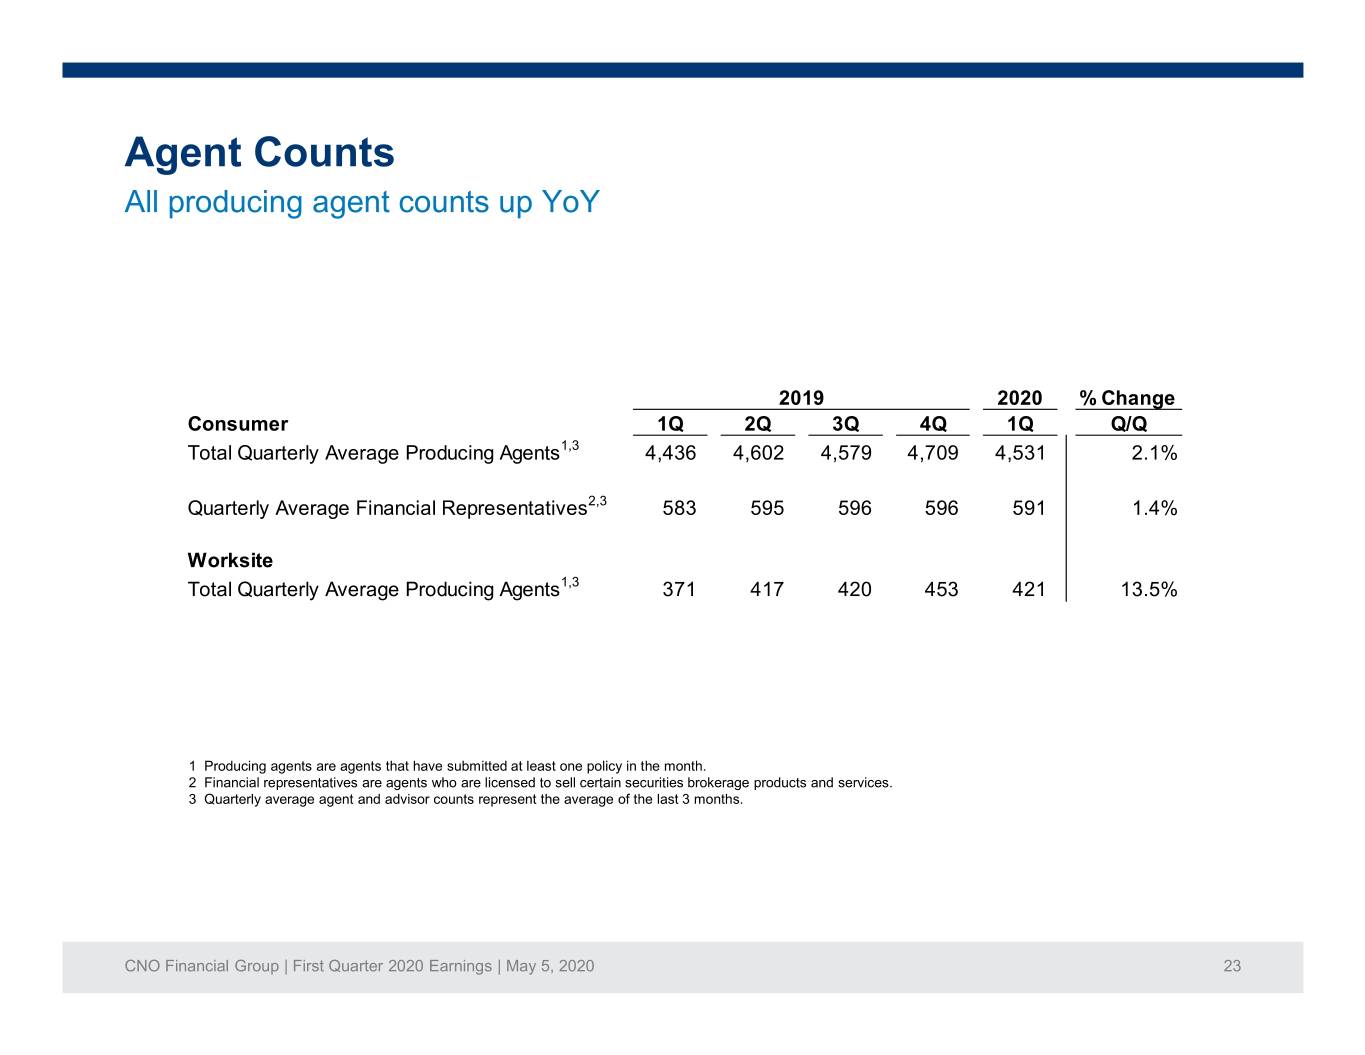
Agent Counts All producing agent counts up YoY 2019 2020 % Change Consumer 1Q 2Q 3Q 4Q 1Q Q/Q Total Quarterly Average Producing Agents1,3 4,436 4,602 4,579 4,709 4,531 2.1% Quarterly Average Financial Representatives2,3 583 595 596 596 591 1.4% Worksite Total Quarterly Average Producing Agents1,3 371 417 420 453 421 13.5% 1 Producing agents are agents that have submitted at least one policy in the month. 2 Financial representatives are agents who are licensed to sell certain securities brokerage products and services. 3 Quarterly average agent and advisor counts represent the average of the last 3 months. CNO Financial Group | First Quarter 2020 Earnings | May 5, 2020 23
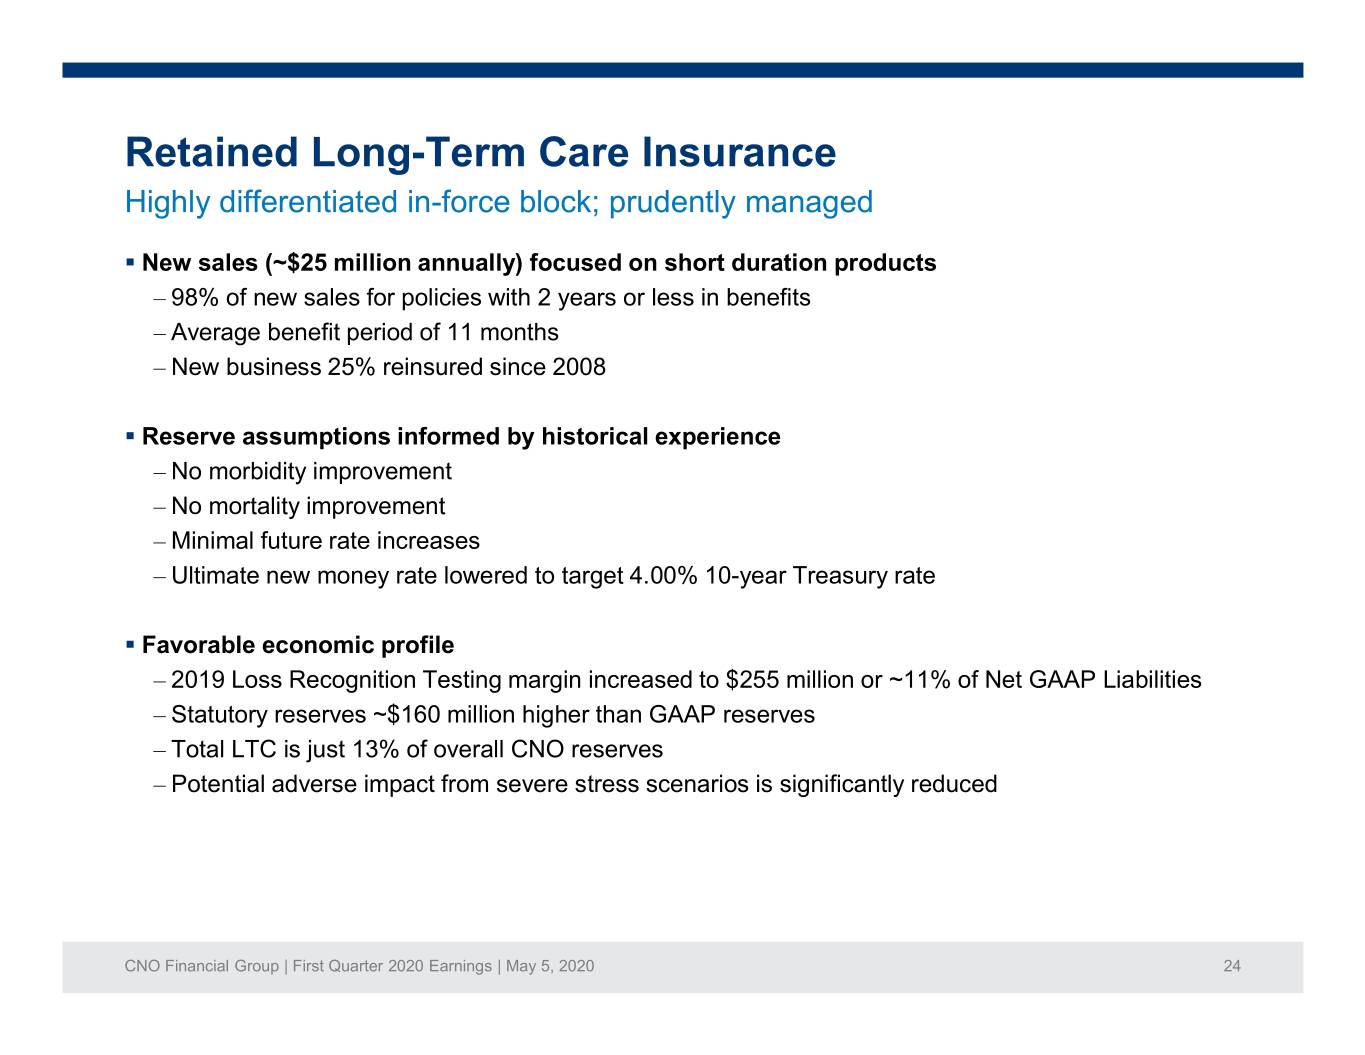
Retained Long-Term Care Insurance Highly differentiated in-force block; prudently managed . New sales (~$25 million annually) focused on short duration products – 98% of new sales for policies with 2 years or less in benefits – Average benefit period of 11 months – New business 25% reinsured since 2008 . Reserve assumptions informed by historical experience – No morbidity improvement – No mortality improvement – Minimal future rate increases – Ultimate new money rate lowered to target 4.00% 10-year Treasury rate . Favorable economic profile – 2019 Loss Recognition Testing margin increased to $255 million or ~11% of Net GAAP Liabilities – Statutory reserves ~$160 million higher than GAAP reserves – Total LTC is just 13% of overall CNO reserves – Potential adverse impact from severe stress scenarios is significantly reduced CNO Financial Group | First Quarter 2020 Earnings | May 5, 2020 24
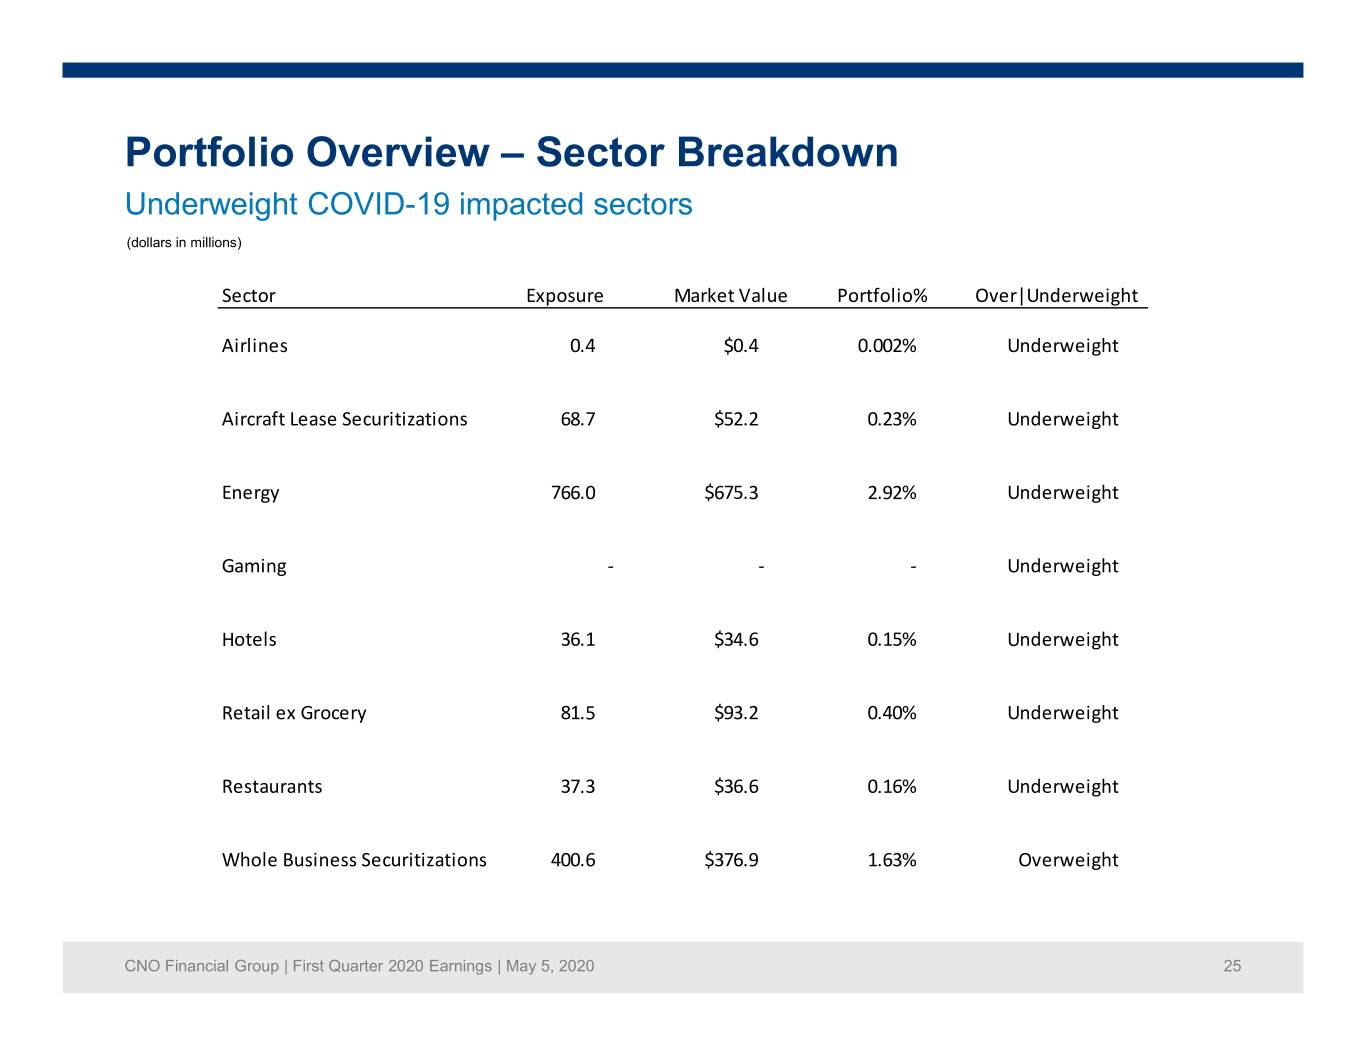
Portfolio Overview – Sector Breakdown Underweight COVID-19 impacted sectors (dollars in millions) Sector Exposure Market Value Portfolio% Over|Underweight Airlines 0.4 $0.4 0.002% Underweight Aircraft Lease Securitizations 68.7 $52.2 0.23% Underweight Energy 766.0 $675.3 2.92% Underweight Gaming - - - Underweight Hotels 36.1 $34.6 0.15% Underweight Retail ex Grocery 81.5 $93.2 0.40% Underweight Restaurants 37.3 $36.6 0.16% Underweight Whole Business Securitizations 400.6 $376.9 1.63% Overweight CNO Financial Group | First Quarter 2020 Earnings | May 5, 2020 25
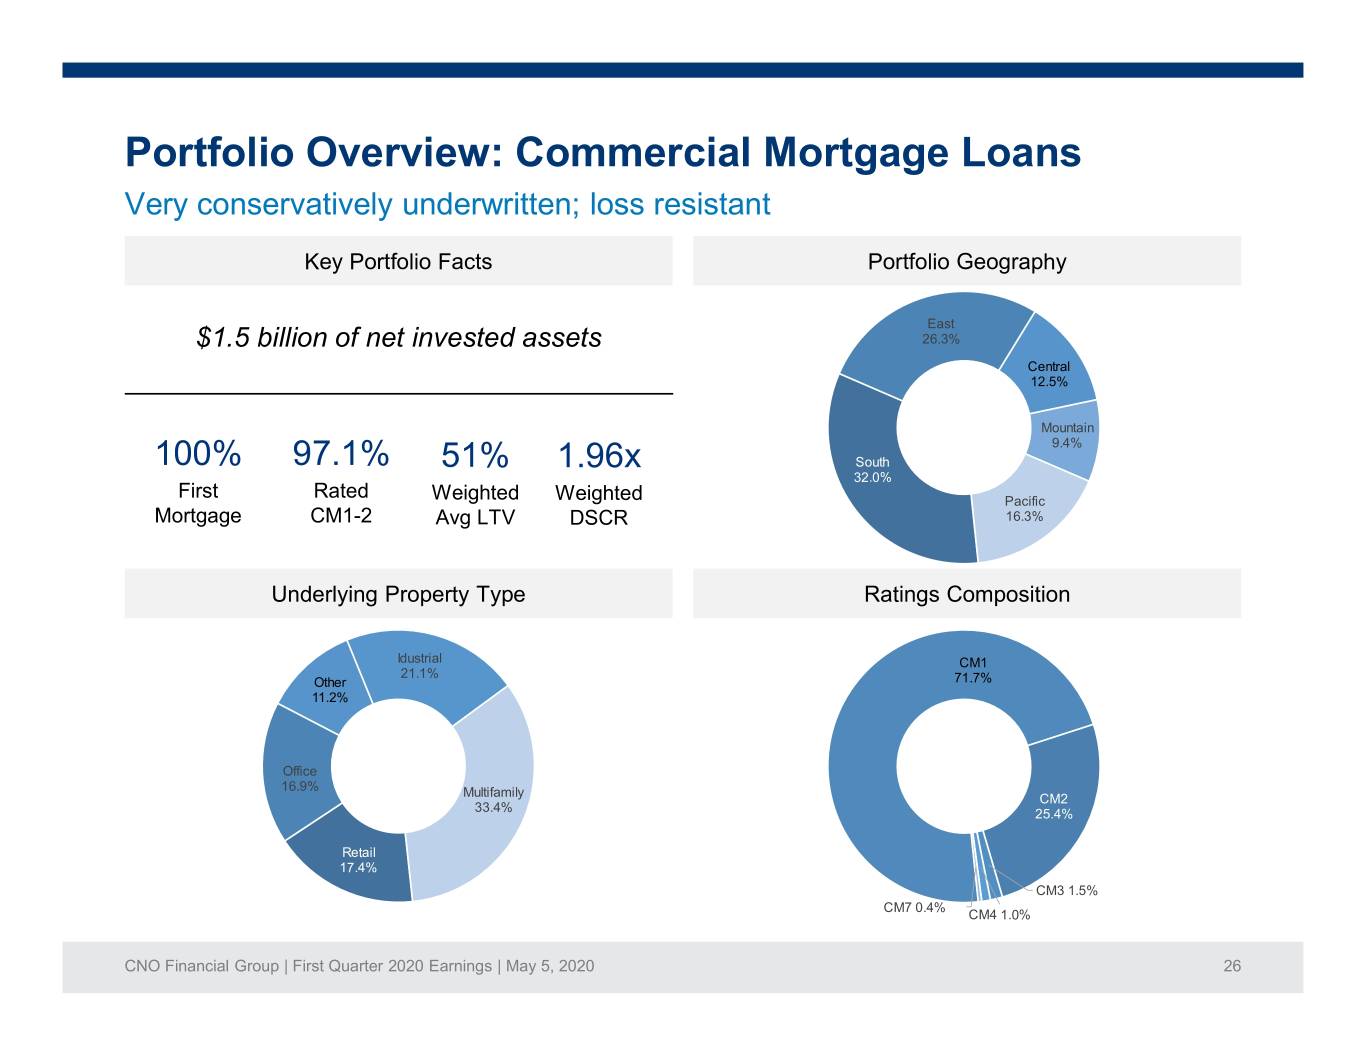
Portfolio Overview: Commercial Mortgage Loans Very conservatively underwritten; loss resistant Key Portfolio Facts Portfolio Geography East $1.5 billion of net invested assets 26.3% Central 12.5% Mountain 9.4% 100% 97.1% 51% 1.96x South 32.0% First Rated Weighted Weighted Pacific Mortgage CM1-2 Avg LTV DSCR 16.3% Underlying Property Type Ratings Composition Idustrial CM1 21.1% Other 71.7% 11.2% Office 16.9% Multifamily CM2 33.4% 25.4% Retail 17.4% CM3 1.5% CM7 0.4% CM4 1.0% CNO Financial Group | First Quarter 2020 Earnings | May 5, 2020 26
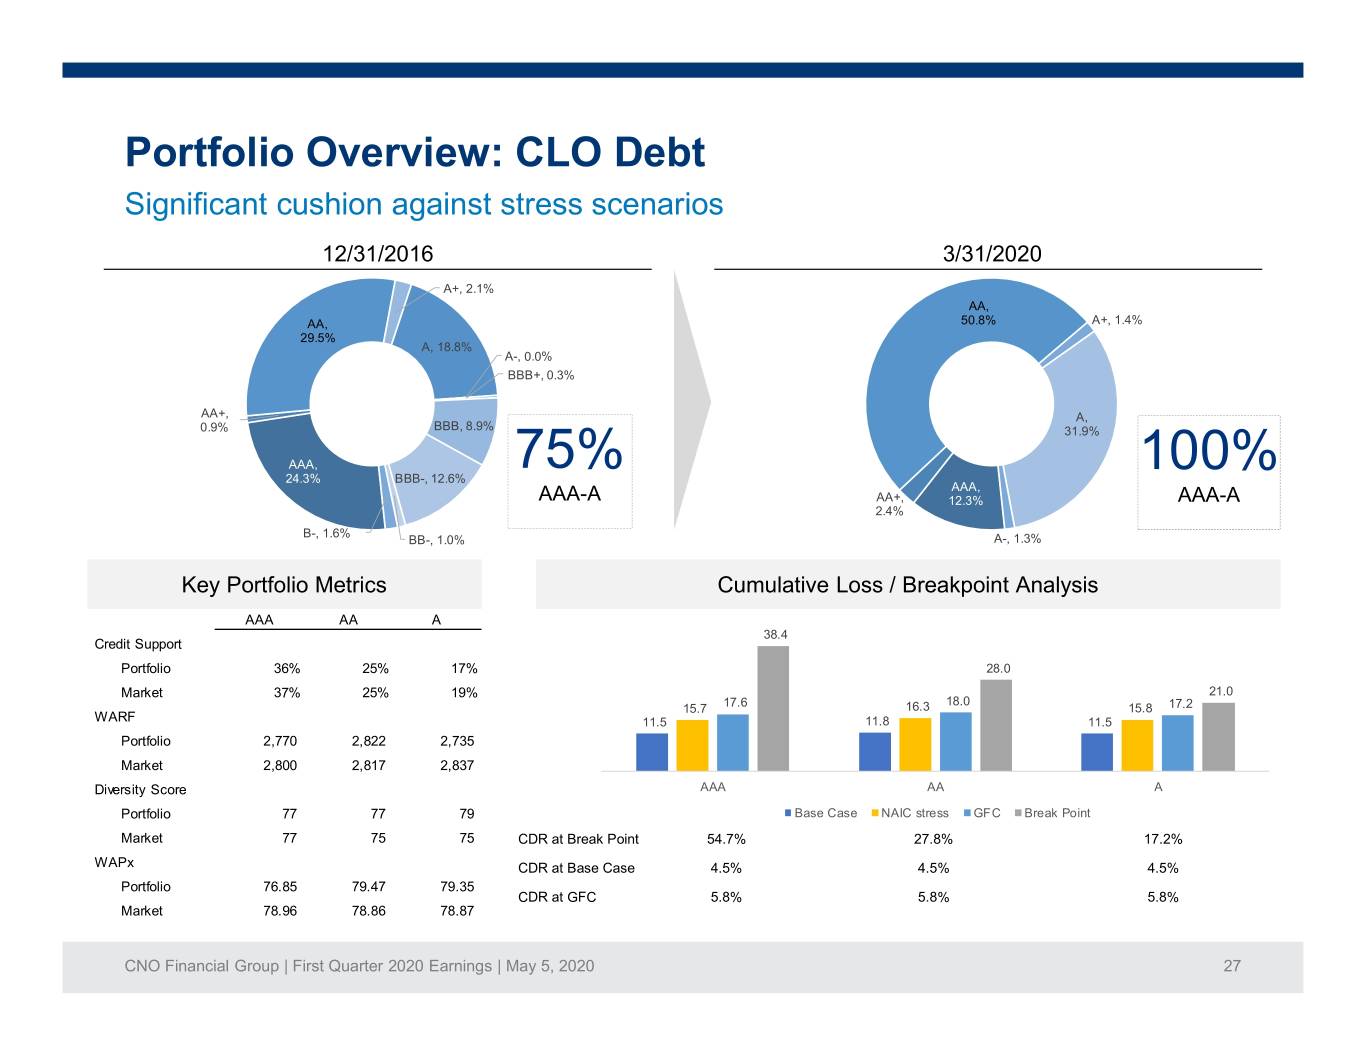
Portfolio Overview: CLO Debt Significant cushion against stress scenarios 12/31/2016 3/31/2020 A+, 2.1% AA, AA, 50.8% A+, 1.4% 29.5% A, 18.8% A-, 0.0% BBB+, 0.3% AA+, A, 0.9% BBB, 8.9% 31.9% AAA, 75% 100% 24.3% BBB-, 12.6% AAA, AAA-A AA+, 12.3% AAA-A 2.4% B-, 1.6% BB-, 1.0% A-, 1.3% Key Portfolio Metrics Cumulative Loss / Breakpoint Analysis AAA AA A 38.4 Credit Support Portfolio 36% 25% 17% 28.0 Market 37% 25% 19% 21.0 18.0 15.7 17.6 16.3 15.8 17.2 WARF 11.5 11.8 11.5 Portfolio 2,770 2,822 2,735 Market 2,800 2,817 2,837 Diversity Score AAA AA A Portfolio 77 77 79 Base Case NAIC stress GFC Break Point Market 77 75 75 CDR at Break Point 54.7% 27.8% 17.2% WAPx CDR at Base Case 4.5% 4.5% 4.5% Portfolio 76.85 79.47 79.35 CDR at GFC 5.8% 5.8% 5.8% Market 78.96 78.86 78.87 CNO Financial Group | First Quarter 2020 Earnings | May 5, 2020 27
Appendix 2: Financial Exhibits • Non-GAAP Financial Measures Slides 29-41 CNO Financial Group | First Quarter 2020 Earnings | May 5, 2020 28

4Q19 Significant Items The table below summarizes the financial impact of significant items on our 4Q19 net operating income. Management believes that identifying the impact of these items enhances the understanding of our operating results. (dollars in millions, except per-share amounts) Three months ended December 31, 2019 Excluding significant Actual results Significant items items Insurance product margin Annuity$ 60.5 $ 0.3 (1) $ 60.8 Health 79.0 - 79.0 Life 46.7 9.7 (1) 56.4 Long-term care 14.0 14.0 Total insurance product margin 200.2 10.0 210.2 Allocated expenses (140.6) - (140.6) Income from insurance products 59.6 10.0 69.6 Fee income 11.7 - 11.7 Investment income not allocated to product lines 26.2 - 26.2 Expenses not allocated to product lines 2.8 (20.0) (2) (17.2) Operating earnings before taxes 100.3 (10.0) 90.3 Income tax expense on operating income (21.7) 2.1 (19.6) Net operating income (3)$ 78.6 $ (7.9) $ 70.7 Net operating income per diluted share (3)$ 0.52 $ (0.05) $ 0.47 (1) Adjustments arising from our comprehensive annual actuarial review of assumptions. (2) $20.0 million of the net favorable impact from legal and regulatory matters. (3) A non-GAAP measure. See pages 30 and 32 for a reconciliation to the corresponding GAAP measure. CNO Financial Group | First Quarter 2020 Earnings | May 5, 2020 29
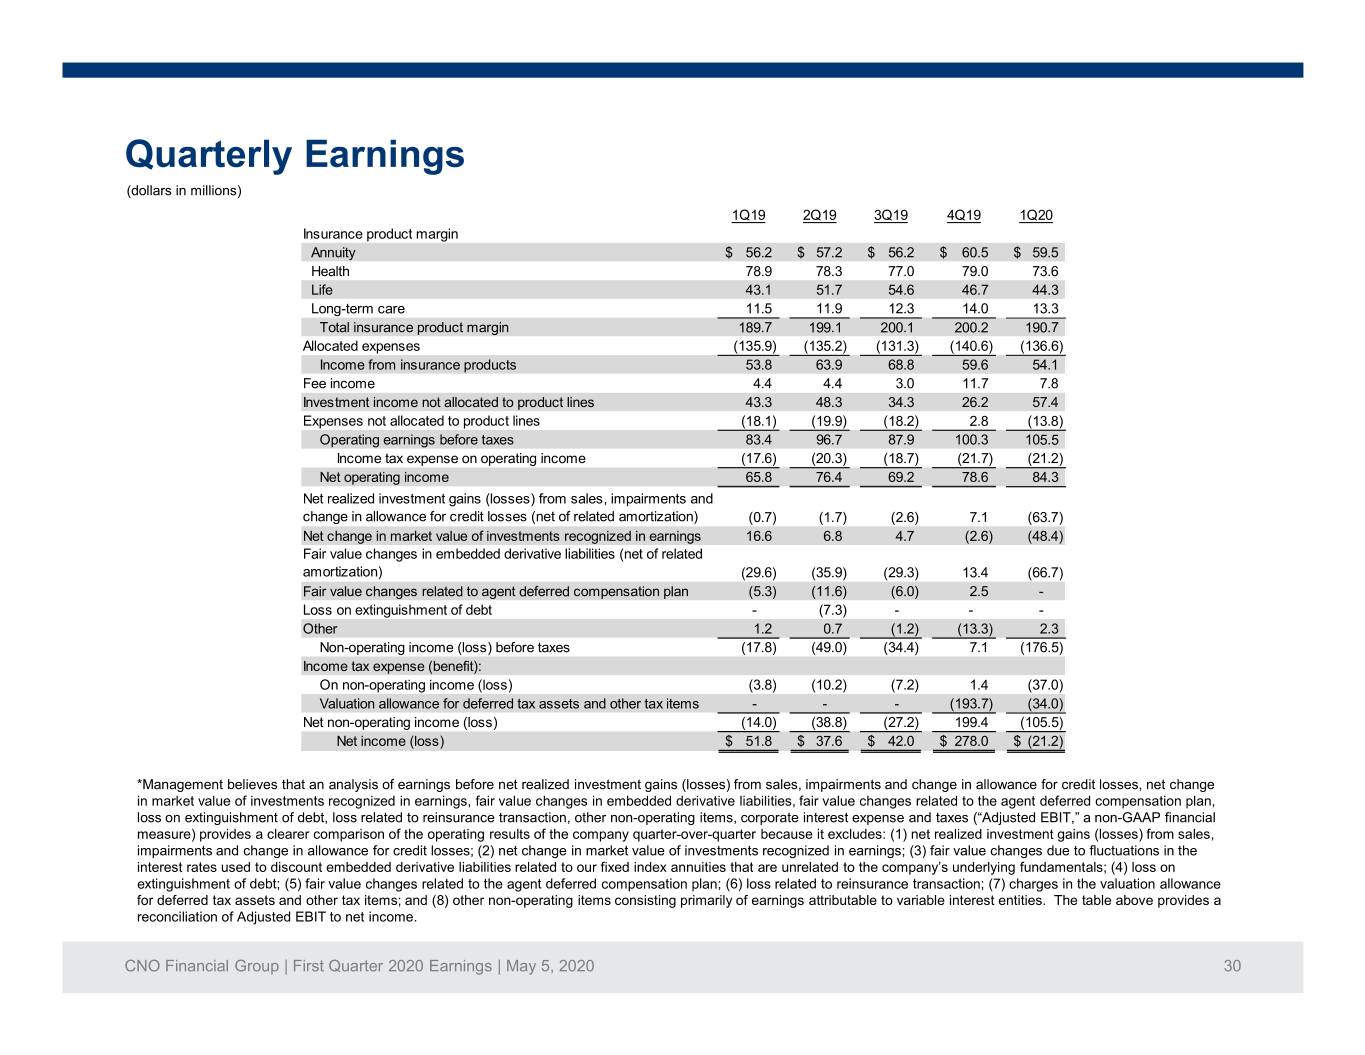
Quarterly Earnings (dollars in millions) 1Q19 2Q19 3Q19 4Q19 1Q20 Insurance product margin Annuity$ 56.2 $ 57.2 $ 56.2 $ 60.5 $ 59.5 Health 78.9 78.3 77.0 79.0 73.6 Life 43.1 51.7 54.6 46.7 44.3 Long-term care 11.5 11.9 12.3 14.0 13.3 Total insurance product margin 189.7 199.1 200.1 200.2 190.7 Allocated expenses (135.9) (135.2) (131.3) (140.6) (136.6) Income from insurance products 53.8 63.9 68.8 59.6 54.1 Fee income 4.4 4.4 3.0 11.7 7.8 Investment income not allocated to product lines 43.3 48.3 34.3 26.2 57.4 Expenses not allocated to product lines (18.1) (19.9) (18.2) 2.8 (13.8) Operating earnings before taxes 83.4 96.7 87.9 100.3 105.5 Income tax expense on operating income (17.6) (20.3) (18.7) (21.7) (21.2) Net operating income 65.8 76.4 69.2 78.6 84.3 Net realized investment gains (losses) from sales, impairments and change in allowance for credit losses (net of related amortization) (0.7) (1.7) (2.6) 7.1 (63.7) Net change in market value of investments recognized in earnings 16.6 6.8 4.7 (2.6) (48.4) Fair value changes in embedded derivative liabilities (net of related amortization) (29.6) (35.9) (29.3) 13.4 (66.7) Fair value changes related to agent deferred compensation plan (5.3) (11.6) (6.0) 2.5 - Loss on extinguishment of debt - (7.3) - - - Other 1.2 0.7 (1.2) (13.3) 2.3 Non-operating income (loss) before taxes (17.8) (49.0) (34.4) 7.1 (176.5) Income tax expense (benefit): On non-operating income (loss) (3.8) (10.2) (7.2) 1.4 (37.0) Valuation allowance for deferred tax assets and other tax items - - - (193.7) (34.0) Net non-operating income (loss) (14.0) (38.8) (27.2) 199.4 (105.5) Net income (loss)$ 51.8 $ 37.6 $ 42.0 $ 278.0 $ (21.2) *Management believes that an analysis of earnings before net realized investment gains (losses) from sales, impairments and change in allowance for credit losses, net change in market value of investments recognized in earnings, fair value changes in embedded derivative liabilities, fair value changes related to the agent deferred compensation plan, loss on extinguishment of debt, loss related to reinsurance transaction, other non-operating items, corporate interest expense and taxes (“Adjusted EBIT,” a non-GAAP financial measure) provides a clearer comparison of the operating results of the company quarter-over-quarter because it excludes: (1) net realized investment gains (losses) from sales, impairments and change in allowance for credit losses; (2) net change in market value of investments recognized in earnings; (3) fair value changes due to fluctuations in the interest rates used to discount embedded derivative liabilities related to our fixed index annuities that are unrelated to the company’s underlying fundamentals; (4) loss on extinguishment of debt; (5) fair value changes related to the agent deferred compensation plan; (6) loss related to reinsurance transaction; (7) charges in the valuation allowance for deferred tax assets and other tax items; and (8) other non-operating items consisting primarily of earnings attributable to variable interest entities. The table above provides a reconciliation of Adjusted EBIT to net income. CNO Financial Group | First Quarter 2020 Earnings | May 5, 2020 30
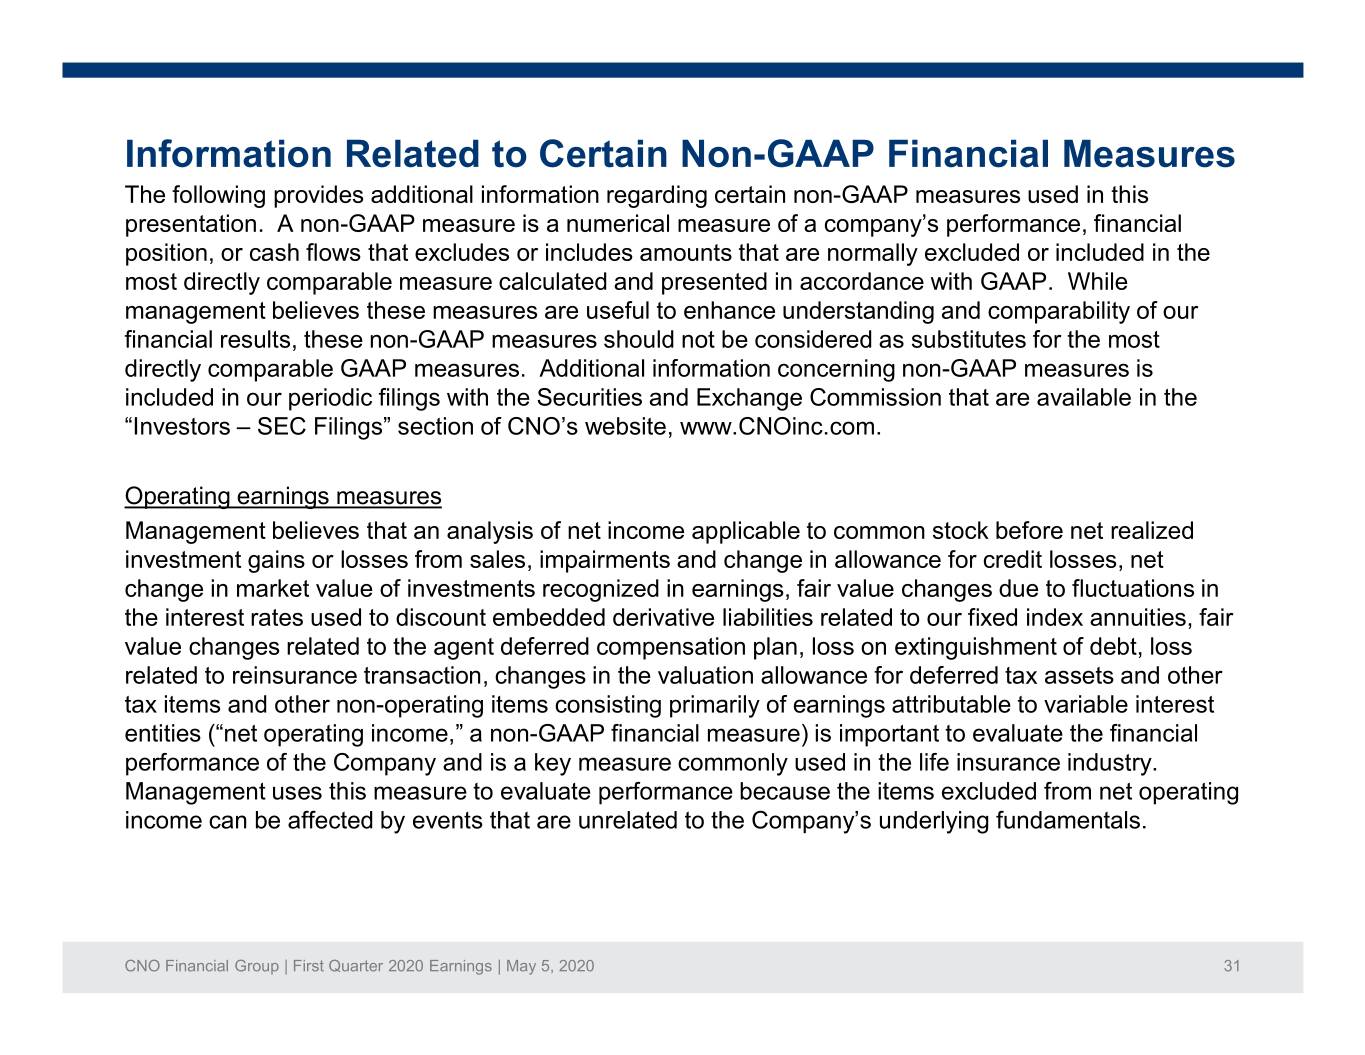
Information Related to Certain Non-GAAP Financial Measures The following provides additional information regarding certain non-GAAP measures used in this presentation. A non-GAAP measure is a numerical measure of a company’s performance, financial position, or cash flows that excludes or includes amounts that are normally excluded or included in the most directly comparable measure calculated and presented in accordance with GAAP. While management believes these measures are useful to enhance understanding and comparability of our financial results, these non-GAAP measures should not be considered as substitutes for the most directly comparable GAAP measures. Additional information concerning non-GAAP measures is included in our periodic filings with the Securities and Exchange Commission that are available in the “Investors – SEC Filings” section of CNO’s website, www.CNOinc.com. Operating earnings measures Management believes that an analysis of net income applicable to common stock before net realized investment gains or losses from sales, impairments and change in allowance for credit losses, net change in market value of investments recognized in earnings, fair value changes due to fluctuations in the interest rates used to discount embedded derivative liabilities related to our fixed index annuities, fair value changes related to the agent deferred compensation plan, loss on extinguishment of debt, loss related to reinsurance transaction, changes in the valuation allowance for deferred tax assets and other tax items and other non-operating items consisting primarily of earnings attributable to variable interest entities (“net operating income,” a non-GAAP financial measure) is important to evaluate the financial performance of the Company and is a key measure commonly used in the life insurance industry. Management uses this measure to evaluate performance because the items excluded from net operating income can be affected by events that are unrelated to the Company’s underlying fundamentals. CNO Financial Group | First Quarter 2020 Earnings | May 5, 2020 31
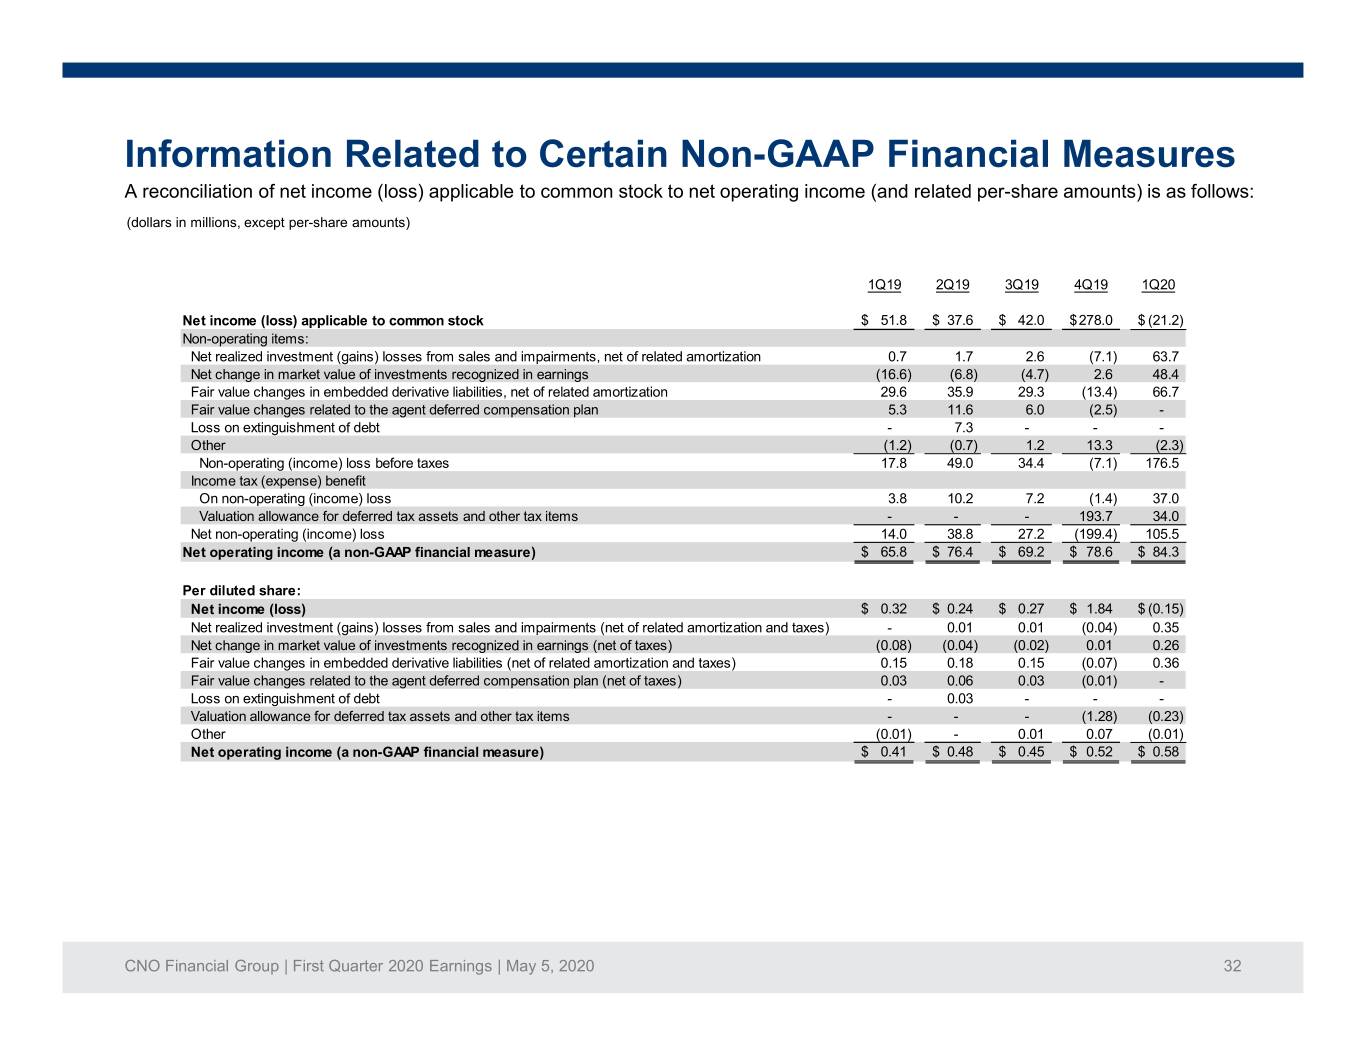
Information Related to Certain Non-GAAP Financial Measures A reconciliation of net income (loss) applicable to common stock to net operating income (and related per-share amounts) is as follows: (dollars in millions, except per-share amounts) 1Q19 2Q19 3Q19 4Q19 1Q20 Net income (loss) applicable to common stock $ 51.8 $ 37.6 $ 42.0 $ 278.0 $ (21.2) Non-operating items: Net realized investment (gains) losses from sales and impairments, net of related amortization 0.7 1.7 2.6 (7.1) 63.7 Net change in market value of investments recognized in earnings (16.6) (6.8) (4.7) 2.6 48.4 Fair value changes in embedded derivative liabilities, net of related amortization 29.6 35.9 29.3 (13.4) 66.7 Fair value changes related to the agent deferred compensation plan 5.3 11.6 6.0 (2.5) - Loss on extinguishment of debt - 7.3 - - - Other (1.2) (0.7) 1.2 13.3 (2.3) Non-operating (income) loss before taxes 17.8 49.0 34.4 (7.1) 176.5 Income tax (expense) benefit On non-operating (income) loss 3.8 10.2 7.2 (1.4) 37.0 Valuation allowance for deferred tax assets and other tax items - - - 193.7 34.0 Net non-operating (income) loss 14.0 38.8 27.2 (199.4) 105.5 Net operating income (a non-GAAP financial measure) $ 65.8 $ 76.4 $ 69.2 $ 78.6 $ 84.3 Per diluted share: Net income (loss) $ 0.32 $ 0.24 $ 0.27 $ 1.84 $ (0.15) Net realized investment (gains) losses from sales and impairments (net of related amortization and taxes) - 0.01 0.01 (0.04) 0.35 Net change in market value of investments recognized in earnings (net of taxes) (0.08) (0.04) (0.02) 0.01 0.26 Fair value changes in embedded derivative liabilities (net of related amortization and taxes) 0.15 0.18 0.15 (0.07) 0.36 Fair value changes related to the agent deferred compensation plan (net of taxes) 0.03 0.06 0.03 (0.01) - Loss on extinguishment of debt - 0.03 - - - Valuation allowance for deferred tax assets and other tax items - - - (1.28) (0.23) Other (0.01) - 0.01 0.07 (0.01) Net operating income (a non-GAAP financial measure) $ 0.41 $ 0.48 $ 0.45 $ 0.52 $ 0.58 CNO Financial Group | First Quarter 2020 Earnings | May 5, 2020 32

Information Related to Certain Non-GAAP Financial Measures A reconciliation of operating income and shares used to calculate basic and diluted operating earnings per share is as follows: (dollars in millions, except per-share amounts, and shares in thousands) 1Q19 2Q19 3Q19 4Q19 1Q20 (a) Operating income$ 65.8 $ 76.4 $ 69.2 $ 78.6 $ 84.3 Weighted average shares outstanding for basic earnings per share 160,948 158,816 154,257 150,138 145,829 Effect of dilutive securities on weighted average shares: Stock options, restricted stock and performance units 1,241 919 1,003 1,271 - Weighted average shares outstanding for diluted earnings per share 162,189 159,735 155,260 151,409 145,829 Net operating income per diluted share$ 0.41 $ 0.48 $ 0.45 $ 0.52 $ 0.58 (a) Equivalent common shares of 768 were not included in the diluted weighted average shares outstanding due to the net less recognized in 1Q20. CNO Financial Group | First Quarter 2020 Earnings | May 5, 2020 33

Information Related to Certain Non-GAAP Financial Measures Book value per diluted share Book value per diluted share reflects the potential dilution that could occur if outstanding stock options were exercised, restricted stock and performance units were vested and convertible securities were converted. The dilution from options, restricted shares and performance units is calculated using the treasury stock method. Under this method, we assume the proceeds from the exercise of the options (or the unrecognized compensation expense with respect to restricted stock and performance units) will be used to purchase shares of our common stock at the closing market price on the last day of the period. In addition, the calculation of this non-GAAP measure differs from the corresponding GAAP measure because accumulated other comprehensive income (loss) has been excluded from the value of capital used to determine this measure. Management believes this non-GAAP measure is useful because it removes the volatility that arises from changes in the unrealized appreciation (depreciation) of our investments. A reconciliation from book value per share to book value per diluted share, excluding accumulated other comprehensive income (loss) is as follows: (dollars in millions, except per-share amounts) 1Q19 2Q19 3Q19 4Q19 1Q20 Total shareholders' equity$ 3,837.9 $ 4,252.2 $ 4,553.3 $ 4,677.0 $ 3,765.8 Shares outstanding for the period 159,955,172 156,768,002 152,183,491 148,084,178 143,610,046 Book value per share$ 23.99 $ 27.12 $ 29.92 $ 31.58 $ 26.22 Total shareholders' equity$ 3,837.9 $ 4,252.2 $ 4,553.3 $ 4,677.0 $ 3,765.8 Less accumulated other comprehensive income (654.9) (1,098.2) (1,442.9) (1,372.5) (595.2) Adjusted shareholders' equity excluding AOCI$ 3,183.0 $ 3,154.0 $ 3,110.4 $ 3,304.5 $ 3,170.6 Shares outstanding for the period 159,955,172 156,768,002 152,183,491 148,084,178 143,610,046 Dilutive common stock equivalents related to: Stock options, restricted stock and performance units 1,168,027 894,456 1,059,278 1,496,546 326,110 Diluted shares outstanding 161,123,199 157,662,458 153,242,769 149,580,724 143,936,156 Book value per diluted share (a non-GAAP measure)$ 19.76 $ 20.00 $ 20.30 $ 22.09 $ 22.03 CNO Financial Group | First Quarter 2020 Earnings | May 5, 2020 34
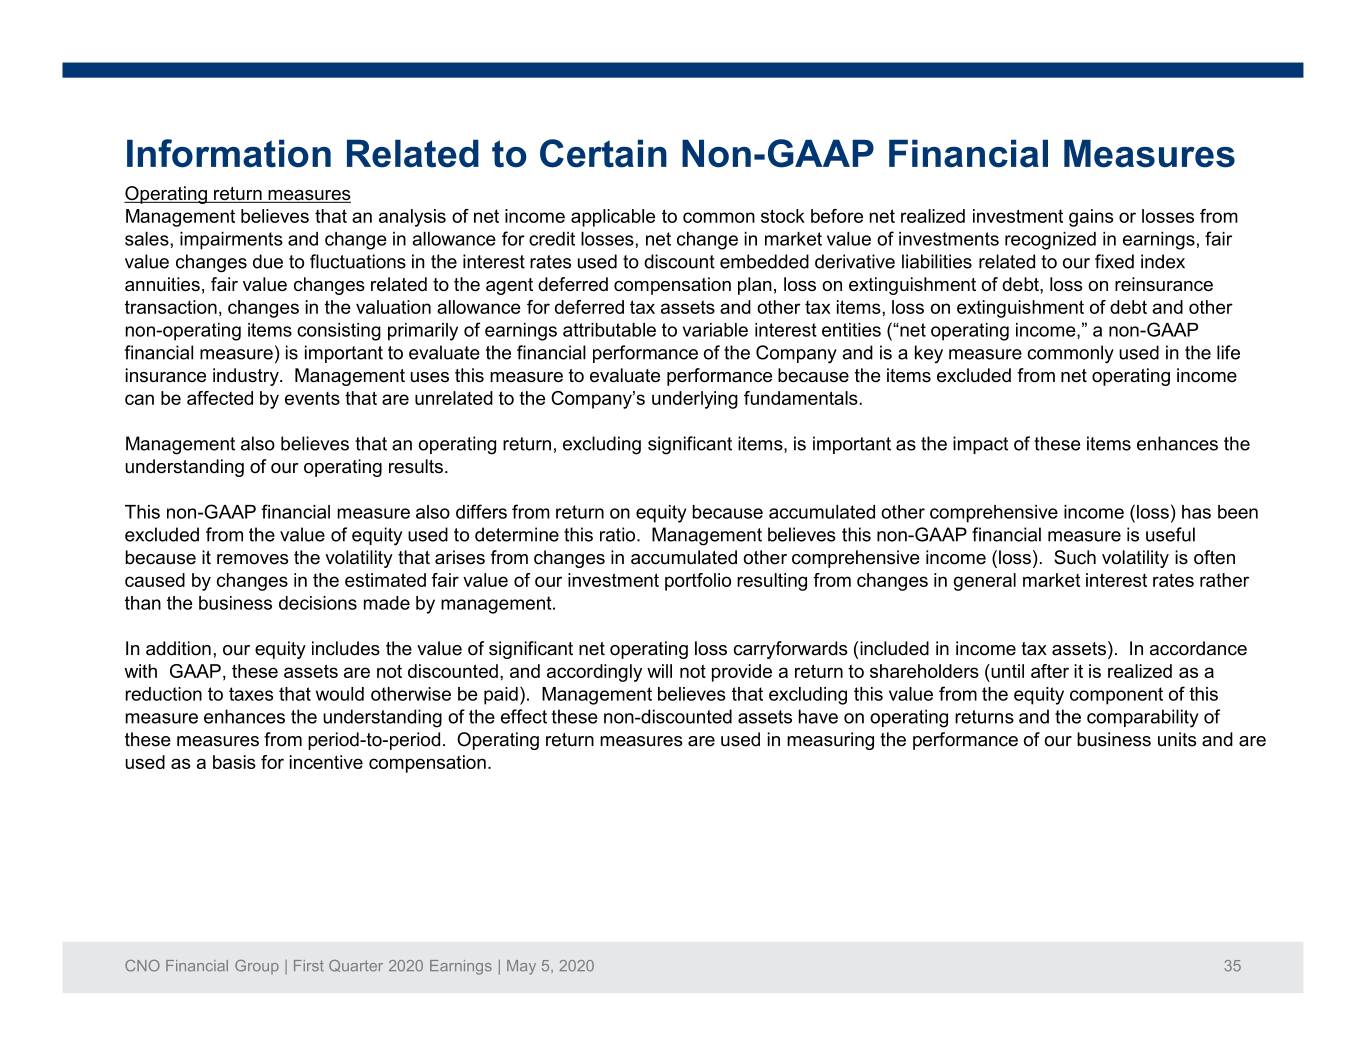
Information Related to Certain Non-GAAP Financial Measures Operating return measures Management believes that an analysis of net income applicable to common stock before net realized investment gains or losses from sales, impairments and change in allowance for credit losses, net change in market value of investments recognized in earnings, fair value changes due to fluctuations in the interest rates used to discount embedded derivative liabilities related to our fixed index annuities, fair value changes related to the agent deferred compensation plan, loss on extinguishment of debt, loss on reinsurance transaction, changes in the valuation allowance for deferred tax assets and other tax items, loss on extinguishment of debt and other non-operating items consisting primarily of earnings attributable to variable interest entities (“net operating income,” a non-GAAP financial measure) is important to evaluate the financial performance of the Company and is a key measure commonly used in the life insurance industry. Management uses this measure to evaluate performance because the items excluded from net operating income can be affected by events that are unrelated to the Company’s underlying fundamentals. Management also believes that an operating return, excluding significant items, is important as the impact of these items enhances the understanding of our operating results. This non-GAAP financial measure also differs from return on equity because accumulated other comprehensive income (loss) has been excluded from the value of equity used to determine this ratio. Management believes this non-GAAP financial measure is useful because it removes the volatility that arises from changes in accumulated other comprehensive income (loss). Such volatility is often caused by changes in the estimated fair value of our investment portfolio resulting from changes in general market interest rates rather than the business decisions made by management. In addition, our equity includes the value of significant net operating loss carryforwards (included in income tax assets). In accordance with GAAP, these assets are not discounted, and accordingly will not provide a return to shareholders (until after it is realized as a reduction to taxes that would otherwise be paid). Management believes that excluding this value from the equity component of this measure enhances the understanding of the effect these non-discounted assets have on operating returns and the comparability of these measures from period-to-period. Operating return measures are used in measuring the performance of our business units and are used as a basis for incentive compensation. CNO Financial Group | First Quarter 2020 Earnings | May 5, 2020 35

Information Related to Certain Non-GAAP Financial Measures The calculations of: (i) operating return on equity, excluding accumulated other comprehensive income (loss) and net operating loss carryforwards (a non-GAAP financial measure); (ii) operating return, excluding significant item, on equity, excluding accumulated other comprehensive income (loss) and net operating loss carryforwards (a non-GAAP financial measure); and (iii) return on equity are as follows: (dollars in millions) Trailing Twelve Months Ended 1Q19 2Q19 3Q19 4Q19 1Q20 Operating income$ 295.0 $ 289.5 $ 271.2 $ 290.0 $ 308.5 Operating income, excluding significant items$ 310.1 $ 304.6 $ 286.3 $ 282.1 $ 300.6 Net income (loss)$ (347.5) $ (412.1) $ 159.7 $ 409.4 $ 336.4 Average common equity, excluding accumulated other comprehensive income (loss) and net operating loss carryforwards (a non-GAAP financial measure) $ 2,942.5 $ 2,782.7 $ 2,697.2 $ 2,703.9 $ 2,713.0 Avearge common shareholders' equity$ 3,918.3 $ 3,795.6 $ 3,886.9 $ 4,166.8 $ 4,321.1 Operating return on equity, excluding accumulated other comprehensive income (loss) and net operating loss carryforwards (a non-GAAP financial measure) 10.0% 10.4% 10.1% 10.7% 11.4% Operating return, excluding significant items, on equity, excluding accumulated other comprehensive income (loss) and net operating loss carryforwards (a non-GAAP financial measure) 10.5% 10.9% 10.6% 10.4% 11.1% Return on equity -8.9% -10.9% 4.1% 9.8% 7.8% (Continued on next page) CNO Financial Group | First Quarter 2020 Earnings | May 5, 2020 36
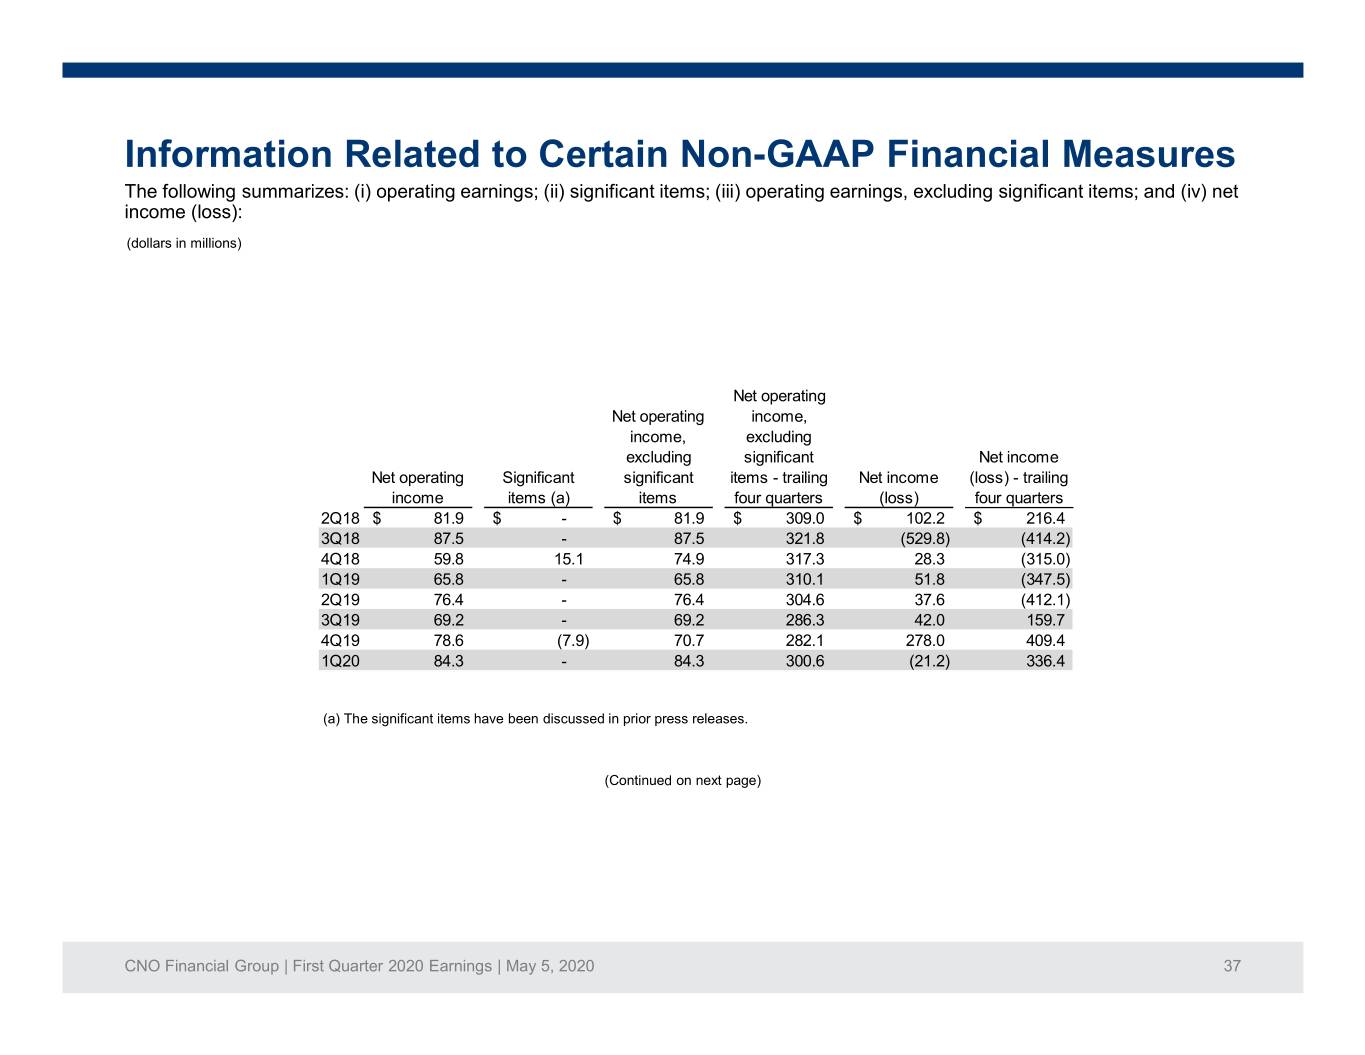
Information Related to Certain Non-GAAP Financial Measures The following summarizes: (i) operating earnings; (ii) significant items; (iii) operating earnings, excluding significant items; and (iv) net income (loss): (dollars in millions) Net operating Net operating income, income, excluding excluding significant Net income Net operating Significant significant items - trailing Net income (loss) - trailing income items (a) items four quarters (loss) four quarters 2Q18$ 81.9 $ - $ 81.9 $ 309.0 $ 102.2 $ 216.4 3Q18 87.5 - 87.5 321.8 (529.8) (414.2) 4Q18 59.8 15.1 74.9 317.3 28.3 (315.0) 1Q19 65.8 - 65.8 310.1 51.8 (347.5) 2Q19 76.4 - 76.4 304.6 37.6 (412.1) 3Q19 69.2 - 69.2 286.3 42.0 159.7 4Q19 78.6 (7.9) 70.7 282.1 278.0 409.4 1Q20 84.3 - 84.3 300.6 (21.2) 336.4 (a) The significant items have been discussed in prior press releases. (Continued on next page) CNO Financial Group | First Quarter 2020 Earnings | May 5, 2020 37
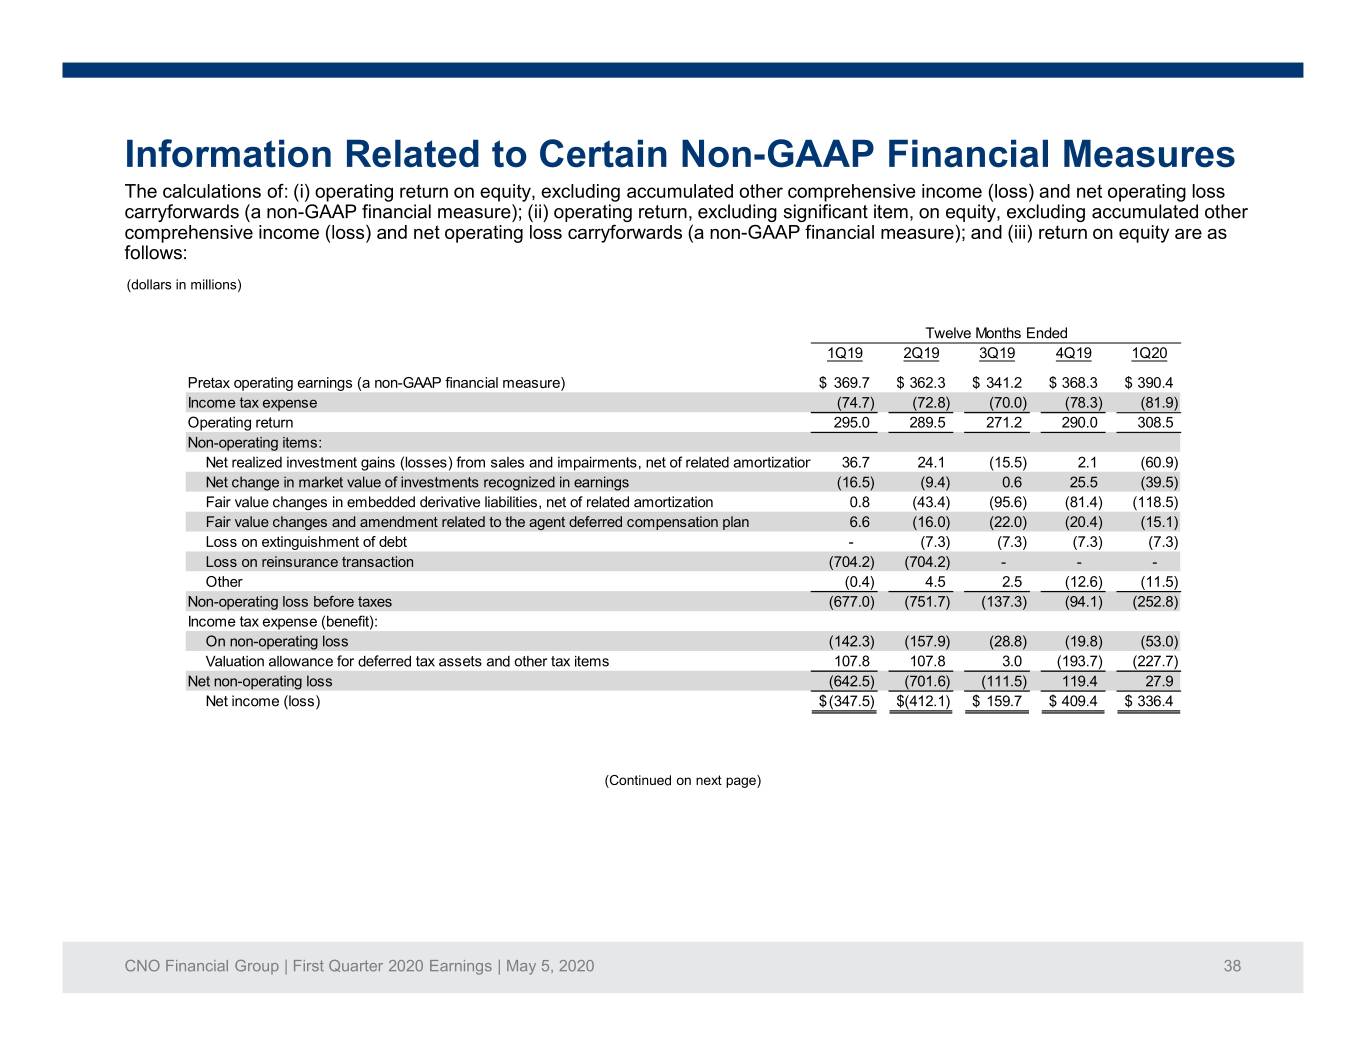
Information Related to Certain Non-GAAP Financial Measures The calculations of: (i) operating return on equity, excluding accumulated other comprehensive income (loss) and net operating loss carryforwards (a non-GAAP financial measure); (ii) operating return, excluding significant item, on equity, excluding accumulated other comprehensive income (loss) and net operating loss carryforwards (a non-GAAP financial measure); and (iii) return on equity are as follows: (dollars in millions) Twelve Months Ended 1Q19 2Q19 3Q19 4Q19 1Q20 Pretax operating earnings (a non-GAAP financial measure)$ 369.7 $ 362.3 $ 341.2 $ 368.3 $ 390.4 Income tax expense (74.7) (72.8) (70.0) (78.3) (81.9) Operating return 295.0 289.5 271.2 290.0 308.5 Non-operating items: Net realized investment gains (losses) from sales and impairments, net of related amortization 36.7 24.1 (15.5) 2.1 (60.9) Net change in market value of investments recognized in earnings (16.5) (9.4) 0.6 25.5 (39.5) Fair value changes in embedded derivative liabilities, net of related amortization 0.8 (43.4) (95.6) (81.4) (118.5) Fair value changes and amendment related to the agent deferred compensation plan 6.6 (16.0) (22.0) (20.4) (15.1) Loss on extinguishment of debt - (7.3) (7.3) (7.3) (7.3) Loss on reinsurance transaction (704.2) (704.2) - - - Other (0.4) 4.5 2.5 (12.6) (11.5) Non-operating loss before taxes (677.0) (751.7) (137.3) (94.1) (252.8) Income tax expense (benefit): On non-operating loss (142.3) (157.9) (28.8) (19.8) (53.0) Valuation allowance for deferred tax assets and other tax items 107.8 107.8 3.0 (193.7) (227.7) Net non-operating loss (642.5) (701.6) (111.5) 119.4 27.9 Net income (loss)$ (347.5) $ (412.1) $ 159.7 $ 409.4 $ 336.4 (Continued on next page) CNO Financial Group | First Quarter 2020 Earnings | May 5, 2020 38
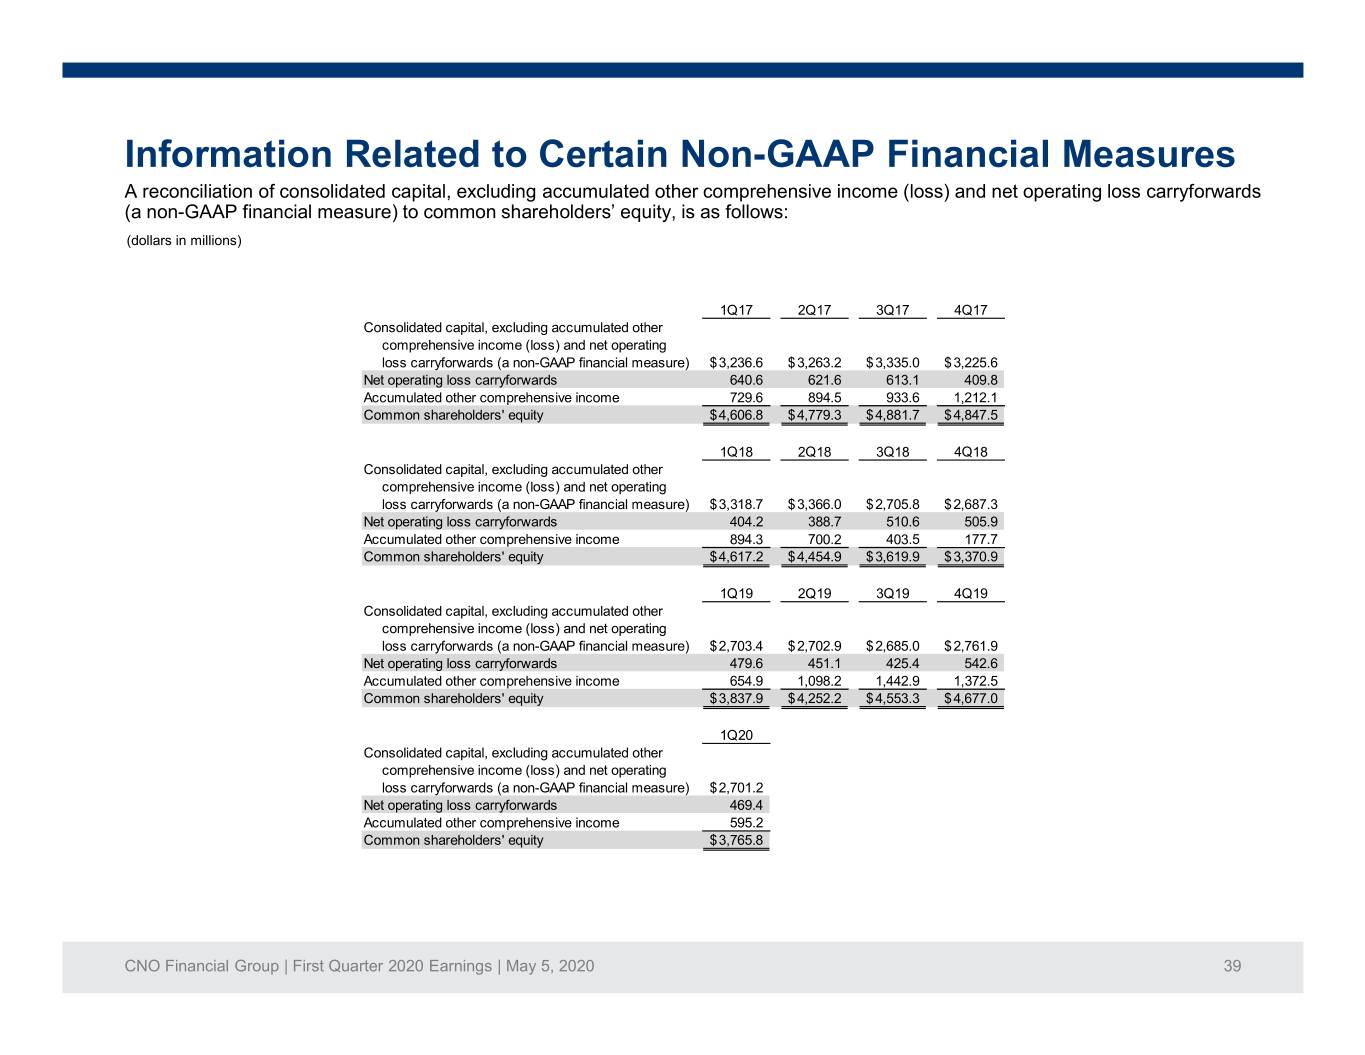
Information Related to Certain Non-GAAP Financial Measures A reconciliation of consolidated capital, excluding accumulated other comprehensive income (loss) and net operating loss carryforwards (a non-GAAP financial measure) to common shareholders’ equity, is as follows: (dollars in millions) 1Q17 2Q17 3Q17 4Q17 Consolidated capital, excluding accumulated other comprehensive income (loss) and net operating loss carryforwards (a non-GAAP financial measure)$ 3,236.6 $ 3,263.2 $ 3,335.0 $ 3,225.6 Net operating loss carryforwards 640.6 621.6 613.1 409.8 Accumulated other comprehensive income 729.6 894.5 933.6 1,212.1 Common shareholders' equity$ 4,606.8 $ 4,779.3 $ 4,881.7 $ 4,847.5 1Q18 2Q18 3Q18 4Q18 Consolidated capital, excluding accumulated other comprehensive income (loss) and net operating loss carryforwards (a non-GAAP financial measure)$ 3,318.7 $ 3,366.0 $ 2,705.8 $ 2,687.3 Net operating loss carryforwards 404.2 388.7 510.6 505.9 Accumulated other comprehensive income 894.3 700.2 403.5 177.7 Common shareholders' equity$ 4,617.2 $ 4,454.9 $ 3,619.9 $ 3,370.9 1Q19 2Q19 3Q19 4Q19 Consolidated capital, excluding accumulated other comprehensive income (loss) and net operating loss carryforwards (a non-GAAP financial measure)$ 2,703.4 $ 2,702.9 $ 2,685.0 $ 2,761.9 Net operating loss carryforwards 479.6 451.1 425.4 542.6 Accumulated other comprehensive income 654.9 1,098.2 1,442.9 1,372.5 Common shareholders' equity$ 3,837.9 $ 4,252.2 $ 4,553.3 $ 4,677.0 1Q20 Consolidated capital, excluding accumulated other comprehensive income (loss) and net operating loss carryforwards (a non-GAAP financial measure)$ 2,701.2 Net operating loss carryforwards 469.4 Accumulated other comprehensive income 595.2 Common shareholders' equity$ 3,765.8 CNO Financial Group | First Quarter 2020 Earnings | May 5, 2020 39
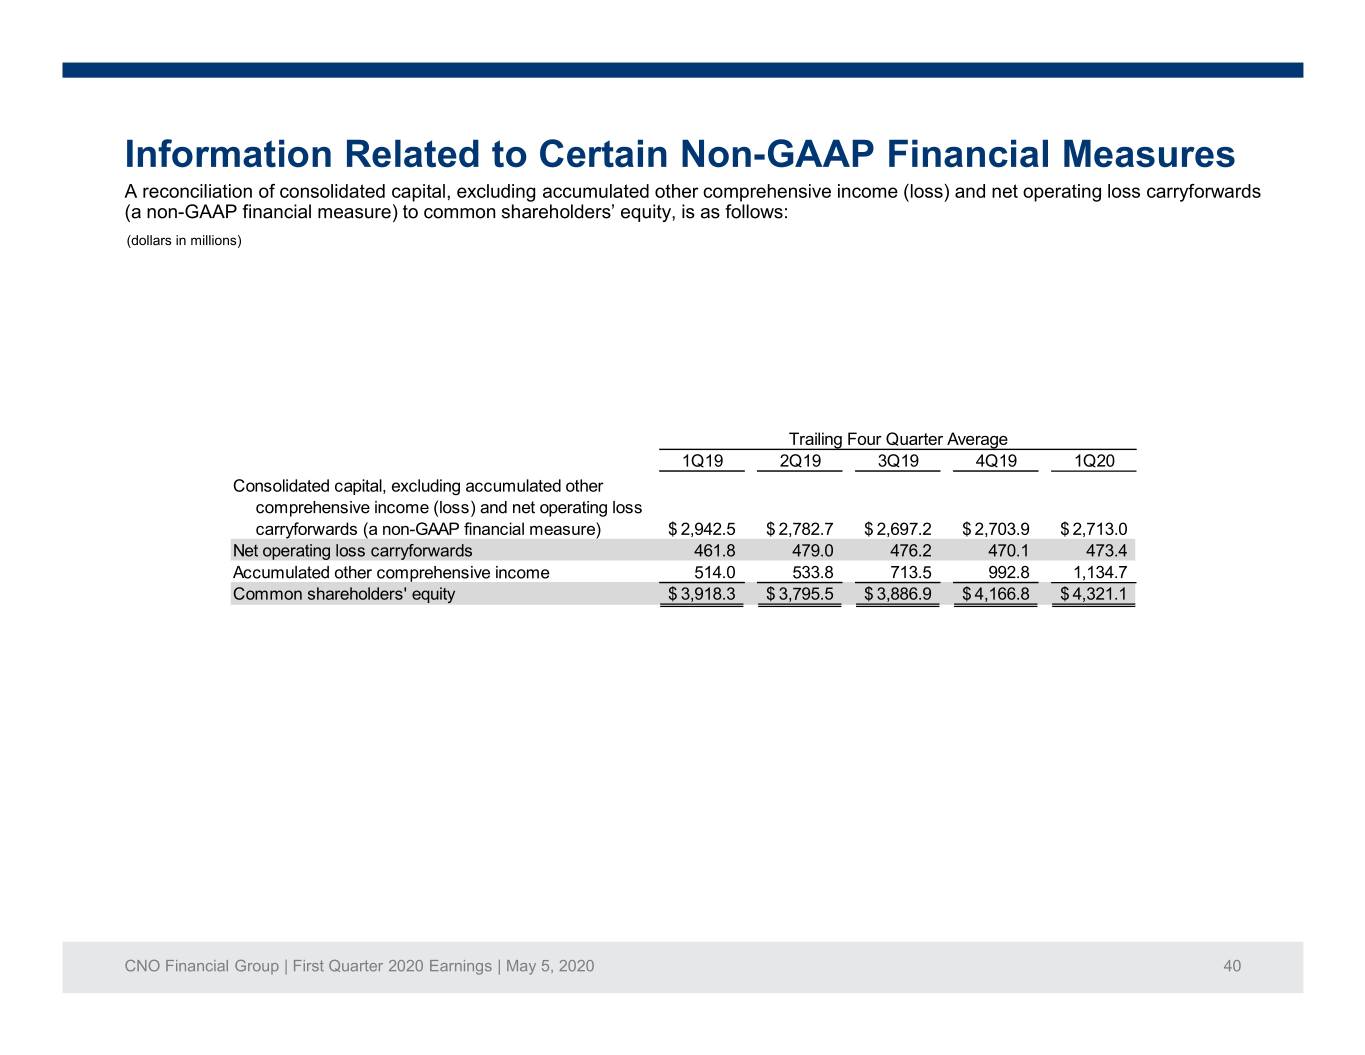
Information Related to Certain Non-GAAP Financial Measures A reconciliation of consolidated capital, excluding accumulated other comprehensive income (loss) and net operating loss carryforwards (a non-GAAP financial measure) to common shareholders’ equity, is as follows: (dollars in millions) Trailing Four Quarter Average 1Q19 2Q19 3Q19 4Q19 1Q20 Consolidated capital, excluding accumulated other comprehensive income (loss) and net operating loss carryforwards (a non-GAAP financial measure)$ 2,942.5 $ 2,782.7 $ 2,697.2 $ 2,703.9 $ 2,713.0 Net operating loss carryforwards 461.8 479.0 476.2 470.1 473.4 Accumulated other comprehensive income 514.0 533.8 713.5 992.8 1,134.7 Common shareholders' equity$ 3,918.3 $ 3,795.5 $ 3,886.9 $ 4,166.8 $ 4,321.1 CNO Financial Group | First Quarter 2020 Earnings | May 5, 2020 40

Information Related to Certain Non-GAAP Financial Measures Debt to capital ratio, excluding accumulated other comprehensive income (loss) The debt to capital ratio, excluding accumulated other comprehensive income (loss), differs from the debt to capital ratio because accumulated other comprehensive income (loss) has been excluded from the value of capital used to determine this measure. Management believes this non-GAAP financial measure is useful because it removes the volatility that arises from changes in accumulated other comprehensive income (loss). Such volatility is often caused by changes in the estimated fair value of our investment portfolio resulting from changes in general market interest rates rather than the business decisions made by management. A reconciliation of these ratios is as follows: (dollars in millions) 1Q19 2Q19 3Q19 4Q19 1Q20 Corporate notes payable$ 917.3 $ 988.3 $ 988.7 $ 989.1 $ 989.4 Total shareholders' equity 3,837.9 4,252.2 4,553.3 4,677.0 3,765.8 Total capital$ 4,755.2 $ 5,240.5 $ 5,542.0 $ 5,666.1 $ 4,755.2 Corporate debt to capital 19.3% 18.9% 17.8% 17.5% 20.8% Corporate notes payable$ 917.3 $ 988.3 $ 988.7 $ 989.1 $ 989.4 Total shareholders' equity 3,837.9 4,252.2 4,553.3 4,677.0 3,765.8 Less accumulated other comprehensive income (654.9) (1,098.2) (1,442.9) (1,372.5) (595.2) Total capital$ 4,100.3 $ 4,142.3 $ 4,099.1 $ 4,293.6 $ 4,160.0 Debt to total capital ratio, excluding AOCI (a non-GAAP financial measure) 22.4% 23.9% 24.1% 23.0% 23.8% CNO Financial Group | First Quarter 2020 Earnings | May 5, 2020 41


