UNITED STATES
SECURITIES AND EXCHANGE COMMISSION
Washington, D.C. 20549
__________________________________________________________________
Form 10-K
_____________________________________________________
(Mark One)
☒ ANNUAL REPORT PURSUANT TO SECTION 13 OR 15(d) OF THE SECURITIES EXCHANGE ACT OF 1934
For the fiscal year ended December 31, 2021
OR
☐ TRANSITION REPORT PURSUANT TO SECTION 13 OR 15(d) OF THE SECURITIES EXCHANGE ACT OF 1934
For the transition period from to
001-35061
(Commission File No.)
__________________________________________________
NeoPhotonics Corporation
(Exact name of Registrant as specified in its charter)
_______________________________________________________________
| | | | | | | | |
| Delaware | | 94-3253730 |
(State or other jurisdiction
of incorporation or organization) | | (I.R.S. Employer
Identification No.) |
3081 Zanker Road
San Jose, California 95134
(Address of principal executive offices, zip code)
Registrant’s telephone number, including area code:
+1 (408) 232-9200
Securities registered pursuant to Section 12(b) of the Act:
| | | | | | | | |
| Title of Each Class | Trading symbol: | Name of Exchange on Which Registered |
| Common Stock, par value $0.0025 per share | NPTN | New York Stock Exchange |
Securities registered pursuant to Section 12(g) of the Act:
None
___________________________________________________________
Indicate by check mark if the Registrant is a well-known seasoned issuer, as defined in Rule 405 of the Securities Act of 1933. Yes ☐ No ☒
Indicate by check mark if the Registrant is not required to file reports pursuant to Section 13 or Section 15(d) of the Act. Yes ☐ No ☒
Indicate by check mark whether the Registrant (1) has filed all reports required to be filed by Section 13 or 15(d) of the Exchange Act of 1934 during the preceding 12 months (or for such shorter period that the Registrant was required to file such reports), and (2) has been subject to such filing requirements for the past 90 days. Yes ☒ No ☐
Indicate by check mark whether the Registrant has submitted electronically every Interactive Data File required to be submitted pursuant to Rule 405 of Regulation S-T (§ 232.405 of this chapter) during the preceding 12 months (or for such shorter period that the Registrant was required to submit such files). Yes ☒ No ☐
Indicate by check mark whether the registrant is a large accelerated filer, an accelerated filer, a non-accelerated filer, a smaller reporting company, or an emerging growth company. See the definitions of “large accelerated filer,” “accelerated filer,” “smaller reporting company,” and "emerging growth company" in Rule 12b-2 of the Exchange Act.
| | | | | | | | | | | | | | | | | | | | |
| Large accelerated filer | | ☐ | | Accelerated filer | | ☒ |
| Non-accelerated filer | | ☐ | | Small reporting company | | ☐ |
| Emerging growth company | | ☐ | | | | |
If an emerging growth company, indicate by check mark if the registrant has elected not to use the extended transition period for complying with any new or revised financial accounting standards provided pursuant to Section 13(a) of the Exchange Act. ☐
Indicate by check mark whether the registrant has filed a report on and attestation to its management’s assessment of the effectiveness of its internal control over financial reporting under Section 404(b) of the Sarbanes-Oxley Act (15 U.S.C. 7262(b)) by the registered public accounting firm that prepared or issued its audit report. [Yes ☒ No ☐]
Indicate by check mark whether the Registrant is a shell company (as defined in Rule 12b-2 of the Act). Yes ☐ No ☒
As of June 30, 2021, the approximate aggregate market value of voting stock held by non-affiliates of the Registrant, based upon the last sale price of the Registrant’s common stock on the last business day of the Registrant’s most recently completed second fiscal quarter, June 30, 2021 (based upon the closing sale price of the Registrant’s common stock on the New York Stock Exchange), was approximately $516,380,000. This calculation excludes 1,504,525 shares held by directors, executive officers and stockholders affiliated with our directors and executive officers.
As of February 18, 2022, the Registrant had 53,128,218 outstanding shares of Common Stock.
__________________________________________________
DOCUMENTS INCORPORATED BY REFERENCE
The Registrant has incorporated by reference into Part III of this Annual Report on Form 10-K portions of its Proxy Statement for its 2022 Annual Meeting of Stockholders to be filed pursuant to Regulation 14A. The Proxy Statement will be filed within 120 days of Registrant’s fiscal year ended December 31, 2021.
NEOPHOTONICS CORPORATION
ANNUAL REPORT ON FORM 10-K
For the Fiscal Year Ended December 31, 2020
Table of Contents
PART I
ITEM 1. BUSINESS
FORWARD-LOOKING STATEMENTS
You should read the following discussion in conjunction with our Consolidated Financial Statements and the related “Notes to Consolidated Financial Statements” and “Financial Statements and Supplementary Data” included in this Annual Report on Form 10-K. This discussion contains forward-looking statements including statements concerning our possible or assumed future results of operations, proposed merger with Lumentum Holdings Inc., business strategies, competitive position, industry environment, potential growth opportunities and the effects of competition. Such statements are based upon our management’s beliefs and assumptions and on information currently available to us. Forward-looking statements include statements that are not historical facts and can be identified by terms such as “anticipates,” “believes,” “could,” “seeks,” “estimates,” “expects,” “intends,” “may,” “plans,” “potential,” “predicts,” “projects,” “should,” “will,” “would” or similar expressions. Forward-looking statements involve known and unknown risks, uncertainties and other factors that may cause our actual results, performance or achievements to be materially different from any future results, performance or achievements expressed or implied by the forward-looking statements. These risks, uncertainties and other factors in this Annual Report on Form 10-K are discussed in greater detail under the heading “Risk Factors.” Given these uncertainties, you should not place undue reliance on these forward-looking statements. Also, forward-looking statements represent our management’s beliefs and assumptions only as of the date of this Annual Report on Form 10-K. You should read this Annual Report on Form 10-K completely and with the understanding that our actual future results may be materially different from what we expect. Except as required by law, we assume no obligation to update these forward-looking statements, or to update the reasons actual results could differ materially from those anticipated in these forward-looking statements, even if new information becomes available in the future.
CONVENTIONS THAT APPLY IN THIS ANNUAL REPORT ON FORM 10-K
The conventions and terms used in this Report relate to the following categories in our industry:
| | | | | | | | | | | | | | | | | | | | | | | |
| Communications Technologies | Optical Materials
Platforms | Lasers,
Coherent Components and Modules | Speed | Transmission Reach or Distance | Data Center | Modulations | Transport and Switching |
• 5G • CDC • CPO • Coherent • Contentionless • Disaggregation • DWDM • IP over DWDM • Long Haul • Metro • PIC • PLC | • III-V • GaAs • InP • SiGe • Silicon Photonics | • CDM • CFPx • COSA • DCO • DFB • ECL • EML • ICR • MCS • NLW • OSFP • QSFP-DD
| • 100G • 400G • 400ZR • 400ZR+ • 600G • 800G • 1T • Gbaud • Gbps • Tbps | • DR (500 m) • FR (2 km) • LR (10 km) • ZR (≤120 km) • ZR+ (>120 km) • Metro reach • Regional reach • Long haul | • Cloud • DCI • IP | • Modulation Order • PAM • QAM • QPSK | • AAWG • Drop Module • ROADM |
Unless otherwise indicated, references in this Annual Report on Form 10-K to:
• “5G” refers to fifth-generation wireless architecture;
•“100G products” collectively refers to all products sold by us designed for use at 100Gbps (“100G”), and in coherent transmission systems, designed for use at 100Gbps or higher data rates. Some customers may use components designed for use at 100G at lower speeds. Our 100G products include both coherent transmission products and 100G network products that are not coherent;
•“400G products” collectively refers to all products sold by us designed for use at 400Gbps (“400G”), and in coherent transmission systems, designed for use at 400Gbps or higher data rates;
•“400G”, “600G”, “800G” or “1 T” refers to data rates at 400Gbps (“400G”) to 800Gbps or 1 Tbps transmission;
•“III-V compound semiconductors” refers to compound semiconductor materials made from group III and group V elements of the periodic table, such as Indium Phosphide and Gallium Arsenide;
•“AAWG” refers to Athermal Arrayed Waveguide Grating, a device which can separate or combine signals that have different wavelengths;
•“Advanced Hybrid Photonic Integration” refers to state-of-the-art integration of multi-platform materials and devices;
• “Baud”, “baud rate” or "Gbaud” refers to a unit of the symbol rate of a transmission system and is equal to the number of times a signal changes state per second. One baud is equivalent to one symbol per second. Similarly, Gbaud is equivalent to one billion symbols per second. The data rate of a transmission symbol is determined by multiplying the baud rate times a factor determined by the modulation order.
•“CDC” refers to Colorless, Directionless, and Contentionless;
•"CDM" refers to a Coherent Driver Modulator which integrates a coherent in-phase and quadrature modulator and drivers;
•“CFP” or “CFPx” refers to CFP Multi-Source Agreement, or CFP MSA, industry standard for hundred Gigabits per second and higher (C), form factor (F), pluggable (P) modules;
•"Cloud" refers to the vast constellation of servers that are located in data centers around the world and which are accessed through the internet, along with the associated software and data bases that run on them and the communications links that interconnect them.
•“Coherent” refers to a mode of optical data transmission that encodes and decodes information in the phase, polarization and amplitude characteristics of an optical signal;
•“Contentionless” refers to the ability to switch two or more channels of the same wavelength or color from different directions through the same switch, such as a Multi-Cast Switch (MCS);
•“COSA” refers to a Coherent Optical Sub-assembly that combines multiple discrete devices such as a modulator and a receiver;
•“CPO” refers to co-packaged optoelectronics;
•“DCI” refers to Data Center Interconnect;
•“DCO” refers to a Digital Coherent Optical module;
•“DFB” refers to Distributed Feedback laser;
•“Disaggregation” refers to the trend in optical communications to separate software and hardware platforms so that different parts of a system can be supplied by different vendors;
•“DR” refers to transmission over a reach of 500 meters;
•“DSP” refers to the use of a specialized digital signal processor to perform a wide variety of signal processing operations to recover transmitted data from an optical signal, including recovery of such signals impaired through transmission.
•“Drop Module” refers to a wavelength multiplexer module;
•“DWDM” refers to Dense Wavelength Division Multiplexing, which combines multiple channels onto a single fiber using many different wavelengths, or colors, of light;
•“ECL” refers to External Cavity Laser;
•“EML” refers to Electro-absorptively Modulated Laser;
• “FR” refers to transmission over a reach of 2 kilometers;
•“GaAs” refers to Gallium Arsenide, a III-V component semiconductor material;
•“Gbaud” refers to symbol rate measure in billions of baud;
•“Gbps” refers to gigabits per second;
•“High Speed Products” refers to transmitter and receiver products as well as switching and other component products for 100G and beyond optical transmission applications. Our high speed 100G and beyond products are based on our Advanced Hybrid Photonic Integration technologies, which support 100 gigabits or more per second of information transmitted over a single channel. Our 400G and above products are a subset of our High Speed Products.
•“ICR” refers to Integrated Coherent Receiver;
•“InP” refers to Indium Phosphide, a III-V component semiconductor material;
•“IP over DWDM” or 'Internet Protocol (IP) over DWDM' is the concept of sending data packets directly over an optical layer using DWDM for its capacity and other operations.
•“I/Q” refers to In-Phase and Quadrature Modulator;
•“ITLA” refers to Integrable Tunable Laser Assembly;
•“LR” refers to transmission over a reach of 10 kilometers;
•“MCS” refers to Multi-Cast Switch;
•“Modulation Order” refers to modulation schemes which can transmit more than one bit per symbol (baud), such as QPSK, PAM and QAM.
•"Network Products and Solutions” collectively refers to all products sold by us for use in optical communications networks and a variety of other applications that are designed for use at data rates that are less than 100Gbps, including 40G, 10G and lower data rates. These products include certain passive products that do not explicitly have a data rate specification, but that are most commonly used in networks at these data rates;
•“NLW” refers to Narrow Line Width;
•“OSFP” refers to Octal Small Form Factor Pluggable;
•“PAM” or “PAM4” refers to Pulse Amplitude Modulation or PAM with four amplitude levels;
•“PIC” refers to Photonic Integrated Circuit;
•“PLC” refers to Planar Lightwave Circuit;
•“QAM” refers to Quaternary Amplitude Modulation; a means to code digital data on a coherent light signal;
•“QPSK” refers to Quadrature Phase Shift Keying;
•“QSFP” refers to 40G and 100G Quad Small Form-factor modules that are Pluggable into standard industry interfaces for switches, routers and other telecommunications equipment;
•“ROADM” refers to Reconfigurable Optical Add Drop Multiplexer;
•“SiGe” refers to Silicon Germanium, a III-V compound semiconductor material;
•“Silicon Photonics” or “SiPho” or “Sipho” refers to Photonic Integrated Circuits manufactured using Silicon waveguides on Silicon wafers;
•“Tbps” or “T” refers to terabits per second. One terabit is one trillion bits;
•“ZR” refers to a transmission reach of 80 to 120 kilometers;
•“ZR+” refers to transmission at distances over a reach greater than 120 kilometers using a small form factor coherent pluggable transceiver module.
Unless the context indicates otherwise, we use the terms “NeoPhotonics,” “we,” “us,” “our” and “the Company” in this Annual Report on Form 10-K to refer to NeoPhotonics Corporation and, where appropriate, its subsidiaries.
Overview: Our Position in Advanced Communications
We develop, manufacture and sell optoelectronic products that transmit and receive high-speed digital optical signals for Cloud and hyperscale data center internet content provider and telecom networks. We are the world's leading supplier of tunable lasers that emit the ultra-pure light that is required for the highest speed over distance fiber optic communications links.
Cloud and hyperscale data center networks are operated by companies such as Amazon, Google, Meta, Microsoft and Tencent, while telecom networks are operated by telecommunications carriers such as AT&T, China Mobile, Deutsche Telekom, NTT Communications, Telefonica and Verizon. As operators of large-scale high-speed communications networks, many of these companies are end-users of NeoPhotonics products. Our direct customers can be these companies, their contract manufacturers or their network equipment suppliers, including companies such as Arista Networks, Ciena Corporation, Cisco Systems, Huawei Technologies, Infinera, Nokia and ZTE. These network equipment manufacturers and their engineering and manufacturing suppliers ("EMS") have historically been our primary customers. However, as we integrate our products into more complete solutions, we expect rising revenues directly from operators of high-speed communications networks.
Most of all the world’s leading suppliers of network equipment and coherent transceiver products directly or indirectly use NeoPhotonics ultra-pure light tunable lasers for their highest speed coherent solutions, and most of them use our integrated modulator and receiver components.
Our high-speed products support the explosive growth of data traffic in Cloud and hyperscale data center networks. Our laser market penetration has increased substantially over the last five years, and our ultra-pure light lasers have been adopted by nearly all leading network equipment and coherent transceiver manufacturers for their 400G and above systems. In addition to our leadership in ultra-pure light tunable lasers, we have been increasing our sales with these companies in modulator and receiver components. Over the recent years, many of these network equipment manufacturers have adopted our 64 Gbaud and 96 Gbaud receiver and modulator components, together with our tunable laser, for their highest speed systems.
Our products operate at the highest speed over distance, at speeds of 400 Gigabits per Second ("G"), 600G and 800G and beyond data rates in a single wavelength. Versions of these products have the speed, size, output power and low power consumption that enable interoperable pluggable transceivers in standard form factors which directly transmit data using industry standard Internet Protocol coding, or IP over DWDM wavelengths, greatly simplifying data networks, thereby lowering costs and reducing the total electrical power required.
Our revenue from products capable of maximum data rates of 400G and above grew by 70% in 2021 over 2020, up from $86 million in 2020 to $148 million in 2021. Similarly, 400G and above revenue doubled in 2020 over 2019, from $44 million in 2019 to $86 million in 2020. Revenue from products for 400G and above applications has been increasing steadily and is now approximately 56% of fourth quarter revenues. 400G capable products are defined as products capable of 50 Gbaud and above operation plus lasers purchased specifically for systems with a maximum data rate of 400G or higher. Customers often use products capable of a maximum data rate of 400G and above at lower speeds, in order to achieve longer transmission distances by employing lower order modulation schemes. We believe that the market for products with a maximum data rate of 400G and above will grow at a 5-year compound annual growth rate of approximately 60 percent through 2025. We therefore expect our 400G and above revenues will continue to grow at an accelerated rate over the intermediate and longer term.
Over the past decade we have been first to deliver commercial mass production volumes for each of the highest speed advances in coherent optical components and lasers, as maximum speeds have advanced for each wavelength, or color, from 100G to 200G, 400G and 800G. We are a specialist in developing and producing products for the highest speed over distance applications, where high baud rate, laser single clarity and high sensitivity are keys to achieving longer distances for a given speed.
We believe we are well positioned to attain and maintain industry leadership in these laser, component and module solutions based on our leadership in the ultra-pure light lasers which power them and our comprehensive Silicon Photonics and compound semiconductor technologies for optical ICs.
Proposed Merger with Lumentum Holdings, Inc.
On November 3, 2021, we entered into an Agreement and Plan of Merger with Lumentum Holdings Inc., a Delaware corporation (“Lumentum”) and Neptune Merger Sub, Inc., a Delaware corporation and a wholly owned subsidiary of Lumentum (“Merger Sub”), (the “Merger Agreement”). Pursuant to the terms of the Merger Agreement, we will be acquired by Lumentum through a merger of Merger Sub and into us (the “Merger”), with NeoPhotonics Corporation surviving the Merger as a wholly owned subsidiary of Lumentum.
Pursuant to the terms of the Merger Agreement, and subject to the terms and conditions set forth therein, our stockholders will receive $16.00 per share in cash, without interest thereon and after giving effect to any required tax withholdings, for each NeoPhotonics share they own. As of December 23, 2021, the date of our Definitive Proxy Statement filed in connection with the Merger, we anticipate that the total amount of funds necessary to complete the Merger and the related transactions, and to pay the fees and expenses required to be paid at the Closing of the Merger by Parent and Merger Sub under the Merger Agreement, will be approximately $913 million. Lumentum will provide up to $50 million in interim debt financing to us, which would provide us financing that may be necessary to operate our business during the pendency of the Merger on terms that are, taken as a whole, likely better than those that could otherwise be obtained from an unrelated third party. The cash consideration will be funded from the combined company’s balance sheet.
The Merger Agreement contains certain termination rights for both Lumentum and us and provides that if the Merger Agreement is terminated for failure to obtain antitrust approval, Lumentum may be required to pay us a termination fee of $55.1 million; and if Lumentum or any of its affiliates enters into any agreement, letter of intent or other similar agreement for an acquisition of any ownership interest or assets of any person that cause a material delay in, or results in the failure of, the consummation of the Merger, Lumentum may be required to pay us an additional termination fee of $36.7 million.
Consummation of the Merger is subject to customary closing conditions, including the absence of certain legal impediments, the expiration or termination of the required waiting periods under the Hart-Scott-Rodino Antitrust Improvements Act of 1976, as amended (“HSR Act”), and approval by the holders of a majority of the outstanding shares of our common stock. The waiting period under the HSR Act expired as of January 21, 2022 and the required approval from our stockholders was obtained on February 1, 2022.
The remaining requirements for closure of the Merger are customary closing conditions set forth in the Merger Agreement and approval from the State Administration for Market Regulation ("SAMR") of the People’s Republic of China. The Merger is expected to close in the second half of calendar year 2022.
For additional information related to the Merger Agreement and the Merger, we refer you to our Definitive Proxy Statement filed with the Securities and Exchange Commission on December 23, 2021, which includes the full text of the Merger Agreement as Annex A, our Current Report on Form 8-K filed with the Securities and Exchange Commission filed on January 20, 2022, our Current Report on Form 8-K filed with the Securities and Exchange Commission filed on January 21, 2022, our Current Report on Form 8-K filed with the Securities and Exchange Commission filed on January 24, 2022, and our Current Report on Form 8-K filed with the Securities and Exchange Commission filed on February 1, 2022.
During the year ended December 31, 2021, we recorded acquisition-related costs of $3.7 million in operating expenses within our consolidated statement of operations.
Our Technology and Product Position
Our high-speed optical communications technologies encode information onto optical signals from electronic signals for transmitting and decode it for receiving. We achieve ultra-high speed data transmission using coherent technology that encodes phase, amplitude and polarization on an optical wavelength, packing in orders of magnitude more information than is possible with simple on/off encoding. With the inherent characteristics in our ultra-pure light tunable lasers, we achieve longer distance transmission as well as higher speed.
Coherent is the technology of choice for high speed over distance data transmission in Cloud infrastructure and data center interconnection, in addition to telecom networks. The move to 400G and above transmission has been a fulcrum for the industry as it marked a major step-up in speed as well as enabling new network architecture alternatives to dramatically lower costs by deploying 400ZR architectures in networks. 400G is now the basic building block for network deployments for all reaches from 40km to long haul distances of 2000kms or more, all of which require coherent transmission technology.
We believe we are a global leader in coherent transmission technology, based on our leadership in ultra-pure light lasers, silicon photonics and optical integration for miniaturization and low power consumption. We sell to virtually all of the leading telecom network equipment companies such as ADVA, Arista Networks, Ciena, Cisco Systems, Fiberhome, Fujitsu, Huawei, Infinera, NEC, Nokia and ZTE. As the primary producer of ultra-pure light lasers, we have delivered more than 2 million lasers into the market of approximately more than 3.2 million coherent ports deployed by the industry over the past 10 years (each port may use either one or two lasers).
Our High Speed Products, including our 400G and above capable products, use our Silicon Photonics integration, compound semiconductor integration and our Advanced Hybrid Photonic Integration technologies to optimize performance by combining different materials platforms. We believe that our use of all of these technologies together is an important competitive differentiator to provide solutions with optimized cost and performance.
The development of the market and the expanding range or uses of 400G and above solutions has two key paths. First is the use of 400G, 600G, 800G and beyond products in chassis-based systems, including systems that support long distance transmission. This is the path for continuing expansion of carrier deployments for the highest speed over a given distance. Second is the use of 400G coherent pluggable modules as the basic building block for communications infrastructure providing direct connection of routers and switches within and between data centers, eliminating the need for proprietary DWDM interfaces. These DCI interconnects, using 400ZR and 400ZR+ pluggable modules, enable new, lower cost network architectures using IP over DWDM protocols. Both of these paths portend accelerating growth.
The emergence of 400ZR and 400ZR+ coherent pluggable modules extends our capabilities to a new, rapidly expanding market segment. Such modules put full coherent transmission capabilities of a line card into the same form factor as a pluggable client side transceiver, enabling interconnects between data centers to be nearly as simple as interconnects within a data center, thereby substantially reducing costs.
Such modules are causing a sea change in the market structure. Signal processors and optics have both progressed to the extent that they are small enough, and their power consumption is low enough, to enable architectures that fully leverage new,
much smaller form factors to deliver a major increase in data rates and scale while minimizing for macro power demands. As a result, for the first time, hyperscaler data center operators and telecom carriers can re-architect their networks with much greater capability to manage the exploding demand for data transmission.
Use cases for 400ZR and 400ZR+ system level modules extend across data center interconnect, backhaul for 5G wireless networks and metro networks. Key attributes of power and power density, and interoperability of pluggable solutions, drive this forecast. These architectures are now being deployed by hyperscale operators and will be adopted in metro telecom networks using 400ZR+ pluggable modules in areas where reach and density make it the clear economic winner with much lower total costs. Furthermore, we believe that our high performance optics combined with next generation digital signal processor ("DSP") will enable 800ZR and 800ZR+ coherent pluggable modules with the next few years, followed by 1.6T implementations.
We believe that Cloud and hyperscale data center operators, such as Alibaba, Amazon, Apple, Google, Meta, Microsoft and Tencent, have the potential to become significant customers as they increasingly link hyperscale data centers regionally. These operators need the highest speeds at reaches to 120 kilometers and farther, defining the ZR+ market sector where we excel and have fundamental technology advantages. We believe the Cloud and hyperscale data center markets will become more important in our sales mix, from our further penetration of this market sector and the higher potential revenue growth rate it portends.
Furthermore, extension of coherent pluggable modules to the metro network is a use case driven by substantially lower costs achieved through elimination of network equipment proprietary chassis, and a reduction in the number of ROADMs required, compared to current network architectures.
With 400G as a fulcrum in the path of growth in the market at the highest speeds, we believe we are well positioned to take advantage of this rapidly developing, high growth market.
Continuing Rapid Growth of Data Traffic in the Information Age
Previously unimaginable amounts of data are being generated with new cloud-based applications that drive massive data manipulation and continue to emerge and expand, impacting almost every realm of knowledge and economic and social life. Examples include applications such as cloud computing, autonomous vehicles, virtual reality, smart homes, tele-medicine, genomics, artificial intelligence and machine learning.
The massive infrastructure of hyperscale data centers necessitates extremely high capacity optical interconnections. There are well over 700 hyperscale data centers around the world, each housing well over 100,000 micro-processors. Each hyperscale data center is surrounded by many more enterprise-level data centers, representing new and growing public cloud, private cloud and hybrid cloud networks. This vast proliferation of data applications will continue to drive growth in hyperscale and enterprise data centers for decades to come.
The ability to generate and process data requires that the data be transported to where it is needed. Thus, the second major element of the Cloud is the communications interconnections between data centers and consumers and between the data centers themselves.
Total annual IP data traffic will reach approximately five zettabytes in the next year, or five trillion billion bytes, according to the Cisco Visual Networking Index. Total data traffic is forecast to nearly double over the next few years, with nearly all of this data being carried over fiber optic communication links.
Networks operating at 400G, 600G, 800G and beyond data rates have adopted coherent transmission technology because of its ability to increase data rates and lower costs. With the explosion of data traffic, these high speed optical networks are very high growth segments of the optical communications market. They support the continuing rapid expansion of hyperscale data center and content provider networks, as well as the expansion of telecom backbone, metro and mobile networks to accommodate increased traffic for the foreseeable future.
Speed over Distance Matters
Our solutions are often unique in their ability to service the need for this explosive growth in data traffic by providing high integrity signals across longer distances. It is more challenging and expensive to transmit a signal a thousand kilometers or across a continent than it is to send the same information a few hundred meters across a data center or campus network.
For speed over distance, state of the art and best of breed optics are essential, and increasingly so as distances extend and data rates increase. For distances of 80 kilometers to a few hundred kilometers, i.e. ZR and ZR+ distances, then further to 2,000 kilometers, or long haul reaches, specialized technologies are needed for each. The benefits of coherent transmission have made it the preferred technology for these state-of-the-art high speed over distance networks. We believe that our Silicon Photonics integration and our ultra-pure light tunable lasers are enabling technologies.
Our Advanced Hybrid Photonic Integration technologies effectively address the challenges inherent in precision and high volume manufacturing of optical components for coherent transmission when distances extend to the longest reaches. For example, we demonstrated our Multi-Rate CFP2-DCO coherent pluggable module transmitting at a 400 Gbps data rate over a distance of 1,500 km in a 75GHz-spaced DWDM channel and we have achieved 400G over 800 km with our QSFP-DD coherent pluggable module.
Emerging Change in Network Architecture
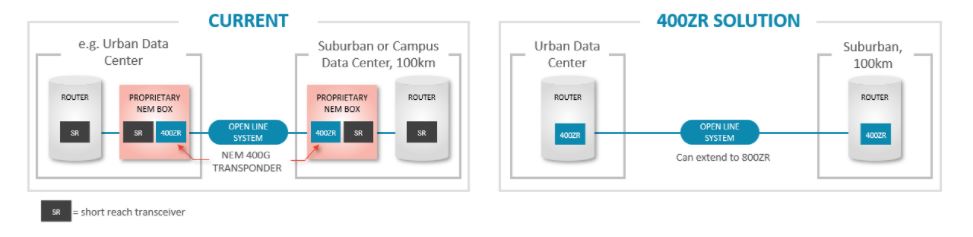
We believe these changes at 400G and above data rates represent a sea change in high-speed network which is resulting in significantly lower costs per bit for network operators. We believe our lasers, coherent techniques and photonic integrated circuits, or PICs, are a significant factor enabling this change in network architecture. Today, the majority of communications between data centers is still done through an equipment rack which contains complex and self-contained elements as the key parts of chassis-based systems. These circuit boards or line cards are usually supplied by a separate network equipment manufacturer, or NEM, to provide the fiber optic link. However, this results in a complex and costly architecture.
Our advanced system-level coherent modules for the highest speeds and longest distances provide a core communications link solution for interconnecting data centers separated by 80 kilometers or more. As such, they carry stringent performance and reliability requirements that are higher than traditional short reach data center modules.
Our integration technologies make it possible for long distance transmission by coherent pluggable transceiver modules that connect directly into switches and routers inside data centers that have previously been used only for short reach connections within data centers. Such dis-aggregated Open Line Systems can manage optical signals between data centers, sometimes called IP over DWDM, with all needed channel management, amplification, traffic planning and monitoring functions. Connections between data centers are now becoming as simple as connections within data centers which provides a major breakthrough to reduce network costs and cost per bit.
To illustrate, a 400G connection between two routers in different data centers 80 kilometers apart can be made by plugging our 400ZR DD-QSFP pluggable transceiver into each router and connecting the fibers through an Open Line System. Similarly, a distance of 400 kilometers or more can be accommodated using our 400ZR+ modules.
400ZR/ZR+ ARCHITECTURE FOR DATA CENTER INTERCONNECT
Architecture Supported by 400ZR Interconnects for direct connection to Routers or Switches
This architecture eliminates two complex network equipment boxes and four short reach data center transceivers and consequently reduces the cost per bit of the optical link by as much as 80 percent. The architecture is possible because coherent technology, driven by our ultra-pure light lasers and coupled with our highly integrated photonic chips, packages the long distance transmission capability of the NEM line card into a small form factor pluggable transceiver that is plug-compatible with standard short reach data center transceivers. For example, a NeoPhotonics 400ZR QSFP-DD or OSFP module capable of 80 kilometer transmission plugs into the same slot on a router that also accommodates a 400G DR4 QSFP-DD or OSFP data center transceiver capable of only 500 meters transmission. Being able to utilize the same plug receptacle for both short reach connections and long reach connections is a major cost-saving breakthrough for network operators.
We believe that this network architecture is becoming the mainstay of new installations and will move a significant portion of the capital expenditures from network equipment supplier DWDM proprietary boxes to new, disaggregated direct 400ZR interconnections. This approach of IP over DWDM moves Internet Protocol traffic from switches and routers directly over an optical channel in an Open Line System to its destination without passing through a proprietary network equipment transmission chassis.
Broad adoption of 400ZR architectures for DCI applications also portends changes in future metro architectures. For example, 5G wireless applications require an ultra-flexible network that can be dynamically provisioned to implement a range of functions. The most efficient way to implement such a network is through a Cloud architecture which enables traffic to be managed at the packet level. A transport grade 400ZR+ coherent pluggable module allows a metro-level connection to be plugged directly into a switch or router. The traffic then goes directly to a ROADM-based Open Line System, creating a very flexible optical network with a lower total cost of deployment. We believe this new metro architecture will result in a similar magnitude of cost savings as is anticipated in 400ZR DCI networks.
Our Solutions
We use our optical integration technologies to develop and produce integrated optical products that deliver the highest speed over distance. Our products work together as solutions to achieve the highest speeds over the longest distances with the highest performance. To maximize total capacity, we provide additional Line System solutions that leverage our coherent products together with our passive products to maximize total fiber capacity.
Three critical optical components are required to make a coherent transceiver: (1) a laser with a very narrow linewidth and very pure light; (2) a coherent modulator capable of changing both the intensity and phase of the optical signal to code data onto it; and (3) a coherent receiver capable of detecting both the intensity and phase of the received optical signal to “interpret” its content, plus an electronic DSP IC.
We have been a leading volume supplier of these optical components since coherent systems were first deployed in volume for the telecommunications networks of a decade ago. We are now the primary supplier of ultra-pure light lasers along with other coherent components for 400G, 600G and 800G applications.
These high performance coherent optical components and ultra-pure light tunable lasers require very specialized materials platforms and assembly capabilities. We believe that we have a unique set of materials, design, assembly and test capabilities for ultra-pure light tunable lasers, coherent modulators and receivers as well as optical ICs that form the basis of our competitive position.
In parallel, commercial DSP development has followed Moore’s Law to achieve the performance and low power necessary for 400ZR and 400ZR+ coherent modules. The latest generation of DSPs incorporate forward error correction software standardized by the Optical Internetworking Forum (OIF) so that they can interoperate. This means that the data traffic can remain in IP format and be directly communicated between switches and routers without passing through a proprietary network equipment chassis, thereby accelerating adoption of IP over DWDM adoption.
As these DSPs are based on standard commercial CMOS IC processes and design tools, the number suppliers of DSPs has grown. There are multiple large scale merchant suppliers of DSPs, and at least three captive DSP suppliers within system companies. Other start-up companies are making efforts to enter the DSP market.
We combine our unique high performance ultra-pure light tunable lasers with a coherent modulator and receiver, or with a combined silicon photonics coherent optical sub-assembly, or COSA, together with a commercially available DSP to manufacture 400ZR modules. These are available in multiple form factors including 400G DD-QSFP, OSFP and CFP2 digital coherent optical (“DCO”) transceivers. Our QSFP-DD and OSFP modules are designed to be extendable to 800ZR and 800ZR+ applications, and we believe that such 800G pluggable modules will enter the market within the next few years as next generation DSPs become available.
Increasing the Data-carrying Capacity of Optical Fibers
There are two principal approaches to optimizing the data carrying capacity of an optical fiber. The first approach addresses capacity by increasing the data rate in a given channel using higher baud rate and higher order modulation. Once this limit is reached, the second approach is to expand the wavelength range available, which is achieved by increasing the wavelength tuning range to accommodate more channels. This maximizes the data carrying capacity in any given fiber, thereby lowering overall cost per bit.
The first approach addresses capacity as speed per channel and uses our 64 Gbaud and 96 Gbaud modulators and receivers and our ultra-pure light tunable lasers. As baud rates increase, however, the channels must be made “wider” to accommodate the signal spread, thereby reducing the number of channels that can be “fit” in a given fiber’s bandwidth using standard optics.
The second approach addresses the number of channels, where we combine coherent transmission technologies to maximize interconnect bandwidth capacity. For example, our C++ LASERTM ITLA, C++ CDMTM Modulator and C++ ICRTM Receiver are uniquely capable of increasing fiber capacity up to 50 percent and to deliver up to 32 Terabits per second of capacity over a single fiber. The number of channels is further optimized by our precision 75 to 100GHz-spaced PLC multiplexers for Open Line Systems.
The capabilities of coherent optics continue to grow with increasing photonic integration for higher performance and smaller size, and open further opportunities for us in adjacent markets. Outside of communications, coherent technology improves sensitivity and performance for a variety of applications including inter-satellite communication links for low earth orbit ("LEO") satellites, plus industrial applications, 3D sensing for autonomous vehicle navigation, and medical imaging.
Our Core Technologies in Silicon Photonics and Hybrid Photonic Integration
We believe we have all the capabilities required for producing the highest performance Advanced Hybrid Photonic Integrated optoelectronic and silicon photonics devices for the highest speeds and highest speed over distance and meeting the most stringent performance requirements. Our core technologies are a unique multi-material platform that includes:
Advanced Hybrid Photonic Integration: Provides our core technology and drives our ability to design, develop and produce industry leading, unique and differentiated high-speed optoelectronics products. We utilize proprietary integration platforms that provide optoelectronic functionality on Silicon and compound semiconductor substrates including Indium Phosphide, Gallium Arsenide and Silicon Germanium. Complete advanced photonics integration capability requires integrated combinations of these platforms to achieve optimal performance and cost.
High Performance Optics and Ultra-Pure Light Lasers: Reduces the need for electronic algorithms from digital signal processors, to correct less pure optical signals, thereby improving performance, cost and power consumption.
Silicon Photonics Integration: Silicon is versatile for photonic integration. Silicon Photonics integrated circuits must be designed to be integrated with lasers fabricated from Indium Phosphide, detectors based on germanium-doped silicon, or other functions and materials through Hybrid Photonic Integration. We design Silicon Photonics modulators, receivers, coherent optical subassemblies and laser subassemblies and fabricate the Silicon wafers in commercial Silicon foundries.
Indium Phosphide ("InP"): Indium Phosphide is used to produce efficient lasers, sensitive photodetectors and modulators in the wavelength window typically used for telecommunications. As a compound semiconductor bandgap material, InP is the most important material for the generation of laser signals and the detection and conversion of those signals back to electronic form. We design and manufacture laser and detector chips in our own and outsourced fabs and integrate them with silicon photonics circuits using Advanced Hybrid Photonic Integration.
Silicon Planar Lightwave Circuits: Silicon is a multi-attribute semiconductor material and waveguides of Silicon or doped Silicon Dioxide (silica) have very low optical loss and are ideal for switching, filtering or interferometric applications. We design and manufacture doped silica photonic chips and integrate them with photonic circuits using Advanced Hybrid Photonic Integration.
Gallium Arsenide ("GaAs"): Gallium Arsenide is a compound semiconductor material that operates at very high speeds due to its high electron mobility and is used to make analog integrated circuit drivers for high-speed lasers and modulators. We design and manufacture GaAs ICs and integrate them with our lasers and modulators or into co-packaged optoelectronics devises, or CPO.
Silicon Germanium ("SiGe"): Silicon Germanium is a compound semiconductor material used to manufacture mixed signal and analog integrated circuits for high-speed drivers and trans-impedance amplifiers used in 400G and beyond systems. We design SiGe ICs and fabricate wafers in commercial SiGe foundries.
Laser Technologies: We specialize in the design, manufacture and control of lasers. Our principle products include ultra-pure light tunable lasers, electro-absorptively modulated lasers ("EMLs") and distributed feedback lasers ("DFB").
Optoelectronic engineering and integration: As we create complex integrated optoelectronic devices, we design and build electronic control algorithms and devices, signal processing methodologies, hardware and software routines and protocols, and device level ASICs that function to control and manage the highest performance features and capabilities of these integrated optoelectronic devices and systems.
Hardware and firmware integration: We sell our products as modules and subsystems which contain electronic hardware and firmware controls that interface directly with our customers’ systems.
Devices, Components, Modules and Subsystems: We design and manufacture modules and subsystems that combine our products with other elements to offer customers a complete solution.
Our Strategy
Key elements of our multi-year strategy include:
•Continue to lead in the most advanced ultra-pure light laser technology, and state-of-the-art integrated coherent receivers, modulators and modules. We continue to invest in and develop highest speed and highest speed over distance products in each of the components required for coherent transmission and related applications.
•Continue innovating to develop industry-leading comprehensive technology for Silicon Photonics and Advanced Hybrid Photonic Integration. We have strengthened and expanded our technology platforms for comprehensive advanced photonic integration to design and produce the highest performance optical signal processing solutions.
•Capture major customer share for the most advanced modules and components serving the leading operators and users of state-of-the-art communications networks and solutions. We intend to deepen our relationships with customers by increasing design wins for their systems, including major Cloud and hyperscale data center operators.
•Offer complete optoelectronic solutions for 100G to 800G and beyond for the highest speed Cloud, data center and Telecom market segments. We produce coherent transmitter, modulator and receiver components and transceiver Modules optimized for the highest speeds that are aligned with leading trends in Open Line System architectures.
•Address additional segments of the network and similar or related applications that leverage our core technology and state-of-the-art products and that will benefit from high speed or high sensitivity optical performance.
Our Products
Our ultra-pure light tunable lasers are core to our coherent communications strategy, and our other coherent components and modules provide industry leading performance and are forward integrations of our lasers. As data rates increase by increasing baud rate and modulation order, it is essential to have the purest possible laser light source. Our ultra-pure light tunable lasers deliver to this essential requirement by having the narrowest linewidth in the industry, meaning the purest color, without noise or other distortion.
We produce transmitter and receiver components and coherent modules, as well as switching products, for 400G and beyond transmission over distances of 2 to 2,000 kilometers. We integrate transmitter and receiver components into next generation pluggable transceiver modules.
All of our high-speed 400G and beyond products are based on our Silicon Photonics technology and our Advanced Hybrid Photonic Integration technology. Our coherent technologies support encoding 400 Gigabits or more per second of information for transmitting over a single channel and decoding the information at the receiver, and enable smaller, more compact and more highly integrated designs for the individual elements and integrated COSAs.
Coherent transmission can only be accomplished in practice using advanced photonic integration to intimately couple functional elements. Coherent systems manipulate light to encode orders of magnitude more information on the same wavelength channel than is possible with traditional methods.
Our coherent optoelectronic modules, which integrate our tunable laser, modulator and receiver components, provide complete transmit and receive functions including variable modulation capability to adjust data rates. Compact integration of our coherent “transceiver” modules allows them to be pluggable and to reduce costs by replacing traditional much larger and more complex chassis.
Each of our module products incorporates one each of our component lasers, integrated coherent receivers and modulators. Further, to minimize size, we often integrate the receiver and modulator into a single component, or a COSA. In addition, each transceiver module has a DSP as an Application Specific Integrated Circuit ("ASIC"). These four elements, three optical components and the DSP, comprise most of the bill of materials for a module, and are roughly comparable in value.
DIGITAL COHERENT TRANSCEIVER
Elements of a Digital Coherent Transceiver Module
We develop and manufacture transmitter products, receiver products and switching products that are used in ultra-high speed digital optical communications, high speed switching and provisioning. We combine our transmitter and receiver products into transceiver modules. Our switching products, such as Multi-Cast Switches, are used primarily in ROADM nodes that dynamically and efficiently allocate bandwidth to adjust for fast changing traffic patterns and for provisioning software defined optical networks. Our products can be categorized into groups, including High-speed Products for 100G, 400G, 600G, 800G and beyond applications, including in coherent networks, including the switches for these applications; and Network Products and Solutions for lower speed networks, plus wavelength management solutions for telecom and DCI networks.
Our High Performance Coherent Module Products
400G Pluggable Coherent Transceivers: We produce pluggable coherent transceivers operating at speeds from 100G to 400G. These high speed and high performance pluggable coherent modules combine our ultra-narrow linewidth laser with our coherent receiver and with our high performance coherent modulator or integrated COSA.
Our 400ZR QSFP-DD and OSFP transceiver modules both provide 400G connections over a DCI reach of up to 120 kilometers in a standard client side pluggable form factor. These modules support OIF standard error correction software and can interoperate with other transceivers using the same standardized software, enabling direct IP over DWDM.
Our 400ZR+ transceiver modules provide 400G connections over longer distances than our standard 400ZR transceivers modules.
Our 400G capable CFP2-DCO transceiver can deliver as much as 32 Terabits per second of capacity per fiber. Our internal optics support 85 channels of 64 Gbaud data at 75 GHz wavelength channel spacing. These CFP2-DCO modules support long haul, metro and DCI network applications.
Our Ultra-Pure Light Laser Products
Ultra-Narrow Linewidth Tunable Laser Products: We produce industry-leading tunable laser products based on an external cavity ("ECL") design. Due to their longer cavity length, ECLs generate a much purer “color,” or narrower “linewidth,” which is critical with new higher order modulation techniques and higher baud rates, thereby carrying significantly more information. We produce standard Micro-ITLA form factor products and a smaller Nano-ITLA that achieves comparable ultra-narrow linewidth, low frequency phase noise and the low power consumption in a more compact package that is approximately one half the size of our Micro-ITLA.
Further extending our leadership in lasers for the highest speed and highest capacity communications links, we also provide ultra-pure light tunable lasers with wider tuning ranges which support more channels or higher speeds. For high baud rate, high capacity per wavelength systems, our ultra-narrow linewidth tunable lasers are available in a C++ LASERTM configuration, which has a tuning range of 6 THz, covering the full “Super C-band”. This is 50 percent more spectrum than a standard 80 channel, 50 GHz spaced laser. The C++ LASERTM ITLA can tune over 120 channels with 50 GHz per channel spacing or 80 channels with 75 GHz per channel spacing. This fully captures the increase in fiber capacity generated by these newer modulation approaches when combined with our C++ ICRTM receivers and C++ CDMTM modulators.
High Performance Laser and Optical Products: For applications inside data centers and in connecting antennas for 5G wireless networks, we design and manufacture electro-absorptively modulated lasers ("EML") and high power distributed feedback lasers ("DFB") as well as driver ICs for these lasers.
We manufacture and sell 100G products for data center applications, including 28 Gbaud and 53 Gbaud EMLs, laser drivers, modulator drivers and photodiode receivers used for single wavelength PAM4 100G applications and four wavelength 400G intra-data center transmission.
For hyperscale data center applications, we have introduced high power laser diode array products for short reach Silicon Photonics based 100G intra-data center interconnections which use parallel single-mode architectures, or PSM4, as well as coarse wavelength division multiplexing, or CWDM architectures.
Our High Speed Coherent Component Products
High Speed Products including products for 400G and beyond applications: We produce high speed and high performance transmitter and receiver products for maximum data rates of 400Gbps to 800 Gbps and beyond optical transmission applications over distances of up to 2,000 kilometers. Most coherent transceivers are flexible and can be programmed to run at many different rates. Customers use our 400Gbps maximum data rate and above high speed and high performance transmitter and receiver products at data dates below 400Gbps, in order to achieve much longer transmission distances. These products include our integrated coherent receiver ("ICR") and coherent driver modulator ("CDM"), which support baud rates of up to 96 Gbaud and can operate over the C++ wavelength band covering 6 THz.
We have integrated transmitter and receiver functions into a single integrated coherent optical sub assembly, or COSA, which has an ultra-small form factor designed to fit into the next generation pluggable transceivers such as QSFP-DD and OSFP. Our technologies support encoding 400, 600 to 800 Gigabits or more per second of information for transmitting over a single channel and decoding the information at the receiver, as well as enabling smaller, more compact and more highly integrated designs for the individual elements and integrated COSAs.
Our High Performance Wavelength Management Products
We are an industry leading supplier of low-loss, high-capacity wavelength management products that are used in rapidly expanding ROADM nodes for high speed telecom carrier networks, in Open Line Systems for new 400ZR architectures and in 5G wireless backhaul applications. These products utilize our PIC integration technologies to expand and extend the transport of optical signals, lowering total network cost and power consumption. We believe we are one of the highest volume manufacturers of PICs in the industry.
Multi-Cast Switches: Our Multi-Cast Switches ("MCS") are used in ROADM nodes to allocate bandwidth dynamically and efficiently, adjusting for fast changing traffic patterns and provisioning and supporting software defined optical networks. We provide Multi-Cast switching solutions for 100G and above coherent systems. Our 4x16, 8x16 and 12x16 Multi-Cast switch modules for colorless, directionless and contentionless, or CDC, ROADMs efficiently allocate bandwidth and route signals in 100G and higher data rate coherent networks to provide scalable contentionless operation and achieve the highest traffic management efficiency, optimizing traffic flows in coherent transmission systems. Our MCSs products use our planar lightwave circuit photonic integration platform and consists of a complex array of switches, waveguides, taps, crossings and other functional elements.
Arrayed Waveguide Gratings: We design and manufacture arrayed waveguide gratings ("AWGs"), multiplexers and filters used in Dense Wavelength Division Multiplexing ("DWDM") open and proprietary line systems. We design and manufacture wavelength management products that are customized for the highest speed and highest capacity coherent systems operating at 400G, 600G, 800G or higher data rates. We have introduced new AWGs for advanced coherent systems that offer channel spacing from 75 GHz to 150 GHz and channel counts from 40 to 85 channels, covering the widest spectral bands used today and supporting data rates that will extend to 1 Tbps and beyond.
Our Infrastructure, Intellectual Properties and Our Employees
We have product development and product sustaining engineering teams in Silicon Valley, California, Ottawa, Canada, Tokyo, Japan and Shenzhen and Wuhan, China. In our Silicon Valley and Tokyo facilities we conduct research, new product development and product roadmap definitions, including for our Silicon Photonics and Advanced Hybrid Photonic Integration PIC products. In our Shenzhen area facilities, we conduct product development, manufacturing and process engineering, quality control, continuous improvement and cost reduction relating to product manufacturing, assembly and test. In our Wuhan, China and Ottawa, Canada facilities we conduct new device, component and product development.
We seek to establish and maintain proprietary rights in our technology and products through the use of patents, copyrights and trade secret laws in each of the locations in which we do business. We have filed applications for patents to protect certain of our intellectual property in the U.S. and in other countries, including Australia, Canada, Japan, Korea, Hong Kong, China, Russia, India, Taiwan and several European Union countries. As of December 31, 2021, we had approximately 376 issued patents, expiring between 2022 and 2039.
We have manufacturing operations in the U.S., Japan, China and Thailand. Our wafer fabrication operations are located in our Silicon Valley, California and Japan facilities, and include chip design, clean room fabrication, integration and related facilities for chip-level devices and PICs. Our manufacturing, assembly and test operations are located in our Shenzhen area facilities, in Thailand and in Silicon Valley.
Our Customers
For 2021, we had four customers who constituted 10% or more of our revenue, comprising of Cisco Systems at 27%, Ciena Corporation at 18%, Nokia at 12% and Huawei at 11% of revenue. In 2020, customers of 10% or more revenue were Huawei at 40%, Ciena Corporation at 17% and Acacia Communications at 10%. In 2019, customers of 10% or more revenue were Huawei and Ciena, which accounted for 41% and 29% of our total revenue, respectively.
The U.S. Department of Commerce Bureau of Industry and Security ("BIS") added Huawei and certain affiliates to the BIS Entity List (“Entity List”) with an effective date of May 21, 2019. On August 17, 2020, BIS increased restrictions on Huawei and its affiliates on the Entity List related to items produced domestically and abroad that use U.S. technology or software and imposed additional requirements on items subject to Commerce export control. As Huawei had been our largest customer in recent periods, such action had a material impact on our revenue in 2020 and 2021. Huawei is expected to continue to decline as a percentage of our revenue into 2022.
Our Sales and Marketing
Our sales model aligns with customers through coordination of our sales, product application engineering and manufacturing teams. Our sales cycles typically require significant time and expenditure of resources to realize revenue from the sale of products. The length of our sales cycle is typically 6 to 12 months for an existing product and 12 to 18 months or longer for a new product.
We use a global direct sales force based in North America, Europe and Asia, including China, Japan, Korea and Taiwan. We have very deep technical relationships with our customers' design teams. We believe that these collaborative engineering activities provide us insight into our customers’ broader and longer-term needs and are an important part of our value delivery to our customers.
Our marketing teams focus on product strategy, product development, roadmap development, new product introduction processes, program management, product demand stimulation and assessment, and competitive analysis. Our marketing team also seeks to educate the market about our products by communicating our value proposition and product differentiation in direct customer interactions and presentations, at industry trade shows, at technical conferences, through digital and online content such as webinars and blogs, and in industry forums such as Multi-Source agreement ("MSA") committees.
Our Research and Development
Our research and development activities continue to advance the performance leadership boundaries in high speed lasers and digital optics, silicon photonics and hybrid photonic integration, optoelectronics control and in signal processing.
We have invested and expect to continue to invest significant time and capital into our research and development operations. Research and development expenses were $56.5 million, $56.1 million and $57.6 million in 2021, 2020 and 2019, respectively.
We have research and development and wafer fabrication facilities in Silicon Valley, California and in Tokyo, Japan that coordinate with our research and development and manufacturing facilities in Dongguan, Shenzhen and Wuhan, China and Ottawa, Canada. We use proprietary design tools and design-for-manufacturing techniques to align our design process with our precision nanoscale, vertically integrated manufacturing and testing.
Human Capital Resources
We are committed to attracting and retaining the brightest and best talent. Investing, developing, and maintaining human capital is critical to our success. As of December 31, 2021, we had approximately 1,157 full-time employees, of which approximately 20% are in the Americas, 10% in Japan and 70% in China. As a global manufacturer of products for DCI and telecom networks, a large number of our employees are engineers or trained technical workers focusing on advanced manufacturing, and many of them hold masters', doctorate, or equivalent or higher degrees.
We emphasize a number of measures and objectives in managing our human capital assets, including, among others, employee safety and wellness, talent acquisition and retention, employee engagement, development, and training, diversity and inclusion, and compensation and pay equity. We have not experienced any employee-generated work stoppages or disruptions, and we consider our employee relations to be satisfactory.
Our U.S. and Canadian employees are not represented by a labor union. Under Chinese law, all employees in our China subsidiaries are members of a union that is overseen by the Chinese government. The majority of the employees in our Japanese subsidiary are also members of a union.
Equity, Diversity and Inclusion
We are committed to being broadly inclusive to capture the ideas and perspectives that fuel innovation and enable our workforce, customers, and communities to succeed in the digital age. We strive to create an inclusive workplace where people can bring their authentic selves to work. Our commitment to diversity and inclusion starts with our diverse world-wide employee base which represents well over 25 countries. We are also committed to gender diversity in our workforce with women currently holding 38% of executive leadership positions at our company and representing 35% of our employees. We strive to remain a diverse company as we believe it is integral to our success.
Our Suppliers
We build long term relationships with companies that are capable to meet our stringent technical requirements at the same time as being cost competitive, and who can scale with us over time. As a result, we work closely with our suppliers to understand their business as we grow together. We use suppliers from the U.S., China, Japan and other locations.
Although there are multiple sources for most of the component parts of our products, some components are sourced from single or, in some cases, limited sources, which can increase risks of materials availability for production, including with
current semiconductor shortages. We also use contract manufacturers primarily in Thailand and other Asia locations for the back-end manufacturing of certain of our products.
We also work to develop new companies as suppliers for new technologies, innovations and for purposes of managing costs and technology competitiveness over time. We examine our supply chain for their performance, quality, technology and technology roadmaps, service, engineering talent, labor practices and environmental sustainability.
We promote long-term relationships with suppliers that we believe have the elements for long-term success, and whose management exercise good practices for both their long-term success and our long-term success and competitiveness.
Our Customer Relationships and Support for Supply Chains
Our sales process requires design and development in collaboration with customers, working with them through their introduction of new, advanced communications systems, whether for Cloud infrastructure customers or for telecom equipment manufacturers. As a supply philosophy we maintain long term relationships with customers and our business grows with them over time, while simultaneously working to develop new customers. Our maintaining close technical collaboration and commercial working relationships with customers required that we have a technically capable and commercially adept global sales and engineering team facing our customers that can support the totality of their supply chains.
Our direct sales force works with our customers in an integrated approach to understand current and future needs. Because we operate a sales model that focuses on alignment with our customers, we additionally must operate our manufacturing and product delivery functions to accommodate flexible demand.
Sales of our products generally are made pursuant to purchase orders, often with short lead times. Purchase orders are typically made without deposits and quantities actually purchased by our customers are frequently revised to reflect changes in our customers’ needs. In 2021, in part due to global supply chain challenges, sales by purchase orders comprised about 90% of our revenue.
Certain of our customers use vendor managed inventory ("VMI") arrangements under which we manufacture at a customer’s request, then ship to its facility or a designated contract manufacturer for the customer, to be held until it is used by the customer. We maintain title to VMI until the customer uses the inventory. At that time the customer takes title to the products, it reports the consumption to us and we recognize the revenue for the product sale. In 2021, sales by customer VMI arrangements comprised approximately 10% of our revenue.
For larger network equipment companies and for Cloud hyperscalers, additional needs for maintaining inventory arises from their need for supply flexibility in the face of longer lead times for some supply chain components including chip-level components produced in wafer fabs. We anticipate that as our revenue increases from hyperscalers, our proportion of finished goods inventory to sales for those companies will increase, as will our need for maintaining more raw material inventory as a percent of total inventory.
The business cycle, as well as international trade discussion between countries including the U.S. and China, require that we carefully monitor and adjust production levels in line with end user demand to minimize impacts of inventory overstocking.
In 2021, we experienced increasing challenges as a result of the global supply chain being impacted by semiconductor chip shortages and other products. These challenges are expected to continue through 2022.
Our Competitors
The market for optical communications systems is highly competitive. We specialize in products that provide the highest speed over distance for which there are fewer competitors than in the broader market. While no single company competes with us across all of our product areas, our competitors range from large international companies offering a wide range of products to smaller companies specializing in narrow markets. We believe the principal competitive requirements to be successful in this market are:
•ability to provide leading edge technologies for high speed and highest speed over distance communications, including ultra-pure light tunable lasers;
•ability to integrate complex and highly precise chip-based and component product designs into sub-system level solutions;
•ability to produce these complex chip-level products and module products solutions that require precise and high quality manufacturing processes and controls, and;
•ability to consistently produce and deliver the complex products in high volume with high reliability and high quality to customers globally.
We believe we compete favorably with respect to these factors. We believe our principal competitors include:
•In lasers and coherent products Cisco Systems through its acquisition of Acacia Communications, Furukawa Electric Co., Ltd., Fujitsu Optical Components Limited, Molex Incorporated, NTT Electronics Corporation, II-VI Incorporated, Sumitomo Electric Industries, Ltd. and others, and;
•In wavelength management and switching Accelink Technologies Co., Ltd., II-VI, Lumentum Holdings Inc., Molex Incorporated and NTT Electronics.
We also face competition from some of our customers, including Cisco, Huawei and Ciena, who evaluate our capabilities against the merits of manufacturing products internally. These customers may have the ability to manufacture competitive products at a lower cost than we would charge as a result of their higher levels of integration.
Our Financial Information by Geographic Region
Our geographic sales represent locations of our customers or their respective contract manufacturers rather than the location of final use or deployment. Major contract manufacturer locations for our customers include Mexico, China, Thailand, Malaysia and Singapore. These are our “ship to” destinations. We have historically reported quarterly revenue by geographic territory, i.e. Americas, China, and Rest of World.
We serve virtually all leading network equipment manufacturers globally. Seven of these customers comprise more than 80% of our revenue.
For information regarding our revenue and property, plant and equipment by geographic region, see Note 3 and Note 19 to the Consolidated Financial Statements.
Our Environmental, Health and Safety Matters
We operate our research and development and manufacturing operations globally with a goal of enhancing value and sustainability over time by steadily investing in improvements to our operations. Our facilities and our products are subject to a variety of environmental, health and safety laws and regulations in the jurisdictions in which we operate including employees health and safely, discharges of effluents, hazardous materials and solid waste, energy efficiency and carbon emissions, and the preservation and improvement of air, water and soil resources. We continue to develop and improve our manufacturing operations to comply with environmental, health and safety requirements and improve the overall performance of our operations to create even more sustainable methods of operation.
Operating facilities and procedures support local initiatives for employee health and safety, including Covid-19 prevention and containment measures, risk reduction and disaster preparedness, environmental protections that include liquid and gaseous effluent reduction, carbon reduction, and solid waste reduction and recycling. Moreover, we support multiple initiatives to improve our energy efficiency while reducing our emissions. We are compliant with current requirements in each location in which we have operations, and we similarly pursue best practices in our owned factories and with our subcontractor manufacturing partners. We continue to invest in and develop and adopt new and improved methods and procedures as these requirements evolve.
Export Control
We are subject to export and import control laws, trade regulations and other trade requirements that limit which products we sell and where and to whom we sell our products. Because we are committed to complying with all applicable export laws, regulations, and requirements, we have reviewed and revised our processes and procedures to ensure that our shipments to our customers remain compliant with applicable export laws.
Available Information
We file electronically with the U.S. Securities and Exchange Commission, or SEC, our annual reports on Form 10-K, quarterly reports on Form 10-Q, current reports on Form 8-K, and amendments to those reports filed or furnished pursuant to Section 13(a) or 15(d) of the Securities Exchange Act of 1934, as amended. We make available free of charge on our website at www.neophotonics.com copies of these reports as soon as reasonably practicable after filing them with the SEC.
Our principal offices are located at 3081 Zanker Road, San Jose, CA 95134, USA and our telephone number is +1 (408) 232-9200. Our website address is www.neophotonics.com. Information accessible through our website is not a part of, and is not incorporated into, this Annual Report on Form 10-K.
ITEM 1A. RISK FACTORS
RISKS ASSOCIATED WITH THE MERGER
Our proposed Merger may be delayed or not occur at all for a variety of reasons, some of which are outside of the parties' control, and if these conditions are not satisfied, the Merger Agreement may be terminated and the Merger may not be completed.
On November 3, 2021, we entered into the Merger Agreement, with Lumentum Holdings Inc. and Neptune Merger Sub, Inc., a wholly owned subsidiary of Lumentum Holdings. The Merger Agreement provides for the merger of the Neptune Merger Sub with and into us, which we refer to as the “Merger”, with us surviving the Merger as a wholly owned subsidiary of Lumentum. Completion of the Merger is subject to customary closing conditions, including (i) obtaining Chinese antitrust approvals (ii) the absence of governmental injunctions or other legal restraints prohibiting the Merger or imposing certain antitrust restraints and (iii) the absence of a “Material Adverse Effect,” as defined in the Merger Agreement. In addition, the obligation of each party to consummate the Merger is conditioned upon, among other things, the accuracy of the representations and warranties of the other party (subject to certain materiality exceptions), and material compliance by the other party with its covenants under the Merger Agreement. Therefore, the Merger may not be completed or may not be completed as quickly as expected.
In addition, if the Merger is not completed by August 3, 2022, either we or Lumentum may choose to terminate the Merger Agreement (subject to two automatic extensions if the closing is delayed due to certain conditions to closing relating to antitrust laws not being satisfied but all other conditions to the closing are otherwise satisfied or could be satisfied at the closing). Either party may also elect to terminate the Merger Agreement in certain other circumstances, including by mutual written consent of both parties.
Failure to complete the Merger could adversely affect our business and the market price of our common stock in a number of ways, including:
•The market price of our common stock may decline to the extent that the current market price reflects an assumption that the Merger will be consummated;
•If the Merger Agreement is terminated under certain circumstances specified in the Merger Agreement, we would be required to pay a termination fee of $27,500,000;
•We have incurred, and will continue to incur, significant expenses for professional services in connection with the Merger for which we will have received little or no benefit if the Merger is not consummated; and
•A failed Merger may result in negative publicity and/or give a negative impression of us in the investment community, with our suppliers, and with our customers.
Efforts to complete the Merger could disrupt our relationships with third parties and employees, divert management’s attention, or result in negative publicity or legal proceedings, any of which could negatively impact our operating results and ongoing business.
We have expended, and continue to expend, significant management time and resources in an effort to complete the Merger, which may have a negative impact on our ongoing business. Uncertainty regarding the outcome of the Merger and our future could disrupt our business relationships with our existing and potential customers, suppliers, vendors, landlords and other business partners, who may attempt to negotiate changes in existing business relationships or consider entering into business relationships with parties other than us. Uncertainty regarding the outcome of the Merger could also adversely affect our ability to recruit and retain key personnel and other employees. The pendency of the Merger may also result in negative publicity and a negative impression of us in the financial markets, and it has led to, and may result in additional, litigation against us and our directors and officers. Such litigation is distracting to management and, may, in the future, require us to incur significant costs. Such litigation could result in the Merger being delayed and/or enjoined by a court of competent jurisdiction, which could prevent the Merger from becoming effective. The occurrence of any of these events individually or in combination could have a material and adverse effect on our business, financial condition and results of operations.
The Merger Agreement contains provisions that limit our ability to pursue alternatives to the Merger which could discourage a potential competing acquiror from making an alternative transaction proposal.
The Merger Agreement contains provisions that preclude our ability to pursue alternatives to the Merger and require us to refrain from authorizing or knowingly permitting our representatives from soliciting alternative transactions, which likely would discourage a potential third-party acquiror or merger partner from making an alternative transaction proposal that we could not accept in light of the approval of the Merger by our stockholders.
Additionally, if the Merger Agreement is terminated and we determine to seek another business combination, we may not be able to negotiate a transaction with another party on terms comparable to, or better than, the terms of the Merger.
While the Merger Agreement is in effect, we are subject to restrictions on our business activities.
While the Merger Agreement is in effect, we are subject to restrictions on our business activities and must generally operate our business in the ordinary course, subject to certain exceptions. These restrictions could prevent us from pursuing attractive business opportunities that may arise prior to the consummation of the Merger. Although we may be able to pursue such activities with the Lumentum’s consent, Lumentum may not be willing to provide its consent for us to do so.
If the Merger occurs, our stockholders will not be able to participate in any further upside to our business.
If the Merger is consummated, our stockholders will receive $16.00 in cash per share, without interest and subject to applicable tax withholding, of our common stock owned by them, and will not receive any shares of Lumentum’s common stock. As a result, if our business following the Merger performs well, our current stockholders will not receive any additional consideration and will therefore not receive any benefit from any such future performance of our business.
Litigation could delay and or prevent the Merger from becoming effective or from becoming effective within the expected timeframe.
We and our directors were named as defendants in several lawsuits brought by purported stockholders challenging the Merger and seeking various forms of injunctive and declaratory relief, as well as awards of damages, costs, expert fees and attorneys’ fees. While the plaintiffs in these lawsuits have dismissed their claims, we may be subject to additional future litigation challenging the Merger. One of the conditions to the completion of the Merger is that no injunction by any governmental entity of competent jurisdiction, such as a court, will be in effect that prohibits or makes illegal the consummation of the Merger. As such, if any future legal actions result in an injunction prohibiting the consummation of the Merger, then such injunction may prevent the Merger from becoming effective or from becoming effective within the expected timeframe, either of which could substantially harm our business.
RISKS ASSOCIATED WITH OUR BUSINESS
We are dependent on a small number of customers for a significant portion of our revenue and the loss of, or a significant reduction in orders in any period from any of these major customers may reduce our revenue and adversely impact our results of operations.
The telecommunications systems market is concentrated with approximately ten global network equipment manufacturing companies having collectively more than 90% market share. We have generated most of our revenue from a limited number of customers. Our top five customers accounted for 75%, 79%, and 84% of our revenue in the in the years ending December 31, 2021, 2020, and 2019 respectively. Four customers were greater than 10% of our revenue for the year ended December 31, 2021, and three customers were greater than 10% for the year ended December 31, 2020.
The lack of significant growth from, the loss of, or a significant reduction in orders from any of our major customers would materially and adversely affect our revenue and results of operations. In 2021, the reduction in revenue from Huawei, our largest customer in 2020, due to Department of Commerce export restrictions had a material adverse effect on our results of operations in 2021. Our sales to Huawei are expected to remain adversely impacted.
Supply constraints and manufacturing problems could impact manufacturing yields or result in delays in product shipments to customers and could adversely affect our revenue, competitive position, and reputation.
Our products contain purchased components including electronic components and semiconductors. Due to the global shortages in the supply of semiconductors, we have experienced delays and disruptions in our manufacturing operations as well as increased costs to ensure supply. These delays and disruptions have adversely impacted component manufacturing volumes and have resulted in delays in our product shipments. As a result, product shipments to our customers have been delayed beyond the shipment schedules requested by our customers, which has negatively affected our revenue and margins. Until the global shortages in the supply of semiconductors is resolved, our manufacturing volumes and shipment dates to customers and product costs may continue to be adversely impacted. Continued shortages in the supply of semiconductors and other electronic components may also cause us to experience quality control problems in our manufacturing operations, could negatively affect our competitive position and reputation, and we may be unable to meet our growth and revenue targets due to an inability to purchase sufficient components for our products to satisfy customer demand.
Additionally, manufacturing of new products and manufacturing yields generally depend on a number of factors, including the stability and manufacturability of the product design, manufacturing improvements gained over cumulative production volumes, the quality and consistency of component parts and the nature and extent of customization requirements by customers. Capacity constraints, raw materials shortages, logistics issues, labor shortages, volatility in utilization of manufacturing operations, supporting utility services and other manufacturing supplies, the introduction of new product lines, rapid increases in production demands and changes in customer requirements, manufacturing facilities or processes, or those of some third party contract manufacturers and suppliers of raw materials and components have caused, and may in the future cause, reduced manufacturing yields, negatively impacting the gross margin on, and our production capacity for, those products.
Our ability to maintain sufficient manufacturing yields is particularly challenging with respect to PICs due to the complexity and required precision of a large number of unique manufacturing process steps. Manufacturing yields for PICs can also suffer if contaminated materials or materials that do not meet highly precise composition requirements are inadvertently utilized. Because a large portion of our PIC manufacturing costs are fixed, PIC manufacturing yields can have a substantial effect on our gross margin. Lower than expected manufacturing yields could also delay product shipments and decrease our revenue.
Additionally, it is possible that purchased components could contain quality defects, manufacturing defects, performance problems or even counterfeit substitutes, each of which could result in manufacturing issues. As a result, we could incur additional costs that would adversely affect our gross margin, and product shipments to our customers could be delayed beyond the shipment schedules requested by our customers, which would negatively affect our revenue, competitive position and reputation.
Our solutions for the Cloud and data center market segments may not achieve broader market acceptance, which would prevent us from increasing our revenue and market share.
Part of our overall strategy is to continue to expand our optoelectronic solutions for the highest speed Cloud and data center market segments. If we fail to achieve broader acceptance of our products in the Cloud and data center markets, there would be an adverse impact on our ability to increase our revenue, gain market share and achieve and sustain profitability. Our ability to achieve broader market acceptance for our products will be impacted by a number of factors, but not limited to:
•Our ability to produce optoelectronic solutions for 100G to 800G and beyond that compete favorably against other solutions on the basis of price, quality, reliability and performance;
•Our ability to timely introduce and complete new designs and timely qualify and certify our products;
•Whether major Cloud and hyperscale data center operators will adopt our solutions, which are based on a new network architecture and have a limited history in these market segments;
•Our ability to develop products that comply with applicable standards and regulatory requirements, as well as potential in-country manufacturing requirements; and;
•Our ability to develop and maintain successful relationships with our customers and suppliers, many of whom are large companies with substantial negotiating power.
•If the Cloud and data center market segments delay their deployments or fail to grow as expected, or if demand for our solutions in these segments fails to materialize, our business, financial condition, results of operations, and prospects will suffer.
If our key customers do not qualify our products for use or do not award us design wins, then our results of operations may suffer.
Prior to placing volume purchase orders with us, most of our customers require us to obtain their approval, a process called qualification in our industry, for our new and existing products. Our customers often audit our manufacturing facilities and perform other vendor evaluations during this process. The qualification process involves product sampling and reliability testing and collaboration with our product management and engineering teams in the design and manufacturing stages. If we are unable to qualify our products with customers, then our revenue would be lower than expected and we may not be able to recover the costs associated with the qualification process which would have an adverse effect on our results of operations.
In addition, due to evolving technological changes in our markets, a customer may cancel or modify a design project before we have qualified our product or begun volume manufacturing of a qualified product. It is unlikely that we would be able to recover the expenses for cancelled or unutilized custom design projects.
Once we have achieved qualification, there is no guarantee that our customers will purchase our products in volume. Our customers typically select two to three vendors per design or version of their products and award a design win. If we are not awarded a design win, our customer will not place volume purchase orders for that version of the customer product.
We face intense competition which could negatively impact our results of operations and market share.
The communications networks industry is highly competitive. Our competitors range from large international companies offering a wide range of products to smaller companies specializing in niche products.
Some of our competitors have substantially greater name brand recognition, technical, financial, and marketing resources, and greater manufacturing capacity, as well as better-established relationships with customers, than we do. Some of our competitors have more resources to develop or acquire, and more experience in developing or acquiring, new products and technologies. Some of our competitors may be able to develop new products more quickly than us, may be able to develop products that are more reliable or which provide more functionality than ours, and may be able to ramp production faster than we can. In addition, some of our competitors have the financial resources to offer competitive products at below-market pricing levels that could prevent us from competing effectively and result in a loss of sales or market share or cause us to lower prices for our products.
We also face competition from some of our customers who evaluate our capabilities against the merits of manufacturing products internally. Due to the fact that such customers are not seeking to make a comparable profit directly from the manufacture of these products or for other reasons, they may have the ability to provide competitive products at a lower total cost than we would charge such customers. As a result, these customers may purchase less of our products and there would be additional pressure to lower our selling prices which, accordingly, would negatively impact our revenue and gross margin.
Customer demand is difficult to accurately forecast and, as a result, we may be unable to optimally match production with customer demand.
We make planning and spending decisions based on our estimates of customer requirements. The short-term nature of commitments by many of our customers, and the possibility of unexpected changes in demand for their products, reduce our ability to accurately estimate future customer requirements. Additionally, due to global semiconductor and electronic component shortages, the purchase lead time for many have our components has increased substantially, in some cases to over a year. To ensure that we have sufficient components to build our products to meet expected customer demands, we have placed non-cancellable orders for these components. A sudden reduction in customer demand would have a material adverse effect on our operating results, as occurred in 2017, because many of our costs and operating expenses are relatively fixed.
On the other hand, customers may require rapid increases in production, which can strain our resources, cause our manufacturing to be negatively impacted by materials shortages, necessitate higher or more restrictive procurement commitments, increase our manufacturing yield loss and scrapping of excess materials, result in delayed shipments and/or reduce our gross margins. We may not have sufficient capacity at any given time to meet the volume demands of our customers, and we may have difficulty expanding our manufacturing operations on a timely basis to meet increasing customer demand. Additionally, one or more of our suppliers may not have sufficient capacity at any given time to meet our volume demands. Any inability to meet customer demands for rapid increases in production in the future could have a material adverse effect on our business, financial condition, results of operations and prospects.
If we fail to retain our key personnel or if we fail to attract additional qualified personnel, we may not be able to achieve our anticipated growth and our business could suffer.
Our success and ability to implement our business strategy depends upon the continued contributions of our senior management team and others, including senior management in foreign subsidiaries and our technical and operations employees in all locations. Our future success depends, in part, on our ability to attract and retain key personnel, including our senior management and others. The loss of services of members of our senior management team or key personnel or the inability to continue to attract and retain qualified personnel could have a material adverse effect on our business. Competition for highly skilled technical and operations people where we operate is extremely intense, and we continue to face challenges identifying, hiring and retaining qualified personnel in many areas of our business. The anticipated merger has also created perceived uncertainty from current and prospective employees, which has placed additional strain on our ability to attract and retain key personnel.
We have had a history of losses, we returned to losses in the fourth quarter of 2021, and losses may recur in the future.
We have had a history of losses and we may incur additional losses in future periods. As of December 31, 2021, our accumulated deficit was $459.6 million. Due to the global semiconductor shortage, shipments to our customers were delayed and as a result our revenue suffered in 2021. Our inability to purchase sufficient semiconductor components to meet customer demand for our products may result in additional losses in 2022.
We continue to review our expenditures related to the ongoing operations of our business for their effectiveness. We plan to make adjustments to our expenditures as needed. These include expenditures related to the sales, marketing and development of our products and to maintain our manufacturing facilities and research and development operations. Operations and assets that are deemed to be less effective have been and may in the future be subject to restructuring, which could lead to increased operating losses in future periods when and if restructuring charges are incurred.
We are subject to governmental export and import rules and regulations that could subject us to liability, impair our ability to compete in international markets, or restrict our sales to certain customers.
We are subject to export and import control laws, trade regulations and other rules that limit which products we sell and where and to whom we sell our products. The United States, China, and various countries regulate the export or import of certain technologies and have enacted laws that could limit our ability to distribute our products. Failure to comply with these and similar laws or any limitation on our ability to export or sell our products or to obtain any required licenses would adversely affect our business, financial condition and results of operations.
The United States Department of Commerce, Bureau of Industry and Security (“BIS”) has added Huawei and certain of its affiliates and Fiberhome and certain of its affiliates to its Entity List. To comply with the restrictions and requirements of the Entity list, we have conducted multiple systematic assessments of our products to ensure compliance. The BIS restrictions impact our products, our manufacturing processes, our manufacturing equipment, and our components. Due to the complexity of such regulations, we sometimes have halted shipment to these customers while the assessments were underway, resulting in adverse revenue impact.
Any additions to or changes in laws, rules, or regulations may result in our inability to ship products to customers, a reduction in the type or quantity of products we can ship, or our inability to use existing suppliers, resulting in negative impacts on our cost structure and results of operation. Various newly enacted and proposed laws and regulations, such as the proposed new regulations in the United States on Information and Communications Technology and Services (“ICTS”) and the Export Control Law (“ECL”) enacted in China, could result in new licensing requirements delays, restrictions, or prohibitions the import, export, or sale of our products to various countries or customers.
Additionally, even if we are legally able to sell the same types of products we have sold historically to affected customers, such customers may decide not to purchase these products for various reasons, including to reduce its own risks of being exposed to disruptions of its supply chain. Furthermore, there can be no assurance that the various regulatory entities, including the U.S. government, will not challenge our determination of which products and associated technology are not subject to the applicable laws, rules, and regulations.
Continued tension in U.S.-China trade relations may adversely impact our business and operating results.
The U.S. government has taken certain other actions in the past several years that impact U.S.-China trade relations, including recently imposed tariffs affecting certain products manufactured in China. Some products manufactured by our Chinese affiliates are subject to tariffs if imported into the United States. In addition, the China government has taken certain reciprocal actions, including tariffs, which affect certain products manufactured in the United States. Certain of our products manufactured in our U.S. operations were included in the tariffs imposed on imports into China from the United States. As of March 2020, tariffs on most of the products we imported into China have been eliminated. However, there can be no assurance that China will not re-impose these or similar tariffs, impose export restrictions, or take other retaliatory trade actions that may have a material impact on our business.
It is unknown whether and to what extent additional new tariffs or other new laws or regulations will be adopted that increase the cost of importing products to or from the United States, or from China to the United States. Further, it is unknown what effect that any such new tariffs or retaliatory actions would have on us or our industry and customers. As additional new tariffs, legislation and/or regulations are implemented, or if existing trade agreements are renegotiated or if China or other affected countries take retaliatory trade actions, such changes could have a material adverse effect on our business, financial condition, results of operations or cash flows.
In response to trade tensions, the Chinese government and/or individual Chinese customers may take steps to reduce their supply chain dependence on products from U.S. suppliers through their own internal developments or the selection of non-U.S. suppliers, placing us at a commercial disadvantage and potentially affecting our business.
Our future results of operations may be subject to volatility as a result of exposure to fluctuations in foreign exchange rates, primarily the Chinese Renminbi (RMB) and Japanese Yen (JPY) exchange rates.
We are exposed to foreign exchange risks. Foreign currency fluctuations may adversely affect our revenue and our costs and expenses, and hence our results of operations. A substantial portion of our business is conducted through our subsidiaries based in China, whose functional currency is the RMB, and in Japan, whose functional currency is the JPY. The value of the RMB against the U.S. dollar and other currencies and the value of the JPY against the U.S. dollar and other currencies fluctuate and are affected by, among other things, changes in political and economic conditions.
We depend upon outside contract manufacturers for a portion of the manufacturing process for some of our products. Our operations and revenue related to these products could be adversely affected if we encounter problems with any such contract manufacturer.
While many of our products are manufactured internally, we also rely upon contract manufacturers in Thailand, China, Japan, other Asia locations, and Canada to provide back-end manufacturing and production of some of our products. Our reliance on contract manufacturers for some of our products makes us vulnerable to possible production capacity constraints, reduced control over their supply chains, delivery schedules, manufacturing yields, manufacturing quality controls and costs. If one of our contract manufacturers is unable to meet all of our customer demand in a timely fashion, whether due to their direct operating control, due to their supply chain or due to the Covid-19 pandemic or other factors, this could have a material adverse effect on the revenue from our products.
Increasing inflation may negatively impact our business.
Inflation in the United States and worldwide may result in increased costs and additional shortages of supplies and components that are critical to the manufacturing of our products, may increase cost of borrowing through our lines of credit, and may reduce our purchasing power, all of which would have a negative impact on our results of operation.
We are under continuous pressure to reduce the prices of our products, which has adversely affected, and may continue to adversely affect, our gross margins.
The communications networks industry has been characterized by declining product prices over time as technological advances improve performance of new products and put pressure on existing products to reduce prices. We have reduced the prices of many of our products in the past, most often during annual end-of-year price negotiation. We expect pricing pressure for our products to continue. To maintain or increase their market share, our competitors also reduce prices of their products each year. In addition, our customers may seek to internally develop and manufacture competing products at a lower cost than we would otherwise charge, which would add additional pressure on us to lower our selling prices. If we are unable to offset any future reductions in our average selling prices by increasing our sales volume, reducing our costs or introducing new products, our gross margin would be adversely affected.
The communications networks industry has long product development cycles requiring us to incur product development costs without assurances of an acceptable investment return.
Large volumes of communications equipment and support structures are installed with considerable expenditures of funds and other resources, and long investment return period expectations. At the component supplier level, these cycles create considerable, typically multi-year, gaps between the commencement of new product development and volume purchases. Due to changing industry and customer requirements, we are constantly developing new products, including seeking to further integrate functions on PICs and developing and using new technologies in our products. These development activities necessitate significant investment of capital. Our new products often require a long time to develop because of their complexity and rigorous testing and qualification requirements. Accordingly, we and our competitors often incur significant research and development and sales and marketing costs for products that, initially, will be purchased by our customers long after much of the cost is incurred and, in some cases, may never be purchased due to changes in industry or customer requirements in the interim.
The majority of our customer contracts do not commit customers to specified buying levels, and many of our customers may decrease, cancel or delay their buying levels at any time with little or no advance notice to us.
Our products are typically sold pursuant to individual purchase orders or by use of a vendor-managed inventory ("VMI"), model, which is a process by which we ship agreed quantities of products to a customer-designated location and those products remain our inventory and we retain the title and risk of loss for those products until the customer takes possession of the products. Our customers are typically not contractually committed to buy any quantity of products beyond firm purchase orders. Many of our customers may increase, decrease, cancel or delay purchase orders already in place, which may impact our level of business.
We may be subject to disruptions or failures in information technology systems and network infrastructures that could have a material adverse effect on our business and financial condition.
We rely on the efficient and uninterrupted operation of complex information technology systems and network infrastructures to operate our business. A disruption, infiltration or failure of our information technology systems as a result of software or hardware malfunctions, system implementations or upgrades, computer viruses, cyber-attacks, third-party security breaches, employee error, theft or misuse, malfeasance, power disruptions, natural disasters or accidents could cause breaches of data security, loss of intellectual property and critical data and the release and misappropriation of sensitive competitive information and partner, customer and employee personal data. Any of these events could harm our competitive position, result in a loss of customer confidence, cause us to incur significant costs to remedy any damages and ultimately materially adversely affect our business and financial condition.
In December 2020, we discovered that we were affected by the Solar Winds Corporation cybersecurity breach; however our comprehensive review by an internal information security group and a third party cybersecurity investigator found no evidence of any suspicious activity on our networks or of any compromise to our data.
Despite using updated security measures, our systems may continue to be vulnerable to cyber security attacks or breaches. While we continually work to safeguard our internal network systems, processes, procedures, and user training to mitigate these potential risks, there is no assurance that these measures will be sufficient to prevent future cyber-attacks. Because security incidents are often not detected immediately, we also may face difficulties or delays in identifying or responding to security breaches and security-related incidents. Additionally, if we discover a threat and take remediation efforts, there may be compromises to our data that our investigation did not uncover or additional undiscovered malware on our networks which could result in further breaches of data security or interruptions of our information technology systems.
The Covid-19 pandemic has and could further harm our operations and our financial operations.
Our operations and supply chain are and could continue to be impacted by the implications of the Covid-19 pandemic, which could harm our future revenue and financial condition and increase our costs and expenses. Our manufacturing operations in Silicon Valley, California; Tokyo, Japan; and Shenzhen and Dongguan, China have been affected and could continue to be affected with actions such as being temporarily shut down, requiring longer lead times or being subject to logistics issues. The same issues have affected and could continue to impact key suppliers in Patumthanee, Thailand, and Ottawa, Canada and other locations throughout United States and Asia. The efficiency of our business operations (including sales and research and development) could also be reduced as a result of compliance with shelter-in-place orders in Silicon Valley, California; Ottawa, Canada; and Shenzhen and Wuhan, China.
Similarly, our worldwide operations could be subject to secondary effects of the pandemic. Even if our facilities are not directly affected, the pandemic and its effects could substantially disrupt the business of our suppliers or customers, which could have a material adverse effect on us.
Accordingly, we may experience significant disruptions as a result of the Covid-19 pandemic that could materially impact our business, including:
•Slower customer deployments of systems using our products due to uncertainty in the business climate;
•Reduced demand for our products;
•Disruptions of the supply chain of components needed for our products; and
•Disruptions of our ability to conduct sales, marketing, product development and other important business activities.
The extent to which the Covid-19 pandemic will continue to impact our business will depend on future developments, which are highly uncertain and cannot be predicted with confidence, such as the duration of the outbreak, travel restrictions, governmental mandates issued to mitigate the spread of the disease, business closures, economic disruptions, and the effectiveness of actions taken to contain and treat the virus. Accordingly, we expect the Covid-19 pandemic may have a
negative impact on our sales and our results of operations, the size and duration of which are difficult to predict. We are not insured against major public health events, including the Covid-19 pandemic.
To the extent the Covid-19 pandemic adversely affects our business and financial results, it may also have the effect of heightening many of the other risks described in this ‘‘Risk Factors’’ section, such as reduced spending for communications networks, fluctuations in customer demand, manufacturing and supply constraints, and our ability to raise capital (if necessary).
If the Merger is not completed or is delayed substantially, we may need to raise additional capital in order to pursue our business strategies or maintain our operations, and we may not be able to obtain capital when desired on favorable terms, if at all, or without dilution to our stockholders.
We believe that our existing cash and cash equivalents, and cash flows from our operating activities and funds available under our credit facilities will be sufficient to meet our anticipated cash needs for at least the next 12 months. However, we operate in an industry that makes our prospects difficult to evaluate. It is possible that we may not generate sufficient cash flow from operations or otherwise have the capital resources to meet our future capital needs. If this occurs and the Merger is not completed or is substantially delayed, we may need additional financing to continue operations or execute on our current or future business strategies, including to:
•Invest in our research and development efforts (particularly in the Cloud and data center interconnect market segments), including by hiring additional technical and other personnel;
•Maintain and expand our operating or manufacturing infrastructure (particularly for our Cloud and data center products);
•Acquire complementary businesses, products, services or technologies; or
•Otherwise pursue our strategic plans and respond to competitive pressures.
We do not know with certainty what forms of financing, if any, will be available to us. If financing is not available on acceptable terms, if and when needed, our ability to fund our operations, enhance our research and development and sales and marketing functions, develop and enhance our products, respond to unanticipated events, including unanticipated opportunities, or otherwise respond to competitive pressures could be adversely impacted.
If we incur additional indebtedness through arrangements such as credit agreements or term loans, such arrangements may impose restrictions and covenants that limit our ability to respond appropriately to market conditions, make capital investments or take advantage of business opportunities. In addition, any additional debt arrangements we may enter into would likely require us to make regular interest payments, which could adversely affect our results of operations.
We may be exposed to costs or losses from product lines that we intend to exit or may undertake divestiture of portions of our business that require us to continue providing substantial post-divestiture transition services and support, which may cause us to incur unanticipated costs and liabilities and adversely affect our financial condition and results of operations.
We have a strategy to exit products that have been declining in revenue and have lower gross margins than our other higher speed products. We may incur additional costs in connection with the sale or end-of-life of these products, or other products and/or facilities in the future, and our revenues and net income could be negatively impacted, particularly in the short term, in connection with the end-of-life or sales of such products and/or facilities. It is also possible that we could incur continued costs or liabilities after the end-of-life process is completed, which could have a material adverse effect on our financial condition or operating results.
Spending for communications networks is cyclical in nature, and any future downturn may reduce demand for our products and revenue.
Our future success as a provider of components, modules and subsystems to leading network equipment vendors depends on continued capital spending on global communications networks. Network traffic has experienced rapid growth driven primarily by bandwidth-intensive content, including cloud services, mobile video and data services, wireless 4G/LTE and now 5G services, social networking, video conferencing and other multimedia. This growth is intensified by the proliferation of fixed and wireless devices that are enabling consumers to access content at increasing data rates anytime and anywhere. Our future success depends on continued demand for high-bandwidth, high-speed communications networks and the ability of network equipment vendors and carrier data center operators to fulfill this demand. Our business and financial results will suffer if anticipated growth does not occur as expected.
The markets for communications networks and network equipment are cyclical and characterized by rapid technological change, price erosion, evolving standards and wide fluctuations in product supply and demand. In the past, including recently to varying degrees in China, the U.S. and Europe, these markets have experienced significant downturns,
often connected with, or in anticipation of, the maturation of product cycles for both manufacturers’ and their customers’ products or in response to over or under purchasing of inventory by our customers relative to end user demand, and with declining general economic conditions. These downturns have been characterized by diminished product demand, production overcapacity, high inventory levels and accelerated erosion of average selling prices. Our historical results of operations have been subject to substantial fluctuations as a result of market downturns and changes in capital spending, and we may experience substantial period-to-period fluctuations in future results of operations.
Risks associated with international sales and operations could adversely affect our business and financial results.
We derive a significant portion of our revenue from international sales in various markets, and we have substantial operations in China, Japan and Thailand in addition to the U.S. Our international revenue and operations are subject to a number of material risks, including, but not limited to:
•Difficulties in staffing, managing and supporting operations across different jurisdictions;
•Difficulties in enforcing agreements and collecting receivables through foreign legal systems;
•Fewer legal protections for intellectual property in foreign jurisdictions;
•International trade restrictions;
•Difficulties in obtaining any necessary governmental authorizations for the export of our products to certain foreign jurisdictions;
•Imposition of regulatory restrictions on sales to any of our major customers;
•Fluctuations in foreign economies and fluctuations in the value of foreign currencies and interest rates;
•Major health events, such as outbreaks of contagious disease;
•Domestic and international economic or political changes, hostilities and other disruptions; and
•Difficulties and increased expenses in complying with a variety of U.S. and foreign laws, regulations and trade standards, including the Foreign Corrupt Practices Act and international labor standards.
Negative developments in any of these areas in China, Japan, Canada, Thailand or other countries could result in a reduction in demand for our products, the cancellation or delay of orders already placed, difficulties in producing and delivering our products, threats to our intellectual property, difficulty in collecting receivables, higher labor costs and a higher cost of doing business.
In addition, although we maintain an anti-corruption compliance program throughout our company, violations of our compliance program may result in criminal or civil sanctions, including material monetary fines, penalties and other costs against us or our employees, and may have a material adverse effect on our business.
Our revenues and costs will fluctuate over time, making it difficult to predict our gross margins and future results of operations.
Our revenue, gross margin and results of operations have varied significantly and are likely to continue to vary from quarter-to-quarter due to a number of factors, many of which are not within our control. We may not be able to maintain or improve our gross margins because of slow introductions of new products, pricing pressure from increased competition, failure to effectively reduce the cost of existing products, failure to improve our product mix, future macroeconomic or market volatility reducing sales volumes, changes in customer demand (including a change in product mix among different areas of our business) or other factors. Our gross margins can also be adversely affected for reasons including, but not limited to, fixed manufacturing costs that would not be expected to decrease in proportion to any decrease in revenues; unfavorable production yields or variances; increases in costs of input parts and materials; the timing of movements in our inventory balances; warranty costs and related returns; changes in foreign currency exchange rates; possible exposure to inventory valuation reserves; and other increases in our costs and expenses, including as a result of rising labor costs. Such significant increases in costs without corresponding increases in revenue would materially and adversely affect our business, our results of operations and our financial condition and our gross margins.
We may be involved in intellectual property disputes, which could divert management’s attention, cause us to incur significant costs and prevent us from selling or using the challenged technology.
Participants in the markets in which we sell our products have experienced frequent litigation regarding patent and other intellectual property rights. Numerous patents in these industries are held by others, including our competitors. In
addition, from time to time, we have been notified that we may be infringing certain patents or other intellectual property rights of others (for example, see our discussion on the Finisar dispute). Regardless of their merit, responding to such claims can be time consuming, divert management’s attention and resources and may cause us to incur significant expenses. In addition, there can be no assurance that third parties will not assert infringement claims against us, whether or not such claims are valid. While we believe that our products do not infringe in any material respect upon intellectual property rights of other parties and/or meritorious defense would exist with respect to any assertions to the contrary, we cannot be certain that our products would not be found infringing the intellectual property rights of others.
Although we believe that we would have meritorious defenses to infringement allegations and intend to defend any new lawsuit vigorously, there can be no assurance that we will be successful in our defense. Even if we are successful, we may incur substantial legal fees and other costs in defending the lawsuit. Further, a new lawsuit, if brought by either party, would be likely to divert the efforts and attention of our management and technical personnel, which could harm our business.
If we fail to protect our intellectual property and other proprietary rights, our business and results of operations could be materially harmed.
Our success depends to a significant degree on our ability to protect our intellectual property and other proprietary rights. We rely on a combination of patent, trademark, copyright, trade secret and unfair competition laws, as well as license agreements and other contractual provisions, to establish and protect our intellectual property and other proprietary rights. We have applied for patent registrations in the U.S. and in other foreign countries, some of which have been issued. We cannot guarantee that our pending applications will be approved by the applicable governmental authorities. Additionally, over time, our patents may expire, and we may be unable to secure other intellectual property protections for the technology covered by the expired patents.
Similarly, we must protect all company data as it pertains to customers, products and product designs, technology and technology related trade secrets, plus customer and supplier and personal data of suppliers, customers and personnel. We rely on a combination of these important data elements to establish and protect multiple aspects of our business, and loss of data, breaching of data or stealing of such data could hard our business.
Policing unauthorized use of our technology is difficult and we cannot be certain that the steps we have taken will prevent the misappropriation, unauthorized use or other infringement of our intellectual property rights. Further, we may not be able to effectively protect our intellectual property rights from misappropriation or other infringement in foreign countries where we have not applied for patent protections, and where effective patent, trademark, trade secret and other intellectual property laws may be unavailable, or may not protect our proprietary rights as fully as U.S. or Japan law. Particularly, our U.S. patents do not afford any intellectual property protection in China, Japan, Canada, Russia or other Asia locations.
In the future, we may need to take legal actions to prevent third parties from infringing upon or misappropriating our intellectual property or from otherwise gaining access to our technology. Protecting and enforcing our intellectual property rights and determining their validity and scope could result in significant litigation costs and require significant time and attention from our technical and management personnel. If we fail to protect our intellectual property and other proprietary rights, or if such intellectual property and proprietary rights are infringed or misappropriated, our business, results of operations or financial condition could be materially harmed.
It could be discovered that our products contain defects that may cause us to incur significant costs, divert our attention, result in a loss of customers and result in product liability claims.
Our products are complex and undergo quality testing as well as formal qualification, both by our customers and by us. For various reasons, such as the occurrence of performance problems that are unforeseeable in testing or that are detected only when products age or are operated under peak stress conditions, our products may fail to perform as expected long after customer acceptance. Failures could result from faulty components or design, problems in manufacturing or other unforeseen reasons. As a result, we could incur significant costs to repair or replace defective products under warranty, particularly when such failures occur in installed systems. Any significant product failure could result in lost future sales of the affected product and other products, as well as customer relations problems and litigation, which could harm our business.
Further, our products contain purchased components including electronic components. It is possible that such purchased items could contain quality defects, manufacturing defects, performance problems or even counterfeit substitutes. Any significant product failure that is the result of such defects could result in lost future sales as well as customer relations problems and litigation, which could harm our business.
Our revenues are typically subject to seasonality.
Our first quarter revenue is typically seasonally lower than the rest of the year primarily due to annual price negotiations with customers that occur at the end of the prior year and lower capacity utilization during the annual new year holidays in China. This historical pattern typically adversely affects our revenues in the first quarter of each year and impacts the typical annual distribution of revenue from quarter-to-quarter through the year. That said, our first quarter revenue varies markedly year- to-year so should not be considered a reliable indicator of our future revenue or financial performance.
If we fail to obtain the right to use the intellectual property rights of others which are necessary to operate our business, and to protect their intellectual property, our business and results of operations will be adversely affected.
From time to time we may choose to, or be required to, license technology or intellectual property from third parties in connection with the development of our products. Failure to obtain a necessary third-party license required for our product offerings or to develop new products and product enhancements could adversely affect our business.
Similarly, from time to time, others may endeavor to infringe on our intellectual property or encroach on our trademarks or other intellectual property. Our failure to identify, recognize and/or action to protect such intellectual property could adversely affect our business.
Participation in standards setting organizations may subject us to intellectual property licensing requirements or limitations that could adversely affect our business and prospects.
In the course of our participation in the development of emerging standards for some of our present and future products, we may agree to grant to all other participants a license to our patents that are essential to the practice of those standards on reasonable and non-discriminatory, or RAND, terms. If we fail to limit to whom we license our patents, or fail to limit the terms of any such licenses, we may be required to license our patents or other intellectual property to others in the future, which could limit the effectiveness of our patents against competitors.
Any potential dispute involving our products, services or technology could also include our customers using our products, which could trigger our indemnification obligations to them and result in substantial expenses to us.
In any potential dispute involving allegations that our products, services or technology infringe the intellectual property rights of third parties, our customers could also become the target of litigation. Because we often indemnify our customers for intellectual property claims made against them for products incorporating our technology, any claims against our customers could trigger indemnification obligations in some of our supply agreements, which could result in substantial expenses such as increased legal expenses, product recalls, damages for past infringement or royalties for future use.
Rapidly changing standards and regulations could make our products obsolete, which would cause our revenue and results of operations to suffer.
We design our products to conform to regulations established by governments and to standards set by industry standards bodies worldwide, such as The American National Standards Institute, the European Telecommunications Standards Institute, the International Telecommunications Union and the Institute of Electrical and Electronics Engineers. Various industry organizations are currently considering whether and to what extent to create standards for elements used in 100Gbps and beyond systems. Because certain of our products are designed to conform to current specific industry standards, if competing or new standards emerge that are preferred by our customers, we would have to make significant expenditures to develop new products and our revenue and results of operations would suffer.
We may be unable to utilize our net operating loss carryforwards to reduce our income taxes, which could adversely affect our future financial results.
As of December 31, 2021, we had net operating loss ("NOL"), carryforwards for U.S. federal and state tax purposes of $334.2 million and $54.4 million, respectively. These net operating losses have not been utilized and may not be utilized prior to their expiration in the future. The utilization of the NOL and tax credit carryforwards are subject to a substantial limitation imposed by Section 382 of the Internal Revenue Code of 1986, as amended, or the Code, and similar state provisions. We recorded deferred tax assets, net of valuation allowance, for the NOL carryforwards currently available after considering the existing Section 382 limitation. If we incur an additional limitation under Section 382, then the NOL carryforwards, as
disclosed, could be reduced by the impact of any future limitation that would result in existing NOL carryforwards and tax credit carryforwards expiring unutilized and increases in future tax liabilities.
We are subject to environmental, health and safety laws and regulations, which could subject us to liabilities, increase our costs, or restrict our business or operations in the future.
Our manufacturing operations and our products are subject to a variety of federal, state, local and international environmental, health and safety laws and regulations in each of the jurisdictions in which we operate or sell our products. Our failure to comply with present and future environmental, health or safety requirements, or the identification of contamination, could cause us to incur substantial costs, including cleanup costs, monetary fines, civil or criminal penalties, or curtailment of operations, which could have a material adverse effect on our business, financial condition and results of operations.
Additionally, increasing efforts to control emissions of greenhouse gases ("GHG"), may also impact us. Additional climate change or GHG control requirements are under consideration at the federal level in the U.S. and in China. Additional restrictions, limits, taxes, or other controls on GHG emissions could increase our operating costs and, while it is not possible to estimate the specific impact any final GHG regulations will have on our operations, there can be no assurance that these measures will not have significant additional impact on us.
RISKS RELATED TO OUR OPERATIONS IN CHINA
Our business operations conducted in China are critical to our success. A significant portion of our revenue was recognized from customers for whom we shipped products to a location in China. Additionally, a substantial portion of our net property, plant and equipment, approximately 29% as of December 31, 2021, was located in China. We expect to make further investments in China in the foreseeable future. Therefore, our business, financial condition, results of operations and prospects are to a significant degree subject to economic, political, legal, and social events and developments in China.
Changes in China’s international trade policies may adversely impact our business and operating results.
The China government may change trade policies that impact our operations. Prior to early 2020, the China government imposed tariffs on certain of our products manufactured in our U.S. operations and imported into China from the United States. There has been exemption of these tariffs since then. We expect these tariffs, if applied without exemption, will increase our cost of goods sold. It is unknown if exemption, or any additional such tariffs or retaliatory actions, will be imposed or what impact they would have on us or our industry and customers. As new tariffs, legislation and/or regulations are implemented, or if existing trade agreements are renegotiated between China and the U.S. or other affected countries, such changes could have a material adverse effect on our business, financial condition, results of operations or cash flows. Furthermore, in response to such trade tensions, the Chinese government and/or individual Chinese customers may take steps to reduce their supply chain dependence on products from U.S. suppliers through their own internal developments or the selection of non-U.S. suppliers, placing us at a commercial disadvantage and potentially affecting our business.
A considerable portion of our business outside of the Cloud and data center market segments involves selling high-speed optical components in China and any move to local Chinese vendors for these products might adversely affect our results.
In December 2017, the Chinese Government Ministry of Industry and Information Technology announced a five-year optical component technology roadmap with the aim to reduce China’s dependency on non-domestic companies for high-end optical chips and sub-components, including some products manufactured and sold by us. This announcement continues an ongoing trend in China to build domestic industry in this area. While we believe local Chinese component suppliers do not currently have the capability to supply the highest performance optical chips and sub-components, those companies are actively investing in their development and may over time develop such capability and negatively impact our revenue and financial performance if we do not continue to innovate and maintain our lead in the highest speed and performance optical components.
Adverse changes in economic and political policies in China, or Chinese laws or regulations could have a material adverse effect on business conditions and the overall economic growth of China, which could adversely affect our business.
The Chinese government exercises significant control over China’s economy by way of the allocation of resources, control over foreign currency-denominated obligations and monetary policy and provision of preferential treatment to particular industries or companies. Moreover, the laws, regulations and legal requirements in China, including the laws that apply to foreign-invested enterprises are relatively new and are subject to frequent changes. The interpretation and enforcement of such
laws is uncertain. Any adverse changes to these laws, regulations and legal requirements, including tax laws, or their interpretation or enforcement, or the creation of new laws or regulations relating to our business, could have a material adverse effect on our business. Furthermore, any slowdown or economic downturn, whether actual or perceived, in China could have a material adverse effect on our business, financial condition and results of operation.
Uncertainties with respect to China’s legal system could adversely affect the legal protection available to us.
Our operations in China are governed by Chinese laws and regulations. Our subsidiaries in China are generally subject to laws and regulations applicable to foreign investments in China and, in particular, laws applicable to wholly foreign-owned enterprises. China's laws and regulations may not sufficiently cover all aspects of economic activities in China. Uncertainties in the Chinese legal system may impede our ability to enforce the contracts we have entered into with our distributors, business partners, customers and suppliers. In addition, protections of intellectual property rights and confidentiality in China may not be as effective as in the U.S. or other countries or regions. All of these uncertainties could limit the legal protections available to us and could materially and adversely affect our business and operations.
Restrictions on currency exchange may limit our ability to use our cash effectively.
In China, the State Administration of Foreign Exchange ("SAFE") administers restrictions on currency exchange. These restrictions may limit our ability to use cash held in RMB to fund any business activities we may have outside China or to make dividend payments in U.S. dollars. SAFE or other Chinese regulatory authorities may impose more stringent restrictions on the convertibility of the RMB, especially with respect to foreign exchange transactions. If such restrictions are imposed, our ability to adjust our capital structure or engage in foreign exchange transactions may be limited.
If the Chinese government determines that we failed to obtain approvals of, or registrations with, the requisite Chinese regulatory authority with respect to our current and past import and export of technologies, or failed to obtain the necessary licenses to file patent applications outside China for inventions made in China, we could be subject to sanctions, which could adversely affect our business.
China imposes controls on technology import and export. The term “technology import and export” is broadly defined to include, without limitation, the transfer or license of patents, software and know-how, and the provision of services in relation to technology. Depending on the nature of the relevant technology, the import and export of technology to or from China requires either approval by or registration with, the relevant Chinese governmental authorities. Additionally, the Chinese government requires the patent application for any invention made at least in part in China to be filed first in China, then undergo a government secrecy review and obtain a license before such application is filed in other countries.
If the Chinese government determines that we failed to follow required procedures and obtain the appropriate license before filing a patent application outside China for an invention made at least in part in China, our China patents on such products may be invalidated, which could have a material and adverse effect on our business and operations.
We may be exposed to liabilities under the FCPA and Chinese anti-corruption laws, and any determination that we violated these laws could have a material adverse effect on our business.
We are subject to the Foreign Corrupt Practices Act of 1977 ("FCPA") and other laws that prohibit improper payments or offers of payments to foreign governments and their officials and political parties by U.S. persons and issuers as defined by the statute, for the purpose of obtaining or retaining business. We have operations, agreements with third parties and we make significant sales in China. China also strictly prohibits bribery of government officials. Our activities in China create the risk of unauthorized payments or offers of payments by our employees, consultants, sales agents or distributors, even though they may not always be subject to our control. Although we have implemented policies and procedures to discourage these practices by our employees, our existing safeguards and any future improvements may prove to be less than effective, and our employees, consultants, sales agents or distributors may engage in conduct for which we might be held responsible. Violations of the FCPA or anti-corruption laws in other countries may result in severe criminal or civil sanctions, and we may be subject to other liabilities, which could negatively affect our business, operating results and financial condition.
RISKS RELATED TO OWNERSHIP OF OUR COMMON STOCK
Our stock price may be volatile due to fluctuation of our financial results from quarter-to-quarter and other factors.
Our quarterly revenue and results of operations have varied in the past and may continue to vary significantly from
quarter-to-quarter. This variability may lead to volatility in our stock price as research analysts and investors respond to these quarterly fluctuations. These fluctuations are due to numerous factors, including:
•Developments or announcements regarding the Merger;
•Our ability to timely obtain adequate quantities of the components used in our products;
•Fluctuations in demand for our products;
•The timing, volume and product mix of sales of our products;
•Changes in our pricing and sales policies, particularly in the first quarter of the year, or changes in the pricing and sales policies of our competitors;
•Changes in government export and import laws, rules, and regulations that restrict our sales to key customers;
•Our ability to design, manufacture and deliver products to our customers in a timely and cost-effective manner and that meet customer requirements;
•Quality control, yield or other output-related problems in our manufacturing operations;
•Length and variability of the sales cycles of our products;
•Unanticipated increases in costs or expenses; and
•Fluctuations in foreign currency exchange rates.
The foregoing factors are difficult to forecast, and these, as well as other factors, could materially adversely affect our quarterly and annual results of operations in the future. In addition, a significant amount of our operating expenses is relatively fixed in nature due to our internal manufacturing, research and development, sales and general administrative efforts. Any failure to adjust spending quickly enough to compensate for a revenue shortfall could magnify the adverse impact of such revenue shortfall on our results of operations. Moreover, our results of operations may not meet our announced financial outlook or the expectations of research analysts or investors, in which case the price of our common stock could decrease significantly. There can be no assurance that we will be able to successfully address these risks.
The market price of our common stock could be subject to wide fluctuations in response to, among other things, the risk factors described in this section of this Annual Report on Form 10-K, and other factors beyond our control, such as fluctuations in the valuation of companies perceived by investors to be comparable to us.
The stock markets have experienced price and volume fluctuations that have affected and continue to affect the market prices of equity securities of many companies. These fluctuations often have been unrelated or disproportionate to the operating performance of those companies. These broad market and industry fluctuations, as well as general economic, political and market conditions, such as recessions, sovereign debt or liquidity issues, interest rate changes or international currency fluctuations, may negatively affect the market price of our common stock.
In the past, many companies that have experienced volatility in the market price of their stock have been subject to securities class action litigation. We may become the target of this type of litigation in the future. Securities litigation against us could result in substantial costs and divert our management’s attention from other business concerns, which could seriously harm our business.
Our charter documents and Delaware law could prevent a takeover that stockholders consider favorable and could also reduce the market price of our stock.
Our amended and restated certificate of incorporation and our amended and restated bylaws contain provisions that could delay or prevent a change in control of our company. These provisions could also make it more difficult for stockholders to elect directors and take other corporate actions. These provisions include:
•Providing for a classified board of directors with staggered, three-year terms;
•Not providing for cumulative voting in the election of directors;
•Authorizing our board of directors to issue, without stockholder approval, preferred stock rights senior to those of common stock;
•Prohibiting stockholder action by written consent;
•Limiting the persons who may call special meetings of stockholders; and
•Requiring advance notification of stockholder nominations and proposals.
In addition, we are governed by the provisions of Section 203 of the Delaware General Corporate Law. These provisions may prohibit large stockholders, in particular those owning 15% or more of our outstanding common stock, from engaging in certain business combinations without approval of substantially all of our stockholders for a certain period of time. These and other provisions in our amended and restated certificate of incorporation, our amended and restated bylaws and
under Delaware law could discourage potential takeover attempts, reduce the price that investors might be willing to pay for shares of our common stock in the future and result in the market price being lower than it would be without these provisions.
Our amended and restated certificate of incorporation provides that the Court of Chancery of the State of Delaware will be the exclusive forum for certain disputes between us and our stockholders, which could limit our stockholders’ ability to obtain a favorable judicial forum for disputes with us or our directors, officers, or employees.
Our amended and restated certificate of incorporation provides that the Court of Chancery of the State of Delaware is the sole and exclusive forum for the following types of actions or proceedings:
•Any derivative action or proceeding brought on our behalf;
•Any action asserting a breach of fiduciary duty;
•Any action asserting a claim against us arising under the Delaware General Corporation Law; and
•Any action asserting a claim against us that is governed by the internal-affairs doctrine.
This provision would not apply to suits brought to enforce a duty or liability created by the Exchange Act. Furthermore, Section 22 of the Securities Act of 1933, as amended, creates concurrent jurisdiction for federal and state courts over all such Securities Act actions. Accordingly, both state and federal courts have jurisdiction to entertain such claims. This exclusive forum provision may limit a stockholder’s ability to bring a claim in a judicial forum that it finds favorable for disputes with us or our directors, officers, or other employees, which may discourage lawsuits against us and our directors, officers and other employees. If a court were to find the exclusive-forum provision in our amended and restated certificate of incorporation to be inapplicable or unenforceable in an action, we may incur additional costs associated with resolving the dispute in other jurisdictions, which could seriously harm our business.
GENERAL RISKS
If we fail to maintain effective internal control over financial reporting in the future, the accuracy and timing of our financial reporting may be adversely affected.
Our management is responsible for establishing and maintaining adequate internal control over our financial reporting, as defined in Rule 13a-15(f) under the Securities Exchange Act of 1934, as amended, or the Exchange Act. Preparing our consolidated financial statements involves a number of complex manual and automated processes, which are dependent upon individual data input or review and require significant management judgment. One or more of these elements may result in errors that may not be detected and could result in a material misstatement of our consolidated financial statements. If we fail to maintain the adequacy of our internal controls over financial reporting, our business and operating results may be harmed and we may fail to meet our financial reporting obligations. If material weaknesses in our internal control are discovered or occur, our consolidated financial statements may contain material misstatements and we could be required to restate our financial results.
Our internal control over financial reporting may not prevent or detect misstatements because of its inherent limitations, including the possibility of human error, the circumvention or overriding of controls, or fraud. Even effective internal controls can provide only reasonable assurance with respect to the preparation and fair presentation of financial statements. Any failure of our internal controls could adversely affect the results of the periodic management evaluations and annual independent registered public accounting firm attestation reports regarding the effectiveness of our internal control over financial reporting. If we cannot provide reliable financial reports or prevent fraud, our business and results of operations could be harmed, investors could lose confidence in our reported financial information, and the trading price of our stock may decline.
Natural disasters, terrorist attacks or other catastrophic events could harm our operations and our financial results.
Our worldwide operations could be subject to natural disasters and other business disruptions, which could harm our future revenue and financial condition and increase our costs and expenses. For example, our corporate headquarters and wafer fabrication facility in Silicon Valley, California and our Tokyo, Japan facility are located near major earthquake fault lines, and our manufacturing facilities are located in Shenzhen and Dongguan, China, areas that are susceptible to typhoons. We are not insured against many natural disasters, including earthquakes. Similarly, our worldwide operations could be subject to secondary effects of natural disasters, terrorist attacks or other catastrophic events. Even if our facilities are not directly affected, any of these types of events could substantially disrupt the business of our suppliers or customers, which could have a material adverse effect on us.
ITEM 1B. UNRESOLVED STAFF COMMENTS
Not applicable.
ITEM 2. PROPERTIES
Our properties consist primarily of owned and leased office and manufacturing facilities. Our corporate headquarters are located in San Jose, California and our manufacturing facilities are primarily located in Shenzhen and Dongguan, China and Tokyo, Japan. The following schedule presents the approximate square footage of our facilities as of December 31, 2021.
| | | | | | | | | | | | | | |
| Location | | Square Feet | | Commitment and Use |
| San Jose, California | | 103,314 | | | Leased; 2 buildings used for corporate headquarters offices and wafer fabrication. |
| Fremont, California | | 19,175 | | | Leased; 1 building used for wafer fabrication and research and development. |
| Shenzhen, China | | 236,853 | | | Owned; 1 building and 1 floor of a building. The building is used for manufacturing, research and development, and sales and marketing. The owned floor of the building, representing 23,361 square feet, was leased continually to a tenant effective February 2014. |
| Shenzhen, China | | 19,838 | | | Leased; 3 buildings used for staff dormitories. |
| Dongguan, China | | 89,394 | | | Leased; 2 buildings used for manufacturing and for staff dormitory. |
| Tokyo, Japan | | 132,517 | | | Owned; 1 building used for manufacturing, research and development and marketing. |
________________________________________________________
In addition, we lease a number of smaller offices for warehousing, manufacturing, research and other functions.
ITEM 3. LEGAL PROCEEDINGS
From time to time, we are involved in litigation that we believe is of the type common to companies engaged in our line of business, including commercial disputes and employment issues. As of the date of this Annual Report on Form 10-K, other than as described below, we are not involved in any pending legal proceedings that we believe could have a material adverse effect on our financial condition, results of operations or cash flows.
In connection with the announcement of the Merger, we were the subject of a number of suits and received two demand letters ("Merger-Related Claims"). The Merger-Related Claims were described in further detail in our Current Report on Form 8-K as filed with the Securities and Exchange Commission on January 24, 2022. The Merger-Related Claims, individually or collectively, are not material and the plaintiffs in these lawsuits have dismissed their claims.
Additionally, a certain dispute involves a claim by a third party that our activities infringe their intellectual property rights. This and other types of intellectual property rights claims generally involve the demand by a third party that we cease the manufacture, use or sale of the allegedly infringing products, processes or technologies and/or pay substantial damages or royalties for past, present and future use of the allegedly infringing intellectual property. Claims that our products or processes infringe or misappropriate any third-party intellectual property rights (including claims arising through our contractual indemnification of our customers) often involve highly complex, technical issues, the outcome of which is inherently uncertain. Moreover, from time to time, we may pursue litigation to assert our intellectual property rights. Regardless of the merit or resolution of any such litigation, complex intellectual property litigation is generally costly and diverts the efforts and attention of our management and technical personnel which could adversely affect our business.
For a discussion of our current legal proceedings, please refer to the information set forth under the “Litigation” section in Note 14, Commitments and contingencies, in Notes to Consolidated Financial Statements in Item 8 of Part II of this Annual Report on Form 10-K, which is incorporated herein by reference.
ITEM 4. MINE SAFETY DISCLOSURES
Not applicable.
PART II
ITEM 5. MARKET FOR REGISTRANT’S COMMON EQUITY, RELATED STOCKHOLDER MATTERS AND ISSUER PURCHASES OF EQUITY SECURITIES
Our common stock trades on the New York Stock Exchange under the symbol NPTN. As of February 18, 2022, there were 44 holders of record of our common stock (not including beneficial holders of our common stock held in street names).
The graph below shows the cumulative total stockholder return of an investment of $100 (and the reinvestment of any dividends thereafter) on December 31, 2016 in (i) our common stock, (ii) the S&P 500 Index and (iii) the NASDAQ Telecommunications Index. Our stock price performance shown in the graph below is not indicative of future stock price performance. The following graph and related information shall not be deemed “soliciting material” or be deemed to be “filed” with the SEC, nor shall such information be incorporated by reference into any future filing, except to the extent that we specifically state that such graph and related information are incorporated by reference into such filing.
| | | | | | | | | | | | | | | | | |
| | NeoPhotonics | | S&P 500 | | NASDAQ
Telecom |
| 12/31/2016 | $ | 100 | | | $ | 100 | | | $ | 100 | |
| 12/31/2017 | $ | 61 | | | $ | 119 | | | $ | 117 | |
| 12/31/2018 | $ | 60 | | | $ | 112 | | | $ | 121 | |
| 12/31/2019 | $ | 82 | | | $ | 144 | | | $ | 135 | |
| 12/31/2020 | $ | 84 | | | $ | 168 | | | $ | 164 | |
| 12/31/2021 | $ | 142 | | | $ | 213 | | | $ | 172 | |
For equity compensation plan information refer to Item 12 of this Annual Report on Form 10-K.
ITEM 6. [Reserved]
ITEM 7. MANAGEMENT’S DISCUSSION AND ANALYSIS OF FINANCIAL CONDITION AND RESULTS OF
OPERATIONS
You should read the following discussion and analysis by our management of our financial condition and results of operations in conjunction with our consolidated financial statements and the accompanying notes.
The following discussion contains forward-looking statements that involve risks and uncertainties, such as statements of our plans, objectives, expectations and intentions. Our actual results could differ materially from those discussed in the forward-looking statements. Please also see the cautionary language at the beginning of Part I of this Annual Report on Form 10-K regarding forward-looking statements. Factors that could cause or contribute to such differences include, but are not limited to, those discussed in “Risk Factors” of this Annual Report on Form 10-K.
Overview
We develop, manufacture and sell optoelectronic products that transmit and receive high-speed digital optical signals for Cloud and hyperscale data center internet content provider and telecom networks. We are the world's primary supplier of tunable lasers that emit the ultra-pure light that is required for the highest speed over distance fiber optic communications links.
Our products operate at the highest speed over distance, at speeds of 400 Gigabits per Second ("G"), 600G and 800G and beyond data rates in a single wavelength. Versions of these products have the speed, size, output power and low power consumption that enable interoperable pluggable transceivers in standard form factors which directly transmit data using industry standard Internet Protocol coding, or IP over DWDM wavelengths, greatly simplifying data networks, thereby lowering costs and reducing the total electrical power required.
We integrate our lasers and our high performance coherent optical components into transmit/receive modules, or transceivers. Our high speed transceiver modules, which can operate at data rates including 400G, for example our 400ZR and 400ZR+ coherent pluggable modules, enable new, lower cost network architectures using IP over DWDM protocols. The emergence of such 400ZR and 400ZR+ pluggable modules extends our capabilities to a new, rapidly expanding market segment. Such modules put full coherent transmission capabilities of a line card into the same form factor as a pluggable client side transceiver, enabling interconnects between data centers to be nearly as simple as interconnects within a data center, thereby substantially reducing costs.
Over the past decade we have been first to deliver commercial mass production volumes for each of the highest speed advances in coherent optical components and lasers, as maximum speeds have advanced for each wavelength, or color, from 100G to 200G, 400G, 600G and 800G. We are a specialist in developing and producing products for the highest speed over distance applications, where high baud rate, laser single clarity and high sensitivity are keys to achieving longer distances for a given speed.
We believe we are well positioned to attain and maintain industry leadership in these lasers, component and module solutions based on our leadership in the ultra-pure light lasers which power them and our comprehensive Silicon Photonics and compound semiconductor technologies for optical ICs.
Coherent is the technology of choice for high speed over distance data transmission in Cloud infrastructure and data center interconnection, in addition to telecom networks. The move to 400G and above transmission has been a fulcrum for the industry as it marked a major step-up in speed, as well as enabling new network architecture alternatives to dramatically lower costs by deploying 400ZR architectures in networks. 400G is now the basic building block for network deployments for all reaches from 40km to long haul distances of 2000kms or more, all of which require coherent transmission technology.
We believe we are a global leader in coherent transmission technology, based on our leadership in ultra-pure light lasers, Silicon photonics and optical integration for miniaturization and low power consumption. We sell to virtually all of the leading telecom network equipment companies such as ADVA, Arista Networks, Ciena, Cisco Systems, Fiberhome, Fujitsu, Huawei, Infinera, NEC, Nokia and ZTE.
Furthermore, we believe that use cases for 400ZR and 400ZR+ system-level modules will extend across data center interconnect, backhaul for 5G wireless networks and metro networks. Key attributes of power and power density, and interoperability of coherent pluggable solutions, drive this forecast. These architectures are now being deployed by hyperscale operators and will be adopted in metro telecom networks using 400ZR+ coherent pluggable modules in areas where reach and density make it the clear economic winner with much lower total costs. Furthermore, we believe that our high performance optics combined with next generation DSPs will enable 800ZR and 800ZR+ coherent pluggable modules with the next few years, followed by 1.6T implementations.
Extension of coherent modules into metro networks will be driven by substantially lower costs achieved through elimination of network equipment proprietary chassis, and the reduction in the number of ROADMs required, compared to current network architectures.
With 400G as a fulcrum for the expansion of the market for the highest speeds, we believe we are well positioned to take advantage of this rapidly developing, high growth market.
Our High Speed Products for data rates of 100G and above, including 800G, were 93% of our 2021 revenues and were 92% of our 2020 revenues. Our sales concentration in High Speed Products has been increasing each year for more than 10 years. Products capable of data rates of 400G and above have accounted for more than 10 percent of our revenue since 2018 and have increased from $44 million in 2019 to $86 million in 2020, to $148 million in 2021, such that revenue from products for 400G and above applications have now reached 51% of revenues in 2021. (400G capable products are defined as products capable of 50 Gbaud and above operation plus lasers purchased specifically for systems with a maximum data rates of 400G or higher.) We believe that the market for 400G and above products will grow at a 5-year compound annual growth rate of 60 percent through 2025. We therefore expect our 400G and above revenues will continue to grow at an accelerated rate over the immediate and longer term.
With adoption of coherent transmission using pluggable high speed optical modules in Cloud and hyperscale data centers, we believe our total addressable market is rapidly expanding.
Proposed Merger with Lumentum Holdings, Inc.
On November 4, 2021 we announced our planned merger with a subsidiary of Lumentum Holdings, Inc. We expect this transaction will close in the second half of 2022.
Our Solutions
Three critical optical components are required to make a coherent transceiver: (1) a laser with a very narrow linewidth for very pure light; (2) a coherent modulator capable of changing both the intensity and phase of the optical signal to code data onto it; and (3) a coherent receiver capable of detecting both the intensity and phase of the received optical signal to “understand” its content, plus an electronic digital signal processor IC (DSP).
We have been a leading volume supplier of these optical components since coherent systems were first deployed in volume for telecommunications networks a decade ago, in 2010. We are now the leading supplier of narrow linewidth tunable lasers and other coherent components for 400G, 600G and above applications.
The capabilities of coherent optics continue to grow with increasing photonic integration for higher performance and smaller size. These are core capabilities of NeoPhotonics and therefore open further opportunities for us in adjacent markets. Outside of communications, coherent technology improves sensitivity and performance for a variety of applications including inter-satellite communication links including for low earth orbit (LEO) satellites, plus industrial applications, 3D sensing for autonomous vehicle navigation, and medical imaging.
Macroeconomic Factors
We continue to manage through two external macro situations that have had a material impact on our business: The Covid-19 Pandemic and the U.S. Department of Commerce restrictions on Huawei Technologies.
The Covid-19 pandemic continues to impact our business, the business of our customers and suppliers and how we execute our business. The pandemic is currently causing industry wide supply chain shortages, particularly for semiconductor chips. In the fourth quarter of 2021, these shortages had a negative impact on our revenue of approximately $15 million. We expect the supply chain disruption will continue at some level for several quarters. Our priorities to address the impacts of the global pandemic on our operations are as follows:
•The health and well-being of our employees and supply chain partners is our top priority.
•We have implemented strict measures to ensure and maintain safety, including working remotely where possible, social distancing and enhanced protocols in each of our global facilities.
•We closely monitor evolving conditions and adhere to local and federal guidelines in each location in which we operate.
Business Continuity
•Our operations and products support essential communications networks globally.
•We have implemented and continue to adjust comprehensive business continuity plans in response to the global pandemic to ensure that we are able to deliver for our customers.
•We are working closely with our supply chain partners globally to secure sufficient inventory and to support the health and safety of their employees.
•We have seen strong demand for products that facilitate increasing network bandwidth; we are working to ensure continuity between us, our supply partners and forward to our customers and their contract manufacturing partners around the world.
Financial Structure
•We believe our balance sheet and liquidity position provide the flexibility needed to support our operations during this pandemic.
On May 16, 2019, the BIS added Huawei and certain affiliates to the Entity List, with an effective date of May 21, 2019. This denies Huawei the ability to purchase products, software and technology that are subject to U.S. Export Administration Regulations ("EAR").
In May 2020, BIS added Fiberhome Technologies Group to the Entity List, with an effective date of June 5, 2020. This denies Fiberhome the ability to purchase products, software and technology that are subject to EAR.
We are committed to EAR compliance in each of the locations in which we do business. We subsequently determined that certain of our products were not subject to EAR regulations and could lawfully be sold to Huawei. Further, in 2019 we applied for licenses for certain technology subject to EAR, and we were granted a license to ship limited, but not material, volumes of U.S.-manufactured lasers to Huawei. Similarly, in 2020 we determined that a significant portion of our shipments to Fiberhome were not subject to EAR and shipments of certain of those products continued.
On August 17, 2020, BIS increased restrictions on Huawei and its affiliates on the Entity List related to items produced domestically and abroad that use U.S. technology or software and imposed additional requirements for items subject to Commerce export control. On October 5, 2020, we announced that we will manage the business without relying on future revenue contributions from Huawei. We have subsequently determined that a limited number of one product category are not produced with U.S. technology and have subsequently resumed some shipments to Huawei. These shipments were approximately $30 million in 2021 and are expected to decline in 2022 as Huawei moves to other sources.
We have taken actions to better align capacity and production infrastructure with expected demand levels, with the goal of returning to profitability while still meeting customer demand. We have consolidated our Indium Phosphide production into our Japan water fabrication plant and are continuing to build inventory, where possible, to meet demand.
Revenue was $290.3 million in the year ended December 31, 2021, compared to $371.2 million in 2020, a 21.8% decrease due primarily to the EAR export restrictions, with some impact of the global semi-conductor supply chain shortage. Our gross profit was 23.3% of revenue in the year ended December 31, 2021, compared to 27.8% of revenue in 2020. The decrease in gross profit was mainly due to lower volumes resulting in decreased leverage of our manufacturing base.
In the year ended December 31, 2021, High Speed Products represented approximately 93% of total revenue, or $271.3 million and Network Products and Solutions represented approximately 7% of total revenue, or $19.0 million. In the year ended December 31, 2020, High Speed Products were 92% of total revenue, or $340.0 million and Network Products and Solutions represented approximately 8% of total revenue, or $31.1 million. We expect our High Speed Product market group will continue to grow with accelerating market adoption and deployments, and related market share gains operating at 400G and beyond data rates.
We have invested and expect to continue to invest significant time and capital into our research and development operations. Our research and development activities continue to push the performance leadership boundaries in high speed digital optics, silicon photonics and hybrid photonic integration, optoelectronics control and in signal processing.
Research and development expenses were $56.5 million, $56.1 million and $57.6 million in 2021, 2020 and 2019, respectively.
We have research and development and wafer fabrication facilities in Silicon Valley, California and in Tokyo, Japan that coordinate with our research and development and manufacturing facilities in Dongguan, Shenzhen and Wuhan, China and Ottawa, Canada. We use proprietary design tools and design-for-manufacturing techniques to align our design process with our precision nanoscale, vertically integrated manufacturing and testing. We believe we are one of the highest volume manufacturers of photonic integrated circuits ("PIC") in the world and that we can further expand our manufacturing capacity to meet market needs.
Demand for certain of our High Speed Products that are used in metro and DCI applications in North America and Europe is increasing rapidly. DCI deployments in North America have been strong over the past two years, and our products for these applications generally ship to contract manufacturers for our system manufacturer customers.
Critical accounting policies and estimates
Our discussion and analysis of our financial condition and results of operations are based upon our consolidated financial statements, which have been prepared in accordance with accounting principles generally accepted in the U.S. (“U.S. GAAP”). These principles require us to make estimates and judgments that affect the reported amounts of assets, liabilities, revenue, expenses and cash flow, and related disclosure of contingent assets and liabilities. Our critical accounting policies and estimates include those related to revenue recognition, valuation of inventory, impairment analysis of long-lived assets, stock-based compensation expense, and accounting for income taxes. We base our estimates on historical experience and on various other assumptions that we believe to be reasonable under the circumstances. Actual results may differ from these estimates. To the extent that there are material differences between these estimates and our actual results, our future financial statements will be affected.
We believe that of our significant accounting policies, which are described in Note 2 of Notes to Consolidated Financial Statements, the following accounting policies involve a greater degree of judgment and complexity. Accordingly, we believe these are the most critical to fully understand and evaluate our financial condition and results of operations.
Revenue recognition
Revenue is recognized upon transfer of control of promised products or services to customers in an amount that reflects the consideration we expect to receive in exchange for those products or services. We generally bear all cost, risk of loss or damage and retain title to the goods up to the point of transfer of control of promised products to customer. Revenue related to the sale of consignment inventories at customer vendor managed locations is not recognized until the products are pulled from consignment inventories by customers. In instances where acceptance of the product or solutions is specified by the customer, revenue is deferred until such required acceptance criteria have been met. Shipping and handling costs are included in the cost of goods sold. We present revenue net of sales taxes and any similar assessments.
Inventories
Our inventories consist of on-hand raw materials, work-in-progress inventories and finished goods. Raw materials and work-in-progress inventories are stored mainly on our premises. Finished goods are stored on our premises as well as on consignment at certain customer sites.
Inventories are stated at the lower of standard cost, which approximates actual cost determined on the weighted average basis, or net realizable value. Inventories are recorded using the first-in, first-out method. We routinely evaluate quantities and values of inventories in light of current market conditions and market trends, and record a write-down for quantities in excess of demand and product obsolescence. The evaluation may take into consideration historic usage, expected demand, anticipated sales price, new product development schedules, the effect new products might have on the sale of existing products, product obsolescence, customer concentrations, product merchantability and other factors. Market conditions are subject to change and actual consumption of inventory could differ from forecasted demand. We also regularly review the cost of inventories against their estimated market value and record a lower of cost or market write-down for inventories that have a cost in excess of estimated market value, resulting in a new cost basis for the related inventories which is not reversed. In 2021, 2020 and 2019, inventory write-down charges were approximately $12.0 million, $9.4 million and $7.8 million, respectively.
Long-lived assets
We assess the impairment of long-lived assets whenever events or changes in circumstances indicate that the carrying amount may not be recoverable. An impairment loss would be recognized when the sum of the future net cash flows expected to result from the use of the asset and its eventual disposition is less than its carrying amount. The estimated future cash flows are based upon, among other things, assumptions about expected future operating performance and may differ from actual cash flows. If our estimates regarding future cash flows derived from such assets were to change, we may record an impairment to the value of these assets.
Stock-based compensation
Our stock-based compensation plans include stock options, stock appreciation units, restricted stock units, and performance-based restricted stock units. The assumptions used in calculating the fair value of share-based compensation awards represent management’s best estimates, but these estimates involve inherent uncertainties and the application of management’s judgment. Valuations related to our stock-based plans are based on estimates involving assumptions of volatility, forfeitures and interest rates.
Performance-based restricted stock units include both market-based objectives, related to achieving stock price targets, and time-based vesting, related to achieving Company revenue targets sustainable over a period of time. These plans all require evaluation of the probability of achieving the stated objectives, and therefore actual expenses in subsequent periods can vary from the original estimates.
Accounting for income taxes
We record income taxes using the asset and liability method, which requires the recognition of deferred tax assets and liabilities for the expected future tax consequences of events that have been recognized in our consolidated financial statements or tax returns. In estimating future tax consequences, generally we consider all expected future events, other than enactments or changes in tax law or rates. We provide valuation allowances when necessary to reduce deferred tax assets to the amount expected to be realized.
We operate in various tax jurisdictions and are subject to audit by various tax authorities. We provide for tax contingencies whenever it is deemed probable that a tax asset has been impaired or a tax liability has been incurred for events such as tax claims or changes in tax laws. Tax contingencies are based upon their technical merits, relevant tax law and the specific facts and circumstances as of each reporting period. Changes in facts and circumstances could result in material changes to the amounts recorded for such tax contingencies.
As part of the process of preparing our consolidated financial statements, we are required to estimate our taxes in each of the jurisdictions in which we operate. We estimate actual current tax exposure together with assessing temporary differences resulting from differing treatment of items, such as accruals and allowances not currently deductible for tax purposes. These differences result in deferred tax assets.
We make estimates and judgments about our future taxable income that are based on assumptions that are consistent with our plans and estimates. Should the actual amounts differ from our estimates, the amount of our valuation allowance could be materially impacted. Any adjustment to the deferred tax asset valuation allowance would be recorded in the consolidated statement of operations in the period that the adjustment is determined to be required.
Results of operations
Our business is focused on the highest speed digital optics and signal processing communications applications.
In 2021, our High Speed Products for data rates of 100G and beyond comprised 93% of our revenues, increased from 92% in 2020 and 91% in 2019.
The following table presents certain consolidated statements of operations data for the periods indicated as a percentage of total revenue:
| | | | | | | | | | | | | | | | | |
| | Years Ended December 31, |
| | 2021 | | 2020 | | 2019 |
| Revenue | 100 | % | | 100 | % | | 100 | % |
| Gross profit | 23 | % | | 28 | % | | 25 | % |
| Operating expenses | 36 | % | | 27 | % | | 29 | % |
| Income (loss) from operations | (13) | % | | 1 | % | | (4) | % |
| Interest and other income (expense), net | — | % | | (2) | % | | — | % |
| Loss before income taxes | (13) | % | | (1) | % | | (4) | % |
| Net loss | (14) | % | | (1) | % | | (5) | % |
Revenue
| | | | | | | | | | | | | | | | | | | | | | | | | | | | | |
| | | | % Change | | | | % Change | | |
| (in thousands, except percentages) | 2021 | | 2021 to 2020 | | 2020 | | 2020 to 2019 | | 2019 |
| Total revenue | $ | 290,289 | | | (22)% | | $ | 371,163 | | | 4% | | $ | 356,804 | |
We sell substantially all of our products to original equipment manufacturers ("OEMs") and their contract manufacturers. Revenue is recognized upon transfer of control of the product to the buyer. We price our products based on market and competitive conditions and may periodically reduce the price of our products as market and competitive conditions change or as manufacturing costs are reduced. Our first quarter revenue is typically seasonally lower than the rest of the year primarily due to the impact of annual price negotiations with customers that occur at the end of the prior year and lower capacity utilization during the holidays in China. Our sales transactions to customers are denominated primarily in U.S. dollars.
Customers accounting for more than 10% of our total revenue and revenue from our top five customers for the years ended December 31, 2021, 2020 and 2019 were as follows:
| | | | | | | | | | | | | | | | | |
| | Years Ended December 31, |
| | 2021 | | 2020 | | 2019 |
| Cisco Systems, Inc. | 27 | % | | 5 | % | | 4 | % |
| Ciena Corporation | 18 | % | | 17 | % | | 29 | % |
| Nokia Corporation | 12 | % | | 7 | % | | 4 | % |
| Huawei Technologies Co., Ltd and their affiliates | 11 | % | | 40 | % | | 41 | % |
| Acacia Communications, Inc. | — | % | | 10 | % | | 5 | % |
| Percent of revenue from top five customers | 75 | % | | 79 | % | | 84 | % |
The following tables present share of revenue by product group and geographical region:
| | | | | | | | | | | | | | | | | |
| | Years Ended December 31, |
| | 2021 | | 2020 | | 2019 |
| High Speed Products | 93 | % | | 92 | % | | 91 | % |
| Network Products and Solutions | 7 | % | | 8 | % | | 9 | % |
| | | | | | | | | | | | | | | | | |
| | Years Ended December 31, |
| | 2021 | | 2020 | | 2019 |
| China | 31 | % | | 52 | % | | 52 | % |
| Americas | 11 | % | | 17 | % | | 23 | % |
| Rest of world | 58 | % | | 31 | % | | 25 | % |
Total revenue decreased by $80.9 million, or 22%, in 2021, due primarily to the combination of tightened BIS restrictions on sales to Huawei, along with a $15 million negative impact from the global semi-conductor supply chain shortage, compared to an increase of 4% in revenue for year ending 2020. Excluding Huawei, revenue in the year ending December 31, 2021 increased 17%, compared to a revenue increase of 5% in the year ending 2020 as the Company continued to expand with other customers and markets. Of this, our 400G and above product revenue grew 71% year-over-year and comprised 51% of revenue in 2021.
Total revenue increased by $14.4 million, or 4%, in 2020 compared to 2019, led by the solid growth in our tunable laser and coherent modulators businesses offset by a decrease in our integrated coherent receiver business in the U.S. market.
Huawei was a significant customer in the first three quarters of 2020, but as a result of the additional BIS restrictions, there was no revenue from Huawei in the fourth quarter.
Geographic revenue represents the shipment location and frequently changes based on the location of contract manufacturing, rather than end customer location. Shipments to the Americas and to the rest of the world are mainly to contract manufacturers for non-China based network equipment manufacturers ("NEMs").
We believe we will continue to be an industry leader for the highest speed over distance network solutions, supplying customers with components and modules which deliver the highest bandwidth per wavelength and per fiber for long distances. Our High Speed Product market segment consistently represents 90% or more of our business and, based on customer deployment data, out 400G and above capable products represent 51% of our revenue for FY2021. Since launching 400ZR and 400ZR+ pluggable coherent modules two years ago in the fourth quarter of 2019, we have shipped units for qualification to multiple hyper scale customers. In addition, we are shipping limited quantities of our newest 96Gbaud component suite for 800G DCI and 400G long-haul transmissions. We believe these high-performance products will bring accelerating revenue growth and our technology enables potential expansion into other adjacent markets. While we expect a significant portion of our revenue will continue to be derived from a limited number of customers, we are seeing some customer diversification with expansion of our high-performance products.
Cost of goods sold and gross margin
| | | | | | | | | | | | | | | | | | | | | | | | | | | | | |
| | | | % Change | | | | % Change | | |
| (in thousands, except percentages) | 2021 | | 2021 to 2020 | | 2020 | | 2020 to 2019 | | 2019 |
| Cost of goods sold | $ | 222,701 | | | (17)% | | $ | 268,081 | | | —% | | $ | 267,991 | |
| Gross profit | 67,588 | | | (34)% | | 103,082 | | | 16% | | 88,813 | |
| | | | | | | | | | | | | | | | | |
| | 2021 | | 2020 | | 2019 |
| Gross profit as a % of revenue | 23.3 | % | | 27.8 | % | | 24.9 | % |
Our cost of goods sold consists primarily of the cost to produce wafers, modules and to manufacture and test our products. Additionally, our cost of goods sold includes stock-based compensation, write-downs of excess and obsolete inventory, royalty payments, amortization of certain purchased intangible assets, depreciation, acquisition-related fair value adjustments, restructuring charges, warranty costs, logistics and allocated facilities costs.
Gross profit as a percentage of total revenue, or gross margin, has been and is expected to continue to be affected by a variety of factors including the introduction of new products, production volume, factory utilization, the mix of products sold, inventory changes, changes in the average selling prices of our products, changes in the cost and volumes of materials purchased from our suppliers, changes in labor costs, changes in overhead costs or requirements, stock-based compensation, write-downs of excess and obsolete inventories and warranty costs. In addition, we periodically negotiate pricing with certain customers which can cause our gross margins to fluctuate, particularly in the quarters in which the negotiations occurred.
As a manufacturing company, our margins are sensitive to changes in volume and factory utilization. When BIS announced additional restrictions on Huawei, and as the global semi-conductor supply chain shortage reduced the availability of raw materials, we took actions to better align capacity and production infrastructure while expanding out markets and customer base.
Our gross margin decreased 4.5% percentage points to 23.3% in 2021 compared to 27.8% in 2020 and 24.9% in 2019 on lower volumes due to the additional EAR restrictions on Huawei and the global semi-conductor supply shortage affecting factory utilization. Additionally, material costs are increasing as we purchase from higher cost sources to maximize supply. Gross profit decreased $35.5 million from $103.1 million in 2020 to $67.6 million in 2021, compared to an increase in gross profit in the prior year of $14.3 million from $88.8 million in 2019 to $103.1 million in 2020. We continue to drive operational changes to reduce costs and improve gross margin.
Operating expenses
Personnel costs are the most significant component of operating expenses and consist of costs such as salaries, benefits, bonuses, stock-based compensation and other variable compensation.
| | | | | | | | | | | | | | | | | | | | | | | | | | | | | |
| | | | % Change | | | | % Change | | |
| (in thousands, except percentages) | 2021 | | 2021 to 2020 | | 2020 | | 2020 to 2019 | | 2019 |
| Research and development | $ | 56,486 | | | 1% | | $ | 56,100 | | | (3)% | | $ | 57,634 | |
| Sales and marketing | 14,539 | | | (7)% | | 15,629 | | | (3)% | | 16,088 | |
| General and administrative | 30,464 | | | —% | | 30,569 | | | 3% | | 29,759 | |
| Amortization of purchased intangible assets | — | | | —% | | — | | | (100)% | | 119 | |
| Acquisition and asset sale related costs | 3,733 | | | 241% | | 1,094 | | | 176% | | 397 | |
| Restructuring charges | 14 | | | (91)% | | 156 | | | (40)% | | 261 | |
| Litigation settlements | 240 | | | 108% | | (2,988) | | | (100)% | | — | |
| Gain on asset sale | (58) | | | (94)% | | (1,044) | | | 16% | | (903) | |
| Total operating expenses | $ | 105,418 | | | 6% | | $ | 99,516 | | | (4)% | | $ | 103,355 | |
Research and development
We focus our research and development efforts on continuing to push the performance leadership boundaries. Research and development expense increased $0.4 million or 1% to $56.5 million, or 19% of revenue from 2020 to 2021 driven mostly by increased personnel costs as we continue to invest for the highest speeds.
Research and development expenses decreased $1.5 million or 3% to $56.1 million, or 15% of revenue, from 2019 to 2020 mainly from lower engineering service costs.
We believe that investments in research and development are important to help meet our strategic objectives. We plan to continue to invest in research and development activities, including new products that we believe will further enhance our competitive position and expand our revenue stream. Research and development expense consists of personnel costs, including stock-based compensation, for our research and development personnel, and product development costs, including engineering services, development software and hardware tools, depreciation of equipment and facility costs. We record all research and development expense as incurred. As a percentage of total revenue, our research and development expense may vary as our investment and revenue levels change over time.
Sales and marketing
Sales and marketing expense decreased by $1.1 million, or 7%, in 2021 compared to 2020, mainly from lower variable compensation expenses.
Sales and marketing expense decreased by $0.5 million, or 3%, in 2020 compared to 2019, mainly from lower levels of travel and fewer marketing events due to the Covid-19 pandemic.
We expect to continue to expand our high speed market focus and increase sales and marketing coverage of the DCI, Cloud and hyperscale data center markets, particularly the 400ZR and 400ZR+ products as well as the 64 Gbaud and 96 Gbaud component suites. Sales and marketing expense consists primarily of personnel costs, including stock-based compensation and sales commissions, costs related to sales and marketing programs and services and facility costs. As a percentage of total revenue, our sales and marketing expense may vary as our revenue changes over time.
General and administrative
General and administrative expense consists of personnel costs, including stock-based compensation, for our finance, human resources and information technology personnel and certain executive officers, as well as professional services costs related to accounting, tax, banking, legal and information technology services, depreciation and facility costs.
General and administrative expense decreased by $0.1 million, or 0.3%, in 2021, compared to 2020, primarily from lower variable compensation expenses and consulting fees.
General and administrative expense increased by $0.8 million, or 3%, in 2020, compared to 2019, primarily from an increase in personnel costs from both headcount and higher variable compensation expenses, offset by decreases in consulting fees, depreciation and amortization and travel expenses.
Amortization of purchased intangible assets
Our intangible assets are being amortized over their estimated useful lives. Amortization expense relating to technology and patents and leasehold interests are included within cost of goods sold, while customer relationships and non-compete agreements are recorded within operating expenses.
In 2021, amortization of purchased intangible assets was $0.6 million included in the cost of goods sold. The decrease of $0.1 million from 2020 was due to certain intangible assets that have become fully amortized.
In 2020, amortization of purchased intangible assets was $0.7 million included in the cost of goods sold. The decrease of $0.1 million from 2019 was due to certain intangible assets that have become fully amortized.
In 2019, amortization of purchased intangible assets was $0.8 million, comprising of $0.7 million in cost of goods sold and $0.1 million in operating expenses. The decrease of $0.3 million from 2018 due to certain intangible assets have become fully amortized during 2019.
Acquisition and asset sale related costs
In 2021, we incurred $3.7 million primarily in advisory and support fees relating to the proposed merger that was announced on November 4, 2021.
In 2020, we incurred $0.8 million in strategic advisory fees and $0.2 million in legal fees related to a litigation settlement with APAT OE relating to the sale of our low speed transceiver product lines (See Note 14 of Notes to Consolidated Financial Statements in Item 8 of Part II of this Report).
In 2019, we incurred $0.4 million in legal and other professional fees related to our litigation with APAT OE relating to the sale of our low speed transceiver product lines (See Note 14 of Notes to Consolidated Financial Statements in Item 8 of Part II of this Report).
Restructuring and other related costs
In 2021, an immaterial amount of restructuring expense was charged to operating expenses and $0.3 million was charged to cost of goods related to the early exit of the Fremont, California facility as the second phase of the Company's consolidation of operations initiated in 2020.
We implemented restructuring actions in 2020 to better align capacity and production infrastructure with future expected demand levels due to additional BIS restrictions on Huawei, including inventory and equipment write-downs and a reduction in force. We incurred $10.1 million of total restructuring and other related charges with $9.9 million charged to cost of goods sold and $0.2 million charged to operating expenses in 2020.
We incurred $0.3 million in the year ended December 31, 2019 for follow-on expenses related to our 2018 restructuring focused on moving towards a lower break even revenue level.
Litigation settlement
In September 2018, we and Cisco signed a settlement agreement under which we agreed to pay Cisco $0.3 million in cash and $0.2 million in product credits which was issued in December 2019.
In January 2019, we and Lestina International Ltd. signed a settlement agreement under which we agreed to pay Lestina International Ltd. $2.2 million in cash. These payments were completed in two installments paid in February and June 2019. See Note 14 of Notes to Consolidated Financial Statements in Item 8 of Part II of this Report.
In October 2020, we and APAT OE signed a settlement agreement to settle all claims and release all property preservation orders. The settlement resulted in a recovery of previously recognized losses in the amount of $3.0 million, which was recognized in the fourth quarter of 2020.
Interest and other income (expense), net
| | | | | | | | | | | | | | | | | | | | | | | | | | | | | |
| | | | % Change | | | | % Change | | |
| (in thousands, except percentages) | 2021 | | 2021 to 2020 | | 2020 | | 2020 to 2019 | | 2019 |
| Interest income | $ | 409 | | | 125% | | $ | 182 | | | (52)% | | $ | 376 | |
| Interest expense | (969) | | | (18)% | | (1,182) | | | (38)% | | (1,919) | |
| Other income (expense), net | (621) | | | (89)% | | (5,730) | | | (993)% | | 642 | |
| Total | $ | (1,181) | | | (82)% | | $ | (6,730) | | | 647% | | $ | (901) | |
Interest expense included in interest and other income (expense), net decreased by $0.2 million in 2021, as compared to 2020. The decrease in interest expense was due to a $1.1 million decrease in outstanding borrowings and lower interest rate on our Wells Fargo loan. Other income (expense), net included in interest and other income (expense), net, increased by $5.1 million in 2021, as compared to 2020, with a $5.2 million lower exchange loss from U.S. dollar depreciation against the Chinese Renminbi offset by a U.S dollar strengthening against the Japanese Yen.
Interest expense included in interest and other income (expense), net decreased by $0.7 million in 2020, as compared to 2019. The decrease in interest expense was due to a $10.1 million decrease in outstanding borrowings and lower interest rate on our Wells Fargo loan. Other income (expense), net included in interest and other income (expense), net, decreased by $6.4 million in 2020, as compared to 2019, with a $6.1 million higher foreign exchange loss from U.S. dollar depreciation against both the Chinese Renminbi and Japanese Yen and $0.3 million less China government subsidy granted.
Income taxes and effective tax rates
| | | | | | | | | | | | | | | | | |
| | Years ended December 31, |
| (in thousands, except percentages) | 2021 | | 2020 | | 2019 |
| Provision for income taxes | $ | (1,708) | | | $ | (1,202) | | | $ | (1,633) | |
| Effective tax rate | (4) | % | | (38) | % | | (11) | % |
In 2021, our income tax provision was primarily related to the operating profit realized in our foreign subsidiaries in Japan and China. Historically, we have experienced net losses in the U.S. and in the short term, we expect this trend to continue.
The effective tax rate was (4)% in 2021 as compared to (38)% in 2020 mainly due to a decrease in earnings in foreign jurisdictions and an increase in net loss generated by the U.S. in 2021.
The effective tax rate was (38)% in 2020 as compared to (11)% in 2019 mainly due to a decrease in earnings in foreign jurisdictions and a decrease in net loss generated by the U.S. in 2020.
Liquidity and capital resources
As of December 31, 2021, we had working capital of $124.1 million, including total cash, cash equivalents, short-term investments and restricted cash of $105.6 million. Approximately 47% of our total cash, cash equivalents, short-term investments and restricted cash were held by our foreign entities, including approximately $42.1 million in accounts held by our subsidiaries in China, of which $0.1 million was in restricted cash, and approximately $7.5 million in accounts held by our subsidiary in Japan. Cash, cash equivalents, investments and restricted cash held outside of the U.S. may be subject to taxes if repatriated and may not be immediately available for our working capital needs.
Approximately $10.5 million of our retained earnings within our total accumulated deficit as of December 31, 2021 was subject to restrictions due to the fact that our subsidiaries in China are required to set aside at least 10% of their respective accumulated profits each year end to fund statutory common reserves as well as allocate a discretionary portion of their after-tax profits to their staff welfare and bonus fund. This restricted amount is not distributable as cash dividends, except in the event of liquidation.
In June 2021 we renewed our revolving line of credit agreement with Wells Fargo Bank, National Association ("Wells Fargo") as the administrative agent for a lender group (the "Wells Fargo Credit Facility" or "Credit Facility").
The Wells Fargo Credit Facility provides for borrowings equal to the lower of (a) a maximum revolver amount of $50.0 million, or (b) an amount equal to 80% - 90% of eligible accounts receivable plus 100% of qualified cash balances up to $15.0 million, less certain discretionary adjustments ("Borrowing Base"). The maximum revolver amount may be increased by up to $25.0 million, subject to certain conditions. At closing, $50.0 million was available, of which $20.1 million was drawn.
The Credit Facility matures on June 30, 2026 and borrowings bear interest at an interest rate option of either (a) the LIBOR rate, plus an applicable margin ranging from 1.50% to 1.75% per annum, or (b) the prime lending rate, plus an applicable margin ranging from 0.50% to 0.75% per annum. We are also required to pay a commitment fee equal to 0.25% of the unused portion of the Credit Facility.
The Credit Facility agreement requires prepayment of the borrowings to the extent the outstanding balance is greater than the lesser of (a) the most recently calculated Borrowing Base, or (b) the maximum revolver amount. The Borrowing Base calculation contains a customary provision that gives the lender the ability to reduce the Borrowing Base by reserves that are
subjectively determinable, which is considered a subjective acceleration clause. We are required to maintain a combination of certain defined cash balances and unused borrowing capacity under the Credit Facility of at least $20.0 million, of which at least $5.0 million must be unused borrowing capacity. Borrowings under the Credit Facility are collateralized by substantially all of our assets.
On June 14, 2019, we entered into a First Amendment to the Credit Facility (the "Amended Credit Facility"). The Amendment removes Huawei from the list of “Eligible Accounts” as a basis for our borrowing while Huawei is on the Entity List. During the period of time while Huawei remains on the Entity List, the concentration limits of certain other customers are increased to partially offset the removal of Huawei. Additionally, until Huawei is no longer on the Entity List, we are required to maintain a temporary combination of certain defined unrestricted cash and unused borrowing capacity under the credit facility of at least $30.0 million in U.S. and $40.0 million world-wide, of which at least $5.0 million shall include unused borrowing capacity.
We were in compliance with the covenants of this Credit Facility as of December 31, 2021. As of December 31, 2021, the outstanding balance under the Credit Facility was $20.3 million and the weighted average rate under the LIBOR option was 1.94%. The remaining borrowing capacity as of December 31, 2021 was $12.7 million, of which $5.0 million is required to be maintained as unused borrowing capacity.
We regularly issue short-term notes payable to our suppliers in China in exchange for accounts payable. These notes are supported by non-interest bearing bank acceptance drafts and are due three to six months after issuance. As a condition of the notes payable arrangements, we are required to keep a compensating balance at the issuing banks that is a percentage of the total notes payable balance until the amounts are settled.
As of December 31, 2021, our subsidiaries in China had two line of credit facilities with banking institutions.
In June 2021, NeoPhotonics (China) Co., Ltd., ("NeoPhotonics China"), a subsidiary of the Company, entered into a credit line agreement with Shanghai Pudong Development Bank Shenzhen Branch (“SPDB”) providing for a line of credit to NeoPhotonics China in an amount of RMB 120,000,000 (approximately $18.9 million) for short-term loans at varying interest rates. As of December 31, 2021, there was $15.0 million outstanding under the NeoPhotonics China credit. The note payable bears interest at 3.0% (2.4% of which was charged to NeoPhotonics China as a loan fee and was paid in the fourth quarter of 2021). This note matures in March 2022.
In June 2021, NeoPhotonics Dongguan Co., Ltd (“NeoPhotonics Dongguan”), also a subsidiary of the Company, entered into a credit line agreement with SPDB providing for a line of credit to NeoPhotonics Dongguan in an amount of RMB 30,000,000 (approximately $4.7 million) for short-term loans at varying interest rates. As of December 31, 2021, there was no amount outstanding under this credit facility.
As of December 31, 2021 and 2020, there were no non-interest bearing bank acceptance drafts issued in connection with our notes payable to our suppliers in China under these line of credit facilities. There were no such balances as of December 31, 2021 and 2020, respectively. There were no compensating balances related to these credit facilities as of December 31, 2021 and 2020. Compensating balances are classified as restricted cash on our consolidated balance sheets. See Note 4 and Note 11 of Notes to Consolidated Financial Statements in Item 8 of Part II of this Report.
As of December 31, 2021, we had two term loan arrangements with MUFG Bank, Ltd. (collectively the “Mitsubishi Bank Term Loans”) and a third loan arrangement with the MUFG Bank, Ltd. and The Yamanashi Chou Bank, Ltd. One of the Mitsubishi Bank Term Loans requires equal monthly payments of principal equal to 8.3 million JPY until the maturity date of February 25, 2025, with a lump sum payment of the balance of 8.4 million JPY on the maturity date. Interest on this loan accrues and is paid monthly based upon the annual rate of the monthly Tokyo Interbank Offer Rate (TIBOR) plus 1.40% and is secured by real estate collateral. The second term loan of 690.0 million JPY (approximately $6.0 million) (the “2017 Mitsubishi Bank Loan”) was entered into in March 2017 to acquire manufacturing equipment for our Japanese subsidiary and has an annual interest rate of the monthly TIBOR rate plus 1.00%. The 2017 Mitsubishi Bank Loan requires monthly interest and principal payments over 72 months commencing in April 2018. This loan was available from March 31, 2017 to March 30, 2018 and 690.0 million JPY (approximately $6.0 million) under this loan was fully drawn in March 2017. In January 2018, we entered into a term loan agreement with MUFG Bank, Ltd. and The Yamanashi Chou Bank, Ltd. for a term loan in the aggregate principal amount of 850.0 million JPY (approximately $7.4 million) (the "Mitsubishi-Yamanashi Term Loan"). The Mitsubishi-Yamanashi Term Loan was available from January 29, 2018 to January 29, 2025. The full amount of the Mitsubishi-Yamanashi Term Loan was drawn on January 29, 2018. Interest on the Mitsubishi-Yamanashi Term Loan is based upon the annual rate of the three months TIBOR rate plus 1.00%. The Mitsubishi-Yamanashi Term Loan requires quarterly interest payments, along with the principal payments, over 82 months commencing in April 2018. As of December 31, 2021, our aggregate outstanding principal balance under Mitsubishi Bank Term Loans and Mitsubishi-Yamanashi Term Loan was 970 million JPY (approximately $8.4 million). See Note 11 of Notes to Consolidated Financial Statements in Item 8 of Part II of this Report.
From time to time we accept notes receivable in exchange for accounts receivable from certain of our customers in China. These notes receivable are non-interest bearing and are generally due within nine months. Historically, we have collected on the notes receivable in full at the time of maturity.
In 2021, we incurred operating losses of $37.8 million and cash flows used in operations of $(20.6) million. We had an accumulated deficit of $459.6 million as of December 31, 2021.
During 2021 under the revolving line of credit we repaid $1.3 million to Wells Fargo. Additionally, we had $2.9 million of current portion of long-term debt as of December 31, 2021, which we plan to pay out of our existing available cash.
Lumentum has agreed to arrange for up to $50,000,000 in interim debt financing that is unsecured, subordinated to our existing secured credit facility with Wells Fargo, has a two-year term and bears interest at the prime rate.
We believe that our existing cash, cash equivalents and cash flows from our operating activities will be sufficient to meet our anticipated cash needs for at least the next 12 months. Our future capital requirements will depend on many factors including our growth rate, the timing and extent of spending to support development efforts, the expansion of sales and marketing activities, the introduction of new and enhanced products, the costs to increase our manufacturing capacity and our foreign operations and the continuing market acceptance of our products. In the event that additional financing is required from outside sources, we may not be able to raise it on terms acceptable to us or at all. If we are unable to raise additional capital when desired, our business, operating results and financial condition would be adversely affected.
Rusnano Rights Agreement
In April 2019, we completed the sale of 100% interest in the operations of NeoPhotonics Corporation, LLC, our manufacturing operations in Russia, to Rusnano. In connection with the sale, we received $2.0 million in cash and settled a $2.0 million exit fee that would have otherwise been owed to Rusnano.
Cash flow discussion
The table below sets forth selected cash flow data for the periods presented:
| | | | | | | | | | | | | | | | | |
| | Years ended December 31, |
| (in thousands) | 2021 | | 2020 | | 2019 |
| Net cash provided by (used in) operating activities | $ | (20,587) | | | $ | 54,930 | | | $ | 34,687 | |
| Net cash used in investing activities | (10,057) | | | (33,368) | | | (7,447) | |
| Net cash provided by (used in) financing activities | 12,796 | | | (8,543) | | | (14,878) | |
| Effect of exchange rates on cash, cash equivalents and restricted cash | 162 | | | 1,148 | | | (161) | |
| Net increase (decrease) in cash, cash equivalents and restricted cash | $ | (17,686) | | | $ | 14,167 | | | $ | 12,201 | |
Operating activities
In 2021, net cash used in operating activities was $20.6 million, compared to $54.9 million net cash provided by operating activities in 2020. The decrease was primarily attributable to a $43.6 million increase in net loss and non-cash adjustments, a $32.7 million decrease in cash flows related to accounts receivable, a $17.0 million decrease in cash flows related to accrued and other liabilities, and a $10.6 million decrease in cash flows related to inventories. The decreases were offset by a $29.2 million increase in cash flows related to accounts payable.
In 2020, net cash provided by operating activities was $54.9 million, compared to $34.7 million in 2019. The increase was primarily attributable to a $12.7 million decrease in net loss, a $16.8 million increase in cash flows related to accounts receivables and a $3.3 million increase in cash flows related to prepaid expenses and other current assets. The increases were offset by a $14.9 million decrease in cash flows related to accounts payable.
Investing activities
In 2021, net cash used in investing activities was $10.1 million, a $23.3 million decrease compared to $33.4 million used in 2020. The decrease in net cash used in investment activities was primarily attributable to an increase in net cash provided by proceeds from sale of marketable securities totaling $27.0 million, and a net decrease of $2.4 million used to purchase property, plant and equipment. The decreases were offset by a $7.0 million increase to purchase marketable securities.
In 2020, net cash used in investing activities was $33.4 million, a $26.0 million increase compared to $7.4 million used in 2019. The increase in net cash used in investment activities was primarily attributable to an increase in net cash used totaling $19.9 million to purchase marketable securities, and a net increase of $4.3 million used to purchase property, plant and equipment.
Financing activities
In 2021, net cash provided by financing activities was $12.8 million, a $21.3 million increase compared to $8.5 million net cash used by financing activities in 2020. The increase in cash flows from investing activities was primarily attributable to a $14.4 million increase in net borrowings under our credit facilities and terms loans in China, and a $5.8 million decrease in repayment of bank loan.
In 2020, net cash used in financing activities was $8.5 million, a $6.4 million decrease compared to $14.9 million net cash used by financing activities in 2019. The decrease in cash flows from investing activities was primarily attributable to a $7.7 million decrease in net borrowings under our credit facilities, terms loans and note payables in China, partially offset by a $1.0 million increase in withholding tax for restricted stock releases.
Material requirements from contractual and other obligations
Summarized in the table and text below are our short-term and long-term obligations as of December 31, 2021:
| | | | | | | | | | | | | | | | | | | | | | | | | | | | | |
| | Payments due by period |
| (in thousands) | Total | | Less than 1 Year | | 1-3 Years | | 3-5 Years | | More than 5 Years |
Notes payable and short-term borrowing (1) | $ | 15,000 | | | $ | 15,000 | | | $ | — | | | $ | — | | | $ | — | |
Long-term debt (1) | 28,861 | | | 3,017 | | | 5,097 | | | 20,747 | | | — | |
Retirement obligations (2) | 2,717 | | | 282 | | | 390 | | | 325 | | | 1,720 | |
Operating leases (3) | 18,848 | | | 3,284 | | | 6,727 | | | 6,709 | | | 2,128 | |
Purchase commitments (4) | 31,343 | | | 31,343 | | | $ | — | | | $ | — | | | $ | — | |
Asset retirement obligations (5) | 3,918 | | | 410 | | | 27 | | | $ | — | | | 3,481 | |
Expected interest payments (6) | 2,017 | | | 528 | | | 867 | | | 622 | | | $ | — | |
| Finance lease | 94 | | | 94 | | | $ | — | | | $ | — | | | $ | — | |
| Total | 102,798 | | | $ | 53,958 | | | $ | 13,108 | | | $ | 28,403 | | | $ | 7,329 | |
| Uncertainty in timing of future payments: | | | | | | | | | |
| Restricted retained earnings | 10,463 | | | | | | | | | |
| Deferred compensation plan | 885 | | | | | | | | | |
| Total commitments | $ | 114,146 | | | | | | | | | |
____________________________________________
(1)See Note 11, Debt, in Notes to Consolidated Financial Statements in Item 8 of Part II of this Report for additional information regarding our debt.
(2)See Note 13, Pension Plans, in Notes to Consolidated Financial Statements in Item 8 of Part II of this Report for additional information regarding our retirement obligations.
(3)We have entered into various non-cancelable operating lease agreements for our offices in China, U.S. and Canada.
(4)This is an estimate of the amount outstanding under open purchase orders for the purchase of inventory and other goods at December 31, 2021. Certain of these open purchase orders may be cancellable without penalty.
(5)We have an asset retirement obligation of $3.8 million associated with our facility leases in California and $0.1 million in Japan, included in Accrued and other current liabilities and Other noncurrent liabilities in the consolidated balance sheets as of December 31, 2021.
(6)We calculate the expected interest payments based on our long-term debt at prevailing interest rates as of December 31, 2021.
Uncertain Tax Positions
As of December 31, 2021, there were no liabilities for uncertain tax positions.
Off-balance sheet arrangements
During the years ended December 31, 2021 and 2020, we did not have any significant off-balance sheet arrangements.
Recent accounting pronouncements
See Note 2, Summary of Significant Accounting Policies, in Notes to the Consolidated Financial Statements in Item 8 of Part II of this Report, for a full description of recent accounting pronouncements, including the expected dates of adoption and estimated effects on financial condition and results of operations, which is incorporated herein by reference.
ITEM 7A. QUANTITATIVE AND QUALITATIVE DISCLOSURES ABOUT MARKET RISK
Interest rate fluctuation risk
The primary objective of our investment activities is to preserve principal while at the same time maximizing the income we receive from our investments without significantly increasing risk. To achieve this objective, we invest our excess cash in a variety of securities, including U.S. government agency securities, corporate notes and bonds and money market funds meeting certain criteria. These securities are classified as available-for-sale which are recorded on the balance sheet at fair value. We have determined that the gross unrealized gains or losses on the available-for-sale securities at December 31, 2020 are temporary in nature. We may sell these marketable securities investments in the future to fund future operating needs.
As of December 31, 2021, we had $20.3 million outstanding under our U.S. credit facilities and $8.4 million outstanding under our term loans in Japan, which were subject to fluctuations in interest rates. For the year ended December 31, 2021, a hypothetical 10% increase in the interest rate could result in $0.1 million additional annual interest expense. The hypothetical assumptions made above will be different from what actually occurs in the future. Furthermore, the computations do not anticipate actions that may be taken by our management should the hypothetical market changes actually occur over time. As a result, actual impacts on our results of operations in the future will differ from those quantified above.
Foreign currency exchange risk
Foreign currency exchange rates are subject to fluctuation and may cause us to recognize transaction gains and losses in our statements of operations. A large portion of our business is conducted through our subsidiaries in China, whose functional currency is the RMB and Japan, whose functional currency is the JPY. To the extent that transactions by these subsidiaries are in currencies other than their functional currencies, we bear the risk that fluctuations in the exchange rates of the RMB and JPY in relation to other currencies could increase our costs and expenses. During the year ended December 31, 2021, we recognized net foreign currency transaction loss of $0.7 million. We use the U.S. dollar as the reporting currency for our consolidated financial statements. Any significant revaluation of the RMB or JPY may materially and adversely affect our results of operations upon translation of these subsidiaries’ financial statements into U.S. dollars. While we generate a significant portion of our revenue in U.S. dollars, a significant portion of our cost of goods sold are in RMB. Therefore, appreciation in RMB against the U.S. dollar would negatively impact our cost of goods sold upon translation to U.S. dollars. For example, for the year ended December 31, 2021, a 10% appreciation in RMB against the U.S. dollar would have resulted in an approximately $1.4 million increase in our cost of goods sold.
Since 2018, we have discontinued entering into foreign currency forward contracts. This may increase the risks to us arising from the short-term impact of foreign currency fluctuations. In addition, our currency exchange variations may be magnified by any Chinese exchange control regulations that restrict our ability to convert RMB into foreign currency.
Inflation risk
Inflationary factors, such as increases in our cost of goods sold and operating expenses, may adversely affect our results of operations. Although we do not believe that inflation has had a material impact on our financial position or results of operations to date, an increase in the rate of inflation in the future, particularly in China, may have an adverse effect on our levels of gross profit and operating profit as a percentage of revenue if the sales prices for our products do not proportionately increase with these increased expenses.
ITEM 8. FINANCIAL STATEMENTS AND SUPPLEMENTARY DATA
INDEX TO CONSOLIDATED FINANCIAL STATEMENTS
| | | | | |
| | Page |
| |
| |
| FINANCIAL STATEMENTS: | |
| |
| |
| |
| |
| |
| |
REPORT OF INDEPENDENT REGISTERED PUBLIC ACCOUNTING FIRM
Shareholders and Board of Directors
NeoPhotonics Corporation
San Jose, California
Opinion on the Consolidated Financial Statements
We have audited the accompanying consolidated balance sheets of NeoPhotonics Corporation (the “Company”) as of December 31, 2021 and 2020, the related consolidated statements of operations, comprehensive loss, stockholders’ equity, and cash flows for each of the years then ended, and the related notes (collectively referred to as the “consolidated financial statements”). In our opinion, the consolidated financial statements present fairly, in all material respects, the financial position of the Company at December 31, 2021 and 2020, and the results of its operations and its cash flows for the years then ended, in conformity with accounting principles generally accepted in the United States of America.
We also have audited, in accordance with the standards of the Public Company Accounting Oversight Board (United States) (“PCAOB”), the Company's internal control over financial reporting as of December 31, 2021, based on criteria established in Internal Control – Integrated Framework (2013) issued by the Committee of Sponsoring Organizations of the Treadway Commission (“COSO”) and our report dated February 24, 2022 expressed an unqualified opinion thereon.
Basis for Opinion
These consolidated financial statements are the responsibility of the Company’s management. Our responsibility is to express an opinion on the Company’s consolidated financial statements based on our audits. We are a public accounting firm registered with the PCAOB and are required to be independent with respect to the Company in accordance with the U.S. federal securities laws and the applicable rules and regulations of the Securities and Exchange Commission and the PCAOB.
We conducted our audits in accordance with the standards of the PCAOB. Those standards require that we plan and perform the audit to obtain reasonable assurance about whether the consolidated financial statements are free of material misstatement, whether due to error or fraud.
Our audits included performing procedures to assess the risks of material misstatement of the consolidated financial statements, whether due to error or fraud, and performing procedures that respond to those risks. Such procedures included examining, on a test basis, evidence regarding the amounts and disclosures in the consolidated financial statements. Our audits also included evaluating the accounting principles used and significant estimates made by management, as well as evaluating the overall presentation of the consolidated financial statements. We believe that our audits provide a reasonable basis for our opinion.
Critical Audit Matter
The critical audit matter communicated below is a matter arising from the current period audit of the consolidated financial statements that was communicated or required to be communicated to the audit committee and that: (1) relates to accounts or disclosures that are material to the consolidated financial statements and (2) involved our especially challenging, subjective, or complex judgments. The communication of the critical audit matter does not alter in any way our opinion on the consolidated financial statements, taken as a whole, and we are not, by communicating the critical audit matter below, providing separate opinions on the critical audit matter or on the accounts or disclosures to which it relates.
Valuation of Inventory
As described in Note 2 to the consolidated financial statements, the valuation of inventories is adjusted by the Company when conditions indicate a decline in value due to obsolescence and is adjusted based on estimates for inventory levels in excess of forecasted demand for specific product groups. Forecasting customer demand can be challenging as significant judgment is needed to determine if and how changing market and industry conditions, and new product developments will impact future demand.
We identified the valuation of inventory as a critical audit matter. To value inventory, management makes complex judgments related to: i) forecasting future demand for excess units on hand based on the Company’s historical sales, existing contracts, market trends, changes in technology, macroeconomic conditions, and applicable government regulations, and ii) obsolescence of certain products based on changes in technology and demand. Auditing these elements involved especially challenging and subjective auditor judgment due to the nature and extent of audit effort required to address these matters.
The primary procedures we performed to address this critical audit matter included:
•Testing the design and operating effectiveness of controls relating to the review and approval process for recording adjustments to the valuation of inventory, including controls designed to review and approve the forecasts and expectations of future demand.
•Observing the proceedings of the Company’s meetings to understand the Company’s rationale for forecasting excess and obsolete inventory for each specific product group.
•Evaluating the Company’s rationale for whether to reduce the value of specific inventory items by selecting a sample of inventory items and i) performing a retrospective review by comparing management’s prior-year projection of future demand by product with actual product sales in the current year to assess management’s ability to accurately forecast future demand by product, and ii) reviewing the underlying assumptions related to the estimates of future demand including historical sales, existing contracts, market trends, changes in technology, macroeconomic conditions, and assessing contradictory evidence.
/s/ BDO USA, LLP
We have served as the Company's auditor since 2020
San Jose, California
February 24, 2022
REPORT OF INDEPENDENT REGISTERED PUBLIC ACCOUNTING FIRM
To the Stockholders and the Board of Directors of NeoPhotonics Corporation
Opinion on the Financial Statements
We have audited the accompanying consolidated balance sheet of NeoPhotonics Corporation and subsidiaries (the "Company") as of December 31, 2019, the related consolidated statements of operations, comprehensive loss, stockholders' equity, and cash flows, for the year ended December 31, 2019, and the related notes (collectively referred to as the "financial statements"). In our opinion, the financial statements present fairly, in all material respects, the financial position of the Company as of December 31, 2019, and the results of its operations and its cash flows for the year ended December 31, 2019, in conformity with accounting principles generally accepted in the United States of America.
Change in Accounting Principle
As discussed in Note 2 to the financial statements, the Company has changed its method of accounting for leases in fiscal year 2019 due to the adoption of Accounting Standards Update (ASU) 2016-02, Leases (Topic 842) and related amendments.
Basis for Opinion
These financial statements are the responsibility of the Company's management. Our responsibility is to express an opinion on the Company's financial statements based on our audit. We are a public accounting firm registered with the Public Company Accounting Oversight Board (United States)(PCAOB) and are required to be independent with respect to the Company in accordance with the U.S. federal securities laws and the applicable rules and regulations of the Securities and Exchange Commission and the PCAOB.
We conducted our audit in accordance with the standards of the PCAOB. Those standards require that we plan and perform the audit to obtain reasonable assurance about whether the financial statements are free of material misstatement, whether due to error or fraud. Our audit included performing procedures to assess the risks of material misstatement of the financial statements, whether due to error or fraud, and performing procedures that respond to those risks. Such procedures included examining, on a test basis, evidence regarding the amounts and disclosures in the financial statements. Our audit also included evaluating the accounting principles used and significant estimates made by management, as well as evaluating the overall presentation of the financial statements. We believe that our audits provide a reasonable basis for our opinion.
/s/ DELOITTE & TOUCHE LLP
San Jose, California
February 27, 2020
We have served as the Company's auditor since 2014. In 2020, we became the predecessor auditor.
NEOPHOTONICS CORPORATION
CONSOLIDATED BALANCE SHEETS
| | | | | | | | | | | |
| | December 31, |
| (In thousands, except per share) | 2021 | | 2020 |
| ASSETS | | | |
| Current assets: | | | |
| Cash and cash equivalents | $ | 77,833 | | | $ | 95,117 | |
| Short-term investments | 27,675 | | | 27,669 | |
| Restricted cash | 87 | | | 489 | |
| Accounts receivable, net of allowance for doubtful accounts | 55,324 | | | 45,232 | |
| Inventories | 52,896 | | | 46,901 | |
| | | |
| Prepaid expenses and other current assets | 16,246 | | | 20,173 | |
| Total current assets | 230,061 | | | 235,581 | |
| Property, plant and equipment, net | 54,190 | | | 66,765 | |
| Operating lease right-of-use assets | 13,201 | | | 13,823 | |
| Purchased intangible assets, net | 844 | | | 1,468 | |
| Goodwill | 1,115 | | | 1,115 | |
| Other long-term assets | 6,156 | | | 4,912 | |
| Total assets | $ | 305,567 | | | $ | 323,664 | |
| LIABILITIES AND STOCKHOLDERS’ EQUITY | | | |
| Current liabilities: | | | |
| Accounts payable | $ | 58,125 | | | $ | 43,539 | |
| Notes payable and short-term borrowing | 14,914 | | | — | |
| Current portion of long-term debt | 2,928 | | | 3,232 | |
| Accrued and other current liabilities | 30,008 | | | 42,053 | |
| Total current liabilities | 105,975 | | | 88,824 | |
| Long-term debt, net of current portion | 25,753 | | | 30,327 | |
| Operating lease liabilities, non-current | 13,441 | | | 14,522 | |
| Other noncurrent liabilities | 7,437 | | | 9,584 | |
| Total liabilities | 152,606 | | | 143,257 | |
| Commitments and contingencies (Note 14) | 0 | | 0 |
| Stockholders’ equity: | | | |
| Preferred stock, $0.0025 par value, 10,000 shares authorized, no shares issued or outstanding | — | | | — | |
| Common stock, $0.0025 par value, 100,000 shares authorized | | | |
| At December 31, 2021, 53,113 shares issued and outstanding; at December 31, 2020, 50,457 shares issued and outstanding | 133 | | | 126 | |
| Additional paid-in capital | 610,085 | | | 597,460 | |
| Accumulated other comprehensive income | 2,376 | | | 1,735 | |
| Accumulated deficit | (459,633) | | | (418,914) | |
| Total stockholders’ equity | 152,961 | | | 180,407 | |
| Total liabilities and stockholders’ equity | $ | 305,567 | | | $ | 323,664 | |
See Accompanying Notes to Consolidated Financial Statements.
NEOPHOTONICS CORPORATION
CONSOLIDATED STATEMENTS OF OPERATIONS
| | | | | | | | | | | | | | | | | |
| | Years Ended December 31, |
| (In thousands, except per share value) | 2021 | | 2020 | | 2019 |
| Revenue | $ | 290,289 | | | $ | 371,163 | | | $ | 356,804 | |
| Cost of goods sold | 222,701 | | | 268,081 | | | 267,991 | |
| Gross profit | 67,588 | | | 103,082 | | | 88,813 | |
| Operating expenses: | | | | | |
| Research and development | 56,486 | | | 56,100 | | | 57,634 | |
| Sales and marketing | 14,539 | | | 15,629 | | | 16,088 | |
| General and administrative | 30,464 | | | 30,569 | | | 29,759 | |
| Amortization of purchased intangible assets | — | | | — | | | 119 | |
| Acquisition and asset sale related costs | 3,733 | | | 1,094 | | | 397 | |
| Restructuring charges | 14 | | | 156 | | | 261 | |
| Litigation settlements | 240 | | | (2,988) | | | — | |
| Gain on asset sale | (58) | | | (1,044) | | | (903) | |
| Total operating expenses | 105,418 | | | 99,516 | | | 103,355 | |
| Income (loss) from operations | (37,830) | | | 3,566 | | | (14,542) | |
| Interest income | 409 | | | 182 | | | 376 | |
| Interest expense | (969) | | | (1,182) | | | (1,919) | |
| Other income (expense), net | (621) | | | (5,730) | | | 642 | |
| Total interest and other income (expense), net | (1,181) | | | (6,730) | | | (901) | |
| Loss before income taxes | (39,011) | | | (3,164) | | | (15,443) | |
| Provision for income taxes | (1,708) | | | (1,202) | | | (1,633) | |
| Net loss | $ | (40,719) | | | $ | (4,366) | | | $ | (17,076) | |
| Basic and diluted net loss per share | $ | (0.78) | | | $ | (0.09) | | | $ | (0.36) | |
| | | | | |
| Weighted average shares used to compute basic and diluted net loss per share | 51,926 | | | 49,474 | | | 47,304 | |
| | | | | |
See Accompanying Notes to Consolidated Financial Statements.
NEOPHOTONICS CORPORATION
CONSOLIDATED STATEMENTS OF COMPREHENSIVE INCOME (LOSS)
| | | | | | | | | | | | | | | | | |
| | Years ended December 31, |
| (in thousands) | 2021 | | 2020 | | 2019 |
| Net loss | $ | (40,719) | | | $ | (4,366) | | | $ | (17,076) | |
| Other comprehensive income (loss): | | | | | |
| Foreign currency translation adjustments, net of zero tax | 651 | | | 9,592 | | | (745) | |
| | | | | |
| Defined benefit pension plans: | | | | | |
| Gain (loss) arising during the period | (15) | | | 21 | | | — | |
| | | | | |
| Tax | 5 | | | (7) | | | — | |
| Total other comprehensive income (loss) | 641 | | | 9,606 | | | (745) | |
| Comprehensive income (loss) | $ | (40,078) | | | $ | 5,240 | | | $ | (17,821) | |
See Accompanying Notes to Consolidated Financial Statements.
NEOPHOTONICS CORPORATION
CONSOLIDATED STATEMENTS OF STOCKHOLDERS’ EQUITY
| | | | | | | | | | | | | | | | | | | | | | | | | | | | | | | | | | | |
| | Common stock | | Additional paid-in capital | | Accumulated other comprehensive income (loss) | | Accumulated deficit | | Total stockholders’ equity |
| (In thousands) | Shares | | Amount | | | | |
| Balances at December 31, 2018 | 46,378 | | | $ | 116 | | | $ | 564,722 | | | $ | (7,126) | | | $ | (397,472) | | | $ | 160,240 | |
| Comprehensive loss | — | | | — | | | — | | | (745) | | | (17,076) | | | (17,821) | |
| Issuance of common stock in exchange for research and development services, net of issuance costs of $46 | 442 | | | 1 | | | 2,453 | | | — | | | — | | | 2,454 | |
| Issuance of common stock upon exercise of stock options | 486 | | | 1 | | | 1,892 | | | — | | | — | | | 1,893 | |
| Issuance of common stock under employee stock purchase plan | 357 | | | 1 | | | 1,952 | | | — | | | — | | | 1,953 | |
| Issuance of common stock for vested restricted stock units | 1,018 | | | 2 | | | (2) | | | — | | | — | | | — | |
| Tax withholding related to vesting of restricted stock units | (155) | | | — | | | (733) | | | — | | | — | | | (733) | |
| Stock-based compensation costs | — | | | — | | | 12,220 | | | — | | | — | | | 12,220 | |
| Balances at December 31, 2019 | 48,526 | | | $ | 121 | | | $ | 582,504 | | | $ | (7,871) | | | $ | (414,548) | | | $ | 160,206 | |
| Comprehensive income (loss) | — | | | — | | | — | | | 9,606 | | | (4,366) | | | 5,240 | |
| Issuance of common stock upon exercise of stock options | 498 | | | 2 | | | 2,170 | | | — | | | — | | | 2,172 | |
| Issuance of common stock under employee stock purchase plan | 326 | | | 1 | | | 2,140 | | | — | | | — | | | 2,141 | |
| Issuance of common stock for vested restricted stock units | 1,313 | | | 3 | | | (3) | | | — | | | — | | | — | |
| Tax withholding related to vesting of restricted stock units | (206) | | | (1) | | | (1,750) | | | — | | | — | | | (1,751) | |
| Stock-based compensation costs | — | | | — | | | 12,399 | | | — | | | — | | | 12,399 | |
| Balances at December 31, 2020 | 50,457 | | | $ | 126 | | | $ | 597,460 | | | $ | 1,735 | | | $ | (418,914) | | | $ | 180,407 | |
| Comprehensive income (loss) | — | | | — | | | — | | | 641 | | | (40,719) | | | (40,078) | |
| Issuance of common stock upon exercise of stock options | 836 | | | 2 | | | 5,113 | | | — | | | — | | | 5,115 | |
| Issuance of common stock under employee stock purchase plan | 358 | | | 1 | | | 2,367 | | | — | | | — | | | 2,368 | |
| Issuance of common stock for vested restricted stock units | 1,914 | | | 5 | | | (5) | | | — | | | — | | | — | |
| Tax withholding related to vesting of restricted stock units | (452) | | | (1) | | | (5,033) | | | — | | | — | | | (5,034) | |
| Stock-based compensation costs | — | | | — | | | 10,183 | | | — | | | — | | | 10,183 | |
| Balances at December 31, 2021 | 53,113 | | | $ | 133 | | | $ | 610,085 | | | $ | 2,376 | | | $ | (459,633) | | | $ | 152,961 | |
See Accompanying Notes to Consolidated Financial Statements.
NEOPHOTONICS CORPORATION
CONSOLIDATED STATEMENTS OF CASH FLOWS
| | | | | | | | | | | | | | | | | |
| | Years ended December 31, |
| (In thousands) | 2021 | | 2020 | | 2019 |
| Cash flows from operating activities | | | | | |
| Net loss | $ | (40,719) | | | $ | (4,366) | | | $ | (17,076) | |
| Adjustments to reconcile net loss to net cash provided by operating activities: | | | | | |
| Depreciation and amortization | 23,545 | | | 30,648 | | | 30,788 | |
| Stock-based compensation expense | 10,993 | | | 12,337 | | | 12,456 | |
| Deferred taxes | (1,092) | | | (928) | | | (287) | |
| Amortization of investment, debt and other | 404 | | | 360 | | | 414 | |
| Gain on disposal of property and equipment | (398) | | | (1,114) | | | (872) | |
| Amortization of operating lease right-of-use assets | 2,084 | | | 1,912 | | | 1,774 | |
| Net loss recovery from litigation settlement | — | | | (2,988) | | | — | |
| | | | | |
| Allowance for doubtful accounts | (1) | | | (16) | | | (13) | |
| Write-down of inventories | 11,971 | | | 9,443 | | | 7,847 | |
| Foreign currency remeasurement and other, net | 685 | | | 5,753 | | | (910) | |
| Issuance of common stock in exchange for research and development services | — | | | — | | | 2,500 | |
| Change in assets and liabilities: | | | | | |
| Accounts receivable | (10,095) | | | 22,567 | | | 5,838 | |
| Inventories | (18,026) | | | (7,411) | | | (2,891) | |
| Prepaid expenses and other assets | 2,907 | | | 3,716 | | | 429 | |
| Accounts payable | 14,201 | | | (14,962) | | | (41) | |
| Accrued and other liabilities | (17,046) | | | (21) | | | (5,269) | |
| Net cash provided by (used in) operating activities | (20,587) | | | 54,930 | | | 34,687 | |
| Cash flows from investing activities | | | | | |
| Purchase of property, plant and equipment | (11,499) | | | (13,870) | | | (9,532) | |
| Proceeds from sale of property, plant and equipment and other assets | 1,448 | | | 533 | | | 2,242 | |
| Purchase of marketable securities | (30,507) | | | (23,531) | | | (157) | |
| Proceeds from sale of marketable securities | 30,501 | | | 3,500 | | | — | |
| | | | | |
| | | | | |
| | | | | |
| Net cash used in investing activities | (10,057) | | | (33,368) | | | (7,447) | |
| Cash flows from financing activities | | | | | |
| Proceeds from exercise of stock options and issuance of stock under ESPP | 7,850 | | | 3,880 | | | 3,846 | |
| Offering costs | — | | | — | | | (46) | |
| Tax withholding on restricted stock units | (5,034) | | | (1,751) | | | (733) | |
| Proceeds from bank loans | 14,446 | | | — | | | 5,000 | |
| Repayment of bank loans | (4,365) | | | (10,150) | | | (18,084) | |
| | | | | |
| Repayment of finance lease liabilities | (101) | | | (87) | | | (87) | |
| Repayment of notes payable | — | | | — | | | (4,774) | |
| Proceeds from (repayment of) government grants | — | | | (435) | | | — | |
| Net cash provided by (used in) financing activities | 12,796 | | | (8,543) | | | (14,878) | |
| Effect of exchange rates on cash, cash equivalents and restricted cash | 162 | | | 1,148 | | | (161) | |
| Net increase (decrease) in cash, cash equivalents and restricted cash | (17,686) | | | 14,167 | | | 12,201 | |
| Cash, cash equivalents and restricted cash at the beginning of the period | 95,606 | | | 81,439 | | | 69,238 | |
| Cash, cash equivalents and restricted cash at the end of the period | $ | 77,920 | | | $ | 95,606 | | | $ | 81,439 | |
| Supplemental disclosure of cash flow information: | | | | | |
| Cash paid for interest | $ | 212 | | | $ | 248 | | | $ | 278 | |
| Net cash paid for income taxes | 1,672 | | | 799 | | | 1,289 | |
| Supplemental disclosure of noncash investing and financing activities: | | | | | |
| Neo Russia penalty settlement | — | | | — | | | 2,000 | |
| Debt interest rolled into principal | 408 | | | 701 | | | 1,368 | |
| Government approved expenditures incurred after receipt of government funds | — | | | — | | | 579 | |
| | | | | |
| Unpaid property, plant and equipment | 1,627 | | | 765 | | | 1,887 | |
| Right-of-use assets obtained in exchange for lease obligations | 1,430 | | | — | | | — | |
See Accompanying Notes to Consolidated Financial Statements.
NEOPHOTONICS CORPORATION
NOTES TO CONSOLIDATED FINANCIAL STATEMENTS
1. The Company and basis of presentation
Business and organization
NeoPhotonics Corporation and its subsidiaries ("NeoPhotonics" or "the Company") develops, manufactures and sells optoelectronic products that transmit and receive high-speed digital optical signals for Cloud and hyperscale data center internet content provider and telecom networks.
Proposed Merger with Lumentum Holdings, Inc.
On November 4, 2021 the Company announced its planned merger with a subsidiary of Lumentum Holdings, Inc. Consummation of the Merger is subject to customary closing conditions, including the absence of certain legal impediments, the expiration or termination of the required waiting periods under the Hart-Scott-Rodino Antitrust Improvements Act of 1976, as amended (“HSR Act”), and approval by the holders of a majority of the outstanding shares of the Company's common stock. The remaining requirements for closure of the Merger are customary closing conditions set forth in the Merger Agreement and approval from the State Administration for Market Regulation ("SAMR") of the People’s Republic of China. The Company expects this transaction will close in the second half of 2022.
Certain Significant Risks and Uncertainties
The Company operates in a dynamic industry and, accordingly, can be affected by a variety of factors. For example, any of the following areas could have a negative effect on the Company in terms of its future financial position, results of operations or cash flows: the general state of the U.S., China and world economies; the highly cyclical nature of the industries the Company serves; successful and timely completion of product design efforts; the ability of the Company to sell its new products into new market segments; trade restrictions by the United States against the Company's customers in China, as well as potential retaliatory trade actions taken by China; the loss of any of its larger customers; restrictions on the Company's ability to sell to foreign customers due to additional U.S. or new China trade laws, regulations and requirements; disruptions of the supply chain of components needed for its products; ability to obtain additional financing; inability to meet certain debt covenants; fundamental changes in the technology underlying the Company’s products; the hiring, training and retention of key employees; and new product design introductions by competitors. The inputs into the Company’s judgments and estimates consider the economic implications of the Covid-19 pandemic, as the Company knows them, on its critical and significant accounting estimates. The extent to which the Covid-19 pandemic may impact its business will depend on future developments, which are highly uncertain, such as the duration of the outbreak, travel restrictions, governmental mandates issued to mitigate the spread of the disease, business closures, economic disruptions, and the effectiveness of actions taken to contain and treat the virus. Accordingly, future adverse developments with respect to the Covid-19 pandemic may have a negative impact on its sales, supply chain and results of operations. The inputs into the Company's judgments and estimates also consider the Department of Commerce Entities List restrictions on Huawei Technologies effective September 2020 for the Company and expected loss of business from Huawei Technologies. See also Note 10.
Consolidation
The consolidated financial statements include the accounts of the Company and its wholly-owned subsidiaries. Intercompany accounts and transactions have been eliminated in consolidation.
2. Summary of significant accounting policies
Use of estimates
The preparation of financial statements in accordance with U.S. GAAP requires management to make estimates and assumptions that affect the reported amounts of assets and liabilities and disclosure of contingent assets and liabilities at the date of the financial statements and the reported revenue and expenses during the reporting period. Significant estimates made by management include: the useful lives and recoverability of long-lived assets; valuation allowances for deferred tax assets; valuation of excess and obsolete inventories and recognition of stock-based compensation, among others. Actual results could differ from these estimates.
Concentration of credit risk and significant customers and suppliers
Financial instruments that potentially subject the Company to concentrations of credit risk are primarily cash and cash equivalents and trade accounts receivable. The Company’s investment policy requires cash and cash equivalents to be placed with high-credit quality institutions and limits on the amount of credit risk from any one issuer. The Company performs ongoing credit evaluations of its customers’ financial condition whenever deemed necessary and generally does not require collateral. The Company maintains an allowance for doubtful accounts based upon the expected collectability of all accounts receivable, which takes into consideration an analysis of historical bad debts, specific customer creditworthiness and current economic trends.
Table of Contents
NEOPHOTONICS CORPORATION
NOTES TO CONSOLIDATED FINANCIAL STATEMENTS (continued)
Customers accounting for more than 10% of our total revenue and revenue from our top five customers for the years ended December 31, 2021, 2020 and 2019 were as follows:
| | | | | | | | | | | | | | | | | |
| | Years Ended December 31, |
| | 2021 | | 2020 | | 2019 |
| Percent of revenue from customers accounting for 10% or more of total revenue: | | | | | |
| Cisco Systems, Inc. | 27 | % | | 5 | % | | 4 | % |
| Ciena Corporation | 18 | % | | 17 | % | | 29 | % |
| Nokia Corporation | 12 | % | | 7 | % | | 4 | % |
| Huawei Technologies Co., Ltd | 11 | % | | 40 | % | | 41 | % |
| Acacia Communications, Inc. | — | % | | 10 | % | | 5 | % |
| Percent of revenue from top five customers | 75 | % | | 79 | % | | 84 | % |
As of December 31, 2021, three customers accounted for a total of 35% of the Company’s total accounts receivable. As of December 31, 2020, three customers accounted for a total of 65% of the Company’s total accounts receivable.
The Company relies on single and limited suppliers for a number of key components. The Company relies primarily on a limited number of significant independent contract manufacturers for the production of certain key components and subassemblies.
Restricted cash
As a condition of the notes payable lending arrangements and the line of credit facilities, the Company is required to keep a compensating balance at the issuing banks. In addition, the Company also maintained restricted cash in connection with government grants received in advance and cash balances temporarily restricted for regular business operations. These balances have been excluded from the Company’s cash and cash equivalents balance and are classified as restricted cash in the Company’s consolidated balance sheets. As of December 31, 2021, the majority of the restrictions on cash have been released. As of December 31, 2021 and 2020, the amount of restricted cash was $0.1 million and $0.5 million, respectively.
Cash, cash equivalents and investments
Highly liquid investments with a maturity of 90 days or less at the date of purchase are considered cash equivalents, with the exception of money market funds and commercial paper which are classified as short-term investments. Marketable securities are reported at fair value and are classified as available-for-sale investments in our current assets because they represent investments of cash available for current operations and for strategic reasons. As a result, the Company recorded all its marketable securities in short-term investments regardless of the contractual maturity date of the securities.
The Company regularly reviews its investment portfolio to identify and evaluate investments that have indications of possible impairment. Factors considered in determining whether a loss is other-than-temporary include: the length of time and extent to which the fair market value has been lower than the cost basis, the financial condition and near-term prospects of the investee, credit quality, likelihood of recovery, and the Company’s ability to hold the investment for a period of time sufficient to allow for any anticipated recovery in fair market value.
Unrealized gains and losses, net of tax, are included in accumulated other comprehensive loss as a separate component of stockholders’ equity on the consolidated balance sheets. The amortization of premiums and discounts on the investments, and realized gains and losses on available-for-sale securities are included in other income, net in the consolidated statements of operations. The Company uses the specific-identification method to determine cost in calculating realized gains and losses upon the sale of its marketable securities.
Fair Value Measurements
Fair value is defined as the price at which an asset could be exchanged in a current transaction between knowledgeable, willing parties. A liability’s fair value is defined as the amount that would be paid to transfer the liability to a new obligor, not the amount that would be paid to settle the liability with the creditor. Where available, fair value is based on observable market prices or parameters or derived from such prices or parameters. Where observable prices or inputs are not available, valuation models are applied. These valuation techniques involve some level of management estimation and judgment, the degree of which is dependent on the price transparency for the instruments or market and the instruments’ complexity. Valuation techniques used to measure fair value must maximize the use of observable inputs and minimize the use of unobservable inputs. The authoritative accounting guidance describes a fair value hierarchy based on three levels of inputs that may be used to measure fair value, of which the first two are considered observable and the last is considered unobservable. These levels of inputs are as follows:
Table of Contents
NEOPHOTONICS CORPORATION
NOTES TO CONSOLIDATED FINANCIAL STATEMENTS (continued)
Level 1—Observable inputs such as unadjusted, quoted prices in active markets for identical assets or liabilities at the measurement date.
Level 2—Inputs (other than quoted prices included in Level 1) are either directly or indirectly observable for the asset or liability. These include quoted prices for similar assets or liabilities in active markets and quoted prices for identical or similar assets or liabilities in markets that are not active.
Level 3—Unobservable inputs that reflect management’s best estimate of what market participants would use in pricing the asset or liability at the measurement date. Consideration is given to the risk inherent in the valuation technique and the risk inherent in the inputs to the model.
For marketable securities measured at fair value using Level 2 inputs, the Company reviews trading activity and pricing for these investments as of the measurement date. When sufficient quoted pricing for identical securities is not available, the Company uses market pricing and other observable market inputs for similar securities obtained from various third party data providers. These inputs either represent quoted prices for similar assets in active markets or have been derived from observable market data.
Accounts receivable
Accounts receivable include trade receivables and notes receivable from customers. The notes are generally due within nine months. The Company receives notes receivable in exchange for accounts receivable from certain customers in China that are secured by the customer’s affiliated financial institution.
An allowance for doubtful accounts is calculated based on the aging of the Company’s trade receivables, historical experience, and management judgment. The Company writes off trade receivables against the allowance when management determines a balance is uncollectible and is no longer actively pursuing collection of the receivable.
Inventories
Inventories consist of on-hand raw materials, work-in-progress inventories and finished goods. Raw materials and work-in-progress inventories are stored mainly on the Company’s premises. Finished goods are stored on the Company’s premises as well as on consignment at certain customer sites.
Inventories are stated at the lower of standard cost, which approximates actual cost determined on the weighted average basis, or net realizable value. Inventories are recorded using the first-in, first-out method. The Company routinely evaluates quantities and values of inventories in light of current market conditions and market trends and records a write-down for quantities in excess of demand and product obsolescence. The evaluation may take into consideration historic usage, expected demand, anticipated sales price, new product development schedules, the effect new products might have on the sale of existing products, product obsolescence, customer concentrations, product merchantability and other factors. Market conditions are subject to change and actual consumption of inventory could differ from forecasted demand. The Company also regularly reviews the cost of inventories against their estimated market value and records a lower of cost or market write-down for inventories that have a cost in excess of estimated market value, resulting in a new cost basis for the related inventories which is not reversed.
Goodwill
Goodwill is reviewed for impairment annually in the fourth fiscal quarter or more frequently if events or changes in circumstances indicate that the carrying value of goodwill may not be recoverable. The Company will assess the qualitative factors to determine whether it is more likely than not that the fair value of its reporting unit is less than its carrying amount as a basis for determining whether it is necessary to perform the two-step goodwill impairment. If the Company determines that it is more likely than not that its fair value is less than its carrying amount, then the two-step goodwill impairment test is performed. The first step, identifying a potential impairment, compares the fair value of the reporting unit with its carrying amount. If the carrying amount exceeds its fair value, the second step would need to be performed; otherwise, no further steps are required. The second step, measuring the impairment loss, compares the implied fair value of the goodwill with the carrying amount of the goodwill. Any excess of the goodwill carrying amount over the implied fair value is recognized as an impairment loss, and the carrying value of goodwill is written down to fair value. The Company had no goodwill impairment in 2021, 2020 and 2019.
Long-lived assets
Property, plant and equipment are stated at cost, net of accumulated depreciation and amortization. Repairs and maintenance costs are expensed as incurred. Depreciation and amortization are computed using the straight-line method over the following estimated useful lives:
Table of Contents
NEOPHOTONICS CORPORATION
NOTES TO CONSOLIDATED FINANCIAL STATEMENTS (continued)
| | | | | |
| Buildings | 20-30 years |
| Machinery and equipment | 2-7 years |
| Furniture, fixtures and office equipment | 3-5 years |
| Software | 5-7 years |
| Leasehold improvements | life of the asset or lease term, if shorter |
Intangible assets acquired in a business combination are recorded at fair value. Identifiable finite-lived intangible assets are amortized over the period of estimated benefit using the straight-line method, reflecting the pattern of economic benefits associated with these assets. The estimated useful lives of the Company’s finite-lived intangible assets generally range from two to seven years. The acquired land use rights in China have an estimated useful life of 45 years.
Assets held for sale are measured at the lower of carrying value or the fair value less cost to sell. The carrying value of intangible assets and other long-lived assets is reviewed on a regular basis for the existence of facts or circumstances, both internally and externally, that may suggest impairment. Some factors which the Company considers to be triggering events for impairment review include a significant decrease in the market value of an asset, a significant change in the extent or manner in which an asset is used, a significant adverse change in the business climate that could affect the value of an asset, an accumulation of costs for an asset in excess of the amount originally expected, a current period operating loss or cash flow decline combined with a history of operating loss or cash flow uses or a projection that demonstrates continuing losses and a current expectation that, it is more likely than not, a long-lived asset will be disposed of at a loss before the end of its estimated useful life.
If one or more of such facts or circumstances exist, the Company will evaluate the carrying value of long-lived assets to determine if impairment exists by comparing it to estimated undiscounted future cash flows over the remaining useful life of the assets. If the carrying value of the assets is greater than the estimated future cash flow, the assets are written down to the estimated fair value. The Company’s cash flow estimates contain management’s best estimates, using appropriate and customary assumptions and projections at the time. Any write-down would be treated as a permanent reduction in the carrying amount of the asset and an operating loss would be recognized.
Due to the Department of Commerce Entities List restrictions effective September 2020 and expected loss of business from Huawei, the Company performed a recoverability test in the third and fourth quarters of 2020 and determined there was no impairment of long-lived assets.
There were no asset impairment charges in 2021, 2020 and 2019.
Leases
The Company determines if an arrangement is a lease at inception. Operating leases are included in operating lease right-of-use ("ROU") assets, other current liabilities and operating lease liabilities on the Company's consolidated balance sheet. Finance leases are included in property, plant and equipment, current portion of long-term debt and long-term debt, net of current portion on the consolidated balance sheets.
Operating lease ROU assets and operating lease liabilities are recognized based on the present value of the future minimum lease payments over the lease term at commencement date. As most of our leases do not provide an implicit rate, the Company uses an estimate of its incremental borrowing rate based on observed market data and other information available at the lease commencement date. The operating lease ROU assets also include any lease payments made and exclude lease incentives. Lease terms may include options to extend or terminate the lease when it is reasonably certain that the Company will exercise such options. The Company does not record leases on the consolidated balance sheet with a term of one year or less. The Company does not separate lease and non-lease components but rather account for each separate component as a single lease component for all underlying classes of assets. Variable lease payments are expensed as incurred and are not included within the operating lease ROU asset and lease liability calculation. Variable lease payments primarily include reimbursements of costs incurred by lessors for common area maintenance and utilities. Lease expense for minimum operating lease payments is recognized on a straight-line basis over the lease term.
Revenue recognition
See Note 3.
Product warranties
The Company generally provides warranties to cover defects in workmanship, materials and manufacturing for a period of one to three years to meet the stated functionality as agreed to in each sales arrangement. Products are tested against specified functionality requirements prior to delivery, but the Company nevertheless from time to time experiences claims under its warranty guarantees. The Company accrues for estimated warranty costs under those guarantees based upon historical experience, and for specific items, at the time their existence is known and the amounts are determinable.
Research and development
Table of Contents
NEOPHOTONICS CORPORATION
NOTES TO CONSOLIDATED FINANCIAL STATEMENTS (continued)
Research and development expense consists of personnel costs, including stock-based compensation expense, for the Company’s research and development personnel and product development costs, including engineering services, development software and hardware tools, depreciation of capital equipment and facility costs. Research and development costs are expensed as incurred.
Advertising costs
Advertising costs are expensed as incurred and, to date, have not been significant.
Stock-based compensation
The Company grants stock-based awards to employees, consultants and directors. The stock-based awards, including stock options, restricted stock units, employee stock purchase rights, stock appreciation units and market-based awards, are accounted for at estimated fair values. Vesting of stock-based awards is generally subject to the grantee’s continuing service to the Company.
The Company generally determines the fair value of stock options and stock appreciation rights utilizing the Black-Scholes-Merton option-pricing model, or a lattice-binomial option-pricing model for stock-based awards with a market condition. The fair value of employee grants is measured on the date of grant and then recognized over the period during which an employee is required to provide services in exchange for the award, known as the requisite service period (usually the vesting period) on a straight-line basis. The fair value of non-employee grants is measured on the date of grant and then marked to market until vest dates and then recognized over the requisite service period.
The Company records expense and an equal adjustment to the liability for stock appreciation units equal to the fair value of the vested portion of the awards as of each period end. Each reporting period thereafter, compensation expense will be recorded based on the remaining service period and the then fair value of the award until vesting of the award is completed. After vesting is completed, the Company will continue to re-measure the fair value of the liability each reporting period until the award is exercised or expires, with changes in the fair value of the liability recorded in the consolidated statements of operations.
Restricted stock units are valued at the closing sales price as quoted on the New York Stock Exchange on the date of grant, and are converted into shares of common stock upon vesting on a 1-for-one basis. The compensation expense related to the restricted stock units is determined using the fair value of common stock on the date of grant, and the expense is recognized on a straight-line basis over the vesting period.
Employee stock purchase rights are accounted for at fair value, utilizing the Black-Scholes-Merton option-pricing model.
Stock-based compensation expense for modified stock-based awards are recognized using the pool approach, under which the remaining compensation cost from the original awards plus the incremental costs, if any, of the related modified awards is recognized in its entirety over the remaining portion of the requisition service period of the corresponding modified awards.
Stock-based compensation expense recognized at fair value includes the impact of estimated forfeitures. The Company estimates future forfeitures at the date of grant and revises the estimates, if necessary, in subsequent periods if actual forfeitures differ from those estimates.
Income taxes
Income taxes are accounted for under the asset and liability method. Deferred tax assets and liabilities are recognized for the future tax consequences attributable to differences between the carrying amounts of existing assets and liabilities in the financial statements and their respective tax bases, and operating loss and tax credit carryforwards. Deferred tax assets and liabilities are measured using enacted tax rates expected to apply to taxable income in the years in which those temporary differences are expected to be recovered or settled. The effect on deferred tax assets and liabilities from a change in tax rates is recognized in the consolidated statement of operations in the period that includes the enactment date.
The Company operates in various tax jurisdictions and is subject to audit by various tax authorities. In preparing the Company’s consolidated financial statements, the Company is required to estimate its taxes in each of the jurisdictions in which it operates. The Company estimates actual current tax exposure as well as assesses temporary differences resulting from different treatment of items, such as accruals and allowances not currently deductible for tax purposes. These differences result in deferred tax assets which represent future tax benefits to be received when certain expenses previously recognized in the financial statements become deductible expenses under applicable income tax laws, or loss credit carryforwards are utilized.
In assessing the ability to realize deferred tax assets, management considers whether it is more likely than not that some portion or all of a deferred tax asset will be realized. The ultimate realization of deferred tax assets is dependent upon the generation of future taxable income during the periods in which those temporary differences become deductible. A valuation allowance is recorded for loss carryforwards and other deferred tax assets where it is more likely than not that such deferred tax assets will not be realized. The Company classifies its net deferred tax assets as other long-term assets and deferred tax liabilities as noncurrent liabilities on its consolidated balance sheet.
Foreign currency
Table of Contents
NEOPHOTONICS CORPORATION
NOTES TO CONSOLIDATED FINANCIAL STATEMENTS (continued)
Generally the functional currency of the Company’s international subsidiaries is the local currency. The Company translates the financial statements of these subsidiaries to U.S. dollars using month-end rates of exchange for assets and liabilities, and average rates of exchange for revenue, costs, and expenses. Translation gains and losses are recorded in accumulated other comprehensive income (loss) as a component of stockholders’ equity. The Company has established a hedging program using monthly forward exchange contracts as economic hedges to protect against volatility of foreign exchange rate exposure of its net intercompany activities based on a cost-benefit analysis that considers that magnitude of the exposure, the volatility of the exchange rate and the cost of the hedging instruments. The forward contracts are not designated for hedge accounting and are marked to market at fair value and reported as either other current assets or accounts payable. Any changes in the fair value are recorded as foreign exchange gain (loss) and help mitigate the changes in the value of the underlying net intercompany balances. Net foreign exchange gain (loss) was ($0.7) million, $(5.9) million, and $0.2 million in 2021, 2020, and 2019, respectively. These gains and losses were recorded as other income, net in the Company’s consolidated statements of operations. The Company presents the cash flows relating to these foreign exchange contracts as investing activities in its consolidated statements of cash flows. In the second half of 2018, the Company temporarily discontinued entering into forward exchange contracts. This may increase the risks to us arising from the short-term impact of foreign currency fluctuations.
Net loss per share
Basic net loss per share is calculated by dividing net loss by the weighted average number of common shares outstanding for the period. Diluted net loss per share is calculated by dividing net loss by the weighted average number of common shares and potential dilutive common share equivalents outstanding during the period if the effect is dilutive.
Reclassifications
Certain prior year amounts have been reclassified to conform to the current year presentation.
Accounting standards update recently adopted
In January 2017, the Financial Accounting Standards Board ("FASB") issued ASU 2017-04, Intangibles-Goodwill and Other (Topic 350): Simplifying the Test for Goodwill Impairment (“ASU 2017-04”). This standard amends the goodwill impairment test to compare the fair value of a reporting unit with its carrying amount and recognize an impairment charge for the amount by which the carrying amount exceeds the reporting unit’s fair value, up to the total amount of goodwill allocated to that reporting unit. In November 2019, the FASB issued ASU 2019-10, according to which, the new standard is effective for smaller reporting companies (“SRC”) as defined by the SEC, for fiscal years beginning after December 15, 2022 including interim periods within those fiscal years. The Company early adopted ASU 2017-04 guidance on January 1, 2020. The adoption of this standard had no material impact on the Company’s consolidated financial statements and related disclosures.
In December 2019, the Financial Accounting Standards Board ("FASB") issued Accounting Standards Update No. 2019-12, Income Taxes (Topic 740): Simplifying the Accounting for Income Taxes (ASU 2019-12), which simplifies the accounting for income taxes. This guidance is effective for fiscal years beginning after December 15, 2020, with early adoption permitted.
Recent accounting standards update not yet effective
In June 2016, the FASB issued ASU 2016-13, Financial Instruments – Credit Losses (Topic 326): Measurement of Credit Losses on Financial Instruments (“ASU 2016-13”). ASU 2016-13 amends existing guidance on the impairment of financial assets and adds an impairment model that is based on expected losses rather than incurred losses and requires an entity to recognize as an allowance its estimate of expected credit losses for its financial assets. An entity will apply this guidance through a cumulative-effect adjustment to retained earnings upon adoption (a modified-retrospective approach) while a prospective transition approach is required for debt securities for which an other-than-temporary impairment had been recognized before the effective date. In November 2019, the FASB issued ASU 2019-10, according to which, the new standard is effective for smaller reporting companies (“SRC”) as defined by the SEC, for fiscal years beginning after December 15, 2022 including interim periods within those fiscal years. The Company is in the process of evaluating the impact and timing of the adoption on its consolidated financial statements and related disclosures.
3. Revenue
Product revenue
The Company develops, manufactures and sells optoelectronic products that transmit and receive high speed digital optical signals for Cloud and hyperscale data center internet content provider and telecom networks. Revenue is derived primarily from the sale of hardware products. The Company sells its products worldwide, primarily to leading network equipment manufacturers and users.
Revenue recognition
Revenue is recognized upon transfer of control of promised products or services to customers in an amount that reflects the consideration the Company expects to receive in exchange for those products or services. The Company generally bears all
Table of Contents
NEOPHOTONICS CORPORATION
NOTES TO CONSOLIDATED FINANCIAL STATEMENTS (continued)
costs, risk of loss or damage and retains title to the goods up to the point of transfer of control of promised products to customer. Revenue related to the sale of consignment inventories at customer vendor managed locations is not recognized until the products are pulled from consignment inventories by customers. In instances where acceptance of the product or solutions is specified by the customer, revenue is deferred until such required acceptance criteria have been met. The Company's standard payment terms range from 30 to 90 days. Shipping and handling costs are included in the cost of goods sold. The Company presents revenue net of sales taxes and any similar assessments.
The Company’s performance obligations relate to contracts with a duration of less than one year. The Company elected to apply the practical expedient provided in Accounting Standard Codification Topic 606, “Revenue from Contracts with Customers” and, therefore, is not required to disclose the aggregate amount of the transaction price allocated to performance obligations that are unsatisfied or partially unsatisfied at the end of the reporting period.
Contract Costs
The Company recognizes the incremental direct costs of obtaining a contract, which consist of sales commissions, when control over the products they relate to transfers to the customer. Applying the practical expedient, the Company recognizes commissions as expense when incurred, as the amortization period of the commission asset the Company would have otherwise recognized is less than one year.
Nature of products
Revenue from sale of hardware products is recognized upon transfer of control to the customer. The performance obligation for the sale of hardware products is satisfied at a point in time. The Company has aligned its products in two groups - High Speed Products and Network Products and Solutions. The following presents revenue by product group (in thousands):
| | | | | | | | | | | | | | | | | |
| | Years Ended December 31, |
| | 2021 | | 2020 | | 2019 |
| High Speed Products | $ | 271,314 | | | $ | 340,015 | | | $ | 323,804 | |
| Network Products and Solutions | 18,975 | | | 31,148 | | | 33,000 | |
| Total revenue | $ | 290,289 | | | $ | 371,163 | | | $ | 356,804 | |
The following table presents the Company's revenue information by geographical region. Revenue is classified based on the ship to location requested by the customer. Such classification recognizes that for many customers, designated shipping points are often in China or elsewhere in Asia (in thousands):
| | | | | | | | | | | | | | | | | |
| | Years Ended December 31, |
| | 2021 | | 2020 | | 2019 |
| China | $ | 89,231 | | | $ | 191,990 | | | $ | 186,157 | |
| Thailand | 94,360 | | | 70,709 | | | 55,385 | |
| Malaysia | 26,996 | | | 1,330 | | | 66 | |
| Mexico | 16,174 | | | 35,549 | | | 74,077 | |
| Rest of world | 63,528 | | | 71,585 | | | 41,119 | |
| Total revenue | $ | 290,289 | | | $ | 371,163 | | | $ | 356,804 | |
Deferred revenue
The Company records deferred revenue when cash payments are received or due in advance of the Company's performance. At December 31, 2021 and December 31, 2020, deferred revenue balances were immaterial.
Contract assets
Contract assets are rights to consideration in exchange for goods or services that the Company has transferred to a customer when such right is conditional on something other than the passage of time. The balance of contract assets exclude any amounts presented as an accounts receivable. There were no contract assets balances as of December 31, 2021 and December 31, 2020.
Table of Contents
NEOPHOTONICS CORPORATION
NOTES TO CONSOLIDATED FINANCIAL STATEMENTS (continued)
4. Cash, cash equivalents, short-term investments and restricted cash
The following table summarizes the Company’s cash, cash equivalents, short-term investments, and restricted cash at December 31, 2021 and 2020 (in thousands):
| | | | | | | | | | | |
| | December 31, 2021 | | December 31, 2020 |
| Cash and cash equivalents: | | | |
| Cash | $ | 77,833 | | | 95,117 | |
| Cash equivalents | — | | | — | |
| Cash and cash equivalents | $ | 77,833 | | | $ | 95,117 | |
| Short-term investments | $ | 27,675 | | | $ | 27,669 | |
| Restricted cash | $ | 87 | | | $ | 489 | |
| | | | | | | | | | | |
| | December 31, 2021 | | December 31, 2020 |
| Cash and cash equivalents | $ | 77,833 | | | $ | 95,117 | |
| Restricted cash | 87 | | | 489 | |
| Total cash, cash equivalents and restricted cash shown in the consolidated statement of cash flows | $ | 77,920 | | | $ | 95,606 | |
The following table summarizes the Company’s unrealized gains and losses related to the short-term investments in marketable securities designated as available-for-sale (in thousands):
| | | | | | | | | | | | | | | | | | | | | | | | | | | | | | | | | | | | | | | | | | | | | | | |
| | As of December 31, 2021 | | As of December 31, 2020 |
| | Amortized Cost | | Gross Unrealized Gains | | Gross Unrealized Loss | | Fair Value | | Amortized Cost | | Gross Unrealized Gains | | Gross Unrealized Loss | | Fair Value |
| Marketable securities: | | | | | | | | | | | | | | | |
| | | | | | | | | | | | | | | |
| Money market funds | $ | 27,675 | | | $ | — | | | $ | — | | | $ | 27,675 | | | $ | 27,669 | | | $ | — | | | $ | — | | | $ | 27,669 | |
| | | | | | | | | | | | | | | |
| | | | | | | | | | | | | | | |
| | | | | | | | | | | | | | | |
| | | | | | | | | | | | | | | |
| Reported as: | | | | | | | | | | | | | | | |
| | | | | | | | | | | | | | | |
| Short-term investments | $ | 27,675 | | | $ | — | | | $ | — | | | $ | 27,675 | | | $ | 27,669 | | | $ | — | | | $ | — | | | $ | 27,669 | |
| | | | | | | | | | | | | | | |
As of December 31, 2021 and 2020, maturities of marketable securities were as follows (in thousands):
| | | | | | | | | | | |
| | December 31, 2021 | | December 31, 2020 |
| Less than 1 year | $ | 27,675 | | | $ | 27,669 | |
| Due in 1 to 2 years | — | | | — | |
| Due in 3 to 5 years | — | | | — | |
| Total | $ | 27,675 | | | $ | 27,669 | |
Realized gains and losses on the sale of marketable securities during the years ended December 31, 2021, 2020 and 2019 were immaterial. The Company did not recognize any impairment losses on its marketable securities during the years ended December 31, 2021, 2020 or 2019. As of December 31, 2021, the Company did not have any investments in marketable securities that were in an unrealized loss position for a period in excess of 12 months.
Table of Contents
NEOPHOTONICS CORPORATION
NOTES TO CONSOLIDATED FINANCIAL STATEMENTS (continued)
5. Fair value measurements
Assets and Liabilities Measured at Fair Value on a Recurring Basis
The following table presents the Company’s assets that are measured at fair value on a recurring basis (in thousands):
| | | | | | | | | | | | | | | | | | | | | | | | | | | | | | | | | | | | | | | | | | | | | | | |
| | December 31, 2021 | | December 31, 2020 |
| | Level 1 | | Level 2 | | Level 3 | | Total | | Level 1 | | Level 2 | | Level 3 | | Total |
| Cash equivalents and short-term investments: | | | | | | | | | | | | | | | |
| Money market funds | $ | 27,675 | | | $ | — | | | $ | — | | | $ | 27,675 | | | $ | 27,669 | | | $ | — | | | $ | — | | | $ | 27,669 | |
| | | | | | | | | | | | | | | |
| | | | | | | | | | | | | | | |
| Total | $ | 27,675 | | | $ | — | | | $ | — | | | $ | 27,675 | | | $ | 27,669 | | | $ | — | | | $ | — | | | $ | 27,669 | |
| Mutual funds held in Rabbi Trust, recorded in other long-term assets | $ | 894 | | | $ | — | | | $ | — | | | $ | 894 | | | $ | 810 | | | $ | — | | | $ | — | | | $ | 810 | |
The Company offers a Non-Qualified Deferred Compensation Plan (“NQDC Plan”) to a select group of its highly compensated employees to provide participants the opportunity to defer payment of certain compensation as defined in the NQDC Plan. A Rabbi Trust has been established to fund the NQDC Plan obligation, which was fully funded as of December 31, 2021 and 2020. The assets held by the Rabbi Trust are in the form of exchange traded mutual funds and are included in the Company’s other long-term assets on its consolidated balance sheets as of December 31, 2021 and 2020. Level 1 assets are determined by using quoted prices in active markets for identical assets. The fair values of Level 2 assets are priced based on quoted market prices for similar instruments or non-binding market prices that are corroborated by observable market data using inputs such as benchmark yields, broker quotes and other similar data.
Assets and Liabilities Measured at Fair Value on a Nonrecurring Basis
There were no assets and liabilities measured on a nonrecurring basis as of December 31, 2021 and 2020.
Assets and Liabilities Not Measured at Fair Value
The carrying values of cash, restricted cash, accounts receivable, accounts payable, notes payable and short-term borrowing approximate their fair values due to the short-term nature and liquidity of these financial instruments.
The fair value of the Company’s long-term debt has been calculated using an estimate of the interest rate the Company would have had to pay on the issuance of liabilities with a similar maturity and discounting the cash flows at that rate which it considers to be a level 2 fair value measurement and was not materially different than the carrying value as of December 31, 2021 and 2020 as the interest rates approximated rates currently available to the Company. The fair values do not necessarily give an indication of the amount that the Company would currently have to pay to extinguish any of this debt.
6. Net loss per share
The following table sets forth the computation of the basic and diluted net loss per share attributable to NeoPhotonics Corporation common stockholders for the periods indicated (in thousands, except per share amounts):
| | | | | | | | | | | | | | | | | |
| | Years Ended December 31, |
| | 2021 | | 2020 | | 2019 |
| Numerator: | | | | | |
| Net loss | (40,719) | | | $ | (4,366) | | | $ | (17,076) | |
| Denominator: | | | | | |
| Weighted average shares used to compute per share amount: | | | | | |
| Basic | 51,926 | | | 49,474 | | | 47,304 | |
| Dilutive effect of equity awards | — | | | — | | | — | |
| Diluted | 51,926 | | | 49,474 | | | 47,304 | |
| Basic net loss per share | $ | (0.78) | | | $ | (0.09) | | | $ | (0.36) | |
| Diluted net loss per share | $ | (0.78) | | | $ | (0.09) | | | $ | (0.36) | |
The Company has excluded the impact of the following outstanding employee stock options, restricted stock units, common stock warrants and shares expected to be issued under its employee stock purchase plan from the computation of diluted net loss per share, as their effect would have been antidilutive (in thousands):
| | | | | | | | | | | | | | | | | |
| | December 31, |
| | 2021 | | 2020 | | 2019 |
| Employee stock options | 1,279 | | | 2,097 | | | 2,599 | |
| Restricted stock units | 3,387 | | | 3,621 | | | 3,171 | |
| Market-based restricted stock units | 134 | | | 612 | | | 641 | |
| Performance-based restricted stock units | 240 | | | 90 | | | — | |
| Employee stock purchase plan | — | | | 358 | | | 298 | |
| | 5,040 | | | 6,778 | | | 6,709 | |
7. Purchased intangible assets
Purchased intangible assets consist of the following (in thousands):
| | | | | | | | | | | | | | | | | | | | | | | | | | | | | | | | | | | |
| | December 31, 2021 | | December 31, 2020 |
| | Gross
Assets | | Accumulated
Amortization | | Net
Assets | | Gross
Assets | | Accumulated
Amortization | | Net
Assets |
| Technology and patents | $ | 37,814 | | | $ | (37,814) | | | $ | — | | | $ | 37,637 | | | $ | (37,021) | | | $ | 616 | |
| Customer relationships | 15,535 | | | (15,535) | | | — | | | 15,487 | | | (15,487) | | | — | |
| Leasehold interest | 1,339 | | | (495) | | | 844 | | | 1,304 | | | (452) | | | 852 | |
| | $ | 54,688 | | | $ | (53,844) | | | $ | 844 | | | $ | 54,428 | | | $ | (52,960) | | | $ | 1,468 | |
Amortization expense relating to technology and patents and the leasehold interest intangible assets is included within cost of goods sold, and customer relationships and the non-compete agreements within operating expenses.
The following table presents details of the amortization expense of the Company’s purchased intangible assets as reported in the consolidated statements of operations (in thousands):
| | | | | | | | | | | | | | | | | |
| | Years ended December 31, |
| | 2021 | | 2020 | | 2019 |
| Cost of goods sold | $ | 646 | | | $ | 737 | | | $ | 737 | |
| Operating expenses | — | | | — | | | 119 | |
| Total | $ | 646 | | | $ | 737 | | | $ | 856 | |
The gross assets and accumulated amortization for customer relationships includes the impact of foreign currency transaction gains and losses during 2021. The estimated future amortization expense of purchased intangible assets as of December 31, 2021, is as follows (in thousands):
| | | | | |
| 2022 | $ | 30 | |
| 2023 | 30 | |
| 2024 | 30 | |
| 2025 | 30 | |
| 2026 | 30 | |
| Thereafter | 694 | |
| | $ | 844 | |
8. Balance sheet components
Restricted Cash
Table of Contents
NEOPHOTONICS CORPORATION
NOTES TO CONSOLIDATED FINANCIAL STATEMENTS (continued)
Restricted cash was as follows (in thousands):
| | | | | | | | | | | |
| | December 31, |
| | 2021 | | 2020 |
| | | |
| | | |
| | | |
| Restricted in connection with government grants received in advance | $ | — | | | $ | 452 | |
| Restricted - Other | 87 | | | 37 | |
| Total restricted cash | $ | 87 | | | $ | 489 | |
Accounts receivable, net
Accounts receivable, net were as follows (in thousands):
| | | | | | | | | | | |
| | December 31, |
| | 2021 | | 2020 |
| Accounts receivable | $ | 55,324 | | | $ | 45,277 | |
| | | |
| Allowance for doubtful accounts | — | | | (45) | |
| | $ | 55,324 | | | $ | 45,232 | |
The table below summarizes the movement in the Company’s allowance for doubtful accounts (in thousands):
| | | | | |
| Balance at December 31, 2018 | $ | (264) | |
| Reversal of provision for bad debt, net | 15 | |
| Write-offs, net of recoveries | (5) | |
| Balance at December 31, 2019 | (254) | |
| Reversal of provision for bad debt, net | 16 | |
| Write-offs, net of recoveries | 193 | |
| Balance at December 31, 2020 | (45) | |
| Reversal of provision for bad debt, net | 1 | |
| Write-offs, net of recoveries | 44 | |
| Balance at December 31, 2021 | $ | — | |
Inventories
Inventories were as follows (in thousands):
| | | | | | | | | | | |
| | December 31, |
| | 2021 | | 2020 |
| Raw materials | $ | 32,809 | | | $ | 25,620 | |
| Work in process | 14,851 | | | 9,196 | |
Finished goods(1) | 5,236 | | | 12,085 | |
| | $ | 52,896 | | | $ | 46,901 | |
(1) Included in finished goods was $1.8 million and $1.7 million of inventory at customer vendor managed inventory locations at December 31, 2021 and 2020, respectively.
Table of Contents
NEOPHOTONICS CORPORATION
NOTES TO CONSOLIDATED FINANCIAL STATEMENTS (continued)
Prepaid expenses and other current assets
Prepaid expenses and other current assets were as follows (in thousands):
| | | | | | | | | | | |
| | December 31, |
| | 2021 | | 2020 |
| Prepaid taxes and taxes receivable | $ | 5,825 | | | $ | 6,137 | |
| Transition services agreement receivable - APAT OE (See Note 14) | — | | | 5,933 | |
| Receivables due from suppliers | 6,728 | | | 4,891 | |
| Deposits and other prepaid expenses | 2,682 | | | 2,417 | |
| Other receivable | 1,011 | | | 795 | |
| | $ | 16,246 | | | $ | 20,173 | |
Property, plant and equipment, net
Property, plant and equipment, net was as follows (in thousands):
| | | | | | | | | | | |
| | December 31, |
| | 2021 | | 2020 |
| Land | $ | 3,018 | | | $ | 3,367 | |
| Buildings | 24,972 | | | 25,310 | |
| Machinery and equipment | 180,272 | | | 181,375 | |
| Furniture, fixtures, software and office equipment | 20,840 | | | 20,992 | |
| Leasehold improvements | 22,491 | | | 22,456 | |
| | 251,593 | | | 253,500 | |
| Less: Accumulated depreciation | (197,403) | | | (186,735) | |
| | $ | 54,190 | | | $ | 66,765 | |
Depreciation expense was $22.9 million, $30.6 million and $27.7 million for the years ended December 31, 2021, 2020 and 2019, respectively.
Accrued and other current liabilities
Accrued and other current liabilities were as follows (in thousands):
| | | | | | | | | | | |
| | December 31, |
| | 2021 | | 2020 |
| Employee-related | $ | 14,956 | | | $ | 19,656 | |
| Transition services agreement payables (See Note 14) | 823 | | | 9,708 | |
| | | |
| | | |
| Operating lease liabilities, current | 2,356 | | | 2,128 | |
| Income and other taxes payable | 2,703 | | | 1,590 | |
| | | |
| Accrued warranty | 977 | | | 1,111 | |
| | | |
| Other accrued expenses | 8,193 | | | 7,860 | |
| $ | 30,008 | | | $ | 42,053 | |
Accrued warranty
The table below summarizes the movement in the warranty accrual, which is included in accrued and other current liabilities (in thousands):
Table of Contents
NEOPHOTONICS CORPORATION
NOTES TO CONSOLIDATED FINANCIAL STATEMENTS (continued)
| | | | | | | | | | | | | | | | | |
| | Years ended December 31, |
| | 2021 | | 2020 | | 2019 |
| Beginning balance | $ | 1,111 | | | $ | 712 | | | $ | 672 | |
| Warranty accruals | 469 | | | 1,678 | | | 782 | |
| Settlements | (603) | | | (1,279) | | | (742) | |
| Ending balance | $ | 977 | | | $ | 1,111 | | | $ | 712 | |
Other noncurrent liabilities
Other noncurrent liabilities were as follows (in thousands):
| | | | | | | | | | | |
| | December 31, |
| | 2021 | | 2020 |
| Pension and other employee-related | $ | 3,266 | | | $ | 3,844 | |
| Transition services agreement payables (See Note 14) | — | | | 823 | |
| | | |
| Government grant | 369 | | | 606 | |
| | | |
| Deferred income tax liabilities | — | | | 501 | |
| *Asset retirement obligations | 3,508 | | | 3,810 | |
| Other | 294 | | | — | |
| | $ | 7,437 | | | $ | 9,584 | |
*Asset retirement obligations are legal obligations associated with the retirement of long-lived assets pertaining to leasehold improvements. In 2021 accretion related to the asset retirement obligations was $0.3 million.
9. Asset sale
NeoRussia
In December 2018, the Company entered into an agreement with Joint Stock Company Rusnano, a related party, for Joint Stock Company Rusnano group to purchase the 100% interest in the operations of NeoPhotonics Corporation, LLC, the Company's manufacturing operations in Russia. In 2018, the Company recorded additional restructuring expense of $1.6 million related to these operations, bringing the total amount accrued for the Rusnano payment derivative to $2.0 million. As of December 31, 2018, the Company had recorded assets with a carrying value of $3.0 million as held for sale. The balance for liabilities held for sale as of December 31, 2018 was immaterial.
In April 2019, the Company completed the sale of 100% interest in the operations of NeoPhotonics Corporation, LLC, to Joint Stock Company Rusnano, a related party. In connection with the sale, the Company received $2.0 million in cash, settled the $2.0 million exit fee and recognized a gain on asset sale of $0.9 million within operating expenses during the 2019.
10. Restructuring and Other Related Charges
A summary of the activity in accrued restructuring costs is as follows (in thousands):
| | | | | | | | | | | | | | | | | | | | | | | | | | |
| Employee Severance | | Facilities Consolidation | | | | | Others | | Total |
| Restructuring obligations at December 31, 2018 | $ | 436 | | | $ | 769 | | | | | | $ | 1,611 | | | $ | 2,816 | |
| Charges | 88 | | | — | | | | | | 173 | | | 261 | |
| Cash payments | (524) | | | (149) | | | | | | (173) | | | (846) | |
| Non-cash settlements and other | — | | | (620) | | | | | | (1,611) | | | (2,231) | |
| Restructuring obligations at December 31, 2019 | $ | — | | | $ | — | | | | | | $ | — | | | $ | — | |
| Charges | 981 | | | — | | | | | | 42 | | | 1,023 | |
| Cash payments | (884) | | | — | | | | | | — | | | (884) | |
| Restructuring obligations at December 31, 2020 | $ | 97 | | | $ | — | | | | | | $ | 42 | | | $ | 139 | |
| Charges | 269 | | | — | | | | | | (6) | | | 263 | |
| Cash payments | (64) | | | — | | | | | | (42) | | | (106) | |
| | | | | | | | | | |
| Non-cash settlements and other | — | | | — | | | | | | 6 | | | 6 | |
| Restructuring obligations at December 31, 2021 | $ | 302 | | | $ | — | | | | | | $ | — | | | $ | 302 | |
2021 Restructuring
In a second phase of the restructuring actions taken in 2020, related to reducing operating expenses and manufacturing costs while maintaining the Company's focus on its core capabilities, in December 2021 the Company exercised its early exit right to terminate the facility lease in Fremont, California.
Substantially all of the restructuring charges for the year ended December 31, 2021 were included in cost of goods sold in the Company’s Consolidated Statements of Operations.
As a result of early exit of the Fremont facility, the related amounts of ROU asset and operating lease liability were approximately $0.2 million each and were written off. The remaining lease commitment will end in April 2022. Other impacts of the lease termination included a reclassification of certain equipment in property, plant and equipment, net of $0.4 million to Assets held for sale that was recorded in Prepaid expenses and other current assets, and an immaterial lease termination fee.
2020 Restructuring
Restructuring charges
On August 17, 2020, BIS increased restrictions on Huawei and its affiliates on the Entity List related to items produced domestically and abroad that use U.S. technology or software and imposed additional requirements for items subject to Commerce export control. The Company announced on October 5, 2020, that it would manage the business without relying on and will not plan on future revenue contributions from Huawei. As a result, the Company initiated certain restructuring actions to reduce operating expenses and manufacturing costs while maintaining the Company's focus on its core capabilities, including its lasers, coherent components and solutions for data center interconnect and high speed communications networks.
Other related charges
In light of the restrictions imposed on Huawei by the BIS in the third quarter of 2020, the Company incurred $4.1 million in accelerated depreciation charges related to Huawei specific assets, consolidation of Indium Phosphide production and certain end-of-life equipment. In addition, the Company incurred $1.9 million in inventory purchase commitment liabilities and $2.5 million in Huawei specific excess and obsolete inventories, resulting in a total inventory write-down of $4.4 million.
Restructuring expenses for severance and other related costs for the year ended December 31, 2020 totaled $1.0 million and were primarily charged to cost of goods sold in the Company’s Consolidated Statements of Operations. The other cash and noncash related charges for the year ended December 31, 2020 date totaling $9.1 million were charged to cost of goods sold.
2019 Restructuring
The company initiated restructuring actions in 2018 in order to focus on key growth initiatives and a lower break even revenue level through lower operating expenses and manufacturing costs. In 2019, the Company recorded $0.3 million in restructuring charges within operating expenses related to these actions.
Table of Contents
NEOPHOTONICS CORPORATION
NOTES TO CONSOLIDATED FINANCIAL STATEMENTS (continued)
11. Debt
The table below summarizes the carrying amount and weighted average interest rate of the Company’s debt (in thousands, except percentages):
| | | | | | | | | | | | | | | | | | | | | | | |
| | December 31, 2021 | | December 31, 2020 |
| | Carrying
Amount | | Interest
Rate | | Carrying
Amount | | Interest
Rate |
| Short-term borrowing: | | | | | | | |
| Note payable to Shanghai Pudong Development Bank | $ | 15,000 | | | 0.60 | % | | $ | — | | | — | % |
| Unaccreted discount and issuance costs | (86) | | | | | — | | | |
| Short-term borrowing, net | $ | 14,914 | | | | | $ | — | | | |
| | | | | | | |
| Long-term debt, current and non-current: | | | | | | | |
| Borrowing under Wells Fargo Credit Facility | $ | 20,338 | | | 1.94 | % | | $ | 21,030 | | | 2.01 | % |
| Mitsubishi Bank loans | 5,000 | | | 1.06%-1.46% | | 7,662 | | | 1.04%-1.44% |
| Mitsubishi Bank and Yamanashi Chou Bank loan | 3,429 | | | 1.06 | % | | 5,002 | | | 1.07 | % |
| Finance lease liability | 94 | | | | | 189 | | | |
| Unaccreted discount and issuance costs | (180) | | | | | (324) | | | |
| Total long-term debt, net of unaccreted discount and issuance costs | $ | 28,681 | | | | | $ | 33,559 | | | |
| Reported as: | | | | | | | |
| Current portion of long-term debt | $ | 2,928 | | | | | $ | 3,232 | | | |
| Long-term debt, net of current portion | 25,753 | | | | | 30,327 | | | |
| Total long-term debt, net of unaccreted discount and issuance costs | $ | 28,681 | | | | | $ | 33,559 | | | |
The effective interest rates of the debt in the table above approximated their stated interest rates.
Notes payable and short-term borrowing
The Company regularly issues notes payable to its suppliers in China. These notes are supported by non-interest bearing bank acceptance drafts issued under the Company’s existing line of credit facilities and are due three to six months after issuance. As a condition of the notes payable arrangements, the Company is required to keep a compensating balance at the issuing banks that is a percentage of the total notes payable balance until the amounts are settled.
As of December 31, 2021, the Company's subsidiaries in China had 2 line of credit facilities with Shanghai Pudong Development Bank Shenzhen Branch (“SPDB”):
•In June 2021, NeoPhotonics (China) Co., Ltd., ("NeoPhotonics China") entered into a credit line agreement with SPDB providing for a line of credit to NeoPhotonics China in an amount of RMB 120.0 million ($18.9 million) for short-term loans at varying interest rates. The line of credit facility expired on February 23, 2022, and NeoPhotonics China and SPDB are working on a renewal agreement.
•In June 2021, NeoPhotonics Dongguan Co., Ltd (“NeoPhotonics Dongguan”) entered into a credit line agreement with SPDB providing for a line of credit to NeoPhotonics Dongguan in an amount of RMB 30.0 million ($4.7 million) for short-term loans at varying interest rates. The line of credit facility expired on February 23, 2022, and NeoPhotonics Dongguan and SPDB are working on a renewal agreement.
As of December 31, 2021, there was $15.0 million note outstanding under the NeoPhotonics China line of credit. The note payable bears interest at 3.0% (2.4% of which was charged to NeoPhotonics China as a loan fee and was paid in the fourth quarter of 2021). This note matures in March 2022.
There was 0 amount outstanding under the NeoPhotonics Dongguan line of credit as of December 31, 2021.
Under these line of credit facilities, the non-interest bearing bank acceptance drafts issued in connection with the Company’s notes payable to its suppliers in China, had no outstanding balance at December 31, 2021 and 2020, respectively.
As of December 31, 2019, compensating balances relating to bank acceptance drafts and letters of credit issued to suppliers and the Company's subsidiaries totaled $2.5 million. There were no such balances as of December 31, 2021 and 2020. Compensating balances are classified as restricted cash on the Company’s consolidated balance sheets.
Table of Contents
NEOPHOTONICS CORPORATION
NOTES TO CONSOLIDATED FINANCIAL STATEMENTS (continued)
Credit Facilities
In September 2017, the Company entered into a revolving line of credit agreement with Wells Fargo as the administrative agent for a lender group (the "Wells Fargo Credit Facility" or "Credit Facility"). On June 29, 2021, the Company renewed the Credit Facility (the “Renewed Credit Facility").
The Renewed Credit Facility provides for borrowings equal to the lower of (a) a maximum revolver amount of $50.0 million, or (b) an amount equal to 80% - 90% of eligible accounts receivable plus 100% of qualified cash balances up to $15.0 million, less certain discretionary adjustments ("Borrowing Base"). The maximum revolver amount may be increased by up to $25.0 million, subject to certain conditions. At closing, $50.0 million was available, of which $20.1 million was drawn.
The Credit Facility matures on June 30, 2026 and borrowings bear interest at an interest rate option of either (a) the LIBOR rate, plus an applicable margin ranging from 1.50% to 1.75% per annum, or (b) the prime lending rate, plus an applicable margin of 0.50% to 0.75% per annum.
The Credit Facility agreement ("Agreement") requires prepayment of the borrowings to the extent the outstanding balance is greater than the lesser of (a) the most recently calculated Borrowing Base, or (b) the maximum revolver amount. The Company is required to maintain a combination of certain defined cash balances and unused borrowing capacity under the Credit Facility of at least $20.0 million, of which at least $5.0 million shall include unused borrowing capacity. The Agreement also restricts the Company's ability to dispose of assets, permit change in control, merge or consolidate, make acquisitions, incur indebtedness, grant liens, make investments and make certain restricted payments. Borrowings under the Credit Facility are collateralized by substantially all of the Company's assets. The Company was in compliance with the covenants of this Credit Facility as of December 31, 2021.
On June 14, 2019, the Company entered into a First Amendment to the Credit Facility (the "Amended Credit Facility"). The Amendment removes Huawei from the list of “Eligible Accounts” as a basis for the Company’s borrowing while Huawei is on the U.S. Bureau of Industry and Security (“BIS”) “Entity List”. During the period of time while Huawei remains on the Entity List, the concentration limits of certain other customers are increased to partially offset the removal of Huawei. Additionally, until Huawei is no longer on the Entity List, the Company is required to maintain a temporary combination of certain defined unrestricted cash and unused borrowing capacity under the Credit Facility of at least $30.0 million in the U.S. and $40.0 million world-wide, of which at least $5.0 million shall include unused borrowing capacity.
On June 29, 2021, the Company entered into the Renewed Credit Facility. The Company removed Huawei from the list of “Eligible Accounts” as a basis for the Company’s borrowing thus removing the need for them to maintain a temporary combination of certain defined unrestricted cash and unused borrowing capacity under the Credit Facility of at least $30.0 million in the U.S. and $40.0 million world-wide, of which at least $5.0 million shall include unused borrowing capacity.
As of December 31, 2021, the outstanding balance under the Credit Facility was $20.3 million and the weighted average rate under the LIBOR option was 1.94%. The remaining borrowing capacity as of December 31, 2021 was $12.7 million, of which $5.0 million is required to be maintained as unused borrowing capacity. The Company repaid $1.3 million and $7.0 million under the revolving line of credit in 2021 and 2020, respectively.
In 2021, $0.4 million accrued interest was rolled into the principal amount of Wells Fargo Credit Facility.
Mitsubishi Bank Loans
On February 25, 2015, the Company entered into certain loan agreements and related agreements with MUFG Bank, Ltd. (the "Mitsubishi Bank") that provided for (i) a term loan in the aggregate principal amount of 500 million Japanese Yen (the “JPY”) ($4.3 million) (the “Term Loan A”) and (ii) a term loan in the aggregate principal amount of 1000000000 JPY ($8.7 million) (the “Term Loan B” and together with the Term Loan A, the “2015 Mitsubishi Bank Loans”). The Mitsubishi Bank Loans are secured by a mortgage on certain real property and buildings owned by our Japanese subsidiary. Interest on the 2015 Mitsubishi Bank Loans accrues and is paid monthly based upon the annual rate of the monthly Tokyo Interbank Offer Rate (TIBOR) plus 1.40%. The Term Loan A requires interest only payments until the maturity date of February 23, 2018, with a lump sum payment of the aggregate principal amount on the maturity date. The Term Loan B requires equal monthly payments of principal equal to 8.3 million JPY until the maturity date of February 25, 2025, with a lump sum payment of the balance of 8.4 million JPY on the maturity date. Interest on the Term Loan B is accrued based upon monthly TIBOR plus 1.40% and is secured by real estate collateral. In conjunction with the execution of the Bank Loans, the Company paid a loan structuring fee, including consumption tax, of 40.5 million JPY ($0.4 million). The Term Loan A of 500 million JPY (approximately $4.4 million) was repaid to the Mitsubishi Bank in January 2018.
The 2015 Mitsubishi Bank Loans contain customary representations and warranties and customary affirmative and negative covenants applicable to the Company’s Japanese subsidiary, including, among other things, restrictions on cessation in business, management, mergers or acquisitions. The 2015 Mitsubishi Bank Loans contain financial covenants relating to minimum net assets, maximum ordinary loss and a coverage ratio covenant. The Company was in compliance with the related covenants as of December 31, 2021 and 2020. Outstanding principal balance for Term Loan B and unamortized debt issuance
Table of Contents
NEOPHOTONICS CORPORATION
NOTES TO CONSOLIDATED FINANCIAL STATEMENTS (continued)
costs were approximately 316.7 million JPY (approximately $2.8 million) and 4.0 million JPY (approximately $0.0 million), respectively, as of December 31, 2021.
In March 2017, the Company entered into a loan agreement and related agreements with the Mitsubishi Bank for a term loan of 690 million JPY (approximately $6.0 million) (the “2017 Mitsubishi Bank Loan”) to acquire manufacturing equipment for its Japanese subsidiary. This loan is secured by the manufacturing equipment owned by the Company's subsidiary in Japan. Interest on the 2017 Mitsubishi Bank Loan is based on the annual rate of the monthly TIBOR rate plus 1.00%. The 2017 Mitsubishi Bank Loan matures on March 29, 2024 and requires monthly interest and principal payments over 72 months commencing in April 2018. The loan contains customary covenants relating to minimum net assets, maximum ordinary loss and a coverage ratio covenant. The Company was in compliance with these covenants as of December 31, 2021 and 2020. The loan was available from March 31, 2017 to March 30, 2018 and 690 million JPY (approximately $6.0 million) under this loan was fully drawn in March 2017. Outstanding principal balance for the 2017 Mitsubishi Bank Loan and unamortized debt issuance costs were approximately 258.8 million JPY (approximately $2.2 million) and 7.8 million JPY (approximately $0.1 million), respectively, as of December 31, 2021.
Mitsubishi Bank and Yamanashi Chou Bank loan
In January 2018, the Company entered into a term loan agreement with Mitsubishi Bank and The Yamanashi Chou Bank, Ltd. for a term loan in the aggregate principal amount of 850 million JPY (approximately $7.4 million) (the “Term Loan C”). The purpose of the Term Loan C is to obtain machinery for the core parts of the manufacturing line and payments for related expenses by the Company's subsidiary in Japan. The Term Loan C was available from January 29, 2018 to January 29, 2025. The full amount of the Term Loan C was drawn in January 2018. Interest on the Term Loan C is based upon the annual rate of the three months TIBOR rate plus 1.00%. The Term Loan C requires quarterly interest payments, along with the principal payments, over 82 months commencing in April 2018. The Term Loan C loan agreement contains customary representations and warranties and customary affirmative and negative covenants applicable to the Japanese Subsidiary, including, among other things, restrictions on cessation in business, management, mergers or acquisitions. The Term Loan C loan agreement contains financial covenants relating to minimum net assets and maximum ordinary loss. The Company was in compliance with these covenants as of December 31, 2021. Outstanding principal balance for the Mitsubishi Bank and Yamanashi Chou Bank Loan and unamortized debt issuance costs were approximately 394.7 million JPY (approximately $3.4 million) and 8.8 million JPY (approximately $0.1 million), respectively, as of December 31, 2021.
At December 31, 2021, maturities of long-term debt were as follows (in thousands):
| | | | | |
| 2022 | $ | 3,017 | |
| 2023 | 2,923 | |
| 2024 | 2,174 | |
| 2025 | 409 | |
| 2026 | 20,338 | |
| | $ | 28,861 | |
12. Leases
The Company has operating leases for offices, research and development facilities and manufacturing facilities. Leases have remaining terms of less than one year to six years, some of which include options to extend the leases and some of which may include options to terminate the leases within one year.
On June 13, 2017, the Company entered into an office lease for approximately 39,000 square feet in San Jose (the “Lease”), with a commencement date of June 1, 2017. Upon commencement, the Lease had an initial term of one hundred and twenty-three (123) months, ending September 30, 2027, (the “Initial Term”) with a monthly rental rate of $41,000, escalating annually to a maximum monthly rental rate of approximately $73,000 in the last year of the Initial Term. Upon termination of the Lease, the Company anticipates a restoration cost of approximately $0.9 million.
In September 2016, the Company entered into an office lease for approximately 64,000 square feet of office and laboratory space located in San Jose (the “Lease”). The term of the Lease commenced on January 1, 2017. Upon commencement, the Lease has an initial term of one hundred and twenty-nine (129) months, ending on September 30, 2027 (the “Initial Term”), with an initial monthly rental rate of $144,000, escalating annually to a maximum monthly rental rate of approximately $194,000 in the last year of the Initial Term. The Landlord has agreed to provide the office and laboratory space to the Company free of charge for the first nine months of the Initial Term through September 30, 2017. Upon termination of the Lease, the Company anticipates a restoration cost of approximately $3.1 million.
Table of Contents
NEOPHOTONICS CORPORATION
NOTES TO CONSOLIDATED FINANCIAL STATEMENTS (continued)
As of December 31, 2021 and 2020, an asset recorded in property, plant and equipment under a finance lease was immaterial.
The components of lease expense were as follows (in thousands):
| | | | | | | | | | | | | | | | | |
| Year Ended
December 31, |
| 2021 | | 2020 | | 2019 |
| Operating lease cost | $ | 3,143 | | | $ | 3,056 | | | 3,026 | |
| Variable and short-term lease cost | 2,760 | | | 2,007 | | | 1,482 | |
| Total lease cost | $ | 5,903 | | | $ | 5,063 | | | $ | 4,508 | |
Other information related to leases was as follows (in thousands, except lease term and discount rate):
| | | | | | | | | | | | | | | | | |
| Year Ended
December 31, |
| 2021 | | 2020 | | 2019 |
| Supplemental cash flow information | | | | | |
| Cash paid for amounts included in the measurement of lease liabilities: | | | | | |
| Operating cash flows from operating leases | $3,403 | | $3,193 | | $3,600 |
| Right-of-use assets obtained in exchange for lease obligations: | | | | | |
| Operating leases | $1,430 | | $98 | | $136 |
| Weighted average remaining lease term (in years) | | | | | |
| Operating leases | 5.5 | | 6.5 | | 7.4 |
| Weighted average discount rate | | | | | |
| Operating leases | 6.3% | | 6.5% | | 6.4% |
Future minimum lease payments under non-cancelable leases as of December 31, 2021 were as follows (in thousands):
| | | | | |
| Operating Leases |
| 2022 | $ | 3,284 | |
| 2023 | 3,376 | |
| 2024 | 3,351 | |
| 2025 | 3,428 | |
| 2026 | 3,281 | |
| Thereafter | 2,128 | |
| Total future minimum lease payments | 18,848 | |
| Less imputed interest | (3,051) | |
| Total | $ | 15,797 | |
| | | | | |
| Reported as of December 31, 2021: | Operating Leases |
| Accrued and other current liabilities | $ | 2,356 | |
| Operating lease liabilities, noncurrent | 13,441 | |
| Total | $ | 15,797 | |
13. Pension Plans
Japan defined benefit pension plans
In connection with its acquisition of NeoPhotonics Semiconductor in 2013, the Company assumed responsibility for 2 defined benefit plans that provide retirement benefits to its NeoPhotonics Semiconductor employees in Japan: the Retirement Allowance Plan (“RAP”) and the Defined Benefit Corporate Pension Plan (“DBCPP”). The RAP is an unfunded plan
Table of Contents
NEOPHOTONICS CORPORATION
NOTES TO CONSOLIDATED FINANCIAL STATEMENTS (continued)
administered by the Company. Effective February 28, 2014, the DBCPP was converted to a defined contribution plan (“DCP”). In May 2014, LAPIS Semiconductor Co., Ltd. ("LAPIS") transferred approximately $2.0 million into the newly formed DCP which was the allowable amount that can be transferred according to the Japanese regulations. LAPIS also paid the Company approximately $0.3 million in connection with the conversion of the plan. Additionally, the Company transferred the net unfunded projected benefit obligation amount from the DBCPP to the RAP and froze the RAP benefit at the February 28, 2014 amount. Under the RAP, lump sum benefits are provided upon retirement or upon certain instances of termination. In 2014, the Company reclassified $0.2 million and $0.1 million from accumulated other comprehensive income to cost of goods sold and operating expenses, respectively.
The funded status of the plan for the years ended December 31, 2021, 2020 and 2019 was as follows (in thousands):
| | | | | | | | | | | | | | | | | |
| | 2021 | | 2020 | | 2019 |
| | RAP | | RAP | | RAP |
| Change in projected benefit obligation: | | | | | |
| Projected benefit obligation, beginning of period | $ | 3,743 | | | $ | 4,090 | | | $ | 4,308 | |
| Interest cost | 6 | | | 4 | | | 4 | |
| Benefits paid | (691) | | | (531) | | | (276) | |
| Actuarial (gain)/loss | 15 | | | (21) | | | — | |
| Currency translation adjustment | (356) | | | 201 | | | 54 | |
| Projected benefit obligation, end of period | $ | 2,717 | | | $ | 3,743 | | | $ | 4,090 | |
| Plan assets at calculated amount, end of period | $ | — | | | $ | — | | | $ | — | |
| Amounts recognized in consolidated balance sheets: | | | | | |
| Accrued and other current liabilities | $ | 337 | | | $ | 707 | | | $ | 585 | |
| Other noncurrent liabilities | $ | 2,380 | | | $ | 3,036 | | | $ | 3,505 | |
| Amount recognized in accumulated other comprehensive loss: | | | | | |
| Defined benefit pension plans adjustment | $ | 353 | | | $ | 398 | | | $ | 378 | |
| Accumulated benefit obligation, end of period | $ | 2,717 | | | $ | 3,743 | | | $ | 4,090 | |
Net periodic pension cost associated with the plan for the years ended December 31, 2021, 2020 and 2019 included the following components (in thousands):
| | | | | | | | | | | | | | | | | |
| | 2021 | | 2020 | | 2019 |
| | RAP | | RAP | | RAP |
| Service cost | $ | — | | | $ | — | | | $ | — | |
| Interest cost | 6 | | | 4 | | | 4 | |
| Other | — | | | — | | | — | |
| Curtailment/settlement (gain) loss | — | | | — | | | — | |
| Net periodic pension costs | $ | 6 | | | $ | 4 | | | $ | 4 | |
The projected and accumulated benefit obligations for the RAP were calculated as of December 31, 2021, 2020 and 2019 using a discount rate assumption of 0.2%, 0.1% and 0.1%, respectively.
Estimated future benefit payments under the RAP are as follows (in thousands):
| | | | | |
| 2022 | $ | 282 | |
| 2023 | — | |
| 2024 | 390 | |
| 2025 | 253 | |
| 2026 | 72 | |
| 2027 - 2031 | 1,258 | |
| Thereafter | 462 | |
| | $ | 2,717 | |
401(k) Plan The Company maintains a savings and retirement plan qualified under Section 401(k) of the Internal Revenue Code of 1986, as amended (the "IRC"). The Company currently matches a portion of all eligible employee contributions which vest
Table of Contents
NEOPHOTONICS CORPORATION
NOTES TO CONSOLIDATED FINANCIAL STATEMENTS (continued)
immediately. The Company’s matching contributions to the plan totaled $0.4 million, $0.4 million and $0.5 million, respectively, for the years ended December 31, 2021, 2020, and 2019.
14. Commitments and contingencies
Litigation
From time to time, the Company is subject to various claims and legal proceedings, either asserted or unasserted, that arise in the ordinary course of business. The Company accrues for legal contingencies if the Company can estimate the potential liability and if the Company believes it is probable that the case will be ruled against it. If a legal claim for which the Company did not accrue is resolved against it, the Company would record the expense in the period in which the ruling was made. The Company believes that the likelihood of an ultimate amount of liability, if any, for any pending claims of any type (alone or combined), except for the matter discussed in the following paragraph, that will materially affect the Company’s financial position, results of operations or cash flows is remote. The ultimate outcome of any litigation is uncertain, however, and unfavorable outcomes could have a material negative impact on the Company’s financial condition and operating results. Regardless of outcome, litigation can have an adverse impact on the Company because of defense costs, negative publicity, diversion of management resources and other factors.
Merger-Related Litigation
In connection with the Merger announced in November 2021, the Company and its directors were named as defendants in 10 lawsuits filed by purported stockholders of NeoPhotonics challenging the proposed merger. These ten lawsuits are not material either individually or collectively. The plaintiffs in these ten lawsuits have dismissed their suits and have entered into fee agreements. Four of the lawsuits, styled as Elaine Wang v. NeoPhotonics Corporation, et al., No. 1:21-cv-10338, Heather Smith v. NeoPhotonics Corporation, et al., No. 1:21-cv-10698, Matthew Hopkins v. NeoPhotonics Corporation, et al., No. 1:21-cv-10725, and John Ryan v. NeoPhotonics Corporation, et al., No. 1:22-cv-00046, were filed in the United States District Court for the Southern District of New York on December 3, 2021, December 14, 2021, December 15, 2021, and January 4, 2022, respectively. Three of the lawsuits, styled as Mengsheng Ku v. NeoPhotonics Corporation, et al., No. 5:21-cv-09479, Stephen Bushansky v. NeoPhotonics Corporation, et al.,No. 5:21-cv-09825, and James Parshall v. NeoPhotonics Corporation, et al., No. 5:22-cv-00055, were filed in the United States District Court for the Northern District of New York on December 8, 2021, December 20, 2021, and January 5, 2022, respectively. One lawsuit, styled as James Hendrickson v. NeoPhotonics Corporation, et al., No. 1:21-cv-06919, was filed in the United States District Court for the Eastern District of New York on December 15, 2021. One of the lawsuits, styled as Alex Ciccotelli v. NeoPhotonics Corporation, et al., No. 2:21-cv-05611, was filed in the United States District Court for the Eastern District of Pennsylvania on December 23, 2021. One of the lawsuits, styled as Christopher Taylor v. NeoPhotonics Corporation, et al., No. 1:22-cv-00002, was filed in the United States District Court for the District of Delaware on January 3, 2022.
The lawsuits generally alleged, among other things, that NeoPhotonics and its directors violated Section 14(a) of the Exchange Act, Rule 14a-9 promulgated thereunder, and 17 C.F.R. § 244.100 by disseminating an incomplete and misleading Preliminary Proxy Statement on Schedule 14A, filed with the SEC on December 1, 2021 regarding the Merger. The lawsuits further alleged that NeoPhotonics’ directors violated Section 20(a) of the Exchange Act by failing to exercise proper control over the person(s) who violated Section 14(a) of the Exchange Act. The complaints sought injunctive relief, rescission or rescissory damages, dissemination of a proxy statement that discloses certain information requested by the plaintiffs, and an award of plaintiffs’ costs, including attorneys’ fees and expenses.
In addition to the ten lawsuits, two demand letters were brought by purported stockholders challenging the Merger and seeking various forms of injunctive and declaratory relief, as well as awards of damages, costs, expert fees and attorneys’ fees.
The ten lawsuits letters and the two demand letters are not material either individually or collectively. Additionally, the plaintiffs in all such matters have dismissed their claims or lawsuits and entered into fee agreements.
Finisar Litigation
In January 2010, Finisar Corporation (acquired by II-VI, Inc. in September 2019) ("Finisar"), filed a complaint in the U.S. District Court for the Northern District of California, against Source Photonics, Inc., MRV Communications, Inc., Oplink Communications, Inc. and the Company, or collectively, the co-defendants. In the complaint, Finisar alleged infringement of certain of its U.S. patents. In 2011 the Company and Finisar agreed to suspend their respective claims and in 2012 the Company and Finisar further agreed to toll their respective claims. While there has been no action on this matter since 2012, the Company is currently unable to predict the outcome of this dispute and therefore cannot estimate a range of possible loss.
APAT Litigation and Settlement
Table of Contents
NEOPHOTONICS CORPORATION
NOTES TO CONSOLIDATED FINANCIAL STATEMENTS (continued)
Since April 2018, APAT OE and NeoPhotonics (China) Co., Ltd. and NeoPhotonics Dongguan Co. Ltd. (collectively "NeoChina", which are both wholly-owned subsidiaries of the Company) and NeoPhotonics Corporation were involved in a series of litigations and arbitrations which arose out of the 2017 sale by NeoChina of certain low speed transceiver assets to APAT.
On October 27, 2020, the parties entered into a settlement agreement to settle all claims and release all property preservation orders. In exchange for a full release of all claims by all parties, terms of the settlement agreement include the following: i) APAT OE to pay NeoChina the arbitration awards in the amount of RMB 52,014,519 (approximately $7.6 million) plus interest of RMB 6,122,150 (approximately $0.9 million) for a total amount of RMB 58,136,669 (approximately $8.5 million) and ii) NeoPhotonics Corporation to pay APAT Hong Kong, a wholly-owned subsidiary of APAT OE, $10,031,515 USD plus $500,000 USD in interest for a total payment $10,531,515 for amounts that were paid by customers to NeoPhotonics Corporation for sales of products made by APAT OE after the close of the asset purchase agreement.
Under the settlement agreement, each party takes turns paying a portion of the total amounts owed until all amounts have been paid. The first payment from APAT OE to the Company occurred in November 2020. All other payments, except the final payment, were completed in Q1 2021 and the final payment by the Company to APAT was completed in February 2022.
The settlement award of RMB 58,136,669 (approximately $8.5 million) payable by APAT OE to the Company represents repayment of the net receivables owed to the Company at the settlement date and partial recovery of previously recognized losses incurred by the Company of approximately $3.0 million primarily related to a litigation settlement loss with a vendor for committed purchases of certain production materials for which the liabilities were assumed by APAT OE in the Asset Purchase Agreement entered into with the Company in December 2016 and the legal fees incurred for the lawsuits with APAT OE during 2018, 2019 and 2020.
At December 31, 2021, the amount payable by the Company to APAT OE under the settlement agreement is approximately $0.8 million, and is included in Accrued and Other Liabilities in the caption "Transition Services Agreement Payables" (See Note 8).
Indemnifications
In the normal course of business, the Company enters into agreements that contain a variety of representations and warranties and provides for general indemnification. The Company’s exposure under these agreements is unknown because it involves claims that may be made against the Company in the future, but have not yet been made. To date, the Company has not paid any claims or been required to defend any action related to its indemnification obligations. However, the Company may record charges in the future as a result of these indemnification obligations.
Purchase obligations
The Company has open purchase orders with its suppliers for the purchase of inventory and other items in the ordinary course of its business. As of December 31, 2021, the Company’s estimate of outstanding amounts under these purchase orders was approximately $31.3 million, primarily expected to be purchased within the next 12 months. Certain of these open purchase orders may be cancellable without penalty.
Penalty Payment Derivative
In connection with a private placement transaction with Joint Stock Company "Rusnano" (formerly Open Joint Stock Company “RUSNANO"), or Rusnano, in 2012, the Company agreed to certain performance obligations including establishing a wholly-owned subsidiary in Russia and making a $30.0 million investment commitment (the "Investment Commitment") towards the Company’s Russian operations, which could be partially satisfied by cash and/or non-cash investment inside or outside of Russia and/or by way of non-cash asset transfers.
The Rights Agreement as amended in 2015 (the "Amended Rights Agreement") limits the maximum amount of penalties and/or exit fee (the "Rusnano Payment") to be paid by the Company to $5.0 million in the aggregate and allows such payment to be reduced when certain milestones are met over time. The Amended Rights Agreement also provides for an updated investment plan for the Company’s Russian subsidiaries that includes non-cash transfer of licensing rights to intellectual property, non-cash transfers of existing equipment and commitments to complete the remaining investment milestones through 2019.
In December 2018, the Company signed a definitive agreement with Rusnano to sell the Company’s 100% interest in NeoPhotonics Corporation, LLC, the subsidiary for the Company’s manufacturing operations in Russia, for approximately book value. The purchase price agreed to be paid by Rusnano consisted of approximately $3.0 million in cash and $1.0 million in cancellation of the remaining penalty payment that would otherwise be owed to Rusnano as consideration for the Company's obligations to provide manufacturing process transition to NeoPhotonics Corporation, LLC. This transaction was completed in April 2019.
15. Stockholders’ Equity
Table of Contents
NEOPHOTONICS CORPORATION
NOTES TO CONSOLIDATED FINANCIAL STATEMENTS (continued)
Common stock
As of December 31, 2021, the Company had reserved 6,356,982 shares of common stock for issuance under its stock plans and there were 0 shares of common stock for issuance under its employee stock purchase plan because of the termination of the plan in November 2021 in conjunction with the proposed merger with Lumentum.
In August 2019, the Company filed a prospectus supplement with SEC to issue 103,734 shares of common stock and additional shares of common stock with an aggregate offering price of up to $4.5 million to one of the Company’s vendors as a consideration for research and development services. In 2019, the Company issued common shares totaling 441,410 for a total consideration of $2.5 million.
Accumulated Other Comprehensive Income (Loss)
The following table shows the components of accumulated other comprehensive income (loss), net of taxes, as of December 31, 2021 and 2020 (in thousands):
| | | | | | | | | | | |
| | December 31,
2021 | | December 31,
2020 |
| Foreign currency translation adjustments | $ | 2,603 | | | $ | 1,951 | |
| Defined benefit pension plan adjustment, net of taxes | (227) | | | (216) | |
| | $ | 2,376 | | | $ | 1,735 | |
Accumulated Deficit
Approximately $10.5 million and $10.0 million of the Company’s retained earnings within its accumulated deficit at December 31, 2021 and 2020, respectively, was subject to restriction due to a requirement that its subsidiaries in China set aside at least 10% of their respective accumulated profits each year to fund statutory common reserves as well as allocate a discretional portion of their after-tax profits to their staff welfare and bonus fund.
16. Restricted net assets
The Company’s consolidated subsidiaries operating in China and Japan are restricted from transferring funds or assets to its parent company in the form of cash dividends, loans or advances. As of December 31, 2021 and December 31, 2020, the Company's consolidated subsidiaries had $11.4 million and $11.4 million, respectively, of restricted net assets. This compares to the Company's consolidated net assets of $153.0 million and $180.4 million as of December 31, 2021 and December 31, 2020, respectively, which consisted of (in thousands): | | | | | | | | | | | |
| December 31, 2021 | | December 31, 2020 |
| Cash restricted in China due to unpaid employee benefits and unfulfilled government grants | $ | 49 | | | $ | 452 | |
| China earnings restricted to fund statutory common reserves in China | 10,463 | | | 10,010 | |
| Loan agreements in Japan requiring local subsidiaries to maintain minimum net asset levels | 869 | | | 969 | |
| Total restricted net assets in the Company's consolidated subsidiaries | $ | 11,381 | | | $ | 11,431 | |
17. Stock-based compensation
Equity incentive programs
2007 Stock Appreciation Grants Plan
In October 2007, the Company adopted its 2007 Stock Appreciation Grants Plan (the “2007 Plan”). The 2007 Plan provides for the grant of units (“stock appreciation units”) entitling the holder upon exercise to receive cash in an amount equal to the amount by which the Company’s common stock has appreciated in value. Each stock appreciation unit entitles a participant to a cash payment in the amount of the excess of the fair market value of a share of common stock on the exercise date over the fair market value of a share of common stock on the award date.
The total appreciation available to a participant from the exercise of an award is equal to the number of stock appreciation units being exercised, multiplied by the amount of appreciation per stock appreciation unit. The stock appreciation units granted under the 2007 Plan were primarily granted to employees or consultants of the Company’s subsidiaries in China.
As of December 31, 2021, no stock appreciation units were outstanding. The Company does not intend to grant additional stock appreciation units under the 2007 Plan.
Table of Contents
NEOPHOTONICS CORPORATION
NOTES TO CONSOLIDATED FINANCIAL STATEMENTS (continued)
2010 Equity Incentive Plan
In April 2010, the Company adopted its 2010 Equity Incentive Plan (the “2010 Plan”). The 2010 Plan terminated on April 13, 2020.
The 2010 Plan provides for the grant of incentive stock options, non-statutory stock options, stock appreciation rights, restricted stock awards, restricted stock unit awards, market-based stock awards, and other forms of equity compensation, or collectively, stock awards, all of which may be granted to employees, including officers, and to non-employee directors and consultants. Additionally, the 2010 Plan provides for the grant of market-based cash awards. Incentive stock options may be granted only to employees. All other awards may be granted to employees, including officers, and to non-employee directors and consultants.
Under the terms of the 2010 Plan, awards may be granted at prices not less than 100% of the fair value of the Company’s common stock, as determined by the Company’s board of directors, on the date of grant for an incentive stock option and not less than 85% of the fair value of the Company’s common stock on the date of grant for a non-qualified stock option. Options vest over a period of time as determined by the board of directors, generally over a three to four year period, and expire ten years from date of grant.
Initially, the aggregate number of shares of the Company’s common stock that may be issued pursuant to stock awards under the 2010 Plan was 865,420 shares. The number of shares of the Company’s common stock reserved for issuance under the 2010 Plan automatically increase on January 1st each year, starting on January 1, 2012 and continuing through January 1, 2020, by 3.5% of the total number of shares of the Company’s common stock outstanding on December 31 of the preceding calendar year, or such lesser number of shares of common stock as determined by the Company’s board of directors. The maximum number of shares that may be issued pursuant to the exercise of incentive stock options under the 2010 Plan is 8,000,000 shares. As of December 31, 2021, stock options to purchase and restricted stock units to convert to a total of 2,980,558 shares of common stock were outstanding under the 2010 Plan and 0 shares were available for future issuance.
2010 Employee Stock Purchase Plan
In February 2011, the Company adopted its 2010 Employee Stock Purchase Plan (the “2010 ESPP”). The 2010 ESPP was implemented through a series of offerings of purchase rights to eligible U.S. employees. The offering period is for 12 months beginning November 16th of each year, with 2 purchase dates on May 15th and November 15th.
The 2010 ESPP initially authorized the issuance of 342,568 shares of the Company’s common stock pursuant to purchase rights granted to employees or to employees of designated affiliates. The number of shares of common stock reserved for issuance automatically increase on January 1st of each year, starting January 1, 2012, in an amount equal to the lesser of (1) 3.5% of the total number of shares of common stock outstanding on December 31st of the preceding calendar year, (2) 600,000 shares of common stock or (3) such lesser number of shares of common stock as determined by the Company’s board of directors.
In June 2019, the Company’s stockholders approved an amendment and restatement of the 2010 ESPP, which authorized 1,500,000 additional shares for issuance under the 2010 ESPP and eliminated the annual automatic increase provisions from the 2010 ESPP.
On November 4, 2021, per the terms in the Merger Agreement with Lumentum, the Company announced that the ESPP program would be terminated effective November 16, 2021 after the latest purchase period ended November 15, 2021 and there would be no future purchase periods.
2011 Inducement Award Plan
In September 2011, the Company adopted its 2011 Inducement Award Plan (the “2011 Plan”). The 2011 Plan provides for awarding options, stock appreciation rights, restricted stock grants, restricted stock units and other awards to new employees of the Company and its affiliates, including as a result of future business acquisitions. All options under this plan will be designated as non-statutory stock options.
The number of shares initially reserved for issuance under the 2011 Plan was 750,000 shares. The exercise price of awards shall be not less than 100% of the fair market value of the Company’s common stock on the date of grant. Each stock appreciation right grant will be denominated in shares of common stock equivalents. Options and stock appreciation rights have a maximum term of ten years measured from the date of grant, subject to earlier termination following the individual’s cessation of service with the Company. In 2015, an additional 100,000 shares were authorized for issuance by the Company’s board of directors. As of December 31, 2021, stock options to purchase and restricted stock units to convert to a total of 135,260 shares of common stock were outstanding under the 2011 Plan and 0 shares were available for future issuance.
2020 Equity Incentive Plan
On June 2, 2020, at the 2020 Annual Meeting of Stockholders of NeoPhotonics Corporation, the Company’s stockholders approved NeoPhotonics Corporation 2020 Equity Incentive Plan (the “2020 Plan”). The Plan became effective immediately upon stockholder approval at the Annual Meeting. The aggregate number of shares of common stock reserved for issuance under the 2020 Plan will not exceed the sum of (i) 1,921,414 shares and (ii) certain shares subject to outstanding awards granted
Table of Contents
NEOPHOTONICS CORPORATION
NOTES TO CONSOLIDATED FINANCIAL STATEMENTS (continued)
under the Company’s 2010 Equity Incentive Plan or 2011 Inducement Award Plan that may become available for issuance under the 2020 Plan, as such shares become available from time to time.
On June 1, 2021, at the 2021 Annual Meeting of Stockholders of NeoPhotonics Corporation, the Company’s stockholders approved the Amended 2020 Equity Incentive Plan.
As of December 31, 2021, stock options to purchase and restricted stock units to convert to a total of 1,925,044 shares of common stock were outstanding under the 2020 Plan and 1,316,120 shares were reserved for future issuance.
Determining Fair Value
The Company estimated the fair value of certain stock-based awards using a Black-Scholes-Merton valuation model with the following assumptions:
| | | | | | | | | | | | | | | | | |
| | Years ended December 31, |
| Stock options | 2021 | | 2020 | | 2019 |
| Weighted-average expected term (years) | 6.00 | | 6.00 | | 6.00 |
| Weighted-average volatility | 68% | | 69% | | 67% |
| Risk-free interest rate | 1.04%-1.16% | | 0.46% | | 1.82%-2.27% |
| Expected dividends | —% | | —% | | —% |
| Stock appreciation units | | | | | |
| Weighted-average expected term (years) | 0.71 | | 1.15 | | 1.52 |
| Weighted-average volatility | 66% | | 66% | | 64% |
| Risk-free interest rate | 0.05%-0.12% | | 0.11%-1.60% | | 1.63%-2.63% |
| Expected dividends | —% | | —% | | —% |
| ESPP | | | | | |
| Weighted-average expected term (years) | N/A | | 0.72 | | 0.71 |
| Weighted-average volatility | N/A | | 62% | | 71% |
| Risk-free interest rate | N/A | | 0.11%-0.15% | | 1.75%-2.44% |
| Expected dividends | N/A | | —% | | —% |
Expected term. The expected term for stock options was estimated using the Company’s historical exercise behavior and expected future exercise behavior. Vested stock appreciation units first became exercisable upon the expiration of the lock-up period associated with the initial public offering. Therefore, the Company estimated the term of the award based on an average of the weighted-average exercise period and the remaining contractual term. The expected term for the ESPP represents the period of time from the beginning of the offering period to the purchase date.
Volatility. Due to the limited history of the trading of the Company’s common stock since the initial public offering in February 2011, the expected volatility used by the Company was based on a combination of its own volatility and the volatility of similar entities through end of 2016. In evaluating similarity, factors such as industry, stage of life cycle, size, and financial leverage were taken into consideration. The term over which volatility was measured was commensurate with the expected term. Starting 2017, the volatility assumption is based on the historical volatility of our common stock over the expected term of the stock options.
Risk-free interest rate. The risk-free rate that the Company uses in the Black-Scholes-Merton option valuation model is based on U.S. Treasury zero-coupon issues with remaining terms similar to the expected term on the options.
Expected dividends. The Company has never declared or paid any cash dividends and does not plan to pay cash dividends in the foreseeable future, and, therefore, used an expected dividend yield of zero in the valuation model.
Stock-Based Compensation Expense
The following table summarizes the stock-based compensation expense recognized for the years ended December 31, 2021, 2020 and 2019. Unamortized stock-based compensation costs capitalized as part of inventory were immaterial in each of the periods presented (in thousands):
Table of Contents
NEOPHOTONICS CORPORATION
NOTES TO CONSOLIDATED FINANCIAL STATEMENTS (continued)
| | | | | | | | | | | | | | | | | |
| | Years ended December 31, |
| | 2021 | | 2020 | | 2019 |
| Cost of goods sold | $ | 2,016 | | | $ | 2,305 | | | $ | 2,244 | |
| Research and development | 2,965 | | | 3,367 | | | 3,138 | |
| Sales and marketing | 1,548 | | | 2,403 | | | 2,411 | |
| General and administrative | 4,464 | | | 4,262 | | | 4,663 | |
| | $ | 10,993 | | | $ | 12,337 | | | $ | 12,456 | |
Stock Option and Restricted Stock Unit Activity
The following table summarizes the Company’s stock option and restricted stock unit, or RSU, activity during the year ended December 31, 2021. The table does not include market-based or performance based RSU awards.
| | | | | | | | | | | | | | | | | | | | | | | | | | | | | |
| | | | Stock Options | | Restricted Stock Units |
| | Shares Available for Grant | | Number of Shares | | Weighted Average Exercise Price | | Number of Units | | Weighted Average Grant Date Fair Value |
| Balance at December 31, 2020 | 1,786,184 | | | 2,096,917 | | | $ | 6.25 | | | 3,621,681 | | | $ | 6.63 | |
| Authorized for issuance | 900,000 | | | | | | | | | |
| Granted | (1,854,954) | | | 60,944 | | | 10.15 | | | 1,629,010 | | | 9.89 | |
| Exercised/Converted | — | | | (835,716) | | | 6.12 | | | (1,476,859) | | | 6.60 | |
| Cancelled/Forfeited | 484,890 | | | (42,923) | | | 6.22 | | | (386,517) | | | 7.02 | |
| Balance at December 31, 2021 | 1,316,120 | | | 1,279,222 | | | 6.52 | | | 3,387,315 | | | 8.16 | |
The following table summarizes information about stock options outstanding as of December 31, 2021 :
| | | | | | | | | | | | | | | | | | | | | | | |
| | Options Outstanding |
| | Number of Shares | | Weighted Average Exercise Price | | Weighted Average Remaining Contractual Term (Years) | | Aggregate Intrinsic Value (in Thousands) |
| Vested and expected to vest | 1,278,575 | | | $ | 6.51 | | | 3.56 | | $ | 11,336,474 | |
| Exercisable | 1,248,125 | | | 6.42 | | | 3.41 | | 11,177,539 | |
The weighted-average exercise price of stock options outstanding as of December 31, 2021 was $6.52. As of December 31, 2021, the weighted-average remaining contractual term of stock options outstanding was 3.56 years.
The fair value of options vested during the years ended December 31, 2021, 2020 and 2019 was $0.5 million, $0.9 million and $1.6 million, respectively. The intrinsic value of options vested and expected to vest and exercisable as of December 31, 2021 is calculated based on the difference between the exercise price and the fair value of the Company’s common stock as of December 31, 2021. The intrinsic value of options exercised during the years ended December 31, 2021, 2020 and 2019, was $5.1 million, $2.1 million and $1.3 million, respectively.
The weighted-average fair value of options granted was $6.19, $5.22 and $2.68 per share for the years ended December 31, 2021, 2020 and 2019, respectively. At December 31, 2021, there was $0.2 million of unrecognized stock-based compensation expense for stock options, net of estimated forfeitures, which will be recognized over the remaining weighted-average period of 0.4 years.
Included in the outstanding stock options at December 31, 2021 are 0.4 million shares of market-based stock options granted to key personnel. The fair value of its market-based option grants was $4.72 for 2015 and $1.65 for 2014 using a Monte Carlo simulation model with the assumptions discussed above. These options vested in September 2016 as a result of the satisfaction of the market condition requiring the average closing price of the Company’s common stock over a period of 20 consecutive trading days to be equal to or greater than $15.00 per share and the recipients remaining in continuous service with the Company through such period. The Company recorded approximately $4.8 million in related stock-based compensation expense for these options in 2016.
The following table summarizes information about RSUs outstanding as of December 31, 2021:
Table of Contents
NEOPHOTONICS CORPORATION
NOTES TO CONSOLIDATED FINANCIAL STATEMENTS (continued)
| | | | | | | | | | | | | | | | | | | | | | | |
| | Restricted Stock Units Outstanding |
| | Number of Shares | | Weighted Average Exercise Price | | Weighted Average Remaining Contractual Term (Years) | | Aggregate Intrinsic Value (in Thousands) |
| Vested and expected to vest | 2,916,139 | | | $ | — | | | 1.47 | | $ | 44,821,060 | |
The fair value of RSUs vested during the years ended December 31, 2021, 2020 and 2019 was $12.6 million, $8.1 million and $8.9 million, respectively. The intrinsic value of RSUs vested and expected to vest as of December 31, 2021 is calculated based on the fair value of the Company’s common stock as of December 31, 2021. The intrinsic value of RSUs converted during the years ended December 31, 2021, 2020 and 2019, was $21.0 million, $11.3 million and $4.7 million, respectively.
The weighted-average fair value of RSUs granted was $9.89, $7.67 and $4.90 per share for the years ended December 31, 2021, 2020 and 2019, respectively. At December 31, 2021, the Company had $19.9 million of unrecognized stock-based compensation expense for RSUs, net of estimated forfeitures, which will be recognized over the remaining weighted-average period of 2.7 years.
The majority of the Company’s RSUs that were converted during the years ended December 31, 2021, 2020 and 2019 were net share settled. Upon each settlement date, RSUs were withheld to cover the minimum withholding tax and the remaining amounts were delivered to the recipient as shares of the Company’s common stock. In 2021, 2020 and 2019, the Company withheld 451,820, 206,065 and 155,267 shares, respectively, and remitted cash of $5.0 million, $1.8 million and $0.7 million, respectively, to the appropriate tax authorities.
Market-based Restricted Stock Unit Activity
In 2019, the Company granted 10,000 shares of market-based RSUs to certain employees. These RSUs will vest if the 30-day weighted average closing price of the Company's common stock is equal to or greater than certain price targets per share and the recipients remain in continuous service with the Company through such service period. 40,500, 30,000 and 63,500 RSU's were canceled during 2021, 2021, and 2019, respectively. There were no RSUs vested in 2021, 2020 and 2019.
The weighted average grant-date fair value per share of market-based RSUs granted during 2019 was approximately $4.86. As of December 31, 2021, the Company had $0.1 million of unrecognized stock-based compensation expense for RSUs, net of estimated forfeitures, which will be recognized over the remaining weighted-average period of 0.43 years. The fair value of market-based RSUs was measured on the grant date using Monte Carlo simulation model with the following assumptions:
| | | | | | | | | | | |
| | Years ended December 31, |
| 2021 | | 2020 |
| Weighted-average volatility | 66% | | 66% |
| Risk-free interest rate | 2.79% | | 2.79% |
| Expected dividends | —% | | —% |
Market-based RSUs expire seven years from the date of grant. As of December 31, 2021, the weighted average remaining contractual term for market-based RSUs is 3.6 years.
Performance-based Restricted Stock Units
In April 2020, the Company granted 90,400 shares of performance-based RSUs to certain employees. These RSUs will vest upon certification by the Board of Directors or the Compensation Committee that the Company has achieved at least $425 million in revenue over four consecutive fiscal quarters and the recipients remain in continuous service with the Company through such service period. In 2021, no performance-based RSUs were vested and 14,950 shares were cancelled, and in 2020 no performance-based RSUs were vested or cancelled.
The weighted average grant-date fair value per share of performance-based RSUs granted during 2020 was $7.73 per share.
In July 2021, the Company granted 165,000 shares of performance-based RSUs to certain employees. These RSUs will vest upon certification by the Board of Directors or the Compensation Committee that the Company has achieved at least $100 million in revenue from Data Center Customers as measured over four consecutive quarters and the recipients remain in continuous service with the Company through such service period. NaN of these shares were vested or cancelled during 2021.
The weighted average grant-date fair value per share of performance-based RSUs granted during 2021 was $8.97 per share.
Table of Contents
NEOPHOTONICS CORPORATION
NOTES TO CONSOLIDATED FINANCIAL STATEMENTS (continued)
Stock Appreciation Unit Activity
The following table summarizes the Company’s stock appreciation unit activity during the year ended December 31, 2021:
| | | | | | | | | | | |
| | Stock Appreciation Units | | Weighted-Average Exercise Price |
| Stock appreciation units outstanding as of December 31, 2020 | 150,000 | | | $ | 5.11 | |
| Stock appreciation units exercised | (125,000) | | | 5.11 | |
| Stock appreciation units canceled | — | | | — | |
| Stock appreciation units outstanding as of December 31, 2021 | 25,000 | | | 5.11 | |
The fair value of stock appreciation units vested was immaterial in 2021, 2020, and 2019. The intrinsic value of stock appreciation units is calculated based on the difference between the exercise price and the fair value of the Company’s common stock as of December 31, 2021. Cash paid for stock appreciation units exercised was $1.3 million in 2021 and $0.1 million in 2020, and 2019. The stock appreciation units may only be settled in cash.
As of December 31, 2021 and 2020, the liability for settlement of stock appreciation units was approximately $0.3 million and $0.7 million, respectively, and was included in accrued and other current liabilities on the consolidated balance sheet, based on the fair value of the stock appreciation units, that will be recognized through settlement.
Included in the outstanding stock appreciation units at December 31, 2021 were 25,000 shares of market-based stock appreciation units granted to key personnel which were granted during 2013. These market-based units vested in September 2016 upon the satisfaction of the market condition requiring the average closing price of the Company’s common stock over a period of 20 consecutive trading days to be equal to or greater than $15.00 per share and the recipients remaining in continuous service with the Company through such period. In 2021, the Company recorded approximately $0.4 million gain as compared to approximately $0.1 million gain in 2020, in related stock-based compensation for these stock appreciation units.
Employee Stock Purchase Plan
The Company issued 357,781 shares under the 2010 ESPP during the year ended December 31, 2021. As a condition of the Merger Agreement with Lumentum, effective November 16, 2021 the ESPP program was terminated by the Company and there is 0 unrecognized compensation expense for stock purchase rights as of December 31, 2021.
18. Income taxes
The provision for income taxes is based upon the income (loss) before income taxes as follows (in thousands):
| | | | | | | | | | | | | | | | | |
| | Years Ended December 31, |
| | 2021 | | 2020 | | 2019 |
| U.S. operations | $ | (44,152) | | | $ | (7,083) | | | $ | (21,579) | |
| Non-U.S. operations | 5,141 | | | 3,919 | | | 6,136 | |
| | $ | (39,011) | | | $ | (3,164) | | | $ | (15,443) | |
Table of Contents
NEOPHOTONICS CORPORATION
NOTES TO CONSOLIDATED FINANCIAL STATEMENTS (continued)
The components of the provision for income taxes consisted of the following (in thousands):
| | | | | | | | | | | | | | | | | |
| | Years Ended December 31, |
| | 2021 | | 2020 | | 2019 |
| Current | | | | | |
| Federal | $ | (21) | | | $ | (39) | | | $ | (71) | |
| State | (5) | | | (12) | | | (3) | |
| Foreign | (3,199) | | | (2,091) | | | (1,854) | |
| | (3,225) | | | (2,142) | | | (1,928) | |
| Deferred | | | | | |
| Federal | — | | | — | | | — | |
| Foreign | 1,517 | | | 940 | | | 295 | |
| Total provision | $ | (1,708) | | | $ | (1,202) | | | $ | (1,633) | |
The tax provision differs from the amount obtained by applying the U.S. federal statutory tax rate as follows (in thousands, except percentages):
| | | | | | | | | | | | | | | | | |
| | Years Ended December 31, |
| | 2021 | | 2020 | | 2019 |
| Federal statutory rate | 21 | % | | 21 | % | | 21 | % |
| Tax at federal statutory rate | $ | 8,142 | | | $ | 673 | | | $ | 3,255 | |
| State taxes, net of federal benefit | (5) | | | (12) | | | (3) | |
| Permanent differences | 218 | | | (125) | | | 1,514 | |
| Stock-based compensation | (710) | | | (1,054) | | | (1,014) | |
| Change in valuation allowance | (9,020) | | | (885) | | | (5,186) | |
| Research and development | 674 | | | 713 | | | 932 | |
| Foreign rate differences | (534) | | | (205) | | | (531) | |
| Foreign tax credit | — | | | — | | | (405) | |
| Change in prior year deferred balances | (472) | | | (302) | | | — | |
| Other | (1) | | | (5) | | | (195) | |
| Total provision for income taxes | $ | (1,708) | | | $ | (1,202) | | | $ | (1,633) | |
Table of Contents
NEOPHOTONICS CORPORATION
NOTES TO CONSOLIDATED FINANCIAL STATEMENTS (continued)
Deferred income tax assets and liabilities comprise the following (in thousands):
| | | | | | | | | | | |
| | December 31, |
| | 2021 | | 2020 |
| Deferred Tax Assets: | | | |
| Net operating loss carryforwards | $ | 63,519 | | | $ | 53,906 | |
| Federal and state credits | 31,571 | | | 31,927 | |
| Reserves, accruals and other | 12,449 | | | 13,339 | |
| Fixed assets and intangibles | 3,582 | | | 3,297 | |
| Total deferred tax assets | 111,121 | | | 102,469 | |
| Valuation allowance | (102,821) | | | (94,017) | |
| Total deferred tax assets, net of valuation allowance | 8,300 | | | 8,452 | |
| Less deferred tax liabilities: | | | |
| Acquired intangibles | (279) | | | (288) | |
| Property, plant and equipment | (2,138) | | | (3,217) | |
| Right-of-use lease assets | (2,457) | | | (2,796) | |
| Net deferred tax assets | $ | 3,426 | | | $ | 2,151 | |
| Reported as: | | | |
| Long term deferred tax assets, included within other long-term assets | $ | 3,426 | | | $ | 2,652 | |
| Long term deferred income tax liabilities, included within noncurrent liabilities | — | | | (501) | |
| Net deferred tax assets | $ | 3,426 | | | $ | 2,151 | |
The net valuation allowance increased by $8.8 million in 2021 and increased by $1.9 million in 2020. There was no material change to the valuation allowance in 2021.
The Company did not record a full valuation allowance against its net deferred tax assets in most foreign jurisdictions as it believes these deferred tax assets were realizable on a more likely than not basis as of December 31, 2021. Based upon the weight of available evidence, which includes the Company’s historical operating performance and the reported cumulative net losses to date, the Company continues to maintain a full valuation allowance against its net U.S. deferred tax assets.
The Company adopted ASU 2019-12 in the first quarter of 2021 that simplifies the accounting for income taxes. The adoption of this standard did not have a material impact on the Company's consolidated financial statements.
As of December 31, 2021, the Company had federal and state net operating loss, or NOL, carryforwards of approximately $334.2 million and $54.4 million, respectively. Federal NOL carryforwards start to expire in 2025, and state net operating loss carryforwards starts to expire in 2028. As of December 31, 2021, the Company had federal and state research and development tax credits of approximately $12.2 million and $21.5 million, respectively. The federal credits begin to expire in 2025 and the state credits will be carried forward indefinitely. The Company had $10.5 million of foreign tax credit carryforwards which will start to expire in 2023 if not utilized. Utilization of NOL carryforwards and tax credit carryover may be subject to substantial annual limitation due to federal and state ownership limitations. The annual limitation may result in the expiration of NOL and tax credit carryforwards before utilization.
The Company maintains its position for undistributed foreign earnings to be indefinite and does not provide for outside basis differences under the indefinite reinvestment assertion of ASC 740-30. Accordingly, the Company does not anticipate the need to provide for additional taxes for basis differences or withholding taxes on remitted foreign earnings in the immediate future.
At December 31, 2021, the Company’s gross unrecognized tax benefits were approximately $21.1 million, of which NaN would impact the effective tax rate if recognized. The unrecognized tax benefits could be subject to valuation allowance if and when recognized in a future period, which could impact the timing of any related effective tax rate benefit. The Company does not believe that the amount of unrecognized tax benefits will change significantly in the next twelve months. There were no interest or penalties related to unrecognized tax benefits. The Company’s policy is to classify interest and penalties associated with unrecognized tax benefits as income tax expense.
Table of Contents
NEOPHOTONICS CORPORATION
NOTES TO CONSOLIDATED FINANCIAL STATEMENTS (continued)
A reconciliation of the beginning and ending amount of unrecognized tax benefits is as follows (in thousands):
| | | | | | | | | | | | | | | | | |
| Balance at December 31, 2018 | $ | 26,196 | | | | | |
| Net changes in tax positions in the period | (5,544) | | | | | |
| Balance at December 31, 2019 | 20,652 | | | | | |
| Net changes in tax positions in the period | (106) | | | | | |
| Balance at December 31, 2020 | 20,546 | | | | | |
| Net changes in tax positions in current year | 557 | | | | | |
| | | | | |
| Balance at December 31, 2021 | $ | 21,103 | | | | | |
The Company’s material tax jurisdictions are the United States federal, California, Japan and China. As a result of NOL carryforwards, substantially all of the Company’s tax years remain open to U.S. federal and state tax examination. Tax years for 2016 and forward remain open for Chinese tax examination.
19. Segment and geographic information
The Company’s Chief Executive Officer, who is considered to be the chief operating decision maker, manages the Company’s operations as a whole and reviews financial information presented on a consolidated basis for purposes of evaluating financial performance and allocating resources. In 2021, 2020 and 2019, the Company operated in 1 reportable segment.
Through 2021, the Company has aligned its products to High Speed Products and Network Products and Solutions (see Note 3).
The following tables set forth the Company’s asset information by geographic region (in thousands):
| | | | | | | | | | | |
| | As of December 31, |
| | 2021 | | 2020 |
| Property, plant and equipment, net: | | | |
| China | $ | 15,887 | | | $ | 19,144 | |
| United States | 17,697 | | | 21,734 | |
| Japan | 14,076 | | | 21,409 | |
| Rest of world | 6,530 | | | 4,478 | |
| Total | $ | 54,190 | | | $ | 66,765 | |
20. Selected Quarterly Financial Data (unaudited)
The following tables set forth a summary of the Company’s quarterly financial information for each of the four quarters for the years ended December 31, 2021 and 2020:
| | | | | | | | | | | | | | | | | | | | | | | | | | |
| Year ended December 31, 2021 | | First Quarter | | Second Quarter | | Third Quarter | | Fourth Quarter |
| | | (In thousands, except per share value) |
| Revenues | | $ | 60,926 | | | $ | 65,010 | | | $ | 83,742 | | | $ | 80,612 | |
| Gross profit | | 13,339 | | | 9,875 | | | 23,774 | | | 20,600 | |
| Net loss | | (10,692) | | | (17,433) | | | (1,860) | | | (10,735) | |
| Basic net loss per share | | $ | (0.21) | | | $ | (0.34) | | | $ | (0.04) | | | $ | (0.20) | |
| Diluted net loss per share | | $ | (0.21) | | | $ | (0.34) | | | $ | (0.04) | | | $ | (0.20) | |
| Weighted averages shares used to compute basic loss per share | | 50,717 | | | 51,634 | | | 52,427 | | | 52,895 | |
| Weighted averages shares used to compute diluted net loss per share | | 50,717 | | | 51,634 | | | 52,427 | | | 52,895 | |
| | | | | | | | | | | | | | | | | | | | | | | | | | |
| Year ended December 31, 2020 | | First Quarter | | Second Quarter | | Third Quarter | | Fourth Quarter |
| | | (In thousands, except per share value) |
| Revenues | | $ | 97,401 | | | $ | 103,171 | | | $ | 102,398 | | | $ | 68,193 | |
| Gross profit | | 29,726 | | | 33,502 | | | 24,404 | | | 15,450 | |
| Net income (loss) | | 6,307 | | | 5,725 | | | (4,903) | | | (11,495) | |
| Basic net income (loss) per share | | $ | 0.13 | | | $ | 0.12 | | | $ | (0.10) | | | $ | (0.23) | |
| Diluted net income (loss) per share | | $ | 0.12 | | | $ | 0.11 | | | $ | (0.10) | | | $ | (0.23) | |
| Weighted averages shares used to compute basic net income (loss) per share | | 48,615 | | | 49,077 | | | 49,936 | | | 50,256 | |
| Weighted averages shares used to compute diluted net income (loss) per share | | 50,617 | | | 51,661 | | | 49,936 | | | 50,256 | |
21. Subsequent Events
On January 14, 2022, NeoPhotonics entered into a credit agreement with Lumentum, according to the terms defined in the definitive merger agreement between Lumentum and the Company. Under the credit agreement, Lumentum provides a subordinated, unsecured delayed draw term loan facility in an aggregate principal amount up to $50.0 million. The loans may be drawn in minimum amounts of $10.0 million and bear interest at Wall Street Journal "prime rate", payable monthly in arrears on the first day of each month. There have not been any draw downs on the loans. The maturity date of the loans is January 14, 2024, unless earlier repaid or accelerated. The Company is subject to a number of affirmative and restrictive covenants pursuant to the credit agreement, including minimum liquidity, compliance with applicable laws and regulations, payment of taxes, maintenance of insurance, business combinations, occurrence of additional indebtedness, prepayments of other indebtedness and transactions with affiliates, among other covenants.
ITEM 9. CHANGES IN AND DISAGREEMENTS WITH ACCOUNTANTS ON ACCOUNTING AND FINANCIAL DISCLOSURE
Not applicable.
ITEM 9A. CONTROLS AND PROCEDURES
Evaluation of Disclosure Controls and Procedures
Our management, with the participation of our Chief Executive Officer and Chief Financial Officer, evaluated the effectiveness of the design and operation of our disclosure controls and procedures as of December 31, 2021. The term “disclosure controls and procedures,” as defined in Rules 13a-15(e) and 15d-15(e) under the Securities Exchange Act of 1934, as amended (Exchange Act), means controls and other procedures of a company that are designed to ensure that information required to be disclosed by a company in the reports that it files or submits under the Exchange Act is recorded, processed, summarized and reported, within the time periods specified in the SEC’s rules and forms. Disclosure controls and procedures include, without limitation, controls and procedures designed to ensure that information required to be disclosed by a company in the reports that it files or submits under the Exchange Act is accumulated and communicated to the company’s management, including its principal executive and principal financial officers, as appropriate to allow timely decisions regarding required disclosure.
Based upon that evaluation as of the end of the period covered in this Annual Report on Form 10-K, our Chief Executive Officer and Chief Financial Officer have concluded that our disclosure controls and procedures were effective as of December 31, 2021 at a reasonable assurance level.
Management’s Report on Internal Control Over Financial Reporting
Our management is responsible for establishing and maintaining adequate internal control over financial reporting, as defined in Rules 13a-15(f) and 15d-15(f) as defined in the Exchange Act. Internal control over financial reporting consists of policies and procedures that: (1) pertain to the maintenance of records that, in reasonable detail, accurately and fairly reflect the transactions and dispositions of our company assets; (2) are designed and operated to provide reasonable assurance regarding the reliability of our financial reporting and our process for the preparation of financial statements for external purposes in accordance with generally accepted accounting principles and that receipts and expenditures are being made only in accordance with authorizations of our management and directors; and (3) provide reasonable assurance regarding prevention or timely detection of unauthorized acquisition, use or disposition of our assets that could have a material effect on the financial statements. Because of its inherent limitations, internal control over financial reporting may not prevent or detect misstatements. Also, projections of any evaluation of effectiveness to future periods are subject to the risk that controls may become inadequate because of changes in conditions, or that the degree of compliance with the policies or procedures may deteriorate.
Our management assessed the effectiveness of our internal control over financial reporting using the criteria set forth by the Committee of Sponsoring Organizations of the Treadway Commission in Internal Control — Integrated Framework (2013). Based on the results of our assessment, using the criteria in Internal Control – Integrated Framework (2013), our management has concluded that we maintained effective internal control over financial reporting as of December 31, 2021.
The effectiveness of our internal control over financial reporting as of December 31, 2021 has been audited by BDO USA, LLP, an independent registered public accounting firm, as stated in their report, which appears below.
Changes in Internal Control Over Financial Reporting
There have not been any changes in our internal control over financial reporting (as defined in Rule 13a-15(f) under the Exchange Act) in the fourth quarter of 2021 that materially affected, or are reasonably likely to materially affect, our internal control over financial reporting.
Inherent Limitation on the Effectiveness of Internal Controls
The effectiveness of any system of internal control over financial reporting is subject to inherent limitations, including the exercise of judgment in designing, implementing, operating, and evaluating the controls and procedures, and the inability to eliminate misconduct completely. Accordingly, any system of internal control over financial reporting can only provide reasonable, not absolute, assurance. In addition, projections of any evaluation of effectiveness to future periods are subject to the risk that controls may become inadequate because of changes in conditions, or that the degree of compliance with the policies or procedures may deteriorate. We intend to continue to monitor and upgrade our internal controls as necessary or appropriate for our business, but cannot assure that such improvements will be sufficient to provide us with effective internal control over financial reporting.
REPORT OF INDEPENDENT REGISTERED PUBLIC ACCOUNTING FIRM
Shareholders and Board of Directors
NeoPhotonics Corporation
San Jose, California
Opinion on Internal Control over Financial Reporting
We have audited NeoPhotonics Corporation’s (the “Company’s”) internal control over financial reporting as of December 31, 2021, based on criteria established in Internal Control – Integrated Framework (2013) issued by the Committee of Sponsoring Organizations of the Treadway Commission (the “COSO criteria”). In our opinion, the Company maintained, in all material respects, effective internal control over financial reporting as of December 31, 2021, based on the COSO criteria.
We also have audited, in accordance with the standards of the Public Company Accounting Oversight Board (United States) (“PCAOB”), the consolidated balance sheets of the Company as of December 31, 2021 and 2020, the related consolidated statements of operations, comprehensive loss, stockholders’ equity, and cash flows for each of the years then ended, and the related notes, and our report dated February 24, 2022, expressed an unqualified opinion thereon.
Basis for Opinion
The Company’s management is responsible for maintaining effective internal control over financial reporting and for its assessment of the effectiveness of internal control over financial reporting, included in the accompanying “Item 9A, Management’s Report on Internal Control over Financial Reporting”. Our responsibility is to express an opinion on the Company’s internal control over financial reporting based on our audit. We are a public accounting firm registered with the PCAOB and are required to be independent with respect to the Company in accordance with U.S. federal securities laws and the applicable rules and regulations of the Securities and Exchange Commission and the PCAOB.
We conducted our audit of internal control over financial reporting in accordance with the standards of the PCAOB. Those standards require that we plan and perform the audit to obtain reasonable assurance about whether effective internal control over financial reporting was maintained in all material respects. Our audit included obtaining an understanding of internal control over financial reporting, assessing the risk that a material weakness exists, and testing and evaluating the design and operating effectiveness of internal control based on the assessed risk. Our audit also included performing such other procedures as we considered necessary in the circumstances. We believe that our audit provides a reasonable basis for our opinion.
Definition and Limitations of Internal Control over Financial Reporting
A company’s internal control over financial reporting is a process designed to provide reasonable assurance regarding the reliability of financial reporting and the preparation of financial statements for external purposes in accordance with generally accepted accounting principles. A company’s internal control over financial reporting includes those policies and procedures that (1) pertain to the maintenance of records that, in reasonable detail, accurately and fairly reflect the transactions and dispositions of the assets of the company; (2) provide reasonable assurance that transactions are recorded as necessary to permit preparation of financial statements in accordance with generally accepted accounting principles, and that receipts and expenditures of the company are being made only in accordance with authorizations of management and directors of the company; and (3) provide reasonable assurance regarding prevention or timely detection of unauthorized acquisition, use, or disposition of the company’s assets that could have a material effect on the financial statements.
Because of its inherent limitations, internal control over financial reporting may not prevent or detect misstatements. Also, projections of any evaluation of effectiveness to future periods are subject to the risk that controls may become inadequate because of changes in conditions, or that the degree of compliance with the policies or procedures may deteriorate.
/s/ BDO USA, LLP
San Jose, California
February 24, 2022
ITEM 9B. OTHER INFORMATION
Not applicable.
ITEM 9C. DISCLOSURE REGARDING FOREIGN JURISDICTIONS THAT PREVENT INSPECTIONS.
Not applicable.
Part III
ITEM 10. DIRECTORS, EXECUTIVE OFFICERS AND CORPORATE GOVERNANCE
The information required regarding our directors is incorporated herein by reference from the information contained in the section entitled “Proposal 1—Election of Directors” in our definitive Proxy Statement for the 2022 Annual Meeting of Stockholders (our “Proxy Statement”), a copy of which will be filed with the SEC on or before April 30, 2022.
The information required regarding our executive officers is incorporated herein by reference from the information contained in the section entitled “Management” in our Proxy Statement.
The information required regarding Section 16(a) beneficial ownership reporting compliance is incorporated by reference from the information contained in the section entitled “Section 16(a) Beneficial Ownership Reporting Compliance” in our Proxy Statement.
The information required with respect to procedures by which security holders may recommend nominees to our board of directors, the composition of our Audit Committee, and whether the Company has an “audit committee financial expert”, is incorporated by reference from the information contained in the section entitled “Proposal 1—Election of Directors” in our Proxy Statement.
Adoption of Code of Ethics
We have adopted a Code of Business Conduct and Ethics (the “Code”) applicable to all of our board of director members, employees and executive officers, including our Chief Executive Officer (Principal Executive Officer), and Chief Financial Officer (Principal Financial Officer and Principal Accounting Officer). We have made the Code available on our website at http://www.neophotonics.com.
We intend to satisfy the public disclosure requirements regarding (1) any amendments to the Code, or (2) any waivers under the Code given to our Principal Executive Officer, Principal Financial Officer and Principal Accounting Officer by posting such information on our website at http://www.neophotonics.com. There were no amendments to the Code or waivers granted thereunder relating to the Principal Executive Officer, Principal Financial Officer or Principal Accounting Officer during 2021.
ITEM 11. EXECUTIVE COMPENSATION
The information required regarding the compensation of our directors and executive officers is incorporated herein by reference from the information contained in the sections entitled “Executive Compensation,” “Director Compensation,” “Compensation Committee Report” and “Compensation Committee Interlocks and Insider Participation” in our Proxy Statement.
ITEM 12. SECURITY OWNERSHIP OF CERTAIN BENEFICIAL OWNERS AND MANAGEMENT
The information required regarding security ownership of our 5% or greater stockholders and of our directors and management is incorporated herein by reference from the information contained in the section entitled “Security Ownership of Certain Beneficial Owners and Management” in our Proxy Statement.
The information required regarding securities authorized for issuance our equity compensation plans is incorporated herein by reference from the information contained in the section entitled “Equity Compensation Plan Information” in our Proxy Statement.
ITEM 13. CERTAIN RELATIONSHIPS AND RELATED TRANSACTIONS AND DIRECTOR INDEPENDENCE
The information required regarding related transactions is incorporated herein by reference from the information contained in the section entitled “Certain Relationships and Related Transactions” and, with respect to director independence, the section entitled “Proposal 1—Election of Directors” in our Proxy Statement.
ITEM 14. PRINCIPAL ACCOUNTING FEES AND SERVICES
The information required is incorporated herein by reference from the information contained in the sections entitled “Principal Accountant Fees and Services” and “Pre-Approval Policies and Procedures” in the section entitled “Proposal 2—Ratification of Appointment of Independent Registered Public Accounting Firm” in our Proxy Statement.
PART IV
ITEM 15. EXHIBITS AND FINANCIAL STATEMENT SCHEDULES
We have filed the following documents as part of this Form 10-K:
1. Consolidated Financial Statements:
2. Financial Statement Schedules
All schedules have been omitted because they are not required, not applicable, not present in amounts sufficient to require submission of the schedule, or the required information is otherwise included in the financial statements.
3. Exhibits
| | | | | | | | | | | | | | | | | | | | | | | | | | | | | | | | | | | |
Exhibit
no. | | Description of exhibit | | Form | | SEC File No. | | Exhibit | | Filing Date | Filed Herewith |
| 2.1 | | | | Form 8-K | | 001-35061 | | 2.1 | | November 8, 2021 | |
| 2.2* | | | | Form 8-K | | 001-35061 | | 2.1 | | January 23, 2017 | |
| 2.3* | | | | Form 8-K | | 001-35061 | | 2.2 | | January 23, 2017 | |
| 2.4* | | | | Form 8-K | | 001-35061 | | 2.3 | | January 23, 2017 | |
| 3.1 | | | | Form 8-K | | 001-35061 | | 3.1 | | February 10, 2011 | |
| 3.2 | | | | Form S-1/A | | 333-166096 | | 3.5 | | November 22, 2010 | |
| 4.1 | | | | Form S-1/A | | 333-166096 | | 4.1 | | May 17, 2010 | |
| 4.2 | | | | Form 10-K/A | | 001-35061 | | 4.2 | | March 3, 2020 | |
| 10.1 | | | | Form S-1 | | 333-166096 | | 10.1 | | April 15, 2010 | |
| 10.2+ | | | | Form 8-K | | 001-35061 | | 8.01 | | October 1, 2021 | |
| 10.3+ | | | | Form DEF 14A | | 001-35061 | | | | April 22, 2019 | |
| 10.4+ | | | | Form S-8 | | 333-189577 | | 99.1 | | June 25, 2013 | |
| 10.5+ | | | | Form S-8 | | 333-238938 | | 99.1 | | June 10, 2021 | |
| 10.6+ | | | | Form S-8 | | 333-177306 | | 99.1 | | October 13, 2011 | |
| 10.7+ | | | | Form 8-K | | 001-35061 | | 10.3 | | October 1, 2021 | |
| 10.8 | | | | Form 10-Q | | 001-35061 | | 10.7 | | November 8, 2016 | |
| 10.9 | | | | Form 8-K | | 001-35061 | | 10.1 | | June 19, 2017 | |
| 10.10* | | | | Form 10-Q | | 001-35061 | | 10.4 | | August 3, 2021 | |
| 10.11+ | | | | Form S-1 | | 333-166096 | | 10.17 | | April 15, 2010 | |
| 10.12+ | | | | Form 10-Q | | 001-35061 | | 10.2 | | August 9, 2016 | |
| 10.13+ | | | | Form S-1 | | 333-166096 | | 10.19 | | April 15, 2010 | |
| 10.14+ | | | | Form 10-Q | | 001-35061 | | 10.6 | | August 9, 2016 | |
| | | | | | | | | | | | | | | | | | | | | | | | | | | | | | | | | | | |
Exhibit
no. | | Description of exhibit | | Form | | SEC File No. | | Exhibit | | Filing Date | Filed Herewith |
| 10.15*+ | | | | Form S-1 | | 333-166096 | | 10.20 | | April 15, 2010 | |
| 10.16+ | | | | Form 10-Q | | 001-35061 | | 10.3 | | August 9, 2016 | |
| 10.17+ | | | | Form 10-Q | | 001-35061 | | 10.1 | | November 8, 2017 | |
| 10.18+ | | | | Form 10-Q | | 001-35061 | | 10.2 | | November 8, 2017 | |
| 10.19+ | | | | Form 10-K | | 001-35061 | | 10.74 | | March 9, 2018 | |
| 10.20+ | | | | Form 10-Q | | 001-35061 | | 10.20 | | February 24, 2022 | X |
| 10.21+ | | | | Form 10-Q | | 001-35061 | | 10.21 | | February 24, 2022 | X |
| 10.22** | | | | Form 10-K | | 001-35061 | | 10.43 | | March 16, 2015 | |
| 10.23** | | | | Form 10-Q | | 001-35061 | | 10.2 | | May 9, 2017 | |
| 10.24** | | | | Form 10-K | | 001-35061 | | 10.73 | | March 9, 2018 | |
| 10.25* | | | | Form 8-K | | 001-35061 | | 10.1 | | June 22, 2021 | |
| 10.26* | | | | Form 8-K | | 001-35061 | | 10.2 | | June 22, 2021 | |
| 10.27 | | | | Form 8-K | | 001-35061 | | 10.1 | | July 2, 2021 | |
| 10.28 | | | | Form 8-K | | 001-35061 | | 10.1 | | January 20, 2022 | |
| 10.29 | | | | Form 8-K | | 001-35061 | | 10.2 | | January 20, 2022 | |
| | | | | | | | | | | | | | | | | | | | | | | | | | | | | | | | | | | |
| | | | | | | | | | | |
Exhibit
no. | | Description of exhibit | | Form | | SEC File No. | | Exhibit | | Filing Date | Filed Herewith |
| 21.1 | | | | | | | | | | | X |
| 23.1 | | | | | | | | | | | X |
| 23.2 | | | | | | | | | | | X |
| 24.1 | | | | | | | | | | | X |
| 31.1 | | | | | | | | | | | X |
| 31.2 | | | | | | | | | | | X |
| 32.1 | | | | | | | | | | | X |
Exhibit
no. | | Description of exhibit | | Form | | SEC File No. | | Exhibit | | Filing Date | Filed Herewith |
| 101.INS | | XBRL Instance Document. | | | | | | | | | |
| 101.SCH | | XBRL Taxonomy Extension Schema Document. | | | | | | | | | |
| 101.CAL | | XBRL Taxonomy Extension Calculation Linkbase Document. | | | | | | | | | |
| 101.DEF | | XBRL Taxonomy Extension Definition Linkbase Document. | | | | | | | | | |
| 101.LAB | | XBRL Taxonomy Extension Label Linkbase Document. | | | | | | | | | |
| 101.PRE | | XBRL Taxonomy Extension Presentation Linkbase Document. | | | | | | | | | |
| 104 | | Cover Page Interactive Data File (formatted in Inline XBRL and contained in Exhibit 101) | | | | | | | | | |
______________________________________*Translation to English of an original Chinese document.
**Translation to English of an original Japanese document.
+Management compensatory plan or arrangement.
ITEM 16. FORM 10-K SUMMARY
None.
SIGNATURES
Pursuant to the requirements of Section 13 or 15(d) of the Securities Exchange Act of 1934, the Registrant has duly caused this Annual Report on Form 10-K to be signed on its behalf by the undersigned, thereunto duly authorized.
| | | | | | | | |
| | NeoPhotonics Corporation |
| | | |
| | By: | /S/ TIMOTHY S. JENKS |
| | | Timothy S. Jenks |
| | | President, Chief Executive Officer and |
| | | Chairman of the Board of Directors |
February 24, 2022
POWER OF ATTORNEY
KNOW ALL PERSONS BY THESE PRESENTS, that each person whose signature appears below constitutes and appoints Timothy S. Jenks and Elizabeth Eby, and each of them, jointly and severally, his/her attorneys-in-fact, each with the power of substitution, for him/her in any and all capacities, to sign any and all amendments to this Annual Report on Form 10-K and to file the same, with exhibits thereto and other documents in connection therewith, with the Securities and Exchange Commission, hereby ratifying and confirming all that each of said attorneys-in-fact, or his/her substitute or substitutes, may do or cause to be done by virtue hereof.
Pursuant to the requirements of the Securities Exchange Act of 1934, this report has been signed by the following persons on February 24, 2022 on behalf of the Registrant and in the capacities and on the dates indicated:
| | | | | | | | | | | | | | |
| Signature | | Title | | Date |
| | | | | |
| /s/ TIMOTHY S. JENKS | | President, Chief Executive Officer and | | February 24, 2022 |
| Timothy S. Jenks | | Chairman of the Board of Directors | | |
| | | (Principal Executive Officer) | | |
| | | | | |
| /s/ ELIZABETH EBY | | Senior Vice President, Finance and Chief | | February 24, 2022 |
| Elizabeth Eby | | Financial Officer (Principal Financial and | | |
| | Accounting Officer) | | |
| | | | | |
| /s/ CHARLES J. ABBE | | Director | | February 24, 2022 |
| Charles J. Abbe | | | | |
| | | | | |
| /s/ BANDEL L. CARANO | | Director | | February 24, 2022 |
| Bandel L. Carano | | | | |
| | | | | |
| /s/ KIMBERLY Y. CHAINEY | | Director | | February 24, 2022 |
| Kimberly Y. Chainey | | | | |
| | | | | |
| /s/ YANBING LI | | Director | | February 24, 2022 |
| Yanbing Li | | | | |
| | | | | |
| /s/ RAJIV RAMASWAMI | | Director | | February 24, 2022 |
| Rajiv Ramaswami | | | | |
| | | | | |
| /s/ SHERI L. SAVAGE | | Director | | February 24, 2022 |
| Sheri L. Savage | | | | |
| | | | |
| /s/ MICHAEL J. SOPHIE | | Director | | February 24, 2022 |
| Michael J. Sophie | | | | |
| | | | |
| /s/ IHAB S. TARAZI | | Director | | February 24, 2022 |
| Ihab S. Tarazi | | | | |