UNITED STATES
SECURITIES AND EXCHANGE COMMISSION
Washington, D.C. 20549
FORM N-CSR
CERTIFIED SHAREHOLDER REPORT OF REGISTERED
MANAGEMENT INVESTMENT COMPANIES
Investment Company Act file number: 811-21331
Allspring Multi-Sector Income Fund
(Exact name of registrant as specified in charter)
525 Market St., San Francisco, CA 94105
(Address of principal executive offices) (Zip code)
Matthew Prasse
Allspring Funds Management, LLC
525 Market St., San Francisco, CA 94105
(Name and address of agent for service)
Registrant’s telephone number, including area code: 800-222-8222
|
| Date of fiscal year end: October 31 |
| Date of reporting period: October 31, 2021 |
| ITEM 1. | REPORT TO STOCKHOLDERS |
Annual Report
October 31, 2021
Allspring
Multi-Sector Income Fund (ERC)
The views expressed and any forward-looking statements are as of October 31, 2021, unless otherwise noted, and are those of the Fund's portfolio managers and/or Allspring Global Investments. Discussions of individual securities or the markets generally are not intended as individual recommendations. Future events or results may vary significantly from those expressed in any forward-looking statements. The views expressed are subject to change at any time in response to changing circumstances in the market. Allspring Global Investments disclaims any obligation to publicly update or revise any views expressed or forward-looking statements.
Allspring Multi-Sector Income Fund | 1
Letter to shareholders (unaudited)
Andrew Owen
President
Allspring Funds
Dear Shareholder:
We are pleased to offer you this annual report for the Allspring Multi-Sector Income Fund for the 12-month period that ended October 31, 2021. Global stocks continued to rally as the global economy continued to emerge from the haze of COVID-19. Tailwinds were provided by global stimulus programs, a rapid vaccination rollout, and recovering consumer and corporate sentiment. The bond market had mostly positive returns during the period.
For the 12-month period, equities had robust returns, as policymakers continued to fight the effects of COVID-19. U.S. stocks led both non-U.S. developed market equities and emerging market stocks. Gains by fixed-income securities were varied, though mostly positive. For the period, U.S. stocks, based on the S&P 500 Index,1 gained 42.91%. International stocks, as measured by the MSCI ACWI ex USA Index (Net),2 returned 29.66%, while the MSCI EM Index (Net) (USD),3 had a weaker performance, with a 16.96% gain. Among bond indexes, the Bloomberg U.S. Aggregate Bond Index,4 returned -0.48%, the Bloomberg Global Aggregate ex-USD Index (unhedged),5 returned -1.99%, and the Bloomberg Municipal Bond Index,6 gained 2.64%, and the ICE BofA U.S. High Yield Index,7 returned 10.74%.
Efforts to contain COVID-19 drove market performance.
Global stocks rallied in November 2020, propelled by optimism over three promising COVID-19 vaccines. Reversing trends recent to November 2020, value stocks outperformed growth stocks and cyclical stocks outpaced information technology (IT) stocks. However, U.S. unemployment remained elevated, with a net job loss of 10 million since February 2020. The eurozone services Purchasing Managers' Index, a monthly survey of purchasing managers, contracted sharply while the region’s manufacturing activity grew. The U.S. election results added to the upbeat mood as investors anticipated more consistent policies in the new administration.
Financial markets ended 2020 with strength on high expectations for a rapid rollout of the COVID-19 vaccines, the successful passage of a $900 billion stimulus package, and rising expectations of additional economic support from a Democratic-led Congress. U.S. economic data were mixed with still-elevated unemployment and weak retail sales but growth in manufacturing output. In contrast, China’s economic expansion continued in both manufacturing and nonmanufacturing. U.S. COVID-19 infection rates continued to rise even as new state and local lockdown measures were implemented.
The year 2021 began with emerging market stocks leading all major asset classes in January, driven by China’s strong economic growth and a broad recovery in corporate earnings, which propelled China’s stock market higher. In the U.S., positive news on vaccine trials and January expansion in both the manufacturing and services sectors were offset by a weak December monthly jobs report. This was compounded by technical factors as some hedge funds were forced to sell stocks to protect themselves against a well-publicized short squeeze coordinated by a group of retail investors. Eurozone sentiment and economic growth were particularly weak, reflecting the impact of a new lockdown with stricter social distancing along with a slow vaccine rollout.
| 1 | The S&P 500 Index consists of 500 stocks chosen for market size, liquidity, and industry group representation. It is a market-value-weighted index with each stock's weight in the index proportionate to its market value. You cannot invest directly in an index. |
| 2 | The Morgan Stanley Capital International (MSCI) All Country World Index (ACWI) ex USA Index (Net) is a free-float-adjusted market-capitalization-weighted index that is designed to measure the equity market performance of developed and emerging markets, excluding the U.S. Source: MSCI. MSCI makes no express or implied warranties or representations and shall have no liability whatsoever with respect to any MSCI data contained herein. The MSCI data may not be further redistributed or used as a basis for other indices or any securities or financial products. This report is not approved, reviewed, or produced by MSCI. You cannot invest directly in an index. |
| 3 | The MSCI Emerging Markets (EM) Index (Net) (USD) is a free-float-adjusted market-capitalization-weighted index that is designed to measure equity market performance of emerging markets. You cannot invest directly in an index. |
| 4 | The Bloomberg U.S. Aggregate Bond Index is a broad-based benchmark that measures the investment-grade, U.S.-dollar-denominated, fixed-rate taxable bond market, including Treasuries, government-related and corporate securities, mortgage-backed securities (agency fixed-rate and hybrid adjustable-rate mortgage pass-throughs), asset-backed securities, and commercial mortgage-backed securities. You cannot invest directly in an index. |
| 5 | The Bloomberg Global Aggregate ex-USD Index (unhedged) is an unmanaged index that provides a broad-based measure of the global investment-grade fixed-income markets excluding the U.S.-dollar-denominated debt market. You cannot invest directly in an index. |
| 6 | The Bloomberg Municipal Bond Index is an unmanaged index composed of long-term tax-exempt bonds with a minimum credit rating of Baa. You cannot invest directly in an index. |
| 7 | The ICE BofA U.S. High Yield Index is a market-capitalization-weighted index of domestic and Yankee high-yield bonds. The index tracks the performance of high-yield securities traded in the U.S. bond market. You cannot invest directly in an index. Copyright 2021. ICE Data Indices, LLC. All rights reserved. |
2 | Allspring Multi-Sector Income Fund
Letter to shareholders (unaudited)
February saw major domestic equity indexes driven higher on the hope of a new stimulus bill, improving COVID-19 vaccination numbers, and the gradual reopening of the economy. Most S&P 500 companies reported better-than-expected earnings, with positive surprises coming from the financials, IT, health care, and materials sectors. Japan saw its economy strengthen as a result of strong export numbers. Meanwhile, crude oil prices continued their climb, rising more than 25% for the year. Domestic government bonds experienced a sharp sell-off in late February as markets priced in a more robust economic recovery and higher future growth and inflation expectations.
The passage of the massive domestic stimulus bill highlighted March activity, leading to increased forecasts for U.S. growth in 2021. Domestic employment surged as COVID-19 vaccinations and an increasingly open economy spurred hiring. A majority of U.S. small companies reported they were operating at pre-pandemic capacity or higher. Value stocks continued their outperformance of growth stocks in the month, continuing the trend that started in late 2020. Meanwhile, most major developed global equity indexes are up month to date on the back of rising optimism regarding the outlook for global growth. While the U.S. and the U.K. have been the most successful in terms of the vaccine rollout, even in markets where the vaccine has lagged, such as in the eurozone and Japan, equity indexes in many of those countries have also been in positive territory for the year through March 2021.
Equity markets produced another strong showing in April. Domestically, the continued reopening of the economy had a strong impact on positive equity performance, as people started leaving their households and jobless claims continued to fall. Domestic corporate bonds performed well and the U.S. dollar weakened. Meanwhile, the U.S. government continued to seek to invest in the recovery, this time by outlining a package of over $2 trillion to improve infrastructure. The primary headwind in April was inflation, as investors tried to determine the breadth and longevity of recent price increases. Developed Europe has been supported by a meaningful increase in the pace of vaccinations. Unfortunately many emerging market countries have not been as successful. India in particular saw COVID-19 cases surge, serving as an example of the need to get vaccinations rolled out to less developed nations.
Vaccine rollouts continued in May, leading to loosened restrictions globally. As a result, equity markets in general saw a minor increase in returns. Concerns that the continued economic rebound could result in inflation increases becoming more than transitory were supported by the higher input costs businesses were experiencing. Meanwhile, those inflation concerns were tempered by the U.S. Federal Reserve (Fed), which stayed steady on its view of the economy and eased fears of a sudden and substantial policy change. Positive performance in the emerging market equity space was supported this month by steady consumer demand and strong commodity prices. Fixed-income markets were also slightly positive for the month, driven by inflation uncertainty and a softer U.S. dollar.
June witnessed the S&P 500 Index reach a new all-time high. 2021 economic growth and inflation forecasts were revised higher to reflect a strong economic recovery and some supply and demand imbalances. Late June saw a deal reached on a U.S. infrastructure package of approximately $1 trillion for road, bridge, and broadband network upgrades over the next eight years. The Fed’s June meeting yielded no change to policy, but its projections pointed to a possible interest rate rise in 2023. This, combined with a rebound in economic activity and investors searching for yield, led to U.S. Treasury yields being down for the month. Many European and Asian countries saw vaccination momentum increase, while the U.K. dealt with a rise in COVID-19 infections, specifically the Delta variant. Meanwhile, crude oil jumped over 10% in June on the back of the pickup in global economic activity and Organization of the Petroleum Exporting Countries’ (OPEC) slow pace of supply growth.
July began the month seeing vaccinations making progress, as several major developed countries eased restrictions, only to be threatened again by the spread of COVID-19’s Delta variant. Inflation continued to climb, aided by the continued supply bottleneck in the face of high demand. As it pertains to the equity area of the market, U.S. equities led the way in positive return territory followed by international developed markets. In contrast, emerging markets were well in negative territory for the month, hindered by China’s plans for new regulations on a number of sectors, specifically education and technology. The U.S. 10-year Treasury bond yield continued to decline, as strong demand swallowed up supply. After hitting a multiyear high earlier in the month, oil prices leveled off following an agreement by OPEC to raise oil production starting in August.
“ 2021 economic growth and inflation forecasts were revised higher to reflect a strong economic recovery and some supply and demand imbalances.”
Allspring Multi-Sector Income Fund | 3
Letter to shareholders (unaudited)
“ Municipal debt experienced its first monthly performance drop since February of this year, slowing a rally that made it one of the best-performing sectors of the bond market.” |
The Delta variant of COVID-19 produced outbreaks globally in August, increasing the potential for increased market volatility and bringing into question the ongoing economic recovery. Domestically, the U.S. economy continued to stay strong in the face of the Delta variant, continued inflationary pressures, and worries over Hurricane Ida. Emerging market equities experienced elevated volatility, largely influenced by China’s regulatory stance. Emerging market equities started the month with poor performance but rebounded to end the month in positive territory. Municipal debt experienced its first monthly performance drop since February of this year, slowing a rally that made it one of the best-performing sectors of the bond market. In the commodity segment of the market, crude oil fell sharply during the month on the back of dampened expectations as a result of the Delta variant but was still a leading asset-class performer for the year.
Global markets suffered their broadest retreat in a year during September, with the exception of commodities. Concerns over inflation and the interest rate outlook depressed investor confidence and hurt performance. Emerging markets declined on concerns over the continued supply chain disruptions and worries over higher energy and food prices. Meanwhile, the Fed indicated it would slow the pace of asset purchases in the near future. All eyes domestically were fixed on the raising of the debt ceiling, the 2022 budget plan, and the ongoing debate over the infrastructure package. Contrary to most asset classes, commodities thrived in September, driven by sharply higher energy prices.
October’s key themes continued to be elevated inflation pressures and a supply bottleneck, but strong earnings provided a bright spot in the markets. Earnings releases in the U.S. were generally strong and consumer confidence was high. The Fed reaffirmed its plans to taper quantitative easing to a stop by mid-2022. Meanwhile, elevated inflation figures are still being considered transitory by the Fed. Similar to the U.S., the eurozone and many Asian countries saw positive earnings but were facing inflation pressures caused by supply bottlenecks while also experiencing energy price increases amid natural gas shortages. Globally, government bond yields rose as central banks prepared to lower monetary policy accommodation in the face of rising inflationary pressures. As previously referenced, positive commodity performance was driven by sharply higher energy costs.
Don’t let short-term uncertainty derail long-term investment goals.
Periods of investment uncertainty can present challenges, but experience has taught us that maintaining long-term investment goals can be an effective way to plan for the future. Although diversification cannot guarantee an investment profit or prevent losses, we believe it can be an effective way to manage investment risk and potentially smooth out overall portfolio performance. We encourage investors to know their investments and to understand that appropriate levels of risk-taking may unlock opportunities.
Information on transaction closing.
On November 1, 2021, GTCR LLC and Reverence Capital Partners, L.P., announced the beginning of Allspring Global Investments™, with the close of the transaction to acquire Wells Fargo Funds Management, LLC; Wells Capital Management, LLC; Galliard Capital Management, LLC.; Wells Fargo Asset Management (International) Ltd.; Wells Fargo Asset Management Luxembourg S.A.; and Wells Fargo Funds Distributor, LLC, as well as Wells Fargo Bank, N.A.’s business of acting as trustee to its collective investment trusts and all related Wells Fargo Asset Management legal entities. The transaction closed on November 1, 2021, forming Allspring Global Investments, a privately held asset management firm with $587 billion in AUM1 as of September 30, 2021.
Allspring Global Investments™ is a leading independent asset management firm with a full breadth of investment capabilities across diverse asset classes, serving the needs of its institutional and wealth management clients around the world. Allspring operates across 18 offices globally supported by more than 480 investment professionals. Allspring and its investment teams provide a broad range of differentiated investment products and solutions to help its diverse range of clients meet their investment objectives.
As part of this transition, all mutual funds and closed-end funds within the Wells Fargo Funds family were rebranded as Allspring Funds. Each individual fund had “Wells Fargo” removed from its fund name and replaced with “Allspring.” The fund name changes went into effect on December 6, 2021.
| 1 | As of September 30, 2021, assets under management (AUM) includes $93 billion from Galliard Capital Management, LLC, an investment advisor that is not part of the Allspring trade name/GIPS firm. |
4 | Allspring Multi-Sector Income Fund
Letter to shareholders (unaudited)
Allspring Global Investments is the trade name for the asset management firms of Allspring Global Investments Holdings, LLC, a holding company indirectly owned by certain private funds of GTCR LLC and Reverence Capital Partners, L.P.
Thank you for choosing to invest with Allspring Funds. We appreciate your confidence in us and remain committed to helping you meet your financial needs.
Sincerely,
Andrew Owen
President
Allspring Funds
For further information about your Fund, contact your investment professional, visit our website at allspringglobal.com, or call us directly at 1-800-222-8222.
Allspring Multi-Sector Income Fund | 5
Letter to shareholders (unaudited)
Notice to Shareholders
| ■ | On November 12, 2021, the Fund announced a renewal of its open-market share repurchase program (the “Buyback Program”). Under the renewed Buyback Program, the Fund may repurchase up to 10% of its outstanding shares in open market transactions during the period beginning on January 1, 2022 and ending on December 31, 2022. The Fund’s Board of Trustees has delegated to Allspring Funds Management, LLC, the Fund’s adviser, discretion to administer the Buyback Program, including the determination of the amount and timing of repurchases in accordance with the best interests of the Fund and subject to applicable legal limitations. |
| ■ | The Fund’s managed distribution plan provides for the declaration of monthly distributions to common shareholders of the Fund at an annual minimum fixed rate of 9% based on the Fund’s average monthly net asset value per share over the prior 12 months. Under the managed distribution plan, monthly distributions may be sourced from income, paid-in capital, and/or capital gains, if any. To the extent that sufficient investment income is not available on a monthly basis, the Fund may distribute paid-in capital and/or capital gains, if any, in order to maintain its managed distribution level. You should not draw any conclusions about the Fund’s investment performance from the amount of the Fund’s distributions or from the terms of the managed distribution plan. Shareholders may elect to reinvest distributions received pursuant to the managed distribution plan in the Fund under the existing dividend reinvestment plan, which is described later in this report. |
6 | Allspring Multi-Sector Income Fund
This page is intentionally left blank.
Performance highlights (unaudited)
| Investment objective | The Fund seeks a high level of current income consistent with limiting its overall exposure to domestic interest rate risk. |
| Strategy summary | The Fund allocates its assets between three separate investment strategies, or sleeves. Under normal market conditions, the Fund allocates approximately 30%-70% of its total assets to a sleeve consisting of below investment-grade (high yield) debt; approximately 10%-40% to a sleeve of foreign debt securities, including emerging market debt; and approximately 10%-30% to a sleeve of adjustable-rate and fixed-rate mortgage backed securities, and investment-grade corporate bonds. |
| Adviser | Allspring Funds Management, LLC |
| Subadvisers | Allspring Global Investments, LLC |
| | Allspring Global Investments (UK) Limited |
| Portfolio managers | Christopher Y. Kauffman, CFA®‡, Chris Lee, CFA®‡, Michael Lee, Alex Perrin, Michael J. Schueller, CFA®‡, Lauren van Biljon, CFA®‡, Peter Wilson, Noah Wise, CFA®‡ |
| Average annual total returns (%) as of October 31, 20211 |
| | 1 year | 5 year | 10 year |
| Based on market value | 34.28 | 11.31 | 8.21 |
| Based on net asset value (NAV) | 13.09 | 7.28 | 6.75 |
| Multi-Sector Income Blended Index2 | 6.32 | 4.79 | 4.71 |
| Bloomberg U.S. Credit Bond Index3 | 1.90 | 4.60 | 4.47 |
| Bloomberg U.S. Securitized Index4 | (0.48) | 2.27 | 2.47 |
| ICE BofA U.S. High Yield Constrained Index5 | 10.75 | 6.23 | 6.65 |
| J.P. Morgan GBI-EM Global Diversified Composite Index6 | 0.84 | 1.96 | 0.37 |
| J.P. Morgan Global Government Bond Index (ex U.S.)7 | (4.41) | 1.50 | 0.30 |
Figures quoted represent past performance, which is no guarantee of future results, and do not reflect taxes that a shareholder may pay on an investment in a fund. Investment return and principal value of an investment will fluctuate so that an investor’s shares, when sold, may be worth more or less than their original cost. Current performance may be lower or higher than the performance data quoted, which assumes the reinvestment of dividends and capital gains. Performance figures of the Fund do not reflect brokerage commissions that a shareholder would pay on the purchase and sale of shares. If taxes and such brokerage commissions had been reflected, performance would have been lower. To obtain performance information current to the most recent month-end, please call 1-800-222-8222.
The Fund’s expense ratio for the year ended October 31, 2021, was 1.19% which includes 0.32% of interest expense.
| 1 | Total returns based on market value are calculated assuming a purchase of common stock on the first day and a sale on the last day of the period reported. Total returns based on NAV are calculated based on the NAV at the beginning of the period and at the end of the period. Dividends and distributions, if any, are assumed for the purposes of these calculations to be reinvested at prices obtained under the Fund’s Automatic Dividend Reinvestment Plan. |
| 2 | Source: Allspring Funds Management, LLC. The Multi-Sector Income Blended Index is composed of 60% ICE BofA U.S. High Yield Constrained Index, 18% J.P. Morgan GBI-EM Global Diversified Composite Index, 7.5% Bloomberg U.S. Credit Bond Index, 7.5% Bloomberg U.S. Securitized Index, and 7% J.P. Morgan Global Government Bond Index (ex U.S.). You cannot invest directly in an index. |
| 3 | The Bloomberg U.S. Credit Bond Index is an unmanaged index of fixed income securities composed of securities from the Bloomberg Government/Corporate Bond Index, Mortgage-Backed Securities Index, and the Asset-Backed Securities Index. You cannot invest directly in an index. |
| 4 | The Bloomberg U.S. Securitized Index is an unmanaged composite of asset-backed securities, collateralized mortgage-backed securities (ERISA eligible), and fixed-rate mortgage-backed securities. You cannot invest directly in an index. |
| 5 | The ICE BofA U.S. High Yield Constrained Index is a market-value-weighted index of all domestic and Yankee high-yield bonds, including deferred interest bonds and payment-in-kind securities. Issues included in the index have maturities of one year or more and have a credit rating lower than BBB-/Baa3 but are not in default. The ICE BofA U.S. High Yield Constrained Index limits any individual issuer to a maximum of 2% benchmark exposure. You cannot invest directly in an index. Copyright 2021. ICE Data Indices, LLC. All rights reserved. |
| 6 | The J.P. Morgan GBI-EM Global Diversified Composite Index is an unmanaged index of debt instruments of 31 emerging countries. You cannot invest directly in an index. |
| 7 | The J.P. Morgan Global Government Bond Index (ex U.S.) measures the total return from investing in 12 developed government bond markets: Australia, Belgium, Canada, Denmark, France, Germany, Italy, Japan, the Netherlands, Spain, Sweden, and the U.K. You cannot invest directly in an index. |
| ‡ | CFA® and Chartered Financial Analyst® are trademarks owned by CFA Institute. |
8 | Allspring Multi-Sector Income Fund
Performance highlights (unaudited)
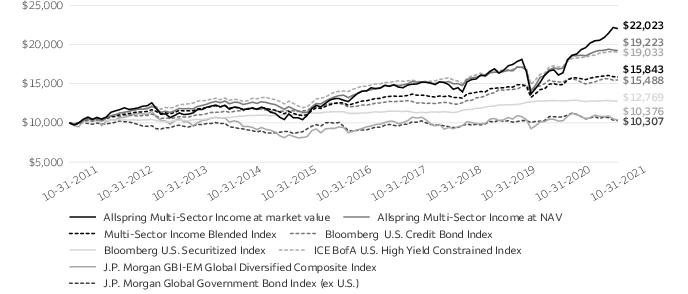
| Growth of $10,000 investment as of October 31, 20211 |
| 1 | The chart compares the performance of the Fund for the most recent ten years with the Multi-Sector Income Blended Index, Bloomberg U.S. Credit Bond Index, Bloomberg U.S. Securitized Index, ICE BofA U.S. High Yield Constrained Index, J.P. Morgan GBI-EM Global Diversified Composite Index and J.P. Morgan Global Government Bond Index (ex U.S.). The chart assumes a hypothetical investment of $10,000 investment and reflects all operating expenses of the Fund. |
| Comparison of NAV vs. market value1 |
| 1 | This chart does not reflect any brokerage commissions charged on the purchase and sale of the Fund’s common stock. Dividends and distributions paid by the Fund are included in the Fund’s average annual total returns but have the effect of reducing the Fund’s NAV. |
More detailed information about the Fund’s investment objective, principal investment strategies and the principal risks associated with investing in the Fund can be found on page 14.
Allspring Multi-Sector Income Fund | 9
Performance highlights (unaudited)
Risk summary
This closed-end fund is no longer available as an initial public offering and is only offered through broker-dealers on the secondary market. A closed-end fund is not required to buy its shares back from investors upon request. Shares of the Fund may trade at either a premium or discount relative to the Fund’s net asset value, and there can be no assurance that any discount will decrease. The values of, and/or the income generated by, securities held by the Fund may decline due to general market conditions or other factors, including those directly involving the issuers of such securities. Debt securities are subject to credit risk and interest rate risk, and high yield securities and unrated securities of similar credit quality have a much greater risk of default and their values tend to be more volatile than higher-rated securities with similar maturities. Foreign investments may contain more risk due to the inherent risks associated with changing political climates, foreign market instability, and foreign currency fluctuations. Risks of foreign investing are magnified in emerging or developing markets. The Fund is exposed to mortgage- and asset-backed securities risk. The Fund is leveraged through a revolving credit facility and also may incur leverage by issuing preferred shares in the future. The use of leverage results in certain risks, including, among others, the likelihood of greater volatility of the net asset value and the market value of common shares. Derivatives involve additional risks, including interest rate risk, credit risk, the risk of improper valuation, and the risk of non-correlation to the relevant instruments that they are designed to hedge or closely track.
10 | Allspring Multi-Sector Income Fund
Performance highlights (unaudited)
MANAGERS' DISCUSSION
Overview
The Fund’s return based on market value was 34.28% for the 12-month period that ended October 31, 2021. During the same period, the Fund’s return based on its net asset value (NAV) was 13.09%. Based on both its market value and its NAV return, the Fund outperformed the Multi-Sector Income Blended Index, which return 6.32% for the 12-month period that ended October 31, 2021.
Strategy
For the 12-month period that ended October 31, 2021, risk assets continued to rally in response to improving economic conditions, with spreads in investment-grade corporate and securitized sectors tightening on average 37 basis points (bps; 100 bps equal 1.00%) and 29 bps, respectively. Lower-rated and more credit-sensitive bonds significantly outperformed higher-rated securities. Similarly, BBB-rated commercial mortgage-backed securities (CMBS) spreads compressed 586 bps while AAA-rated CMBS tightened only 33 bps. Improving fundamentals, especially in the retail and hospitality sectors, benefited sectors that had materially underperformed early last year as a result of the pandemic.
Reflation and reopening has been a key investment theme over the past 12 months. Broad economic reflation affected the high-yield market in 3 main ways: rising U.S. Treasury yields, a 134% increase in the price of oil, and the recovery in valuations in COVID-19-affected sectors. To capitalize, we increased the average spread in our floating-rate loans, reduced rate-sensitive bonds, optimized our energy overweight, and applied a bottom-up approach to selecting COVID-19-affected securities.
| Ten largest holdings (%) as of October 31, 20211 |
| Mexico, 8.50%, 5-31-2029 | 3.04 |
| India, 7.32%, 1-28-2024 | 2.82 |
| Indonesia, 7.00%, 9-15-2030 | 2.42 |
| Colombia, 7.50%, 8-26-2026 | 1.73 |
| Romania, 3.25%, 4-29-2024 | 1.53 |
| Russia, 6.50%, 2-28-2024 | 1.50 |
| Russia, 6.90%, 5-23-2029 | 1.49 |
| Romania, 5.00%, 2-12-2029 | 1.33 |
| Russia, 7.65%, 4-10-2030 | 1.27 |
| Malaysia, 4.23%, 6-30-2031 | 1.21 |
| 1 | Figures represent the percentage of the Fund's net assets. Holdings are subject to change and may have changed since the date specified. |
Growth, inflation, and political risk have been the key drivers of emerging-market bonds and currencies over the reporting period. Investors have oscillated between worrying about inflation and worrying about growth, prompting yields to rise and fall depending on which narrative had the upper hand at the time. The marked sovereign underperformers have been those struggling with domestic political upheaval—Chile, Peru, and Turkey—but it’s worth noting that overall geopolitical risk remains elevated. In general, bond yields are higher and yield curves are steeper than they were a year ago.
Exposure to Eastern Europe was reduced over the reporting period through the sale of part of the position in Romania. The lowest-yielding of the emerging market regions, Eastern Europe, has been screening as expensive given underlying inflation dynamics and central bank reluctance to take action. Exposure to Malaysia was reduced after a period of good performance. These sales allowed additional exposure to higher-yielding Brazil and a new position in Chinese government bonds. We have adjusted duration in individual markets as opportunities presented themselves, but we have been careful to keep overall Fund duration fairly modest.
| Credit quality as of October 31, 20211 |
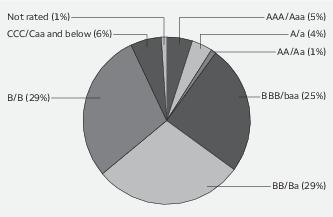
| 1 | The credit quality distribution of portfolio holdings reflected in the chart is based on ratings from Standard & Poor’s, Moody’s Investors Service, and/or Fitch Ratings Ltd. Credit quality ratings apply to the underlying holdings of the Fund and not to the Fund itself. The percentages of the portfolio with the ratings depicted in the chart are calculated based on the market value of fixed income securities held by the Fund. If a security was rated by all three rating agencies, the middle rating was utilized. If rated by two of the three rating agencies, the lower rating was utilized, and if rated by one of the rating agencies, that rating was utilized. Standard & Poor’s rates the creditworthiness of bonds, ranging from AAA (highest) to D (lowest). Ratings from A to CCC may be modified by the addition of a plus (+) or minus (-) sign to show relative standing within the rating categories. Standard & Poor’s rates the creditworthiness of short-term notes from SP-1 (highest) to SP-3 (lowest). Moody’s rates the creditworthiness of bonds, ranging from Aaa (highest) to C (lowest). Ratings Aa to B may be modified by the addition of a number 1 (highest) to 3 (lowest) to show relative standing within the ratings categories. Moody’s rates the creditworthiness of short-term U.S. tax-exempt municipal securities from MIG 1/VMIG 1 (highest) to SG (lowest). Fitch rates the creditworthiness of bonds, ranging from AAA (highest) to D (lowest). Credit quality distribution is subject to change and may have changed since the date specified. |
Allspring Multi-Sector Income Fund | 11
Performance highlights (unaudited)
Contributors
Within securitized sectors, out-of-benchmark positioning in mezzanine CMBS was the largest contributor, followed by holdings in subordinate non-agency mortgage-backed securities (MBS). In corporate sectors, the primary contributor was an overweight to BBB-rated bonds.
Reorganized energy equities with depressed valuations and low dollar-price fallen angel bonds were the best ways to capitalize on broad economic reflation within the high-yield market. The portfolio’s top-performing investment was an equity position in Denbury Resources, Incorporated, a long-time high-yield issuer whose set of conventional oil-producing assets positions it to capture carbon that’s a by-product of industrial production and use that carbon to enhance oil recoveries from generations-old wells, thus producing carbon-neutral oil. Bond positions in Baytex Energy, Occidental Petroleum Corp., and EnLink Midstream and equity positions in Bristow Group Incorporated and Whiting Petroleum Corporation were also top performers.
The vaccine rollout led to the normalization of inverted credit curves (near-term maturities trading at higher yields than longer ones). The portfolio built an overweight position in the leisure, airlines, and transportation sectors to take advantage. The Fund's use of leverage had a positive impact on total return performance during this reporting period.
Detractors
Within securitized sectors, the Fund’s allocation to agency MBS was a small detractor. Within corporate sectors, security selection in the industrials sector was a modest detractor.
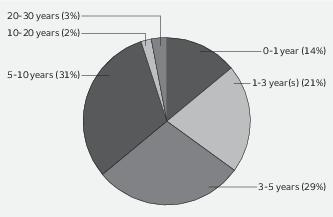
| Effective maturity distribution as of October 31, 20211 |
| 1 | Figures represent the percentage of the Fund’s fixed-income securities. These amounts are subject to change and may have changed since the date specified. |
Lack of positions in Transocean Limited, AMC Entertainment Holdings, The Kraft Heinz Company, and PBF Holding Company LLC also dampened performance relative to the ICE BofA U.S. High Yield Constrained Index.
The positions in Romania—bonds and currency—detracted. The Brazilian bond market struggled in the latter stages of the reporting period as inflation quickened, while the Indian rupee was modestly weaker versus the U.S. dollar.
Outlook
We continuously review market conditions, relative valuations, and technical factors over a six-month time frame, asking ourselves whether we think conditions will improve or deteriorate over the next few quarters. Ultimately, the goal of this focus is to foster an unbiased approach in evaluating the conditions we expect over the coming months and to inform our decisions. We believe that a process built to stay closely attuned to changing market conditions will benefit investors over the economic cycle.
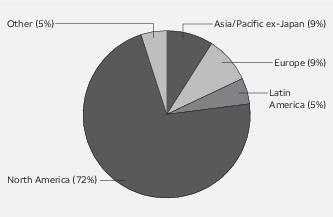
| Geographic allocation as of October 31, 20211 |
| 1 | Figures represent the percentage of the Fund's long-term investments. These amounts are subject to change and may have changed since the date specified. |
We are neutral on corporate credit given current valuations. We continue to favor financials over industrials given the former’s favorable fundamentals and the latter’s higher leverage levels. Lower event risk in the financial space is also preferred. While we continue to like BBB-rated bonds, we are looking for opportunities to implement a more barbelled strategy (where approximately half of the fixed-income holdings are short-term instruments while the other half are long-term instruments), holding A-rated and BB-rated bonds where possible.
Approximately 57% of the mortgage/corporate sleeve’s exposure is in corporate credit and around 41% is in fixed-rate and floating-rate mortgage securities. The largest industry exposures in the credit sector include insurance, energy, banking, and technology companies.
Just as the height of monetary policy support is behind us, so, too, is the majority of systemic spread compression. Looking forward, we expect tight spreads, more aggressive issuance, and the expectation for rate increases to be potential sources of volatility in high yield. Ultimately, we believe that generating attractive risk-adjusted carry and successfully navigating idiosyncratic credit risk will be paramount to generating outperformance.
12 | Allspring Multi-Sector Income Fund
Performance highlights (unaudited)
Emerging markets are in an interesting place, with higher inflation and the pivot to tighter monetary policy contrasting with the continued rebound in economic growth and commodity prices. Duration is not yet attractive, but 2022 could present an opportunity for longer-dated emerging market securities to outperform. There is some anxiety around what the end of quantitative easing in core developed markets means for emerging markets, but we’re encouraged by the proactive measures taken by central banks (particularly central banks of higher-yielders).
Allspring Multi-Sector Income Fund | 13
Objective, strategies and risks (unaudited)
Investment objective
The Fund seeks to provide a high level of current income consistent with limiting its overall exposure to domestic interest rate risk. The Fund’s investment objective is a fundamental policy and may not be changed without the approval of a majority of the outstanding voting securities (as defined in the Investment Company Act of 1940, as amended, (the “1940 Act”) of the Fund.
Principal investment strategies
The Fund allocates its assets between three separate investment strategies, or sleeves.
High Yield Bond Sleeve. Under normal market conditions, the Fund allocates approximately 30%-70% of its total assets to a sleeve with an investment strategy that focuses on U.S. dollar-denominated below investment-grade bonds, debentures, and other income obligations, including loans and preferred stocks (often called “high yield” securities or “junk bonds”). We may invest in below investment-grade debt securities of any credit quality, however, we may not purchase securities rated CCC or below if 20% of the sleeve’s assets are already held with such a rating. We are not required to sell securities rated CCC or below if the 20% limit is exceeded due to security downgrades. Securities in the Fund’s high yield bond sleeve may be issued by domestic or foreign issuers (including foreign governments).
For purposes of the sleeve’s credit quality policies, if a security receives different ratings from nationally recognized securities rating organizations, the sleeve will use the rating that the portfolio managers believe is most representative of the security’s credit quality. The sleeve’s high yield securities may have fixed or variable principal payments and all types of interest rate and dividend payment and reset terms, including fixed rate, adjustable rate, contingent, deferred, payment in kind and auction rate features. The sleeve may invest in securities with a broad range of maturities.
The Fund’s high yield sleeve is managed following a rigorous investment process that emphasizes both quality and value. The research driven approach includes both a top-down review of macroeconomic factors and intensive, bottom-up scrutiny of individual securities. We consider both broad economic and issuer specific factors in selecting securities for the high yield sleeve. In assessing the appropriate maturity and duration for the Fund’s high yield sleeve and the credit quality parameters and weighting objectives for each sector and industry in this portion of the Fund’s portfolio, we consider a variety of factors that are expected to influence the economic environment and the dynamics of the high yield market. These factors include fundamental economic indicators, such as interest rate trends, the rates of economic growth and inflation, the performance of equity markets, commodities prices, Federal Reserve monetary policy and the relative value of the U.S. dollar compared to other currencies. Once we determine the preferable portfolio characteristics, we conduct further evaluation to determine capacity and inventory levels in each targeted industry. We also identify any circumstances that may lead to improved business conditions, thus increasing the attractiveness of a particular industry. We select individual securities based upon the terms of the securities (such as yields compared to U.S. Treasuries or comparable issues), liquidity and rating, sector and issuer diversification. We also employ due diligence and fundamental research to assess an issuer’s credit quality, taking into account financial condition and profitability, future capital needs, potential for change in rating, industry outlook, the competitive environment and management ability.
The analysis of issuers may include, among other things, historic and current financial conditions, current and anticipated cash flow and borrowing requirements, value of assets in relation to historical costs, strength of management, responsiveness to business conditions, credit standing, the company’s leverage versus industry norms and current and anticipated results of operations. While we consider as one factor in our credit analysis the ratings assigned by the rating services, we perform our own independent credit analysis of issuers.
In making decisions for the high yield sleeve, we rely on the knowledge, experience and judgment of our team who have access to a wide variety of research. We apply a strict sell discipline, which is as important as purchase criteria in determining the performance of this portion of this portfolio. We routinely meet to review profitability outlooks and discuss any deteriorating business fundamentals, as well as consider changes in equity valuations and market perceptions before selling securities.
In other than normal market conditions, when changing economic conditions and other factors cause the yield difference between lower rated and higher rated securities to narrow, the high yield bond sleeve may purchase higher rated U.S. debt instruments if we believe that the risk of loss of income and principal may be reduced substantially with only a relatively small reduction in yield.
We regularly review the investments of the portfolio and may sell a portfolio holding when it has achieved its valuation target, there is deterioration in the underlying fundamental of the business, or we have identified a more attractive investment opportunity.
Material Changes During the Fiscal Year: As of the date of this report, there have been no material changes made to the high yield bond sleeve of the Fund during this fiscal year.
14 | Allspring Multi-Sector Income Fund
Objective, strategies and risks (unaudited)
International/Emerging Markets Bond Sleeve. Under normal market conditions, the Fund allocates approximately 10%-40% of its total assets to an investment strategy that focuses on developed and emerging market debt securities, including obligations of foreign governments or governmental entities, foreign corporations, or supranational agencies denominated in various currencies. Within this sleeve, the Fund invests in at least three countries or supranational agencies.
Up to 10% of the debt securities in the sleeve may be below investment grade. The weighted average credit quality of the sleeve is expected to be investment grade.
Currency is managed as a separate asset class. We may purchase a foreign currency on a spot or forward basis in order to benefit from potential appreciation of such currency relative to the U.S. dollar or to other currencies. The sleeve may enter into foreign currency exchange contracts to gain or hedge currency exposure or control risk.
While we may purchase securities of any maturity or duration, under normal circumstances, we expect this sleeve of the Fund’s portfolio to maintain a dollar-weighted average effective maturity of between 5 and 14 years, and a dollar-weighted average effective duration of between 3 1/2 and 10 years. “Dollar-Weighted Average Effective Maturity” is a measure of the average time until the final payment of principal and interest is due on fixed income securities in this sleeve of the Fund. “Dollar-Weighted Average Effective Duration” is an aggregate measure of the sensitivity of a fund’s fixed income portfolio securities to changes in interest rates. As a general matter, the price of a fixed income security with a longer effective duration will fluctuate more in response to changes in interest rates than the price of a fixed income security with a shorter effective duration.
We use proprietary models and systems to assess and highlight areas of relative value around the world. Model-driven forecasts are created using fundamental economic inputs to generate economic forecasts on the global bond markets. With these forecasts, an optimization process accounts for multiple iteration scenarios to create, what we believe to be, an optimal portfolio strategy. The output of the model process is intended to provide relative valuations for determining an over, or underweight of country-specific bond markets. Similarly, currencies are valued for their potential returns or to hedge currency exposure. These macro ‘top-down’ quantitative models are used in conjunction with our investment expertise and aligned with a ‘bottom-up’ security selection process. Each of our quantitative models and investment expertise are equally important in our security selection process.
Sell decisions with respect to this sleeve are valuation-driven based on our models and our fundamental analysis. We may also sell a security held by this sleeve of the Fund due to changes in portfolio strategy or cash flow needs.
Material Changes During the Fiscal Year: As of the date of this report, there have been no material changes made to the international/emerging markets bond sleeve of the Fund during this fiscal year.
Mortgage/Corporate Bond Sleeve. Under normal market conditions, the Fund allocates approximately 10%-30% of its total assets to an investment strategy that focuses on adjustable-rate and fixed-rate mortgage backed securities (including collateralized mortgage obligations (“CMOs”)) and asset-backed securities) and investment grade corporate bonds. Mortgage backed securities in which the sleeve invests may include both non-agency mortgage securities and securities issued or guaranteed by the U.S. government, its agencies, or its instrumentalities. The sleeve may invest in securities with a broad range of maturities.
Under normal circumstances, we expect to maintain an average weighted credit quality rating for the sleeve of investment-grade (BBB-/Baa3 or better). As part of our mortgage-backed securities investment strategy, we may enter into dollar roll transactions for this sleeve of the Fund.
We employ a top-down, macroeconomic outlook to determine the portfolio’s duration, yield curve positioning, credit quality and sector allocation. Macroeconomic factors considered may include, among others, the pace of economic growth, employment conditions, corporate profits, inflation, monetary and fiscal policy, as well as the influence of international economic and financial conditions. In combination with our top-down macroeconomic approach, we employ a bottom-up process of fundamental securities analysis to determine the specific securities for investment. Elements of this evaluation may include credit research, duration measurements, historical yield spread relationships, volatility trends, mortgage refinance rates, as well as other factors. Our credit analysis may consider an issuer’s general financial condition, its competitive position and its management strategies, as well as industry characteristics and other factors. We may sell a security due to changes in credit characteristics or outlook, as well as changes in portfolio strategy or cash flow needs. A security may also be sold and replaced with one that presents a better value or risk/reward profile.
Material Changes During the Fiscal Year: As of the date of this report, there have been no material changes made to the mortgage/corporate bond sleeve of the Fund during this fiscal year.
Allspring Multi-Sector Income Fund | 15
Objective, strategies and risks (unaudited)
The Fund’s Overall Portfolio. We monitor the weighting of each investment strategy within the Fund’s portfolio on an ongoing basis and rebalance the Fund’s assets when we determine that such a rebalancing is necessary to align the portfolio in accordance with the investment strategies described above. From time to time, we may make adjustments to the weighting of each investment strategy. Such adjustments would be based on our review and consideration of the expected returns for each investment strategy and would factor in the stock, bond and money markets, interest rate and corporate earnings growth trends, and economic conditions which support changing investment opportunities.
The Fund may enter into transactions including, among others, options, futures and forward contracts, loans of portfolio securities, swap contracts, and other derivatives, as well as when-issued, delayed delivery, or forward commitment transactions, that may in some circumstances give rise to a form of leverage. The Fund may use some or all of these transactions from time to time in the management of its portfolio, for hedging purposes, to adjust portfolio characteristics, or more generally for purposes of attempting to increase the Fund’s investment return. There can be no assurance that the Fund will enter into any such transactions at any particular time or under any specific circumstances. The Fund reserves the flexibility to issue preferred shares and debt securities, or to borrow money, for leveraging purposes. By using leverage, the Fund would seek to obtain a higher return for holders of common shares than if it did not use leverage. Leveraging is a speculative technique, and there are special risks involved. There can be no assurance that any leveraging strategies, if employed by the Fund, will be successful, and such strategies can result in losses to the Fund.
In contrast to the investment objectives of the Fund, which are fundamental, the investment policies of the Fund described above are non-fundamental and may be changed by the Board of Trustees of the Fund so long as shareholders are provided with at least 60 days prior written notice of any change to the extent required by the rules under the 1940 Act.
Other investment techniques and strategies
As part of or in addition to the principal investment strategies discussed above, the Fund may at times invest a portion of its assets in the investment strategies and may use certain investment techniques as described below.
Convertible and Other Securities. The Fund’s investment in fixed income securities may include bonds and preferred stocks that are convertible into the equity securities of the issuer or a related company. The Fund will not invest more than 10% of its total assets in convertible securities. Depending upon the relationship of the conversion price to the market value of the underlying securities, convertible securities may trade more like equity securities than debt instruments. Consistent with its objective and other investment policies, the Fund may also invest a portion of its assets in equity securities, including common stocks, depositary receipts, warrants, rights and other equity interests.
Loans. The Fund may invest in direct debt instruments which are interests in amounts owed to lenders by corporate or other borrowers. The loans in which the Fund invests primarily consist of direct obligations of a borrower. The Fund may invest in a loan at origination as a co-lender or by acquiring in the secondary market participations in, assignments of or novations of a corporate loan. By purchasing a participation, the Fund acquires some or all of the interest of a bank or other lending institution in a loan to a borrower. The participations typically will result in the Fund having a contractual relationship only with the lender, not the borrower. The Fund will have the right to receive payments of principal, interest and any fees to which it is entitled only from the lender selling the participation and only upon receipt by the lender of the payments from the borrower. Many such loans are secured, although some may be unsecured. Loans that are fully secured offer the Fund more protection than an unsecured loan in the event of non-payment of scheduled interest or principal. However, there is no assurance that the liquidation of collateral from a secured loan would satisfy the corporate borrower’s obligation, or that the collateral can be liquidated. Direct debt instruments may involve a risk of loss in case of default or insolvency of the borrower and may offer less legal protection to the Fund in the event of fraud or misrepresentation. In addition, loan participations involve a risk of insolvency of the lending bank or other financial intermediary. The markets in loans are not regulated by federal securities laws or the U.S. Securities and Exchange Commission.
Preferred Shares. The Fund may invest in preferred shares. Preferred shares are equity securities, but they have many characteristics of fixed income securities, such as a fixed dividend payment rate and/or a liquidity preference over the issuer’s common shares. However, because preferred shares are equity securities, they may be more susceptible to risks traditionally associated with equity investments than the Fund’s fixed income securities.
Foreign Currency Transactions. The Fund may engage in foreign currency transactions for the purpose of hedging against foreign exchange risk arising from the Fund’s investment or anticipated investment in securities denominated in foreign currencies. The Fund also may enter into these contracts for purposes of increasing exposure to a foreign currency or to shift exposure to foreign currency fluctuations from one country to another.
16 | Allspring Multi-Sector Income Fund
Objective, strategies and risks (unaudited)
Structured Securities. The Fund may invest in structured securities. The value of the principal and/or interest on such securities is determined by reference to changes in the value of specific currencies, interest rates, commodities, indices or other financial indicators (“Reference”) or the relative change in two or more References. The interest rate or the principal amount payable upon maturity or redemption may be increased or decreased depending upon changes in the Reference. The terms of the structured securities may provide in certain circumstances that no principal is due at maturity and, therefore, may result in a loss of the Fund’s investment. Changes in the interest rate or principal payable at maturity may be a multiple of the changes in the value of the Reference. Consequently, structured securities may entail a greater degree of market risk than other types of fixed income securities.
Asset-Backed Securities. Asset-backed securities are securities that represent a participation in, or are secured by and payable from, a stream of payments generated by particular assets, most often a pool or pools of similar assets (e.g., trade receivables). The credit quality of these securities depends primarily upon the quality of the underlying assets and the level of credit support and/or enhancement provided.
The underlying assets (e.g., loans) are subject to prepayments which shorten the securities’ weighted average maturity and may lower their return. If the credit support or enhancement is exhausted, losses or delays in payment may result if the required payments of principal and interest are not made. The value of these securities also may change because of changes in the market’s perception of the creditworthiness of the servicing agent for the pool, the originator of the pool, or the financial institution or Fund providing the credit support or enhancement.
Real Estate Investment Trusts. The Fund may invest a portion of its assets in real estate investment trusts (“REITs”). REITs primarily invest in income-producing real estate or real estate related loans or interests. REITs are generally classified as equity REITs, mortgage REITs, or a combination of equity and mortgage REITs. Equity REITs invest the majority of their assets directly in real property and derive income primarily from the collection of rents. Equity REITs can also realize capital gains by selling properties that have appreciated in value. Mortgage REITs invest the majority of their assets in real estate mortgages and derive income from the collection of interest payments. The Fund will indirectly bear its proportionate share of any management and other expenses paid by REITs in which it invests in addition to the expenses paid by the Fund. Distributions received by the Fund from REITs may consist of dividends, capital gains, and/or return of capital.
U.S. Government Securities. The Fund may invest in U.S. government securities, including debt securities issued or guaranteed by the U.S. Treasury, U.S. Government agencies or government-sponsored entities. These securities may have fixed, floating or variable rate and also include mortgage-backed securities.
Zero-Coupon, Step-Up Coupon, and Pay-in-Kind Securities. Zero-coupon, step-up coupon, and pay-in-kind securities are types of debt securities that do not make regular cash interest payments. Asset-backed securities, convertible securities, corporate debt securities, foreign securities, high yield securities, mortgage-backed securities, municipal securities, participation interests, stripped securities, U.S. Government and related obligations and other types of debt instruments may be structured as zero-coupon, step-up coupon, and pay-in-kind securities.
Instead of making periodic interest payments, zero-coupon securities are sold at discounts from face value. The interest earned by the investor from holding this security to maturity is the difference between the maturity value and the purchase price. Step-up coupon bonds are debt securities that do not pay interest for a specified period of time and then, after the initial period, pay interest at a series of different rates. Pay-in-kind securities normally give the issuer an option to pay cash at a coupon payment date or to give the holder of the security a similar security with the same coupon rate and a face value equal to the amount of the coupon payment that would have been made. To the extent these securities do not pay current cash income, the market prices of these securities would generally be more volatile and likely to respond to a greater degree to changes in interest rates than the market prices of securities that pay cash interest periodically having similar maturities and credit qualities.
Investments in Equity Securities. The Fund may invest in equity securities. Equity securities, such as common stock, generally represent an ownership interest in a company. While equity securities have historically generated higher average returns than fixed income securities, equity securities have also experienced significantly more volatility in those returns. An adverse event, such as an unfavorable earnings report, may depress the value of a particular equity security held by the Fund. Also, the price of equity securities, particularly common stocks, are sensitive to general movements in the stock market. A drop in the stock market may depress the price of equity securities held by the Fund.
Other Investment Companies. The Fund may invest in other investment companies to the extent permitted under the Investment Company Act of 1940, as amended, and the rules, regulations, and exemptive orders thereunder. The Fund, as a holder of the securities of other investment companies, will bear its pro rata portion of the other investment companies’ expenses, including advisory fees. These expenses are in addition to the direct expenses of the Fund’s own operations.
Allspring Multi-Sector Income Fund | 17
Objective, strategies and risks (unaudited)
Defensive and Temporary Investments. The Fund may hold some of its assets in cash or in money market instruments, including U.S. Government obligations, shares of other mutual funds and repurchase agreements, or make other short-term investments for purposes of maintaining liquidity or for short-term defensive purposes when we believe it is in the best interests of the shareholders to do so. During these periods, the Fund may not achieve its objective.
Derivatives. The Fund may invest up to 10% of its total assets in futures and options on securities and indices and in other derivatives. In addition, the Fund may enter into interest rate swap transactions with respect to the total amount the Fund is leveraged in order to hedge against adverse changes in interest rates affecting dividends payable on any preferred shares or interest payable on borrowings constituting leverage. In connection with any such swap transaction, the Fund will segregate liquid securities in the amount of its obligations under the transaction. A derivative is a security or instrument whose value is determined by reference to the value or the change in value of one or more securities, currencies, indices or other financial instruments. The Fund does not use derivatives as a primary investment technique and generally does not anticipate using derivatives for non-hedging purposes. In the event the Advisor uses derivatives for non-hedging purposes, no more than 3% of the Fund’s total assets will be committed to initial margin for derivatives for such purposes. The Fund may use derivatives for a variety of purposes, including:
| ■ | As a hedge against adverse changes in securities market prices or interest rates; and |
| ■ | As a substitute for purchasing or selling securities. |
Repurchase Agreements. The Fund may enter into repurchase agreements with broker-dealers, member banks of the Federal Reserve System and other financial institutions. Repurchase agreements are arrangements under which the Fund purchases securities and the seller agrees to repurchase the securities within a specific time and at a specific price. We review and monitor the creditworthiness of any institution which enters into a repurchase agreement with the Fund. The counterparty’s obligations under the repurchase agreement are collateralized with U.S. Treasury and/or agency obligations with a market value of not less than 100% of the obligations, valued daily. Collateral is held by the Fund’s custodian in a segregated, safekeeping account for the benefit of the Fund. Repurchase agreements afford the Fund an opportunity to earn income on temporarily available cash at low risk. In the event that the counterparty to a repurchase agreement is unwilling or unable to fulfill its contractual obligations to repurchase the underlying security, the Fund may lose money, suffer delays, or incur costs arising from holding or selling the underlying security.
Portfolio Turnover. It is the policy of the Fund not to engage in trading for short-term profits although portfolio turnover is not considered a limiting factor in the execution of investment decisions for the Fund.
Principal risks
An investment in the Fund may lose money, is not a deposit of a bank, is not insured or guaranteed by the Federal Deposit Insurance Corporation or any other governmental agency, and is primarily subject to the risks briefly summarized below.
Market Risk. The values of, and/or the income generated by, securities held by the Fund may decline due to general market conditions or other factors, including those directly involving the issuers of such securities. Securities markets are volatile and may decline significantly in response to adverse issuer, regulatory, political, or economic developments. Different sectors of the market and different security types may react differently to such developments. Political, geopolitical, natural and other events, including war, terrorism, trade disputes, government shutdowns, market closures, natural and environmental disasters, epidemics, pandemics and other public health crises and related events have led, and in the future may lead, to economic uncertainty, decreased economic activity, increased market volatility and other disruptive effects on U.S. and global economies and markets. Such events may have significant adverse direct or indirect effects on the Fund and its investments. In addition, economies and financial markets throughout the world are becoming increasingly interconnected, which increases the likelihood that events or conditions in one country or region will adversely impact markets or issuers in other countries or regions.
Debt Securities Risk. Debt securities are subject to credit risk and interest rate risk. Credit risk is the possibility that the issuer or guarantor of a debt security may be unable, or perceived to be unable, to pay interest or repay principal when they become due. In these instances, the value of an investment could decline and the Fund could lose money. Credit risk increases as an issuer’s credit quality or financial strength declines. Interest rate risk is the possibility that interest rates will change over time. When interest rates rise, the value of debt securities tends to fall. The longer the terms of the debt securities held by a Fund, the more the Fund is subject to this risk. If interest rates decline, interest that the Fund is able to earn on its investments in debt securities may also decline, which could cause the Fund to reduce the dividends it pays to shareholders, but the value of those securities may increase. Very low or negative interest rates may magnify interest rate risk.
18 | Allspring Multi-Sector Income Fund
Objective, strategies and risks (unaudited)
High Yield Securities Risk. High yield securities and unrated securities of similar credit quality (commonly known as “junk bonds”) have a much greater risk of default (or in the case of bonds currently in default, of not returning principal) and their values tend to be more volatile than higher-rated securities with similar maturities. Additionally, these securities tend to be less liquid and more difficult to value than higher-rated securities.
Foreign Investment Risk. Foreign investments may be subject to lower liquidity, greater price volatility and risks related to adverse political, regulatory, market or economic developments. Foreign companies may be subject to significantly higher levels of taxation than U.S. companies, including potentially confiscatory levels of taxation, thereby reducing the earnings potential of such foreign companies. Foreign investments may involve exposure to changes in foreign currency exchange rates. Such changes may reduce the U.S. dollar value of the investments. Foreign investments may be subject to additional risks such as potentially higher withholding and other taxes, and may also be subject to greater trade settlement, custodial, and other operational risks than domestic investments. Certain foreign markets may also be characterized by less stringent investor protection and disclosure standards.
Emerging Markets Risk. Emerging market securities typically present even greater exposure to the risks described under “Foreign Investment Risk” and may be particularly sensitive to global economic conditions. For example, emerging market countries are typically more dependent on exports and are therefore more vulnerable to recessions in other countries. Emerging markets tend to have less developed legal and financial systems and a smaller market capitalization than markets in developed countries. Some emerging markets are subject to greater political instability. Additionally, emerging markets may have more volatile currencies and be more sensitive than developed markets to a variety of economic factors, including inflation. Emerging market securities are also typically less liquid than securities of developed countries and could be difficult to sell, particularly during a market downturn.
Mortgage- and Asset-Backed Securities Risk. Mortgage- and asset-backed securities are subject to risk of default on the underlying mortgages or assets, particularly during periods of economic downturn. Defaults on the underlying mortgages or assets may cause such securities to decline in value and become less liquid. Rising interest rates tend to extend the duration of these securities, making them more sensitive to changes in interest rates than instruments with fixed payment schedules. As a result, in a period of rising interest rates, these securities may exhibit additional volatility. When interest rates decline or are low, borrowers may pay off their mortgage or other debts sooner than expected, which can reduce the returns of the Fund. Mortgage dollar roll transactions involve the risk that the market value of the securities that are required to be repurchased in the future may decline below the agreed upon repurchase price. They also involve the risk that the party to whom the securities are sold may become insolvent, limiting the fund’s ability to repurchase securities at the agreed upon price.
Leverage Risk. The use of leverage through the issuance of preferred shares and/or debt securities, or from borrowing money, may result in certain risks to the Fund as described below. Certain transactions, such as derivatives, also may give rise to a form of economic leverage. Leveraging is a speculative technique, and there are special risks involved, including the risk that downside outcomes for common shareholders are magnified as a result of losses and declines in value of portfolio securities purchased with borrowed money. In addition, the costs of the financial leverage may exceed the income from investments made with such leverage, interest rates or dividends payable on the financial leverage may affect the yield and distributions to the common shareholders, and the net asset value and market value of common shares may be more volatile than if the Fund had not been leveraged. The use of leverage may cause the Fund to have to liquidate portfolio positions when it may not be advantageous to do so. There can be no assurance that any leveraging strategies will be successful.
Because many derivatives have a leverage component (i.e., a notional value in excess of the assets needed to establish and/or maintain the derivative position), adverse changes in the value or level of the underlying asset, rate or index may result in a loss substantially greater than the amount invested in the derivative itself.
Anti-takeover Provisions Risk. The Fund’s governing documents include provisions that could limit the ability of other entities or persons to acquire control of the Fund or to change the composition of its Board of Trustees. Such provisions could limit the ability of shareholders to sell their shares at a premium over prevailing market prices by discouraging a third party from seeking to obtain control of the Fund. These provisions include staggered terms of office for the Trustees, advance notice requirements for shareholder proposals, and super majority voting requirements for open-ending the Fund or a merger, liquidation, asset sale or similar transactions.
Closed-end Fund Risk. Closed-end funds involve investment risks different from those associated with other investment companies. Shares of closed-end funds frequently trade at either a premium or discount relative to their net asset value (“NAV”). There can be no assurance that the discount will decrease. It is possible that a market discount may increase and the Fund may suffer realized or unrealized capital losses due to further decline in the market price of the securities held by the
Allspring Multi-Sector Income Fund | 19
Objective, strategies and risks (unaudited)
Fund, thereby adversely affecting the NAV of the Fund’s shares. Similarly, there can be no assurance that the Fund’s shares will trade at a premium, will continue to trade at a premium or that the premium will not decrease over time.
Convertible Securities Risk. A convertible security has characteristics of both equity and debt securities and, as a result, is exposed to risks that are typically associated with both types of securities. The market value of a convertible security tends to decline as interest rates increase but also tends to reflect changes in the market price of the common stock of the issuing company. A convertible security is also exposed to the risk that an issuer is unable to meet its obligation to make dividend or interest and principal payments when due as a result of changing financial or market conditions. In the event of a liquidation of the issuer, holders of a convertible security would generally be paid only after holders of any senior debt obligations. The Fund may be forced to convert a convertible security before it would otherwise choose to do so, which may decrease the Fund’s return.
Derivatives Risk. The use of derivatives, such as futures, options and swap agreements, presents risks different from, and possibly greater than, the risks associated with investing directly in traditional securities. The use of derivatives can lead to losses because of adverse movements in the price or value of the derivatives’ underlying assets, indexes or rates and the derivatives themselves, which may be magnified by certain features of the derivatives. These risks are heightened when derivatives are used to enhance the Fund’s return or as a substitute for a position or security, rather than solely to hedge (or mitigate) the risk of a position or security held by the Fund. The success of a derivative strategy will be affected by the portfolio manager’s ability to assess and predict market or economic developments and their impact on the derivatives’ underlying assets, indexes or rates and the derivatives themselves. Certain derivative instruments may become illiquid and, as a result, may be difficult to sell when the portfolio manager believes it would be appropriate to do so. Certain derivatives create leverage, which can magnify the impact of a decline in the value of their underlying assets, indexes or rates and increase the volatility of the Fund’s net asset value. Certain derivatives (e.g., over-the-counter swaps) are also subject to the risk that the counterparty to the derivative contract will be unwilling or unable to fulfill its contractual obligations, which may cause the Fund to lose money, suffer delays or incur costs arising from holding or selling an underlying asset. Changes in laws or regulations may make the use of derivatives more costly, may limit the availability of derivatives, or may otherwise adversely affect the use, value or performance of derivatives.
Equity Securities Risk. The values of equity securities may experience periods of substantial price volatility and may decline significantly over short time periods. In general, the values of equity securities are more volatile than those of debt securities. Equity securities fluctuate in value and price in response to factors specific to the issuer of the security, such as management performance, financial condition, and market demand for the issuer’s products or services, as well as factors unrelated to the fundamental condition of the issuer, including general market, economic and political conditions. Different parts of a market, industry and sector may react differently to adverse issuer, market, regulatory, political, and economic developments.
Foreign Currency Risk. The Fund may invest in non-dollar-denominated investments. The Fund may be limited in its ability to hedge the value of its non-dollar denominated investments against currency fluctuations. As a result, a decline in the value of currencies in which the Fund’s investments are denominated against the dollar will result in a corresponding decline in the dollar value of the Fund’s assets. These declines will in turn affect the Fund’s income and net asset value.
Futures Contracts Risk. A Fund that uses futures contracts, which are a type of derivative, is subject to the risk of loss caused by unanticipated market movements. In addition, there may at times be an imperfect correlation between the movement in the prices of futures contracts and the value of their underlying instruments or indexes, and there may at times not be a liquid secondary market for certain futures contracts.
Inflation Risk. Inflation risk is the risk that the value of assets or income from the Fund’s investments will be worth less in the future as inflation decreases the value of money. As inflation increases, the real, or inflation-adjusted, value of the common shares and distributions can decline and the dividend payments on the Fund’s preferred shares, if any, or interest payments on Fund borrowings, if any, may increase.
Issuer Risk. The value of corporate income-producing securities may decline for a number of reasons which directly relate to the issuer, such as management performance, financial leverage and reduced demand for the issuer’s goods and services.
Loan Risk. Loans may be unrated, less liquid and more difficult to value than traditional debt securities. Loans may be made to finance highly leveraged corporate operations or acquisitions. The highly leveraged capital structure of the borrowers in such transactions may make such loans especially vulnerable to adverse changes in financial, economic or market conditions. Loans generally are subject to restrictions on transfer, and only limited opportunities may exist to sell such loans in secondary markets. As a result, the Fund may be unable to sell loans at a desired time or price. If the Fund acquires only an assignment or a participation in a loan made by a third party, the Fund may not be able to control amendments, waivers or the exercise of any remedies that a lender would have under a direct loan and may assume liability as a lender.
20 | Allspring Multi-Sector Income Fund
Objective, strategies and risks (unaudited)
Management Risk. Investment decisions, techniques, analyses or models implemented by the Fund’s manager or sub-advisor in seeking to achieve the Fund’s investment objective may not produce the returns expected, may cause the Fund’s shares to lose value or may cause the Fund to underperform other funds with similar investment objectives.
Market Price of Shares Risk. Whether investors will realize a gain or loss upon the sale of the Fund’s common shares will depend upon whether the market value of the shares at the time of sale is above or below the price the investor paid, taking into account transaction costs, for the shares and is not directly dependent upon the Fund’s net asset value. Because the market value of the Fund’s shares will be determined by factors such as the relative demand for and supply of the shares in the market, general market conditions and other factors beyond the control of the Fund, the Fund cannot predict whether its common shares will trade at, below or above net asset value, or below or above the initial offering price for the shares.
Options Risk. A Fund that purchases options, which are a type of derivative, is subject to the risk that gains, if any, realized on the position, will be less than the amount paid as premiums to the writer of the option. A Fund that writes options receives a premium that may be small relative to the loss realized in the event of adverse changes in the value of the underlying instruments. A Fund that writes covered call options gives up the opportunity to profit from any price increase in the underlying security above the option exercise price while the option is in effect. Options may be more volatile than the underlying instruments. In addition, there may at times be an imperfect correlation between the movement in values of options and their underlying securities and there may at times not be a liquid secondary market for certain options.
Prepayment Risk. During periods of declining interest rates, the issuer of a security may exercise its option to prepay principal earlier than scheduled, forcing the Fund to reinvest in lower yielding securities. This is known as call or prepayment risk. Debt securities frequently have call features that allow the issuer to repurchase the security prior to its stated maturity. An issuer may redeem an obligation if the issuer can refinance the debt at a lower cost due to declining interest rates or an improvement in the credit standing of the issuer.
Reinvestment Risk. Reinvestment risk is the risk that income from the Fund’s bond portfolio will decline if and when the Fund invests the proceeds from matured, traded or called bonds at market interest rates that are below the portfolio’s current earnings rate. A decline in income could affect the common shares’ market price or their overall returns.
Sovereign Debt Risk. Investments in sovereign or quasi-sovereign debt involve the risk that the governmental entities responsible for repayment will be unable or unwilling to pay interest and repay principal when due. A governmental entity’s ability and willingness to pay interest and repay principal in a timely manner can be expected to be affected by a variety of factors, including its cash flow, the size of its reserves, its access to foreign exchange, the relative size of its debt service burden to its economy as a whole, and political constraints. Investments in quasi-sovereign issuers are subject to the additional risk that the issuer will default independently of its sovereign. Sovereign debt risk is greater for fixed income securities issued or guaranteed by emerging countries.
U.S. Government Obligations Risk. U.S. Government obligations may be adversely impacted by changes in interest rates, and securities issued or guaranteed by U.S. Government agencies or government-sponsored entities may not be backed by the full faith and credit of the U.S. Government.
Allspring Multi-Sector Income Fund | 21
Portfolio of investments—October 31, 2021
| | | Interest
rate | Maturity
date | Principal | Value |
| Agency securities: 0.88% | | | | | | |
| FHLMC (5 Year Treasury Constant Maturity +2.08%) ± | | 2.73% | 9-1-2032 | $ | 334,913 | $ 335,887 |
| FHLMC | | 8.50 | 7-1-2028 | | 12,823 | 14,304 |
| FHLMC Series 1383 (1 Year Treasury Constant Maturity +2.25%) ± | | 2.37 | 2-1-2037 | | 76,158 | 81,431 |
| FHLMC Series 2012-K17 Class B 144A±± | | 4.49 | 12-25-2044 | | 675,000 | 676,548 |
| FHLMC Series 2012-K18 Class B 144A±± | | 4.32 | 1-25-2045 | | 810,000 | 812,346 |
| FHLMC Series 2013-K30 Class B 144A±± | | 3.56 | 6-25-2045 | | 700,000 | 727,512 |
| FHLMC Series 2390 Class FD (1 Month LIBOR +0.45%) ± | | 0.54 | 12-15-2031 | | 9,065 | 9,085 |
| FHLMC Series 2567 Class FH (1 Month LIBOR +0.40%) ± | | 0.49 | 2-15-2033 | | 29,302 | 28,827 |
| FHLMC Series 3987 Class CI ♀ | | 3.50 | 6-15-2026 | | 1,353,499 | 23,356 |
| FHLMC Series K020 Class X1 ♀±± | | 1.34 | 5-25-2022 | | 5,554,395 | 23,393 |
| FNMA (6 Month LIBOR +1.64%) ± | | 1.89 | 9-1-2037 | | 13,210 | 13,273 |
| FNMA | | 6.00 | 4-1-2033 | | 48,893 | 50,473 |
| FNMA | | 7.50 | 2-1-2030 | | 6,452 | 6,497 |
| FNMA | | 7.50 | 9-1-2030 | | 10,036 | 10,111 |
| FNMA Series 1997-20 Class IO ♀±± | | 1.84 | 3-25-2027 | | 63,373 | 911 |
| FNMA Series 2001-25 Class Z | | 6.00 | 6-25-2031 | | 40,123 | 44,669 |
| FNMA Series 2001-35 Class F (1 Month LIBOR +0.60%) ± | | 0.69 | 7-25-2031 | | 2,211 | 2,232 |
| FNMA Series 2001-57 Class F (1 Month LIBOR +0.50%) ± | | 0.59 | 6-25-2031 | | 2,226 | 2,253 |
| FNMA Series 2002-77 Class FH (1 Month LIBOR +0.40%) ± | | 0.49 | 12-18-2032 | | 14,289 | 14,325 |
| FNMA Series 2002-97 Class FR (1 Month LIBOR +0.55%) ± | | 0.64 | 1-25-2033 | | 3,490 | 3,521 |
| GNMA | | 6.50 | 6-15-2028 | | 12,429 | 13,891 |
| GNMA Series 2019-H06 Class HI ♀±± | | 1.80 | 4-20-2069 | | 4,475,545 | 197,998 |
| Total Agency securities (Cost $2,990,766) | | | | | | 3,092,843 |
| Asset-backed securities: 1.01% | | | | | | |
| Aqua Finance Trust Series 2021-A Class A 144A | | 1.54 | 7-17-2046 | | 750,000 | 744,351 |
| Asset-Backed Funding Certificates Series 2003-AHL1 Class A1 | | 3.68 | 3-25-2033 | | 104,428 | 105,745 |
| Bear Stearns Asset Backed Securities Series 2002-2 Class A1 (1 Month LIBOR +0.66%) ± | | 0.75 | 10-25-2032 | | 78,109 | 77,883 |
| CVS Pass-Through Trust Series T | | 6.04 | 12-10-2028 | | 354,251 | 410,139 |
| Five Guys Funding LLC Series 17-1A Class A2 144A | | 4.60 | 7-25-2047 | | 992,500 | 1,037,473 |
| Mesa Trust Asset Backed Certificates Series 2001-5 Class A (1 Month LIBOR +0.80%) 144A± | | 0.89 | 12-25-2031 | | 3,673 | 3,668 |
| Montana Higher Education Student Assistance Corporation Series 2012-1 Class A2 (1 Month LIBOR +1.00%) ± | | 1.09 | 5-20-2030 | | 167,606 | 168,149 |
| PFS Financing Corporation Series 2021-A Class A 144A | | 0.71 | 4-15-2026 | | 1,000,000 | 991,244 |
| Student Loan Consolidation Center Series 2011-1 Class A (1 Month LIBOR +1.22%) 144A± | | 1.31 | 10-25-2027 | | 45,527 | 45,710 |
| Total Asset-backed securities (Cost $3,561,837) | | | | | | 3,584,362 |
The accompanying notes are an integral part of these financial statements.
22 | Allspring Multi-Sector Income Fund
Portfolio of investments—October 31, 2021
| | | | | Shares | Value |
| Common stocks: 1.13% | | | | | | |
| Energy: 0.71% | | | | | | |
| Energy equipment & services: 0.36% | | | | | | |
| Bristow Group Incorporated † | | | | | 37,310 | $ 1,290,926 |
| Oil, gas & consumable fuels: 0.35% | | | | | | |
| Denbury Incorporated † | | | | | 10,597 | 897,142 |
| Whiting Petroleum Corporation † | | | | | 5,057 | 329,362 |
| | | | | | | 1,226,504 |
| Financials: 0.42% | | | | | | |
| Mortgage REITs: 0.42% | | | | | | |
| Blackstone Mortgage Trust Incorporated Class A | | | | | 14,944 | 491,658 |
| Ladder Capital Corporation | | | | | 41,398 | 496,776 |
| Starwood Property Trust Incorporated | | | | | 18,508 | 471,399 |
| | | | | | | 1,459,833 |
| Total Common stocks (Cost $2,521,175) | | | | | | 3,977,263 |
| | | Interest
rate | Maturity
date | Principal | |
| Corporate bonds and notes: 69.21% | | | | | | |
| Communication services: 10.66% | | | | | | |
| Diversified telecommunication services: 0.96% | | | | | | |
| Cablevision Lightpath LLC 144A | | 5.63% | 9-15-2028 | $ | 140,000 | 138,384 |
| Cablevision Lightpath LLC 144A | | 3.88 | 9-15-2027 | | 160,000 | 155,792 |
| Frontier Communications Corporation 144A | | 5.88 | 10-15-2027 | | 180,000 | 188,550 |
| Frontier Communications Corporation 144A | | 6.00 | 1-15-2030 | | 90,000 | 90,426 |
| Level 3 Financing Incorporated 144A | | 3.63 | 1-15-2029 | | 425,000 | 402,139 |
| Level 3 Financing Incorporated 144A | | 4.25 | 7-1-2028 | | 375,000 | 370,740 |
| Windstream Corporation 144A | | 7.75 | 8-15-2028 | | 530,000 | 560,597 |
| Zayo Group Holdings Incorporated 144A | | 6.13 | 3-1-2028 | | 1,525,000 | 1,488,453 |
| | | | | | | 3,395,081 |
| Entertainment: 0.71% | | | | | | |
| Live Nation Entertainment Incorporated 144A | | 3.75 | 1-15-2028 | | 220,000 | 217,800 |
| Live Nation Entertainment Incorporated 144A | | 5.63 | 3-15-2026 | | 228,000 | 235,695 |
| Live Nation Entertainment Incorporated 144A | | 6.50 | 5-15-2027 | | 1,025,000 | 1,122,375 |
| Seaworld Parks & Entertainment 144A | | 5.25 | 8-15-2029 | | 915,000 | 932,156 |
| | | | | | | 2,508,026 |
| Interactive media & services: 0.45% | | | | | | |
| Rackspace Technology Company 144A | | 5.38 | 12-1-2028 | | 1,665,000 | 1,602,563 |
| Media: 8.13% | | | | | | |
| Block Communications Incorporated 144A | | 4.88 | 3-1-2028 | | 150,000 | 153,000 |
| CCO Holdings LLC 144A | | 4.50 | 8-15-2030 | | 3,000,000 | 3,053,640 |
| CCO Holdings LLC 144A | | 4.50 | 5-1-2032 | | 250,000 | 251,183 |
| CCO Holdings LLC 144A | | 5.00 | 2-1-2028 | | 150,000 | 156,000 |
| CCO Holdings LLC 144A | | 5.13 | 5-1-2027 | | 450,000 | 466,313 |
| Charter Communications Operating LLC | | 5.05 | 3-30-2029 | | 675,000 | 787,009 |
| Cinemark USA Incorporated 144A | | 5.25 | 7-15-2028 | | 1,650,000 | 1,609,781 |
| Cinemark USA Incorporated 144A | | 5.88 | 3-15-2026 | | 420,000 | 421,050 |
The accompanying notes are an integral part of these financial statements.
Allspring Multi-Sector Income Fund | 23
Portfolio of investments—October 31, 2021
| | | Interest
rate | Maturity
date | Principal | Value |
| Media (continued) | | | | | | |
| Cinemark USA Incorporated 144A | | 8.75% | 5-1-2025 | $ | 385,000 | $ 411,950 |
| Clear Channel Outdoor Holdings 144A | | 5.13 | 8-15-2027 | | 435,000 | 446,201 |
| Clear Channel Outdoor Holdings 144A | | 7.75 | 4-15-2028 | | 550,000 | 569,500 |
| CSC Holdings LLC 144A | | 4.13 | 12-1-2030 | | 865,000 | 828,238 |
| CSC Holdings LLC 144A | | 4.63 | 12-1-2030 | | 625,000 | 572,656 |
| CSC Holdings LLC 144A | | 5.38 | 2-1-2028 | | 425,000 | 437,750 |
| CSC Holdings LLC 144A | | 5.75 | 1-15-2030 | | 4,025,000 | 3,971,438 |
| Diamond Sports Group LLC 144A | | 5.38 | 8-15-2026 | | 675,000 | 381,375 |
| Diamond Sports Group LLC 144A | | 6.63 | 8-15-2027 | | 275,000 | 82,009 |
| DIRECTV Holdings LLC 144A | | 5.88 | 8-15-2027 | | 80,000 | 82,932 |
| Gray Escrow II Incorporated 144A%% | | 5.38 | 11-15-2031 | | 1,410,000 | 1,424,100 |
| Gray Television Incorporated 144A | | 4.75 | 10-15-2030 | | 1,850,000 | 1,824,808 |
| Nexstar Broadcasting Incorporated 144A | | 4.75 | 11-1-2028 | | 450,000 | 459,743 |
| Nexstar Broadcasting Incorporated 144A | | 5.63 | 7-15-2027 | | 2,000,000 | 2,110,000 |
| Nielsen Finance LLC 144A | | 5.63 | 10-1-2028 | | 1,255,000 | 1,304,868 |
| Nielsen Finance LLC 144A | | 5.88 | 10-1-2030 | | 1,800,000 | 1,884,240 |
| Outfront Media Capital Corporation 144A | | 4.63 | 3-15-2030 | | 675,000 | 674,798 |
| Outfront Media Capital Corporation 144A | | 5.00 | 8-15-2027 | | 50,000 | 51,000 |
| QVC Incorporated | | 4.75 | 2-15-2027 | | 150,000 | 157,032 |
| Salem Media Group Incorporated 144A | | 6.75 | 6-1-2024 | | 1,210,000 | 1,214,538 |
| Scripps Escrow II Incorporated 144A | | 5.38 | 1-15-2031 | | 790,000 | 773,213 |
| Scripps Escrow II Incorporated 144A | | 5.88 | 7-15-2027 | | 100,000 | 101,500 |
| Scripps Escrow II Incorporated 144A | | 3.88 | 1-15-2029 | | 170,000 | 169,150 |
| Townsquare Media Incorporated 144A | | 6.88 | 2-1-2026 | | 1,765,000 | 1,844,425 |
| | | | | | | 28,675,440 |
| Wireless telecommunication services: 0.41% | | | | | | |
| Consolidated Communications Holdings Incorporated 144A | | 6.50 | 10-1-2028 | | 550,000 | 585,690 |
| Sprint Spectrum Company 144A | | 5.15 | 9-20-2029 | | 750,000 | 846,563 |
| | | | | | | 1,432,253 |
| Consumer discretionary: 7.50% | | | | | | |
| Auto components: 1.37% | | | | | | |
| Allison Transmission Incorporated 144A | | 5.88 | 6-1-2029 | | 240,000 | 258,300 |
| Clarios Global LP 144A | | 6.25 | 5-15-2026 | | 112,000 | 117,180 |
| Clarios Global LP 144A | | 6.75 | 5-15-2025 | | 45,000 | 47,413 |
| Clarios Global LP 144A | | 8.50 | 5-15-2027 | | 1,680,000 | 1,784,614 |
| Cooper Tire & Rubber Company | | 7.63 | 3-15-2027 | | 1,710,000 | 2,002,872 |
| Tenneco Incorporated 144A | | 5.13 | 4-15-2029 | | 630,000 | 624,488 |
| | | | | | | 4,834,867 |
| Automobiles: 0.07% | | | | | | |
| Ford Motor Company | | 9.00 | 4-22-2025 | | 100,000 | 120,250 |
| Ford Motor Company | | 9.63 | 4-22-2030 | | 100,000 | 144,063 |
| | | | | | | 264,313 |
| Diversified consumer services: 1.17% | | | | | | |
| Service Corporation International | | 7.50 | 4-1-2027 | | 3,400,000 | 4,131,000 |
| Hotels, restaurants & leisure: 3.02% | | | | | | |
| Carnival Corporation 144A | | 10.50 | 2-1-2026 | | 325,000 | 377,650 |
| Carnival Corporation 144A | | 4.00 | 8-1-2028 | | 760,000 | 760,000 |
The accompanying notes are an integral part of these financial statements.
24 | Allspring Multi-Sector Income Fund
Portfolio of investments—October 31, 2021
| | | Interest
rate | Maturity
date | Principal | Value |
| Hotels, restaurants & leisure (continued) | | | | | | |
| Carnival Corporation 144A%% | | 6.00% | 5-1-2029 | $ | 640,000 | $ 639,600 |
| Carnival Corporation 144A | | 7.63 | 3-1-2026 | | 1,165,000 | 1,227,432 |
| Carnival Corporation 144A | | 9.88 | 8-1-2027 | | 425,000 | 489,281 |
| CCM Merger Incorporated 144A | | 6.38 | 5-1-2026 | | 975,000 | 1,021,313 |
| NCL Corporation Limited 144A | | 5.88 | 3-15-2026 | | 910,000 | 912,275 |
| NCL Corporation Limited 144A | | 12.25 | 5-15-2024 | | 1,750,000 | 2,064,353 |
| Royal Caribbean Cruises Limited 144A | | 5.50 | 8-31-2026 | | 345,000 | 351,469 |
| Royal Caribbean Cruises Limited 144A | | 5.50 | 4-1-2028 | | 680,000 | 691,900 |
| Royal Caribbean Cruises Limited 144A | | 9.13 | 6-15-2023 | | 1,400,000 | 1,520,092 |
| Royal Caribbean Cruises Limited 144A | | 10.88 | 6-1-2023 | | 525,000 | 587,344 |
| | | | | | | 10,642,709 |
| Household durables: 0.36% | | | | | | |
| WASH Multifamily Acquisition Incorporated 144A | | 5.75 | 4-15-2026 | | 1,240,000 | 1,281,850 |
| Multiline retail: 0.22% | | | | | | |
| Nordstrom Incorporated | | 4.00 | 3-15-2027 | | 750,000 | 770,625 |
| Specialty retail: 1.11% | | | | | | |
| Asbury Automotive Group Incorporated | | 4.75 | 3-1-2030 | | 406,000 | 414,120 |
| Asbury Automotive Group Incorporated | | 4.50 | 3-1-2028 | | 419,000 | 426,333 |
| Group 1 Automotive Incorporated 144A | | 4.00 | 8-15-2028 | | 620,000 | 620,124 |
| Lithia Motors Incorporated 144A | | 3.88 | 6-1-2029 | | 390,000 | 404,138 |
| Lithia Motors Incorporated 144A | | 4.63 | 12-15-2027 | | 150,000 | 158,587 |
| NMG Holding Company Incorporated 144A | | 7.13 | 4-1-2026 | | 1,040,000 | 1,092,312 |
| Rent-A-Center Incorporated 144A | | 6.38 | 2-15-2029 | | 760,000 | 794,200 |
| | | | | | | 3,909,814 |
| Textiles, apparel & luxury goods: 0.18% | | | | | | |
| The William Carter Company 144A | | 5.50 | 5-15-2025 | | 125,000 | 130,781 |
| The William Carter Company 144A | | 5.63 | 3-15-2027 | | 500,000 | 518,125 |
| | | | | | | 648,906 |
| Consumer staples: 0.59% | | | | | | |
| Food products: 0.59% | | | | | | |
| CHS Incorporated 144A | | 6.00 | 1-15-2029 | | 40,000 | 42,100 |
| CHS Incorporated 144A | | 6.63 | 2-15-2025 | | 750,000 | 780,000 |
| CHS Incorporated 144A | | 6.88 | 4-15-2029 | | 1,230,000 | 1,265,363 |
| | | | | | | 2,087,463 |
| Energy: 15.02% | | | | | | |
| Energy equipment & services: 2.63% | | | | | | |
| Bristow Group Incorporated ♦† | | 6.25 | 10-15-2022 | | 3,855,000 | 0 |
| Bristow Group Incorporated 144A | | 6.88 | 3-1-2028 | | 2,350,000 | 2,438,125 |
| Hilcorp Energy Company 144A | | 5.75 | 2-1-2029 | | 270,000 | 274,050 |
| Hilcorp Energy Company 144A | | 6.00 | 2-1-2031 | | 270,000 | 277,121 |
| Hilcorp Energy Company 144A | | 6.25 | 11-1-2028 | | 350,000 | 359,205 |
| Oceaneering International Incorporated | | 4.65 | 11-15-2024 | | 145,000 | 150,619 |
| Oceaneering International Incorporated | | 6.00 | 2-1-2028 | | 1,580,000 | 1,624,809 |
| Pattern Energy Operations LP 144A | | 4.50 | 8-15-2028 | | 2,300,000 | 2,380,500 |
The accompanying notes are an integral part of these financial statements.
Allspring Multi-Sector Income Fund | 25
Portfolio of investments—October 31, 2021
| | | Interest
rate | Maturity
date | Principal | Value |
| Energy equipment & services (continued) | | | | | | |
| USA Compression Partners LP | | 6.88% | 4-1-2026 | $ | 970,000 | $ 1,002,738 |
| W.R. Grace Holdings LLC 144A | | 5.63 | 8-15-2029 | | 780,000 | 786,825 |
| | | | | | | 9,293,992 |
| Oil, gas & consumable fuels: 12.39% | | | | | | |
| Aethon United 144A | | 8.25 | 2-15-2026 | | 1,225,000 | 1,315,907 |
| Antero Resources Corporation | | 5.00 | 3-1-2025 | | 1,150,000 | 1,173,000 |
| Antero Resources Corporation 144A | | 8.38 | 7-15-2026 | | 120,000 | 135,000 |
| Apache Corporation | | 4.38 | 10-15-2028 | | 750,000 | 806,123 |
| Archrock Partners LP 144A | | 6.25 | 4-1-2028 | | 590,000 | 610,650 |
| Archrock Partners LP 144A | | 6.88 | 4-1-2027 | | 500,000 | 521,250 |
| Boardwalk Pipelines LP | | 4.80 | 5-3-2029 | | 750,000 | 856,080 |
| Buckeye Partners LP | | 5.85 | 11-15-2043 | | 1,125,000 | 1,109,138 |
| Cheniere Energy Partners LP 144A | | 3.25 | 1-31-2032 | | 800,000 | 792,960 |
| Cheniere Energy Partners LP | | 4.50 | 10-1-2029 | | 400,000 | 427,072 |
| Cheniere Energy Partners LP 144A | | 5.50 | 6-15-2031 | | 1,550,000 | 1,612,000 |
| DCP Midstream Operating Company | | 5.13 | 5-15-2029 | | 1,775,000 | 2,010,223 |
| DT Midstream Incorporated 144A | | 4.13 | 6-15-2029 | | 300,000 | 302,145 |
| DT Midstream Incorporated 144A | | 4.38 | 6-15-2031 | | 300,000 | 303,948 |
| Encino Acquisition Partners Company 144A | | 8.50 | 5-1-2028 | | 2,345,000 | 2,450,525 |
| Energy Transfer Partners LP | | 5.20 | 2-1-2022 | | 750,000 | 750,000 |
| EnLink Midstream Partners LP | | 5.05 | 4-1-2045 | | 1,575,000 | 1,500,188 |
| EnLink Midstream Partners LP | | 5.38 | 6-1-2029 | | 2,050,000 | 2,121,750 |
| EnLink Midstream Partners LP | | 5.60 | 4-1-2044 | | 750,000 | 735,675 |
| EnLink Midstream Partners LP 144A | | 5.63 | 1-15-2028 | | 170,000 | 180,257 |
| Enviva Partners LP 144A | | 6.50 | 1-15-2026 | | 2,250,000 | 2,327,086 |
| Harvest Midstream LP 144A | | 7.50 | 9-1-2028 | | 760,000 | 798,000 |
| Hess Midstream Operation Company 144A | | 4.25 | 2-15-2030 | | 630,000 | 630,000 |
| Kinder Morgan Energy Partners LP | | 3.95 | 9-1-2022 | | 750,000 | 765,157 |
| Murphy Oil Corporation | | 5.75 | 8-15-2025 | | 185,000 | 189,625 |
| Murphy Oil Corporation | | 5.88 | 12-1-2027 | | 150,000 | 156,188 |
| Murphy Oil Corporation | | 6.38 | 7-15-2028 | | 1,230,000 | 1,299,255 |
| Nabors Industries Limited 144A | | 9.00 | 2-1-2025 | | 78,000 | 80,730 |
| New Fortress Energy Incorporated 144A | | 6.50 | 9-30-2026 | | 1,815,000 | 1,763,890 |
| Occidental Petroleum Corporation | | 4.63 | 6-15-2045 | | 1,825,000 | 1,888,875 |
| Occidental Petroleum Corporation | | 6.20 | 3-15-2040 | | 425,000 | 514,915 |
| Occidental Petroleum Corporation | | 6.45 | 9-15-2036 | | 3,190,000 | 4,059,275 |
| Phillips 66 | | 4.30 | 4-1-2022 | | 625,000 | 635,110 |
| Plains All American Pipeline LP | | 3.85 | 10-15-2023 | | 750,000 | 785,177 |
| Range Resources Corporation 144A | | 8.25 | 1-15-2029 | | 180,000 | 203,220 |
| Rockies Express Pipeline LLC 144A | | 6.88 | 4-15-2040 | | 2,110,000 | 2,389,575 |
| Rockies Express Pipeline LLC 144A | | 7.50 | 7-15-2038 | | 240,000 | 274,200 |
| Southwestern Energy Company | | 7.75 | 10-1-2027 | | 975,000 | 1,046,906 |
| Southwestern Energy Company | | 8.38 | 9-15-2028 | | 650,000 | 724,750 |
| Tallgrass Energy Partners LP 144A | | 6.00 | 12-31-2030 | | 1,185,000 | 1,185,261 |
| Tallgrass Energy Partners LP 144A | | 6.00 | 9-1-2031 | | 370,000 | 363,988 |
| Western Midstream Operating LP | | 5.30 | 2-1-2030 | | 600,000 | 657,750 |
| Western Midstream Operating LP | | 5.30 | 3-1-2048 | | 1,000,000 | 1,165,000 |
| Western Midstream Operating LP | | 6.50 | 2-1-2050 | | 75,000 | 89,774 |
| | | | | | | 43,707,598 |
| Financials: 12.25% | | | | | | |
| Banks: 0.72% | | | | | | |
| Bank of America Corporation | | 5.70 | 1-24-2022 | | 250,000 | 253,046 |
The accompanying notes are an integral part of these financial statements.
26 | Allspring Multi-Sector Income Fund
Portfolio of investments—October 31, 2021
| | | Interest
rate | Maturity
date | Principal | Value |
| Banks (continued) | | | | | | |
| Citigroup Incorporated | | 4.50% | 1-14-2022 | $ | 250,000 | $ 252,000 |
| Citigroup Incorporated (U.S. SOFR +3.23%) ʊ± | | 4.70 | 1-30-2025 | | 750,000 | 760,313 |
| City National Bank | | 5.38 | 7-15-2022 | | 500,000 | 517,996 |
| JPMorgan Chase & Company (3 Month LIBOR +3.25%) ± | | 5.15 | 12-29-2049 | | 750,000 | 770,985 |
| | | | | | | 2,554,340 |
| Capital markets: 0.74% | | | | | | |
| Coinbase Global Incorporated 144A | | 3.63 | 10-1-2031 | | 630,000 | 600,075 |
| Goldman Sachs Group Incorporated | | 5.75 | 1-24-2022 | | 750,000 | 759,310 |
| Oppenheimer Holdings Incorporated | | 5.50 | 10-1-2025 | | 1,200,000 | 1,260,000 |
| | | | | | | 2,619,385 |
| Consumer finance: 4.38% | | | | | | |
| Acuris Finance U.S. Incorporated 144A | | 5.00 | 5-1-2028 | | 450,000 | 443,250 |
| Discover Financial Services | | 5.20 | 4-27-2022 | | 750,000 | 767,232 |
| FirstCash Incorporated 144A | | 4.63 | 9-1-2028 | | 445,000 | 458,906 |
| Ford Motor Credit Company LLC | | 4.00 | 11-13-2030 | | 590,000 | 615,813 |
| Ford Motor Credit Company LLC | | 4.39 | 1-8-2026 | | 1,450,000 | 1,551,500 |
| Ford Motor Credit Company LLC | | 5.11 | 5-3-2029 | | 2,175,000 | 2,416,969 |
| Ford Motor Credit Company LLC | | 5.13 | 6-16-2025 | | 225,000 | 244,125 |
| LFS Topco LLC 144A | | 5.88 | 10-15-2026 | | 455,000 | 468,081 |
| Navient Corporation | | 5.00 | 3-15-2027 | | 1,215,000 | 1,238,972 |
| Navient Corporation | | 5.63 | 8-1-2033 | | 825,000 | 782,669 |
| PRA Group Incorporated 144A | | 5.00 | 10-1-2029 | | 1,530,000 | 1,511,931 |
| Rocket Mortgage LLC 144A | | 2.88 | 10-15-2026 | | 965,000 | 958,366 |
| Springleaf Finance Corporation | | 5.38 | 11-15-2029 | | 1,100,000 | 1,174,250 |
| Springleaf Finance Corporation | | 6.13 | 3-15-2024 | | 750,000 | 797,813 |
| Springleaf Finance Corporation | | 6.63 | 1-15-2028 | | 100,000 | 112,250 |
| Springleaf Finance Corporation | | 7.13 | 3-15-2026 | | 925,000 | 1,049,875 |
| Synchrony Financial | | 5.15 | 3-19-2029 | | 750,000 | 873,073 |
| | | | | | | 15,465,075 |
| Diversified financial services: 1.22% | | | | | | |
| Hat Holdings LLC 144A | | 3.38 | 6-15-2026 | | 630,000 | 624,488 |
| Jefferies Finance LLC 144A | | 5.00 | 8-15-2028 | | 875,000 | 886,865 |
| LPL Holdings Incorporated 144A | | 4.38 | 5-15-2031 | | 1,220,000 | 1,248,975 |
| United Shore Financial Services LLC 144A | | 5.50 | 11-15-2025 | | 1,550,000 | 1,542,250 |
| | | | | | | 4,302,578 |
| Insurance: 3.29% | | | | | | |
| Amwins Group Incorporated 144A | | 4.88 | 6-30-2029 | | 1,240,000 | 1,236,131 |
| Assurant Incorporated | | 3.70 | 2-22-2030 | | 750,000 | 810,511 |
| Brighthouse Financial Incorporated | | 4.70 | 6-22-2047 | | 850,000 | 975,365 |
| Broadstreet Partners Incorporated 144A | | 5.88 | 4-15-2029 | | 1,570,000 | 1,542,525 |
| Genworth Mortgage Holding Incorporated 144A | | 6.50 | 8-15-2025 | | 1,890,000 | 2,069,550 |
| HUB International Limited 144A | | 7.00 | 5-1-2026 | | 550,000 | 567,188 |
| Liberty Mutual Group Incorporated 144A | | 4.57 | 2-1-2029 | | 750,000 | 865,349 |
| MetLife Incorporated | | 6.40 | 12-15-2066 | | 1,000,000 | 1,273,431 |
| Prudential Financial Incorporated (3 Month LIBOR +2.38%) ± | | 4.50 | 9-15-2047 | | 750,000 | 797,629 |
The accompanying notes are an integral part of these financial statements.
Allspring Multi-Sector Income Fund | 27
Portfolio of investments—October 31, 2021
| | | Interest
rate | Maturity
date | Principal | Value |
| Insurance (continued) | | | | | | |
| Sammons Financial Group Incorporated 144A | | 4.45% | 5-12-2027 | $ | 750,000 | $ 827,993 |
| W.R. Berkley Corporation | | 4.63 | 3-15-2022 | | 650,000 | 660,211 |
| | | | | | | 11,625,883 |
| Mortgage REITs: 0.57% | | | | | | |
| Blackstone Mortgage Trust Incorporated 144A | | 3.75 | 1-15-2027 | | 300,000 | 298,455 |
| Starwood Property Trust Incorporated | | 4.75 | 3-15-2025 | | 755,000 | 793,430 |
| Starwood Property Trust Incorporated | | 5.00 | 12-15-2021 | | 180,000 | 180,225 |
| Starwood Property Trust Incorporated 144A | | 5.50 | 11-1-2023 | | 690,000 | 724,500 |
| | | | | | | 1,996,610 |
| Thrifts & mortgage finance: 1.33% | | | | | | |
| Ladder Capital Finance Holdings LP 144A | | 4.25 | 2-1-2027 | | 850,000 | 854,242 |
| Ladder Capital Finance Holdings LP 144A | | 4.75 | 6-15-2029 | | 1,070,000 | 1,078,025 |
| Ladder Capital Finance Holdings LP 144A | | 5.25 | 10-1-2025 | | 1,385,000 | 1,395,388 |
| United Wholesale Mortgage LLC 144A | | 5.50 | 4-15-2029 | | 1,395,000 | 1,356,638 |
| | | | | | | 4,684,293 |
| Health care: 4.32% | | | | | | |
| Health care equipment & supplies: 0.58% | | | | | | |
| Avantor Funding Incorporated 144A | | 3.88 | 11-1-2029 | | 365,000 | 364,883 |
| Mozart Debt Merger Sub Incorporated 144A | | 5.25 | 10-1-2029 | | 1,175,000 | 1,192,625 |
| Surgery Center Holdings Incorporated 144A | | 6.75 | 7-1-2025 | | 485,000 | 493,488 |
| | | | | | | 2,050,996 |
| Health care providers & services: 2.81% | | | | | | |
| 180 Medical Incorporated 144A | | 3.88 | 10-15-2029 | | 475,000 | 477,678 |
| AdaptHealth LLC 144A | | 4.63 | 8-1-2029 | | 240,000 | 237,300 |
| Air Methods Corporation 144A | | 8.00 | 5-15-2025 | | 1,410,000 | 1,078,650 |
| CommonSpirit Health | | 3.82 | 10-1-2049 | | 750,000 | 865,641 |
| Davita Incorporated 144A | | 4.63 | 6-1-2030 | | 600,000 | 602,976 |
| Encompass Health Corporation | | 4.50 | 2-1-2028 | | 150,000 | 152,715 |
| Encompass Health Corporation | | 4.75 | 2-1-2030 | | 175,000 | 179,375 |
| Encompass Health Corporation | | 4.63 | 4-1-2031 | | 175,000 | 178,063 |
| HealthSouth Corporation | | 5.75 | 9-15-2025 | | 575,000 | 587,219 |
| Magellan Health Incorporated | | 4.90 | 9-22-2024 | | 325,000 | 355,800 |
| MPT Operating Partnership LP | | 5.25 | 8-1-2026 | | 1,575,000 | 1,622,250 |
| Select Medical Corporation 144A | | 6.25 | 8-15-2026 | | 1,320,000 | 1,380,676 |
| Tenet Healthcare Corporation 144A | | 4.63 | 6-15-2028 | | 125,000 | 129,531 |
| Tenet Healthcare Corporation 144A | | 4.88 | 1-1-2026 | | 1,025,000 | 1,050,625 |
| Tenet Healthcare Corporation 144A | | 5.13 | 11-1-2027 | | 225,000 | 235,125 |
| Tenet Healthcare Corporation 144A | | 6.25 | 2-1-2027 | | 425,000 | 441,469 |
| Tenet Healthcare Corporation 144A | | 7.50 | 4-1-2025 | | 150,000 | 159,188 |
| Vizient Incorporated 144A | | 6.25 | 5-15-2027 | | 175,000 | 183,419 |
| | | | | | | 9,917,700 |
| Health care technology: 0.68% | | | | | | |
| Change Healthcare Holdings Incorporated 144A | | 5.75 | 3-1-2025 | | 2,375,000 | 2,392,813 |
The accompanying notes are an integral part of these financial statements.
28 | Allspring Multi-Sector Income Fund
Portfolio of investments—October 31, 2021
| | | Interest
rate | Maturity
date | Principal | Value |
| Life sciences tools & services: 0.14% | | | | | | |
| Ortho-Clinical Diagnostics Incorporated 144A | | 7.25% | 2-1-2028 | $ | 90,000 | $ 95,850 |
| Ortho-Clinical Diagnostics Incorporated 144A | | 7.38 | 6-1-2025 | | 385,000 | 404,173 |
| | | | | | | 500,023 |
| Pharmaceuticals: 0.11% | | | | | | |
| Bausch Health Companies Incorporated 144A | | 8.50 | 1-31-2027 | | 375,000 | 397,969 |
| Industrials: 7.75% | | | | | | |
| Aerospace & defense: 0.90% | | | | | | |
| Spirit AeroSystems Holdings Incorporated 144A | | 5.50 | 1-15-2025 | | 305,000 | 317,581 |
| Spirit AeroSystems Holdings Incorporated 144A | | 7.50 | 4-15-2025 | | 370,000 | 390,628 |
| TransDigm Group Incorporated | | 4.88 | 5-1-2029 | | 1,270,000 | 1,273,723 |
| TransDigm Group Incorporated 144A | | 6.25 | 3-15-2026 | | 575,000 | 600,156 |
| TransDigm Group Incorporated | | 7.50 | 3-15-2027 | | 550,000 | 576,813 |
| | | | | | | 3,158,901 |
| Airlines: 2.58% | | | | | | |
| American Airlines Group Incorporated 144A | | 5.75 | 4-20-2029 | | 2,155,000 | 2,319,319 |
| Delta Air Lines Incorporated | | 3.75 | 10-28-2029 | | 710,000 | 721,486 |
| Delta Air Lines Incorporated 144A | | 4.75 | 10-20-2028 | | 545,000 | 605,185 |
| Hawaiian Airlines Incorporated | | 3.90 | 7-15-2027 | | 818,224 | 813,177 |
| Hawaiian Brand Intellectual Property Limited 144A | | 5.75 | 1-20-2026 | | 2,370,000 | 2,488,500 |
| Mileage Plus Holdings LLC 144A | | 6.50 | 6-20-2027 | | 1,175,000 | 1,278,823 |
| United Airlines Incorporated 144A | | 4.63 | 4-15-2029 | | 850,000 | 876,333 |
| | | | | | | 9,102,823 |
| Commercial services & supplies: 1.16% | | | | | | |
| CoreCivic Incorporated | | 8.25 | 4-15-2026 | | 1,145,000 | 1,170,247 |
| IAA Spinco Incorporated 144A | | 5.50 | 6-15-2027 | | 1,700,000 | 1,765,875 |
| Plastipak Holdings Incorporated 144A | | 6.25 | 10-15-2025 | | 1,150,000 | 1,170,850 |
| | | | | | | 4,106,972 |
| Construction & engineering: 0.45% | | | | | | |
| Great Lakes Dredge & Dock Company 144A | | 5.25 | 6-1-2029 | | 1,565,000 | 1,592,028 |
| Machinery: 1.03% | | | | | | |
| Meritor Incorporated 144A | | 4.50 | 12-15-2028 | | 600,000 | 597,000 |
| Stevens Holding Company Incorporated 144A | | 6.13 | 10-1-2026 | | 1,425,000 | 1,535,438 |
| Werner FinCo LP 144A | | 8.75 | 7-15-2025 | | 1,445,000 | 1,502,800 |
| | | | | | | 3,635,238 |
| Road & rail: 0.69% | | | | | | |
| Uber Technologies Incorporated 144A | | 4.50 | 8-15-2029 | | 725,000 | 729,658 |
| Uber Technologies Incorporated 144A | | 8.00 | 11-1-2026 | | 1,600,000 | 1,703,040 |
| | | | | | | 2,432,698 |
| Trading companies & distributors: 0.94% | | | | | | |
| Fortress Transportation & Infrastructure Investors LLC 144A | | 5.50 | 5-1-2028 | | 1,915,000 | 1,919,788 |
The accompanying notes are an integral part of these financial statements.
Allspring Multi-Sector Income Fund | 29
Portfolio of investments—October 31, 2021
| | | Interest
rate | Maturity
date | Principal | Value |
| Trading companies & distributors (continued) | | | | | | |
| Fortress Transportation & Infrastructure Investors LLC 144A | | 6.50% | 10-1-2025 | $ | 1,140,000 | $ 1,173,117 |
| Fortress Transportation & Infrastructure Investors LLC 144A | | 9.75 | 8-1-2027 | | 200,000 | 225,250 |
| | | | | | | 3,318,155 |
| Information technology: 4.54% | | | | | | |
| Communications equipment: 0.59% | | | | | | |
| CommScope Technologies LLC 144A | | 5.00 | 3-15-2027 | | 1,115,000 | 1,034,541 |
| CommScope Technologies LLC 144A | | 8.25 | 3-1-2027 | | 1,025,000 | 1,044,414 |
| | | | | | | 2,078,955 |
Electronic equipment, instruments &
components: 0.19% | | | | | | |
| Keysight Technologies | | 4.60 | 4-6-2027 | | 600,000 | 678,825 |
| IT services: 1.19% | | | | | | |
| Flexential Intermediate Corporation 144A | | 11.25 | 8-1-2024 | | 1,000,000 | 1,060,000 |
| Sabre GLBL Incorporated 144A | | 9.25 | 4-15-2025 | | 2,699,000 | 3,119,126 |
| | | | | | | 4,179,126 |
Semiconductors & semiconductor
equipment: 0.28% | | | | | | |
| Broadcom Corporation | | 3.50 | 1-15-2028 | | 750,000 | 809,535 |
| QORVO Incorporated | | 4.38 | 10-15-2029 | | 175,000 | 187,906 |
| | | | | | | 997,441 |
| Software: 1.50% | | | | | | |
| IQVIA Incorporated 144A | | 5.00 | 5-15-2027 | | 250,000 | 259,143 |
| MPH Acquisition Holdings LLC 144A | | 5.50 | 9-1-2028 | | 640,000 | 635,541 |
| MPH Acquisition Holdings LLC 144A | | 5.75 | 11-1-2028 | | 1,940,000 | 1,769,464 |
| NCR Corporation 144A | | 5.13 | 4-15-2029 | | 195,000 | 199,403 |
| NCR Corporation 144A | | 6.13 | 9-1-2029 | | 1,000,000 | 1,074,386 |
| SS&C Technologies Incorporated 144A | | 5.50 | 9-30-2027 | | 500,000 | 526,250 |
| VMware Incorporated | | 3.90 | 8-21-2027 | | 750,000 | 822,549 |
| | | | | | | 5,286,736 |
| Technology hardware, storage & peripherals: 0.79% | | | | | | |
| Dell International LLC | | 6.02 | 6-15-2026 | | 750,000 | 883,753 |
| Dell International LLC 144A | | 7.13 | 6-15-2024 | | 1,125,000 | 1,143,214 |
| Hewlett-Packard Company | | 4.05 | 9-15-2022 | | 750,000 | 770,872 |
| | | | | | | 2,797,839 |
| Materials: 2.47% | | | | | | |
| Chemicals: 0.38% | | | | | | |
| Chemours Company 144A | | 4.63 | 11-15-2029 | | 950,000 | 914,375 |
| Olympus Water US Holding Corporation 144A | | 4.25 | 10-1-2028 | | 450,000 | 442,463 |
| | | | | | | 1,356,838 |
| Containers & packaging: 0.98% | | | | | | |
| Berry Global Incorporated 144A | | 5.63 | 7-15-2027 | | 175,000 | 183,288 |
| Crown Cork & Seal Company Incorporated | | 7.38 | 12-15-2026 | | 750,000 | 922,500 |
The accompanying notes are an integral part of these financial statements.
30 | Allspring Multi-Sector Income Fund
Portfolio of investments—October 31, 2021
| | | Interest
rate | Maturity
date | Principal | Value |
| Containers & packaging (continued) | | | | | | |
| Flex Acquisition Company Incorporated 144A | | 6.88% | 1-15-2025 | $ | 900,000 | $ 909,000 |
| Flex Acquisition Company Incorporated 144A | | 7.88 | 7-15-2026 | | 430,000 | 448,894 |
| Owens-Brockway Packaging Incorporated 144A | | 5.88 | 8-15-2023 | | 325,000 | 342,063 |
| Owens-Brockway Packaging Incorporated 144A | | 6.38 | 8-15-2025 | | 600,000 | 656,250 |
| | | | | | | 3,461,995 |
| Metals & mining: 0.77% | | | | | | |
| Arches Buyer Incorporated 144A | | 4.25 | 6-1-2028 | | 800,000 | 806,448 |
| Arches Buyer Incorporated 144A | | 6.13 | 12-1-2028 | | 405,000 | 409,556 |
| Cleveland-Cliffs Incorporated 144A | | 4.88 | 3-1-2031 | | 220,000 | 229,075 |
| Cleveland-Cliffs Incorporated | | 5.88 | 6-1-2027 | | 540,000 | 561,600 |
| Cleveland-Cliffs Incorporated 144A | | 9.88 | 10-17-2025 | | 361,000 | 413,345 |
| Kaiser Aluminum Corporation 144A | | 4.63 | 3-1-2028 | | 300,000 | 303,660 |
| | | | | | | 2,723,684 |
| Paper & forest products: 0.34% | | | | | | |
| Clearwater Paper Corporation 144A | | 5.38 | 2-1-2025 | | 350,000 | 377,125 |
| Clearwater Paper Corporation 144A | | 4.75 | 8-15-2028 | | 115,000 | 116,581 |
| Vertical US Newco Incorporated 144A | | 5.25 | 7-15-2027 | | 675,000 | 687,015 |
| | | | | | | 1,180,721 |
| Real estate: 1.58% | | | | | | |
| Equity REITs: 1.58% | | | | | | |
| Omega HealthCare Investors Incorporated | | 4.50 | 4-1-2027 | | 600,000 | 662,738 |
| Service Properties Trust Company | | 3.95 | 1-15-2028 | | 385,000 | 358,050 |
| Service Properties Trust Company | | 4.75 | 10-1-2026 | | 545,000 | 539,005 |
| Service Properties Trust Company | | 4.95 | 2-15-2027 | | 2,260,000 | 2,226,100 |
| Service Properties Trust Company | | 7.50 | 9-15-2025 | | 1,000,000 | 1,106,695 |
| SITE Centers Corporation | | 4.70 | 6-1-2027 | | 600,000 | 669,691 |
| | | | | | | 5,562,279 |
| Utilities: 2.53% | | | | | | |
| Electric utilities: 0.88% | | | | | | |
| NextEra Energy Operating Partners LP 144A | | 4.25 | 7-15-2024 | | 775,000 | 820,493 |
| NextEra Energy Operating Partners LP 144A | | 4.25 | 9-15-2024 | | 16,000 | 16,840 |
| NextEra Energy Operating Partners LP 144A | | 4.50 | 9-15-2027 | | 1,250,000 | 1,337,250 |
| PG&E Corporation | | 5.00 | 7-1-2028 | | 100,000 | 104,000 |
| PG&E Corporation | | 5.25 | 7-1-2030 | | 800,000 | 835,800 |
| | | | | | | 3,114,383 |
Independent power & renewable electricity
producers: 1.65% | | | | | | |
| NSG Holdings LLC 144A | | 7.75 | 12-15-2025 | | 2,052,610 | 2,196,293 |
| TerraForm Power Operating LLC 144A | | 4.25 | 1-31-2023 | | 500,000 | 510,000 |
| TerraForm Power Operating LLC 144A | | 4.75 | 1-15-2030 | | 800,000 | 828,784 |
| TerraForm Power Operating LLC 144A | | 5.00 | 1-31-2028 | | 675,000 | 718,875 |
| Vistra Operations Company LLC 144A | | 5.63 | 2-15-2027 | | 1,500,000 | 1,545,480 |
| | | | | | | 5,799,432 |
| Total Corporate bonds and notes (Cost $230,834,700) | | | | | | 244,259,234 |
The accompanying notes are an integral part of these financial statements.
Allspring Multi-Sector Income Fund | 31
Portfolio of investments—October 31, 2021
| | | Interest
rate | Maturity
date | Principal | Value |
| Foreign corporate bonds and notes: 5.03% | | | | | | |
| Financials: 5.03% | | | | | | |
| Banks: 5.03% | | | | | | |
| European Investment Bank | | 8.00% | 5-5-2027 | ZAR | 21,000,000 | $ 1,390,697 |
| European Investment Bank | | 8.38 | 7-29-2022 | ZAR | 40,000,000 | 2,677,316 |
| European Investment Bank | | 8.75 | 8-18-2025 | ZAR | 20,000,000 | 1,372,608 |
| International Bank for Reconstruction & Development | | 5.75 | 1-14-2028 | BRL | 15,000,000 | 2,007,424 |
| International Bank for Reconstruction & Development | | 7.00 | 6-7-2023 | ZAR | 15,000,000 | 993,306 |
| International Bank for Reconstruction & Development | | 8.25 | 6-22-2023 | BRL | 9,000,000 | 1,511,747 |
| International Finance Corporation | | 7.50 | 5-9-2022 | BRL | 5,000,000 | 872,107 |
| International Finance Corporation | | 7.50 | 5-9-2022 | BRL | 4,000,000 | 697,686 |
| International Finance Corporation | | 8.25 | 1-30-2023 | BRL | 9,000,000 | 1,534,232 |
| KfW | | 7.50 | 11-10-2022 | ZAR | 36,000,000 | 2,401,331 |
| Landwirtschaftliche Rentenbank | | 8.25 | 5-23-2022 | ZAR | 15,000,000 | 994,959 |
| The Asian Development Bank | | 6.00 | 2-5-2026 | BRL | 9,000,000 | 1,316,249 |
| | | | | | | 17,769,662 |
| Total Foreign corporate bonds and notes (Cost $21,732,719) | | | | | | 17,769,662 |
| Foreign government bonds: 24.60% | | | | | | |
| China Government Bond | | 3.02 | 5-27-2031 | CNY | 14,700,000 | 2,307,069 |
| China Government Bond | | 3.03 | 3-11-2026 | CNY | 14,400,000 | 2,270,521 |
| Colombia | | 6.25 | 11-26-2025 | COP | 15,000,000,000 | 3,895,893 |
| Colombia | | 7.50 | 8-26-2026 | COP | 22,725,000,000 | 6,111,440 |
| India | | 7.27 | 4-8-2026 | INR | 60,000,000 | 846,540 |
| India | | 7.32 | 1-28-2024 | INR | 710,000,000 | 9,956,711 |
| Indonesia | | 7.00 | 9-15-2030 | IDR | 115,000,000,000 | 8,543,321 |
| Indonesia | | 7.25 | 2-15-2026 | IDR | 55,000,000,000 | 4,200,187 |
| Indonesia | | 5.50 | 4-15-2026 | IDR | 50,000,000,000 | 3,586,024 |
| Malaysia | | 4.23 | 6-30-2031 | MYR | 17,000,000 | 4,267,615 |
| Mexico | | 7.75 | 5-29-2031 | MXN | 85,000,000 | 4,192,819 |
| Mexico | | 8.50 | 5-31-2029 | MXN | 208,500,000 | 10,728,818 |
| Republic of Trinidad and Tobago 144A | | 4.50 | 8-4-2026 | TTD | 750,000 | 778,133 |
| Romania | | 3.25 | 4-29-2024 | RON | 23,500,000 | 5,384,039 |
| Romania | | 5.00 | 2-12-2029 | RON | 20,000,000 | 4,698,770 |
| Russia | | 6.50 | 2-28-2024 | RUB | 390,000,000 | 5,300,942 |
| Russia | | 6.90 | 5-23-2029 | RUB | 400,000,000 | 5,272,005 |
| Russia | | 7.65 | 4-10-2030 | RUB | 325,000,000 | 4,475,761 |
| Total Foreign government bonds (Cost $90,851,417) | | | | | | 86,816,608 |
| Loans: 19.08% | | | | | | |
| Communication services: 1.78% | | | | | | |
| Diversified telecommunication services: 0.14% | | | | | | |
| Frontier Communications Corporation (1 Month LIBOR +3.75%) ± | | 4.50 | 5-1-2028 | $ | 487,550 | 486,575 |
| Media: 1.16% | | | | | | |
| Clear Channel Outdoor Holdings (1 Month LIBOR +3.50%) ± | | 3.63 | 8-21-2026 | | 428,615 | 421,458 |
The accompanying notes are an integral part of these financial statements.
32 | Allspring Multi-Sector Income Fund
Portfolio of investments—October 31, 2021
| | | Interest
rate | Maturity
date | Principal | Value |
| Media (continued) | | | | | | |
| DIRECTV Financing LLC (1 Month LIBOR +5.00%) <± | | 5.75% | 7-22-2027 | $ | 1,575,000 | $ 1,575,756 |
| Hubbard Radio LLC (3 Month LIBOR +4.25%) ± | | 5.25 | 3-28-2025 | | 2,098,426 | 2,097,545 |
| | | | | | | 4,094,759 |
| Wireless telecommunication services: 0.48% | | | | | | |
| Connect U.S. Finco LLC (1 Month LIBOR +3.50%) ± | | 4.50 | 12-11-2026 | | 861,875 | 861,875 |
| Consolidated Communications Holdings Incorporated (1 Month LIBOR +3.50%) ± | | 4.25 | 10-2-2027 | | 848,000 | 847,805 |
| | | | | | | 1,709,680 |
| Consumer discretionary: 2.24% | | | | | | |
| Auto components: 0.50% | | | | | | |
| Clarios Global LP (1 Month LIBOR +3.25%) ± | | 3.34 | 4-30-2026 | | 190,172 | 188,903 |
| Truck Hero Incorporated (1 Month LIBOR +3.25%) ± | | 4.00 | 1-31-2028 | | 1,591,003 | 1,583,413 |
| | | | | | | 1,772,316 |
| Distributors: 0.72% | | | | | | |
| Spin Holdco Incorporated (1 Month LIBOR +4.00%) ± | | 4.75 | 3-4-2028 | | 2,520,548 | 2,527,127 |
| Hotels, restaurants & leisure: 0.54% | | | | | | |
| CCM Merger Incorporated (1 Month LIBOR +3.75%) ± | | 4.50 | 11-4-2025 | | 1,895,345 | 1,895,345 |
| Household durables: 0.22% | | | | | | |
| Wilsonart LLC (1 Month LIBOR +3.50%) ± | | 4.50 | 12-19-2026 | | 791,025 | 791,523 |
| Specialty retail: 0.26% | | | | | | |
| Great Outdoors Group LLC (1 Month LIBOR +4.25%) ± | | 5.00 | 3-6-2028 | | 417,472 | 418,428 |
| Rent-A-Center Incorporated (1 Month LIBOR +3.25%) ± | | 3.75 | 2-17-2028 | | 492,525 | 493,451 |
| | | | | | | 911,879 |
| Energy: 1.61% | | | | | | |
| Oil, gas & consumable fuels: 1.61% | | | | | | |
| AL NGPL Holdings LLC (1 Month LIBOR +3.75%) ± | | 4.75 | 4-14-2028 | | 770,000 | 771,925 |
| Apergy Corporation (1 Month LIBOR +5.00%) <± | | 6.00 | 6-3-2027 | | 2,335,362 | 2,369,668 |
| GIP II Blue Holdings LP (1 Month LIBOR +4.50%) ± | | 5.50 | 9-29-2028 | | 760,000 | 761,429 |
| NorthRiver Midstream Finance LP (3 Month LIBOR +3.25%) ± | | 3.38 | 10-1-2025 | | 917,192 | 915,018 |
| Prairie ECI Acquiror LP (3 Month LIBOR +4.75%) ± | | 4.84 | 3-11-2026 | | 900,000 | 868,842 |
| | | | | | | 5,686,882 |
The accompanying notes are an integral part of these financial statements.
Allspring Multi-Sector Income Fund | 33
Portfolio of investments—October 31, 2021
| | | Interest
rate | Maturity
date | Principal | Value |
| Financials: 3.13% | | | | | | |
| Diversified financial services: 2.12% | | | | | | |
| Mallinckrodt International Finance SA (3 Month LIBOR +5.25%) ± | | 6.00% | 9-24-2024 | $ | 1,581,896 | $ 1,469,629 |
| Resolute Investment Managers Incorporated (1 Month LIBOR +3.75%) ౠ| | 5.25 | 4-30-2024 | | 2,379,488 | 2,379,488 |
| Resolute Investment Managers Incorporated (1 Month LIBOR +8.00%) ౠ| | 9.00 | 4-30-2025 | | 923,070 | 925,378 |
| Russell Investments US Institutional Holdco Incorporated (1 Month LIBOR +3.50%) ± | | 4.50 | 5-30-2025 | | 1,721,259 | 1,727,180 |
| Stonepeak Lonestar Holdings LLC (1 Month LIBOR +4.50%) ± | | 4.62 | 10-19-2026 | | 978,871 | 980,966 |
| | | | | | | 7,482,641 |
| Insurance: 1.01% | | | | | | |
| Asurion LLC (1 Month LIBOR +5.25%) <± | | 5.34 | 1-31-2028 | | 2,020,000 | 2,011,698 |
| Asurion LLC (1 Month LIBOR +5.25%) ± | | 5.34 | 1-20-2029 | | 350,000 | 348,324 |
| HUB International Limited (1 Month LIBOR +2.75%) ± | | 2.87 | 4-25-2025 | | 1,209,375 | 1,195,358 |
| | | | | | | 3,555,380 |
| Health care: 1.86% | | | | | | |
| Health care equipment & supplies: 0.38% | | | | | | |
| Surgery Center Holdings Incorporated (1 Month LIBOR +3.75%) ± | | 4.50 | 8-31-2026 | | 1,350,653 | 1,353,097 |
| Health care providers & services: 0.91% | | | | | | |
| Medrisk Incorporated (1 Month LIBOR +3.75%) ± | | 4.50 | 5-10-2028 | | 780,000 | 780,164 |
| National Mentor Holdings Incorporated (1 Month LIBOR +3.75%) <± | | 3.75 | 3-2-2028 | | 69,617 | 69,153 |
| National Mentor Holdings Incorporated (1 Month LIBOR +3.75%) <± | | 4.50 | 3-2-2028 | | 1,459,243 | 1,449,510 |
| National Mentor Holdings Incorporated (1 Month LIBOR +3.75%) <± | | 4.50 | 3-2-2028 | | 47,230 | 46,915 |
| Padagis LLC (1 Month LIBOR +4.75%) ౠ| | 5.25 | 7-6-2028 | | 405,000 | 405,506 |
| Press Ganey Holdings Incorporated (1 Month LIBOR +3.75%) ± | | 4.50 | 7-24-2026 | | 468,825 | 469,411 |
| | | | | | | 3,220,659 |
| Health care technology: 0.57% | | | | | | |
| Change Healthcare Holdings Incorporated (1 Month LIBOR +2.50%) ± | | 3.50 | 3-1-2024 | | 437,268 | 436,769 |
| Project Ruby Ultimate Parent Corporation (1 Month LIBOR +3.25%) ± | | 4.00 | 3-3-2028 | | 1,567,125 | 1,564,727 |
| | | | | | | 2,001,496 |
| Industrials: 4.54% | | | | | | |
| Aerospace & defense: 0.85% | | | | | | |
| Spirit AeroSystems Holdings Incorporated (1 Month LIBOR +5.25%) ± | | 6.00 | 1-15-2025 | | 2,997,350 | 3,004,843 |
The accompanying notes are an integral part of these financial statements.
34 | Allspring Multi-Sector Income Fund
Portfolio of investments—October 31, 2021
| | | Interest
rate | Maturity
date | Principal | Value |
| Airlines: 1.89% | | | | | | |
| AAdvantage Loyalty IP Limited (1 Month LIBOR +4.75%) ± | | 5.50% | 4-20-2028 | $ | 1,920,000 | $ 1,998,605 |
| Air Canada (1 Month LIBOR +3.50%) ± | | 4.25 | 8-11-2028 | | 200,000 | 201,958 |
| Mileage Plus Holdings LLC (1 Month LIBOR +5.25%) ± | | 6.25 | 6-21-2027 | | 2,885,000 | 3,070,736 |
| SkyMiles IP Limited (3 Month LIBOR +3.75%) ± | | 4.75 | 10-20-2027 | | 910,000 | 968,640 |
| United Airlines Incorporated (1 Month LIBOR +3.75%) ± | | 4.50 | 4-21-2028 | | 402,975 | 408,371 |
| | | | | | | 6,648,310 |
| Commercial services & supplies: 1.00% | | | | | | |
| MIP V Waste Holdings LLC (1 Month LIBOR +3.25%) ‡<± | | 3.75 | 10-27-2028 | | 350,000 | 350,438 |
| Polaris Newco LLC (1 Month LIBOR +4.00%) ± | | 4.50 | 6-2-2028 | | 1,580,000 | 1,583,034 |
| Ring Container Technologies (1 Month LIBOR +3.75%) ± | | 4.25 | 8-12-2028 | | 1,595,000 | 1,597,791 |
| | | | | | | 3,531,263 |
| Machinery: 0.80% | | | | | | |
| Alliance Laundry Systems LLC (1 Month LIBOR +3.50%) ± | | 4.25 | 10-8-2027 | | 1,129,054 | 1,131,063 |
| Gates Global LLC Series 2021 Class B3 (1 Month LIBOR +2.50%) ± | | 3.25 | 3-31-2027 | | 480,389 | 478,987 |
| Werner FinCo LP (3 Month LIBOR +4.00%) ౠ| | 5.00 | 7-24-2024 | | 1,210,543 | 1,210,543 |
| | | | | | | 2,820,593 |
| Information technology: 1.35% | | | | | | |
| Communications equipment: 0.14% | | | | | | |
| CommScope Incorporated (3 Month LIBOR +3.25%) ± | | 3.34 | 4-6-2026 | | 490,000 | 483,111 |
| IT services: 0.54% | | | | | | |
| Applied Systems Incorporated (1 Month LIBOR +3.25%) ± | | 3.75 | 9-19-2024 | | 383,368 | 382,801 |
| Flexential Intermediate Corporation (3 Month LIBOR +3.50%) ± | | 3.59 | 8-1-2024 | | 226,462 | 217,546 |
| Flexential Intermediate Corporation (3 Month LIBOR +7.25%) ± | | 7.33 | 8-1-2025 | | 1,425,000 | 1,313,380 |
| | | | | | | 1,913,727 |
| Software: 0.67% | | | | | | |
| Emerald Topco Incorporated (1 Month LIBOR +3.50%) ± | | 3.63 | 7-24-2026 | | 980,000 | 972,405 |
| Sophia LP (1 Month LIBOR +3.75%) ± | | 4.00 | 10-7-2027 | | 1,409,350 | 1,404,984 |
| | | | | | | 2,377,389 |
| Materials: 1.17% | | | | | | |
| Chemicals: 0.23% | | | | | | |
| Solenis Holdings LLC (1 Month LIBOR +3.75%) <± | | 4.25 | 9-21-2028 | | 800,000 | 798,664 |
The accompanying notes are an integral part of these financial statements.
Allspring Multi-Sector Income Fund | 35
Portfolio of investments—October 31, 2021
| | | Interest
rate | Maturity
date | Principal | Value |
| Containers & packaging: 0.55% | | | | | | |
| Flex Acquisition Company Incorporated (3 Month LIBOR +3.00%) ± | | 3.13% | 6-29-2025 | $ | 725,009 | $ 719,035 |
| Flex Acquisition Company Incorporated (1 Month LIBOR +3.50%) ± | | 4.00 | 2-23-2028 | | 696,500 | 694,369 |
| Graham Packaging Company Incorporated (1 Month LIBOR +3.00%) ± | | 3.75 | 8-4-2027 | | 536,120 | 534,656 |
| | | | | | | 1,948,060 |
| Paper & forest products: 0.39% | | | | | | |
| Clearwater Paper Corporation (1 Month LIBOR +3.00%) ౠ| | 3.13 | 7-26-2026 | | 59,500 | 59,351 |
| Vertical US Newco Incorporated (1 Month LIBOR +3.50%) ± | | 4.00 | 7-30-2027 | | 1,306,849 | 1,308,483 |
| | | | | | | 1,367,834 |
| Real estate: 0.50% | | | | | | |
| Equity REITs: 0.50% | | | | | | |
| The Geo Group Incorporated (3 Month LIBOR +2.00%) ± | | 2.09 | 3-22-2024 | | 1,891,857 | 1,758,349 |
| Utilities: 0.90% | | | | | | |
| Electric utilities: 0.90% | | | | | | |
| ExGen Renewables IV LLC (1 Month LIBOR +2.50%) ± | | 3.50 | 12-15-2027 | | 750,000 | 750,533 |
| PG&E Corporation (1 Month LIBOR +3.00%) ± | | 3.50 | 6-23-2025 | | 2,468,750 | 2,440,211 |
| | | | | | | 3,190,744 |
| Total Loans (Cost $66,709,265) | | | | | | 67,332,246 |
| Non-agency mortgage-backed securities: 5.58% | | | | | | |
| ACE Securities Corporation (1 Month LIBOR +2.63%) ± | | 2.71 | 6-25-2033 | | 35,656 | 35,669 |
| Banc of America Funding Corporation Series 2005 Class 5-1A1 | | 5.50 | 9-25-2035 | | 97,551 | 104,527 |
| Banc of America Funding Corporation Series 2005 Class D-A1 ±± | | 2.78 | 5-25-2035 | | 165,474 | 171,300 |
| Banc of America Merrill Lynch Commercial Mortgage Incorporated Series 2017-BNK6 Class D 144A | | 3.10 | 7-15-2060 | | 1,000,000 | 907,033 |
| Banc of America Mortgage Securities Series 2003 Class 1A1 ±± | | 2.25 | 4-25-2033 | | 247,994 | 240,582 |
| Benchmark Mortgage Trust Series 2018-B1 Class A2 | | 3.57 | 1-15-2051 | | 195,000 | 199,218 |
| Bluemountain CLO Limited Series 2015-2A Class A1R (3 Month LIBOR +0.93%) 144A± | | 1.05 | 7-18-2027 | | 228,614 | 228,732 |
| Brookside Mill CLO Limited Series 2013 Class 1A (3 Month LIBOR +2.65%) 144A± | | 2.77 | 1-17-2028 | | 1,000,000 | 991,390 |
| Centex Home Equity Series 2002-A Class AF6 | | 5.54 | 1-25-2032 | | 10,815 | 11,050 |
| Citigroup Commercial Mortgage Trust Series 2012-GC8 Class C 144A±± | | 4.88 | 9-10-2045 | | 1,000,000 | 1,005,888 |
| Citigroup Commercial Mortgage Trust Series 2017-MDRB Class A (1 Month LIBOR +1.10%) 144A± | | 1.19 | 7-15-2030 | | 203,094 | 202,369 |
The accompanying notes are an integral part of these financial statements.
36 | Allspring Multi-Sector Income Fund
Portfolio of investments—October 31, 2021
| | | Interest
rate | Maturity
date | Principal | Value |
Non-agency mortgage-backed securities
(continued) | | | | | | |
| Commercial Mortgage Trust Series 2012-CR2 Class C ±± | | 4.83% | 8-15-2045 | $ | 1,000,000 | $ 999,478 |
| Commercial Mortgage Trust Series 2012-CR4 Class B 144A | | 3.70 | 10-15-2045 | | 1,000,000 | 923,115 |
| Commercial Mortgage Trust Series 2012-CR5 Class E 144A±± | | 4.32 | 12-10-2045 | | 1,000,000 | 942,070 |
| Commercial Mortgage Trust Series 2012-LC4 Class A4 | | 3.29 | 12-10-2044 | | 49,719 | 49,730 |
| Commercial Mortgage Trust Series 2012-LC4 Class AM | | 4.06 | 12-10-2044 | | 500,000 | 503,267 |
| Commercial Mortgage Trust Series 2012-LC4 Class C ±± | | 5.61 | 12-10-2044 | | 500,000 | 470,540 |
| Commercial Mortgage Trust Series 2013-LC13 Class D 144A±± | | 5.26 | 8-10-2046 | | 1,103,000 | 1,050,837 |
| Countrywide Home Loans Series 2003-48 Class 2A2 ±± | | 2.30 | 10-25-2033 | | 28,770 | 28,674 |
| Credit Suisse First Boston Mortgage Securities Series 2002-AR25 Class 1A1 ±± | | 2.04 | 9-25-2032 | | 257,331 | 254,327 |
| Credit Suisse First Boston Mortgage Securities Series 2003-AR15 Class 3A1 ±± | | 2.30 | 6-25-2033 | | 35,380 | 36,900 |
| Credit Suisse First Boston Mortgage Securities Series 2003-AR9 Class 2A2 ±± | | 2.19 | 3-25-2033 | | 10,882 | 11,218 |
| Credit Suisse First Boston Mortgage Securities Series 2014-USA Class D 144A | | 4.37 | 9-15-2037 | | 750,000 | 704,529 |
| Global Mortgage Securitization Limited Series 2004-A Class A2 (1 Month LIBOR +0.32%) 144A± | | 0.41 | 11-25-2032 | | 33,912 | 33,119 |
| Goldman Sachs Mortgage Securities Trust Series 2010-C1 Class X 144A♀±± | | 0.73 | 8-10-2043 | | 1,322,796 | 6,413 |
| Goldman Sachs Mortgage Securities Trust Series 2012-GCJ7 Class XA ♀±± | | 1.76 | 5-10-2045 | | 1,081,602 | 2,443 |
| Goldman Sachs Mortgage Securities Trust Series 2019-GSA1 Class C ±± | | 3.80 | 11-10-2052 | | 1,000,000 | 1,048,184 |
| Goldman Sachs Mortgage Securities Trust Series 2020-DUNE Class D (1 Month LIBOR +1.90%) 144A± | | 1.99 | 12-15-2036 | | 1,000,000 | 996,850 |
| GSAA Home Equity Trust Series 2004-5 Class AF5 | | 4.36 | 6-25-2034 | | 64 | 65 |
| JPMorgan Chase Commercial Mortgage Securities Trust Series 2012-C6 Class E 144A±± | | 5.14 | 5-15-2045 | | 520,000 | 389,015 |
| JPMorgan Chase Commercial Mortgage Securities Trust Series 2013-C17 Class B ±± | | 4.89 | 1-15-2047 | | 50,000 | 53,004 |
| JPMorgan Mortgage Trust Series 2004-A3 Class 2A1 ±± | | 2.24 | 7-25-2034 | | 2,817 | 2,914 |
| JPMorgan Mortgage Trust Series 2004-A3 Class 3A3 ±± | | 2.42 | 7-25-2034 | | 19,397 | 19,311 |
| JPMorgan Mortgage Trust Series 2005-A3 Class 11A2 ±± | | 2.57 | 6-25-2035 | | 78,422 | 80,094 |
| MASTR Adjustable Rate Mortgage Trust Series 2003-6 Class 3A1 ±± | | 2.37 | 12-25-2033 | | 79,563 | 83,153 |
| MASTR Adjustable Rate Mortgage Trust Series 2003-6 Class 4A2 ±± | | 3.02 | 1-25-2034 | | 3,668 | 3,915 |
| MASTR Adjustable Rate Mortgage Trust Series 2004-13 Class 3A7 ±± | | 2.72 | 11-21-2034 | | 5,080 | 5,155 |
The accompanying notes are an integral part of these financial statements.
Allspring Multi-Sector Income Fund | 37
Portfolio of investments—October 31, 2021
| | | Interest
rate | Maturity
date | Principal | Value |
Non-agency mortgage-backed securities
(continued) | | | | | | |
| MASTR Alternative Loans Trust Series 2005-1 Class 5A1 | | 5.50% | 3-25-2036 | $ | 446 | $ 442 |
| Mid-State Trust Series 11 Class A1 | | 4.86 | 7-15-2038 | | 109,725 | 114,423 |
| MLCC Mortgage Investors Incorporated Series 2003-G Class A2 (6 Month LIBOR +0.68%) ± | | 0.86 | 1-25-2029 | | 30,691 | 30,789 |
| MMAF Equipment Finance LLC Series 2017-AA Class A4 144A | | 2.41 | 8-16-2024 | | 9,712 | 9,727 |
| Morgan Stanley Bank of America Merrill Lynch Trust Series 2012-C5 Class XA 144A♀±± | | 1.36 | 8-15-2045 | | 3,458,125 | 15,000 |
| Morgan Stanley Bank of America Merrill Lynch Trust Series 2013-C11 Class A4 ±± | | 4.15 | 8-15-2046 | | 569,000 | 594,901 |
| Morgan Stanley Bank of America Merrill Lynch Trust Series 2013-C7 Class D 144A±± | | 4.23 | 2-15-2046 | | 692,000 | 516,966 |
| Morgan Stanley Capital I Trust Series 2012-C4 Class C 144A±± | | 5.37 | 3-15-2045 | | 900,000 | 899,053 |
| Morgan Stanley Mortgage Loan Trust Series 2004-4 Class 2A ±± | | 6.38 | 9-25-2034 | | 17,686 | 19,437 |
| New Century Home Equity Loan Trust Series 2004-3 Class M1 (1 Month LIBOR +0.93%) ± | | 1.02 | 11-25-2034 | | 848,348 | 846,444 |
| Palmer Square Loan Funding Limited Series 2019-2A Class A1 (3 Month LIBOR +0.97%) 144A± | | 1.10 | 4-20-2027 | | 115,859 | 115,898 |
| Parallel Limited Series 2021-1A Class D (3 Month LIBOR +3.45%) 144A± | | 3.57 | 7-15-2034 | | 1,000,000 | 993,019 |
| Sequoia Mortgage Trust Series 2003-1 Class 1A (1 Month LIBOR +0.76%) ± | | 0.47 | 4-20-2033 | | 4,810 | 4,733 |
| SFAVE Commercial Mortgage Securities Trust Series 2015-5AVE Class D 144A±± | | 4.39 | 1-5-2043 | | 1,000,000 | 817,050 |
| Sound Point CLO Limited Series 2015-1RA Class BR (3 Month LIBOR +1.55%) 144A± | | 1.67 | 4-15-2030 | | 1,000,000 | 995,871 |
| Structured Adjustable Rate Mortgage Loan Trust Series 2004-2 Class 2A ±± | | 2.65 | 3-25-2034 | | 22,904 | 24,091 |
| Terwin Mortgage Trust Series 2003-6HE Class A3 (1 Month LIBOR +1.14%) ± | | 1.23 | 11-25-2033 | | 110,861 | 110,702 |
| Vendee Mortgage Trust Series 2003-2 Class IO ♀±± | | 0.57 | 5-15-2033 | | 1,708,122 | 29,967 |
| Verus Securitization Trust Series 2021-1 Class A2 144A±± | | 1.05 | 1-25-2066 | | 708,036 | 705,476 |
| Washington Mutual Mortgage Trust Series 2004-RA4 Class 3A | | 7.50 | 7-25-2034 | | 67,050 | 71,532 |
| Total Non-agency mortgage-backed securities (Cost $20,529,582) | | | | | | 19,711,599 |
| Yankee corporate bonds and notes: 10.00% | | | | | | |
| Communication services: 1.13% | | | | | | |
| Diversified telecommunication services: 0.61% | | | | | | |
| Intelsat Jackson Holdings SA † | | 5.50 | 8-1-2023 | | 4,300,000 | 2,160,750 |
| Media: 0.06% | | | | | | |
| Virgin Media Finance plc 144A | | 5.00 | 7-15-2030 | | 200,000 | 198,868 |
The accompanying notes are an integral part of these financial statements.
38 | Allspring Multi-Sector Income Fund
Portfolio of investments—October 31, 2021
| | | Interest
rate | Maturity
date | Principal | Value |
| Wireless telecommunication services: 0.46% | | | | | | |
| Connect U.S. Finco LLC 144A | | 6.75% | 10-1-2026 | $ | 750,000 | $ 778,125 |
| Telesat Canada 144A | | 5.63 | 12-6-2026 | | 360,000 | 336,042 |
| VMED O2 UK Financing I plc 144A | | 4.75 | 7-15-2031 | | 500,000 | 502,500 |
| | | | | | | 1,616,667 |
| Energy: 1.14% | | | | | | |
| Oil, gas & consumable fuels: 1.14% | | | | | | |
| Baytex Energy Corporation 144A | | 8.75 | 4-1-2027 | | 1,800,000 | 1,921,500 |
| Husky Energy Incorporated | | 4.40 | 4-15-2029 | | 750,000 | 838,705 |
| Northriver Midstream Finance LP 144A | | 5.63 | 2-15-2026 | | 1,227,000 | 1,266,878 |
| | | | | | | 4,027,083 |
| Financials: 2.17% | | | | | | |
| Banks: 0.98% | | | | | | |
| ABN AMRO Bank NV 144A | | 4.80 | 4-18-2026 | | 750,000 | 833,987 |
| Banco del Estado de Chile 144A | | 3.88 | 2-8-2022 | | 650,000 | 653,250 |
| Corporación Andina de Fomento | | 4.38 | 6-15-2022 | | 958,000 | 978,586 |
| NatWest Group plc (5 Year Treasury Constant Maturity +2.35%) ± | | 3.03 | 11-28-2035 | | 1,000,000 | 995,039 |
| | | | | | | 3,460,862 |
| Capital markets: 0.19% | | | | | | |
| Credit Suisse Group AG (5 Year Treasury Constant Maturity +3.55%) 144Aʊ± | | 4.50 | 9-3-2030 | | 700,000 | 680,540 |
| Diversified financial services: 0.18% | | | | | | |
| Castlelake Aviation Finance 144A | | 5.00 | 4-15-2027 | | 630,000 | 628,230 |
| Insurance: 0.82% | | | | | | |
| Allied World Assurance Company Holdings Limited | | 4.35 | 10-29-2025 | | 385,000 | 415,723 |
| Athene Holding Limited | | 4.13 | 1-12-2028 | | 750,000 | 830,747 |
| Fairfax Financial Holdings Limited | | 4.85 | 4-17-2028 | | 750,000 | 849,991 |
| Sompo International Holdings Limited | | 7.00 | 7-15-2034 | | 575,000 | 779,470 |
| | | | | | | 2,875,931 |
| Health care: 2.14% | | | | | | |
| Biotechnology: 0.06% | | | | | | |
| Grifols Escrow Issuer SA 144A | | 4.75 | 10-15-2028 | | 230,000 | 233,450 |
| Pharmaceuticals: 2.08% | | | | | | |
| Bausch Health Companies Incorporated 144A | | 4.88 | 6-1-2028 | | 380,000 | 391,324 |
| Bausch Health Companies Incorporated 144A | | 5.25 | 1-30-2030 | | 450,000 | 406,136 |
| Bausch Health Companies Incorporated 144A | | 5.50 | 11-1-2025 | | 375,000 | 381,026 |
| Bausch Health Companies Incorporated 144A | | 6.13 | 4-15-2025 | | 1,581,000 | 1,610,280 |
| Bausch Health Companies Incorporated 144A | | 6.25 | 2-15-2029 | | 600,000 | 581,250 |
| Bausch Health Companies Incorporated 144A | | 7.00 | 1-15-2028 | | 100,000 | 101,264 |
| Bausch Health Companies Incorporated 144A | | 7.25 | 5-30-2029 | | 50,000 | 50,676 |
| Teva Pharmaceutical Finance Netherlands III BV | | 6.00 | 4-15-2024 | | 3,110,000 | 3,261,613 |
| Teva Pharmaceutical Finance Netherlands III BV | | 6.75 | 3-1-2028 | | 500,000 | 547,500 |
| | | | | | | 7,331,069 |
The accompanying notes are an integral part of these financial statements.
Allspring Multi-Sector Income Fund | 39
Portfolio of investments—October 31, 2021
| | | Interest
rate | Maturity
date | Principal | Value |
| Industrials: 2.89% | | | | | | |
| Aerospace & defense: 0.53% | | | | | | |
| Bombardier Incorporated 144A | | 6.00% | 2-15-2028 | $ | 185,000 | $ 186,619 |
| Bombardier Incorporated 144A | | 7.13 | 6-15-2026 | | 270,000 | 283,163 |
| Bombardier Incorporated 144A | | 7.88 | 4-15-2027 | | 1,350,000 | 1,403,123 |
| | | | | | | 1,872,905 |
| Airlines: 0.90% | | | | | | |
| Air Canada 144A | | 3.88 | 8-15-2026 | | 370,000 | 374,625 |
| Air Canada 2020-1 Class C Pass-Through Trust 144A | | 10.50 | 7-15-2026 | | 2,276,000 | 2,793,790 |
| | | | | | | 3,168,415 |
| Electrical equipment: 0.25% | | | | | | |
| Sensata Technologies BV 144A | | 4.00 | 4-15-2029 | | 365,000 | 370,716 |
| Sensata Technologies BV 144A | | 5.00 | 10-1-2025 | | 260,000 | 284,809 |
| TE Connectivity | | 3.50 | 2-3-2022 | | 225,000 | 225,020 |
| | | | | | | 880,545 |
| Machinery: 0.07% | | | | | | |
| Vertical Holdco GmbH 144A | | 7.63 | 7-15-2028 | | 224,000 | 237,440 |
| Metals & mining: 0.22% | | | | | | |
| Glencore Finance Canada Limited 144A | | 4.25 | 10-25-2022 | | 750,000 | 774,983 |
| Road & rail: 0.21% | | | | | | |
| Canadian Pacific Railway Company | | 4.50 | 1-15-2022 | | 750,000 | 756,088 |
| Trading companies & distributors: 0.71% | | | | | | |
| Carlyle Aviation Elevate Merger Subsidiary Limited 144A | | 7.00 | 10-15-2024 | | 2,575,000 | 2,528,302 |
| Materials: 0.38% | | | | | | |
| Containers & packaging: 0.38% | | | | | | |
| Ardagh Packaging Finance plc 144A | | 4.13 | 8-15-2026 | | 75,000 | 76,502 |
| Ardagh Packaging Finance plc 144A | | 5.25 | 4-30-2025 | | 125,000 | 130,000 |
| OI European Group BV 144A | | 4.00 | 3-15-2023 | | 1,100,000 | 1,125,025 |
| | | | | | | 1,331,527 |
| Utilities: 0.15% | | | | | | |
| Multi-utilities: 0.15% | | | | | | |
| Veolia Environnement SA | | 6.75 | 6-1-2038 | | 350,000 | 524,401 |
| Total Yankee corporate bonds and notes (Cost $36,369,169) | | | | | | 35,288,056 |
The accompanying notes are an integral part of these financial statements.
40 | Allspring Multi-Sector Income Fund
Portfolio of investments—October 31, 2021
| | | Yield | | Shares | Value |
| Short-term investments: 3.37% | | | | | | |
| Investment companies: 3.37% | | | | | | |
| Allspring Government Money Market Fund Select Class ♠∞## | | 0.03% | | | 11,880,250 | $ 11,880,250 |
| Total Short-term investments (Cost $11,880,250) | | | | | | 11,880,250 |
| Total investments in securities (Cost $487,980,880) | 139.89% | | | | | 493,712,123 |
| Other assets and liabilities, net | (39.89) | | | | | (140,771,089) |
| Total net assets | 100.00% | | | | | $ 352,941,034 |
| ± | Variable rate investment. The rate shown is the rate in effect at period end. |
| 144A | The security may be resold in transactions exempt from registration, normally to qualified institutional buyers, pursuant to Rule 144A under the Securities Act of 1933. |
| ±± | The coupon of the security is adjusted based on the principal and/or interest payments received from the underlying pool of mortgages as well as the credit quality and the actual prepayment speed of the underlying mortgages. The rate shown is the rate in effect at period end. |
| ♀ | Investment in an interest-only security that entitles holders to receive only the interest payments on the underlying mortgages. The principal amount shown is the notional amount of the underlying mortgages. The rate represents the coupon rate. |
| † | Non-income-earning security |
| ♦ | The security is fair valued in accordance with procedures approved by the Board of Trustees. |
| < | All or a portion of the position represents an unfunded loan commitment. The rate represents the current interest rate if the loan is partially funded. |
| ‡ | Security is valued using significant unobservable inputs. |
| ## | All or a portion of this security is segregated for when-issued securities and unfunded loans. |
| ♠ | The issuer of the security is an affiliated person of the Fund as defined in the Investment Company Act of 1940. |
| ∞ | The rate represents the 7-day annualized yield at period end. |
| %% | The security is purchased on a when-issued basis. |
| ʊ | Security is perpetual in nature and has no stated maturity date. The date shown reflects the next call date. |
| Abbreviations: |
| BRL | Brazilian real |
| CNY | China yuan |
| COP | Colombian peso |
| FHLMC | Federal Home Loan Mortgage Corporation |
| FNMA | Federal National Mortgage Association |
| GNMA | Government National Mortgage Association |
| IDR | Indonesian rupiah |
| INR | Indian rupee |
| LIBOR | London Interbank Offered Rate |
| MXN | Mexican peso |
| MYR | Malaysian ringgit |
| REIT | Real estate investment trust |
| RON | Romanian lei |
| RUB | Russian ruble |
| SOFR | Secured Overnight Financing Rate |
| TTD | Trinidad and Tobago dollar |
| ZAR | South African rand |
The accompanying notes are an integral part of these financial statements.
Allspring Multi-Sector Income Fund | 41
Portfolio of investments—October 31, 2021
Investments in affiliates
An affiliated investment is an investment in which the Fund owns at least 5% of the outstanding voting shares of the issuer or as a result of other relationships, such as the Fund and the issuer having the same adviser or investment manager. Transactions with issuers that were either affiliates of the Fund at the beginning of the period or the end of the period were as follows:
| | Value,
beginning of
period | Purchases | Sales
proceeds | Net
realized
gains
(losses) | Net
change in
unrealized
gains
(losses) | Value,
end of
period | Shares,
end
of period | Income
from
affiliated
securities |
| Short-term investments | | | | | | | |
| Allspring Government Money Market Fund Select Class | $6,300,394 | $145,119,728 | $(139,539,872) | $0 | $0 | $11,880,250 | 11,880,250 | $3,770 |
The accompanying notes are an integral part of these financial statements.
42 | Allspring Multi-Sector Income Fund
Statement of assets and liabilities—October 31, 2021
| | |
| Assets | |
Investments in unaffiliated securities, at value (cost $476,100,630)
| $ 481,831,873 |
Investments in affiliated securities, at value (cost $11,880,250)
| 11,880,250 |
Foreign currency, at value (cost $174,911)
| 174,952 |
Receivable for dividends and interest
| 6,305,051 |
Receivable for investments sold
| 2,224,264 |
Principal paydown receivable
| 54,695 |
Prepaid expenses and other assets
| 13,272 |
Total assets
| 502,484,357 |
| Liabilities | |
Secured borrowing payable
| 139,000,000 |
Payable for investments purchased
| 6,849,995 |
Dividends payable
| 2,700,974 |
Advisory fee payable
| 230,833 |
Administration fee payable
| 20,985 |
Accrued expenses and other liabilities
| 740,536 |
Total liabilities
| 149,543,323 |
Total net assets
| $352,941,034 |
| Net assets consist of | |
Paid-in capital
| $ 386,193,507 |
Total distributable loss
| (33,252,473) |
Total net assets
| $352,941,034 |
| Net asset value per share | |
Based on $352,941,034 divided by 28,084,035 shares issued and outstanding (100,000,000 shares authorized)
| $12.57 |
The accompanying notes are an integral part of these financial statements.
Allspring Multi-Sector Income Fund | 43
Statement of operations—year ended October 31, 2021
| | |
| Investment income | |
Interest (net of foreign withholding taxes of $305,664)
| $ 26,340,944 |
Dividends
| 45,349 |
Income from affiliated securities
| 3,770 |
Total investment income
| 26,390,063 |
| Expenses | |
Advisory fee
| 2,742,607 |
Administration fee
| 249,328 |
Custody and accounting fees
| 404 |
Professional fees
| 61,860 |
Shareholder report expenses
| 34,674 |
Trustees’ fees and expenses
| 19,219 |
Transfer agent fees
| 18,641 |
Interest expense
| 1,139,454 |
Other fees and expenses
| 30,652 |
Total expenses
| 4,296,839 |
Net investment income
| 22,093,224 |
| Realized and unrealized gains (losses) on investments | |
| Net realized gains (losses) on | |
Unaffiliated securities
| 6,376,972 |
Foreign currency and foreign currency translations
| (341,337) |
Net realized gains on investments
| 6,035,635 |
| Net change in unrealized gains (losses) on | |
Unaffiliated securities(net of deferred foreign capital gain tax of $(52,046))
| 15,135,330 |
Foreign currency and foreign currency translations
| 4,234 |
Net change in unrealized gains (losses) on investments
| 15,139,564 |
Net realized and unrealized gains (losses) on investments
| 21,175,199 |
Net increase in net assets resulting from operations
| $43,268,423 |
The accompanying notes are an integral part of these financial statements.
44 | Allspring Multi-Sector Income Fund
Statement of changes in net assets
| | | |
| | Year ended
October 31, 2021 | Year ended
October 31, 2020 |
| Operations | | |
Net investment income
| $ 22,093,224 | $ 22,683,920 |
Net realized gains (losses) on investments
| 6,035,635 | (13,785,225) |
Net change in unrealized gains (losses) on investments
| 15,139,564 | (10,073,393) |
Net increase (decrease) in net assets resulting from operations
| 43,268,423 | (1,174,698) |
| Distributions to shareholders from | | |
Net investment income and net realized gains
| (22,656,911) | (19,260,099) |
Tax basis return of capital
| (8,737,398) | (15,609,126) |
Total distributions to shareholders
| (31,394,309) | (34,869,225) |
| Capital share transactions | | |
Net asset value of common shares issued under the Automatic Dividend Reinvestment Plan
| 211,903 | 0 |
Cost of shares repurchased
| (3,698,472) | (23,309,557) |
Net decrease from capital share transactions
| (3,486,569) | (23,309,557) |
Total increase (decrease) in net assets
| 8,387,545 | (59,353,480) |
| Net assets | | |
Beginning of period
| 344,553,489 | 403,906,969 |
End of period
| $352,941,034 | $344,553,489 |
The accompanying notes are an integral part of these financial statements.
Allspring Multi-Sector Income Fund | 45
Statement of cash flows—year ended October 31, 2021
| | |
| Cash flows from operating activities: | |
Net increase in net assets resulting from operations
| $ 43,268,423 |
| Adjustments to reconcile net increase in net assets from operations to net cash provided by operating activities: | |
Purchase of long-term securities
| (248,421,258) |
Proceeds from the sales of long-term securities
| 264,847,275 |
Paydowns
| 2,245,580 |
Amortization, net
| 326,004 |
Purchases and sales of short-term securities, net
| (5,579,856) |
Decrease in receivable for investments sold
| 2,651,810 |
Increase in principal paydown receivable
| (49,683) |
Increase in receivable for dividends and interest
| (124,410) |
Increase in prepaid expenses and other assets
| (8,849) |
Decrease in payable for investments purchased
| (2,843,686) |
Decrease in trustees’ fees and expenses payable
| (2,810) |
Decrease in advisory fee payable
| (3,952) |
Decrease in administration fee payable
| (359) |
Decrease in accrued expenses and other liabilities
| (262,627) |
Litigation payments received
| 291 |
Net realized gains on investments
| (6,035,635) |
Net change in unrealized gains (losses) on investments
| (15,139,564) |
Net cash provided by operating activities
| 34,866,694 |
| Cash flows from financing activities: | |
Cost of shares repurchased
| (3,698,472) |
Cash distributions paid
| (31,162,925) |
Net cash used in financing activities
| (34,861,397) |
Net increase in cash
| 5,297 |
| Cash (including foreign currency): | |
Beginning of period
| 169,655 |
End of period
| $ 174,952 |
| Supplemental cash disclosure | |
Cash paid for interest
| $ 1,110,443 |
| Supplemental non-cash financing disclosure | |
Reinvestment of dividends
| $ 211,903 |
The accompanying notes are an integral part of these financial statements.
46 | Allspring Multi-Sector Income Fund
Financial highlights
(For a share outstanding throughout each period)
| | Year ended October 31 |
| | 2021 | 2020 | 2019 | 2018 | 2017 |
Net asset value, beginning of period
| $12.14 | $13.21 | $13.10 | $14.31 | $14.35 |
Net investment income
| 0.79 1 | 0.76 1 | 0.81 1 | 0.85 1 | 0.97 1 |
Net realized and unrealized gains (losses) on investments
| 0.75 | (0.86) | 0.48 | (0.92) | 0.18 |
Total from investment operations
| 1.54 | (0.10) | 1.29 | (0.07) | 1.15 |
| Distributions to shareholders from | | | | | |
Net investment income
| (0.81) | (0.65) | (0.70) | (0.46) | (0.70) |
Tax basis return of capital
| (0.31) | (0.52) | (0.52) | (0.83) | (0.53) |
Total distributions to shareholders
| (1.12) | (1.17) | (1.22) | (1.29) | (1.23) |
Anti-dilutive effect of shares repurchased
| 0.01 | 0.20 | 0.04 | 0.15 | 0.04 |
Net asset value, end of period
| $12.57 | $12.14 | $13.21 | $13.10 | $14.31 |
Market value, end of period
| $13.34 | $10.85 | $12.67 | $11.57 | $13.05 |
Total return based on market value2
| 34.28% | (5.09)% | 20.91% | (1.91)% | 13.07% |
| Ratios to average net assets (annualized) | | | | | |
Expenses3
| 1.19% | 1.75% | 2.29% | 2.14% | 1.68% |
Net investment income3
| 6.14% | 6.15% | 6.17% | 6.12% | 6.73% |
| Supplemental data | | | | | |
Portfolio turnover rate
| 47% | 36% | 26% | 25% | 38% |
Net assets, end of period (000s omitted)
| $352,941 | $344,553 | $403,907 | $413,317 | $499,824 |
Borrowings outstanding, end of period (000s omitted)
| $139,000 | $139,000 | $173,000 | $187,000 | $187,000 |
Asset coverage per $1,000 of borrowing, end of period
| $3,539 | $3,479 | $3,335 | $3,210 | $3,673 |
| 1 | Calculated based upon average shares outstanding |
| 2 | Total return is calculated assuming a purchase of common stock on the first day and a sale on the last day of the period reported. Dividends and distributions, if any, are assumed for purposes of these calculations to be reinvested at prices obtained under the Fund’s Automatic Dividend Reinvestment Plan. Total return does not reflect brokerage commissions that a shareholder would pay on the purchase and sale of shares. |
| 3 | Ratios include interest expense relating to interest associated with borrowings and/or leverage transactions as follows: |
| Year ended October 31, 2021 | 0.32% |
| Year ended October 31, 2020 | 0.80% |
| Year ended October 31, 2019 | 1.32% |
| Year ended October 31, 2018 | 1.07% |
| Year ended October 31, 2017 | 0.61% |
The accompanying notes are an integral part of these financial statements.
Allspring Multi-Sector Income Fund | 47
Notes to financial statements
1. ORGANIZATION
Allspring Multi-Sector Income Fund (the “Fund”) was organized as a statutory trust under the laws of the state of Delaware on April 10, 2003 and is registered as a diversified closed-end management investment company under the Investment Company Act of 1940, as amended (the “1940 Act”). As an investment company, the Fund follows the accounting and reporting guidance in Financial Accounting Standards Board (“FASB”) Accounting Standards Codification Topic 946, Financial Services – Investment Companies.
On February 23, 2021, Wells Fargo & Company announced that it has entered into a definitive agreement to sell Wells Fargo Asset Management (“WFAM”) to GTCR LLC and Reverence Capital Partners, L.P. WFAM is the trade name used by the asset management businesses of Wells Fargo & Company and includes Wells Fargo Funds Management, LLC, the adviser to the Fund, and Wells Capital Management, LLC and Wells Fargo Asset Management (International) Limited, the subadvisers to the Fund. As part of the transaction, Wells Fargo & Company would own a 9.9% equity interest.
Consummation of the transaction will result in the automatic termination of the Fund’s investment advisory agreement and subadvisory agreements. The Fund’s Board of Trustees approved a new investment advisory agreement and new subadvisory agreements which were submitted to the Fund’s shareholders for approval at a Special Meeting of Shareholders held on August 16, 2021. Shareholders of record of the Fund at the close of business on May 28, 2021 approved the new agreements which will take effect upon the closing of the transaction.
As more fully discussed in Note 12, the transaction closed on November 1, 2021 and the adviser and subadvisers changed their names to Allspring Funds Management, LLC, Allspring Global Investments, LLC and Allspring Global Investments (UK) Limited, respectively. While these name changes occurred after the end of the period, throughout this report, the new names have been used.
The Board of Trustees of the Wells Fargo Funds voted on July 15, 2021 to approve a change to the Fund's name to remove "Wells Fargo" from the name and replace it with "Allspring", effective December 6, 2021.
2. SIGNIFICANT ACCOUNTING POLICIES
The following significant accounting policies, which are consistently followed in the preparation of the financial statements of the Fund, are in conformity with U.S. generally accepted accounting principles which require management to make estimates and assumptions that affect the reported amounts of assets and liabilities, disclosure of contingent assets and liabilities at the date of the financial statements, and the reported amounts of income and expenses during the reporting period. Actual results could differ from those estimates.
Securities valuation
All investments are valued each business day as of the close of regular trading on the New York Stock Exchange (generally 4 p.m. Eastern Time), although the Fund may deviate from this calculation time under unusual or unexpected circumstances.
Debt securities are valued at the evaluated bid price provided by an independent pricing service (e.g. taking into account various factors, including yields, maturities, or credit ratings) or, if a reliable price is not available, the quoted bid price from an independent broker-dealer.
Equity securities that are listed on a foreign or domestic exchange or market are valued at the official closing price or, if none, the last sales price. If no sale occurs on the principal exchange or market that day, a fair value price will be determined in accordance with the Fund’s Valuation Procedures.
The values of securities denominated in foreign currencies are translated into U.S. dollars at rates provided by an independent foreign currency pricing source at a time each business day specified by the Allspring Global Investments Pricing Committee at Allspring Funds Management, LLC ("Allspring Funds Management").
Investments in registered open-end investment companies are valued at net asset value.
Investments which are not valued using any of the methods discussed above are valued at their fair value, as determined in good faith by the Board of Trustees. The Board of Trustees has established a Valuation Committee comprised of the Trustees and has delegated to it the authority to take any actions regarding the valuation of portfolio securities that the Valuation Committee deems necessary or appropriate, including determining the fair value of portfolio securities, unless the determination has been delegated to the Allspring Global Investments Pricing Committee. The Board of Trustees retains the authority to make or ratify any valuation decisions or approve any changes to the Valuation Procedures as it deems appropriate. On a quarterly basis, the Board of Trustees receives reports on any valuation actions taken by the Valuation Committee or the Allspring Global Investments Pricing Committee which may include items for ratification.
48 | Allspring Multi-Sector Income Fund
Notes to financial statements
Foreign currency translation
The accounting records of the Fund are maintained in U.S. dollars. The values of other assets and liabilities denominated in foreign currencies are translated into U.S. dollars at rates provided by an independent foreign currency pricing source at a time each business day specified by the Allspring Global Investments Pricing Committee. Purchases and sales of securities, and income and expenses are converted at the rate of exchange on the respective dates of such transactions. Net realized foreign exchange gains or losses arise from sales of foreign currencies, currency gains or losses realized between the trade and settlement dates on securities transactions, and the difference between the amounts of dividends, interest and foreign withholding taxes recorded and the U.S. dollar equivalent of the amounts actually paid or received. Net unrealized foreign exchange gains and losses arise from changes in the fair value of assets and liabilities other than investments in securities resulting from changes in exchange rates. The changes in net assets arising from changes in exchange rates of securities and the changes in net assets resulting from changes in market prices of securities are not separately presented. Such changes are included in net realized and unrealized gains or losses from investments.
When-issued transactions
The Fund may purchase securities on a forward commitment or when-issued basis. The Fund records a when-issued transaction on the trade date and will segregate assets in an amount at least equal in value to the Fund's commitment to purchase when-issued securities. Securities purchased on a when-issued basis are marked-to-market daily and the Fund begins earning interest on the settlement date. Losses may arise due to changes in the market value of the underlying securities or if the counterparty does not perform under the contract.
Loans
The Fund may invest in direct debt instruments which are interests in amounts owed to lenders by corporate or other borrowers. The loans pay interest at rates which are periodically reset by reference to a base lending rate plus a spread. Investments in loans may be in the form of participations in loans or assignments of all or a portion of loans from third parties. When the Fund purchases participations, it generally has no rights to enforce compliance with the terms of the loan agreement with the borrower. As a result, the Fund assumes the credit risk of both the borrower and the lender that is selling the participation. When the Fund purchases assignments from lenders, it acquires direct rights against the borrower on the loan and may enforce compliance by the borrower with the terms of the loan agreement. Loans may include fully funded term loans or unfunded loan commitments, which are contractual obligations for future funding.
Security transactions and income recognition
Securities transactions are recorded on a trade date basis. Realized gains or losses are recorded on the basis of identified cost.
Interest income is accrued daily and bond discounts are accreted and premiums are amortized daily. To the extent debt obligations are placed on non-accrual status, any related interest income may be reduced by writing off interest receivables when the collection of all or a portion of interest has been determined to be doubtful based on consistently applied procedures and the fair value has decreased. If the issuer subsequently resumes interest payments or when the collectability of interest is reasonably assured, the debt obligation is removed from non-accrual status. Paydown gains and losses are included in interest income.
Dividend income is recognized on the ex-dividend date.
Income is recorded net of foreign taxes withheld where recovery of such taxes is not assured.
Distributions to shareholders
Under a managed distribution plan, the Fund pays monthly distributions to shareholders at an annual minimum fixed rate of 9% based on the Fund’s average monthly net asset value per share over the prior 12 months. The monthly distributions may be sourced from income, paid-in capital, and/or capital gains, if any. To the extent that sufficient investment income is not available on a monthly basis, the Fund may distribute paid-in capital and/ or capital gains, if any, in order to maintain its managed distribution level.
Distributions to shareholders from net investment income and net realized gains, if any, are recorded on the ex-dividend date. Such distributions are determined in accordance with income tax regulations and may differ from U.S. generally accepted accounting principles. Dividend sources are estimated at the time of declaration. The tax character of distributions is determined as of the Fund’s fiscal year end. Therefore, a portion of the Fund’s distributions made prior to the Fund’s fiscal year end may be categorized as a tax return of capital at year end.
Allspring Multi-Sector Income Fund | 49
Notes to financial statements
Federal and other taxes
The Fund intends to continue to qualify as a regulated investment company by distributing substantially all of its investment company taxable income and any net realized capital gains (after reduction for capital loss carryforwards) sufficient to relieve it from all, or substantially all, federal income taxes. Accordingly, no provision for federal income taxes was required.
The Fund’s income and federal excise tax returns and all financial records supporting those returns for the prior three fiscal years are subject to examination by the federal and Delaware revenue authorities. Management has analyzed the Fund's tax positions taken on federal, state, and foreign tax returns for all open tax years and does not believe that there are any uncertain tax positions that require recognition of a tax liability.
As of October 31, 2021, the aggregate cost of all investments for federal income tax purposes was $490,229,202 and the unrealized gains (losses) consisted of:
| Gross unrealized gains | $ 19,096,082 |
| Gross unrealized losses | (15,613,161) |
| Net unrealized gains | $ 3,482,921 |
As of October 31, 2021, the Fund had capital loss carryforwards which consisted of $10,696,586 in short-term capital losses and $23,225,728 in long-term capital losses.
3. FAIR VALUATION MEASUREMENTS
Fair value measurements of investments are determined within a framework that has established a fair value hierarchy based upon the various data inputs utilized in determining the value of the Fund’s investments. The three-level hierarchy gives the highest priority to unadjusted quoted prices in active markets for identical assets or liabilities (Level 1) and the lowest priority to unobservable inputs (Level 3). The Fund’s investments are classified within the fair value hierarchy based on the lowest level of input that is significant to the fair value measurement. The inputs are summarized into three broad levels as follows:
| ■ | Level 1 – quoted prices in active markets for identical securities |
| ■ | Level 2 – other significant observable inputs (including quoted prices for similar securities, interest rates, prepayment speeds, credit risk, etc.) |
| ■ | Level 3 – significant unobservable inputs (including the Fund’s own assumptions in determining the fair value of investments) |
The inputs or methodologies used for valuing investments in securities are not necessarily an indication of the risk associated with investing in those securities.
50 | Allspring Multi-Sector Income Fund
Notes to financial statements
The following is a summary of the inputs used in valuing the Fund’s assets and liabilities as of October 31, 2021:
| | Quoted prices
(Level 1) | Other significant
observable inputs
(Level 2) | Significant
unobservable inputs
(Level 3) | Total |
| Assets | | | | |
| Investments in: | | | | |
| Agency securities | $ 0 | $ 3,092,843 | $ 0 | $ 3,092,843 |
| Asset-backed securities | 0 | 3,584,362 | 0 | 3,584,362 |
| Common stocks | | | | |
| Energy | 2,517,430 | 0 | 0 | 2,517,430 |
| Financials | 1,459,833 | 0 | 0 | 1,459,833 |
| Corporate bonds and notes | 0 | 244,259,234 | 0 | 244,259,234 |
| Foreign corporate bonds and notes | 0 | 17,769,662 | 0 | 17,769,662 |
| Foreign government bonds | 0 | 86,816,608 | 0 | 86,816,608 |
| Loans | 0 | 62,001,542 | 5,330,704 | 67,332,246 |
| Non-agency mortgage-backed securities | 0 | 19,711,599 | 0 | 19,711,599 |
| Yankee corporate bonds and notes | 0 | 35,288,056 | 0 | 35,288,056 |
| Short-term investments | | | | |
| Investment companies | 11,880,250 | 0 | 0 | 11,880,250 |
| Total assets | $15,857,513 | $472,523,906 | $5,330,704 | $493,712,123 |
Additional sector, industry or geographic detail, if any, is included in the Portfolio of Investments.
The following is a reconciliation of assets in which significant unobservable inputs (Level 3) were used in determining fair value:
| | Loans |
| Balance as of October 31, 2020 | $ 5,577,354 |
| Accrued discounts (premiums) | 4,642 |
| Realized gains (losses) | (29,836) |
| Change in unrealized gains (losses) | 127,857 |
| Purchases | 3,772,448 |
| Sales | (5,531,282) |
| Transfer into Level 3 | 3,304,866 |
| Transfers out of Level 3 | (1,895,345) |
| Balance as of October 31, 2021 | $ 5,330,704 |
| Change in unrealized gains (losses) relating to securities still held at October 31, 2021 | $ 6,903 |
The investment type categorized above was valued using indicative broker quotes. These indicative broker quotes are considered Level 3 inputs. Quantitative unobservable inputs used by the brokers are often proprietary and not provided to the Fund and therefore the disclosure that would address these inputs is not included above.
4. TRANSACTIONS WITH AFFILIATES
Advisory fee
Allspring Funds Management, a wholly owned subsidiary of Allspring Global Investments Holdings, LLC, a holding company indirectly owned by Wells Fargo & Company as of October 31, 2021, is the adviser to the Fund and is entitled to receive a fee at an annual rate of 0.55% of the Fund’s average daily total assets. Total assets consist of the net assets of the Fund plus borrowings or other leverage for investment purposes to the extent excluded in calculating net assets.
Allspring Funds Management has retained the services of subadvisers to provide daily portfolio management to the Fund. The fee for subadvisory services is borne by Allspring Funds Management. Allspring Global Investments, LLC, an affiliate of Allspring Funds Management and a wholly owned subsidiary of Allspring Global Investments Holdings, LLC, is a subadviser to the Fund and is entitled to receive a fee from Allspring Funds Management at an annual rate of 0.30% of the Fund’s average daily total assets. Allspring Global Investments (UK) Limited, an affiliate of Allspring Funds Management and wholly owned subsidiary of
Allspring Multi-Sector Income Fund | 51
Notes to financial statements
Allspring Global Investments Holdings, LLC, is also a subadviser to the Fund and is entitled to receive a fee from Allspring Funds Management at an annual rate of 0.10% of the Fund’s average daily total assets.
Administration fee
Allspring Funds Management also serves as the administrator to the Fund, providing the Fund with a wide range of administrative services necessary to the operation of the Fund. Allspring Funds Management is entitled to receive an annual administration fee from the Fund equal to 0.05% of the Fund’s average daily total assets.
Interfund transactions
The Fund may purchase or sell portfolio investment securities to certain affiliates pursuant to Rule 17a-7 under the 1940 Act and under procedures adopted by the Board of Trustees. The procedures have been designed to ensure that these interfund transactions, which do not incur broker commissions, are effected at current market prices. Pursuant to these procedures, the Fund had $3,253,861, $2,323,950 and $99,781 in interfund purchases, sales and net realized gains (losses), respectively, during the year ended October 31, 2021.
5. CAPITAL SHARE TRANSACTIONS
The Fund has authorized capital of 100,000,000 shares with no par value. For the years ended October 31, 2021 and October 31, 2020, the Fund issued 16,436 and 0 shares, respectively.
On November 17, 2020, the Fund announced a renewal of its open-market share repurchase program (the “Buyback Program”). Under the renewed Buyback Program, the Fund is authorized to repurchase up to 10% of its outstanding shares in open market transactions during the period beginning on January 1, 2021 and ending on December 31, 2021. The Fund’s Board of Trustees has delegated to Allspring Funds Management full discretion to administer the Buyback Program including the determination of the amount and timing of repurchases in accordance with the best interests of the Fund and subject to applicable legal limitations. During the year ended October 31, 2021, the Fund purchased 320,866 of its shares on the open market at a total cost of $3,698,472 (weighted average price per share of $11.51). The weighted average discount of these repurchased shares was 8.87%.
6. BORROWINGS
The Fund has borrowed $139,000,000 through a revolving credit facility administered by a major financial institution (the “Facility”). The Facility has a commitment amount of $139,000,000. The Fund is charged interest at the 30 day London Interbank Offered Rate (LIBOR) plus 0.70% or the 1 Month LIBOR plus 0.70% and a commitment fee of 0.15% per annum of the unutilized amount of the commitment amount. With the market-wide transition away from LIBOR, when the 1 Month LIBOR ceases to be published (currently through June 30, 2023), the Fund will adopt the Secured Overnight Financing Rate (SOFR) in lieu of LIBOR. The financial institution holds a security interest in all the assets of the Fund as collateral for the borrowing. Based on the nature of the terms of the Facility and comparative market rates, the carrying amount of the borrowings at October 31, 2021 approximates its fair value. If measured at fair value, the borrowings would be categorized as Level 2 under the fair value hierarchy.
During the year ended October 31, 2021, the Fund had average borrowings outstanding of $139,000,000 at an average interest rate of 0.82% and paid interest in the amount of $1,139,454, which represents 0.32% of its average daily net assets.
7. INVESTMENT PORTFOLIO TRANSACTIONS
Purchases and sales of investments, excluding U.S. government obligations (if any) and short-term securities, for the year ended October 31, 2021 were $248,421,258 and $226,858,462, respectively.
As of October 31, 2021, the Fund had the following unfunded loan commitments:
52 | Allspring Multi-Sector Income Fund
Notes to financial statements
| | Unfunded commitments | Unrealized
gain (loss) |
| Apergy Corporation, 6.00%, 6-3-2027 | $ 1,800,987 | $ 14,159 |
| Asurion LLC, 5.34%, 1-31-2028 | 800,000 | (1,471) |
| DIRECTV Financing LLC, 5.75%, 7-22-2027 | 345,000 | 311 |
| MIP V Waste Holdings LLC, 3.75%,10-27-2028 | 350,000 | 2,188 |
| National Mentor Holdings Incorporated, 3.75%, 3-2-2028 | 29,867 | (199) |
| National Mentor Holdings Incorporated, 4.50%, 3-2-2028 | 20,262 | (144) |
| National Mentor Holdings Incorporated, 4.50%, 3-2-2028 | 605,007 | (4,290) |
| Solenis Holdings LLC, 4.25%, 9-21-2028 | 800,000 | 664 |
| | $4,751,123 | $11,218 |
8. DISTRIBUTIONS TO SHAREHOLDERS
The tax character of distributions paid during the years ended October 31, 2021 and October 31, 2020 were as follows:
| | Year ended October 31 |
| | 2021 | 2020 |
| Ordinary income | $22,656,911 | $19,260,099 |
| Tax basis return of capital | 8,737,398 | 15,609,126 |
As of October 31, 2021, the components of distributable earnings on a tax basis were as follows:
Unrealized
gains | Capital loss
carryforward |
| $3,414,930 | $(33,922,314) |
9. INDEMNIFICATION
Under the Fund's organizational documents, the officers and Trustees have been granted certain indemnification rights against certain liabilities that may arise out of performance of their duties to the Fund. The Fund has entered into a separate agreement with each Trustee that converts indemnification rights currently existing under the Fund’s organizational documents into contractual rights that cannot be changed in the future without the consent of the Trustee. Additionally, in the normal course of business, the Fund may enter into contracts with service providers that contain a variety of indemnification clauses. The Fund’s maximum exposure under these arrangements is dependent on future claims that may be made against the Fund and, therefore, cannot be estimated.
10. CORONAVIRUS (COVID-19) PANDEMIC
On March 11, 2020, the World Health Organization announced that it had made the assessment that coronavirus disease 2019 (“COVID-19”) is a pandemic. The impacts of COVID-19 are affecting the entire global economy, individual companies and investment products, the funds, and the market in general. There is significant uncertainty around the extent and duration of business disruptions related to COVID-19 and the impacts may last for an extended period of time. COVID-19 has led to significant uncertainty and volatility in the financial markets.
11. SUBSEQUENT DISTRIBUTIONS
Under the managed distribution plan, the Fund declared the following distributions to common shareholders:
| Declaration date | Record date | Payable date | Per share amount |
| October 29, 2021 | November 15, 2021 | December 1, 2021 | $0.09617 |
| November 12, 2021 | December 14, 2021 | January 3, 2022 | 0.09641 |
Allspring Multi-Sector Income Fund | 53
Notes to financial statements
These distributions are not reflected in the accompanying financial statements.
12. SUBSEQUENT EVENTS
Effective on November 1, 2021, the sale transaction of Wells Fargo Asset Management by Wells Fargo & Company to GTCR LLC and Reverence Capital Partners, L.P. was closed. In connection with the closing of the transaction, Wells Fargo Asset Management became known as Allspring Global Investments (“Allspring”) and various entities that provide services to the Fund changed their names to “Allspring”, including Allspring Funds Management, LLC (formerly Wells Fargo Funds Management, LLC), the adviser to the Fund, Allspring Global Investments, LLC (formerly Wells Capital Management, LLC) and Allspring Global Investments (UK) Limited (formerly Wells Fargo Asset Management (International) Limited), both subadvisers to the Fund. These name changes have been reflected within this report.
54 | Allspring Multi-Sector Income Fund
Report of independent registered public accounting firm
To the Shareholders and Board of Trustees
Allspring Multi-Sector Income Fund:
Opinion on the Financial Statements
We have audited the accompanying statement of assets and liabilities of Allspring Multi-Sector Income Fund (formerly, Wells Fargo Multi-Sector Income Fund) (the Fund), including the portfolio of investments, as of October 31, 2021, the related statements of operations and cash flows for the year then ended, the statements of changes in net assets for each of the years in the two-year period then ended, and the related notes (collectively, the financial statements) and the financial highlights for each of the years in the five-year period then ended. In our opinion, the financial statements and financial highlights present fairly, in all material respects, the financial position of the Fund as of October 31, 2021, the results of its operations and its cash flows for the year then ended, the changes in its net assets for each of the years in the two-year period then ended, and the financial highlights for each of the years in the five-year period then ended, in conformity with U.S. generally accepted accounting principles.
Basis for Opinion
These financial statements and financial highlights are the responsibility of the Fund’s management. Our responsibility is to express an opinion on these financial statements and financial highlights based on our audits. We are a public accounting firm registered with the Public Company Accounting Oversight Board (United States) (PCAOB) and are required to be independent with respect to the Fund in accordance with the U.S. federal securities laws and the applicable rules and regulations of the Securities and Exchange Commission and the PCAOB.
We conducted our audits in accordance with the standards of the PCAOB. Those standards require that we plan and perform the audit to obtain reasonable assurance about whether the financial statements and financial highlights are free of material misstatement, whether due to error or fraud. Our audits included performing procedures to assess the risks of material misstatement of the financial statements and financial highlights, whether due to error or fraud, and performing procedures that respond to those risks. Such procedures included examining, on a test basis, evidence regarding the amounts and disclosures in the financial statements and financial highlights. Such procedures also included confirmation of securities owned as of October 31, 2021, by correspondence with the custodian, transfer agent, agent banks and brokers, or by other appropriate auditing procedures. Our audits also included evaluating the accounting principles used and significant estimates made by management, as well as evaluating the overall presentation of the financial statements and financial highlights. We believe that our audits provide a reasonable basis for our opinion.

We have not been able to determine the specific year that we began serving as the auditor of one or more Allspring Funds investment companies; however, we are aware that we have served as the auditor of one or more Allspring Funds investment companies since at least 1955.
Boston, Massachusetts
December 23, 2021
Allspring Multi-Sector Income Fund | 55
Other information (unaudited)
TAX INFORMATION
For the fiscal year ended October 31, 2021, $20,993,953 has been designated as interest-related dividends for nonresident alien shareholders pursuant to Section 871 of the Internal Revenue Code.
For corporate shareholders, pursuant to Section 163(j) of the Internal Revenue Code, 93% of ordinary income dividends qualify as interest dividends for the fiscal year ended October 31, 2021.
PROXY VOTING INFORMATION
A description of the policies and procedures used to determine how to vote proxies relating to portfolio securities is available without charge, upon request, by calling 1-800-222-8222, visiting our website at allspringglobal.com, or visiting the SEC website at sec.gov. Information regarding how the proxies related to portfolio securities were voted during the most recent 12-month period ended June 30 is available on the website at allspringglobal.com or by visiting the SEC website at sec.gov.
SPECIAL MEETING OF SHAREHOLDERS
On August 16, 2021, a Special Meeting of Shareholders for the Fund was held to consider the following proposals. The results of the proposals are indicated below.
Proposal 1 – To consider and approve a new investment management agreement with Wells Fargo Funds Management, LLC*.
| Shares voted “For” | 14,396,459 |
| Shares voted “Against/Withhold” | 673,939 |
| Shares voted “Abstain” | 1,066,748 |
Proposal 2 – To consider and approve a new investment subadvisory agreement with Wells Capital Management, LLC**.
| Shares voted “For” | 14,308,817 |
| Shares voted “Against/Withhold” | 725,516 |
| Shares voted “Abstain” | 1,102,813 |
Proposal 3 – To consider and approve a new investment subadvisory agreement with Wells Fargo Asset Management (International), Limited***.
| Shares voted “For” | 14,286,936 |
| Shares voted “Against/Withhold” | 731,182 |
| Shares voted “Abstain” | 1,119,028 |
* Effective November 1, 2021, known as Allspring Funds Management, LLC.
** Effective November 1, 2021, known as Allspring Global Investments, LLC.
***Effective November 1, 2021, known as Allspring Global Investments (UK) Limited.
QUARTERLY PORTFOLIO HOLDINGS INFORMATION
The Fund files its complete schedule of portfolio holdings with the SEC for the first and third quarters of each fiscal year as an exhibit to its reports on Form N-PORT. Shareholders may view the filed Form N-PORT by visiting the SEC website at sec.gov.
56 | Allspring Multi-Sector Income Fund
Other information (unaudited)
BOARD OF TRUSTEES AND OFFICERS
The following table provides basic information about the Board of Trustees (the “Trustees”) and Officers of the Fund. Each of the Trustees and Officers listed below acts in identical capacities for each fund in the Allspring family of funds, which consists of 139 mutual funds comprising the Allspring Funds Trust, Allspring Variable Trust, Allspring Master Trust, and four closed-end funds, including the Fund (collectively the “Fund Complex”). The mailing address of each Trustee and Officer is 525 Market Street, 12th Floor, San Francisco, CA 94105. The Board of Trustees is classified into three classes of which one is elected annually. Each Trustee serves a three-year term concurrent with the class from which the Trustee is elected. Each Officer serves an indefinite term.
Independent Trustees
Name and
year of birth | Position held and
length of service* | Principal occupations during past five years or longer | Current other
public company or
investment company
directorships |
| Class I - Non-Interested Trustees to serve until 2023 Annual Meeting of Shareholders |
Isaiah Harris, Jr.
(Born 1952) | Trustee, since 2010;
Audit Committee
Chairman, since 2019 | Retired. Chairman of the Board of CIGNA Corporation since 2009, and Director since 2005. From 2003 to 2011, Director of Deluxe Corporation. Prior thereto, President and CEO of BellSouth Advertising and Publishing Corp. from 2005 to 2007, President and CEO of BellSouth Enterprises from 2004 to 2005 and President of BellSouth Consumer Services from 2000 to 2003. Emeritus member of the Iowa State University Foundation Board of Governors. Emeritus Member of the Advisory Board of Iowa State University School of Business. Advisory Board Member, Palm Harbor Academy (private school). Mr. Harris is a certified public accountant (inactive status). | CIGNA Corporation |
David F. Larcker
(Born 1950) | Trustee, since 2010 | James Irvin Miller Professor of Accounting at the Graduate School of Business (Emeritus), Stanford University, Director of the Corporate Governance Research Initiative and Senior Faculty of The Rock Center for Corporate Governance since 2006. From 2005 to 2008, Professor of Accounting at the Graduate School of Business, Stanford University. Prior thereto, Ernst & Young Professor of Accounting at The Wharton School, University of Pennsylvania from 1985 to 2005. | N/A |
Olivia S. Mitchell
(Born 1953) | Trustee, since 2010;
Nominating and Governance
Committee Chair, since 2018 | International Foundation of Employee Benefit Plans Professor, Wharton School of the University of Pennsylvania since 1993. Director of Wharton’s Pension Research Council and Boettner Center on Pensions & Retirement Research, and Research Associate at the National Bureau of Economic Research. Previously, Cornell University Professor from 1978 to 1993. | N/A |
| Class II - Non-Interested Trustees to serve until 2024 Annual Meeting of Shareholders |
William R. Ebsworth
(Born 1957) | Trustee, since 2015 | Retired. From 1984 to 2013, equities analyst, portfolio manager, research director and chief investment officer at Fidelity Management and Research Company in Boston, Tokyo, and Hong Kong, and retired in 2013 as Chief Investment Officer of Fidelity Strategic Advisers, Inc. where he led a team of investment professionals managing client assets. Prior thereto, Board member of Hong Kong Securities Clearing Co., Hong Kong Options Clearing Corp., the Thailand International Fund, Ltd., Fidelity Investments Life Insurance Company, and Empire Fidelity Investments Life Insurance Company. Audit Committee Chair and Investment Committee Chair of the Vincent Memorial Hospital Endowment (non-profit organization). Mr. Ebsworth is a CFA® charterholder. | N/A |
Allspring Multi-Sector Income Fund | 57
Other information (unaudited)
Name and
year of birth | Position held and
length of service* | Principal occupations during past five years or longer | Current other
public company or
investment company
directorships |
Jane A. Freeman
(Born 1953) | Trustee, since 2015;
Chair Liaison, since 2018 | Retired. From 2012 to 2014 and 1999 to 2008, Chief Financial Officer of Scientific Learning Corporation. From 2008 to 2012, Ms. Freeman provided consulting services related to strategic business projects. Prior to 1999, Portfolio Manager at Rockefeller & Co. and Scudder, Stevens & Clark. Board member of the Harding Loevner Funds from 1996 to 2014, serving as both Lead Independent Director and chair of the Audit Committee. Board member of the Russell Exchange Traded Funds Trust from 2011 to 2012 and the chair of the Audit Committee. Ms. Freeman is also an inactive Chartered Financial Analyst. | N/A |
Judith M. Johnson**
(Born 1949) | Trustee, since 2010 | Retired. Prior thereto, Chief Executive Officer and Chief Investment Officer of Minneapolis Employees Retirement Fund from 1996 to 2008. Ms. Johnson is an attorney, certified public accountant and a certified managerial accountant. | N/A |
| Class III - Non-Interested Trustees to serve until 2022 Annual Meeting of Shareholders |
Timothy J. Penny
(Born 1951) | Trustee, since 2010;
Chair, since 2018 | President and Chief Executive Officer of Southern Minnesota Initiative Foundation, a non-profit organization, since 2007. Member of the Board of Trustees of NorthStar Education Finance, Inc., a non-profit organization, since 2007. | N/A |
James G. Polisson
(Born 1959) | Trustee, since 2018 | Retired. Chief Marketing Officer, Source (ETF) UK Services, Ltd, from 2015 to 2017. From 2012 to 2015, Principal of The Polisson Group, LLC, a management consulting, corporate advisory and principal investing company. Chief Executive Officer and Managing Director at Russell Investments, Global Exchange Traded Funds from 2010 to 2012. Managing Director of Barclays Global Investors from 1998 to 2010 and Global Chief Marketing Officer for iShares and Barclays Global Investors from 2000 to 2010. Trustee of the San Francisco Mechanics’ Institute, a non-profit organization, from 2013 to 2015. Board member of the Russell Exchange Traded Fund Trust from 2011 to 2012. Director of Barclays Global Investors Holdings Deutschland GmbH from 2006 to 2009. Mr. Polisson is an attorney and has a retired status with the Massachusetts and District of Columbia Bar Associations. | N/A |
Pamela Wheelock
(Born 1959) | Trustee, since January 2020; previously Trustee
from January 2018 to July 2019 | Board member of the Destination Medical Center Economic Development Agency, Rochester, Minnesota since 2019. Interim President of the McKnight Foundation from January to September 2020. Acting Commissioner, Minnesota Department of Human Services, July 2019 through September 2019. Human Services Manager (part-time), Minnesota Department of Human Services, October 2019 through December 2019. Chief Operating Officer, Twin Cities Habitat for Humanity from 2017 to 2019. Vice President of University Services, University of Minnesota from 2012 to 2016. Prior thereto, on the Board of Directors, Governance Committee and Finance Committee for the Minnesota Philanthropy Partners (Saint Paul Foundation) from 2012 to 2018, Interim Chief Executive Officer of Blue Cross Blue Shield of Minnesota from 2011 to 2012, Chairman of the Board from 2009 to 2012 and Board Director from 2003 to 2015. Vice President, Leadership and Community Engagement, Bush Foundation, Saint Paul, Minnesota (a private foundation) from 2009 to 2011. Executive Vice President and Chief Financial Officer, Minnesota Sports and Entertainment from 2004 to 2009 and Senior Vice President from 2002 to 2004. Executive Vice President of the Minnesota Wild Foundation from 2004 to 2008. Commissioner of Finance, State of Minnesota, from 1999 to 2002. Currently Board Chair of the Minnesota Wild Foundation since 2010. | N/A |
* Length of service dates reflect the Trustee’s commencement of service with the Trust’s predecessor entities, where applicable.
** Ms. Johnson has resigned from the Board effective December 31, 2021.
58 | Allspring Multi-Sector Income Fund
Other information (unaudited)
Officers1
Name and
year of birth | Position held and
length of service | Principal occupations during past five years or longer |
Andrew Owen
(Born 1960) | President,
since 2017 | President, Chief Executive Officer and Director of Allspring Funds Management, LLC since 2017 and co-president of Galliard Capital Management, LLC, an affiliate of Allspring Funds Management, LLC, since 2019. Prior thereto, Head of Affiliated Managers, Allspring Global Investments, from 2014 to 2019 and Executive Vice President responsible for marketing, investments and product development for Allspring Funds Management, LLC, from 2009 to 2014. In addition, Mr. Owen was an Executive Vice President of Wells Fargo & Company from 2014 to 2021. |
Jeremy DePalma
(Born 1974) | Treasurer,
since 2012
(for certain funds in
the Fund Complex);
since 2021 (for
the remaining funds in the
Fund Complex) | Senior Vice President of Allspring Funds Management, LLC since 2009. Senior Vice President of Evergreen Investment Management Company, LLC from 2008 to 2010 and head of the Fund Reporting and Control Team within Fund Administration. |
Kate McKinley
(Born 1977) | Chief Legal Officer and Chief Compliance Officer,
since 2021 | Chief Legal Officer of Allspring Global Investments since 2021. Prior thereto, held various roles at State Street Global Advisors, Inc. beginning in 2010, including serving as Senior Vice President and General Counsel from 2019 to 2021. Previously served as Assistant General Counsel for Bank of America Corporation from 2005 to 2010 and as an Associate at WilmerHale from 2002 to 2005. |
Matthew Prasse
(Born 1983) | Secretary,
since 2021 | Senior Counsel of the Allspring Legal Department since 2021. Senior Counsel of the Wells Fargo Legal Department from 2018 to 2021. Previously, Counsel for Barings LLC from 2015 to 2018. Prior to joining Barings, Associate at Morgan, Lewis & Bockius LLP from 2008 to 2015. |
1 For those Officers with tenures at Allspring Global Investments and/or Allspring Funds Management, LLC that began prior to 2021, such tenures include years of service during which these businesses/entities were known as Wells Fargo Asset Management and Wells Fargo Funds Management, LLC, respectively.
Allspring Multi-Sector Income Fund | 59
Board considerations (unaudited)
BOARD CONSIDERATION OF INVESTMENT ADVISORY AND SUB-ADVISORY AGREEMENTS:
Board Considerations – Current Agreements in Effect through November 1, 2021
Under the Investment Company Act of 1940 (the “1940 Act”), the Board of Trustees (the “Board”) of Wells Fargo Multi-Sector Income Fund (the “Fund”) must determine whether to approve the continuation of the Fund’s investment advisory and sub-advisory agreements. In this regard, at a Board meeting held on May 17-19, 2021 (the “Meeting”), the Board, all the members of which have no direct or indirect interest in the investment advisory and sub-advisory agreements and are not “interested persons” of the Fund, as defined in the 1940 Act (the “Independent Trustees”), reviewed and approved: (i) an investment advisory agreement with Wells Fargo Funds Management, LLC (“Funds Management”), (ii) an investment sub-advisory agreement with Wells Capital Management Incorporated (“WellsCap”), an affiliate of Funds Management; and (iii) an investment sub-advisory agreement with Wells Fargo Asset Management (International), Limited (“WFAM International”), an affiliate of Funds Management. The investment advisory agreement with Funds Management and the investment sub-advisory agreements with WellsCap and WFAM International (each, a “Sub-Adviser” and together, the “Sub-Advisers”) are collectively referred to as the “Advisory Agreements.”
The Board noted that Wells Fargo & Company recently announced that it had entered into a definitive agreement to sell Wells Fargo Asset Management (“WFAM”), which includes Funds Management and the Sub-Advisers, to GTCR LLC and Reverence Capital Partners, L.P. and/or their affiliates (the “Transaction”). The Board further noted that the Transaction would result in a change-of-control of Funds Management and the Sub-Advisers, which would be considered to be an assignment that would result in the termination of the Advisory Agreements. In light of the Transaction, the Board separately considered for approval a new investment management agreement with Funds Management and new sub-advisory agreements with the Sub-Advisers (the “New Agreements”) that would replace the Advisory Agreements upon consummation of the Transaction, subject to approval of the New Agreements by the Fund’s shareholders. The Board also considered for approval interim agreements to go into effect in the event shareholders do not approve the New Agreements before the Transaction is completed. The interim agreements would allow the Manager and the Sub-Advisers to continue providing services to the Fund while the Fund continues to seek shareholder approval of the New Agreements. The Board noted that the terms of the interim agreements would be identical to those of the current Advisory Agreements, except for the term and certain escrow provisions.
At the Meeting, the Board considered the factors and reached the conclusions described below relating to the selection of Funds Management and the Sub-Advisers and the continuation of the Advisory Agreements. Prior to the Meeting, including at Board meetings held in April and May 2021, the Trustees conferred extensively among themselves and with representatives of Funds Management about these matters. Also, the Board has adopted a team-based approach, with each team consisting of a sub-set of Trustees, to assist the full Board in the discharge of its duties in reviewing investment performance and other matters throughout the year. The Independent Trustees were assisted in their evaluation of the Advisory Agreements by independent legal counsel, from whom they received separate legal advice and with whom they met separately.
In providing information to the Board, Funds Management and the Sub-Advisers were guided by a detailed set of requests for information submitted to them by independent legal counsel on behalf of the Independent Trustees at the start of the Board’s annual contract renewal process earlier in 2021. In considering and approving the Advisory Agreements, the Trustees considered the information they believed relevant, including but not limited to the information discussed below. The Board considered not only the specific information presented in connection with the Meeting, but also the knowledge gained over time through interaction with Funds Management and the Sub-Advisers about various topics. In this regard, the Board reviewed reports of Funds Management at each of its quarterly meetings, which included, among other things, portfolio reviews and investment performance reports. In addition, the Board and the teams mentioned above confer with portfolio managers at various times throughout the year. The Board did not identify any particular information or consideration that was all-important or controlling, and each individual Trustee may have attributed different weights to various factors.
After its deliberations, the Board unanimously determined that the compensation payable to Funds Management and the Sub-Advisers under each of the Advisory Agreements was reasonable, and approved the continuation of the Advisory Agreements for a one-year term. The Board considered the approval of the Advisory Agreements for the Fund as part of its consideration of agreements for funds across the complex, but its approvals were made on a fund-by-fund basis. The following summarizes a number of important, but not necessarily all, factors considered by the Board in support of its approvals.
Nature, extent and quality of services
The Board received and considered various information regarding the nature, extent and quality of services provided to the Fund by Funds Management and the Sub-Advisers under the Advisory Agreements. This information included, among other things, a summary of the background and experience of senior management of WFAM, of which Funds Management and the Sub-Advisers
60 | Allspring Multi-Sector Income Fund
Board considerations (unaudited)
are a part, and a summary of investments made in the business of WFAM. The Board also received a description of Funds Management’s and the Sub-Advisers’ business continuity plans, including a summary of the performance of such plans and any changes thereto during the COVID-19 pandemic, and of their approaches to data privacy and cybersecurity.
The Board considered the additional services provided to the Fund due to the fact that the Fund is a closed-end fund, including, but not limited to, leverage management and monitoring, evaluating, and, where appropriate, making recommendations with respect to the Fund’s trading discount, share repurchase program, managed distribution program, and distribution rates, as well as shareholder relations activities. The Board also considered the qualifications, background, tenure and responsibilities of each of the portfolio managers primarily responsible for the day-to-day portfolio management of the Fund. The Board evaluated the ability of Funds Management and the Sub-Advisers to attract and retain qualified investment professionals, including research, advisory and supervisory personnel.
The Board further considered the compliance programs and compliance records of Funds Management and the Sub-Advisers. In addition, the Board took into account the full range of services provided to the Fund by Funds Management and its affiliates. The Board also considered information about retention and back-up arrangements that have been put into place with respect to key personnel of WFAM in connection with the anticipated Transaction, noting that WFAM provided assurances that the announcement and eventual culmination of the Transaction is not expected to result in any diminution in the nature or quality of services provided to the Fund.
Fund investment performance and expenses
The Board considered the investment performance results for the Fund over various time periods ended December 31, 2020. The Board considered these results in comparison to the investment performance of funds in a custom peer group that included funds selected by Broadridge Inc. (“Broadridge”) and additional funds that were determined by Funds Management to be similar to the Fund (the “Custom Peer Group”), and in comparison to the Fund’s benchmark index and to other comparative data. The Board received a description of the methodology used by Broadridge and Funds Management to select the funds in the Custom Peer Group and discussed the limitations inherent in the use of other peer groups. The Board noted that the investment performance of the Fund was higher than the average investment performance of the Custom Peer Group for all periods under review, except the ten-year period. The Board also noted that the investment performance of the Fund was higher than its benchmark, the Multi-Sector Income Blended Index, which is a proprietary index used by the Board to help it assess the Fund’s relative performance, for all periods under review.
The Board also received and considered information regarding the Fund’s net operating expense ratio and its various components, including actual management fees, and custodian and other non-management fees. The Board considered this ratio in comparison to the median ratio of funds in the Custom Peer Group and in comparison to the median ratio of funds in an expense group that was determined by Broadridge to be similar to the Fund (the “Broadridge Group”, and together with the Custom Peer Group, the “Expense Groups”). Broadridge is an independent provider of investment company data. The Board received a description of the methodology used by Broadridge and Funds Management to select the funds in the Expense Groups, and an explanation from Broadridge of how funds comprising Broadridge expense groups and their expense ratios may vary from year-to-year. Based on the Broadridge reports, the Board noted that the net operating expense ratio of the Fund was lower than the median net operating expense ratios of the Expense Groups.
The Board took into account the Fund’s investment performance and expense information provided to it among the factors considered in deciding to re-approve the Advisory Agreements.
Investment advisory and sub-advisory fee rates
The Board reviewed and considered the contractual investment advisory fee rate that is payable by the Fund to Funds Management for investment advisory services (the “Advisory Agreement Rate”), both on a stand-alone basis and on a combined basis with the Fund’s contractual administration fee rate (the “Management Rate”). The Board also reviewed and considered the contractual investment sub-advisory fee rates that are payable by Funds Management to each of the Sub-Advisers for investment sub-advisory services (the “Sub-Advisory Agreement Rate”).
Among other information reviewed by the Board was a comparison of the Management Rate of the Fund with those of other funds in the Expense Groups at a common asset level. The Board noted that the Management Rate of the Fund was lower than the average rates for the Expense Groups.
The Board also received and considered information about the portion of the total advisory fee that was retained by Funds Management after payment of the fee to the Sub-Advisers for sub-advisory services. In assessing the reasonableness of this amount, the Board received and evaluated information about the nature and extent of responsibilities retained and risks assumed
Allspring Multi-Sector Income Fund | 61
Board considerations (unaudited)
by Funds Management and not delegated to or assumed by the Sub-Advisers, and about Funds Management’s on-going oversight services. Given the affiliation between Funds Management and the Sub-Advisers, the Board ascribed limited relevance to the allocation of the advisory fee between them.
Based on its consideration of the factors and information it deemed relevant, including those described here, the Board determined that the Advisory Agreement Rate and each Sub-Advisory Agreement Rate were reasonable.
Profitability
The Board received and considered information concerning the profitability of Funds Management, as well as the profitability of both WFAM and Wells Fargo & Co. (“Wells Fargo”) from providing services to the fund family as a whole. The Board noted that the Sub-Advisers’ profitability information with respect to providing services to the Fund and other funds in the family was subsumed in the WFAM and Wells Fargo profitability analysis.
Funds Management reported on the methodologies and estimates used in calculating profitability, including a description of the methodology used to allocate certain expenses. Among other things, the Board noted that the levels of profitability reported on a fund-by-fund basis varied widely, depending on factors such as the size, type and age of fund. Based on its review, the Board did not deem the profits reported by Funds Management, WFAM or Wells Fargo from services provided to the Fund to be at a level that would prevent it from approving the continuation of the Advisory Agreements.
Economies of scale
The Board received and considered information about the potential for Funds Management to experience economies of scale in the provision of management services, the difficulties of calculating economies of scale on an individual fund level, and the extent to which potential scale benefits are shared with Fund shareholders. The Board noted that the Fund is not engaged in a continuous offering that could help its assets grow, and that, as is typical of closed-end funds, there are no breakpoints in the Management Rate. Although the Fund would not share in any potential economies of scale through contractual breakpoints, the Board noted that Funds Management shares potential economies of scale from its management business in a variety of ways, including through fee waiver and expense reimbursement arrangements, competitive management fee rates set at the outset without regard to breakpoints, and investments in the business intended to enhance services available to shareholders.
The Board concluded that Funds Management’s arrangements with respect to the Fund constituted a reasonable approach to sharing potential economies of scale with the Fund and its shareholders. The Board also noted that it would have opportunities to revisit the Management Rate as part of future contract reviews.
Other benefits to Funds Management and the Sub-Advisers
The Board received and considered information regarding potential “fall-out” or ancillary benefits received by Funds Management and its affiliates, including the Sub-Advisers, as a result of their relationships with the Fund. Ancillary benefits could include, among others, benefits directly attributable to other relationships with the Fund and benefits potentially derived from an increase in Funds Management’s and the Sub-Advisers’ business as a result of their relationships with the Fund. The Board also reviewed information about soft dollar credits earned and utilized by WellsCap and commissions earned by affiliated brokers from portfolio transactions.
Based on its consideration of the factors and information it deemed relevant, including those described here, the Board did not find that any ancillary benefits received by Funds Management and its affiliates, including the Sub-Advisers, were unreasonable.
Conclusion
At the Meeting, after considering the above-described factors and based on its deliberations and its evaluation of the information described above, the Board unanimously determined that the compensation payable to Funds Management and the Sub-Advisers under each of the Advisory Agreements was reasonable, and approved the continuation of the Advisory Agreements for a one-year term.
62 | Allspring Multi-Sector Income Fund
Board considerations (unaudited)
Board Considerations – New Agreements in Effect as of November 1, 2021
Overview of the Board evaluation process
At a meeting held on May 17-19, 2021 (the “Board Meeting”), the Board of Trustees (the “Board”) of Wells Fargo Multi-Sector Income Fund (the “Fund”) approved the continuation of the Fund’s current Investment Advisory Agreement (the “Current Investment Advisory Agreement”) and the current Sub-Advisory Agreements (the “Current Sub-Advisory Agreements”, and collectively, the “Current Agreements”). Each Trustee on the Board is not an “interested person” (as defined in the 1940 Act) of the Fund (collectively, the “Independent Trustees”). The process followed by the Board in considering and approving the continuation of the Current Agreements is referred to herein as the “2021 Annual Approval Process.”
As noted above, the closing of the sale of Wells Fargo Asset Management (“WFAM”) to a holding company (“NewCo”) affiliated with private funds of GTCR LLC (“GTCR”) and of Reverence Capital Partners, L.P. (“Reverence Capital”, and such transaction, the “Transaction”) will result in a change of control of Wells Fargo Funds Management LLC (“Funds Management”), Wells Capital Management Incorporated (“Wells Capital”) and Wells Fargo Asset Management (International) Limited (“WFAM(I) Ltd.”, and together with Funds Management and Wells Capital, the “Advisers”), which will be considered to be an “assignment” the Fund’s Current Agreements under the 1940 Act that will result in the automatic termination of the Fund’s Current Agreements. In light of the expected termination of the Fund’s Current Agreements upon the closing, at the Board Meeting the Board also considered and approved: (i) a new Investment Management Agreement (the “New Investment Management Agreement”) between the Fund and Funds Management; (ii) a new Sub-Advisory Agreement (the “New Wells Capital Sub-Advisory Agreement”) among the Funds, Funds Management and Wells Capital; and (iii) a new Sub-Advisory Agreement (the “New WFAM(I) Ltd Sub-Advisory Agreement”, and collectively, the “New Agreements”) among the Fund, Funds Management and WFAM(I) Ltd (together with Wells Capital, the “Sub-Advisers”), each of which is intended to go into effect upon the closing. The process followed by the Board in reviewing and approving the New Agreements is referred to herein as the “New Agreement Approval Process.”
At a series of meetings held in April and May 2021 (collectively, “April and May 2021 Meetings”) and at the Board Meeting, the Trustees conferred extensively among themselves and with senior representatives of Funds Management, GTCR and Reverence Capital about the New Agreements and related matters. The Board reviewed and discussed information furnished by Funds Management, GTCR and Reverence Capital that the Board considered reasonably necessary to evaluate the terms of the New Agreements and the services to be provided. At these meetings, senior representatives from Funds Management, GTCR and Reverence Capital made presentations to, and responded to questions from, the Board.
In providing information to the Board in connection with the 2021 annual approval process (the “2021 Annual Approval Process”) and the New Agreement Approval Process, Funds Management, GTCR and Reverence Capital (as applicable) were guided by requests for information submitted by independent legal counsel on behalf of the Independent Trustees. In considering and approving the New Agreements, the Trustees considered the information they believed relevant, including but not limited to the information discussed herein. The Board considered not only the specific information presented in connection with the April and May 2021 Meetings as well as the Board Meeting, but also the knowledge gained over time through interaction with Funds Management and the Sub-Advisers about various topics. In this regard, the Board reviews reports of Funds Management at each of its regular Board meetings, which includes, among other things, portfolio reviews and investment performance reports. In addition, the Board confers with portfolio managers at various times throughout the year. The Board was assisted in its evaluation of the New Agreements by independent legal counsel, from whom the Independent Trustees received separate legal advice and with whom the Independent Trustees met separately. The Board did not identify any particular information or consideration that was all-important or controlling, and each individual Trustee may have attributed different weights to various factors.
Among other information considered by the Board in connection with the Transaction was:
| ■ | Information regarding NewCo, GTCR and Reverence Capital: (i) information about NewCo, including information about its expected financial condition and access to capital, and senior leadership team; (ii) the experience of senior management at GTCR and Reverence Capital in acquiring portfolio companies; (iii) the plan to operationalize NewCo, including the transition of necessary infrastructure services through a transition services agreement with Wells Fargo under which Wells Fargo will continue to provide NewCo with certain services for a specified period of time after the closing; and (iv) information regarding regulatory matters, compliance, and risk management functions at NewCo, including resources to be dedicated thereto. |
| ■ | Impact of the Transaction on WFAM and Service Providers: (i) information regarding any changes to personnel and/or other resources of the Advisers as a result of the Transaction, including assurances regarding comparable and competitive compensation arrangements to attract and retain highly qualified personnel; and (ii) information about the organizational and operating structure with respect to NewCo, the Advisers and the Fund. |
Allspring Multi-Sector Income Fund | 63
Board considerations (unaudited)
| ■ | Impact of the Transaction on the Fund and its Shareholders: (i) information regarding anticipated benefits to the Fund as a result of the Transaction; (ii) a commitment that the Fund would not bear any expenses, directly or indirectly, in connection with the Transaction; (iii) confirmation that the Advisers intend to continue to manage the Fund in a manner consistent with the Fund’s current investment objectives and principal investments strategies; and (iv) a commitment that neither NewCo nor WFAM will take any steps that would impose any “unfair burden” (as that term is used in section 15(f)(1)(B) of the 1940 Act) on the Fund as a result of the Transaction. |
With respect to the New Agreements, the Board considered: (i) a representation that, after the closing, all of the Fund will continue to be managed and advised by their current Advisers, and that the same portfolio managers of the Sub-Advisers are expected to continue to manage the Fund after the Transaction; (ii) information regarding the terms of the New Agreements, including changes as compared to the Current Agreements; (iii) information confirming that the fee rates payable under the New Agreements will not increase as a result of the Transaction as compared to the rates under the Current Agreements; and (iv) assurances that the Transaction is not expected to cause any diminution with respect to the nature, extent and quality of any of the services currently provided to the Fund by the Advisers as a result of the Transaction.
In addition to considering information furnished specifically to evaluate the impact of the Transaction on the Fund and their respective shareholders in connection with the New Agreement Approval Process, the Board considered information furnished at prior meetings of the Board and its committees, including detailed information provided in connection with the 2021 Annual Approval Process. In this regard, in connection with the 2021 Annual Approval Process, the Board received information about complex-wide and individual Fund performance, fees and expenses, including: (i) a report from an independent data provider comparing the investment performance of the Fund to the investment performance of comparable funds and benchmark indices, over various time periods; (ii) a report from an independent data provider comparing the Fund’s total expense ratio (and its components) to those of comparable funds; (iii) comparative information concerning the fees charged and services provided by the Advisers to the Fund in managing other accounts (which may include other mutual funds, collective investment funds and institutional accounts), if any, that employ investment strategies and techniques similar to those used in managing such Fund(s); and (iv) profitability analyses of Funds Management, as well as the profitability of both WFAM and Wells Fargo from providing services to the fund family as a whole.
After its deliberations, the Board unanimously determined that the compensation payable to Funds Management and the Sub-Advisers under the New Agreements is reasonable, approved the New Agreements for a two-year term, and voted to recommend that Fund shareholders approve the New Agreements. The Board considered the approval of the New Agreements as part of its consideration of agreements for funds across the complex, but its approvals were made on a fund-by-fund basis. The following summarizes a number of important, but not necessarily all, factors considered by the Board in support of its approvals.
Nature, extent and quality of services
In connection with the 2021 Annual Approval Process, the Board received and considered various information regarding the nature, extent and quality of services provided to the Fund by Funds Management and the under the Advisory Agreements. This information included, among other things, a summary of the background and experience of senior management of WFAM, of which Funds Management and the Sub-Advisers are a part, and a summary of investments made in the business of WFAM. The Board also received a description of Funds Management’s and the Sub-Adviser’s business continuity plans, including a summary of the performance of such plans and any changes thereto during the COVID-19 pandemic, and of their approaches to data privacy and cybersecurity.
The Board considered the additional services provided to the Fund due to the fact that the Fund is a closed-end fund, including, but not limited to, leverage management and monitoring, evaluating, and, where appropriate, making recommendations with respect to the Fund’s trading discount, share repurchase program, managed distribution program, and distribution rates, as well as shareholder relations activities.
In connection with the 2021 Annual Approval Process, the Board also considered the qualifications, background, tenure and responsibilities of each of the portfolio managers primarily responsible for the day-to-day portfolio management of the Fund. The Board evaluated the ability of Funds Management and the Sub-Advisers to attract and retain qualified investment professionals, including research, advisory and supervisory personnel.
In connection with the 2021 Annual Approval Process, the Board further considered the compliance programs and compliance records of Funds Management and each Sub-Adviser. In addition, the Board took into account the full range of services provided to the Fund by Funds Management and its affiliates.
In connection with the New Agreement Approval Process, the Board considered, among other information, the structure of the Transaction and expected impact, if any, of the Transaction on the operations, facilities, organization and personnel of the Advisers. The Board received assurances from Funds Management that the Fund will continue to be advised by its current Sub-
64 | Allspring Multi-Sector Income Fund
Board considerations (unaudited)
Advisers after the closing, and that the same individual portfolio managers are expected to continue to manage the Fund after the closing. With respect to the recruitment and retention of key personnel, the Board noted information from GTCR, Reverence Capital and the Advisers regarding the potential benefits for employees of joining NewCo. The Board recognized that the personnel who had been extended offers may not accept such offers and personnel changes may occur in the future in the ordinary course.
In addition, the Board considered information regarding the infrastructure, operational capabilities and support staff in place to assist in the portfolio management and operations of the Fund, including the provision of administrative services, and the anticipated impact of the Transaction on such matters. The Board also considered the business-related and other risks to which the Advisers may be subject in managing the Fund and in connection with the Transaction. The Board also considered the transition and integration plans as a result of the change in ownership of the Advisers from Wells Fargo to NewCo. The Board considered the resources and infrastructure that NewCo intends to devote to its compliance program to ensure compliance with applicable laws and regulations, as well as its risk management program and cybersecurity program. The Board also took into account assurances received from the Advisers, GTCR and Reverence Capital that the Transaction is not expected to cause any diminution in the nature, extent and quality of services provided by the Advisers to the Fund and its shareholders.
Fund investment performance and expenses
In connection with the 2021 Annual Approval Process, the Board considered the investment performance results for the Fund over various time periods ended December 31, 2020. The Board considered these results in comparison to the investment performance of funds in a universe that was determined by Broadridge Inc. (“Broadridge”) to be similar to the Fund (the “Universe”), and in comparison to the Fund’s benchmark index and to other comparative data. Broadridge is an independent provider of investment company data. The Board received a description of the methodology used by Broadridge to select the mutual funds in the performance Universe. Where applicable, the Board received information concerning, and discussed factors contributing to, underperformance of Funds relative to the Universe and benchmark for any underperformance periods.
In connection with the 2021 Annual Approval Process, the Board also received and considered information regarding the Fund’s net operating expense ratio and its various components, including actual management fees, custodian and other non-management fees. The Board considered this ratio in comparison to the median ratio of funds in an expense group that was determined by Broadridge to be similar to the Fund (the “Group”). The Board received a description of the methodology used by Broadridge to select the mutual funds in the expense Group and an explanation of how funds comprising expense groups and their expense ratios may vary from year-to-year.
In connection with the New Agreement Approval Process, the Board received a commitment that WFAM will maintain fee and expense commitments for at least two years after the closing. The Board took into account the Fund’s investment performance and expense information among the factors considered in deciding to approve the New Agreements.
Investment advisory and sub-advisory fee rates
In connection with the 2021 Annual Approval Process, the Board reviewed and considered the contractual fee rate payable by the Fund to Funds Management under the Current Investment Advisory Agreement, both on a stand-alone basis and on a combined basis with the Fund’s contractual administration fee rate (the “Management Rate”).The Board also reviewed and considered the contractual investment sub-advisory fee rate that is payable by Funds Management to the Sub-Advisers under the Current Sub-Advisory Agreements for investment sub-advisory services (the “Sub-Advisory Fee Rate”).
Among other information reviewed by the Board in connection with the 2021 Annual Approval Process, was a comparison of the Fund’s Management Rate with those of other funds in the expense Group at a common asset level.
In connection with the 2021 Annual Approval Process, the Board also received and considered information about the portion of the total advisory fee that was retained by Funds Management after payment of the Sub-Advisory Fee Rate. In assessing the reasonableness of this amount, the Board received and evaluated information about the nature and extent of responsibilities retained and risks assumed by Funds Management and not delegated to or assumed by each Sub-Adviser, and about Funds Management’s on-going oversight services. Given the affiliation between Funds Management and each Sub-Adviser, the Board ascribed limited relevance to the allocation of fees between them.
In connection with the 2021 Annual Approval Process, the Board also received and considered information about the nature and extent of services offered and fee rates charged by Funds Management and the Sub-Advisers to other types of clients, if any, with investment strategies similar to those of the Fund. In this regard, the Board received information about the significantly greater scope of services, and compliance, reporting and other legal burdens and risks of managing proprietary mutual funds compared with those associated with managing assets of other types of clients, including third-party sub-advised fund clients and non-mutual fund clients such as institutional separate accounts.
Allspring Multi-Sector Income Fund | 65
Board considerations (unaudited)
In connection with the New Agreement Approval Process, the Board noted the assurances received by it that there would be no increases to any of the Management Rate or the Sub-Advisory Fee Rate as a result of the Transaction. The Board also considered that the New Agreements do not change the computation method for calculating such fees, and there is no present intention to reduce expense waiver and reimbursement arrangements that are currently in effect. Based on its consideration of the factors and information it deemed relevant, including those described here, the Board determined that the compensation payable to Funds Management under the New Management Agreement and to each Sub-Adviser under the New Sub-Advisory Agreements was reasonable.
Profitability
In connection with the 2021 Annual Approval Process, the Board received and considered information concerning the profitability of Funds Management, as well as the profitability of both WFAM and Wells Fargo from providing services to the fund family as a whole. The Board noted that each Sub-Adviser’s profitability information with respect to providing services to the Fund and other funds in the family was subsumed in the WFAM and Wells Fargo profitability analysis.
Funds Management reported on the methodologies and estimates used in calculating profitability in connection with the 2021 Annual Approval Process, including a description of the methodology used to allocate certain expenses. Among other things, the Board noted that the levels of profitability reported on a fund-by-fund basis varied widely, depending on factors such as the size, type and age of fund.
In connection with the New Agreement Approval Process, the Board received certain information about NewCo’s projected financial condition, and reviewed with senior representatives of Funds Management, GTCR and Reverence Capital the underlying assumptions on which such information was based. The Board considered that NewCo is a newly formed entity, with no historical operations, revenues or expenses, and that it is difficult to predict with any degree of certainty the future profitability of NewCo and the Advisers from advisory activities under the New Agreements. The Board considered that the fee rates payable under the New Agreements will not increase as a result of the Transaction as compared to the rates under the Current Agreements, and that the current contractual expense limitations applicable to the Fund will not increase. The Board noted that if the New Agreements are approved by shareholders and the Transaction closes, the Board will have the opportunity in the future to review the profitability of NewCo and the Advisers from advisory activities under the New Agreements.
Economies of scale
In connection with the 2021 Annual Approval Process, the Board received and considered information about the potential for Funds Management to experience economies of scale in the provision of management services to the Fund, the difficulties of calculating economies of scale at an individual fund level, and the extent to which potential scale benefits are shared with Fund shareholders. The Board noted that the Fund is not engaged in a continuous offering that could help its assets grow, and that, as is typical of closed-end funds, there are no breakpoints in the Management Rate. Although the Fund would not share in any potential economies of scale through contractual breakpoints, the Board noted that Funds Management shares potential economies of scale from its management business in a variety of ways, including through fee waiver and expense reimbursement arrangements, services that benefit shareholders, competitive management fee rates set at the outset without regard to breakpoints, and investments in the business intended to enhance services available to shareholders.
Based upon the information furnished to the Board in connection with the 2021 Annual Approval Process and the New Agreement Approval Process, the Board concluded that Funds Management’s arrangements with respect to the Fund constituted a reasonable approach to sharing potential economies of scale with the Fund and its shareholders.
“Fall-out” benefits to Funds Management and the Sub-Advisers
In connection with the 2021 Annual Approval Process, the Board received and considered information regarding potential “fall-out” or ancillary benefits received by Funds Management and its affiliates, including each Sub-Adviser, as a result of their relationships with the Fund. Ancillary benefits could include, among others, benefits directly attributable to other relationships with the Fund and benefits potentially derived from an increase in Funds Management’s and each Sub-Adviser’s business as a result of their relationships with the Fund. The Board noted that various current affiliates of Funds Management may receive distribution-related fees, shareholder servicing payments and sub-transfer agency fees in respect of shares sold or held through them and services provided.
In connection with the 2021 Annual Approval Process, the Board also reviewed information about soft dollar credits earned and utilized by each Sub-Adviser, fees earned by Funds Management and the Sub-Advisers from managing a private investment vehicle for the fund family’s securities lending collateral, and commissions earned by an affiliated broker of Wells Fargo from portfolio transactions.
66 | Allspring Multi-Sector Income Fund
Board considerations (unaudited)
In connection with the New Agreement Approval Process, the Board received information to the effect that the Transaction is not expected to have a material impact on the fall-out benefits currently realized by Funds Management and its affiliates, including each Sub-Adviser. The information reviewed by the Board also noted that several of the ancillary benefits identified for WFAM would be potential ancillary benefits for NewCo, including that the scale and reputation of the Fund might benefit NewCo’s broader reputation, product initiatives, technology investment and talent acquisition. Based on its consideration of the factors and information it deemed relevant, including those described here, the Board did not find that any ancillary benefits expected to be received by Funds Management and its affiliates, including NewCo and each Sub-Adviser, under the New Agreements were unreasonable.
Conclusion
At the Board Meeting, after considering the above-described factors and based on its deliberations and its evaluation of the information described above, the Board unanimously determined that the compensation payable to Funds Management and the Sub-Advisers under the New Agreements is reasonable, approved the New Agreements for a two-year term, and voted to recommend that Fund shareholders approve the New Agreements.
Allspring Multi-Sector Income Fund | 67
Board considerations (unaudited)
Board Considerations - Interim Agreements (not in effect)
At a meeting held on May 17-19, 2021 (the “Board Meeting”), the Boards of Trustees (each, a “Board”, and collectively, the “Boards”) of Wells Fargo Funds Trust, Wells Fargo Master Trust, Wells Fargo Variable Trust, Wells Fargo Global Dividend Opportunity Fund, Wells Fargo Income Opportunities Fund, Wells Fargo Multi-Sector Income Fund and Wells Fargo Utilities and High Income Fund (each a “Trust”, and the series thereof, a “Fund”) reviewed and approved for the Trusts and Funds, as applicable: (i) interim investment management agreements (the “Interim Management Agreements”) with Wells Fargo Funds Management, LLC (“Funds Management”); (ii) interim investment advisory agreements (the “Interim Advisory Agreements”) with Funds Management; and (iii) interim sub-advisory agreements (the “Interim Sub-Advisory Agreements”) with each of Cooke & Bieler, L.P., Galliard Capital Management LLC (“Galliard”), Peregrine Capital Management Inc., Wells Capital Management, LLC (“WellsCap”), and Wells Fargo Asset Management (International) Limited (“WFAMI”, and collectively, the “Sub-Advisers”). Each Trustee on the Board is not an “interested person” (as defined in the Investment Company Act of 1940 (the “1940 Act”) of the Funds (collectively, the “Independent Trustees”). The Interim Management Agreements, Interim Advisory Agreements, and Interim Sub-Advisory Agreements are collectively referred to as the “Interim Advisory Agreements.”
At the Board Meeting, the Boards reviewed and approved the continuation of existing investment management, advisory and sub-advisory agreements (the “Current Advisory Agreements”) for each Trust and Fund, as applicable. The factors considered and conclusions reached by the Boards in approving the Current Advisory Agreements are summarized in the section entitled “Board Considerations – Current Agreements” of this shareholder report. The Boards noted that Wells Fargo & Company has entered into a definitive agreement to sell Wells Fargo Asset Management (“WFAM”), which includes Funds Management, Galliard, WellsCap and WFAMI (the “Affiliated Sub-Advisers”), to a holding company affiliated with private funds of GTCR LLC and Reverence Capital Partners, L.P. (the “Transaction”). The Boards further noted that the Transaction would result in a change-of-control of Funds Management and the Affiliated Sub-Advisers, which would be considered to be an “assignment” under the 1940 Act that would terminate the Current Advisory Agreements. At the Board Meeting, the Boards also reviewed and approved new investment management, advisory and sub-advisory agreements (the “New Advisory Agreements”) for each Trust and Fund, as applicable, that would replace the Current Advisory Agreements upon consummation of the Transaction, subject to approval of the New Advisory Agreements by the applicable Trust’s or Fund’s shareholders. The factors considered and conclusions reached by the Boards in approving the New Advisory Agreements are summarized in the section entitled “Board Considerations – New Agreements” of this shareholder report.
At the Board Meeting, the Boards also approved the Interim Advisory Agreements, which will go into effect for a Trust or Fund only in the event that shareholders of such Trust or Fund do not approve the New Advisory Agreement(s) for the Trust or Fund by the closing date of the Transaction, when the Current Advisory Agreements will terminate. The Board noted that, in such a circumstance, the Interim Advisory Agreements will permit continuity of management by allowing Funds Management and the Sub-Advisers to continue providing services to the Trust or Fund pursuant to the Interim Advisory Agreements while the Trust or Fund continues to solicit shareholder approval of such New Advisory Agreement(s). The Boards noted that the terms of the Interim Advisory Agreements are identical to those of the Current Advisory Agreements, except for the term and the addition of escrow provisions with respect to the advisory fees. The Boards also noted that the entities that would service the Funds and Trusts under the Interim Advisory Agreements are identical to those that provide services under the Current Advisory Agreements and those that will provide services under the New Advisory Agreements.
In approving the Interim Advisory Agreements, the Boards considered the same factors and reached the same conclusions as they considered and reached with respect to the Boards’ approvals of the Current Advisory Agreements and New Advisory Agreements, as applicable, which are described in separate Board Consideration sections within this shareholder report. Prior to the Board Meeting, including at a series of meetings held in April and May 2021, the Trustees conferred extensively among themselves and with senior representatives of Funds Management, GTCR LLC and Reverence Capital Partners, L.P. about the Interim Advisory Agreements and related matters. The Independent Trustees were assisted in their evaluation of the Interim Advisory Agreements by independent legal counsel, from whom they received separate legal advice and with whom they met separately.
At the Board Meeting, after considering the factors and reaching the conclusions described in the separate Board Consideration sections within this shareholder report, the Boards unanimously determined that the compensation payable to Funds Management and to each Sub-Adviser under each of the Interim Advisory Agreements was reasonable, and approved the Interim Advisory Agreements.
68 | Allspring Multi-Sector Income Fund
Automatic dividend reinvestment plan
AUTOMATIC DIVIDEND REINVESTMENT PLAN
All common shareholders are eligible to participate in the Automatic Dividend Reinvestment Plan (“the Plan”). Pursuant to the Plan, unless a common shareholder is ineligible or elects otherwise, all cash dividends and capital gains distributions are automatically reinvested by Computershare Trust Company, N.A., as agent for shareholders in administering the Plan (“Plan Agent”), in additional common shares of the Fund. Whenever the Fund declares an ordinary income dividend or a capital gain dividend (collectively referred to as “dividends”) payable either in shares or in cash, nonparticipants in the Plan will receive cash, and participants in the Plan will receive the equivalent in common shares. The shares are acquired by the Plan Agent for the participant’s account, depending upon the circumstances described below, either (i) through receipt of additional unissued but authorized common shares from the Fund (“newly issued common shares”) or (ii) by purchase of outstanding common shares on the open-market (open-market purchases) on the NYSE Amex or elsewhere. If, on the payment date for any dividend or distribution, the net asset value per share of the common shares is equal to or less than the market price per common share plus estimated brokerage commissions (“market premium”), the Plan Agent will invest the amount of such dividend or distribution in newly issued shares on behalf of the participant. The number of newly issued common shares to be credited to the participant’s account will be determined by dividing the dollar amount of the dividend by the net asset value per share on the date the shares are issued, provided that the maximum discount from the then current market price per share on the date of issuance may not exceed 5%. If on the dividend payment date the net asset value per share is greater than the market value (“market discount”), the Plan Agent will invest the dividend amount in shares acquired on behalf of the participant in open-market purchases. There will be no brokerage charges with respect to shares issued directly by the Fund as a result of dividends or capital gains distributions payable either in shares or in cash. However, each participant will pay a pro rata share of brokerage commissions incurred with respect to the Plan Agent’s open-market purchases in connection with the reinvestment of dividends. The automatic reinvestment of dividends and distributions will not relieve participants of any federal, state or local income tax that may be payable (or required to be withheld) on such dividends. All correspondence concerning the Plan should be directed to the Plan Agent at P.O. Box 505000, Louisville, Kentucky 40233 or by calling 1-800-730-6001.
Allspring Multi-Sector Income Fund | 69
Transfer Agent, Registrar, Shareholder Servicing
Agent & Dividend Disbursing Agent
Computershare Trust Company, N.A.
P.O. Box 505000
Louisville, Kentucky 40233
1-800-730-6001
Website: allspringglobal.com
Allspring Global InvestmentsTM is the trade name for the asset management firms of Allspring Global Investments Holdings, LLC, a holding company indirectly owned by certain private funds of GTCR LLC and Reverence Capital Partners, L.P. These firms include but are not limited to Allspring Global Investments, LLC, and Allspring Funds Management, LLC. Certain products managed by Allspring entities are distributed by Allspring Funds Distributor, LLC (a broker-dealer and Member FINRA/SIPC).
This material is for general informational and educational purposes only and is NOT intended to provide investment advice or a recommendation of any kind—including a recommendation for any specific investment, strategy, or plan.
© 2021 Allspring Global Investments Holdings, LLC. All rights reserved.
PAR-1121-00702 12-21
AMSI/AR143 10-21
(a) As of the end of the period, covered by the report, Allspring Multi-Sector Income Fund has adopted a code of ethics that applies to its President and Treasurer. A copy of the code of ethics is filed as an exhibit to this Form N-CSR.
(c) During the period covered by this report, there were no amendments to the provisions of the code of ethics adopted in Item 2(a) above.
(d) During the period covered by this report, there were no implicit or explicit waivers to the provisions of the code of ethics adopted in Item 2(a) above.
| ITEM 3. | AUDIT COMMITTEE FINANCIAL EXPERT |
The Board of Trustees of Allspring Multi-Sector Income Fund has determined that that Isaiah Harris and Judith Johnson are each an audit committee financial expert, as defined in Item 3 of Form N-CSR. Mr. Harris and Ms. Johnson are independent for purposes of Item 3 of Form N-CSR.
| ITEM 4. | PRINCIPAL ACCOUNTANT FEES AND SERVICES |
(a), (b), (c), (d) The following table presents aggregate fees billed in each of the last two fiscal years for services rendered
to the Registrant by the Registrant’s principal accountant. These fees were billed to the registrant and were approved by
the Registrant’s audit committee.
| | | | | | | | |
| | | Fiscal year
ended
October 31,
2021 | | | Fiscal year
ended
October 31,
2020 | |
Audit fees | | $ | 60,310 | | | $ | 67,510 | |
Audit-related fees | | | — | | | | — | |
Tax fees (1) | | | 4,510 | | | | 4,340 | |
All other fees | | | — | | | | — | |
| | | | | | | | |
| | $ | 64,820 | | | $ | 71,850 | |
| | | | | | | | |
| (1) | Tax fees consist of fees for tax compliance, tax advice, tax planning and excise tax. |
(e) The Chair of the Audit Committees is authorized to pre-approve: (1) audit services for the Allspring Multi-Sector Income Fund; (2) non-audit tax or compliance consulting or training services provided to the Allspring Multi-Sector Income Fund by the independent auditors (“Auditors”) if the fees for any particular engagement are not anticipated to exceed $50,000; and (3) non-audit tax or compliance consulting or training services provided by the Auditors to a Allspring Multi-Sector Income Fund’s investment adviser and its controlling entities (where pre-approval is required because the engagement relates directly to the operations and financial reporting of the Allspring Multi-Sector Income Fund) if the fee to the Auditors for any particular engagement is not anticipated to exceed $50,000. For any such pre-approval sought from the Chair, Management shall prepare a brief description of the proposed services. If the Chair approves of such service, he or she shall sign the statement prepared by Management. Such written statement shall be presented to the full Committees at their next regularly scheduled meetings.
(f) Not applicable
(g) Not applicable
(h) Not applicable
ITEM 5. AUDIT COMMITTEE OF LISTED REGISTRANTS
The registrant has a separately-designated standing audit committee established in accordance with Section 3(a)(58)(A) of the Securities Exchange Act of 1934, as amended. The Audit Committee is comprised of:
William R. Ebsworth
Jane A. Freeman
Isaiah Harris, Jr.
Judith M. Johnson
David F. Larcker
Olivia S. Mitchell
Timothy J. Penny
James G. Polisson
Pamela Wheelock
ITEM 6. INVESTMENTS
A Portfolio of Investments for Allspring Multi-Sector Income Fund is included as part of the report to shareholders filed under Item 1 of this Form.
ITEM 7. DISCLOSURE OF PROXY VOTING POLICIES AND PROCEDURES FOR CLOSED-END MANAGEMENT INVESTMENT COMPANIES
PROXY VOTING POLICIES AND PROCEDURES EFFECTIVE
November 2021
The Multi-Sector Income Fund has adopted policies and procedures (“Fund Proxy Voting Procedures”) that are used to determine how to vote proxies relating to portfolio securities held by the Fund. The Fund Proxy Voting Procedures are designed to ensure that proxies are voted in the best interests of Fund shareholders, without regard to any relationship that any affiliated person of a Fund (or an affiliated person of such affiliated person) may have with the issuer of the security and with the goal of maximizing value to shareholders consistent with governing laws and the investment policies of the Fund. While securities are not purchased to exercise control or to seek to effect corporate change through share ownership activism, the Fund supports sound corporate governance practices within companies in which it invests. The Board of the Fund has delegated the responsibility for voting proxies relating to the Fund’s portfolio securities to Allspring Funds Management. Allspring Funds Management utilizes the Allspring Global Investments Proxy Voting Policies and Procedures, included below, to ensure that proxies relating to the Fund’s portfolio securities are voted in shareholders’ best interests.
Allspring Global Investments (Allspring) Stewardship
As fiduciaries, we are committed to effective stewardship of the assets we manage on behalf of our clients. To us, good stewardship reflects responsible, active ownership and includes both engaging with investee companies and voting proxies in a manner that we believe will maximize the long-term value of our investments.
Scope of Policies and Procedures
In conjunction with the Allspring Engagement Policy, these Proxy Voting Policies and Procedures (“Policies and Procedures”) set out how Allspring complies with applicable regulatory requirements in respect of how we exercise voting rights when we invest in shares traded on a regulated market on behalf of a client.
With respect to client accounts of Allspring Funds Management, LLC (“Allspring Funds Management”) this includes, among others, Allspring Funds Trust, Allspring Master Trust, Allspring Variable Trust, Allspring Global Dividend Opportunity Fund, Allspring Income Opportunities Fund, Allspring Multi-Sector Income Fund, and Allspring Utilities and High Income Fund (the “Trusts”). It also includes Allspring (Lux) Worldwide Fund and Worldwide Alternative Fund SICAV-SIF, both domiciled in Luxembourg (the “Luxembourg Funds”). Aside from the investment funds managed by Allspring Funds Management, Allspring also offers medium term note programs, managed for issuers of such notes domiciled in Luxembourg. Hereafter, all series of the Trusts, and all such Trusts not having separate series, and all sub-funds of the Luxembourg Funds, as well as the MTN issuers, are referred to as the “Investment Products”. In addition, these Policies and Procedures are used to determine how to vote proxies for the assets managed on behalf of Allspring’s other clients. Not all clients delegate proxy-voting authority to Allspring. Allspring will not vote proxies, or provide advice to clients on how to vote proxies in the absence of specific delegation of authority, a pre-existing contractual agreement, or an obligation under applicable law (e.g., securities that are held in an investment advisory account for which Allspring exercises no investment discretion are not voted by Allspring).
Luxembourg Products
Allspring Global Investments Luxembourg S.A. (“Allspring Luxembourg”) has delegated the portfolio management of the Luxembourg Funds it manages to Allspring and the responsibility for exercising voting rights in conjunction with such delegation; as such, these Policies and Procedures shall apply to the portfolio management of the Allspring (Lux) Worldwide Fund. The respective portfolio management may also delegate the responsibility for exercising voting rights to the Proxy Voting Vendor, with the prior consent of Allspring Luxembourg. Responsibility for exercising voting rights has also been delegated to Allspring with respect to the Worldwide Alternative Fund SICAV-SIF and to the MTN issuers.
Voting Philosophy
Allspring has adopted these Policies and Procedures to ensure that proxies are voted in the best interests of clients and Investment Product investors, without regard to any relationship that any affiliated person of Allspring or the Investment Product (or an affiliated person of such affiliated person) may have with the issuer. Allspring exercises its voting responsibility as a fiduciary with the goal of maximizing value to clients consistent with governing laws and the investment policies of each client. While securities are not purchased to exercise control or to seek to effect corporate change through share ownership activism, Allspring supports sound corporate governance practices at companies in which client assets are invested. Allspring has established an appropriate strategy determining when and how the voting rights related to the instruments held in portfolios managed are exercised, so that these rights are exclusively reserved to the relevant Investment Product and its investors.
Proxy Administrator
The proxy voting process is administered by Allspring’s Operations Department (“Proxy Administrator”), who reports to Allspring’s Chief Operations Officer. The Proxy Administrator is responsible for administering and overseeing the proxy voting process to ensure the implementation of the Policies and Procedures, including regular operational reviews, typically conducted on a weekly basis. The Proxy Administrator monitors third party voting of proxies to ensure it is being done in a timely and responsible manner, including review of scheduled vendor reports. The Proxy Administrator in conjunction with the Allspring Proxy Governance Committee reviews the continuing appropriateness of the Policies and Procedures set forth herein, and recommends revisions as necessary.
Third Party Proxy Voting Vendor
Allspring has retained a third-party proxy voting service, Institutional Shareholder Services Inc. (“ISS”), to assist in the implementation of certain proxy voting-related functions including: 1.) Providing research on proxy matters 2.) Providing technology to facilitate the sharing of research and discussions related to proxy votes 3.) Vote proxies in accordance with Allspring’s guidelines 4.) Handle administrative and reporting items 5.) Maintain records of proxy statements received in connection with proxy votes and provide copies/analyses upon request. Except in instances where clients have retained voting authority, Allspring retains the responsibility for proxy voting decisions.
Proxy Committee
Allspring Proxy Governance Committee
The Allspring Proxy Governance Committee shall be responsible for overseeing the proxy voting process to ensure its implementation in conformance with these Policies and Procedures. The Allspring Proxy Governance Committee shall coordinate with Allspring Compliance to monitor ISS, the proxy voting agent currently retained by Allspring, to determine that ISS is accurately applying the Policies and Procedures as set forth herein and operates as an independent proxy voting agent. Allspring’s ISS Vendor Oversight process includes an assessment of ISS’ Policy and Procedures (“P&P”), including conflict controls and monitoring, receipt and review of routine performance-related reporting by ISS to Allspring and periodic onsite due diligence meetings. Due diligence meetings typically include: meetings with key staff, P&P related presentations and discussions, technology-related demonstrations and assessments, and some sample testing, if appropriate. The Allspring Proxy Governance Committee shall review the continuing appropriateness of the Policies and Procedures set forth herein. The Allspring Proxy Governance Committee may delegate certain powers and responsibilities to proxy voting working groups. The Allspring Proxy Governance Committee reviews and, in accordance with these Policies and Procedures, votes on issues that have been escalated from proxy voting working groups. Members of the Allspring Proxy Governance Committee also oversee the implementation of Allspring Proxy Governance Committee recommendations for the respective functional areas in Allspring that they represent.
Proxy Voting Due Diligence Working Group
Among other delegated matters, the proxy voting Due Diligence Working Group (‘DDWG’) in accordance with these Policies and Procedures, reviews and votes on routine proxy proposals that it considers under these Policies and Procedures in a timely manner. If necessary, the DDWG escalates issues to the Allspring Proxy Governance Committee that are determined to be material by the DDWG or otherwise in accordance with these Policies and Procedures. The DDWG coordinates with Allspring’s Investment Analytics and Compliance teams to review the performance and independence of ISS in exercising its proxy voting responsibilities.
Meetings; Committee Actions
The Allspring Proxy Governance Committee shall convene or act through written consent, including through the use of electronic systems of record, of a majority of Allspring Proxy Governance Committee members as needed and when discretionary voting determinations need to be considered. Any working group of the Allspring Proxy Governance Committee shall have the authority on matters delegated to it to act by vote or written consent, including through the use of electronic systems of record, of a majority of the working group members available at that time. The Allspring Proxy Governance Committee shall also meet quarterly to review the Policies and Procedures.
Membership
Members are selected based on subject matter expertise for the specific deliverables the committee is required to complete. The voting members of the Allspring Proxy Governance Committee are identified in the Allspring Proxy Charter. Changes to the membership of the Allspring Proxy Governance Committee will be made only with approval of the Allspring Proxy Governance Committee. Upon departure from Allspring Global Investments, a member’s position on the Allspring Proxy Governance Committee will automatically terminate.
Voting Procedures
Unless otherwise required by applicable law,1 proxies will be voted in accordance with the following steps and in the following order of consideration:
| | 1. | First, any voting items related to Allspring “Top-of-House” voting principles (as described below under the heading “Allspring Proxy Voting Principles/Guidelines”) will generally be voted in accordance with a custom voting policy with ISS (“Custom Policy”) designed to implement the Allspring’s Top-of-House voting principles.2 |
| | 2. | Second, any voting items for meetings deemed of “high importance”3 (e.g., proxy contests, mergers and acquisitions, capitalization proposals and anti-takeover proposals) where ISS opposes management recommendations will be referred to the Portfolio Management teams for recommendation or the DDWG (or escalated to the Allspring Proxy Governance-Committee) for case-by-case review and vote determination. |
| | 3. | Third, with respect to any voting items where ISS Sustainability Voting Guidelines4 provide a different recommendation than ISS Standard Voting Guidelines, the following steps are taken: |
| | a. | The Allspring Investment Analytics team5 evaluates the matter for materiality and any other relevant considerations. |
| | b. | If the Investment Analytics team recommends further review, the voting item is then referred to the Portfolio Management teams for recommendation or the DDWG (or escalated to the Allspring Proxy Governance Committee) for case-by-case review and vote determination. |
| 1 | Where provisions of the Investment Company Act of 1940 (the “1940 Act”) specify the manner in which items for any third party registered investment companies (e.g., mutual funds, exchange-traded funds and closed-end funds) and business development companies (as defined in Section 2(a)(48) of the 1940 Act) (“Third Party Fund Holding Voting Matters”) held by the Trusts or series thereof, Allspring shall vote the Third Party Fund Holding Voting Matter on behalf of the Trusts or series thereof accordingly. |
| 2 | The Allspring Proxy Governance Committee may determine that additional review of a Top-of-House voting matter is warranted. For example, voting matters for declassified boards or annual election of directors of public operating and holding companies that have certain long-term business commitments (e.g., developing proprietary technology; or having an important strategic alliance in place) may warrant referral to the DDWG (or escalation to the Proxy Governance Committee) for case-by-case review and vote determination. |
| 3 | The term “high importance” is defined as those items designated Proxy Level 6, 5, or 4 by ISS, which include proxy contests, mergers, capitalization proposals and anti-takeover defenses. |
| 4 | ISS’s Sustainability Voting Guidelines seeks to promote support for recognized global governing bodies encouraging sustainable business practices advocating for stewardship of environment, fair labor practices, non-discrimination, and the protection of human rights. |
| 5 | The Investment Analytics team comprises of approximately 35 team members, focused on equity and fixed income risk analytics, mutual fund risk analytics, counterparty risk analytics, model documentation, scientific learning and portfolio analytics (including portfolio characteristics, portfolio construction research, multi-asset class risk analytics, and ESG analytics). The team and its processes serve a similar function as an investment risk committee and reports into the Allspring Chief Investment Officer(s). |
| | c. | If the Investment Analytics team does not recommend further review, the matter is voted in accordance with ISS Standard Voting Guidelines. |
4. Fourth, any remaining proposals are voted in accordance with ISS Standard Voting Guidelines.6
Commitment to the Principles of Responsible Investment
As a signatory to the Principles for Responsible Investment, Allspring has integrated certain environmental, social, and governance factors into its investment processes, which includes the proxy process. As described under Voting Procedures above, Allspring considers ISS’s Sustainability Voting Guidelines as a point of reference in certain cases deemed to be material to a company’s long-term shareholder value.
Voting Discretion
In all cases, the Allspring Proxy Governance Committee (and any working group thereof) will exercise its voting discretion in accordance with the voting philosophy of these Policies and Procedures. In cases where a proxy item is forwarded by ISS to the Allspring Proxy Governance Committee or a working group thereof, the Allspring Proxy Governance Committee or its working group may be assisted in its voting decision through receipt of: (i) independent research and voting recommendations provided by ISS or other independent sources; (ii) input from the investment sub-adviser responsible for purchasing the security; and (iii) information provided by company management and shareholder groups.
Portfolio Manager and Sub-Adviser Input
The Allspring Proxy Governance Committee (and any working group thereof) may consult with portfolio management teams and Fund sub-advisers on specific proxy voting issues as it deems appropriate. In addition, portfolio management teams or Fund sub-advisers may proactively make recommendations to the Allspring Proxy Governance Committee regarding any proxy voting issue. In this regard, the process takes into consideration expressed views of portfolio management teams and Fund sub-advisers given their deep knowledge of investee companies. For any proxy vote, portfolio management teams and Investment Product advisers and sub-advisers may make a case to vote against the ISS or Allspring Proxy Governance Committee’s recommendation (which is described under Voting Procedures above). Any portfolio management team’s or Investment Product adviser’s or sub-adviser’s opinion should be documented in a brief write-up for consideration by the DDWG who will determine, or escalate to the Allspring Proxy Governance Committee, the final voting decision.
Consistent Voting
Proxies will be voted consistently on the same matter when securities of an issuer are held by multiple client accounts unless there are special circumstances such as, for example, proposals concerning corporate actions such as mergers, tender offers, and acquisitions or as reasonably necessary to implement specified proxy voting guidelines as established by a client (e.g. Taft Hartley ISS Guidelines or custom proxy guidelines).
Governance and Oversight
Allspring Top-of-House Proxy Voting Principles/Guidelines.
The following reflects Allspring’s Top-of-House Voting Principles in effect as of the date of these Policies and Procedures. Allspring has put in place a custom voting policy with ISS to implement these voting principles.
| 6 | The voting of proxies for Taft Hartley clients may incorporate the use of ISS’s Taft Hartley voting guidelines. |
We believe that Boards of Directors of investee companies should have strong, independent leadership and should adopt structures and practices that enhance their effectiveness. We recognize that the optimal board size and governance structure can vary by company size, industry, region of operations, and circumstances specific to the company.
| | • | We generally vote for the election of Directors in uncontested elections. We reserve the right to vote on a case-by-case basis when directors fail to meet their duties as a board member, such as failing to act in the best economic interest of shareholders; failing to maintain independent audit, compensation, nominating committees; and failing to attend at least 75% of meetings, etc. |
| | • | We generally vote for an independent board that has a majority of outside directors who are not affiliated with the top executives and have minimal or no business dealings with the company to avoid potential conflicts of interests. |
| | • | Generally speaking, we believe Directors serving on an excessive number of boards could result in time constraints and an inability to fulfill their duties. |
| | • | We generally support adopting a declassified board structure for public operating and holding companies. We reserve the right to vote on a case-by-case basis when companies have certain long-term business commitments. |
| | • | We generally support annual election of directors of public operating and holding companies. We reserve the right to vote on a case-by-case basis when companies have certain long-term business commitments. |
| | • | We believe a well-composed board should embody multiple dimensions of diversity in order to bring personal and professional experiences to bear and create a constructive debate of competing perspectives and opinions in the boardroom. Diversity should consider factors such as gender, ethnicity, and age as well as professional factors such as area of expertise, industry experience and geographic location. |
We believe it is the responsibility of the Board of Directors to create, enhance, and protect shareholder value and that companies should strive to maximize shareholder rights and representation.
| | • | We believe that companies should adopt a one-share, one-vote standard and avoid adopting share structures that create unequal voting rights among their shareholders. We will normally support proposals seeking to establish that shareholders are entitled to voting rights in proportion to their economic interests |
| | • | We believe that directors of public operating and holding companies be elected by a majority of the shares voted. We reserve the right to vote on a case-by-case basis when companies have certain long-term business commitments. This ensures that directors of public operating and holding companies who are not broadly supported by shareholders are not elected to serve as their representatives. We will normally support proposals seeking to introduce bylaws requiring a majority vote standard for director elections. |
| | • | We believe a simple majority voting standard should be required to pass proposals. We will normally support proposals seeking to introduce bylaws requiring a simple majority vote. |
| | • | We believe that shareholders who own a meaningful stake in the company and have owned such stake for a sufficient period of time should have, in the form of proxy access, the ability to nominate directors to appear on the management ballot at shareholder meetings. In general we support market-standardized proxy access proposals and we will analyze them based on various criteria such as threshold ownership levels, a minimum holding period, and the % and/or number of directors that are subject to nomination. |
| | • | We believe that shareholders should have the right to call a special meeting and not wait for company management to schedule a meeting if there is sufficiently high shareholder support for doing so on issues of substantial importance. In general we support the right to call a special meeting if there is balance between a reasonable threshold of shareholders and a hurdle high enough to also avoid the waste of corporate resources for narrowly supported interests. We will evaluate the issues of importance on the basis of serving all shareholders well and not structured for the benefit of a dominant shareholder over others. |
Practical Limitations to Proxy Voting
While Allspring uses its reasonable best efforts to vote proxies, in certain circumstances, it may be impractical or impossible for Allspring to vote proxies (e.g., limited value or unjustifiable costs).
Securities on Loan
As a general matter, securities on loan will not be recalled to facilitate proxy voting (in which case the borrower of the security shall be entitled to vote the proxy). However, as it relates to portfolio holdings of the Investment Products, if the Allspring Proxy Governance Committee is aware of an item in time to recall the security and has determined in good faith that the importance of the matter to be voted upon outweighs the loss in lending revenue that would result from recalling the security (e.g., if there is a controversial upcoming merger or acquisition, or some other significant matter), the security will be recalled for voting.
Share Blocking
Proxy voting in certain countries requires ‘share blocking’. Shareholders wishing to vote their proxies must deposit their shares with a designated depositary before the date of the meeting. Consequently, the shares may not be sold in the period preceding the proxy vote. Absent compelling reasons, Allspring believes that the benefit derived from voting these shares is outweighed by the burden of limited trading. Therefore, if share blocking is required in certain markets, Allspring will not participate and will refrain from voting proxies for those clients impacted by share blocking.
Conflicts of Interest
We always seek to place the interests of our clients first and to identify and manage any conflicts of interest, including those that arise from proxy voting or engagement. Allspring acts as a fiduciary with respect to its asset management activities and therefore we must act in the best interest of our clients and address conflicts that arise.
Conflicts of interest are identified and managed through a strict and objective application of our voting policy and procedures. Allspring may have a conflict of interest regarding a proxy to be voted upon if, for example, Allspring or its affiliates (such as a sub-adviser or principal underwriter) have other relationships with the issuer of the proxy. This type of conflict is generally mitigated by the information barriers between Allspring and its affiliates and our commitment as a fiduciary to independent judgement. However, when the Allspring Proxy Governance Committee becomes aware of a conflict of interest (that gets uncovered through the Allspring Proxy Voting Policy and Procedures), it takes additional steps to mitigate the conflict, by using any of the following methods:
1. Instructing ISS to vote in accordance with its recommendation;
2. Disclosing the conflict to the relevant Board and obtaining its consent before voting;
3. Submitting the matter to the relevant Board to exercise its authority to vote on such matter;
4. Engaging an independent fiduciary who will direct the vote on such matter,
5. Consulting with Legal and Compliance and, if necessary, outside legal counsel for guidance on resolving the conflict of interest,
6. Voting in proportion to other shareholders (“mirror voting”) following consultation with the Board of the Funds if the conflict pertains to a matter involving a portfolio holding of the Funds; or
7. Voting in other ways that are consistent with Allspring’s obligation to vote in the best interests of its clients.
Vendor Oversight
The Allspring Proxy Administrator monitors the ISS proxy process against specific criteria in order to identify potential issues relating to account reconciliation, unknown and rejected ballot reviews, upcoming proxy reviews, share reconciliation oversight, etc. With respect to ISS’s management of its potential conflicts of interest with corporate issuers, ISS provides institutional clients such as Allspring with its “Policy and disclosure of Significant ISS Relationships” and tools to provide transparency of those relationships.
Other Provisions
Policy Review and Ad Hoc Meetings
The Allspring Proxy Governance Committee meets at least annually to review this Policy and consider any appropriate changes. Meetings may be convened more frequently (for example, to discuss a specific proxy agenda or proposal) as requested by the Manager of Proxy Administrator, any member of the Allspring Proxy Governance Committee, or Allspring’s Chief Compliance Officer. The Allspring Proxy Governance Committee includes representation from Portfolio Management, Operations, Investment Analytics and, in a non-voting consultative capacity, Compliance.
Records Retention
The Allspring Proxy Administrator will maintain the following records relating to the implementation of the Policies and Procedures:
| | • | | A copy of these proxy voting policies and procedures; |
| | • | | Proxy statements received for client securities (which will be satisfied by relying on ISS); |
| | • | | Records of votes cast on behalf of Investment Products and separate account clients (which ISS maintains on behalf of Allspring); |
| | • | | Records of each written client request for proxy voting records and Allspring’s written response to any client request (written or oral) for such records; and |
| | • | | Any documents prepared by Allspring or ISS that were material to making a proxy voting decision. |
Such proxy voting books and records shall be maintained at an office of Allspring in an easily accessible place for a period of six years.
Compliance with Regional Regulations and Client Delegation Arrangements
U.S. Regulation
These Policies and Procedures have been written in compliance with Rule 206(4)-6 of the Investment Advisers Act of 1940. Proxy voting records for Allspring’s mutual funds are disclosed on Form N-PX annually, as required by Section 30 and Rule 30b1-4 of the Investment Company Act of 1940, to the Securities and Exchange Commission (“SEC”).
E.U. Regulation
These Policies and Procedures have been established, implemented and maintained, as they apply to Allspring Luxembourg and Allspring Global Investments (UK) Limited, in accordance the EU Shareholder Rights Directive II (EU 2017/828) (SEF II). Specific to Allspring Luxembourg, the Policies and Procedures also comply with Article 23 of CSSF Regulation No. 10-4, and the CSSF Circular 18/698.
Disclosure of policies and procedures
A summary of the proxy voting policy and procedures are disclosed on Allspring’s website. In addition, Allspring will disclose to its separate clients (i.e. proxy votes for assets managed on behalf of Allspring’s other clients as per a delegation arrangement) a summary description of its proxy voting policy and procedures via mail.
Disclosure of proxy voting results
Allspring will provide to clients proxy statements and any records as to how Allspring voted proxies on behalf of clients, quarterly or upon request. For assistance, clients may contact their relationship manager, call Allspring at 1-800-259-3305 or e-mail: allspring.clientadministration@asllspring-global.com to request a record of proxies voted on their behalf.
Allspring will publish high-level proxy voting statistics in periodic reports. However, except as otherwise required by law, Allspring has a general policy of not disclosing to any issuer specific or third party how its separate account client proxies are voted.
Approved by the Allspring Proxy Governance Committee: November 2021
| ITEM 8. | PORTFOLIO MANAGERS OF CLOSED-END MANAGEMENT INVESTMENT COMPANIES |
PORTFOLIO MANAGERS
Christopher Y. Kauffman, CFA
Christopher Kauffman is a senior portfolio manager for the Multi-Sector Fixed Income - Plus and High Yield team. Previously, Christopher was with the Tattersall Advisory Group, where he served in a similar role. He began his investment industry career as an investment officer for NISA Investment Advisors, where he was responsible for mortgage-backed securities analysis, risk assessment, and trading. He earned a bachelor’s degree in finance and economics and a master’s degree in business administration with an emphasis in finance from Washington University in St. Louis. He has earned the right to use the Chartered Financial Analyst® (CFA®) designation and is a member of CFA Society St. Louis and CFA Institute.
Peter Wilson
Peter Wilson is managing director, portfolio manager and head of the Global Fixed Income team. His responsibilities include macro-portfolio allocation, portfolio positioning, and risk management. Previously, Peter was with Evergreen Investments, where he served in a similar role since 1992. Before that, he served as treasurer and portfolio manager for Axe-Houghton, vice president at Bankers Trust in London and New York, and portfolio manager at Merchant Bankers Kleinwort Benson Ltd. Peter began his investment industry career in 1978 at international stockbrokers James Capel & Co. He was educated in Canada, Hong Kong, and England.
Michael Lee
Michael Lee is a portfolio manager and head of trading with the Global Fixed Income team. His responsibilities include the day-to-day management and implementation of portfolio strategies. Previously, Michael was with Evergreen Investments, where he served in a similar role since 1992. Prior to this, he worked at Northern Trust Co. Earlier, he held investment positions at JPMorgan Chase and National Westminster Bank. Michael began his investment industry career in 1982. He is a member of the U.K. Society of Investment Professionals.
Alex Perrin
Alex Perrin is head of investments and portfolio manager of the Global Fixed Income team. His responsibilities include developing investment strategies, macro-portfolio allocation, portfolio positioning, and risk management. He joined the firm in 1992. Alex earned a bachelor’s degree in mathematics and computer science from Hull University in the U.K. He is a member of the Society of Technical Analysts and an Associate Member of the U.K. Society of Investment Professionals.
Lauren van Biljon, CFA
Lauren van Biljon is a portfolio manager with the Global Fixed Income team. Her responsibilities include macro-portfolio allocation, portfolio positioning, and risk management. Previously, Lauren was with Evergreen Investments. Prior to this, she served as an emerging markets analyst with 4Cast Ltd., where she began her investment industry career in 2007. She earned a bachelor’s degree in economics from the University of Cape Town, South Africa, and a master’s degree in economics from the University of Edinburgh, U.K. Lauren has earned the right to use the Chartered Financial Analyst® (CFA®) designation and is a member of the Society of Technical Analysts (STA). She earned a bachelor’s degree in economics from the University of Cape Town and a master’s degree in economics from the University of Edinburgh. She has earned the right to use the Chartered Financial Analyst® (CFA®) designation and is a member of the Society of Technical Analysts.
Chris Lee, CFA
Chris Lee is a senior portfolio manager on the Multi-Sector Fixed Income - Plus and High Yield team. Previously, Chris served as head of high yield trading for the U.S. High Yield Fixed Income team since 2012. Prior to this he was with Silver Lake Credit where he served as a managing director, portfolio manager, and head of trading. Before joining Silver Lake in 2007, Chris was a senior research analyst with Wells Fargo’s Proprietary Investments Group. Chris earned a bachelor’s degree in political science from University of California, Irvine, where he graduated magna cum laude. He also earned a master’s degree in business administration from the Graduate School of Management at the University of California, Davis. Chris is a graduate of Wells Fargo’s Credit Management Training Program and has earned the right to use the Chartered Financial Analyst® (CFA®) designation.
Michael J. Schueller, CFA
Michael (Mike) Schueller is a portfolio manager and research analyst for the Multi-Sector Fixed Income - Plus and High Yield team. Previously, Mike was a senior investment research analyst. Prior to that, he was with Strong Capital Management in a similar position. He rejoined Strong after leaving to start a trust department for Community Bank & Trust in Sheboygan, Wisconsin. Mike first joined Strong as associate counsel in the legal department. Prior to this, he practiced law with Reinhart, Boerner, Van Deuren, Norris & Rieselbach, S.C., in Milwaukee, specializing in corporate reorganizations, mergers, and acquisitions. He earned a bachelor’s degree in economics from the University of Minnesota and a law degree from the University of Wisconsin, Madison. Mike has earned the right to use the Chartered Financial Analyst® (CFA®) designation.
Noah Wise, CFA
Noah Wise is a senior portfolio manager for the Multi-Sector Fixed Income - Plus and High Yield team. Previously, Noah was a research analyst. Before that, Noah worked as a lead market maker for Interactive Brokers. He began his investment industry career as an intern for Capital Financial Services. Noah earned a bachelor’s degree in finance and a master’s degree in business administration with an emphasis in securities analysis from the University of Wisconsin, Madison. He has earned the right to use the Chartered Financial Analyst® (CFA®) designation.
OTHER FUNDS AND ACCOUNTS MANAGED
The following table provides information about the registered investment companies and other pooled investment vehicles and accounts managed by the portfolio manager of the Fund as of the Fund’s most recent year ended October 31, 2021.
Christopher Y. Kauffman
| | | | | | | | | | | | |
| I manage the following types of accounts: | | Other Registered
Investment
Companies | | | Other Pooled
Investment
Vehicles | | | Other Accounts | |
Number of above accounts | | | 4 | | | | 0 | | | | 3 | |
Total assets of above accounts (millions) | | $ | 8,072.16 | | | $ | 0 | | | $ | 297.43 | |
performance based fee accounts:
| | | | | | | | | | | | |
| I manage the following types of accounts: | | Other Registered
Investment
Companies | | | Other Pooled
Investment
Vehicles | | | Other Accounts | |
Number of above accounts | | | 0 | | | | 0 | | | | 0 | |
Total assets of above accounts (millions) | | $ | 0 | | | $ | 0 | | | $ | 0 | |
Chris Lee
| | | | | | | | | | | | |
| I manage the following types of accounts: | | Other Registered
Investment
Companies | | | Other Pooled
Investment
Vehicles | | | Other Accounts | |
Number of above accounts | | | 3 | | | | 0 | | | | 0 | |
Total assets of above accounts (millions) | | $ | 1,924.10 | | | $ | 0 | | | $ | 0 | |
performance based fee accounts:
| | | | | | | | | | | | |
| I manage the following types of accounts: | | Other Registered
Investment
Companies | | | Other Pooled
Investment
Vehicles | | | Other Accounts | |
Number of above accounts | | | 0 | | | | 0 | | | | 0 | |
Total assets of above accounts (millions) | | $ | 0 | | | $ | 0 | | | $ | 0 | |
Michael Lee
| | | | | | | | | | | | |
| I manage the following types of accounts: | | Other Registered
Investment
Companies | | | Other Pooled
Investment
Vehicles | | | Other Accounts | |
Number of above accounts | | | 3 | | | | 3 | | | | 8 | |
Total assets of above accounts (millions) | | $ | 374.56 | | | $ | 408.99 | | | $ | 2,326.13 | |
performance based fee accounts:
| | | | | | | | | | | | |
| I manage the following types of accounts: | | Other Registered
Investment
Companies | | | Other Pooled
Investment
Vehicles | | | Other Accounts | |
Number of above accounts | | | 0 | | | | 0 | | | | 3 | |
Total assets of above accounts (millions) | | $ | 0 | | | $ | 0 | | | $ | 1,257.32 | |
Alex Perrin
| | | | | | | | | | | | |
| I manage the following types of accounts: | | Other Registered
Investment
Companies | | | Other Pooled
Investment
Vehicles | | | Other Accounts | |
Number of above accounts | | | 3 | | | | 3 | | | | 3 | |
Total assets of above accounts (millions) | | $ | 374.56 | | | $ | 408.99 | | | $ | 2,326.13 | |
performance based fee accounts:
| | | | | | | | | | | | |
| I manage the following types of accounts: | | Other Registered
Investment
Companies | | | Other Pooled
Investment
Vehicles | | | Other Accounts | |
Number of above accounts | | | 0 | | | | 0 | | | | 3 | |
Total assets of above accounts (millions) | | $ | 0 | | | $ | 0 | | | $ | 1,257.32 | |
Michael J. Schueller
| | | | | | | | | | | | |
| I manage the following types of accounts: | | Other Registered
Investment
Companies | | | Other Pooled
Investment
Vehicles | | | Other Accounts | |
Number of above accounts | | | 10 | | | | 2 | | | | 1 | |
Total assets of above accounts (millions) | | $ | 9,055.53 | | | $ | 202.51 | | | $ | 34.84 | |
performance based fee accounts:
| | | | | | | | | | | | |
| I manage the following types of accounts: | | Other Registered
Investment
Companies | | | Other Pooled
Investment
Vehicles | | | Other Accounts | |
Number of above accounts | | | 0 | | | | 0 | | | | 0 | |
Total assets of above accounts (millions) | | $ | 0 | | | $ | 0 | | | $ | 0 | |
Lauren van Biljon
| | | | | | | | | | | | |
| I manage the following types of accounts: | | Other Registered
Investment
Companies | | | Other Pooled
Investment
Vehicles | | | Other Accounts | |
Number of above accounts | | | 1 | | | | 2 | | | | 8 | |
Total assets of above accounts (millions) | | $ | 109.76 | | | | 337.97 | | | | 2587.14 | |
performance based fee accounts:
| | | | | | | | | | | | |
| I manage the following types of accounts: | | Other Registered
Investment
Companies | | | Other Pooled
Investment
Vehicles | | | Other Accounts | |
Number of above accounts | | | 0 | | | | 0 | | | | 3 | |
Total assets of above accounts (millions) | | $ | 0 | | | $ | 0 | | | $ | 1557.06 | |
Peter Wilson
| | | | | | | | | | | | |
| I manage the following types of accounts: | | Other Registered
Investment
Companies | | | Other Pooled
Investment
Vehicles | | | Other Accounts | |
Number of above accounts | | | 1 | | | | 2 | | | | 8 | |
Total assets of above accounts (millions) | | $ | 109.76 | | | | 337.97 | | | | 2587.14 | |
performance based fee accounts:
| | | | | | | | | | | | |
| I manage the following types of accounts: | | Other Registered
Investment
Companies | | | Other Pooled
Investment
Vehicles | | | Other Accounts | |
Number of above accounts | | | 0 | | | | 0 | | | | 3 | |
Total assets of above accounts (millions) | | $ | 0 | | | $ | 0 | | | $ | 1557.06 | |
Noah Wise
| | | | | | | | | | | | |
| I manage the following types of accounts: | | Other Registered
Investment
Companies | | | Other Pooled
Investment
Vehicles | | | Other Accounts | |
Number of above accounts | | | 5 | | | | 4 | | | | 7 | |
Total assets of above accounts (millions) | | $ | 6,539.19 | | | $ | 2,587.78 | | | $ | 845.79 | |
performance based fee accounts:
| | | | | | | | | | | | |
| I manage the following types of accounts: | | Other Registered
Investment
Companies | | | Other Pooled
Investment
Vehicles | | | Other Accounts | |
Number of above accounts | | | 0 | | | | 0 | | | | 0 | |
Total assets of above accounts (millions) | | $ | 0 | | | $ | 0 | | | $ | 0 | |
MATERIAL CONFLICTS OF INTEREST
The Portfolio Managers face inherent conflicts of interest in their day-to-day management of the Funds and other accounts because the Funds may have different investment objectives, strategies and risk profiles than the other accounts managed by the Portfolio Managers. For instance, to the extent that the Portfolio Managers manage accounts with different investment strategies than the Funds, they may from time to time be inclined to purchase securities, including initial public offerings, for one account but not for a Fund. Additionally, some of the accounts managed by the Portfolio Managers may have different fee structures, including performance fees, which are or have the potential to be higher or lower, in some cases significantly higher or lower, than the fees paid by the Funds. The differences in fee structures may provide an incentive to the Portfolio Managers to allocate more favorable trades to the higher-paying accounts.
To minimize the effects of these inherent conflicts of interest, the Sub-Advisers have adopted and implemented policies and procedures, including brokerage and trade allocation policies and procedures, that they believe address the potential conflicts associated with managing portfolios for multiple clients and ensure that all clients are treated fairly and equitably. Additionally, some of the Sub-Advisers minimize inherent conflicts of interest by assigning the Portfolio Managers to accounts having similar objectives. Accordingly, security block purchases are allocated to all accounts with similar objectives in proportionate weightings. Furthermore, the Sub-Advisers have adopted a Code of Ethics under Rule 17j-1 of the 1940 Act and Rule 204A-1 under the Investment Advisers Act of 1940 (the “Advisers Act”) to address potential conflicts associated with managing the Funds and any personal accounts the Portfolio Managers may maintain.
Allspring Investments
Allspring Investments’ Portfolio Managers often provide investment management for separate accounts advised in the same or similar investment style as that provided to mutual funds. While management of multiple accounts could potentially lead to conflicts of interest over various issues such as trade allocation, fee disparities and research acquisition, Allspring Investments has implemented policies and procedures for the express purpose of ensuring that clients are treated fairly and that potential conflicts of interest are minimized.
COMPENSATION
The Portfolio Managers were compensated by their employing sub-adviser from the fees the Adviser paid the Sub-Adviser using the following compensation structure:
Allspring Investments Compensation.
The compensation structure for Allspring Investments’ Portfolio Managers includes a competitive fixed base salary plus variable incentives (Allspring Investments utilizes investment management compensation surveys as confirmation). Incentive bonuses are typically tied to pretax relative investment performance of all accounts under his or her management within acceptable risk parameters. Relative investment performance is generally evaluated for 1, 3, and 5 year performance results, with a predominant weighting on the 3- and 5- year time periods, versus the relevant benchmarks and/or peer groups consistent with the investment style. This evaluation takes into account relative performance of the accounts to each account’s individual benchmark and/or the relative composite performance of all accounts to one or more relevant benchmarks consistent with the overall investment style. In the case of each Fund, the benchmark(s) against which the performance of the Fund’s portfolio may be compared for these purposes generally are indicated in the Performance” sections of the Prospectuses.
Allspring Investments’ investment incentive program plays an important role in aligning the interests of our portfolio managers, investment team members, clients, and shareholders. Incentive awards for portfolio managers are determined based on a review of relative investment and business/team performance. Investment performance is generally evaluated for 1, 3, and 5 year performance results, with a predominant weighting on the 3- and 5- year time periods, versus the relevant benchmarks and/or peer groups consistent with the investment style. Once determined, incentives are awarded to portfolio managers annually, with a portion awarded as annual cash and a portion awarded as long term incentive. The long term portion of incentives generally carry a pro-rated vesting schedule over a three year period. For many of our portfolio managers, Allspring Investments further requires a portion of their annual long-term award be allocated directly into each strategy they manage through a deferred compensation vehicle. In addition, our investment team members who are eligible for long term awards also have the opportunity to invest up to 100% of their awards into investment strategies they support (through a deferred compensation vehicle).
BENEFICIAL OWNERSHIP OF THE FUND
The following table shows for each Portfolio Manager the dollar value of the Fund beneficially owned by the Portfolio Manager as of October 31, 2021:
| | | | |
| Christopher Y. Kauffman, | | none | | |
| Chris Lee, | | | | $100,001 to 500,000 |
| Michael Lee | | | | none |
| Alex Perrin | | | | None |
| Michael J. Schueller | | | | none |
| Lauren van Biljon | | none | | |
| Peter Wilson | | | | none |
| Noah Wise, | | | | none |
| ITEM 9. | PURCHASES OF EQUITY SECURITIES BY CLOSED-END MANAGEMENT INVESTMENT COMPANY AND AFFILIATED PURCHASERS |
| | | | | | | | | | | | | | | | |
| | | (a) | | | (b) | | | (c) | | | (d) | |
Period | | Total Number
of Shares
Purchased | | | Average Price Paid
per Share | | | Total Number
of Shares
Purchased as
Part of
Publicly
Announced
Plans or
Programs | | | Maximum
Number of
Shares that
May Yet Be
Purchased
Under the
Plans or
Programs | |
11/1/2020 to 11/30/2020 | | | 256,377 | | | | 11.39 | | | | 256,377 | | | | 2,551,709 | |
12/1/2020 to 12/31/2020 | | | 64,489 | | | | 12.00 | | | | 64,489 | | | | 2,487,220 | |
1/1/2021 to 1/31/2021 | | | 0 | | | | 0 | | | | 0 | | | | 2,808,086 | |
2/1/2021 to 2/28/2021 | | | 0 | | | | 0 | | | | 0 | | | | 2,808,086 | |
3/1/2021 to 3/31/2021 | | | 0 | | | | 0 | | | | 0 | | | | 2,808,086 | |
4/1/2021 to 4/30/2021 | | | 0 | | | | 0 | | | | 0 | | | | 2,808,086 | |
5/1/2021 to 5/31/21 | | | 0 | | | | 0 | | | | 0 | | | | 2,808,086 | |
6/1/2021 to 6/30/21 | | | 0 | | | | 0 | | | | 0 | | | | 2,808,086 | |
7/1/2021 to 7/31/21 | | | 0 | | | | 0 | | | | 0 | | | | 2,808,086 | |
8/1/2021 to 8/31/21 | | | 0 | | | | 0 | | | | 0 | | | | 2,808,086 | |
9/1/2021 to 9/30/21 | | | 0 | | | | 0 | | | | 0 | | | | 2,808,086 | |
10/1/2021 to 10/31/21 | | | 0 | | | | 0 | | | | 0 | | | | 2,808,086 | |
| | | | | | | | | | | | | | | | |
Total | | | 320,866 | | | | 11.51 | | | | 320,866 | | | | 2,808,086 | |
| | | | | | | | | | | | | | | | |
On November 12, 2021, the Fund announced a renewal of its open-market share repurchase program (the “Buyback Program”). Under the renewed Buyback Program, the Fund may repurchase up to 10% of its outstanding shares in open market transactions during the period beginning on January 1, 2022 and ending on December 31, 2022. The Fund’s Board of Trustees has delegated to Allspring Funds Management, LLC, the Fund’s adviser, discretion to administer the Buyback Program, including the determination of the amount and timing of repurchases in accordance with the best interests of the Fund and subject to applicable legal limitations.
| ITEM 10. | SUBMISSION OF MATTERS TO A VOTE OF SECURITY HOLDERS |
There have been no material changes to the procedures by which shareholders may recommend nominees to the registrant’s Board of Trustees that have been implemented since the registrant’s last provided disclosure in response to the requirements of this Item.
| ITEM 11. | CONTROLS AND PROCEDURES |
(a) The President and Treasurer have concluded that the Allspring Multi-Sector Income Fund (the “Fund”) disclosure controls and procedures (as defined in Rule 30a-3(c) under the Investment Company Act of 1940) provide reasonable assurances that material information relating to the Fund is made known to them by the appropriate persons based on their evaluation of these controls and procedures as of a date within 90 days of the filing of this report.
(b) There were no significant changes in the Fund’s internal controls over financial reporting (as defined in Rule 30a-3(d) under the Investment Company Act of 1940) that occurred during the most recent fiscal half-year of the period covered by this report that materially affected, or is reasonably likely to materially affect, the registrant’s internal control over financial reporting.
| ITEM 12. | DISCLOSURES OF SECURITIES LENDING ACTIVITES FOR CLOSED-END MANAGEMENT INVESTMENT COMPANIES |
Not applicable.
SIGNATURES
Pursuant to the requirements of the Securities Exchange Act of 1934 and the Investment Company Act of 1940, the registrant has duly caused this report to be signed on its behalf by the undersigned, thereunto duly authorized.
| | |
| Allspring Multi-Sector Income Fund |
| |
| By: | | /s/ Andrew Owen |
| | Andrew Owen |
| | President |
|
| Date: December 23, 2021 |
Pursuant to the requirements of the Securities Exchange Act of 1934 and the Investment Company Act of 1940, this report has been signed below by the following persons on behalf of the registrant and in the capacities and on the date indicated.
| | |
| Allspring Multi-Sector Income Fund |
| |
| By: | | /s/ Andrew Owen |
| | Andrew Owen President |
|
| Date: December 23, 2021 |
| |
| By: | | /s/Jeremy DePalma |
| | Jeremy DePalma |
| | Treasurer |
|
| Date: December 23, 2021 |