As filed with the Securities and Exchange Commission on June 7, 2006
UNITED STATES
SECURITIES AND EXCHANGE COMMISSION
Washington, D.C. 20549
FORM N-CSR
CERTIFIED SHAREHOLDER REPORT OF REGISTERED
MANAGEMENT INVESTMENT COMPANIES
| | |
| Investment Company Act File Number: 811-21332 |
RMK High Income Fund, Inc.
|
| (Exact name of registrant as specified in charter) |
| | |
Morgan Keegan Tower Fifty North Front Street Memphis, Tennessee | | 38103 |
| (Address of principal executive offices) | | (Zip code) |
Allen B. Morgan, Jr.
Morgan Keegan Tower
Fifty North Front Street
Memphis, Tennessee 38103
|
| (Name and address of agent for service) |
Registrant’s telephone number, including area code: (901) 524-4100
with copies to:
Arthur J. Brown, Esq.
Kirkpatrick & Lockhart Nicholson Graham LLP
1601 K Street, N.W.
Washington, D.C. 20006
Date of fiscal year end: March 31, 2006
Date of reporting period: March 31, 2006
| Item 1. | Reports to Stockholders. |
The following is a copy of the report transmitted to stockholders pursuant to Rule 30e-1 under the Investment Company Act of 1940, as amended (the “1940 Act”) (17 CFR 270.30e-1):
TABLEOF CONTENTS
There is no assurance that the Funds will achieve their investment objectives. The Funds are subject to market risk, which include the possibilities that the market values of the securities owned by the Funds will decline or that the shares of the Funds will trade at lower prices in the market. Accordingly, you can lose money investing in the Funds.
| | | | |
| NOT FDIC INSURED | | MAY LOSE VALUE | | NO BANK GUARANTEE |
i
LETTER TO STOCKHOLDERS
Dear Fellow Stockholders:
We are pleased to present the enclosed combined annual report for RMK Advantage Income Fund, Inc., RMK High Income Fund, Inc., RMK Multi-Sector High Income Fund, Inc. and RMK Strategic Income Fund, Inc. (each, a “Fund” and collectively, the “Funds”). In this report, you will find information on each Fund’s investment objective and strategy and learn how your investment performed during the fiscal year ended March 31, 2006. The portfolio manager will also provide an overview of the market conditions and discuss some of the factors that affected investment performance during the reporting period. In addition, this report includes each Fund’s audited financial statements and each Fund’s portfolio of investments as of March 31, 2006.
As always, we appreciate your continued support of the Regions Morgan Keegan closed-end funds. We remain committed to helping you pursue your financial goals through investments in our fund family. You have our commitment to bring you the highest level of disciplined decision making and personal service to meet your financial needs. If you have any questions about the Funds, please call us at 800-564-2188.
Sincerely,

Carter E. Anthony, CFA
President and Chief Investment Officer
Morgan Asset Management, Inc.
May 22, 2006
1
[THIS PAGE INTENTIONALLY LEFT BLANK]
2
RMK ADVANTAGE INCOME FUND, INC.
OBJECTIVE & STRATEGY
RMK Advantage Income Fund, Inc. seeks a high level of current income. The Fund seeks capital growth as a secondary investment objective when consistent with its primary investment objective. The Fund invests a majority of its total assets in below investment grade debt securities (commonly referred to as “junk bonds”) that offer attractive yield and capital appreciation potential. The Fund may also invest in investment grade securities and up to 15% of its total assets in foreign debt and equity securities and up to 25% of its total assets in domestic equity securities, including common and preferred stocks. The Fund invests in a wide range of below investment grade debt securities, including corporate bonds, mortgage- and asset-backed securities and municipal and foreign government obligations, as well as securities of companies in bankruptcy reorganization proceedings or otherwise in the process of debt restructuring. (Below investment grade debt securities are rated Ba1 or lower by Moody’s Investors Service, Inc., rated BB+ or lower by Standard & Poor’s Ratings Group or Fitch Ratings Ltd., comparably rated by another nationally recognized statistical rating organization, or not rated by any rating agency but determined by the Fund’s investment adviser to be of comparable quality.)
INVESTMENT RISKS: Bond funds tend to experience smaller fluctuations in value than stock funds. However, investors in any bond fund should anticipate fluctuations in price. Bond prices and the value of bond funds decline as interest rates rise. Longer-term funds generally are more vulnerable to interest rate risk than shorter-term funds. Below investment grade bonds involve greater credit risk, which is the risk that the issuer will not make interest or principal payments when due. An economic downturn or period of rising interest rates could adversely affect the ability of issuers, especially issuers of below investment grade debt, to service primary obligations and an unanticipated default could cause the Fund to experience a reduction in value of its shares. The value of U.S. and foreign equity securities in which the Fund invests will change based on changes in a company’s financial condition and in overall market and economic conditions. Use of leverage may increase the likelihood that the net asset value of the Fund and market value of its common shares will be more volatile, and the yield and total return to common stockholders will tend to fluctuate more in response to changes in interest rates and creditworthiness.
3
RMK ADVANTAGE INCOME FUND, INC.
MANAGEMENT DISCUSSIONOF FUND PERFORMANCE
For the six months and the year ended March 31, 2006, RMK Advantage Income Fund, Inc. had total returns of 7.35% and 23.28%, respectively, based on market price and reinvested dividends. For the six months and the year ended March 31, 2006, the Fund had total returns of 5.80% and 11.05%, respectively, based on net asset value and reinvested dividends. For the six months and the year ended March 31, 2006, the Lehman Brothers Ba U.S. High Yield Index1 had total returns of 2.44% and 6.83%, respectively. The Fund’s strong performance was primarily due to the Fund’s relative yield advantage as evidenced by the monthly dividend distributions and the relative net asset value stability produced by the Fund’s allocation to a wide variety of asset types. The Fund had an above average yield due to three main factors: an efficient leverage package which allowed the Fund to have additional money invested with limited borrowing costs; an increasing interest rate environment and our overweighting in the floating rate securities sector; and a prospectus that gives the management team latitude to look at sectors that are not in the index.
During the fiscal year ended March 31, 2006, the Fund paid a total income distribution of $2.10 per share, which was composed of total regular monthly dividends for the year of $1.73 per share and special dividend distributions in December 2005 of $0.37 per share. For the last seven months of the Fund’s fiscal year, the Fund paid monthly dividends of $0.15 per share.
In spite of a modest level of industry-wide outflows from corporate high yield funds, the high yield corporate market feels pretty good so far this year. With little change to underlying asset value, index performance has remained at coupon clipping levels (i.e. prices have held up). Importantly, economic conditions continue to remain strong causing the Fed to nudge interest rates ever higher. A strong economy is very good for corporate earnings, cash flows, balance sheets, equity valuations, and, in turn, high yield corporate bonds. Such conditions create more opportunities for corporate bond issuers to refinance or otherwise payoff their bonds, effectively placing an underlying bid for the bonds. In other words, steady bond prices. Unfortunately, strong bids create a scarcity of attractive investment opportunities and that is the challenge we face today. Opportunities exist in every market environment, they just may not be readily apparent.
We believe the domestic automotive sector is providing several attractive buying opportunities. This sector is a classic example of an industry in dire need of restructuring. Bound by uncompetitive labor, plant, and capital costs coupled with less than inspiring product offerings, many will have to restructure their contractual obligations either in or out of court. In many circumstances, the courts will be the
4
RMK ADVANTAGE INCOME FUND, INC.
only means by which the necessary fundamental changes to survive in the long run can be accomplished. Bankruptcy isn’t necessarily the end and, in many cases, is a new beginning. We like this space because turmoil convinces and, often times forces, weak hands to dispose of valuable assets at fire-sale prices. While these assets may not be worth “par” in bond parlance, they almost always have some value. The trick is to estimate that value and pay accordingly. Since we define risk by the price one pays, we believe the risk reward ratio is largely tilted in the buyer’s favor in selected automotive sector bonds. We have and plan to continue to trade opportunistically in this space.
In the asset-backed and mortgage-backed arena, market technicals have made a dramatic about face over the last six weeks. The market was very heavy during the fourth quarter of 2005 with very few buyers willing to commit to new positions at the close of a very difficult year. However, beginning in February the demand for “BBB” to “B” floating rate asset-backed bonds picked up dramatically. The prospect of continued rate hikes from the Federal Reserve and the lack of available yield in the fixed income market have forced investors into some of the more “off the run” issues that we have used effectively in the high income fund. We expect floating rate assets to continue to contribute to our net asset value stability and current yield during the next 3 to 6 months as short term rates push higher. Our challenge will be to find enough suitable fixed rate assets as this interest rate cycle nears the point where the Federal Reserve will begin lowering rates.

James C. Kelsoe, Jr., CFA
Senior Portfolio Manager
Morgan Asset Management, Inc.
Market forecasts provided in this report may not necessarily come to pass. There is no assurance that the Fund will achieve its investment objectives. These views are subject to change at any time based upon market or other conditions, and Morgan Asset Management, Inc. disclaims any responsibility to update such views. The Fund is subject to market risk, which include the possibilities that the market values of the securities owned by the Fund will decline or that shares of the Fund will trade at lower prices in the market. Accordingly, you can lose money investing in the Fund.
INDEX DESCRIPTION
| 1 | | The Lehman Brothers Ba U.S. High Yield Index covers the universe of fixed rate, non-investment grade debt. Pay-in-kind (PIK) bonds, Eurobonds, and debt issues from countries designated as emerging markets (e.g., Argentina, Brazil, Venezuela, etc.) are excluded, but Canadian and global bonds (SEC registered) of issuers in non-emerging countries are included. Original issue zeroes, step-up coupon structures, and 144As are also included. The index is unmanaged, and unlike the fund, is not affected by cashflows or trading and other expenses. It is not possible to invest directly in an index. |
5
RMK ADVANTAGE INCOME FUND, INC.
PORTFOLIO STATISTICS†
AS OF MARCH 31, 2006
| | |
Average Credit Quality | | BB- |
Current Yield | | 10.71% |
Yield to Maturity | | 12.79% |
Duration | | 3.32 Years |
Average Effective Maturity | | 4.42 Years |
Percentage of Leveraged Assets | | 26% |
Total Number of Holdings | | 260 |
| † | | The Fund’s composition is subject to change. |
CREDIT QUALITY†
AS OF MARCH 31, 2006
| | | | | | |
| %OFTOTALINVESTMENTS | | %OFTOTALINVESTMENTS |
AAA | | 2.1% | | B | | 10.2% |
AA | | 0.7% | | CCC | | 21.3% |
A | | 0.8% | | CC | | 0.4% |
BBB | | 21.8% | | C | | 0.2% |
BB | | 24.5% | | D | | 0.9% |
| | | | | Not Rated | | 17.1% |
| | | | | | |
|
| | | | | Total | | 100.0% |
| † | | The Fund’s composition is subject to change. |
ASSET ALLOCATION†
AS OF MARCH 31, 2006
| | |
| %OFTOTALINVESTMENTS |
Corporate Bonds | | 26.6% |
Equipment Leases | | 18.2% |
Collateralized Mortgage Obligations | | 13.8% |
Home Equity Loans | | 12.5% |
Common Stock | | 9.5% |
Collateralized Debt Obligations | | 6.3% |
Short Term Investments | | 5.5% |
Preferred Stock | | 2.7% |
Certificate-Backed Obligations | | 1.5% |
Other | | 1.4% |
Commercial Loans | | 1.0% |
Manufactured Housing Loans | | 0.7% |
Franchise Loans | | 0.3% |
| | |
|
Total | | 100.0% |
| † | | The Fund’s composition is subject to change. |
6
RMK ADVANTAGE INCOME FUND, INC.
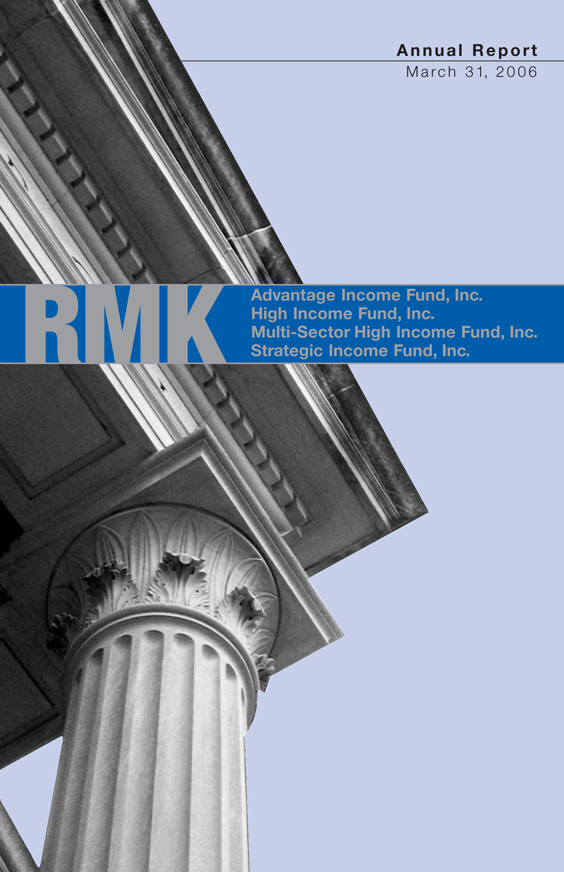
NAV & MARKET PRICE HISTORY*
The graph below illustrates the net asset value and market price history of RMK Advantage Income Fund, Inc. (NYSE: RMA) from November 8, 2004 (commencement of investment operations) to March 31, 2006.
| * | | Net asset value is calculated every day that the New York Stock Exchange is open as of the close of trading (normally 4:00 p.m. Eastern Time) by taking the closing market value of all portfolio securities owned, cash and other assets, subtracting all liabilities, then dividing the result (total net assets) by the total number of shares outstanding. The market price is the last reported price at which a share of the Fund was sold on the New York Stock Exchange. |
7
RMK ADVANTAGE INCOME FUND, INC.
PERFORMANCE INFORMATION
| | | | | | | | | |
| | | AVERAGE ANNUAL TOTAL RETURNS | |
| AS OF MARCH 31, 2006 | | SIX
MONTHS* | | | 1
YEAR | | | COMMENCEMENT
OF INVESTMENT
OPERATIONS1 | |
| MARKET VALUE | | 7.35 | % | | 23.28 | % | | 22.21 | % |
| NET ASSET VALUE | | 5.80 | % | | 11.05 | % | | 10.52 | % |
LEHMAN BROTHERS BA
HIGH YIELD INDEX2 | | 2.44 | % | | 6.83 | % | | 4.44 | % |
| * | | Not annualized for periods less than one year. |
Performance data quoted represents past performance which is no guarantee of future results. Investment return and principal value will fluctuate so that an investor’s shares, when redeemed, may be worth more or less than their original cost. Fund performance changes over time and current performance may be lower or higher than what is stated. For the most recent performance, call 800-564-2188. Total returns assume an investment at the common share market price or net asset value at the beginning of the period, reinvestment of all dividends and distributions for the period in accordance with the Fund’s dividend reinvestment plan, and sale of all shares at the closing market price (excluding any commissions) or net asset value at the end of the period. Returns shown do not reflect the deduction of taxes that a shareholder would pay on Fund distributions or on the sale of Fund shares.
| 1 | | The Fund commenced investment operations on November 8, 2004. |
| 2 | | The Lehman Brothers Ba U.S. High Yield Index covers the universe of fixed rate, non-investment grade debt. Pay-in-kind (PIK) bonds, Eurobonds, and debt issues from countries designated as emerging markets (e.g., Argentina, Brazil, Venezuela, etc.) are excluded, but Canadian and global bonds (SEC registered) of issuers in non-emerging market countries are included. Original issue zeroes, step-up coupon structures, and 144As are also included. The index is unmanaged, and unlike the fund, is not affected by cashflows or trading and other expenses. It is not possible to invest directly in an index. |
8
RMK ADVANTAGE INCOME FUND, INC.
PORTFOLIOOF INVESTMENTS
MARCH 31, 2006
| | | | | | | | |
Principal
Amount | | | | Description | | Market
Value (b) |
| | Asset Backed Securities–Investment Grade–14.0% of Net Assets | | | |
| | | | | | Collateralized Debt Obligations–3.9% | | | |
| $ | 1,921,411 | | | | E-Trade 2004-1A COM1, 2.000% 1/10/40 | | $ | 1,940,625 |
| | 6,000,000 | | | | Palmer Square 2A CN, 12.000% 11/2/45 (a) | | | 5,970,000 |
| | 4,200,000 | | | | Restructured Asset Backed 2003-3A A3, 5.378% 1/29/22 (a) | | | 3,564,288 |
| | 4,864,052 | | | | Witherspoon 2004-1A COM1, 11.500% 9/15/39 | | | 4,791,092 |
| | | | | | | |
|
|
| | | | | | | | | 16,266,005 |
| | | | | | | |
|
|
| | | | | | Credit Cards–0.8% | | | |
| | 3,500,000 | | | | North Street 2000-1A B, 5.293% 10/30/11 (a) | | | 3,080,000 |
| | | | | | | |
|
|
| | | | | | Equipment Leases–4.3% | | | |
| | 8,586,169 | | | | Aerco Limited 2A A3, 5.209% 7/15/25 (a) | | | 7,405,571 |
| | 19,000,000 | | | | Airplanes Repackaging 2004-1A B, Zero Coupon Bond 6/16/31 (a) | | | 1,235,000 |
| | 4,999,007 | | | | Aviation Capital 2000-1A A1, 5.229% 11/15/25 (a) | | | 4,236,658 |
| | 3,962,861 | | | | Aviation Capital 2005-3A C1, 8.068% 12/25/35 (a) | | | 3,972,768 |
| | 3,000,000 | | | | United Capital Aviation Trust 2005-1 B1A,
Zero Coupon Bond 7/15/31 (a) | | | 891,360 |
| | | | | | | |
|
|
| | | | | | | | | 17,741,357 |
| | | | | | | |
|
|
| | | | | | Home Equity Loans (Non-High Loan-To-Value)–4.6% | | | |
| | 7,613,000 | | | | Ace Securities 2004-HE3 M11, 8.318% 11/25/34 | | | 6,927,830 |
| | 3,000,000 | | | | Ace Securities 2004-HE4 M11, 8.318% 12/25/34 | | | 2,807,820 |
| | 2,119,000 | | | | Asset Backed Securities 2005-HE1 M10, 7.818% 3/25/35 | | | 1,968,678 |
| | 2,681,000 | | | | Bear Stearns 2004-HE9 M7B, 8.818% 11/25/34 | | | 2,386,090 |
| | 4,000,000 | | | | Merrill Lynch Mortgage 2005-ACR1 B4, 7.321% 6/28/35 (a) | | | 3,500,000 |
| | 2,000,000 | | | | Soundview 2005-A B1, 7.818% 4/25/35 (a) | | | 1,706,260 |
| | | | | | | |
|
|
| | | | | | | | | 19,296,678 |
| | | | | | | |
|
|
| | | | | | Manufactured Housing–0.4% | | | |
| | 1,881,872 | | | | Mid-State Trust 2005-1 B, 7.758% 1/15/40 | | | 1,851,160 |
| | | | | | | |
|
|
| | | | | | Total Asset Backed Securities–Investment Grade
(cost $56,834,200) | | | 58,235,200 |
| | | | | | | |
|
|
| | Asset Backed Securities–Non-Investment Grade–42.2% of Net Assets | | | |
| | | | | | Certificate-Backed Obligations–2.0% | | | |
| | 2,000,000 | | | | Preferred Term Securities II, 12.000% 5/22/33 (a) | | | 1,818,640 |
| | 2,900,000 | | | | Preferred Term Securities XVI, 11.000% 3/23/35 (a) | | | 2,792,700 |
| | 2,000,000 | | | | Preferred Term Securities XVII, 12.000% 9/23/35 (a) | | | 1,960,000 |
| | 2,000,000 | | | | Preferred Term Securities XXI, 10.000% 3/22/38 (a) | | | 1,960,000 |
| | | | | | | |
|
|
| | | | | | | | | 8,531,340 |
| | | | | | | |
|
|
| | | | | | Collateralized Debt Obligations–4.6% | | | |
| | 2,773,473 | | | | Cigna CDO Limited 2000-1A B1, 6.110% 8/28/12 (a) | | | 2,081,852 |
| | 3,000,000 | | | | Diversified Asset Securitization 2 1A B1, 9.712% 9/15/35 (a) | | | 1,432,500 |
| | 3,000,000 | | | | Emerald CBO 1A III, 8.250% 5/24/11 (a) | | | 2,536,890 |
9
RMK ADVANTAGE INCOME FUND, INC.
PORTFOLIOOF INVESTMENTS
MARCH 31, 2006
| | | | | | | | |
Principal
Amount | | | | Description | | Market
Value (b) |
| | Asset Backed Securities–Non-Investment Grade (continued) | | | |
| | | | | | Collateralized Debt Obligations (continued) | | | |
| $ | 2,000,000 | | | | Goldentree Capital 2006-1A E, 10.940% 2/22/20 (a) | | $ | 1,905,200 |
| | 3,921,230 | | | | Hewett’s Island 2004-1A COM, 9.000% 12/15/16 | | | 3,842,806 |
| | 3,875,828 | | | | MKP 4A CS, 2.000% 7/12/40 (a) | | | 3,837,069 |
| | 1,020,430 | | | | Norse CBO Limited 1A C2, 9.342% 8/13/10 | | | 949,000 |
| | 2,500,000 | | | | Stanfield 2A D1, 10.700% 4/15/15 (a) | | | 2,487,500 |
| | | | | | | |
|
|
| | | | | | | | | 19,072,817 |
| | | | | | | |
|
|
| | | | | | Commercial Loans–1.4% | | | |
| | 2,000,000 | | | | CS First Boston 1998-C2 H, 6.750% 11/11/30 (a) | | | 1,606,160 |
| | 1,967,335 | | | | Lehman Brothers-UBS Commercial Mortgage 2001-C7 S, 5.868% 11/15/33 | | | 1,037,907 |
| | 3,050,000 | | | | Lehman Brothers 2002-LLFA L, 6.140% 6/14/17 (a) | | | 2,999,861 |
| | | | | | | |
|
|
| | | | | | | | | 5,643,928 |
| | | | | | | |
|
|
| | | | | | Credit Cards–0.8% | | | |
| | 6,698,773 | | | | Nextcard 2000-1 A C, 6.399% 12/15/06 (a) | | | 3,550,350 |
| | | | | | | |
|
|
| | | | | | Equipment Leases–20.3% | | | |
| | 4,461,500 | | | | Aerco Limited 1X C1, 6.099% 7/15/23 | | | 1,673,063 |
| | 1,784,600 | | | | Aerco Limited 1A CA, 6.099% 7/15/23 (a) | | | 642,456 |
| | 4,654,978 | | | | Aerco Limited 2A B2, 5.799% 7/15/25 (a) | | | 1,955,091 |
| | 21,250,000 | | | | Aircraft Finance Trust 1999-1A A1, 5.229% 5/15/24 | | | 14,662,500 |
| | 24,000,000 | | | | Airplanes Pass Through Trust 2001-1A A9, 5.299% 3/15/19 | | | 14,400,000 |
| | 1,404,746 | | | | DVI Receivables 2001-2 A3, 3.519% 11/8/31 | | | 1,165,939 |
| | 2,986,912 | | | | DVI Receivables 2001-2 A4, 4.613% 11/11/09 | | | 2,494,071 |
| | 8,954,351 | | | | DVI Receivables 2002-1 A3A, 5.070% 6/11/10 | | | 5,954,643 |
| | 1,627,123 | | | | DVI Receivables 2002-2 C, 4.340% 9/12/10 | | | 894,918 |
| | 4,201,141 | | | | DVI Receivables 2003-1 A3A, 5.220% 3/14/11 | | | 3,549,964 |
| | 16,000,000 | | | | Lease Investment Flight Trust 1 A1, 5.139% 7/15/31 | | | 11,440,000 |
| | 3,000,000 | | | | Lease Investment Flight Trust 1 A2, 5.179% 7/15/31 | | | 2,145,000 |
| | 16,000,000 | | | | Pegasus Aviation Lease 1999-1A A2, 6.300% 3/25/29 (a) | | | 7,135,200 |
| | 10,000,000 | | | | Pegasus Aviation Lease 1999-1A B1, 6.300% 3/25/29 (a) | | | 2,436,000 |
| | 4,557,603 | | | | Pegasus Aviation Lease 2000-1 A1, 5.443% 3/25/15 (a) | | | 2,825,714 |
| | 1,000,000 | | | | Pegasus Aviation Lease 2000-1 A2, 8.370% 3/25/30 (a) | | | 626,820 |
| | 14,700,000 | | | | Pegasus Aviation Lease 2001-1A A1, 5.178% 5/10/31 (a) | | | 8,526,000 |
| | 3,000,000 | | | | Triton Aviation Finance 1A A1, 5.519% 5/15/05 (a) | | | 2,325,000 |
| | | | | | | |
|
|
| | | | | | | | | 84,852,379 |
| | | | | | | |
|
|
| | | | | | Franchise Loans–0.4% | | | |
| | 1,617,000 | | | | Falcon Franchise Loan 2001-1 F, 6.500% 1/5/23 | | | 958,930 |
| | 852,439 | | | | FMAC Loan Trust 1998-A A2, 6.500% 9/15/20 (a) | | | 578,329 |
| | | | | | | |
|
|
| | | | | | | | | 1,537,259 |
| | | | | | | |
|
|
10
RMK ADVANTAGE INCOME FUND, INC.
PORTFOLIOOF INVESTMENTS
MARCH 31, 2006
| | | | | | | | |
Principal
Amount | | | | Description | | Market
Value (b) |
| | Asset Backed Securities–Non-Investment Grade (continued) | | | |
| | | | | | Home Equity Loans (Non-High Loan-To-Value)–12.2% | | | |
| $ | 2,000,000 | | | | Ace Securities 2004-HE4 B, 8.318% 12/25/34 (a) | | $ | 1,680,000 |
| | 4,463,000 | | | | Ace Securities 2005-HE2 B1, 8.068% 4/25/35 (a) | | | 3,709,646 |
| | 4,000,000 | | | | Ace Securities 2005-HE5 B2, 7.818% 8/25/35 (a) | | | 2,980,000 |
| | 3,000,000 | | | | Ace Securities 2005-HE6 B1, 7.818% 10/25/35 (a) | | | 2,239,500 |
| | 4,400,000 | | | | Argent Securities 2004-W8 M11, 7.318% 5/25/34 (a) | | | 3,828,000 |
| | 7,038,000 | | | | Equifirst Mortgage 2004-3 B2, 8.318% 12/25/34 (a) | | | 6,123,060 |
| | 1,000,000 | | | | Equifirst Mortgage 2005-1 B3, 8.068% 4/25/35 (a) | | | 822,500 |
| | 1,757,000 | | | | Equifirst Mortgage 2005-1 B4, 8.068% 4/25/35 (a) | | | 1,440,740 |
| | 3,253,000 | | | | GSAMP Trust 2005-S2 B3, 6.500% 11/25/34 | | | 2,899,952 |
| | 3,000,000 | | | | Greenwich 2005-1A N2, 4.150% 1/20/45 (a) | | | 2,310,000 |
| | 4,000,000 | | | | Meritage Asset Holdings NIM 2005-2 N4, 7.500% 11/25/35 (a) | | | 3,012,000 |
| | 2,000,000 | | | | Merrill Lynch Mortgage 2005-SL1 B5, 8.318% 1/25/35 (a) | | | 1,760,000 |
| | | | | | Terwin Mortgage 2005-3SL B6, 11.500% 3/25/35 interest-only strips | | | 5,550,000 |
| | 2,147,874 | | | | Terwin Mortgage 2005-7SL, 6.500% 7/25/35 (a) | | | 1,871,335 |
| | 4,796,685 | | | | Terwin Mortgage 2005-11 1B7, 5.000% 11/25/36 (a) | | | 3,981,249 |
| | 4,000,000 | | | | Terwin Mortgage 2005-R1, 5.000% 12/28/36 (a) | | | 2,920,000 |
| | 4,500,000 | | | | Terwin Mortgage 2006-1 2B5, 5.000% 1/25/37 (a) | | | 3,681,000 |
| | | | | | | |
|
|
| | | | | | | | | 50,808,982 |
| | | | | | | |
|
|
| | | | | | Manufactured Housing Loans–0.5% | | | |
| | 1,626,860 | | | | Bombardier Capital 1998-B M2, 7.310% 10/15/28 | | | 65,074 |
| | 500,000 | | | | Bombardier Capital 2001-A M2, 8.265% 12/15/30 | | | 110,000 |
| | 7,510,353 | | | | Conseco Finance 1999-6 M1, 7.960% 6/1/30 (a) | | | 732,259 |
| | 2,723,167 | | | | Green Tree Financial 1996-7 B1, 7.700% 10/15/27 | | | 735,990 |
| | 1,300,000 | | | | Oakwood Mortgage 2002-C M1, 6.890% 11/15/32 | | | 349,030 |
| | | | | | | |
|
|
| | | | | | | | | 1,992,353 |
| | | | | | | |
|
|
| | | | | | Total Asset Backed Securities–Non-Investment Grade
(cost $180,869,795) | | | 175,989,408 |
| | | | | | | |
|
|
| | Corporate Bonds–Investment Grade–1.4% of Net Assets | | | |
| | | | | | Special Purpose Entity–1.4% | | | |
| | 2,000,000 | | | | Barton Springs 2005-1-C1, 8.230% 12/20/10 (a) | | | 1,775,000 |
| | 4,000,000 | | | | Duane Park I, Zero Coupon Bond, 6/27/16 (a) | | | 4,000,000 |
| | | | | | | |
|
|
| | | | | | Total Corporate Bonds–Investment Grade
(cost $5,775,816) | | | 5,775,000 |
| | | | | | | |
|
|
| | Corporate Bonds–Non-Investment Grade–34.5% of Net Assets | | | |
| | | | | | Apparel–0.8% | | | |
| | 550,000 | | | | Anvil Knitwear, Inc., 10.875% 3/15/07 | | | 272,250 |
| | 2,935,000 | | | | Rafaella Apparel, 11.250% 6/15/11 (a) | | | 2,920,325 |
| | | | | | | |
|
|
| | | | | | | | | 3,192,575 |
| | | | | | | |
|
|
11
RMK ADVANTAGE INCOME FUND, INC.
PORTFOLIOOF INVESTMENTS
MARCH 31, 2006
| | | | | | | | |
Principal
Amount | | | | Description | | Market
Value (b) |
| | Corporate Bonds–Non-Investment Grade (continued) | | | |
| | | | | | Appliances–1.0% | | | |
| $ | 4,160,000 | | | | Windmere-Durable, 10.000% 7/31/08 | | $ | 3,952,000 |
| | | | | | | |
|
|
| | | | | | Automotives–0.9% | | | |
| | 1,190,000 | | | | Ford Motor, 9.215% 9/15/21 | | | 952,000 |
| | 525,000 | | | | Ford Motor, 9.980% 2/15/47 | | | 430,500 |
| | 3,450,000 | | | | General Motors, 8.375% 7/15/33 | | | 2,527,125 |
| | | | | | | |
|
|
| | | | | | | | | 3,909,625 |
| | | | | | | |
|
|
| | | | | | Automotive Parts & Equipment–2.2% | | | |
| | 3,513,000 | | | | Dana Corporation, Zero Coupon Bond 3/15/10 in default (c) | | | 2,740,140 |
| | 975,000 | | | | Delphi Corporation, Zero Coupon Bond 5/1/29 in default (c) | | | 599,625 |
| | 2,800,000 | | | | Dura Operating, 9.000% 5/1/09 | | | 1,386,000 |
| | 1,100,000 | | | | Exide Technologies, 10.500% 3/15/13 (a) | | | 830,500 |
| | 1,775,000 | | | | Metaldyne Corp., 11.000% 6/15/12 | | | 1,413,344 |
| | 2,300,000 | | | | Metaldyne Corp., 10.000% 11/1/13 | | | 2,150,500 |
| | | | | | | |
|
|
| | | | | | | | | 9,120,109 |
| | | | | | | |
|
|
| | | | | | Basic Materials–3.0% | | | |
| | 1,900,000 | | | | Doe Run Resources, 11.750% 11/1/08 (a) | | | 1,518,000 |
| | 3,110,000 | | | | Edgen Acquisition, 9.875% 2/1/11 | | | 3,094,450 |
| | 1,300,000 | | | | Edgen Corporation, 9.875% 2/1/11 (a) | | | 1,293,500 |
| | 2,200,000 | | | | Millar Western, 7.750% 11/15/13 | | | 1,694,000 |
| | 3,750,000 | | | | OM Group, 9.250% 12/15/11 | | | 3,881,250 |
| | 1,050,000 | | | | Phibro Animal Health Corporation, 13.000% 12/1/07 | | | 1,081,500 |
| | | | | | | |
|
|
| | | | | | | | | 12,562,700 |
| | | | | | | |
|
|
| | | | | | Building & Construction–1.5% | | | |
| | 4,790,000 | | | | MMI Products, 11.250% 4/15/07 | | | 4,718,150 |
| | 1,700,000 | | | | Owens Corning, Zero Coupon Bond 8/1/18 in default (c) | | | 1,364,250 |
| | | | | | | |
|
|
| | | | | | | | | 6,082,400 |
| | | | | | | |
|
|
| | | | | | Communications–1.4% | | | |
| | 800,000 | | | | Adelphia Communications, Zero Coupon Bond 10/1/10 in default (c) | | | 472,000 |
| | 986,000 | | | | CCH I Holdings, 10.000% 5/15/14 (a) | | | 497,930 |
| | 3,375,000 | | | | CCH I Holdings, Zero Coupon Bond 5/15/14 (a) | | | 1,755,000 |
| | 792,000 | | | | CCH I Holdings, 11.000% 10/1/15 (a) | | | 658,350 |
| | 200,000 | | | | Century Communications, Zero Coupon Bond in default (c) | | | 200,000 |
| | 2,525,000 | | | | Penton Media, 10.375% 6/15/11 | | | 2,291,437 |
| | | | | | | |
|
|
| | | | | | | | | 5,874,717 |
| | | | | | | |
|
|
| | | | | | Consulting Services–1.1% | | | |
| | 2,000,000 | | | | MSX International, 11.000% 10/15/07 | | | 1,920,000 |
| | 4,000,000 | | | | MSX International, 11.375% 1/15/08 | | | 2,640,000 |
| | | | | | | |
|
|
| | | | | | | | | 4,560,000 |
| | | | | | | |
|
|
12
RMK ADVANTAGE INCOME FUND, INC.
PORTFOLIOOF INVESTMENTS
MARCH 31, 2006
| | | | | | | | |
Principal
Amount | | | | Description | | Market
Value (b) |
| | Corporate Bonds–Non-Investment Grade (continued) | | | |
| | | | | | Electronics–1.1% | | | |
| $ | 4,850,000 | | | | Motors and Gears, 10.750% 11/15/06 | | $ | 4,753,000 |
| | | | | | | |
|
|
| | | | | | Finance–1.3% | | | |
| | 2,850,000 | | | | Advanta Capital Trust I, 8.990% 12/17/26 | | | 2,899,875 |
| | 1,525,000 | | | | Banctec, 7.500% 6/1/08 | | | 1,092,266 |
| | 1,400,000 | | | | Citisteel USA, 12.480% 9/1/10 (a) | | | 1,435,000 |
| | | | | | | |
|
|
| | | | | | | | | 5,427,141 |
| | | | | | | |
|
|
| | | | | | Food–1.1% | | | |
| | 2,560,000 | | | | Di Giorgio Corp., 10.000% 6/15/07 | | | 2,464,000 |
| | 3,200,000 | | | | Merisant, 9.500% 7/15/13 | | | 2,208,000 |
| | | | | | | |
|
|
| | | | | | | | | 4,672,000 |
| | | | | | | |
|
|
| | | | | | Garden Products–0.3% | | | |
| | 1,660,000 | | | | Ames True Temper, 10.000% 7/15/12 | | | 1,386,100 |
| | | | | | | |
|
|
| | | | | | Human Resources–0.4% | | | |
| | 1,850,000 | | | | Comforce Operating, 12.000% 12/1/07 | | | 1,852,313 |
| | | | | | | |
|
|
| | | | | | Industrial–5.2% | | | |
| | 2,060,000 | | | | Advanced Lighting Technologies, 11.000% 3/31/09 | | | 2,031,139 |
| | 4,000,000 | | | | Consolidated Container, 10.125% 7/15/09 | | | 3,500,000 |
| | 1,120,000 | | | | Constar International, 11.000% 12/1/12 | | | 873,600 |
| | 3,228,000 | | | | Continental Global Group, 9.000% 10/1/08 | | | 3,147,720 |
| | 3,100,000 | | | | GSI Group, 12.000% 5/15/13 | | | 3,142,625 |
| | 2,070,000 | | | | Trimas Corp., 9.875% 6/15/12 | | | 1,894,050 |
| | 915,000 | | | | VICAP S.A., 11.375% 5/15/07* | | | 855,525 |
| | 2,650,000 | | | | VITRO S.A., 12.750% 11/1/13 (a) | | | 2,464,500 |
| | 4,075,000 | | | | Wolverine Tube, 7.375% 8/1/08 (a) | | | 3,219,250 |
| | 675,000 | | | | Wolverine Tube, 10.500% 4/1/09 | | | 556,875 |
| | | | | | | |
|
|
| | | | | | | | | 21,685,284 |
| | | | | | | |
|
|
| | | | | | Investment Companies–0.3% | | | |
| | 1,250,000 | | | | Reg Diversified Funding, 10.000% 1/25/36 (a) | | | 1,250,000 |
| | | | | | | |
|
|
| | | | | | Manufacturing–1.1% | | | |
| | 3,150,000 | | | | BGF Industries, 10.250% 1/15/09 | | | 2,898,000 |
| | 2,000,000 | | | | JB Poindexter, 8.750% 3/15/14 | | | 1,590,000 |
| | | | | | | |
|
|
| | | | | | | | | 4,488,000 |
| | | | | | | |
|
|
| | | | | | Medical Products–0.7% | | | |
| | 5,405,000 | | | | Insight Health Services, 9.875% 11/1/11 | | | 2,972,750 |
| | | | | | | |
|
|
| | | | | | Retail–2.7% | | | |
| | 2,325,000 | | | | General Nutrition Center, 8.500% 12/1/10 | | | 2,202,938 |
| | 2,475,000 | | | | Jo-Ann Stores, 7.500% 3/1/12 | | | 2,171,813 |
| | 1,150,000 | | | | Nebraska Book Company, 8.625% 3/15/12 | | | 1,058,000 |
13
RMK ADVANTAGE INCOME FUND, INC.
PORTFOLIOOF INVESTMENTS
MARCH 31, 2006
| | | | | | | | |
Principal
Amount | | | | Description | | Market
Value (b) |
| | Corporate Bonds–Non-Investment Grade (continued) | | | |
| | | | | | Retail (continued) | | | |
| $ | 2,550,000 | | | | Star Gas Partner, 10.250% 2/15/13 | | $ | 2,639,250 |
| | 3,800,000 | | | | Uno Restaurant, 10.000% 2/15/11 (a) | | | 3,078,000 |
| | | | | | | |
|
|
| | | | | | | | | 11,150,001 |
| | | | | | | |
|
|
| | | | | | Special Purpose Entity–4.4% | | | |
| | 1,725,000 | | | | Altra Industrial Motion, 9.000% 12/1/11 (a) | | | 1,716,375 |
| | 9,588,756 | | | | Dow Jones CDX HY T4, 10.500% 12/29/09 (a) | | | 9,708,615 |
| | 5,000,000 | | | | INCAPS Funding II, 10.000% 1/15/34 (a) | | | 4,500,000 |
| | 975,000 | | | | Interactive Health, 7.250% 4/1/11 (a) | | | 760,500 |
| | 231,593 | | | | PAHC Holdings, Zero Coupon Bond 2/1/10** | | | 238,541 |
| | 1,525,000 | | | | Transmeridian Exploration, 12.000% 12/15/10 (a) | | | 1,536,437 |
| | | | | | | |
|
|
| | | | | | | | | 18,460,468 |
| | | | | | | |
|
|
| | | | | | Technology–0.7% | | | |
| | 3,350,000 | | | | Danka Business Systems, 11.000% 6/15/10 | | | 2,738,625 |
| | | | | | | |
|
|
| | | | | | Telecommunications–1.7% | | | |
| | 1,805,800 | | | | BARAK I.T.C., 10.000% 11/15/07* | | | 1,775,210 |
| | 4,175,000 | | | | Primus Telecommunications, 8.000% 1/15/14 | | | 2,839,000 |
| | 300,000 | | | | Rural Cellular, 9.750% 1/15/10 | | | 304,500 |
| | 2,400,000 | | | | Securus Technologies, 11.000% 9/1/11 | | | 2,064,000 |
| | | | | | | |
|
|
| | | | | | | | | 6,982,710 |
| | | | | | | |
|
|
| | | | | | Tobacco–0.7% | | | |
| | 4,915,000 | | | | North Atlantic Trading, 9.250% 3/1/12 | | | 3,145,600 |
| | | | | | | |
|
|
| | | | | | Transportation–0.3% | | | |
| | 1,275,000 | | | | Evergreen International Aviation, 12.000% 5/15/10 | | | 1,276,594 |
| | | | | | | |
|
|
| | | | | | Travel–0.6% | | | |
| | 3,000,000 | | | | Worldspan Financial, 10.999% 2/15/11 | | | 2,595,000 |
| | | | | | | |
|
|
| | | | | | Total Corporate Bonds–Non-Investment Grade
(cost $152,165,256) | | | 144,089,712 |
| | | | | | | |
|
|
| | Mortgage Backed Securities–Investment Grade–4.4% of Net Assets | | | |
| | | | | | Collateralized Mortgage Obligations–4.4% | | | |
| | 2,000,000 | | | | Aames Mortgage 2005-2 B3, 7.818% 7/25/35 | | | 1,720,000 |
| | 1,000,000 | | | | First Franklin Mortgage 2004-FF5 M8, 7.818% 8/25/34 | | | 975,000 |
| | 2,000,000 | | | | First Franklin Mortgage 2004-FF5, 8.594% 8/25/34 (a) | | | 2,000,000 |
| | | | | | Harborview Mortgage 2004-8 X, 1.407% 11/19/34 interest-only strips | | | 3,297,214 |
| | 1,831,401 | | | | Long Beach Mortgage 2001-4 M2, 6.468% 3/25/32 | | | 1,655,804 |
| | 4,000,000 | | | | Merrill Lynch Mortgage 2005-M1, 6.818% 5/25/36 | | | 3,218,720 |
| | 3,017,249 | | | | Sail Net Interest Margin Notes 2004-7A B, 6.750% 8/27/34 (a) | | | 2,970,542 |
| | 2,000,000 | | | | Soundview 2005-OPT1 M10, 8.068% 6/25/35 | | | 1,909,060 |
| | 1,000,000 | | | | Soundview 2005-OPT4 M9, 7.318% 12/25/35 | | | 803,750 |
| | | | | | | |
|
|
| | | | | | Total Mortgage Backed Securities–Investment Grade
(cost $20,400,494) | | | 18,550,090 |
| | | | | | | |
|
|
14
RMK ADVANTAGE INCOME FUND, INC.
PORTFOLIOOF INVESTMENTS
MARCH 31, 2006
| | | | | | | | |
Principal
Amount/
Shares | | | | Description | | Market
Value (b) |
| | Mortgage Backed Securities–Non-Investment Grade–14.2% of Net Assets | | | |
| | | | | | Collateralized Mortgage Obligations–14.2% | | | |
| $ | 3,073,000 | | | | Fremont Home Equity 2005-C B3, 7.068% 7/25/35 (a) | | $ | 2,227,925 |
| | 8,000,000 | | | | Greenwich 2005-4 N-2, Zero Coupon Bond, 7/27/45 (a) | | | 4,160,000 |
| | 3,000,000 | | | | Greenwich 2005-3 N2, 2.000% 6/27/35 (a) | | | 1,860,000 |
| | 2,000,000 | | | | Greenwich 2005-2A N2, 3.100% 2/26/35 (a) | | | 1,400,000 |
| | 2,000,000 | | | | GSAMP Trust 2004-AR1 B5, 5.000% 6/25/34 (a) | | | 1,620,000 |
| | 1,999,884 | | | | Harborview Mortgage 2005-15 B10, 6.526% 10/20/45 | | | 1,592,408 |
| | 5,000,000 | | | | Long Beach Asset Holdings 2005-WL1 N4, 7.500% 6/25/45 (a) | | | 4,579,700 |
| | 2,374,520 | | | | Long Beach Mortgage 2001-3 M3, 6.693% 9/25/31 | | | 664,866 |
| | 3,558,812 | | | | Long Beach Mortgage 2001-4 M3, 7.568% 3/25/32 | | | 925,291 |
| | 2,000,000 | | | | Long Beach Mortgage 2005-WL1, 7.568% 6/25/35 | | | 1,747,180 |
| | 3,000,000 | | | | Park Place Securities 2005-WHQ1 M10, 7.318% 3/25/35 (a) | | | 2,675,160 |
| | 3,000,000 | | | | Park Place Securities 2005-WHQ1 M11, 7.318% 3/25/35 (a) | | | 2,460,000 |
| | 3,800,000 | | | | Park Place Securities 2005-WCW1 M11, 7.318% 9/25/35 | | | 3,087,500 |
| | 3,000,000 | | | | Park Place Securities 2005-WCW3, 7.318% 8/25/35 (a) | | | 2,460,000 |
| | 2,000,000 | | | | Park Place Securities 2005-WHQ4, 7.318% 9/25/35 (a) | | | 1,370,320 |
| | 2,043,150 | | | | Park Place Securities 2005-WCW1 B, 5.000% 9/25/35 (a) | | | 1,884,806 |
| | 2,000,000 | | | | People’s Choice Home Loan 2004-2 B, 5.000% 10/25/34 (a) | | | 1,652,500 |
| | 2,000,000 | | | | Popular 2005-4 B2, 7.318% 9/25/35 (a) | | | 1,862,500 |
| | 5,250,000 | | | | Residential 2005-RS4 B2, 7.818% 4/25/35 (a) | | | 4,372,252 |
| | 3,938,000 | | | | Residential 2005-RS4 B3, 7.818% 4/25/35 (a) | | | 3,103,656 |
| | 2,042,535 | | | | Sasco Net Interest Margin Trust 2004-6XS B, 5.000% 3/28/34 (a) | | | 1,909,770 |
| | 2,000,000 | | | | Soundview 2005-1 B3, 8.068% 4/25/35 (a) | | | 1,640,000 |
| | 2,591,000 | | | | Soundview 2005-2 B3, 7.818% 7/25/35 (a) | | | 2,053,367 |
| | 1,000,000 | | | | Soundview 2005-2 B4, 7.818% 7/25/35 (a) | | | 752,500 |
| | 1,972,000 | | | | Soundview 2005-B M14, 7.650% 5/25/35 (a) | | | 1,616,547 |
| | 2,000,000 | | | | Structured Asset 2005-S1 B4, 7.318% 3/25/35 (a) | | | 1,655,000 |
| | 2,139,000 | | | | Structured Asset 2004-S4 B3, 5.000% 12/25/34 (a) | | | 1,665,511 |
| | 2,573,000 | | | | Structured Asset 2004-S2 B, 6.000% 6/25/34 (a) | | | 2,330,932 |
| | | | | | | |
|
|
| | | | | | Total Mortgage Backed Securities–Non-Investment Grade
(cost $61,533,597) | | | 59,329,691 |
| | | | | | | |
|
|
| | Municipal Securities–0.2% of Net Assets | | | |
| | 1,250,000 | | | | Pima County Arizona IDA Health Care, Zero Coupon Bond 11/15/32 in default | | | 626,300 |
| | | | | | | |
|
|
| | | | | | Total Municipal Securities
(cost $782,910) | | | 626,300 |
| | | | | | | |
|
|
| | Common Stocks–12.7% of Net Assets | | | |
| | 35,200 | | | | Alpha Natural Resources, Inc. (c) | | | 814,528 |
| | 40,000 | | | | American Capital Strategies, Ltd. | | | 1,406,400 |
| | 16,400 | | | | Arthur J. Gallegher & Co. | | | 456,084 |
| | 49,000 | | | | ATI Technologies Inc. (c) | | | 841,820 |
| | 45,600 | | | | Bois d’Arc Energy LLC (c) | | | 759,240 |
| | 51,800 | | | | Cascade Microtech, Inc. (c) | | | 678,062 |
15
RMK ADVANTAGE INCOME FUND, INC.
PORTFOLIOOF INVESTMENTS
MARCH 31, 2006
| | | | | | | |
| Shares | | | | Description | | Market
Value (b) |
| Common Stocks (continued) | | | |
| 7,900 | | | | Caterpillar, Inc. | | $ | 567,299 |
| 10,700 | | | | CEMEX, S.A. de C.V. | | | 698,496 |
| 39,800 | | | | Citizens Communications Company | | | 528,146 |
| 17,600 | | | | Companhia de Saneamento Básico do Estado de São Paulo (c) | | | 387,376 |
| 60,800 | | | | Compton Petroleum Corporation (c) | | | 780,672 |
| 57,100 | | | | Consolidated Communications Illinois Holdings, Inc. (c) | | | 929,017 |
| 15,800 | | | | Cytec Industries Inc. (d) | | | 948,158 |
| 7,400 | | | | Deere & Company | | | 584,970 |
| 11,700 | | | | Dell Inc. (c)(d) | | | 348,192 |
| 43,000 | | | | Direct General Corporation | | | 731,430 |
| 45,700 | | | | Dollar General Corporation (d) | | | 807,519 |
| 31,300 | | | | Education Realty Trust, Inc. | | | 478,890 |
| 17,500 | | | | EnCana Corporation (d) | | | 817,775 |
| 9,400 | | | | ENSCO International Incorporated (d) | | | 483,630 |
| 30,900 | | | | Enterprise Partners Products L.P. | | | 762,921 |
| 43,800 | | | | FairPoint Communications, Inc. | | | 605,316 |
| 10,100 | | | | Fording Canadian Coal Trust | | | 383,699 |
| 14,000 | | | | Fred’s Inc. | | | 185,640 |
| 31,300 | | | | Global Industries, Ltd. (c)(d) | | | 453,537 |
| 41,600 | | | | Infocrossing, Inc. (c) | | | 501,280 |
| 184,500 | | | | InPhonic, Inc. (c) | | | 1,289,655 |
| 111,695 | | | | Intermet Corporation (c) | | | 1,340,340 |
| 109,200 | | | | International Coal Group, Inc. (c) | | | 1,063,608 |
| 58,200 | | | | Iowa Telecommunications Services, Inc. | | | 1,110,456 |
| 9,800 | | | | J.C. Penney Company, Inc. | | | 592,018 |
| 15,500 | | | | Kinder Morgan Energy Partners, L.P. | | | 746,790 |
| 11,200 | | | | KKR Financial Corp. (c) | | | 251,216 |
| 41,500 | | | | Korn/Ferry International (c) | | | 846,185 |
| 10,800 | | | | L-3 Communications Holdings, Inc. | | | 926,532 |
| 11,000 | | | | Lloyds TSB Group plc | | | 423,390 |
| 14,000 | | | | Lone Star Technologies, Inc. (c)(d) | | | 775,740 |
| 25,800 | | | | Macquarie Infrastructure Company Trust | | | 838,500 |
| 15,900 | | | | Magellan Midstream Partners, L.P. | | | 522,633 |
| 12,800 | | | | Manpower Inc. | | | 731,904 |
| 33,100 | | | | Masco Corporation | | | 1,075,419 |
| 121,100 | | | | MCG Capital Corporation | | | 1,708,721 |
| 33,500 | | | | Microsoft Corporation (d) | | | 911,535 |
| 29,000 | | | | Mittal Steel Company N.V. | | | 1,094,750 |
| 24,400 | | | | Motorola, Inc. | | | 559,004 |
| 66,000 | | | | Nam Tai Electronics, Inc. | | | 1,512,060 |
| 55,800 | | | | Ness Technologies, Inc. (c) | | | 702,522 |
| 7,100 | | | | PACCAR Inc. | | | 500,408 |
| 10,700 | | | | PetroChina Company Limited (d) | | | 1,122,965 |
16
RMK ADVANTAGE INCOME FUND, INC.
PORTFOLIOOF INVESTMENTS
MARCH 31, 2006
| | | | | | | | |
Principal
Amount/
Shares | | | | Description | | Market
Value (b) |
| | Common Stocks (continued) | | | |
| | 10,800 | | | | Philippine Long Distance Telephone Company | | $ | 405,756 |
| | 41,400 | | | | Regal Entertainment Group | | | 778,734 |
| | 17,500 | | | | Sasol Limited | | | 662,025 |
| | 32,590 | | | | Ship Finance International Limited | | | 559,244 |
| | 3,700 | | | | Stone Energy Corporation (c)(d) | | | 163,281 |
| | 14,500 | | | | Superior Energy Services, Inc. (c) | | | 388,455 |
| | 102,300 | | | | Taiwan Semiconductor Manufacturing Company Ltd. | | | 1,029,138 |
| | 114,470 | | | | Technology Investment Capital Corporation (c) | | | 1,664,394 |
| | 18,550 | | | | Teva Pharmaceutical Industries Limited | | | 763,889 |
| | 23,600 | | | | The Home Depot, Inc. (d) | | | 998,280 |
| | 6,500 | | | | The Timken Company | | | 209,755 |
| | 11,900 | | | | Tidewater Inc. (d) | | | 657,237 |
| | 70,500 | | | | TOP Tankers Inc. | | | 916,500 |
| | 104,450 | | | | Trustreet Properties Inc. | | | 1,586,595 |
| | 35,900 | | | | Tsakos Energy Navigation Limited (d) | | | 1,406,562 |
| | 3,100 | | | | Unit Corporation (c)(d) | | | 172,825 |
| | 21,100 | | | | Valero Energy Corporation (d) | | | 1,261,358 |
| | 14,200 | | | | Valero L.P. | | | 719,230 |
| | 16,900 | | | | Washington Mutual, Inc. | | | 720,278 |
| | 27,200 | | | | Willbros Group, Inc. (c)(d) | | | 553,248 |
| | | | | | | |
|
|
| | | | | | Total Common Stocks
(cost $50,952,271) | | | 53,203,232 |
| | | | | | | |
|
|
| | Preferred Stocks–3.7% of Net Assets | | | |
| | 40,000 | | | | Baker Street Funding (a)(c) | | | 3,880,000 |
| | 3,000 | | | | Credit Genesis CLO 2005 | | | 3,000,000 |
| | 100,000 | | | | Endurance Specialty Holdings Ltd. | | | 2,422,000 |
| | 2,000 | | | | Hewett’s Island II (a) | | | 1,980,000 |
| | 2,000 | | | | Marquette Park CLO (a) | | | 1,960,000 |
| | 2,000 | | | | SOLOSO CDO 2005 | | | 1,985,412 |
| | | | | | | |
|
|
| | | | | | Total Preferred Stocks
(cost $15,257,427) | | | 15,227,412 |
| | | | | | | |
|
|
| | Corporate Loans–0.1% of Net Assets | | | |
| $ | 400,000 | | | | ICO North America, 7.500% 8/15/09 | | | 508,000 |
| | | | | | | |
|
|
| | | | | | Total Corporate Loans
(cost $400,000) | | | 508,000 |
| | | | | | | |
|
|
| | Repurchase Agreement–3.6% of Net Assets | | | |
| | | | | | Repurchase Agreement with Cantor Fitzgerald, 4.450%, dated March 31, 2006 to be repurchased at $15,005,563 on April 3, 2006, collateralized by a U.S. Treasury Note valued at $15,300,000 with a maturity of
July 15, 2016 | | | 15,000,000 |
| | | | | | | |
|
|
17
RMK ADVANTAGE INCOME FUND, INC.
PORTFOLIOOF INVESTMENTS
MARCH 31, 2006
| | | | | | | | |
Principal
Amount | | | | Description | | Market
Value (b) | |
| Eurodollar Time Deposits–3.9% of Net Assets | | | | |
| | | | | State Street Bank & Trust Company Eurodollar time deposits dated March 31, 2006 3.750% maturing at $16,100,383 on April 3, 2006 | | $ | 16,095,353 | |
| | | | | | |
|
|
|
| | | | | Total Investments–134.9% of Net Assets
(cost $576,067,119) | | | 562,629,398 | |
| | | | | | |
|
|
|
| | | | | Other Assets and Liabilities, net–(34.9%) of Net Assets | | | (145,400,259 | ) |
| | | | | | |
|
|
|
| | | | | Net Assets | | $ | 417,229,139 | |
| | | | | | |
|
|
|
Call Options Written
March 31, 2006
| | | | | | | |
Number of
Contracts | | | | Common Stocks/Expiration Date/Exercise Price | | Market
Value (b) |
| 7 | | | | Cytec Industries Inc./April/60 | | $ | 980 |
| 88 | | | | Dell Inc./April/30 | | | 4,048 |
| 6 | | | | Dollar General Corporation/April/17.50 | | | 270 |
| 38 | | | | EnCana Corporation/April/50 | | | 1,710 |
| 4 | | | | ENSCO International Incorporated/April/50 | | | 1,060 |
| 3 | | | | Global Industries, Ltd./April/15 | | | 90 |
| 14 | | | | The Home Depot, Inc./April/42.50 | | | 980 |
| 39 | | | | Lone Star Technologies, Inc./April/55 | | | 8,775 |
| 64 | | | | Microsoft Corporation/April/27.50 | | | 1,664 |
| 23 | | | | PetroChina Company Limited/April/100 | | | 12,420 |
| 12 | | | | Stone Energy Corporation/April/45 | | | 2,040 |
| 35 | | | | Tidewater Inc./April/55 | | | 6,300 |
| 60 | | | | Tsakos Energy Navigation Limited/April/40 | | | 2,100 |
| 31 | | | | Unit Corporation/April/55 | | | 5,580 |
| 32 | | | | Valero Energy Corporation/April/60 | | | 5,600 |
| 10 | | | | Willbros Group, Inc./April/20 | | | 550 |
| | | | | | |
|
|
| | | | | Total Call Options Written
(Premiums Received $58,566) | | $ | 54,167 |
| | | | | | |
|
|
| (a) | | Securities sold within the terms of a private placement memorandum, exempt from registration under Rule 144A under the Securities Act of 1933, as amended, and may be resold in transactions exempt from registration, normally to qualified institutional buyers. Pursuant to guidelines adopted by the Board of Directors, these issues have been determined to be liquid by Morgan Asset Management, Inc., the Fund’s investment adviser. |
| (b) | | See Note 2 of accompanying Notes to Financial Statements regarding valuation of securities. |
| (c) | | These securities are non-income producing. |
| (d) | | A portion or all of the security is pledged as collateral for call options written. |
| (e) | | Trust preferred security with no stated interest rate. |
| * | | These securities are classified as Yankee Bonds, which are U.S. dollar denominated bonds issued in the United States by a foreign entity. |
| ** | | This security is payment-in-kind. |
(See Accompanying Notes to the Financial Statements)
18
RMK HIGH INCOME FUND, INC.
OBJECTIVE & STRATEGY
RMK High Income Fund, Inc. seeks a high level of current income. The Fund seeks capital growth as a secondary investment objective when consistent with its primary investment objective. The Fund invests a majority of its total assets in below investment grade debt securities (commonly referred to as “junk bonds”) that offer attractive yield and capital appreciation potential. The Fund may also invest in investment grade securities and up to 15% of its total assets in foreign debt and equity securities and up to 25% of its total assets in domestic equity securities, including common and preferred stocks. The Fund invests in a wide range of below investment grade debt securities, including corporate bonds, mortgage- and asset-backed securities and municipal and foreign government obligations, as well as securities of companies in bankruptcy reorganization proceedings or otherwise in the process of debt restructuring. (Below investment grade debt securities are rated Ba1 or lower by Moody’s Investors Service, Inc., rated BB+ or lower by Standard & Poor’s Ratings Group or Fitch Ratings Ltd., comparably rated by another nationally recognized statistical rating organization, or not rated by any rating agency but determined by the Fund’s investment adviser to be of comparable quality.)
INVESTMENT RISKS: Bond funds tend to experience smaller fluctuations in value than stock funds. However, investors in any bond fund should anticipate fluctuations in price. Bond prices and the value of bond funds decline as interest rates rise. Longer-term funds generally are more vulnerable to interest rate risk than shorter-term funds. Below investment grade bonds involve greater credit risk, which is the risk that the issuer will not make interest or principal payments when due. An economic downturn or period of rising interest rates could adversely affect the ability of issuers, especially issuers of below investment grade debt, to service primary obligations and an unanticipated default could cause the Fund to experience a reduction in value of its shares. The value of U.S. and foreign equity securities in which the Fund invests will change based on changes in a company’s financial condition and in overall market and economic conditions. Use of leverage may increase the likelihood that the net asset value of the Fund and market value of its common shares will be more volatile, and the yield and total return to common stockholders will tend to fluctuate more in response to changes in interest rates and creditworthiness.
19
RMK HIGH INCOME FUND, INC.
MANAGEMENT DISCUSSIONOF FUND PERFORMANCE
For the six months and the year ended March 31, 2006, RMK High Income Fund, Inc. had total returns of 8.08% and 24.15%, respectively, based on market price and reinvested dividends. For the six months and the year ended March 31, 2006, the Fund had total returns of 3.90% and 7.80%, respectively, based on net asset value and reinvested dividends. For the six months and the year ended March 31, 2006, the Lehman Brothers Ba U.S. High Yield Index1 had total returns of 2.44% and 6.83%, respectively. The Fund’s strong performance was primarily due to the Fund’s relative yield advantage as evidenced by the monthly dividend distributions and the relative net asset value stability produced by the Fund’s allocation to a wide variety of asset types. The Fund had an above average yield due to three main factors: an efficient leverage package which allowed the Fund to have additional money invested with limited borrowing costs; an increasing interest rate environment and our overweighting in the floating rate securities sector; and a prospectus that gives the management team latitude to look at sectors that are not in the index.
During the fiscal year ended March 31, 2006, the Fund paid a total income distribution of $2.58 per share, which was composed of total regular monthly dividends for the year of $1.80 per share and special dividend distributions in December 2005 of $0.78 per share. For the entire fiscal year, the Fund paid monthly dividends of $0.15 per share.
In spite of a modest level of industry-wide outflows from corporate high yield funds, the high yield corporate market feels pretty good so far this year. With little change to underlying asset value, index performance has remained at coupon clipping levels (i.e. prices have held up). Importantly, economic conditions continue to remain strong causing the Fed to nudge interest rates ever higher. A strong economy is very good for corporate earnings, cash flows, balance sheets, equity valuations, and, in turn, high yield corporate bonds. Such conditions create more opportunities for corporate bond issuers to refinance or otherwise payoff their bonds, effectively placing an underlying bid for the bonds. In other words, steady bond prices. Unfortunately, strong bids create a scarcity of attractive investment opportunities and that is the challenge we face today. Opportunities exist in every market environment, they just may not be readily apparent.
We believe the domestic automotive sector is providing several attractive buying opportunities. This sector is a classic example of an industry in dire need of restructuring. Bound by uncompetitive labor, plant, and capital costs coupled with less than inspiring product offerings, many will have to restructure their contractual obligations either in or out of court. In many circumstances, the courts will be the
20
RMK HIGH INCOME FUND, INC.
only means by which the necessary fundamental changes to survive in the long run can be accomplished. Bankruptcy isn’t necessarily the end and, in many cases, is a new beginning. We like this space because turmoil convinces and, often times forces, weak hands to dispose of valuable assets at fire-sale prices. While these assets may not be worth “par” in bond parlance, they almost always have some value. The trick is to estimate that value and pay accordingly. Since we define risk by the price one pays, we believe the risk reward ratio is largely tilted in the buyer’s favor in selected automotive sector bonds. We have and plan to continue to trade opportunistically in this space.
In the asset-backed and mortgage-backed arena, market technicals have made a dramatic about face over the last six weeks. The market was very heavy during the fourth quarter of 2005 with very few buyers willing to commit to new positions at the close of a very difficult year. However, beginning in February the demand for “BBB” to “B” floating rate asset-backed bonds picked up dramatically. The prospect of continued rate hikes from the Federal Reserve and the lack of available yield in the fixed income market have forced investors into some of the more “off the run” issues that we have used effectively in the high income fund. We expect floating rate assets to continue to contribute to our net asset value stability and current yield during the next 3 to 6 months as short term rates push higher. Our challenge will be to find enough suitable fixed rate assets as this interest rate cycle nears the point where the Federal Reserve will begin lowering rates.
James C. Kelsoe, Jr., CFA
Senior Portfolio Manager
Morgan Asset Management, Inc.
Market forecasts provided in this report may not necessarily come to pass. There is no assurance that the Fund will achieve its investment objectives. These views are subject to change at any time based upon market or other conditions, and Morgan Asset Management, Inc. disclaims any responsibility to update such views. The Fund is subject to market risk, which include the possibilities that the market values of the securities owned by the Fund will decline or that shares of the Fund will trade at lower prices in the market. Accordingly, you can lose money investing in the Fund.
INDEX DESCRIPTION
| 1 | | The Lehman Brothers Ba U.S. High Yield Index covers the universe of fixed rate, non-investment grade debt. Pay-in-kind (PIK) bonds, Eurobonds, and debt issues from countries designated as emerging markets (e.g., Argentina, Brazil, Venezuela, etc.) are excluded, but Canadian and global bonds (SEC registered) of issuers in non-emerging countries are included. Original issue zeroes, step-up coupon structures, and 144As are also included. The index is unmanaged, and unlike the fund, is not affected by cashflows or trading and other expenses. It is not possible to invest directly in an index. |
21
RMK HIGH INCOME FUND, INC.
PORTFOLIO STATISTICS†
AS OF MARCH 31, 2006
| | |
Average Credit Quality | | BB |
Current Yield | | 10.27% |
Yield to Maturity | | 12.53% |
Duration | | 3.48 Years |
Average Effective Maturity | | 4.64 Years |
Percentage of Leveraged Assets | | 27% |
Total Number of Holdings | | 256 |
| † | | The Fund’s composition is subject to change. |
CREDIT QUALITY†
AS OF MARCH 31, 2006
| | | | | | |
| %OFTOTALINVESTMENTS | | %OFTOTALINVESTMENTS |
AAA | | 4.3% | | B | | 9.8% |
AA | | 1.8% | | CCC | | 22.1% |
A | | 1.8% | | CC | | 0.5% |
BBB | | 19.2% | | D | | 2.0% |
BB | | 23.0% | | Not Rated | | 15.5% |
| | | | | | |
|
| | | | | Total | | 100.0% |
| † | | The Fund’s composition is subject to change. |
ASSET ALLOCATION†
AS OF MARCH 31, 2006
| | |
| %OFTOTALINVESTMENTS |
Corporate Bonds | | 26.4% |
Equipment Leases | | 17.6% |
Collateralized Mortgage Obligations | | 14.8% |
Common Stock | | 9.6% |
Home Equity Loans | | 8.8% |
Short Term Investments | | 6.8% |
Collateralized Debt Obligations | | 5.7% |
Manufactured Housing Loans | | 2.9% |
Franchise Loans | | 2.3% |
Preferred Stock | | 1.7% |
Other | | 1.2% |
Commercial Loans | | 0.9% |
Certificate-Backed Obligations | | 0.8% |
Government Agency Securities | | 0.5% |
| | |
|
Total | | 100.0% |
| † | | The Fund’s composition is subject to change. |
22
RMK HIGH INCOME FUND, INC.
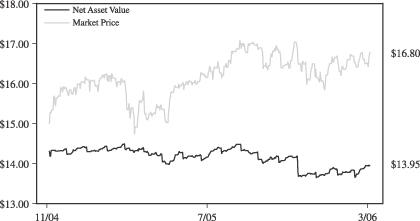
NAV & MARKET PRICE HISTORY*
The graph below illustrates the net asset value and market price history of RMK High Income Fund, Inc. (NYSE: RMH) from June 24, 2003 (commencement of investment operations) to March 31, 2006.
| * | | Net asset value is calculated every day that the New York Stock Exchange is open as of the close of trading (normally 4:00 p.m. Eastern Time) by taking the closing market value of all portfolio securities owned, cash and other assets, subtracting all liabilities, then dividing the result (total net assets) by the total number of shares outstanding. The market price is the last reported price at which a share of the Fund was sold on the New York Stock Exchange. |
23
RMK HIGH INCOME FUND, INC.
PERFORMANCE INFORMATION
| | | | | | | | | |
| | | AVERAGE ANNUAL TOTAL RETURNS | |
| AS OF MARCH 31, 2006 | | SIX
MONTHS* | | | 1
YEAR | | | COMMENCEMENT
OF INVESTMENT
OPERATIONS1 | |
| MARKET VALUE | | 8.08 | % | | 24.15 | % | | 22.02 | % |
| NET ASSET VALUE | | 3.90 | % | | 7.80 | % | | 13.99 | % |
LEHMAN BROTHERS BA HIGH YIELD INDEX2 | | 2.44 | % | | 6.83 | % | | 7.61 | % |
| * | | Not annualized for periods less than one year. |
Performance data quoted represents past performance which is no guarantee of future results. Investment return and principal value will fluctuate so that an investor’s shares, when redeemed, may be worth more or less than their original cost. Fund performance changes over time and current performance may be lower or higher than what is stated. For the most recent performance, call 800-564-2188. Total returns assume an investment at the common share market price or net asset value at the beginning of the period, reinvestment of all dividends and distributions for the period in accordance with the Fund’s dividend reinvestment plan, and sale of all shares at the closing market price (excluding any commissions) or net asset value at the end of the period. Returns shown do not reflect the deduction of taxes that a shareholder would pay on Fund distributions or on the sale of Fund shares.
| 1 | | The Fund commenced investment operations on June 24, 2003. |
| 2 | | The Lehman Brothers Ba U.S. High Yield Index covers the universe of fixed rate, non-investment grade debt. Pay-in-kind (PIK) bonds, Eurobonds, and debt issues from countries designated as emerging markets (e.g., Argentina, Brazil, Venezuela, etc.) are excluded, but Canadian and global bonds (SEC registered) of issuers in non-emerging market countries are included. Original issue zeroes, step-up coupon structures, and 144As are also included. The index is unmanaged, and unlike the fund, is not affected by cashflows or trading and other expenses. It is not possible to invest directly in an index. |
24
RMK HIGH INCOME FUND, INC.
PORTFOLIOOF INVESTMENTS
MARCH 31, 2006
| | | | | | | | |
Principal
Amount | | | | Description | | Market
Value (b) |
| | Asset Backed Securities–Investment Grade–12.9% of Net Assets | | | |
| | | | | | Collateralized Debt Obligations–4.4% | | | |
| $ | 5,000,000 | | | | Commodore 1A C, 7.560% 2/28/37 (a) | | $ | 3,150,000 |
| | 5,036,369 | | | | Diversified Asset Securitization 1A A1, 7.875% 9/15/35 | | | 5,255,199 |
| | 1,921,411 | | | | E-Trade 2004-1A COM1, 2.000% 1/10/40 | | | 1,940,625 |
| | 3,000,000 | | | | Palmer Square 2A CN, Zero Coupon Bond 11/2/45 (a) | | | 2,985,000 |
| | | | | | | |
|
|
| | | | | | | | | 13,330,824 |
| | | | | | | |
|
|
| | | | | | Equipment Leases–3.2% | | | |
| | 5,724,113 | | | | Aerco Limited 2A A3, 5.209% 7/15/25 (a) | | | 4,937,047 |
| | 16,000,000 | | | | Airplanes Repackaging 2004-1A B, Zero Coupon Bond 6/16/31 (a) | | | 1,040,000 |
| | 2,972,146 | | | | Aviation Capital 2005-3A C1, 8.068% 12/25/35 (a) | | | 2,979,576 |
| | 3,000,000 | | | | United Capital Aviation Trust 2005-1 B1A,
Zero Coupon Bond 7/15/31 (a) | | | 891,360 |
| | | | | | | |
|
|
| | | | | | | | | 9,847,983 |
| | | | | | | |
|
|
| | | | | | Franchise Loans–1.9% | | | |
| | 5,230,037 | | | | Atherton Franchisee 1999-A A2, 7.230% 4/15/12 (a) | | | 5,340,589 |
| | | | | | Atherton Franchisee 1999-A AX, 1.082% 3/15/19 interest-only strips (a) | | | 478,193 |
| | | | | | | |
|
|
| | | | | | | | | 5,818,782 |
| | | | | | | |
|
|
| | | | | | Home Equity Loans (Non-High Loan-To-Value)–2.4% | | | |
| | 2,000,000 | | | | Ameriquest Mortgage 2003-8 MV6, 8.568% 10/25/33 | | | 2,027,634 |
| | 1,000,000 | | | | Asset Backed Securities 2005-HE1 M10, 7.818% 3/25/35 | | | 929,060 |
| | 3,000,000 | | | | Merrill Lynch Mortgage 2005-ACR1 B4, 7.321% 6/28/35 (a) | | | 2,625,000 |
| | 2,000,000 | | | | Soundview 2005-A B1, 7.818% 4/25/35 (a) | | | 1,706,260 |
| | | | | | | |
|
|
| | | | | | | | | 7,287,954 |
| | | | | | | |
|
|
| | | | | | Manufactured Housing–0.6% | | | |
| | 1,881,872 | | | | Mid-State Trust 2005-1 B, 7.758% 1/15/40 | | | 1,851,160 |
| | | | | | | |
|
|
| | | | | | Small Business Loans–0.4% | | | |
| | 1,170,401 | | | | ACLC Business Trust 1998-2 A3, 6.686% 4/15/20 (a) | | | 1,163,988 |
| | | | | | | |
|
|
| | | | | | Total Asset Backed Securities–Investment Grade
(cost $39,403,723) | | | 39,300,691 |
| | | | | | | |
|
|
| | Asset Backed Securities–Non-Investment Grade–41.6% of Net Assets | | | |
| | | | | | Certificate-Backed Obligations–1.1% | | | |
| | 1,000,000 | | | | Preferred Term Securities II, 12.000% 5/22/33 (a) | | | 909,320 |
| | 1,000,000 | | | | Preferred Term Securities XXI, 10.000% 3/22/38 (a) | | | 980,000 |
| | 1,700,000 | | | | US Capital Funding I, 10.000% 5/1/34 (a) | | | 1,445,000 |
| | | | | | | |
|
|
| | | | | | | | | 3,334,320 |
| | | | | | | |
|
|
| | | | | | Collateralized Debt Obligations–3.4% | | | |
| | 1,664,084 | | | | Cigna CDO Limited 2000-1A B1, 5.700% 8/28/12 (a) | | | 1,249,111 |
| | 3,000,000 | | | | Diversified Asset Securitization 2 1A B1, 9.712% 9/15/35 (a) | | | 1,432,500 |
| | 2,000,000 | | | | Goldentree Capital 2006-1A E, 10.940% 2/22/20 (a) | | | 1,905,200 |
25
RMK HIGH INCOME FUND, INC.
PORTFOLIOOF INVESTMENTS
MARCH 31, 2006
| | | | | | | | |
Principal
Amount | | | | Description | | Market
Value (b) |
| | Asset Backed Securities–Non-Investment Grade (continued) | | | |
| | | | | | Collateralized Debt Obligations (continued) | | | |
| $ | 2,940,923 | | | | Hewett’s Island 2004-1A COM, 9.000% 12/15/16 | | $ | 2,882,104 |
| | 1,937,914 | | | | MKP 4A CS, 2.000% 7/12/40 (a) | | | 1,918,535 |
| | 1,000,000 | | | | Stanfield 2A D1, 10.700% 4/15/15 (a) | | | 995,000 |
| | | | | | | |
|
|
| | | | | | | | | 10,382,450 |
| | | | | | | |
|
|
| | | | | | Commercial Loans–1.3% | | | |
| | 92,461 | | | | CS First Boston 1995-WF1 G, 8.570% 12/21/27 | | | 88,146 |
| | 2,000,000 | | | | CS First Boston 1998-C, 6.750% 11/11/30 (a) | | | 1,606,160 |
| | 1,967,335 | | | | Lehman Brothers-UBS Commercial Mortgage 2001-C7 S, 5.868% 11/15/33 | | | 1,037,907 |
| | 2,000,000 | | | | Merrill Lynch Mortgage 1998-C1 F, 6.250% 11/15/26 | | | 1,160,980 |
| | | | | | | |
|
|
| | | | | | | | | 3,893,193 |
| | | | | | | |
|
|
| | | | | | Equipment Leases–20.7% | | | |
| | 892,300 | | | | Aerco Limited 1A C1, 6.099% 7/15/23 (a) | | | 321,228 |
| | 4,461,500 | | | | Aerco Limited 1X C1, 6.099% 7/15/23 | | | 1,673,063 |
| | 4,267,063 | | | | Aerco Limited 2A B2, 5.799% 7/15/25 (a) | | | 1,792,167 |
| | 2,461,460 | | | | Aerco Limited 2A C2, 6.799% 7/15/25 (a) | | | 787,667 |
| | 14,000,000 | | | | Aircraft Finance Trust 1999-1A A1, 5.229% 5/15/24 | | | 9,660,000 |
| | 19,000,000 | | | | Airplanes Pass Through Trust 2001-1A A9, 5.299% 3/15/19 | | | 11,400,000 |
| | 1,248,663 | | | | DVI Receivables 2001-2 A3, 3.519% 11/8/31 | | | 1,036,391 |
| | 1,752,321 | | | | DVI Receivables 2001-2 A4, 4.613% 11/11/09 | | | 1,463,188 |
| | 5,854,768 | | | | DVI Receivables 2002-1 A3A, 5.070% 6/11/10 | | | 3,893,420 |
| | 3,600,978 | | | | DVI Receivables 2003-1 A3 A, 5.220% 3/14/11 | | | 3,042,826 |
| | 14,000,000 | | | | Lease Investment Flight Trust 1 A1, 5.139% 7/15/31 | | | 10,010,000 |
| | 2,000,000 | | | | Lease Investment Flight Trust 1 A2, 5.179% 7/15/31 | | | 1,430,000 |
| | 3,798,003 | | | | Pegasus Aviation Lease 2000-1 A1, 5.443% 3/25/15 (a) | | | 2,354,762 |
| | 12,000,000 | | | | Pegasus Aviation Lease 2001-1A A1, 5.178% 5/10/31 (a) | | | 6,960,000 |
| | 12,000,000 | | | | Pegasus Aviation Lease 1999-1A A2, 6.300% 3/25/29 (a) | | | 5,351,400 |
| | 3,517,584 | | | | Pegasus Aviation Lease 2001-1A B1, 6.380% 5/10/31 (a) | | | 422,110 |
| | 1,758,792 | | | | Pegasus Aviation Lease 2001-1A B2, 7.270% 5/10/31 (a) | | | 386,934 |
| | 2,000,000 | | | | Triton Aviation Finance 1A A1, 5.519% 6/15/25 (a) | | | 1,550,000 |
| | | | | | | |
|
|
| | | | | | | | | 63,535,156 |
| | | | | | | |
|
|
| | | | | | Franchise Loans–1.2% | | | |
| | 1,000,000 | | | | Falcon Franchise Loan 2001-1 F, 6.500% 1/5/23 | | | 593,030 |
| | 3,548,000 | | | | Falcon Franchise Loan 2003-1 D, 7.836% 1/5/25 (a) | | | 3,036,130 |
| | | | | | | |
|
|
| | | | | | | | | 3,629,160 |
| | | | | | | |
|
|
| | | | | | Home Equity Loans (Non-High Loan-To-Value)–9.6% | | | |
| | 2,000,000 | | | | Ace Securities 2004-HE4 B, 8.318% 12/25/34 (a) | | | 1,680,000 |
| | 2,000,000 | | | | Ace Securities 2005-HE5 B2, 7.818% 8/25/35 (a) | | | 1,490,000 |
| | 2,000,000 | | | | Ace Securities 2005-HE6 B1, 7.818% 10/25/35 (a) | | | 1,493,000 |
| | 925,014 | | | | Amresco Residential Securities 1999-1 B, 8.818% 11/25/29 | | | 901,490 |
26
RMK HIGH INCOME FUND, INC.
PORTFOLIOOF INVESTMENTS
MARCH 31, 2006
| | | | | | | | |
Principal
Amount | | | | Description | | Market
Value (b) |
| | Asset Backed Securities–Non-Investment Grade (continued) | | | |
| | | | | | Home Equity Loans (Non-High Loan-To-Value) (continued) | | | |
| $ | 1,900,000 | | | | Argent Securities 2004-W5 M7, 8.068% 4/25/34 (a) | | $ | 1,750,375 |
| | 1,610,661 | | | | Delta Funding Home Equity 1997-2 B3, 7.800% 6/25/27 | | | 654,573 |
| | 2,967,507 | | | | Delta Funding Home Equity 2000-1 B, 8.090% 5/15/30 | | | 2,593,482 |
| | 2,000,000 | | | | Equifirst Mortgage 2004-2 B1, 8.218% 7/25/34 (a) | | | 1,760,000 |
| | 1,000,000 | | | | Equifirst Mortgage 2005-1 B3, 8.068% 4/25/35 (a) | | | 822,500 |
| | 1,000,000 | | | | Equifirst Mortgage 2005-1 B4, 8.068% 4/25/35 (a) | | | 820,000 |
| | 2,000,000 | | | | Greenwich 2005-1A N2, 4.150% 1/20/45 (a) | | | 1,540,000 |
| | 3,000,000 | | | | Meritage Asset Holdings NIM 2005-2 N4, 7.500% 11/25/35 (a) | | | 2,259,000 |
| | 2,000,000 | | | | Merrill Lynch Mortgage 2005-SL1 B5, 8.318% 6/25/35 (a) | | | 1,760,000 |
| | 1,327,523 | | | | Structured Asset 2003-S A, 7.500% 12/28/33 (a) | | | 1,329,182 |
| | | | | | Terwin Mortgage 2005-3SL B6, 11.500% 3/25/35 interest-only strips | | | 2,220,000 |
| | 1,867,717 | | | | Terwin Mortgage 2005-7SL, 6.500% 7/25/35 (a) | | | 1,627,248 |
| | 2,878,011 | | | | Terwin Mortgage 2005-11SL B7, 5.000% 11/25/36 (a) | | | 2,388,749 |
| | 3,000,000 | | | | Terwin Mortgage 2005-R1, 5.000% 12/28/36 (a) | | | 2,190,000 |
| | | | | | | |
|
|
| | | | | | | | | 29,279,599 |
| | | | | | | |
|
|
| | | | | | Manufactured Housing Loans–3.3% | | | |
| | 3,755,176 | | | | Conseco Finance 1999-6 M1, 7.960% 6/1/30 (a) | | | 366,130 |
| | 5,000,000 | | | | Conseco Finance 2000-6 M1, 7.720% 9/1/32 | | | 900,000 |
| | 4,000,000 | | | | Conseco Finance 2001-1 M1, 7.535% 7/1/32 | | | 919,272 |
| | 3,000,000 | | | | Green Tree Financial 1997-8 M1, 7.020% 10/15/27 | | | 1,941,768 |
| | 21,505,000 | | | | Madison Avenue Manufactured Housing 2002-A B2, 7.500% 3/25/32 | | | 6,021,400 |
| | | | | | | |
|
|
| | | | | | | | | 10,148,570 |
| | | | | | | |
|
|
| | | | | | Recreational Equipment–0.2% | | | |
| | 633,291 | | | | Green Tree Recreational Equipment 1996-B CTFS, 7.700% 7/15/18 | | | 629,239 |
| | | | | | | |
|
|
| | | | | | Small Business Loans–0.8% | | | |
| | | | | | FMAC Loan Trust 1998-CA AX, 1.837% 9/15/18 interest-only strips (a) | | | 2,470,624 |
| | | | | | | |
|
|
| | | | | | Total Asset Backed Securities–Non-Investment Grade
(cost $135,324,327) | | | 127,302,311 |
| | | | | | | |
|
|
| | Corporate Bonds–Investment Grade–1.3% of Net Assets | | | |
| | | | | | Special Purpose Entity–1.3% | | | |
| | 4,000,000 | | | | Duane Park I, Zero Coupon Bond, 6/27/16 (a) | | | 4,000,000 |
| | | | | | | |
|
|
| | | | | | Total Corporate Bonds–Investment Grade
(cost $4,000,000) | | | 4,000,000 |
| | | | | | | |
|
|
27
RMK HIGH INCOME FUND, INC.
PORTFOLIOOF INVESTMENTS
MARCH 31, 2006
| | | | | | | | |
Principal
Amount | | | | Description | | Market
Value (b) |
| | Corporate Bonds–Non-Investment Grade–34.6% of Net Assets | | | |
| | | | | | Apparel–0.8% | | | |
| $ | 435,000 | | | | Anvil Knitwear, 10.875% 3/15/07 | | $ | 215,325 |
| | 2,175,000 | | | | Rafaella Apparel, 11.250% 6/15/11 (a) | | | 2,164,125 |
| | | | | | | |
|
|
| | | | | | | | | 2,379,450 |
| | | | | | | |
|
|
| | | | | | Appliances–1.0% | | | |
| | 3,075,000 | | | | Windmere-Durable, 10.000% 7/31/08 | | | 2,921,250 |
| | | | | | | |
|
|
| | | | | | Automotives��0.9% | | | |
| | 850,000 | | | | Ford Motor, 9.215% 9/15/21 | | | 680,000 |
| | 425,000 | | | | Ford Motor, 9.980% 2/15/47 | | | 348,500 |
| | 2,550,000 | | | | General Motors, 8.375% 7/15/33 | | | 1,867,875 |
| | | | | | | |
|
|
| | | | | | | | | 2,896,375 |
| | | | | | | |
|
|
| | | | | | Automotive Parts & Equipment–2.5% | | | |
| | 2,800,000 | | | | Dana Corporation, Zero Coupon Bond 3/15/10 in default (c) | | | 2,184,000 |
| | 650,000 | | | | Delphi Corporation, Zero Coupon Bond 5/1/29 in default (c) | | | 399,750 |
| | 2,650,000 | | | | Dura Operating, 9.000% 5/1/09 | | | 1,311,750 |
| | 850,000 | | | | Exide Technologies, 10.500% 3/15/13 (a) | | | 641,750 |
| | 1,925,000 | | | | Metaldyne Corp., 11.000% 6/15/12 | | | 1,532,781 |
| | 1,625,000 | | | | Metaldyne Corp., 10.000% 11/1/13 | | | 1,519,375 |
| | | | | | | |
|
|
| | | | | | | | | 7,589,406 |
| | | | | | | |
|
|
| | | | | | Basic Materials–3.4% | | | |
| | 1,400,000 | | | | Doe Run Resources, 11.750% 11/1/08 (a) | | | 1,232,000 |
| | 2,650,000 | | | | Edgen Acquisition, 9.875% 2/1/11 | | | 2,636,750 |
| | 975,000 | | | | Edgen Corporation, 9.875% 2/1/11 (a) | | | 970,125 |
| | 1,800,000 | | | | Millar Western, 7.750% 11/15/13 | | | 1,386,000 |
| | 3,200,000 | | | | OM Group, 9.250% 12/15/11 | | | 3,312,000 |
| | 800,000 | | | | Phibro Animal Health Corporation, 13.000% 12/1/07 | | | 824,000 |
| | | | | | | |
|
|
| | | | | | | | | 10,360,875 |
| | | | | | | |
|
|
| | | | | | Building & Construction–1.7% | | | |
| | 4,200,000 | | | | MMI Products, 11.250% 4/15/07 | | | 4,137,000 |
| | 1,350,000 | | | | Owens Corning, Zero Coupon Bond 8/1/18 in default (c) | | | 1,083,375 |
| | | | | | | |
|
|
| | | | | | | | | 5,220,375 |
| | | | | | | |
|
|
| | | | | | Communications–1.5% | | | |
| | 650,000 | | | | Adelphia Communications, Zero Coupon Bond 10/1/10 in default (c) | | | 383,500 |
| | 493,000 | | | | CCH I Holdings LLC, 10.000% 5/15/14 (a) | | | 248,965 |
| | 3,375,000 | | | | CCH I Holdings LLC, Zero Coupon Bond 5/15/11 (a) | | | 1,755,000 |
| | 396,000 | | | | CCH I Holdings, 11.000% 10/1/15 (a) | | | 329,175 |
| | 2,000,000 | | | | Penton Media, 10.375% 6/15/11 | | | 1,815,000 |
| | | | | | | |
|
|
| | | | | | | | | 4,531,640 |
| | | | | | | |
|
|
28
RMK HIGH INCOME FUND, INC.
PORTFOLIOOF INVESTMENTS
MARCH 31, 2006
| | | | | | | | |
Principal
Amount | | | | Description | | Market
Value (b) |
| | Corporate Bonds–Non-Investment Grade (continued) | | | |
| | | | | | Consulting Services–1.1% | | | |
| $ | 2,300,000 | | | | MSX International, 11.375% 1/15/08 | | $ | 1,518,000 |
| | 2,000,000 | | | | MSX International, 11.000% 10/15/07 | | | 1,920,000 |
| | | | | | | |
|
|
| | | | | | | | | 3,438,000 |
| | | | | | | |
|
|
| | | | | | Electronics–1.3% | | | |
| | 4,100,000 | | | | Motors and Gears, 10.750% 11/15/06 | | | 4,018,000 |
| | | | | | | |
|
|
| | | | | | Finance–1.2% | | | |
| | 1,752,000 | | | | Advanta Capital Trust I, 8.990% 12/17/26 | | | 1,782,660 |
| | 1,200,000 | | | | Banctec, 7.500% 6/1/08 | | | 859,488 |
| | 1,075,000 | | | | Citisteel USA, 11.553% 9/1/10 (a) | | | 1,101,875 |
| | | | | | | |
|
|
| | | | | | | | | 3,744,023 |
| | | | | | | |
|
|
| | | | | | Food–1.2% | | | |
| | 2,300,000 | | | | Di Giorgio Corp., 10.000% 6/15/07 | | | 2,213,750 |
| | 2,300,000 | | | | Merisant, 9.500% 7/15/13 | | | 1,587,000 |
| | | | | | | |
|
|
| | | | | | | | | 3,800,750 |
| | | | | | | |
|
|
| | | | | | Garden Products–0.3% | | | |
| | 1,115,000 | | | | Ames True Temper, 10.000% 7/15/12 | | | 931,025 |
| | | | | | | |
|
|
| | | | | | Human Resources–0.5% | | | |
| | 1,500,000 | | | | Comforce Operating, 12.000% 12/1/07 | | | 1,501,875 |
| | | | | | | |
|
|
| | | | | | Industrial–5.5% | | | |
| | 1,625,000 | | | | Advanced Lighting Technologies, 11.000% 3/31/09 | | | 1,602,234 |
| | 3,000,000 | | | | Consolidated Container, 10.125% 7/15/09 | | | 2,625,000 |
| | 825,000 | | | | Constar International, 11.000% 12/1/12 | | | 643,500 |
| | 2,500,000 | | | | Continental Global Group, 9.000% 10/1/08 | | | 2,437,825 |
| | 2,475,000 | | | | GSI Group, 12.000% 5/15/13 | | | 2,509,031 |
| | 1,650,000 | | | | Trimas Corp., 9.875% 6/15/12 | | | 1,509,750 |
| | 680,000 | | | | Vicap S.A., 11.375% 5/15/07* | | | 635,800 |
| | 2,150,000 | | | | VITRO S.A., 11.750% 11/1/13 (a) | | | 1,999,500 |
| | 3,075,000 | | | | Wolverine Tube, 7.375% 8/1/08 (a) | | | 2,429,250 |
| | 500,000 | | | | Wolvernine Tube, 10.500% 4/1/09 | | | 412,500 |
| | | | | | | |
|
|
| | | | | | | | | 16,804,390 |
| | | | | | | |
|
|
| | | | | | Manufacturing–1.1% | | | |
| | 2,295,000 | | | | BGF Industries, 10.250% 1/15/09 | | | 2,111,400 |
| | 1,500,000 | | | | JB Poindexter, 8.750% 3/15/14 | | | 1,192,500 |
| | | | | | | |
|
|
| | | | | | | | | 3,303,900 |
| | | | | | | |
|
|
| | | | | | Medical Products–0.8% | | | |
| | 4,275,000 | | | | Insight Health Services, 9.875% 11/1/11 | | | 2,351,250 |
| | | | | | | |
|
|
29
RMK HIGH INCOME FUND, INC.
PORTFOLIOOF INVESTMENTS
MARCH 31, 2006
| | | | | | | | |
Principal
Amount | | | | Description | | Market
Value (b) |
| | Corporate Bonds–Non-Investment Grade (continued) | | | |
| | | | | | Retail–3.0% | | | |
| $ | 2,150,000 | | | | General Nutrition Center, 8.500% 12/1/10 | | $ | 2,037,125 |
| | 1,950,000 | | | | Jo-Ann Stores, 7.500% 3/1/12 | | | 1,711,125 |
| | 825,000 | | | | Nebraska Book Company, 8.625% 3/15/12 | | | 759,000 |
| | 2,150,000 | | | | Star Gas Partner, 10.250% 2/15/13 | | | 2,225,250 |
| | 3,100,000 | | | | Uno Restaurant, 10.000% 2/15/11 (a) | | | 2,511,000 |
| | | | | | | |
|
|
| | | | | | | | | 9,243,500 |
| | | | | | | |
|
|
| | | | | | Special Purpose Entity–2.9% | | | |
| | 1,350,000 | | | | Altra Industrial Motion, 9.000% 12/1/11 (a) | | | 1,343,250 |
| | 2,500,000 | | | | INCAPS Funding II, 10.000% 1/15/34 (a) | | | 2,250,000 |
| | 725,000 | | | | Interactive Health, 7.250% 4/1/11 (a) | | | 565,500 |
| | 3,000,000 | | | | MM Community Funding IX, 10.000% 5/1/33 (a) | | | 2,340,000 |
| | 172,000 | | | | PAHC Holdings, Zero Coupon Bond 2/1/10** | | | 177,160 |
| | 1,316,750 | | | | TPREF Funding III, Zero Coupon Bond 1/15/33 (a) | | | 1,106,070 |
| | 1,175,000 | | | | Transmeridian Exploration, 12.000% 12/15/10 (a) | | | 1,183,812 |
| | | | | | | |
|
|
| | | | | | | | | 8,965,792 |
| | | | | | | |
|
|
| | | | | | Technology–0.7% | | | |
| | 2,600,000 | | | | Danka Business Systems, 11.000% 6/15/10 | | | 2,125,500 |
| | | | | | | |
|
|
| | | | | | Telecommunications–1.7% | | | |
| | 1,274,600 | | | | BARAK I.T.C., 10.000% 11/15/10* | | | 1,253,008 |
| | 150,000 | | | | Century Communications, Zero Coupon Bond 5/15/11 in default (c) | | | 150,000 |
| | 2,925,000 | | | | Primus Telecommunications, 8.000% 1/15/14 | | | 1,989,000 |
| | 300,000 | | | | Rural Cellular, 9.750% 1/15/10 | | | 304,500 |
| | 1,900,000 | | | | Securus Technologies, 11.000% 9/1/11 | | | 1,634,000 |
| | | | | | | |
|
|
| | | | | | | | | 5,330,508 |
| | | | | | | |
|
|
| | | | | | Tobacco–0.6% | | | |
| | 2,950,000 | | | | North Atlantic Trading, 9.250% 3/1/12 | | | 1,888,000 |
| | | | | | | |
|
|
| | | | | | Transportation–0.3% | | | |
| | 1,050,000 | | | | Evergreen International Aviation, 12.000% 5/15/10 | | | 1,051,313 |
| | | | | | | |
|
|
| | | | | | Travel–0.6% | | | |
| | 2,000,000 | | | | Worldspan Financial, 10.999% 2/15/11 | | | 1,730,000 |
| | | | | | | |
|
|
| | | | | | Total Corporate Bonds–Non-Investment Grade
(cost $113,284,638) | | | 106,127,197 |
| | | | | | | |
|
|
| | Mortgage Backed Securities–Investment Grade–4.7% of Net Assets | | | |
| | | | | | Collateralized Mortgage Obligations–4.7% | | | |
| | | | | | Harborview Mortgage 2003-2 1X, 1.148% 10/19/33 interest-only strips | | | 549,058 |
| | | | | | Harborview Mortgage 2004-8 x, 1.407% 11/19/34 interest-only strips | | | 1,648,607 |
| | 4,000,000 | | | | Long Beach Mortgage 2004-4 M10, 7.818% 10/25/34 | | | 4,050,000 |
| | | | | | Mellon Residential 2002-TBC2 X, 0.632% 8/15/32 interest-only strips | | | 673,323 |
30
RMK HIGH INCOME FUND, INC.
PORTFOLIOOF INVESTMENTS
MARCH 31, 2006
| | | | | | | | |
Principal
Amount | | | | Description | | Market
Value (b) |
| | Mortgage Backed Securities–Investment Grade (continued) | | | |
| | | | | | Collateralized Mortgage Obligations (continued) | | | |
| $ | 2,000,000 | | | | Merrill Lynch Mortgage 2005-M1, 6.818% 5/25/36 | | $ | 1,609,360 |
| | 702,699 | | | | Sail Net Interest Margin Notes 2004-5A B, 6.750% 6/27/34 (a) | | | 704,456 |
| | 2,262,937 | | | | Sail Net Interest Margin Notes 2004-7A B, 6.750% 8/27/34 (a) | | | 2,227,906 |
| | 1,000,000 | | | | Soundview 2005-OPT4 M9, 7.318% 12/25/35 (a) | | | 803,750 |
| | 2,167,000 | | | | Structured Asset 2003-BC1 B2, 9.000% 5/25/32 | | | 2,203,679 |
| | | | | | | |
|
|
| | | | | | Total Mortgage Backed Securities–Investment Grade
(cost $16,718,693) | | | 14,470,139 |
| | | | | | | |
|
|
| | Mortgage Backed Securities–Non-Investment Grade–15.3% of Net Assets | | | |
| | | | | | Collateralized Mortgage Obligations–15.3% | | | |
| | 2,500,000 | | | | First Franklin Mortgage 2004-FFH2 B2, 8.318% 10/25/34 (a) | | | 2,325,000 |
| | 3,000,000 | | | | First Franklin Mortgage 2004-FFH3 B1, 8.318% 6/25/34 (a) | | | 2,670,000 |
| | 3,000,000 | | | | Fremont Home Equity 2005-C B3, 7.068% 7/25/35 (a) | | | 2,175,000 |
| | 2,000,000 | | | | Greenwich 2005-2A N2, 3.100% 2/26/35 (a) | | | 1,400,000 |
| | 3,000,000 | | | | Greenwich 2005-3 N2, 2.000% 6/27/35 (a) | | | 1,860,000 |
| | 6,000,000 | | | | Greenwich 2005-4 N-2, Zero Coupon Bond, 7/27/45 (a) | | | 3,120,000 |
| | 2,568,000 | | | | GSAMP Trust 2004-AR1 B5, 5.000% 6/25/34 (a) | | | 2,080,080 |
| | 1,863,892 | | | | Harborview Mortgage 2005-15 B10, 6.526% 10/20/45 | | | 1,484,124 |
| | 2,463,793 | | | | Long Beach Mortgage 2001-4 M3, 7.568% 3/25/32 | | | 640,586 |
| | 3,000,000 | | | | Long Beach Mortgage 2005-WL1, 7.568% 6/25/35 | | | 2,620,770 |
| | 5,000,000 | | | | Long Beach Asset Holdings 2005-WL1 N4, 7.500% 6/25/45 (a) | | | 4,579,700 |
| | 3,000,000 | | | | Meritage Mortgage 2004-2 B1, 8.068% 1/25/35 (a) | | | 2,595,000 |
| | 2,000,000 | | | | Meritage Mortgage 2004-2 B2, 8.068% 1/25/35 (a) | | | 1,665,000 |
| | 1,021,575 | | | | Park Place Securities 2005-WCW1 B, 5.000% 9/25/35 (a) | | | 942,403 |
| | 3,000,000 | | | | Park Place Securities 2005-WCW1 M11, 7.318% 9/25/35 | | | 2,437,500 |
| | 2,000,000 | | | | Park Place Securities 2005-WCW3, 7.318% 8/25/35 (a) | | | 1,640,000 |
| | 2,000,000 | | | | Park Place Securities 2005-WHQ1 M10, 7.318% 3/25/35 (a) | | | 1,783,440 |
| | 2,000,000 | | | | Park Place Securities 2005-WHQ4, 7.318% 9/25/35 (a) | | | 1,370,320 |
| | 2,000,000 | | | | People’s Choice Home Loan 2004-2 B, 5.000% 10/25/34 (a) | | | 1,652,500 |
| | 1,500,000 | | | | Popular 2005-4 B2, 7.318% 9/25/35 (a) | | | 1,396,875 |
| | 1,000,000 | | | | Soundview 2005-1 B3, 8.068% 4/25/35 (a) | | | 820,000 |
| | 1,000,000 | | | | Soundview 2005-2 B4, 7.818% 7/25/35 (a) | | | 752,500 |
| | 2,000,000 | | | | Soundview 2005-B M14, 7.650% 5/25/35 | | | 1,639,500 |
| | 2,000,000 | | | | Structured Asset 2004-S4 B3, 5.090% 12/25/34 (a) | | | 1,557,280 |
| | 2,000,000 | | | | Structured Asset 2004-S2 B, 6.000% 6/25/34 (a) | | | 1,811,840 |
| | | | | | | |
|
|
| | | | | | Total Mortgage Backed Securities–Non-Investment Grade (cost $47,144,494) | | | 47,019,418 |
| | | | | | | |
|
|
| | Government Agency Securities–0.7% of Net Assets | | | |
| | | | | | GNMA 2003-59 XA, 0.612% 6/16/34 interest-only strips (g) | | | 2,286,799 |
| | | | | | | |
|
|
| | | | | | Total Government Agency Securities
(cost $2,427,037) | | | 2,286,799 |
| | | | | | | |
|
|
31
RMK HIGH INCOME FUND, INC.
PORTFOLIOOF INVESTMENTS
MARCH 31, 2006
| | | | | | | | |
Principal
Amount/
Shares | | | | Description | | Market
Value (b) |
| | Municipal Securities–0.2% of Net Assets | | | |
| $ | 1,000,000 | | | | Pima County Arizona IDA Health Care, Zero Coupon Bond 11/15/32 in default | | $ | 501,040 |
| | | | | | | |
|
|
| | | | | | Total Municipal Securities
(cost $626,327) | | | 501,040 |
| | | | | | | |
|
|
| | Common Stocks–13.1% of Net Assets | | | |
| | 26,200 | | | | Alpha Natural Resources, Inc. (c) | | | 606,268 |
| | 29,800 | | | | American Capital Strategies, Ltd. | | | 1,047,768 |
| | 12,600 | | | | Arthur J. Gallagher & Co. | | | 350,406 |
| | 36,500 | | | | ATI Technologies Inc. (c) | | | 627,070 |
| | 34,000 | | | | Bois d’Arc Energy LLC (c) | | | 566,100 |
| | 38,600 | | | | Cascade Microtech, Inc. (c) | | | 505,274 |
| | 6,100 | | | | Caterpillar, Inc. | | | 438,041 |
| | 8,000 | | | | CEMEX, S.A. de C.V. | | | 522,240 |
| | 29,700 | | | | Citizens Communications Company | | | 394,119 |
| | 13,100 | | | | Companhia de Saneamento Basico do Estado de São Paulo (c) | | | 288,331 |
| | 45,200 | | | | Compton Petroleum Corporation (c) | | | 580,368 |
| | 42,600 | | | | Consolidated Communications Illinois Holdings, Inc. (c) | | | 693,102 |
| | 11,900 | | | | Cytec Industries Inc. (d) | | | 714,119 |
| | 5,600 | | | | Deere & Company | | | 442,680 |
| | 8,700 | | | | Dell Inc. (c)(d) | | | 258,912 |
| | 32,700 | | | | Direct General Corporation | | | 556,227 |
| | 34,000 | | | | Dollar General Corporation (d) | | | 600,780 |
| | 23,300 | | | | Education Realty Trust, Inc. | | | 356,490 |
| | 12,400 | | | | EnCana Corporation (d) | | | 579,452 |
| | 7,000 | | | | ENSCO International Incorporated (d) | | | 360,150 |
| | 23,000 | | | | Enterprise Partners Products L.P. | | | 567,870 |
| | 33,300 | | | | FairPoint Communications, Inc. | | | 460,206 |
| | 7,500 | | | | Fording Canadian Coal Trust | | | 284,925 |
| | 10,400 | | | | Fred’s Inc. | | | 137,904 |
| | 23,300 | | | | Global Industries, Ltd. (c)(d) | | | 337,617 |
| | 31,000 | | | | Infocrossing, Inc. (c) | | | 373,550 |
| | 137,700 | | | | InPhonic, Inc. (c) | | | 962,523 |
| | 91,386 | | | | Intermet Corporation (c) | | | 1,096,632 |
| | 81,300 | | | | International Coal Group, Inc. (c) | | | 791,862 |
| | 44,200 | | | | Iowa Telecommunications Services, Inc. | | | 843,336 |
| | 7,600 | | | | J.C. Penney Company, Inc. | | | 459,116 |
| | 11,750 | | | | Kinder Morgan Energy Partners, L.P. | | | 566,115 |
| | 8,400 | | | | KKR Financial Corp. (c) | | | 188,412 |
| | 30,900 | | | | Korn/Ferry International (c) | | | 630,051 |
| | 8,500 | | | | L-3 Communications Holdings, Inc. | | | 729,215 |
| | 8,200 | | | | Lloyds TSB Group plc | | | 315,618 |
| | 10,600 | | | | Lone Star Technologies, Inc. (c)(d) | | | 587,346 |
32
RMK HIGH INCOME FUND, INC.
PORTFOLIOOF INVESTMENTS
MARCH 31, 2006
| | | | | | | |
| Shares | | | | Description | | Market
Value (b) |
| Common Stocks (continued) | | | |
| 19,200 | | | | Macquarie Infrastructure Company Trust | | $ | 624,000 |
| 12,200 | | | | Magellan Midstream Partners, L.P. | | | 401,014 |
| 9,500 | | | | Manpower Inc. | | | 543,210 |
| 25,300 | | | | Masco Corporation | | | 821,997 |
| 90,050 | | | | MCG Capital Corporation | | | 1,270,606 |
| 24,900 | | | | Microsoft Corporation (d) | | | 677,529 |
| 22,200 | | | | Mittal Steel Company N.V. | | | 838,050 |
| 18,200 | | | | Motorola, Inc. | | | 416,962 |
| 49,100 | | | | Nam Tai Electronics, Inc. | | | 1,124,881 |
| 42,600 | | | | Ness Technologies, Inc. (c) | | | 536,334 |
| 5,300 | | | | PACCAR Inc. | | | 373,544 |
| 7,900 | | | | PetroChina Company Limited (d) | | | 829,105 |
| 8,000 | | | | Philippine Long Distance Telephone Company | | | 300,560 |
| 33,700 | | | | Regal Entertainment Group | | | 633,897 |
| 13,000 | | | | Sasol Limited | | | 491,790 |
| 24,290 | | | | Ship Finance International Limited | | | 416,816 |
| 2,700 | | | | Stone Energy Corporation (c)(d) | | | 119,151 |
| 10,800 | | | | Superior Energy Services, Inc. (c) | | | 289,332 |
| 77,800 | | | | Taiwan Semiconductor Manufacturing Company Ltd. | | | 782,668 |
| 89,833 | | | | Technology Investment Capital Corporation (c) | | | 1,306,172 |
| 14,750 | | | | Teva Pharmaceutical Industries Limited | | | 607,405 |
| 18,000 | | | | The Home Depot, Inc. (d) | | | 761,400 |
| 4,800 | | | | The Timken Company | | | 154,896 |
| 8,600 | | | | Tidewater Inc. (d) | | | 474,978 |
| 54,100 | | | | TOP Tankers Inc. | | | 703,300 |
| 79,900 | | | | Trustreet Properties Inc. | | | 1,213,681 |
| 27,400 | | | | Tsakos Energy Navigation Limited (d) | | | 1,073,532 |
| 1,800 | | | | Unit Corporation (c)(d) | | | 100,350 |
| 15,700 | | | | Valero Energy Corporation (d) | | | 938,545 |
| 10,800 | | | | Valero L.P. | | | 547,020 |
| 12,900 | | | | Washington Mutual, Inc. | | | 549,798 |
| 20,200 | | | | Willbros Group, Inc. (c)(d) | | | 410,868 |
| | | | | | |
|
|
| | | | | Total Common Stocks
(cost $38,063,354) | | | 40,153,586 |
| | | | | | |
|
|
| Preferred Stocks–2.2% of Net Assets | | | |
| 30,000 | | | | Baker Street Funding | | | 2,910,000 |
| 1,000 | | | | Credit Genesis CLO 2005 | | | 1,000,000 |
| 1,000 | | | | Hewett’s Island II (a) | | | 990,000 |
| 1,000 | | | | Marquette Park CLO, 10.000% 7/12/20 (a) | | | 980,000 |
| 1,000 | | | | SOLOSO CDO 2005 | | | 992,706 |
| | | | | | |
|
|
| | | | | Total Preferred Stocks
(cost $6,872,714) | | | 6,872,706 |
| | | | | | |
|
|
33
RMK HIGH INCOME FUND, INC.
PORTFOLIOOF INVESTMENTS
MARCH 31, 2006
| | | | | | | | | |
Principal
Amount | | | | Description | | Market
Value (b) | |
| | Corporate Loans–0.1% of Net Assets | | | | |
| $ | 1,000,000 | | | | ICO North America, 7.50% 8/15/09 | | $ | 412,750 | |
| | | | | | | |
|
|
|
| | | | | | Total Corporate Loans
(cost $325,000) | | | 412,750 | |
| | | | | | | |
|
|
|
| | Eurodollar Time Deposits–9.2% of Net Assets | | | | |
| | | | | | State Street Bank & Trust Company Eurodollar time deposits dated March 31, 2006, 3.75% maturing at $28,195,090 on April 3, 2006 | | | 28,192,153 | |
| | | | | | | |
|
|
|
| | | | | | Total Investments–135.9% of Net Assets
(cost $432,382,460) | | | 416,638,790 | |
| | | | | | | |
|
|
|
| | | | | | Other Assets and Liabilities, net–(35.9%) of Net Assets | | | (109,939,729 | ) |
| | | | | | | |
|
|
|
| | | | | | Net Assets | | $ | 306,699,061 | |
| | | | | | | |
|
|
|
Call Options Written
March 31, 2006
| | | | | | | |
Number of
Contracts | | | | Common Stocks/Expiration Date/Exercise Price | | Market
Value (b) |
| 17 | | | | Cytec Industries Inc./April/60 | | $ | 2,380 |
| 45 | | | | Dell Inc./April/30 | | | 2,070 |
| 4 | | | | Dollar General Corporation/April/17.50 | | | 180 |
| 8 | | | | EnCana Corporation/April/50 | | | 360 |
| 10 | | | | ENSCO International Incorporated/April/50 | | | 2,650 |
| 2 | | | | Global Industries, Ltd/April/15 | | | 60 |
| 15 | | | | The Home Depot, Inc/April/42.50 | | | 1,050 |
| 31 | | | | Lone Star Technologies, Inc/April/55 | | | 6,975 |
| 29 | | | | Microsoft Corporation/April/27.50 | | | 754 |
| 37 | | | | PetroChina Company Limited/April/100 | | | 19,980 |
| 27 | | | | Stone Energy Corporation/April/45 | | | 4,590 |
| 24 | | | | Tidewater Inc/April/55 | | | 4,320 |
| 21 | | | | Tsakos Energy Navigation Limited/April/40 | | | 735 |
| 18 | | | | Unit Corporation/April/55 | | | 3,240 |
| 10 | | | | Valero Energy Corporation/April/60 | | | 1,750 |
| 7 | | | | Willbros Group, Inc/April/20 | | | 385 |
| | | | | | |
|
|
| | | | | Total Call Options Written
(Premiums Received $45,863) | | $ | 51,479 |
| | | | | | |
|
|
34
RMK HIGH INCOME FUND, INC.
PORTFOLIOOF INVESTMENTS
MARCH 31, 2006
| (a) | | Securities sold within the terms of a private placement memorandum, exempt from registration under Rule 144A under the Securities Act of 1933, as amended, and may be resold in transactions exempt from registration, normally to qualified institutional buyers. Pursuant to guidelines adopted by the Board of Directors, these issues have been determined to be liquid by Morgan Asset Management, Inc., the Fund’s investment adviser. |
| (b) | | See Note 2 of accompanying Notes to Financial Statements regarding valuation of securities. |
| (c) | | These securities are non-income producing. |
| (d) | | A portion or all of the security is pledged as collateral for call options written. |
| * | | These securities are classified as Yankee Bonds, which are U.S. dollar denominated bonds issued in the United States by a foreign entity. |
| ** | | This security is payment-in-kind. |
(See Accompanying Notes to the Financial Statements)
35
[THIS PAGE INTENTIONALLY LEFT BLANK]
36
RMK MULTI-SECTOR HIGH INCOME FUND, INC.
OBJECTIVE & STRATEGY
RMK Multi-Sector High Income Fund, Inc. seeks a high level of current income. The Fund seeks capital growth as a secondary investment objective when consistent with its primary investment objective. The Fund invests in a diversified portfolio consisting primarily of debt securities that offer attractive yield and capital appreciation potential. Under normal market conditions, the Fund invests a majority of its total assets in below investment grade debt securities, including up to 20% of the Fund’s total assets in distressed securities. The Fund maintains the flexibility to invest up to 50% of its total assets in investment grade securities. The Fund invests up to 30% of its total assets in equity securities of both domestic and foreign issuers and up to 15% of its total assets in a combination of foreign debt and foreign equity securities. The Fund invests in a wide range of debt securities including, corporate bonds, mortgage- and asset-backed securities, convertible debt securities, distressed securities, including securities of companies in bankruptcy reorganization proceedings or otherwise in the process of debt restructuring, U.S. government and municipal obligations and foreign government obligations. (Below investment grade debt securities are rated Ba1 or lower by Moody’s Investors Service, Inc., rated BB+ or lower by Standard & Poor’s Ratings Group or Fitch Ratings Ltd., comparably rated by another nationally recognized statistical rating organization, or not rated by any rating agency but determined by the Fund’s investment adviser to be of comparable quality.)
INVESTMENT RISKS: Bond funds tend to experience smaller fluctuations in value than stock funds. However, investors in any bond fund should anticipate fluctuations in price. Bond prices and the value of bond funds decline as interest rates rise. Longer-term funds generally are more vulnerable to interest rate risk than shorter-term funds. Below investment grade bonds involve greater credit risk, which is the risk that the issuer will not make interest or principal payments when due. An economic downturn or period of rising interest rates could adversely affect the ability of issuers, especially issuers of below investment grade debt, to service primary obligations and an unanticipated default could cause the Fund to experience a reduction in value of its shares. The value of U.S. and foreign equity securities in which the Fund invests will change based on changes in a company’s financial condition and in overall market and economic conditions. Use of leverage may increase the likelihood that the net asset value of the Fund and market value of its common shares will be more volatile, and the yield and total return to common stockholders will tend to fluctuate more in response to changes in interest rates and creditworthiness.
37
RMK MULTI-SECTOR HIGH INCOME FUND, INC.
MANAGEMENT DISCUSSION OF FUND PERFORMANCE
RMK Multi-Sector High Income Fund, Inc. began trading on January 19, 2006 under the ticker symbol RHY after an initial public offering at $15 per share. The Fund had a total return of 7.38% for the period ended March 31, 2006, based on market price and reinvested dividends. The Fund had a total return of 2.27% for the period ended March 31, 2006, based on net asset value and reinvested dividends. From January 19, 2006 until March 31, 2006, the Lehman Brothers Ba U.S. High Yield Index1 had a total return of 0.97%.
The Fund paid a monthly dividend out of the net investment income of the Fund of $0.12 per share for the month of March.
In spite of a modest level of industry-wide outflows from corporate high yield funds, the high yield corporate market feels pretty good so far this year. With little change to underlying asset value, index performance has remained at coupon clipping levels (i.e. prices have held up). Importantly, economic conditions continue to remain strong causing the Fed to nudge interest rates ever higher. While most bondholders tend to run for the hills in an environment of increasing rates (sending most bond prices lower), we like the signals we are receiving. A strong economy is very good for corporate earnings, cash flows, balance sheets, equity valuations, and, in turn, high yield corporate bonds. Such conditions create more opportunities for corporate bond issuers to refinance or otherwise payoff their bonds, effectively placing an underlying bid for the bonds. In other words, steady bond prices. Unfortunately, strong bids create a scarcity of attractive investment opportunities and that is the challenge we face today. Opportunities exist in every market environment, they just may not be readily apparent.
We believe the domestic automotive sector is providing several attractive buying opportunities. This sector is a classic example of an industry in dire need of restructuring. Bound by uncompetitive labor, plant, and capital costs coupled with less than inspiring product offerings, many will have to restructure their contractual obligations either in or out of court. In many circumstances, the courts will be the only means by which the necessary fundamental changes to survive in the long run can be accomplished. Bankruptcy isn’t necessarily the end and, in many cases, is a new beginning. We like this space because turmoil convinces and, often times forces, weak hands to dispose of valuable assets at fire-sale prices. While these assets may not be worth “par” in bond parlance, they almost always have some value. The trick is to estimate that value and pay accordingly. Since we define risk by the price one pays, we believe the risk reward ratio is largely tilted in the buyer’s favor in selected automotive sector bonds. We have and plan to continue to trade opportunistically in this space.
38
RMK MULTI-SECTOR HIGH INCOME FUND, INC.
In the asset-backed and mortgage-backed arena, market technicals have made a dramatic about face over the last six weeks. The market was very heavy during the fourth quarter of 2005 with very few buyers willing to commit to new positions at the close of a very difficult year. However, beginning in February the demand for “BBB” to “B” floating rate asset-backed bonds picked up dramatically. The prospect of continued rate hikes from the Federal Reserve and the lack of available yield in the fixed income market have forced investors into some of the more “off the run” issues that we have used effectively in the high income fund. We expect floating rate assets to continue to contribute to our net asset value stability and current yield during the next 3 to 6 months as short term rates push higher. Our challenge will be to find enough suitable fixed rate assets as this interest rate cycle nears the point where the Federal Reserve will begin lowering rates.
James C. Kelsoe, Jr., CFA
Senior Portfolio Manager
Morgan Asset Management, Inc.
Market forecasts provided in this report may not necessarily come to pass. There is no assurance that the Fund will achieve its investment objectives. These views are subject to change at any time based upon market or other conditions, and Morgan Asset Management, Inc. disclaims any responsibility to update such views. The Fund is subject to market risk, which include the possibilities that the market values of the securities owned by the Fund will decline or that shares of the Fund will trade at lower prices in the market. Accordingly, you can lose money investing in the Fund.
INDEX DESCRIPTION
| 1 | | The Lehman Brothers Ba U.S. High Yield Index covers the universe of fixed rate, non-investment grade debt. Pay-in-kind (PIK) bonds, Eurobonds, and debt issues from countries designated as emerging markets (e.g., Argentina, Brazil, Venezuela, etc.) are excluded, but Canadian and global bonds (SEC registered) of issuers in non-emerging countries are included. Original issue zeroes, step-up coupon structures, and 144As are also included. The index is unmanaged, and unlike the fund, is not affected by cashflows or trading and other expenses. It is not possible to invest directly in an index. |
39
RMK MULTI-SECTOR HIGH INCOME FUND, INC.
PORTFOLIO STATISTICS†
AS OF MARCH 31, 2006
| | |
Average Credit Quality | | BB- |
Current Yield | | 9.01% |
Yield to Maturity | | 13.21% |
Duration | | 3.22 Years |
Average Effective Maturity | | 4.29 Years |
Percentage of Leveraged Assets | | 0% |
Total Number of Holdings | | 174 |
| † | | The Fund’s composition is subject to change. |
CREDIT QUALITY†
AS OF MARCH 31, 2006
| | | | | | |
| % OF TOTAL INVESTMENTS | | % OF TOTAL INVESTMENTS |
AAA | | 1.0% | | B | | 11.3% |
A | | 0.6% | | CCC | | 15.8% |
BBB | | 20.2% | | C | | 0.6% |
BB | | 30.4% | | D | | 1.0% |
| | | | | Not Rated | | 19.1% |
| | | | | | |
|
| | | | | Total | | 100.0% |
| † | | The Fund’s composition is subject to change. |
ASSET ALLOCATION†
AS OF MARCH 31, 2006
| | |
| % OF TOTAL INVESTMENTS |
Corporate Bonds | | 26.5% |
Equipment Leases | | 20.2% |
Collateralized Mortgage Obligations | | 17.1% |
Home Equity Loans | | 15.0% |
Short Term Investments | | 5.6% |
Common Stock | | 5.2% |
Collateralized Debt Obligations | | 3.0% |
Preferred Stock | | 2.4% |
Mutual Funds | | 1.8% |
Certificate-Backed Obligations | | 1.7% |
Commercial Loans | | 1.5% |
| | |
|
Total | | 100.0% |
| | |
|
| † | | The Fund’s composition is subject to change. |
40
RMK MULTI-SECTOR HIGH INCOME FUND, INC.
NAV & MARKET PRICE HISTORY*
The graph below illustrates the net asset value and market price history of RMK Multi-Sector High Income Fund, Inc. (NYSE: RHY) from January 19, 2006 (commencement of investment operations) to March 31, 2006.
| * | | Net asset value is calculated every day that the New York Stock Exchange is open as of the close of trading (normally 4:00 p.m. Eastern Time) by taking the closing market value of all portfolio securities owned, cash and other assets, subtracting all liabilities, then dividing the result (total net assets) by the total number of shares outstanding. The market price is the last reported price at which a share of the Fund was sold on the New York Stock Exchange. |
41
RMK MULTI-SECTOR HIGH INCOME FUND, INC.
PERFORMANCE INFORMATION
| | | |
| | | AGGREGATE TOTAL RETURNS | |
| AS OF MARCH 31, 2006 | | COMMENCEMENT
OF INVESTMENT
OPERATIONS1 | |
| MARKET VALUE | | 7.38 | % |
| NET ASSET VALUE | | 2.27 | % |
| LEHMAN BROTHERS BA HIGH YIELD INDEX2 | | 0.97 | % |
Performance data quoted represents past performance which is no guarantee of future results. Please note that this performance data is for a very short period of time. Investment return and principal value will fluctuate so that an investor’s shares, when redeemed, may be worth more or less than their original cost. Fund performance changes over time and current performance may be lower or higher than what is stated. For the most recent performance, call 800-564-2188. Total returns assume an investment at the common share market price or net asset value at the beginning of the period, reinvestment of all dividends and distributions for the period in accordance with the Fund’s dividend reinvestment plan, and sale of all shares at the closing market price (excluding any commissions) or net asset value at the end of the period. Returns shown do not reflect the deduction of taxes that a shareholder would pay on Fund distributions or on the sale of Fund shares.
| 1 | | The Fund commenced investment operations on January 19, 2006. |
| 2 | | The Lehman Brothers Ba U.S. High Yield Index covers the universe of fixed rate, non-investment grade debt. Pay-in-kind (PIK) bonds, Eurobonds, and debt issues from countries designated as emerging markets (e.g., Argentina, Brazil, Venezuela, etc.) are excluded, but Canadian and global bonds (SEC registered) of issuers in non-emerging market countries are included. Original issue zeroes, step-up coupon structures, and 144As are also included. The index is unmanaged, and unlike the fund, is not affected by cashflows or trading and other expenses. It is not possible to invest directly in an index. |
42
RMK MULTI-SECTOR HIGH INCOME FUND, INC.
PORTFOLIOOF INVESTMENTS
MARCH 31, 2006
| | | | | | | | |
Principal
Amount | | | | Description | | Market
Value (b) |
| | Asset Backed Securities–Investment Grade–9.2% of Net Assets | | | |
| | | | | | Collateralized Debt Obligations–0.9% | | | |
| $ | 4,000,000 | | | | MKP CBO 5A E, 7.761% 1/6/46 (a) | | $ | 3,890,000 |
| | | | | | | |
|
|
| | | | | | Equipment Leases–3.6% | | | |
| | 6,678,132 | | | | Aerco Limited 2A A3, 5.209% 7/15/25 (a) | | | 5,759,889 |
| | 4,999,007 | | | | Aviation Capital 2000-1A A1, 5.229% 11/15/25 (a) | | | 4,236,658 |
| | 4,953,576 | | | | Aviation Capital 2005-3A C1, 8.068% 12/25/35 (a) | | | 4,965,960 |
| | 5,000,000 | | | | United Capital Aviation Trust 2005-1 B1A,
Zero Coupon Bond 7/15/31 (a) | | | 1,485,600 |
| | | | | | | |
|
|
| | | | | | | | | 16,448,107 |
| | | | | | | |
|
|
| | | | | | Home Equity Loans (Non-High Loan-To-Value)–4.7% | | | |
| | 1,500,000 | | | | Equifirst Mortgage 2004-1 N4, 10.000% 6/25/34 (a) | | | 1,501,170 |
| | 7,000,000 | | | | Indymac Residential 2005-C M11, 7.318% 10/25/35 | | | 5,600,000 |
| | 4,000,000 | | | | Merrill Lynch Mortgage 2005-ACR1 B4, 7.321% 6/28/35 (a) | | | 3,500,000 |
| | 3,250,000 | | | | Option One Mortgage 2004-2A N, 8.836% 11/25/34 (a) | | | 3,225,625 |
| | 2,700,000 | | | | Soundview 2005-1N N2, 6.413% 4/25/35 (a) | | | 2,588,625 |
| | 3,000,000 | | | | Soundview 2006-1 M10, 7.318% 2/25/36 (a) | | | 2,351,730 |
| | 3,000,000 | | | | Soundview 2006-1 M9, 7.318% 2/25/36 (a) | | | 2,531,250 |
| | | | | | | |
|
|
| | | | | | | | | 21,298,400 |
| | | | | | | |
|
|
| | | | | | Total Asset Backed Securities–Investment Grade
(cost $41,380,775) | | | 41,636,507 |
| | | | | | | |
|
|
| | Asset Backed Securities–Non-Investment Grade–32.1% of Net Assets | | | |
| | | | | | Certificate-Backed Obligations–1.7% | | | |
| | 5,950,000 | | | | Preferred Term Securities XX, 10.000% 3/22/38 (a) | | | 5,831,000 |
| | 2,000,000 | | | | Preferred Term Securities XXI, 10.000% 3/22/38 (a) | | | 1,960,000 |
| | | | | | | |
|
|
| | | | | | | | | 7,791,000 |
| | | | | | | |
|
|
| | | | | | Collateralized Debt Obligations–2.2% | | | |
| | 3,500,000 | | | | Goldentree Capital 2006-1A E, 10.940% 2/22/20 (a) | | | 3,334,100 |
| | 5,263,867 | | | | Hewett’s Island CDO 2005-1A D, 10.470% 8/9/17 (a) | | | 5,441,522 |
| | 1,000,000 | | | | Stanfield 2A D1, 10.700% 4/15/15 (a) | | | 995,000 |
| | | | | | | |
|
|
| | | | | | | | | 9,770,622 |
| | | | | | | |
|
|
| | | | | | Commercial Loans–1.5% | | | |
| | 5,528,648 | | | | Banc of America 2002-1A B, 8.900% 11/6/14 (a) | | | 5,321,324 |
| | 2,951,002 | | | | Lehman Brothers-UBS Commercial Mortgage 2001-C7 S,
5.868% 11/15/33 | | | 1,556,860 |
| | | | | | | |
|
|
| | | | | | | | | 6,878,184 |
| | | | | | | |
|
|
| | | | | | Equipment Leases–16.5% | | | |
| | 6,246,100 | | | | Aerco Limited 1X C1, 6.099% 7/15/23 | | | 2,342,288 |
| | 1,857,706 | | | | Aerco Limited 2A C2, 6.799% 7/15/25 (a) | | | 594,466 |
| | 15,000,000 | | | | Aircraft Finance Trust 1999-1A A1, 5.229% 5/15/24 | | | 10,350,000 |
43
RMK MULTI-SECTOR HIGH INCOME FUND, INC.
PORTFOLIOOF INVESTMENTS
MARCH 31, 2006
| | | | | | | | |
Principal
Amount | | | | Description | | Market
Value (b) |
| | Asset Backed Securities–Non-Investment Grade (continued) | | | |
| | | | | | Equipment Leases (continued) | | | |
| $ | 24,000,000 | | | | Airplanes Pass Through Trust 2001-1A A9, 5.299% 3/15/19 | | $ | 14,400,000 |
| | 3,585,626 | | | | Aviation Capital 2000-1A C1, 6.699% 11/15/25 (a) | | | 1,254,969 |
| | 2,283,150 | | | | Aviation Capital 2000-1I D1, 8.500% 11/15/25 (a) | | | 1,164,407 |
| | 2,475,555 | | | | DVI Receivables 1999-2 A4, 7.220% 11/13/07 | | | 1,448,199 |
| | 3,819,742 | | | | DVI Receivables 2001-2 A4, 4.613% 11/11/09 | | | 3,189,484 |
| | 4,801,303 | | | | DVI Receivables 2003-1 A3A, 5.220% 3/14/11 | | | 4,057,102 |
| | 18,000,000 | | | | Lease Investment Flight Trust 1 A1, 5.139% 7/15/31 | | | 12,870,000 |
| | 15,000,000 | | | | Pegasus Aviation Lease 1999-1A B1, 6.300% 3/25/29 (a) | | | 3,654,000 |
| | 5,317,204 | | | | Pegasus Aviation Lease 2000-1 A1, 5.443% 3/25/15 (a) | | | 3,296,666 |
| | 3,620,000 | | | | Pegasus Aviation Lease 2000-1 A2, 8.370% 3/25/30 (a) | | | 2,269,088 |
| | 15,000,000 | | | | Pegasus Aviation Lease 2001-1A A1, 5.178% 5/10/31 (a) | | | 8,700,000 |
| | 15,000,000 | | | | United Capital Aviation Trust 2005-1 B1B,
Zero Coupon Bond 7/15/31 (a) | | | 2,149,950 |
| | 63,000,000 | | | | United Capital Aviation Trust 2005-1 B2,
Zero Coupon Bond 7/15/31 (a) | | | 2,970,450 |
| | | | | | | |
|
|
| | | | | | | | | 74,711,069 |
| | | | | | | |
|
|
| | | | | | Home Equity Loans (Non-High Loan-To-Value)–10.2% | | | |
| | 3,000,000 | | | | Ace Securities 2005-HE6 B1, 7.818% 10/25/35 (a) | | | 2,239,500 |
| | 2,600,000 | | | | Equifirst Mortgage 2004-3 N3, 7.869% 12/25/34 (a) | | | 2,541,916 |
| | 1,600,000 | | | | Finance America NIM Trust 2004-3 N3, 8.000% 11/25/34 (a) | | | 1,568,496 |
| | 2,300,000 | | | | First Franklin Mortgage 2004-FF11 N2, 6.414% 1/25/35 (a) | | | 2,226,699 |
| | 700,000 | | | | Fremont Home Equity 2004-4 N4, 8.000% 3/25/35 (a) | | | 684,467 |
| | 3,000,000 | | | | Fremont Home Equity 2005-2 B3, 7.568% 6/25/35 (a) | | | 2,359,680 |
| | 8,500,000 | | | | Indymac Residential 2005-B M11, 8.318% 8/25/35 (a) | | | 7,012,500 |
| | 2,400,000 | | | | Meritage Asset Holdings NIM 2004-2 N6, 9.000% 1/25/35 (a) | | | 2,377,512 |
| | 4,000,000 | | | | Merrill Lynch Mortgage 2005-SL1 B5, 8.318% 1/25/35 (a) | | | 3,520,000 |
| | 800,000 | | | | Soundview 2004-W N3, 9.000% 1/25/35 (a) | | | 791,624 |
| | 1,500,000 | | | | Soundview 2005-1N N3, 8.500% 4/25/35 (a) | | | 1,475,865 |
| | 4,415,000 | | | | Soundview 2005-4 M11, 7.318% 3/25/36 (a) | | | 3,261,581 |
| | 5,375,000 | | | | Soundview 2005-A B2, 7.818% 4/25/35 (a) | | | 4,461,250 |
| | 850,000 | | | | Soundview 2005-W N4, 9.000% 1/25/35 (a) | | | 841,101 |
| | 12,798,000 | | | | Terwin Mortgage 2006-R2 A, 2.351% 12/26/36 | | | 10,837,858 |
| | | | | | | |
|
|
| | | | | | | | | 46,200,049 |
| | | | | | | |
|
|
| | | | | | Total Asset Backed Securities–Non-Investment Grade
(cost $144,574,772) | | | 145,350,924 |
| | | | | | | |
|
|
| | Corporate Bonds–Investment Grade–1.9% of Net Assets | | | |
| | | | | | Special Purpose Entity–1.9% | | | |
| | 5,000,000 | | | | Barton Springs 2005-1-C2, 8.000% 12/20/10 (a) | | | 4,425,000 |
| | 4,000,000 | | | | Duane Park I, Zero Coupon Bond, 6/27/16 (a) | | | 4,000,000 |
| | | | | | | |
|
|
| | | | | | Total Corporate Bonds–Investment Grade
($8,439,351) | | | 8,425,000 |
| | | | | | | |
|
|
44
RMK MULTI-SECTOR HIGH INCOME FUND, INC.
PORTFOLIOOF INVESTMENTS
MARCH 31, 2006
| | | | | | | | |
Principal
Amount | | | | Description | | Market
Value (b) |
| | Corporate Bonds–Non-Investment Grade–24.5% of Net Assets | | | |
| | | | | | Apparel–0.6% | | | |
| $ | 600,000 | | | | Anvil Knitwear, 10.875% 3/15/07 | | $ | 297,000 |
| | 2,500,000 | | | | Rafaella Apparel, 11.250% 6/15/11 (a) | | | 2,487,500 |
| | | | | | | |
|
|
| | | | | | | | | 2,784,500 |
| | | | | | | |
|
|
| | | | | | Appliances–1.0% | | | |
| | 4,750,000 | | | | Windmere-Durable, 10.000% 7/31/08 | | | 4,512,500 |
| | | | �� | | | |
|
|
| | | | | | Automotives–0.9% | | | |
| | 5,000,000 | | | | General Motors, 8.375% 7/15/33 | | | 3,662,500 |
| | 500,000 | | | | Ford Motor, 9.215% 9/15/21 | | | 400,000 |
| | | | | | | |
|
|
| | | | | | | | | 4,062,500 |
| | | | | | | |
|
|
| | | | | | Automotive Parts & Equipment–1.9% | | | |
| | 3,000,000 | | | | Dana Corporation, Zero Coupon Bond 3/15/10 in default (c) | | | 2,340,000 |
| | 1,000,000 | | | | Delphi Corporation, Zero Coupon Bond 5/1/29 in default (c) | | | 615,000 |
| | 1,500,000 | | | | Dura Operating, 9.000% 5/1/09 | | | 742,500 |
| | 1,150,000 | | | | Exide Technologies, 10.500% 3/15/13 (a) | | | 868,250 |
| | 2,500,000 | | | | Metaldyne Corp., 10.000% 11/1/13 | | | 2,337,500 |
| | 1,850,000 | | | | Metaldyne Corp., 11.000% 6/15/12 | | | 1,473,063 |
| | | | | | | |
|
|
| | | | | | | | | 8,376,313 |
| | | | | | | |
|
|
| | | | | | Basic Materials–3.0% | | | |
| | 1,850,000 | | | | Doe Run Resources, 11.750% 11/1/08 (a) | | | 1,628,000 |
| | 5,000,000 | | | | Edgen Acquisition, 9.875% 2/1/11 | | | 4,975,000 |
| | 3,300,000 | | | | Millar Western, 7.750% 11/15/13 | | | 2,541,000 |
| | 4,250,000 | | | | OM Group, 9.250% 12/15/11 | | | 4,398,750 |
| | | | | | | |
|
|
| | | | | | | | | 13,542,750 |
| | | | | | | |
|
|
| | | | | | Building & Construction–0.6% | | | |
| | 1,500,000 | | | | MMI Products, 11.250% 4/15/07 | | | 1,477,500 |
| | 1,800,000 | | | | Owens Corning, Zero Coupon Bond 8/1/18 in default | | | 1,444,500 |
| | | | | | | |
|
|
| | | | | | | | | 2,922,000 |
| | | | | | | |
|
|
| | | | | | Communications–0.7% | | | |
| | 1,000,000 | | | | Adelphia Communications, Zero Coupon Bond 10/1/10 in default (c) | | | 590,000 |
| | 2,700,000 | | | | Penton Media, 10.375% 6/15/11 | | | 2,450,250 |
| | | | | | | |
|
|
| | | | | | | | | 3,040,250 |
| | | | | | | |
|
|
| | | | | | Consulting Services–0.9% | | | |
| | 1,600,000 | | | | MSX International, 11.000% 10/15/07 | | | 1,536,000 |
| | 4,000,000 | | | | MSX International, 11.375% 1/15/08 | | | 2,640,000 |
| | | | | | | |
|
|
| | | | | | | | | 4,176,000 |
| | | | | | | |
|
|
| | | | | | Electronics–1.1% | | | |
| | 5,087,000 | | | | Motors and Gears, 10.750% 11/15/06 | | | 4,985,260 |
| | | | | | | |
|
|
45
RMK MULTI-SECTOR HIGH INCOME FUND, INC.
PORTFOLIOOF INVESTMENTS
MARCH 31, 2006
| | | | | | | | |
Principal
Amount | | | | Description | | Market
Value (b) |
| | Corporate Bonds–Non-Investment Grade (continued) | | | |
| | | | | | Finance–0.6% | | | |
| $ | 1,625,000 | | | | Banctec, 7.500% 6/1/08 | | $ | 1,163,890 |
| | 1,600,000 | | | | Citisteel USA, 12.480% 9/1/10 (a) | | | 1,640,000 |
| | | | | | | |
|
|
| | | | | | | | | 2,803,890 |
| | | | | | | |
|
|
| | | | | | Food–1.4% | | | |
| | 4,024,000 | | | | Di Giorgio Corp., 10.000% 6/15/07 | | | 3,873,100 |
| | 3,500,000 | | | | Merisant, 9.500% 7/15/13 | | | 2,415,000 |
| | | | | | | |
|
|
| | | | | | | | | 6,288,100 |
| | | | | | | |
|
|
| | | | | | Human Resources–0.6% | | | |
| | 2,725,000 | | | | Comforce Operating, 12.000% 12/1/07 | | | 2,728,406 |
| | | | | | | |
|
|
| | | | | | Industrial–4.2% | | | |
| | 2,175,000 | | | | Advanced Lighting Technologies, 11.000% 3/31/09 | | | 2,144,528 |
| | 6,825,000 | | | | Continental Global Group, 9.000% 10/1/08 | | | 6,825,000 |
| | 5,000,000 | | | | GSI Group, 12.000% 5/15/13 | | | 5,068,750 |
| | 6,000,000 | | | | Wolverine Tube, 10.500% 4/1/09 | | | 4,950,000 |
| | | | | | | |
|
|
| | | | | | | | | 18,988,278 |
| | | | | | | |
|
|
| | | | | | Manufacturing–1.0% | | | |
| | 3,153,000 | | | | BGF Industries, 10.250% 1/15/09 | | | 2,900,760 |
| | 2,000,000 | | | | JB Poindexter, 8.750% 3/15/14 | | | 1,590,000 |
| | | | | | | |
|
|
| | | | | | | | | 4,490,760 |
| | | | | | | |
|
|
| | | | | | Medical Products–0.7% | | | |
| | 5,825,000 | | | | Insight Health Services, 9.875% 11/1/11 | | | 3,203,750 |
| | | | | | | |
|
|
| | | | | | Retail–1.0% | | | |
| | 2,625,000 | | | | Jo-Ann Stores, 7.500% 3/1/12 | | | 2,303,438 |
| | 3,000,000 | | | | Uno Restaurant, 10.000% 2/15/11 (a) | | | 2,430,000 |
| | | | | | | |
|
|
| | | | | | | | | 4,733,438 |
| | | | | | | |
|
|
| | | | | | Special Purpose Entity–1.8% | | | |
| | 1,850,000 | | | | Altra Industrial Motion, 9.000% 12/1/11 (a) | | | 1,840,750 |
| | 1,000,000 | | | | Interactive Health, 7.250% 4/1/11 (a) | | | 780,000 |
| | 3,790,000 | | | | PAHC Holdings, Zero Coupon Bond 2/1/10** | | | 3,903,700 |
| | 1,600,000 | | | | Transmeridian Exploration, 12.000% 12/15/10 (a) | | | 1,612,000 |
| | | | | | | |
|
|
| | | | | | | | | 8,136,450 |
| | | | | | | |
|
|
| | | | | | Technology–0.7% | | | |
| | 3,575,000 | | | | Danka Business Systems, 11.000% 6/15/10 | | | 2,922,562 |
| | | | | | | |
|
|
| | | | | | Telecommunications–0.5% | | | |
| | 2,575,000 | | | | Securus Technologies, 11.000% 9/1/11 | | | 2,214,500 |
| | | | | | | |
|
|
| | | | | | Tobacco–0.8% | | | |
| | 5,970,000 | | | | North Atlantic Trading, 9.250% 3/1/12 | | | 3,820,800 |
| | | | | | | |
|
|
46
RMK MULTI-SECTOR HIGH INCOME FUND, INC.
PORTFOLIOOF INVESTMENTS
MARCH 31, 2006
| | | | | | | | |
Principal
Amount/
Shares | | | | Description | | Market
Value (b) |
| | Corporate Bonds–Non-Investment Grade (continued) | | | |
| | | | | | Travel–0.5% | | | |
| $ | 2,500,000 | | | | Worldspan Financial, 10.999% 2/15/11 | | $ | 2,162,500 |
| | | | | | | |
|
|
| | | | | | Total Corporate Bonds–Non-Investment Grade
($110,002,055) | | | 110,895,507 |
| | | | | | | |
|
|
| | Mortgage Backed Securities–Investment Grade–2.5% of Net Assets | | | |
| | | | | | Collateralized Mortgage Obligations–2.5% | | | |
| | 6,976,000 | | | | Aames Mortgage 2005-4 B3, 7.568% 10/25/35 | | | 5,371,520 |
| | 6,034,497 | | | | Sail Net Interest Margin Notes 2004-7A B, 6.750% 8/27/34 (a) | | | 5,941,084 |
| | | | | | | |
|
|
| | | | | | Total Mortgage Backed Securities–Investment Grade
($11,269,809) | | | 11,312,604 |
| | | | | | | |
|
|
| | Mortgage Backed Securities–Non-Investment Grade–14.4% of Net Assets | | | |
| | | | | | Collateralized Mortgage Obligations–14.4% | | | |
| | 1,600,000 | | | | First Franklin Mortgage 2004-FF2 N4, 10.000% 4/25/34 (a) | | | 1,602,752 |
| | 3,100,000 | | | | First Franklin Mortgage 2004-FFH4 N2, 8.000% 1/21/35 (a) | | | 3,032,203 |
| | 4,826,000 | | | | First Franklin Mortgage 2005-FFH4 B2, 6.818% 12/25/35 (a) | | | 3,679,825 |
| | 6,450,000 | | | | Greenwich 2005-3 N2, 2.000% 6/27/35 (a) | | | 3,999,000 |
| | 14,000,000 | | | | Greenwich 2005-4 N-2, Zero Coupon Bond, 7/27/45 (a) | | | 7,280,000 |
| | 5,000,000 | | | | Greenwich 2005-6A N2, 8.000% 11/27/45 (a) | | | 4,175,000 |
| | 4,175,757 | | | | Harborview Mortgage 2006-CB1 2B5, 6.568% 3/25/36 | | | 2,307,106 |
| | 1,997,330 | | | | Harborview Mortgage 2006-CB1 2B6, 6.568% 3/25/36 | | | 339,546 |
| | 6,000,000 | | | | Long Beach Asset Holdings 2005-WL1 N4, 7.500% 6/25/45 (a) | | | 5,495,640 |
| | 3,000,000 | | | | Long Beach Mortgage 2005-1 N4, 10.000% 2/25/35 (a) | | | 3,008,430 |
| | 5,000,000 | | | | Long Beach Mortgage 2006-2 B, 7.170% 3/25/36 (a) | | | 3,892,950 |
| | 7,022,000 | | | | Merrill Lynch Mortgage 2006-SL1 B5, 7.500% 9/25/36 (a) | | | 5,471,402 |
| | 10,000,000 | | | | Park Place Securities 2005-WCW2, 7.318% 7/25/35 (a) | | | 7,500,000 |
| | 4,788,000 | | | | Soundview 2005-OPT4, 7.318% 12/25/35 (a) | | | 3,611,971 |
| | 6,000,000 | | | | Structured Asset 2004-S2 B, 6.000% 6/25/34 (a) | | | 5,435,520 |
| | 6,000,000 | | | | Structured Asset 2004-S4 B3, 5.000% 12/25/34 (a) | | | 4,671,840 |
| | | | | | | |
|
|
| | | | | | Total Mortgage Backed Securities–Non-Investment Grade
(cost $65,173,476) | | | 65,503,185 |
| | | | | | | |
|
|
| | Common Stocks–5.2% of Net Assets | | | |
| | 21,500 | | | | Alpha Natural Resources, Inc. (c) | | | 497,510 |
| | 26,300 | | | | American Capital Strategies, Ltd. | | | 924,708 |
| | 27,900 | | | | Bois d’Arc Energy LLC (c) | | | 464,535 |
| | 32,200 | | | | Cascade Microtech, Inc. (c) | | | 421,498 |
| | 6,600 | | | | CEMEX, S.A. de C.V. | | | 430,848 |
| | 25,700 | | | | Citizens Communications Company | | | 341,039 |
| | 10,800 | | | | Companhia de Saneamento Básico do Estado de São Paulo (c) | | | 237,708 |
| | 37,300 | | | | Compton Petroleum Corporation (c) | | | 478,932 |
| | 35,500 | | | | Consolidated Communications Illinois Holdings, Inc. (c) | | | 577,585 |
47
RMK MULTI-SECTOR HIGH INCOME FUND, INC.
PORTFOLIOOF INVESTMENTS
MARCH 31, 2006
| | | | | | | |
| Shares | | | | Description | | Market
Value (b) |
| Common Stocks (continued) | | | |
| 7,300 | | | | Dell Inc. (c)(d) | | $ | 217,248 |
| 10,000 | | | | Direct General Corporation | | | 170,100 |
| 28,400 | | | | Dollar General Corporation (d) | | | 501,828 |
| 10,700 | | | | EnCana Corporation (d) | | | 500,011 |
| 5,800 | | | | ENSCO International Incorporated (d) | | | 298,410 |
| 19,100 | | | | Enterprise Partners Products L.P. | | | 471,579 |
| 2,000 | | | | FairPoint Communications, Inc. | | | 27,640 |
| 5,800 | | | | Fording Canadian Coal Trust | | | 220,342 |
| 8,700 | | | | Fred’s Inc. | | | 115,362 |
| 19,200 | | | | Global Industries, Ltd. (c) | | | 278,208 |
| 25,900 | | | | Infocrossing, Inc. (c) | | | 312,095 |
| 113,827 | | | | InPhonic, Inc. (c) | | | 795,651 |
| 66,800 | | | | International Coal Group, Inc. (c) | | | 650,632 |
| 8,500 | | | | Iowa Telecommunications Services, Inc. | | | 162,180 |
| 9,400 | | | | Kinder Morgan Energy Partners, L.P. | | | 452,892 |
| 7,000 | | | | KKR Financial Corp. (c) | | | 157,010 |
| 2,700 | | | | L-3 Communications Holdings, Inc. | | | 231,633 |
| 8,700 | | | | Lone Star Technologies, Inc. (c)(d) | | | 482,067 |
| 16,000 | | | | Macquarie Infrastructure Company Trust | | | 520,000 |
| 4,800 | | | | Magellan Midstream Partners, L.P. | | | 157,776 |
| 10,200 | | | | Masco Corporation | | | 331,398 |
| 75,200 | | | | MCG Capital Corporation | | | 1,061,072 |
| 17,800 | | | | Mittal Steel Company N.V. | | | 671,950 |
| 15,000 | | | | Motorola, Inc. | | | 343,650 |
| 40,500 | | | | Nam Tai Electronics, Inc. | | | 927,855 |
| 34,300 | | | | Ness Technologies, Inc. (c) | | | 431,837 |
| 4,300 | | | | PACCAR Inc. | | | 303,064 |
| 3,200 | | | | PetroChina Company Limited | | | 335,840 |
| 6,600 | | | | Philippine Long Distance Telephone Company | | | 247,962 |
| 26,200 | | | | Regal Entertainment Group | | | 492,822 |
| 10,800 | | | | Sasol Limited | | | 408,564 |
| 20,000 | | | | Ship Finance International Limited | | | 343,200 |
| 2,000 | | | | Stone Energy Corporation (c)(d) | | | 88,260 |
| 9,100 | | | | Superior Energy Services, Inc. (c) | | | 243,789 |
| 61,000 | | | | Taiwan Semiconductor Manufacturing Company Ltd. | | | 613,660 |
| 65,500 | | | | Technology Investment Capital Corporation (c) | | | 952,370 |
| 5,800 | | | | Teva Pharmaceutical Industries Limited | | | 238,844 |
| 4,000 | | | | The Timken Company | | | 129,080 |
| 7,400 | | | | Tidewater Inc. (d) | | | 408,702 |
| 42,700 | | | | TOP Tankers Inc. | | | 555,100 |
| 56,500 | | | | Trustreet Properties Inc. | | | 858,235 |
| 8,300 | | | | Tsakos Energy Navigation Limited | | | 325,194 |
| 2,000 | | | | Unit Corporation (c)(d) | | | 111,500 |
48
RMK MULTI-SECTOR HIGH INCOME FUND, INC.
PORTFOLIOOF INVESTMENTS
MARCH 31, 2006
| | | | | | | |
| Shares | | | | Description | | Market
Value (b) |
| Common Stocks (continued) | | | |
| 12,900 | | | | Valero Energy Corporation (d) | | $ | 771,162 |
| 8,900 | | | | Valero L.P. | | | 450,785 |
| 10,800 | | | | Washington Mutual, Inc. | | | 460,296 |
| 14,500 | | | | Willbros Group, Inc. (c) | | | 294,930 |
| | | | | | |
|
|
| | | | | Total Common Stocks
(cost $22,865,070) | | | 23,498,148 |
| | | | | | |
|
|
| Preferred Stocks–2.3% of Net Assets | | | |
| 40,000 | | | | Baker Street Funding (a)(c) | | | 3,880,000 |
| 200,000 | | | | Endurance Specialty Holdings Ltd. | | | 4,844,000 |
| 2,000 | | | | Marquette Park CLO (a) | | | 1,960,000 |
| | | | | | |
|
|
| | | | | Total Preferred Stocks
(cost $10,744,015) | | | 10,684,000 |
| | | | | | |
|
|
| Mutual Funds–1.8% of Net Assets | | | |
| 85,000 | | | | iShares Russell 3000 Value Index Fund | | | 8,131,950 |
| | | | | | |
|
|
| | | | | Total Mutual Funds
(cost $7,888,349) | | | 8,131,950 |
| | | | | | |
|
|
| Eurodollar Time Deposits–5.5% of Net Assets | | | |
| | | | | State Street Bank & Trust Company Eurodollar time deposits dated March 31, 2006 3.750% maturing at $25,141,222 on April 1, 2006 | | | 25,138,603 |
| | | | | | |
|
|
| | | | | Total Investments–99.4% of Net Assets
(cost $447,476,275) | | | 450,576,428 |
| | | | | | |
|
|
| | | | | Other Assets and Liabilities, net–0.6% of Net Assets | | | 2,946,648 |
| | | | | | |
|
|
| | | | | Net Assets | | $ | 453,523,076 |
| | | | | | |
|
|
49
RMK MULTI-SECTOR HIGH INCOME FUND, INC.
PORTFOLIOOF INVESTMENTS
MARCH 31, 2006
Call Options Written
March 31, 2006
| | | | | | | |
Number of
Contracts | | | | Common Stocks/Expiration Date/Exercise Price | | Market
Value (b) |
| 38 | | | | Dell Inc./April/30 | | $ | 1,748 |
| 4 | | | | Dollar General Corporation/April/17.50 | | | 180 |
| 10 | | | | EnCana Corporation/April/50 | | | 450 |
| 8 | | | | ENSCO International Incorporated/April/50 | | | 2,120 |
| 25 | | | | Lone Star Technologies, Inc./April/55 | | | 5,625 |
| 20 | | | | Stone Energy Corporation/April/45 | | | 3,400 |
| 22 | | | | Tidewater Inc./April/55 | | | 3,960 |
| 20 | | | | Unit Corporation/April/55 | | | 3,600 |
| 6 | | | | Valero Energy Corporation/April/60 | | | 1,050 |
| | | | | | |
|
|
| | | | | Total Call Options Written
(Premiums Received $18,949) | | $ | 22,133 |
| | | | | | |
|
|
| (a) | | Securities sold within the terms of a private placement memorandum, exempt from registration under Rule 144A under the Securities Act of 1933, as amended, and may be resold in transactions exempt from registration, normally to qualified institutional buyers. Pursuant to guidelines adopted by the Board of Directors, these issues have been determined to be liquid by Morgan Asset Management, Inc., the Fund’s investment adviser. |
| (b) | | See Note 2 of accompanying Notes to Financial Statements regarding valuation of securities. |
| (c) | | These securities are non-income producing. |
| (d) | | A portion or all of the security is pledged as collateral for call options written. |
| ** | | This security is payment-in-kind. |
(See Accompanying Notes to the Financial Statements)
50
RMK STRATEGIC INCOME FUND, INC.
OBJECTIVE & STRATEGY
RMK Strategic Income Fund, Inc. seeks a high level of current income. The Fund seeks capital growth as a secondary investment objective when consistent with its primary investment objective. The Fund invests in a diversified portfolio of securities that offers attractive yield and capital appreciation potential and consists primarily of debt securities and secondarily of equity securities. The Adviser will continually analyze the markets for income-producing securities and will periodically reallocate the Fund’s investments among various fixed-income and equity asset classes and between investment grade and below investment grade securities (commonly referred to as “junk bonds”) to pursue its investment objectives. As a result, a majority of the Fund’s total assets may be invested in investment grade securities at some times and in below investment grade securities at other times. The Fund invests in a wide range of debt securities, including corporate bonds, mortgage- and asset-backed securities, and municipal and foreign government obligations, as well as securities of companies in bankruptcy reorganization proceedings or otherwise in the process of debt restructuring. The Fund also invests in other securities providing the potential for high income or a combination of high income and capital growth. (Below investment grade debt securities are rated Ba1 or lower by Moody’s Investors Service, Inc., rated BB+ or lower by Standard & Poor’s Ratings Group or Fitch Ratings Ltd., comparably rated by another nationally recognized statistical rating organization, or not rated by any rating agency but determined by the Fund’s investment adviser to be of comparable quality.)
INVESTMENT RISKS: Bond funds tend to experience smaller fluctuations in value than stock funds. However, investors in any bond fund should anticipate fluctuations in price. Bond prices and the value of bond funds decline as interest rates rise. Longer-term funds generally are more vulnerable to interest rate risk than shorter-term funds. Below investment grade bonds involve greater credit risk, which is the risk that the issuer will not make interest or principal payments when due. An economic downturn or period of rising interest rates could adversely affect the ability of issuers, especially issuers of below investment grade debt, to service primary obligations and an unanticipated default could cause the Fund to experience a reduction in value of its shares. The value of U.S. and foreign equity securities in which the Fund invests will change based on changes in a company’s financial condition and in overall market and economic conditions. Use of leverage may increase the likelihood that the net asset value of the Fund and market value of its common shares will be more volatile, and the yield and total return to common stockholders will tend to fluctuate more in response to changes in interest rates and creditworthiness.
51
RMK STRATEGIC INCOME FUND, INC.
MANAGEMENT DISCUSSIONOF FUND PERFORMANCE
For the six months and the year ended March 31, 2006, RMK Strategic Income Fund, Inc. had total returns of 7.11% and 22.60%, respectively, based on market price and reinvested dividends. For the six months and the year ended March 31, 2006, the Fund had total returns of 4.26% and 9.95%, respectively, based on net asset value and reinvested dividends. For the six months and the year ended March 31, 2006, the Lehman Brothers Ba U.S. High Yield Index1 had total returns of 2.44% and 6.83%, respectively. The Fund’s strong performance was primarily due to the Fund’s relative yield advantage as evidenced by the monthly dividend distributions and the relative net asset value stability produced by the Fund’s allocation to a wide variety of asset types. The Fund had an above average yield due to three main factors: an efficient leverage package which allowed the Fund to have additional money invested with limited borrowing costs; an increasing interest rate environment and our overweighting in the floating rate securities sector; and a prospectus that gives the management team latitude to look at sectors that are not in the index.
During the fiscal year ended March 31, 2006, the Fund paid a total income distribution of $2.27 per share, which was composed of total regular monthly dividends for the year of $1.80 per share and special dividend distributions in December 2005 of $0.47 per share. For the entire fiscal year, the Fund paid monthly dividends of $0.15 per share.
In spite of a modest level of industry-wide outflows from corporate high yield funds, the high yield corporate market feels pretty good so far this year. With little change to underlying asset value, index performance has remained at coupon clipping levels (i.e. prices have held up). Importantly, economic conditions continue to remain strong causing the Fed to nudge interest rates ever higher. A strong economy is very good for corporate earnings, cash flows, balance sheets, equity valuations, and, in turn, high yield corporate bonds. Such conditions create more opportunities for corporate bond issuers to refinance or otherwise payoff their bonds, effectively placing an underlying bid for the bonds. In other words, steady bond prices. Unfortunately, strong bids create a scarcity of attractive investment opportunities and that is the challenge we face today. Opportunities exist in every market environment, they just may not be readily apparent.
We believe the domestic automotive sector is providing several attractive buying opportunities. This sector is a classic example of an industry in dire need of restructuring. Bound by uncompetitive labor, plant, and capital costs coupled with less than inspiring product offerings, many will have to restructure their contractual obligations either in or out of court. In many circumstances, the courts will be the
52
RMK STRATEGIC INCOME FUND, INC.
only means by which the necessary fundamental changes to survive in the long run can be accomplished. Bankruptcy isn’t necessarily the end and, in many cases, is a new beginning. We like this space because turmoil convinces and, often times forces, weak hands to dispose of valuable assets at fire-sale prices. While these assets may not be worth “par” in bond parlance, they almost always have some value. The trick is to estimate that value and pay accordingly. Since we define risk by the price one pays, we believe the risk reward ratio is largely tilted in the buyer’s favor in selected automotive sector bonds. We have and plan to continue to trade opportunistically in this space.
In the asset-backed and mortgage-backed arena, market technicals have made a dramatic about face over the last six weeks. The market was very heavy during the fourth quarter of 2005 with very few buyers willing to commit to new positions at the close of a very difficult year. However, beginning in February the demand for “BBB” to “B” floating rate asset-backed bonds picked up dramatically. The prospect of continued rate hikes from the Federal Reserve and the lack of available yield in the fixed income market have forced investors into some of the more “off the run” issues that we have used effectively in the high income fund. We expect floating rate assets to continue to contribute to our net asset value stability and current yield during the next 3 to 6 months as short term rates push higher. Our challenge will be to find enough suitable fixed rate assets as this interest rate cycle nears the point where the Federal Reserve will begin lowering rates.
James C. Kelsoe, Jr., CFA
Senior Portfolio Manager
Morgan Asset Management, Inc.
Market forecasts provided in this report may not necessarily come to pass. There is no assurance that the Fund will achieve its investment objectives. These views are subject to change at any time based upon market or other conditions, and Morgan Asset Management, Inc. disclaims any responsibility to update such views. The Fund is subject to market risk, which include the possibilities that the market values of the securities owned by the Fund will decline or that shares of the Fund will trade at lower prices in the market. Accordingly, you can lose money investing in the Fund.
INDEX DESCRIPTION
| 1 | | The Lehman Brothers Ba U.S. High Yield Index covers the universe of fixed rate, non-investment grade debt. Pay-in-kind (PIK) bonds, Eurobonds, and debt issues from countries designated as emerging markets (e.g., Argentina, Brazil, Venezuela, etc.) are excluded, but Canadian and global bonds (SEC registered) of issuers in non-emerging countries are included. Original issue zeroes, step-up coupon structures, and 144As are also included. The index is unmanaged, and unlike the fund, is not affected by cashflows or trading and other expenses. It is not possible to invest directly in an index. |
53
RMK STRATEGIC INCOME FUND, INC.
PORTFOLIO STATISTICS†
AS OF MARCH 31, 2006
| | |
Average Credit Quality | | BB |
Current Yield | | 10.77% |
Yield to Maturity | | 12.59% |
Duration | | 3.43 Years |
Average Effective Maturity | | 4.57 Years |
Percentage of Leveraged Assets | | 26% |
Total Number of Holdings | | 267 |
| † | | The Fund’s composition is subject to change. |
CREDIT QUALITY†
AS OF MARCH 31, 2006
| | | | | | |
| %OFTOTALINVESTMENTS | | %OFTOTALINVESTMENTS |
AAA | | 3.0% | | B | | 9.5% |
AA | | 2.7% | | CCC | | 21.6% |
A | | 2.9% | | CC | | 0.7% |
BBB | | 22.7% | | D | | 1.0% |
BB | | 19.6% | | Not Rated | | 16.3% |
| | | | | | |
|
| | | | | Total | | 100.0% |
| † | | The Fund’s composition is subject to change. |
ASSET ALLOCATION†
AS OF MARCH 31, 2006
| | |
| %OFTOTALINVESTMENTS |
Corporate Bonds | | 24.9% |
Collateralized Mortgage Obligations | | 15.1% |
Common Stock | | 13.9% |
Equipment Leases | | 13.8% |
Home Equity Loans | | 10.3% |
Collateralized Debt Obligations | | 7.4% |
Short Term Investments | | 4.2% |
Manufactured Housing Loans | | 2.8% |
Franchise Loans | | 1.9% |
Certificate-Backed Obligations | | 1.4% |
Preferred Stock | | 1.4% |
Other | | 1.4% |
Commercial Loans | | 0.9% |
Government Agency Securities | | 0.6% |
| | |
|
Total | | 100.0% |
| † | | The Fund’s composition is subject to change. |
54
RMK STRATEGIC INCOME FUND, INC.
NAV & MARKET PRICE HISTORY*
The graph below illustrates the net asset value and market price history of RMK Strategic Income Fund, Inc. (NYSE: RSF) from March 18, 2004 (commencement of investment operations) to March 31, 2006.
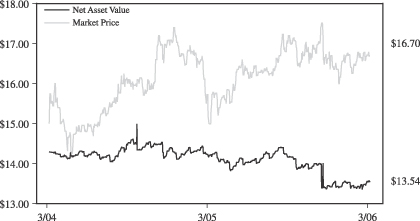
| * | | Net asset value is calculated every day that the New York Stock Exchange is open as of the close of trading (normally 4:00 p.m. Eastern Time) by taking the closing market value of all portfolio securities owned, cash and other assets, subtracting all liabilities, then dividing the result (total net assets) by the total number of shares outstanding. The market price is the last reported price at which a share of the Fund was sold on the New York Stock Exchange. |
55
RMK STRATEGIC INCOME FUND, INC.
PERFORMANCE INFORMATION
| | | | | | | | | |
| | | AVERAGE ANNUAL TOTAL RETURNS | |
| AS OF MARCH 31, 2006 | | SIX
MONTHS* | | | 1
YEAR | | | COMMENCEMENT
OF INVESTMENT
OPERATIONS1 | |
| MARKET VALUE | | 7.11 | % | | 22.60 | % | | 19.36 | % |
| NET ASSET VALUE | | 4.26 | % | | 9.95 | % | | 10.13 | % |
LEHMAN BROTHERS BA HIGH YIELD INDEX2 | | 2.44 | % | | 6.83 | % | | 5.41 | % |
| * | | Not annualized for periods less than one year. |
Performance data quoted represents past performance which is no guarantee of future results. Investment return and principal value will fluctuate so that an investor’s shares, when redeemed, may be worth more or less than their original cost. Fund performance changes over time and current performance may be lower or higher than what is stated. For the most recent performance, call 800-564-2188. Total returns assume an investment at the common share market price or net asset value at the beginning of the period, reinvestment of all dividends and distributions for the period in accordance with the Fund’s dividend reinvestment plan, and sale of all shares at the closing market price (excluding any commissions) or net asset value at the end of the period. Returns shown do not reflect the deduction of taxes that a shareholder would pay on Fund distributions or on the sale of Fund shares.
| 1 | | The Fund commenced investment operations on March 18, 2004. |
| 2 | | The Lehman Brothers Ba U.S. High Yield Index covers the universe of fixed rate, non-investment grade debt. Pay-in-kind (PIK) bonds, Eurobonds, and debt issues from countries designated as emerging markets (e.g., Argentina, Brazil, Venezuela, etc.) are excluded, but Canadian and global bonds (SEC registered) of issuers in non-emerging countries are included. Original issue zeroes, step-up coupon structures, and 144As are also included. The index is unmanaged, and unlike the fund, is not affected by cashflows or trading and other expenses. It is not possible to invest directly in an index. |
56
RMK STRATEGIC INCOME FUND, INC.
PORTFOLIOOF INVESTMENTS
MARCH 31, 2006
| | | | | | | | |
Principal
Amount | | | | Description | | Market
Value (b) |
| | Asset Backed Securities–Investment Grade–18.7% of Net Assets | | | |
| | | | | | Collateralized Debt Obligations–7.3% | | | |
| $ | 10,000,000 | | | | Diversified Asset Securitization 1A A1, 7.873% 9/15/35 | | $ | 8,758,665 |
| | 4,000,000 | | | | E-Trade 2004-1A COM1, 2.000% 1/10/40 | | | 3,881,250 |
| | 4,000,000 | | | | GRAND 2005-1A C0MB, 1.913% 4/5/46 | | | 3,760,000 |
| | 3,000,000 | | | | MKP CBO 5A E, 7.761% 1/6/46 (a) | | | 2,917,500 |
| | 2,000,000 | | | | Orchid Structured Finance 2006-3A E, 8.620% 1/6/46 (a) | | | 2,000,000 |
| | 3,000,000 | | | | Palmer Square 2A CN, Zero Coupon Bond 11/2/45 (a) | | | 2,985,000 |
| | 2,400,000 | | | | Restructured Asset Backed 2003-3A A3, 5.378% 1/29/22 (a) | | | 2,036,737 |
| | | | | | | |
|
|
| | | | | | | | | 26,339,152 |
| | | | | | | |
|
|
| | | | | | Credit Cards–1.2% | | | |
| | 5,000,000 | | | | North Street 2000-1A B, 5.293% 10/30/11 (a) | | | 4,400,000 |
| | | | | | | |
|
|
| | | | | | Equipment Leases–2.7% | | | |
| | 5,500,000 | | | | Aerco Limited 2A A3, 5.209% 7/15/25 (a) | | | 4,525,628 |
| | 18,000,000 | | | | Airplanes Repackaging 2004-1A B, Zero Coupon Bond 6/16/31 (a) | | | 1,170,000 |
| | 3,000,000 | | | | Aviation Capital 2005-3A C1, 8.068% 12/25/35 (a) | | | 2,979,576.00 |
| | 3,000,000 | | | | United Capital Aviation Trust 2005-1 B1A,
Zero Coupon Bond 7/15/31 (a) | | | 891,360 |
| | | | | | | |
|
|
| | | | | | | | | 9,566,564 |
| | | | | | | |
|
|
| | | | | | Franchise Loans–2.4% | | | |
| | 15,000,000 | | | | Atherton Franchisee 1999-A A2, 7.230% 4/15/12 (a) | | | 7,282,621 |
| | | | | | FMAC Loan Trust 1997-C AX, 2.264% 12/15/19
interest-only strips (a) | | | 1,580,795 |
| | | | | | | |
|
|
| | | | | | | | | 8,863,416 |
| | | | | | | |
|
|
| | | | | | Home Equity Loans (Non-High Loan-To-Value)–4.6% | | | |
| | 4,000,000 | | | | Aames Mortgage Trust 2001-3 B, 7.130% 11/25/31 | | | 879,360 |
| | 3,450,000 | | | | Ace Securities 2004-HE2 B1, 8.318% 10/25/34 | | | 3,243,000 |
| | 2,000,000 | | | | Ace Securities 2004-HE4 M11, 8.318% 12/25/34 | | | 1,871,880 |
| | 1,487,000 | | | | Ace Securities 2004-HS1 M6, 8.318% 2/25/34 | | | 1,495,283 |
| | 3,000,000 | | | | Asset Backed Securities 2002-HE3 M4, 7.749% 10/15/32 | | | 2,296,628 |
| | 1,000,000 | | | | Asset Backed Securities 2005-HE1 M10, 7.818% 3/25/35 | | | 929,060 |
| | 2,000,000 | | | | Meritage Mortgage, 7.818% 1/25/36 (a) | | | 1,620,620 |
| | 3,000,000 | | | | Merrill Lynch Mortgage 2005-ACR1 B4, 7.321% 6/28/35 (a) | | | 2,625,000 |
| | 1,700,000 | | | | NovaStar Home Equity 2004-3 B4, 8.318% 12/25/34 | | | 1,649,000 |
| | | | | | | |
|
|
| | | | | | | | | 16,609,831 |
| | | | | | | |
|
|
| | | | | | Manufactured Housing Loans–0.5% | | | |
| | 2,000,000 | | | | Mid-State Trust 2005-1 B, 7.758% 1/15/40 | | | 1,851,160 |
| | | | | | | |
|
|
| | | | | | Total Asset Backed Securities–Investment Grade
(cost $67,050,118) | | | 67,630,123 |
| | | | | | | |
|
|
57
RMK STRATEGIC INCOME FUND, INC.
PORTFOLIOOF INVESTMENTS
MARCH 31, 2006
| | | | | | | | |
Principal
Amount | | | | Description | | Market
Value (b) |
| | Asset Backed Securities–Non-Investment Grade–35.9% of Net Assets | | | |
| | | | | | Certificate-Backed Obligations–1.9% | | | |
| $ | 1,000,000 | | | | Preferred Term Securities II, 12.000% 5/22/33 (a) | | $ | 909,320 |
| | 5,000,000 | | | | Preferred Term Securities XIX, 6.070% 12/22/35 (a) | | | 4,983,350 |
| | 1,000,000 | | | | Preferred Term Securities XXI, 10.000% 3/22/38 (a) | | | 980,000 |
| | | | | | | |
|
|
| | | | | | | | | 6,872,670 |
| | | | | | | |
|
|
| | | | | | Collateralized Debt Obligations–2.9% | | | |
| | 1,500,000 | | | | Cigna CDO Limited 2000-1A B1, 6.110% 8/28/12 (a) | | | 1,249,111 |
| | 3,000,000 | | | | Diversified Asset Securitization 2 1A B1, 9.712% 9/15/35 (a) | | | 1,432,500 |
| | 2,000,000 | | | | Goldentree Capital 2006-1A E, 10.940% 2/22/20 (a) | | | 1,905,200 |
| | 3,000,000 | | | | Hewett’s Island 2004-1A COM, 9.000% 12/15/16 | | | 2,882,104 |
| | 1,950,000 | | | | MKP 4A CS, 2.000% 7/12/40 (a) | | | 1,918,535 |
| | 1,000,000 | | | | Stanfield 2A D1, 10.700% 4/15/15 (a) | | | 995,000 |
| | | | | | | |
|
|
| | | | | | | | | 10,382,450 |
| | | | | | | |
|
|
| | | | | | Commercial Loans–1.2% | | | |
| | 2,000,000 | | | | CS First Boston 1998-C2 H, 6.750% 11/11/30 (a) | | | 1,606,160 |
| | 2,000,000 | | | | CS First Boston Mortgage 1995-WF1 G, 8.570% 12/21/27 | | | 117,528 |
| | 2,000,000 | | | | Lehman Brothers-UBS Commercial Mortgage 2001-C7 S, 5.868% 11/15/33 | | | 1,037,908 |
| | 3,000,000 | | | | Merrill Lynch Mortgage 1998-C1 F, 6.250% 11/15/26 | | | 1,741,470 |
| | | | | | | |
|
|
| | | | | | | | | 4,503,066 |
| | | | | | | |
|
|
| | | | | | Equipment Leases–16.4% | | | |
| | 1,000,000 | | | | Aerco Limited 1A C1, 6.099% 7/15/23 (a) | | | 321,229 |
| | 5,000,000 | | | | Aerco Limited 1X C1, 6.099% 7/15/23 | | | 1,673,063.00 |
| | 5,500,000 | | | | Aerco Limited 2A B2, 5.799% 7/15/25 (a) | | | 1,792,166 |
| | 2,500,000 | | | | Aerco Limited 2A C2, 6.799% 7/15/25 (a) | | | 743,082 |
| | 11,000,000 | | | | Aircraft Finance Trust 1999-1A A1, 5.229% 5/15/24 | | | 7,590,000 |
| | 19,000,000 | | | | Airplanes Pass Through Trust 2001-1A A9, 5.299% 3/15/19 | | | 11,400,000 |
| | 8,000,000 | | | | DVI Receivables 2001-2 A3, 3.519% 11/8/31 | | | 1,036,391 |
| | 5,500,000 | | | | DVI Receivables 2001-2 A4, 4.613% 11/11/09 | | | 1,463,188 |
| | 16,750,000 | | | | DVI Receivables 2002-1 A3A, 5.070% 6/11/10 | | | 3,836,164 |
| | 4,000,000 | | | | DVI Receivables 2003-1 A3A, 5.220% 3/14/11 | | | 2,028,551 |
| | 16,000,000 | | | | Lease Investment Flight Trust 1 A1, 5.139% 7/15/31 | | | 11,440,000 |
| | 2,000,000 | | | | Lease Investment Flight Trust 1 A2, 5.179% 7/15/31 | | | 1,430,000 |
| | 13,000,000 | | | | Pegasus Aviation Lease 1999-1A A2, 6.300% 3/25/29 (a) | | | 5,797,350 |
| | 4,000,000 | | | | Pegasus Aviation Lease 2000-1 A1, 5.443% 3/25/15 (a) | | | 1,883,809 |
| | 12,000,000 | | | | Pegasus Aviation Lease 2001-1A A1, 5.178% 5/10/31 (a) | | | 6,960,000 |
| | | | | | | |
|
|
| | | | | | | | | 59,394,993 |
| | | | | | | |
|
|
| | | | | | Franchise Loans–0.2% | | | |
| | 1,000,000 | | | | Falcon Franchise Loan 2001-1 F, 6.500% 1/5/23 | | | 593,030 |
| | | | | | FMAC Loan Trust 1998-BA AX, 2.259% 11/15/20
interest-only strips (a) | | | 338,181 |
| | | | | | | |
|
|
| | | | | | | | | 931,211 |
| | | | | | | |
|
|
58
RMK STRATEGIC INCOME FUND, INC.
PORTFOLIOOF INVESTMENTS
MARCH 31, 2006
| | | | | | | | |
Principal
Amount | | | | Description | | Market
Value (b) |
| | Asset Backed Securities–Non-Investment Grade (continued) | | | |
| | | | | | Home Equity Loans (Non-High Loan-To-Value)–9.6% | | | |
| $ | 8,892,000 | | | | Ace Securities 2004-HE1 B, 8.318% 2/25/34 | | $ | 7,380,360 |
| | 2,000,000 | | | | Ace Securities 2004-HE4 B, 8.318% 12/25/34 (a) | | | 1,680,000 |
| | 2,057,000 | | | | Ace Securities 2004-RM1 B3, 8.318% 7/25/34 (a) | | | 1,789,590 |
| | 2,000,000 | | | | Ace Securities 2005-HE5 B2, 7.818% 8/25/35 (a) | | | 1,490,000 |
| | 2,000,000 | | | | Ace Securities 2005-HE6 B1, 7.818% 10/25/35 (a) | | | 1,493,000 |
| | 5,615,000 | | | | Amresco Residential Securities 1999-1 B, 8.818% 11/25/29 | | | 1,687,290 |
| | 3,000,000 | | | | Delta Funding Home Equity 2000-4 B, 7.150% 2/15/31 | | | 244,062 |
| | 2,100,000 | | | | Equifirst Mortgage 2004-2 B1, 8.218% 7/25/34 (a) | | | 1,848,000 |
| | 2,732,000 | | | | Equifirst Mortgage 2004-2 B2, 8.218% 7/25/34 (a) | | | 2,308,540 |
| | 1,000,000 | | | | Equifirst Mortgage 2005-1 B3, 8.068% 4/25/35 (a) | | | 822,500 |
| | 1,000,000 | | | | Equifirst Mortgage 2005-1 B4, 8.068% 4/25/35 (a) | | | 820,000 |
| | 3,000,000 | | | | Meritage Asset Holdings NIM 2005-2 N4, 7.500% 11/25/35 (a) | | | 2,259,000 |
| | 2,000,000 | | | | Merrill Lynch Mortgage 2005-SL1 B5, 8.318% 6/25/35 (a) | | | 1,760,000 |
| | 3,000,000 | | | | Terwin Mortgage 2005-11 1B7, 5.000% 11/25/36 (a) | | | 2,388,749 |
| | 8,000,000 | | | | Terwin Mortgage 2005-3SL B6, 11.500% 3/25/35
interest-only strips | | | 2,960,000 |
| | 2,000,000 | | | | Terwin Mortgage 2005-7SL, 6.500% 7/25/35 (a) | | | 1,627,248 |
| | 3,000,000 | | | | Terwin Mortgage 2005-R1, 5.000% 12/28/36 (a) | | | 2,190,000 |
| | | | | | | |
|
|
| | | | | | | | | 34,748,339 |
| | | | | | | |
|
|
| | | | | | Manufactured Housing Loans–3.3% | | | |
| | 10,000,000 | | | | Bombardier Capital 1999-B M1, 8.120% 12/15/29 | | | 2,011 |
| | 5,000,000 | | | | Conseco Finance 1999-6 M1, 7.960% 6/1/30 (a) | | | 366,130 |
| | 2,000,000 | | | | Conseco Finance 2001-1 M1, 7.535% 7/1/32 | | | 459,636 |
| | 8,000,000 | | | | Green Tree Financial 1997-8 M1, 7.020% 10/15/27 | | | 5,178,048 |
| | 7,500,000 | | | | Greenpoint Manufactured Housing 2000-1 M2, 8.780% 3/20/30 | | | 209,480 |
| | 10,000,000 | | | | Madison Avenue Manufactured Housing 2002-A B2, 7.8306% 3/25/32 | | | 2,800,000 |
| | 1,500,000 | | | | Oakwood Mortgage 2002-A M1, 7.760% 3/15/32 | | | 321,762 |
| | 10,000,000 | | | | Oakwood Mortgage 2002-B M1, 7.620% 6/15/32 | | | 2,414,330 |
| | 5,000,000 | | | | UCFC Manufactured Housing 1997-2 B1, Zero Coupon Bond 2/15/18 | | | 192,053 |
| | | | | | | |
|
|
| | | | | | | | | 11,943,450 |
| | | | | | | |
|
|
| | | | | | Recreational Equipment–0.4% | | | |
| | 9,723,769 | | | | Green Tree Recreational Equipment 1996-B CTFS, 7.700% 7/15/18 | | | 1,530,308 |
| | | | | | | |
|
|
| | | | | | Total Asset Backed Securities–Non-Investment Grade
(cost $135,546,353) | | | 130,306,487 |
| | | | | | | |
|
|
| | Corporate Bonds–Investment Grade–1.1% of Net Assets | | | |
| | | | | | Special Purpose Entity–1.1% | | | |
| | 4,000,000 | | | | Duane Park I, Zero Coupon Bond, 6/27/16 (a) | | | 4,000,000 |
| | | | | | | |
|
|
| | | | | | Total Corporate Bonds–Investment Grade
(cost $4,000,000) | | | 4,000,000 |
| | | | | | | |
|
|
59
RMK STRATEGIC INCOME FUND, INC.
PORTFOLIOOF INVESTMENTS
MARCH 31, 2006
| | | | | | | | |
Principal
Amount | | | | Description | | Market
Value (b) |
| | Corporate Bonds–Non-Investment Grade–33.1% of Net Assets | | | |
| | | | | | Apparel–0.8% | | | |
| $ | 500,000 | | | | Anvil Knitwear, 10.875% 3/15/07 | | $ | 247,500 |
| | 2,515,000 | | | | Rafaella Apparel, 11.250% 6/15/11 (a) | | | 2,502,425 |
| | | | | | | |
|
|
| | | | | | | | | 2,749,925 |
| | | | | | | |
|
|
| | | | | | Appliances–1.2% | | | |
| | 4,625,000 | | | | Windmere-Durable, 10.000% 7/31/08 | | | 4,393,750 |
| | | | | | | |
|
|
| | | | | | Automotives–0.9% | | | |
| | 1,000,000 | | | | Ford Motor, 9.215% 9/15/21 | | | 800,000 |
| | 475,000 | | | | Ford Motor, 9.980% 2/15/47 | | | 389,500 |
| | 2,750,000 | | | | General Motors, 8.375% 7/15/33 | | | 2,014,375 |
| | | | | | | |
|
|
| | | | | | | | | 3,203,875 |
| | | | | | | |
|
|
| | | | | | Automotive Parts & Equipment–2.4% | | | |
| | 3,300,000 | | | | Dana Corporation, Zero Coupon Bond 6/15/10 in default (c) | | | 2,574,000 |
| | 825,000 | | | | Delphi Corporation, Zero Coupon Bond 5/1/29 in default (c) | | | 507,375 |
| | 2,650,000 | | | | Dura Operating, 9.000% 5/1/09 | | | 1,311,750 |
| | 1,000,000 | | | | Exide Technologies, 10.500% 3/15/13 (a) | | | 755,000 |
| | 2,050,000 | | | | Metaldyne Corp., 10.000% 11/1/13 | | | 1,916,750 |
| | 1,950,000 | | | | Metaldyne Corp., 11.000% 6/15/12 | | | 1,552,687 |
| | | | | | | |
|
|
| | | | | | | | | 8,617,562 |
| | | | | | | |
|
|
| | | | | | Basic Materials–3.2% | | | |
| | 1,625,000 | | | | Doe Run Resources, 11.750% 11/1/08 (a) | | | 1,430,000 |
| | 2,650,000 | | | | Edgen Acquisition, 9.875% 2/1/11 | | | 2,636,750 |
| | 1,300,000 | | | | Edgen Corporation, 9.875% 2/1/11 (a) | | | 1,293,500 |
| | 2,000,000 | | | | Millar Western, 7.750% 11/15/13 | | | 1,540,000 |
| | 3,525,000 | | | | OM Group, 9.250% 12/15/11 | | | 3,648,375 |
| | 1,000,000 | | | | Phibro Animal Health Corporation, 13.000% 12/1/07 | | | 1,030,000 |
| | | | | | | |
|
|
| | | | | | | | | 11,578,625 |
| | | | | | | |
|
|
| | | | | | Building & Construction–1.6% | | | |
| | 4,600,000 | | | | MMI Products, 11.250% 4/15/07 | | | 4,531,000 |
| | 1,550,000 | | | | Owens Corning, Zero Coupon Bond 8/1/18 in default (c) | | | 1,243,875 |
| | | | | | | |
|
|
| | | | | | | | | 5,774,875 |
| | | | | | | |
|
|
| | | | | | Communications–1.5% | | | |
| | 750,000 | | | | Adelphia Communications, Zero Coupon Bond 6/15/11 in default (c) | | | 442,500 |
| | 986,000 | | | | CCH I Holdings, 10.000% 5/15/14 (a) | | | 497,930 |
| | 792,000 | | | | CCH I Holdings, 11.000% 10/1/15 (a) | | | 658,350 |
| | 3,374,000 | | | | CCH I Holdings, Zero Coupon Bond 5/15/14 (a) | | | 1,754,480 |
| | 200,000 | | | | Century Communications, Zero Coupon Bond in default (c) | | | 200,000 |
| | 2,325,000 | | | | Penton Media, 10.375% 6/15/11 | | | 2,109,936 |
| | | | | | | |
|
|
| | | | | | | | | 5,663,196 |
| | | | | | | |
|
|
60
RMK STRATEGIC INCOME FUND, INC.
PORTFOLIOOF INVESTMENTS
MARCH 31, 2006
| | | | | | | | |
Principal
Amount | | | | Description | | Market
Value (b) |
| | Corporate Bonds–Non-Investment Grade (continued) | | | |
| | | | | | Consulting Services–1.1% | | | |
| $ | 2,750,000 | | | | MSX International, 11.000% 10/15/07 | | $ | 2,640,000 |
| | 2,000,000 | | | | MSX International, 11.375% 1/15/08 | | | 1,320,000 |
| | | | | | | |
|
|
| | | | | | | | | 3,960,000 |
| | | | | | | |
|
|
| | | | | | Electronics–1.2% | | | |
| | 4,500,000 | | | | Motors and Gears, 10.750% 11/15/06 | | | 4,410,000 |
| | | | | | | |
|
|
| | | | | | Finance–1.1% | | | |
| | 1,600,000 | | | | Advanta Capital Trust I, 8.990% 12/17/26 | | | 1,628,000 |
| | 1,375,000 | | | | Banctec, 7.500% 6/1/08 | | | 984,830 |
| | 1,275,000 | | | | Citisteel USA, 12.480% 9/1/10 (a) | | | 1,306,875 |
| | | | | | | |
|
|
| | | | | | | | | 3,919,705 |
| | | | | | | |
|
|
| | | | | | Food–1.2% | | | |
| | 2,415,000 | | | | Di Giorgio Corp., 10.000% 6/15/07 | | | 2,324,437 |
| | 2,925,000 | | | | Merisant, 9.500% 7/15/13 | | | 2,018,250 |
| | | | | | | |
|
|
| | | | | | | | | 4,342,687 |
| | | | | | | |
|
|
| | | | | | Garden Products–0.3% | | | |
| | 1,350,000 | | | | Ames True Temper, 10.000% 7/15/12 | | | 1,127,250 |
| | | | | | | |
|
|
| | | | | | Human Resources–0.4% | | | |
| | 1,650,000 | | | | Comforce Operating, 12.000% 12/1/07 | | | 1,652,062 |
| | | | | | | |
|
|
| | | | | | Industrial–5.5% | | | |
| | 1,875,000 | | | | Advanced Lighting Technologies, 11.000% 3/31/09 | | | 1,848,731 |
| | 4,000,000 | | | | Consolidated Container, 10.125% 7/15/09 | | | 3,500,000 |
| | 903,000 | | | | Constar International, 11.000% 12/1/12 | | | 704,340 |
| | 2,750,000 | | | | Continental Global Group, 9.000% 10/1/08 | | | 2,681,607 |
| | 2,800,000 | | | | GSI Group, 12.000% 5/15/13 | | | 2,838,500 |
| | 2,000,000 | | | | Trimas Corp., 9.875% 6/15/12 | | | 1,830,000 |
| | 915,000 | | | | VICAP S.A., 11.375% 5/15/07* | | | 855,525 |
| | 2,500,000 | | | | VITRO S.A., 12.750% 11/1/13 (a) | | | 2,325,000 |
| | 670,000 | | | | Wolverine Tube, 10.500% 4/1/09 | | | 552,750 |
| | 3,405,000 | | | | Wolverine Tube, 7.375% 8/1/08 (a) | | | 2,689,950 |
| | | | | | | |
|
|
| | | | | | | | | 19,826,403 |
| | | | | | | |
|
|
| | | | | | Investment Companies–0.3% | | | |
| | 1,000,000 | | | | Reg Diversified Funding, Zero Coupon Bond 1/25/36 (a) | | | 1,000,000 |
| | | | | | | |
|
|
| | | | | | Manufacturing–1.2% | | | |
| | 2,950,000 | | | | BGF Industries, 10.250% 1/15/09 | | | 2,714,000 |
| | 2,000,000 | | | | JB Poindexter, 8.750% 3/15/14 | | | 1,590,000 |
| | | | | | | |
|
|
| | | | | | | | | 4,304,000 |
| | | | | | | |
|
|
| | | | | | Medical Products–0.8% | | | |
| | 5,075,000 | | | | Insight Health Services, 9.875% 11/1/11 | | | 2,791,250 |
| | | | | | | |
|
|
61
RMK STRATEGIC INCOME FUND, INC.
PORTFOLIOOF INVESTMENTS
MARCH 31, 2006
| | | | | | | | |
Principal
Amount | | | | Description | | Market
Value (b) |
| | Corporate Bonds–Non-Investment Grade (continued) | | | |
| | | | | | Retail–2.9% | | | |
| $ | 2,175,000 | | | | General Nutrition Center, 8.500% 12/1/10 | | $ | 2,060,812 |
| | 2,250,000 | | | | Jo-Ann Stores, 7.500% 3/1/12 | | | 1,974,375 |
| | 1,075,000 | | | | Nebraska Book Company, 8.625% 3/15/12 | | | 989,000 |
| | 2,400,000 | | | | Star Gas Partner, 10.250% 2/15/13 | | | 2,484,000 |
| | 3,700,000 | | | | Uno Restaurant, 10.000% 2/15/11 (a) | | | 2,997,000 |
| | | | | | | |
|
|
| | | | | | | | | 10,505,187 |
| | | | | | | |
|
|
| | | | | | Special Purpose Entity–1.5% | | | |
| | 1,615,000 | | | | Altra Industrial Motion, 9.000% 12/1/11 (a) | | | 1,606,925 |
| | 975,000 | | | | Interactive Health, 7.250% 4/1/11 (a) | | | 760,500 |
| | 2,000,000 | | | | MM Community Funding IX, 10.000% 5/1/33 (a) | | | 1,560,000 |
| | 230,000 | | | | PAHC Holdings, Zero Coupon Bond 2/1/10** | | | 236,900 |
| | 1,450,000 | | | | Transmeridian Exploration, 12.000% 12/15/10 (a) | | | 1,460,875 |
| | | | | | | |
|
|
| | | | | | | | | 5,625,200 |
| | | | | | | |
|
|
| | | | | | Technology–0.7% | | | |
| | 3,125,000 | | | | Danka Business Systems, 11.000% 6/15/10 | | | 2,554,687 |
| | | | | | | |
|
|
| | | | | | Telecommunications–1.9% | | | |
| | 3,480,000 | | | | BARAK I.T.C., 10.000% 11/15/07* | | | 1,816,892 |
| | 3,975,000 | | | | Primus Telecommunications, 8.000% 1/15/14 | | | 2,703,000 |
| | 300,000 | | | | Rural Cellular, 9.750% 1/15/10 | | | 304,500 |
| | 2,200,000 | | | | Securus Technologies, 11.000% 9/1/11 | | | 1,892,000 |
| | | | | | | |
|
|
| | | | | | | | | 6,716,392 |
| | | | | | | |
|
|
| | | | | | Tobacco–0.6% | | | |
| | 3,500,000 | | | | North Atlantic Trading, 9.250% 3/1/12 | | | 2,240,000 |
| | | | | | | |
|
|
| | | | | | Transportation–0.3% | | | |
| | 1,075,000 | | | | Evergreen International Aviation, 12.000% 5/15/10 | | | 1,076,344 |
| | | | | | | |
|
|
| | | | | | Travel–0.5% | | | |
| | 2,300,000 | | | | Worldspan Financial, 10.999% 2/15/11 | | | 1,989,500 |
| | | | | | | |
|
|
| | | | | | Total Corporate Bonds–Non-Investment Grade (cost $127,442,280) | | | 120,022,475 |
| | | | | | | |
|
|
| | Mortgage Backed Securities–Investment Grade–7.6% of Net Assets | | | |
| | | | | | Collateralized Mortgage Obligations–7.6% | | | |
| | 2,700,000 | | | | First Franklin Mortgage 2004-FF2 N3, 8.835% 4/25/34 (a) | | | 818,238 |
| | 2,750,000 | | | | First Franklin Mortgage 2004-FF5 M9, 7.818% 8/25/34 | | | 2,557,500 |
| | | | | | Harborview Mortgage 2004-1 X, 1.224% 4/19/34 interest-only strips | | | 667,976 |
| | | | | | Harborview Mortgage 2004-8 X, 1.407% 11/19/34 interest-only strips | | | 1,648,607 |
| | 5,000,000 | | | | Harborview Mortgage 2005-9 B10, 6.526% 6/20/35 | | | 4,112,218 |
| | 5,000,000 | | | | Long Beach Mortgage 2004-4 M10, 7.818% 10/25/34 | | | 5,062,500 |
62
RMK STRATEGIC INCOME FUND, INC.
PORTFOLIOOF INVESTMENTS
MARCH 31, 2006
| | | | | | | | |
Principal
Amount | | | | Description | | Market
Value (b) |
| | Mortgage Backed Securities–Investment Grade (continued) | | | |
| | | | | | Collateralized Mortgage Obligation (continued) | | | |
| | | | | | Mellon Residential 2004-TBC1 X, 0.156% 2/26/34
interest-only strips (a) | | $ | 759,915 |
| $ | 3,125,000 | | | | Meritage Mortgage 2005-2 M11, 7.818% 11/25/35 | | | 2,584,469 |
| | 2,000,000 | | | | Merrill Lynch Mortgage 2005-M1, 6.818% 5/25/36 | | | 1,609,360 |
| | 2,000,000 | | | | Sail Net Interest Margin Notes 2004-5A B, 6.750% 6/27/34 (a) | | | 704,456 |
| | 2,500,000 | | | | Soundview 2005-OPT1 M10, 8.068% 6/25/35 | | | 2,386,325 |
| | 1,000,000 | | | | Soundview, 7.318% 12/25/35 | | | 803,750 |
| | 15,000,000 | | | | Structured Asset 1999-SP1, 9.000% 5/25/29 | | | 2,394,325 |
| | 1,423,000 | | | | Structured Asset 2003-BC1 B2, 9.000% 5/25/32 | | | 1,447,086 |
| | | | | | | |
|
|
| | | | | | Total Mortgage Backed Securities–Investment Grade
(cost $30,083,891) | | | 27,556,725 |
| | | | | | | |
|
|
| | Mortgage Backed Securities–Non-Investment Grade–13.2% of Net Assets | | | |
| | | | | | Collateralized Mortgage Obligations–13.2% | | | |
| | 2,750,000 | | | | First Franklin Mortgage 2004-FF5 B, 7.818% 8/25/34 (a) | | | 2,447,500 |
| | 3,000,000 | | | | First Franklin Mortgage 2004-FFH2 B2, 8.318% 6/25/34 (a) | | | 2,670,000 |
| | 2,500,000 | | | | First Franklin Mortgage 2004-FFH3 B1, 8.318% 10/25/34 (a) | | | 2,325,000 |
| | 3,000,000 | | | | Fremont Home Equity 2005-C B3, 7.068% 7/25/35 (a) | | | 2,175,000 |
| | 1,000,000 | | | | Greenwich 2005-2A N2, 3.100% 2/26/35 (a) | | | 700,000 |
| | 3,000,000 | | | | Greenwich 2005-3 N2, 2.000% 6/27/35 (a) | | | 1,860,000 |
| | 6,000,000 | | | | Greenwich 2005-4 N-2, Zero Coupon Bond, 7/27/45 (a) | | | 3,120,000 |
| | 2,000,000 | | | | GSAMP Trust 2004-AR1 B5, 5.000% 6/25/34 (a) | | | 1,620,000 |
| | 2,000,000 | | | | Harborview Mortgage 2005-15 B10, 6.526% 10/20/45 | | | 1,592,408 |
| | 5,000,000 | | | | Long Beach Asset Holdings 2005-WL1 N4, 7.500% 6/25/45 (a) | | | 4,579,700 |
| | 6,000,000 | | | | Long Beach Mortgage 2001-4 M3, 7.568% 3/25/32 | | | 427,057 |
| | 3,485,000 | | | | Long Beach Mortgage 2005-WL1, 7.568% 6/25/35 | | | 3,044,461 |
| | 3,000,000 | | | | Meritage Mortgage 2004-2 B1, 8.068% 1/25/35 (a) | | | 2,595,000 |
| | 2,000,000 | | | | Meritage Mortgage 2004-2 B2, 8.068% 1/25/35 (a) | | | 1,665,000 |
| | 1,000,000 | | | | Park Place Securities 2005-WCW1 B, 5.000% 9/25/35 (a) | | | 942,403 |
| | 2,000,000 | | | | Park Place Securities 2005-WCW3, 7.318% 8/25/35 (a) | | | 1,640,000 |
| | 3,000,000 | | | | Park Place Securities 2005-WHQ1 M10, 7.318% 3/25/35 (a) | | | 2,675,160 |
| | 2,000,000 | | | | Park Place Securities 2005-WHQ4, 7.318% 9/25/35 (a) | | | 1,370,320 |
| | 2,000,000 | | | | People’s Choice Home Loan 2004-2 B, 5.000% 10/25/34 (a) | | | 1,652,500 |
| | 1,530,000 | | | | Popular 2005-4 B2, 7.318% 9/25/35 (a) | | | 1,424,813 |
| | 2,000,000 | | | | Soundview 2005-1 B3, 8.068% 4/25/35 (a) | | | 1,640,000 |
| | 1,000,000 | | | | Soundview 2005-2 B4, 7.818% 7/25/35 (a) | | | 752,500 |
| | 2,000,000 | | | | Soundview 2005-B M14, 7.650% 5/25/35 (a) | | | 1,639,500 |
| | 2,000,000 | | | | Structured Asset 2004-S2 B, 6.000% 6/25/34 (a) | | | 1,811,840 |
| | 2,000,000 | | | | Structured Asset 2004-S4 B3, 5.090% 12/25/34 (a) | | | 1,557,280 |
| | | | | | | |
|
|
| | | | | | Total Mortgage Backed Securities–Non-Investment Grade (cost $47,951,515) | | | 47,927,442 |
| | | | | | | |
|
|
63
RMK STRATEGIC INCOME FUND, INC.
PORTFOLIOOF INVESTMENTS
MARCH 31, 2006
| | | | | | | | |
Principal
Amount/
Shares | | | | Description | | Market
Value (b) |
| | Government Agency Securities–0.8% of Net Assets | | | |
| | | | | | Fannie Mae 1998-M7 N, 0.821% 5/25/36 interest-only strips (e) | | $ | 1,080,334 |
| | | | | | GNMA 2003-64 XA, 0.263% 8/16/43 interest-only strips | | | 1,881,718 |
| | | | | | | |
|
|
| | | | | | Total Government Agency Securities
(cost $8,081,724) | | | 2,962,052 |
| | | | | | | |
|
|
| | Municipal Securities–0.2% of Net Assets | | | |
| $ | 1,000,000 | | | | Pima County Arizona IDA Health Care, Zero Coupon Bond 11/15/32 in default | | | 501,040 |
| | | | | | | |
|
|
| | | | | | Total Municipal Agency Securities
(cost $626,327) | | | 501,040 |
| | | | | | | |
|
|
| | Common Stocks–19.1% of Net Assets | | | |
| | 46,500 | | | | Alpha Natural Resources, Inc. (c) | | | 1,076,010 |
| | 52,962 | | | | American Capital Strategies, Ltd. | | | 1,862,144 |
| | 21,500 | | | | Arthur J. Gallagher & Co. | | | 597,915 |
| | 62,700 | | | | ATI Technologies Inc. (c) | | | 1,077,186 |
| | 60,300 | | | | Bois d’Arc Energy LLC (c) | | | 1,003,995 |
| | 66,400 | | | | Cascade Microtech, Inc. (c) | | | 869,176 |
| | 10,700 | | | | Caterpillar, Inc. | | | 768,367 |
| | 14,200 | | | | CEMEX, S.A. de C.V. | | | 926,976 |
| | 52,700 | | | | Citizens Communications Company | | | 699,329 |
| | 23,300 | | | | Companhia de Saneamento Básico do Estado de São Paulo (c) | | | 512,833 |
| | 80,000 | | | | Compton Petroleum Corporation (c) | | | 1,027,200 |
| | 75,500 | | | | Consolidated Communications Illinois Holdings, Inc. (c) | | | 1,228,385 |
| | 21,400 | | | | Cytec Industries Inc. (d) | | | 1,284,214 |
| | 10,000 | | | | Deere & Company | | | 790,500 |
| | 15,000 | | | | Dell Inc. (c)(d) | | | 446,400 |
| | 55,800 | | | | Direct General Corporation | | | 949,158 |
| | 60,400 | | | | Dollar General Corporation (d) | | | 1,067,268 |
| | 41,200 | | | | Education Realty Trust, Inc. | | | 630,360 |
| | 23,200 | | | | EnCana Corporation (d) | | | 1,084,136 |
| | 12,500 | | | | ENSCO International Incorporated (d) | | | 643,125 |
| | 40,100 | | | | Enterprise Partners Products L.P. | | | 990,069 |
| | 56,800 | | | | FairPoint Communications, Inc. | | | 784,976 |
| | 13,300 | | | | Fording Canadian Coal Trust | | | 505,267 |
| | 17,900 | | | | Fred’s Inc. | | | 237,354 |
| | 41,200 | | | | Global Industries, Ltd. (c)(d) | | | 596,988 |
| | 53,300 | | | | Infocrossing, Inc. (c) | | | 642,265 |
| | 244,300 | | | | InPhonic, Inc. (c) | | | 1,707,657 |
| | 91,386 | | | | Intermet Corporation (c) | | | 1,096,632 |
| | 144,400 | | | | International Coal Group, Inc. (c) | | | 1,406,456 |
| | 75,400 | | | | Iowa Telecommunications Services, Inc. | | | 1,438,632 |
| | 13,400 | | | | J.C. Penney Company, Inc. | | | 809,494 |
64
RMK STRATEGIC INCOME FUND, INC.
PORTFOLIOOF INVESTMENTS
MARCH 31, 2006
| | | | | | | |
| Shares | | | | Description | | Market
Value (b) |
| Common Stocks (continued) | | | |
| 20,050 | | | | Kinder Morgan Energy Partners, L.P. | | $ | 966,009 |
| 14,400 | | | | KKR Financial Corp. (c) | | | 322,992 |
| 54,700 | | | | Korn/Ferry International (c) | | | 1,115,333 |
| 14,600 | | | | L-3 Communications Holdings, Inc. | | | 1,252,534 |
| 14,100 | | | | Lloyds TSB Group plc | | | 542,709 |
| 18,800 | | | | Lone Star Technologies, Inc. (c)(d) | | | 1,041,708 |
| 33,000 | | | | Macquarie Infrastructure Company Trust | | | 1,072,500 |
| 21,500 | | | | Magellan Midstream Partners, L.P. | | | 706,705 |
| 16,800 | | | | Manpower Inc. | | | 960,624 |
| 43,800 | | | | Masco Corporation | | | 1,423,062 |
| 155,050 | | | | MCG Capital Corporation | | | 2,187,756 |
| 42,900 | | | | Microsoft Corporation (d) | | | 1,167,309 |
| 38,400 | | | | Mittal Steel Company N.V. | | | 1,449,600 |
| 32,100 | | | | Motorola, Inc. | | | 735,411 |
| 87,000 | | | | Nam Tai Electronics, Inc. | | | 1,993,170 |
| 74,300 | | | | Ness Technologies, Inc. (c) | | | 935,437 |
| 9,400 | | | | PACCAR Inc. | | | 662,512 |
| 14,100 | | | | PetroChina Company Limited (d) | | | 1,479,795 |
| 14,300 | | | | Philippine Long Distance Telephone Company | | | 537,251 |
| 55,700 | | | | Regal Entertainment Group | | | 1,047,717 |
| 23,100 | | | | Sasol Limited | | | 873,873 |
| 43,010 | | | | Ship Finance International Limited | | | 738,052 |
| 5,500 | | | | Stone Energy Corporation (c)(d) | | | 242,715 |
| 19,300 | | | | Superior Energy Services, Inc. (c) | | | 517,047 |
| 134,900 | | | | Taiwan Semiconductor Manufacturing Company Ltd. | | | 1,357,094 |
| 154,747 | | | | Technology Investment Capital Corporation (c) | | | 2,250,021 |
| 24,600 | | | | Teva Pharmaceutical Industries Limited | | | 1,013,028 |
| 31,200 | | | | The Home Depot, Inc. (d) | | | 1,319,760 |
| 8,600 | | | | The Timken Company | | | 277,522 |
| 15,300 | | | | Tidewater Inc. (d) | | | 845,019 |
| 93,000 | | | | TOP Tankers Inc. | | | 1,209,000 |
| 138,250 | | | | Trustreet Properties Inc. | | | 2,100,017 |
| 47,500 | | | | Tsakos Energy Navigation Limited (d) | | | 1,861,050 |
| 3,100 | | | | Unit Corporation (c)(d) | | | 172,825 |
| 27,900 | | | | Valero Energy Corporation (d) | | | 1,667,862 |
| 18,400 | | | | Valero L.P. | | | 931,960 |
| 22,900 | | | | Washington Mutual, Inc. | | | 975,998 |
| 36,000 | | | | Willbros Group, Inc. (c)(d) | | | 732,240 |
| | | | | | |
|
|
| | | | | Total Common Stocks
(cost $65,288,002) | | | 69,445,684 |
| | | | | | |
|
|
| Preferred Stocks–1.9% of Net Assets | | | |
| 30,000 | | | | Baker Street Funding (a)(c) | | | 2,910,000 |
| 1,000 | | | | Credit Genesis CLO 2005 | | | 1,000,000 |
65
RMK STRATEGIC INCOME FUND, INC.
PORTFOLIOOF INVESTMENTS
MARCH 31, 2006
| | | | | | | | | |
Principal
Amount/
Shares | | | | Description | | Market
Value (b) | |
| | Preferred Stocks (continued) | | | | |
| | 1,000 | | | | Hewett’s Island II (a) | | $ | 990,000 | |
| | 1,000 | | | | Marquette Park CLO (a) | | | 980,000 | |
| | 1,000 | | | | SOLOSO CDO 2005 | | | 992,706 | |
| | | | | | | |
|
|
|
| | | | | | Total Preferred Stocks
(cost $6,872,714) | | | 6,872,706 | |
| | | | | | | |
|
|
|
| | Corporate Loans–0.1% of Net Assets | | | | |
| $ | 375,000 | | | | ICO North America, 7.500% 8/15/09 | | | 476,250 | |
| | | | | | | |
|
|
|
| | | | | | Total Corporate Loans
(cost $375,000) | | | 476,250 | |
| | | | | | | |
|
|
|
| | Eurodollar Time Deposits–5.7% of Net Assets | | | | |
| | 20,883,293 | | | | State Street Bank & Trust Company Eurodollar time deposits dated March 31, 2006, 3.750% maturing at $20,889,819.03 on April 3, 2006 | | | 20,883,293 | |
| | | | | | | |
|
|
|
| | | | | | Total Investments–137.4% of Net Assets
(cost $514,201,217) | | | 498,584,277 | |
| | | | | | | |
|
|
|
| | | | | | Other Assets and Liabilities, net–(37.4%) of Net Assets | | | (135,816,222 | ) |
| | | | | | | |
|
|
|
| | | | | | Net Assets | | $ | 362,768,055 | |
| | | | | | | |
|
|
|
66
RMK STRATEGIC INCOME FUND, INC.
PORTFOLIOOF INVESTMENTS
MARCH 31, 2006
Call Options Written
March 31, 2006
| | | | | | | |
Number of
Contracts | | | | Common Stocks/Expiration Date/Exercise Price | | Market
Value (b) |
| 38 | | | | Cytec Industries Inc./April/60 | | $ | 5,320 |
| 77 | | | | Dell Inc./April/30 | | | 3,542 |
| 26 | | | | Dollar General Corporation/April/17.50 | | | 1,170 |
| 32 | | | | EnCana Corporation/April/50 | | | 1,440 |
| 23 | | | | ENSCO International Incorporated/April/50 | | | 6,095 |
| 15 | | | | Global Industries, Ltd/April/15 | | | 450 |
| 28 | | | | The Home Depot, Inc/April/42.50 | | | 1,960 |
| 59 | | | | Lone Star Technologies, Inc/April/55 | | | 13,275 |
| 50 | | | | Microsoft Corporation/April/27.50 | | | 1,300 |
| 69 | | | | PetroChina Company Limited/April/100 | | | 37,260 |
| 55 | | | | Stone Energy Corporation/April/45 | | | 9,350 |
| 45 | | | | Tidewater Inc/April/55 | | | 8,100 |
| 40 | | | | Tsakos Energy Navigation Limited/April/40 | | | 1,400 |
| 31 | | | | Unit Corporation/April/55 | | | 5,580 |
| 26 | | | | Valero Energy Corporation/April/60 | | | 4,550 |
| 25 | | | | Willbros Group, Inc/April/20 | | | 1,375 |
| | | | | | |
|
|
| | | | | Total Call Options Written
(Premiums Received $89,778) | | $ | 102,167 |
| | | | | | |
|
|
| (a) | | Securities sold within the terms of a private placement memorandum, exempt from registration under Rule 144A under the Securities Act of 1933, as amended, and may be resold in transactions exempt from registration, normally to qualified institutional buyers. Pursuant to guidelines adopted by the Board of Directors, these issues have been determined to be liquid by Morgan Asset Management, Inc., the Fund’s investment adviser. |
| (b) | | See Note 2 of accompanying Notes to Financial Statements regarding valuation of securities. |
| (c) | | These securities are non-income producing. |
| (d) | | A portion or all of the security is pledged as collateral for call options written. |
| (e) | | The issuer is a publicly-traded company that operates under a congressional charter; its securities are neither issued nor guaranteed by the U. S. government. |
| * | | These securities are classified as Yankee Bonds, which are U.S. dollar denominated bonds issued in the United States by a foreign entity. |
| ** | | This security is payment-in-kind. |
(See Accompanying Notes to the Financial Statements)
67
REGIONS MORGAN KEEGAN FUNDS
STATEMENTSOF ASSETSAND LIABILITIES
MARCH 31, 2006
| | | | | | | | |
| | | RMK Advantage
Income Fund | | | RMK High
Income Fund | |
Assets: | | | | | | | | |
Investments in securities, at value | | $ | 562,629,398 | | | $ | 416,638,790 | |
Dividends and interest receivable | | | 6,727,167 | | | | 5,028,808 | |
Receivable for investments sold | | | 2,057,842 | | | | 2,267,638 | |
Debt issue costs | | | 47,790 | | | | 51,119 | |
Other assets | | | — | | | | 13,524 | |
| | |
|
|
| |
|
|
|
Total assets | | | 571,462,197 | | | | 423,999,879 | |
| | |
|
|
| |
|
|
|
Liabilities: | | | | | | | | |
Loan payable (Note 6) | | | 150,000,000 | | | | 115,000,000 | |
Interest payable | | | 600,471 | | | | 207,646 | |
Call options written, at value (premiums received $58,566 and $45,863) (Note 4) | | | 54,167 | | | | 51,479 | |
Payable for investments purchased | | | 3,094,305 | | | | 1,682,994 | |
Accrued expenses: | | | | | | | | |
Advisory fees (Note 3) | | | 310,931 | | | | 231,196 | |
Accounting and administration fees (Note 3) | | | 71,753 | | | | 53,353 | |
Other | | | 101,431 | | | | 74,150 | |
| | |
|
|
| |
|
|
|
Total liabilities | | | 154,233,058 | | | | 117,300,818 | |
| | |
|
|
| |
|
|
|
Net assets | | $ | 417,229,139 | | | $ | 306,699,061 | |
| | |
|
|
| |
|
|
|
Composition of Net Assets: | | | | | | | | |
Common stock, $.0001 par value (1,000,000,000 shares authorized for each fund) | | | 2,992 | | | | 2,215 | |
Paid-in capital | | | 430,604,465 | | | | 322,288,100 | |
Undistributed net investment income | | | 52,072 | | | | 2,279 | |
Accumulated net realized gains on investments | | | 2,932 | | | | 155,753 | |
Net unrealized (depreciation) on investments | | | (13,433,322 | ) | | | (15,749,286 | ) |
| | |
|
|
| |
|
|
|
Net assets | | $ | 417,229,139 | | | $ | 306,699,061 | |
| | |
|
|
| |
|
|
|
Investments, at identified cost | | $ | 576,067,119 | | | $ | 432,382,460 | |
| | |
|
|
| |
|
|
|
Shares Outstanding and Net Asset Value Per Share: | | | | | | | | |
Common shares outstanding | | | 29,919,002 | | | | 22,151,608 | |
Net asset value per share | | $ | 13.95 | | | $ | 13.85 | |
(See Accompanying Notes to the Financial Statements)
68
REGIONS MORGAN KEEGAN FUNDS
STATEMENTSOF ASSETSAND LIABILITIES
MARCH 31, 2006
| | | | | | | |
| | | RMK Multi-Sector
High Income Fund | | RMK Strategic
Income Fund | |
Assets: | | | | | | | |
Investments in securities, at value | | $ | 450,576,428 | | $ | 498,584,277 | |
Dividends and interest receivable | | | 4,496,574 | | | 5,586,088 | |
Receivable for investments sold | | | 2,071,987 | | | 1,967,523 | |
Debt issue costs | | | — | | | 33,488 | |
Other assets | | | — | | | — | |
| | |
|
| |
|
|
|
Total assets | | | 457,144,989 | | | 506,171,376 | |
| | |
|
| |
|
|
|
Liabilities: | | | | | | | |
Loan payable (Note 6) | | | — | | | 140,000,000 | |
Interest payable | | | — | | | 1,394,356 | |
Call options written, at value (premiums received $18,949 and $89,778) (Note 4) | | | 22,133 | | | 102,167 | |
Payable for investments purchased | | | 3,221,572 | | | 1,485,848 | |
Accrued expenses: | | | | | | | |
Advisory fees (Note 3) | | | 248,179 | | | 275,804 | |
Accounting and administration fees (Note 3) | | | 57,272 | | | 63,647 | |
Other | | | 72,757 | | | 81,499 | |
| | |
|
| |
|
|
|
Total liabilities | | | 3,621,913 | | | 143,403,321 | |
| | |
|
| |
|
|
|
Net assets | | $ | 453,523,076 | | $ | 362,768,055 | |
| | |
|
| |
|
|
|
Composition of Net Assets: | | | | | | | |
Common stock, $.0001 par value (1,000,000,000 shares authorized for each fund) | | | 3,119 | | | 2,679 | |
Paid-in capital | | | 446,373,744 | | | 385,731,113 | |
Undistributed net investment income | | | 2,708,869 | | | 70,384 | |
Accumulated net realized gains/(losses) on investments | | | 1,340,375 | | | (7,406,792 | ) |
Net unrealized appreciation/(depreciation) on investments | | | 3,096,969 | | | (15,629,329 | ) |
| | |
|
| |
|
|
|
Net assets | | $ | 453,523,076 | | $ | 362,768,055 | |
| | |
|
| |
|
|
|
Investments, at identified cost | | $ | 447,476,275 | | $ | 514,201,217 | |
| | |
|
| |
|
|
|
Shares Outstanding and Net Asset Value Per Share: | | | | | | | |
Common shares outstanding | | | 31,194,982 | | | 26,787,246 | |
Net asset value per share | | $ | 14.54 | | $ | 13.54 | |
(See Accompanying Notes to the Financial Statements)
69
REGIONS MORGAN KEEGAN FUNDS
STATEMENTSOF OPERATIONS
FOR THE YEAR ENDED MARCH 31, 2006
| | | | | | | | |
| | | RMK Advantage
Income Fund | | | RMK High
Income Fund | |
Investment Income: | | | | | | | | |
Interest income | | $ | 63,382,993 | | | $ | 49,628,247 | |
Dividend income | | | 2,412,360 | (a) | | | 1,790,136 | (b) |
| | |
|
|
| |
|
|
|
Total investment income | | | 65,795,353 | | | | 51,418,383 | |
| | |
|
|
| |
|
|
|
Expenses: | | | | | | | | |
Advisory fees | | | 3,527,038 | | | | 2,754,381 | |
Accounting and Administration fees | | | 813,932 | | | | 635,626 | |
Interest expense | | | 5,277,216 | | | | 5,094,863 | |
Debt issue expense | | | 768,311 | | | | 237,201 | |
Legal fees | | | 115,197 | | | | 90,513 | |
Audit fees | | | 30,419 | | | | 36,420 | |
Transfer agent fees | | | 33,198 | | | | 34,738 | |
Custodian fees | | | 35,961 | | | | 38,738 | |
Registration fees | | | 20,535 | | | | 27,251 | |
Directors fees | | | 58,475 | | | | 57,458 | |
Insurance premiums | | | 32,142 | | | | 23,097 | |
Other | | | 32,627 | | | | 32,637 | |
| | |
|
|
| |
|
|
|
Total expenses | | | 10,745,051 | | | | 9,062,923 | |
| | |
|
|
| |
|
|
|
Net investment income | | | 55,050,302 | | | | 42,355,460 | |
| | |
|
|
| |
|
|
|
Realized and Unrealized Gains/(Losses) on Investments: | | | | | | | | |
Net realized gains/(losses) on investments | | | 945,291 | | | | (1,025,157 | ) |
Change in unrealized appreciation/(depreciation) on investments | | | (10,068,183 | ) | | | (13,910,971 | ) |
| | |
|
|
| |
|
|
|
Change in net assets resulting from operations | | $ | 45,927,410 | | | $ | 27,419,332 | |
| | |
|
|
| |
|
|
|
| (a) | | Net of foreign taxes paid of $7,959. |
| (b) | | Net of foreign taxes paid of $6,843. |
(See Accompanying Notes to the Financial Statements)
70
REGIONS MORGAN KEEGAN FUNDS
STATEMENTSOF OPERATIONS
FOR THE YEAR ENDED MARCH 31, 2006
| | | | | | | | |
| | | RMK Multi-Sector
High Income Fund(c) | | | RMK Strategic
Income Fund | |
Investment Income: | | | | | | | | |
Interest income | | $ | 6,867,428 | | | $ | 53,985,237 | |
Dividend income | | | 504,689 | (d) | | | 2,897,449 | (e) |
| | |
|
|
| |
|
|
|
Total investment income | | | 7,372,117 | | | | 56,882,686 | |
| | |
|
|
| |
|
|
|
Expenses: | | | | | | | | |
Advisory fees | | | 512,744 | | | | 3,219,371 | |
Accounting and Administration fees | | | 118,326 | | | | 742,932 | |
Interest expense | | | — | | | | 5,988,102 | |
Debt issue expense | | | — | | | | 296,890 | |
Legal fees | | | 19,586 | | | | 105,954 | |
Audit fees | | | 28,000 | | | | 37,341 | |
Transfer agent fees | | | 7,050 | | | | 46,234 | |
Custodian fees | | | 4,408 | | | | 40,216 | |
Registration fees | | | 436 | | | | 19,287 | |
Directors fees | | | 12,125 | | | | 59,958 | |
Insurance premiums | | | — | | | | 29,015 | |
Other | | | 2,866 | | | | 36,736 | |
| | |
|
|
| |
|
|
|
Total expenses | | | 705,541 | | | | 10,622,036 | |
| | |
|
|
| |
|
|
|
Net investment income | | | 6,666,576 | | | | 46,260,650 | |
| | |
|
|
| |
|
|
|
Realized and Unrealized Gains/(Losses) on Investments: | | | | | | | | |
Net realized gains/(losses) on investments | | | 1,109,506 | | | | (6,375,927 | ) |
Change in unrealized appreciation/(depreciation) on investments | | | 3,096,969 | | | | (1,310,891 | ) |
| | |
|
|
| |
|
|
|
Change in net assets resulting from operations | | $ | 10,873,051 | | | $ | 38,573,832 | |
| | |
|
|
| |
|
|
|
| (c) | | For the period from the commencement of investment operations on January 19, 2006 to March 31, 2006. |
| (d) | | Net of foreign taxes paid of $557. |
| (e) | | Net of foreign taxes paid of $11,047. |
(See Accompanying Notes to the Financial Statements)
71
REGIONS MORGAN KEEGAN FUNDS
STATEMENTSOF CHANGESIN NET ASSETS
| | | | | | | | | | | | | | | | |
| | | RMK Advantage Income Fund
| | | RMK High Income Fund
| |
| | | Year Ended
March 31,
2006 | | | Period Ended
March 31,
2005(a) | | | Year Ended
March 31,
2006 | | | Year Ended
March 31,
2005 | |
Change in Net Assets: | | | | | | | | | | | | | | | | |
Operations: | | | | | | | | | | | | | | | | |
Net investment income | | $ | 55,050,302 | | | $ | 15,787,353 | | | $ | 42,355,460 | | | $ | 43,454,200 | |
Net realized gains/(losses) on investments | | | 945,291 | | | | 2,351,807 | | | | (1,025,157 | ) | | | 14,869,629 | |
Change in unrealized depreciation on investments | | | (10,068,183 | ) | | | (3,365,139 | ) | | | (13,910,971 | ) | | | (11,718,935 | ) |
| | |
|
|
| |
|
|
| |
|
|
| |
|
|
|
Change in net assets resulting from operations | | | 45,927,410 | | | | 14,774,021 | | | | 27,419,332 | | | | 46,604,894 | |
| | |
|
|
| |
|
|
| |
|
|
| |
|
|
|
Distributions to Shareholders: | | | | | | | | | | | | | | | | |
Distributions from net investment income | | | (53,755,090 | ) | | | (13,339,822 | ) | | | (40,624,400 | ) | | | (41,663,366 | ) |
Distributions from net realized gain on investments | | | (6,984,837 | ) | | | — | | | | (14,591,926 | ) | | | (12,333,973 | ) |
| | |
|
|
| |
|
|
| |
|
|
| |
|
|
|
Total distribution to shareholders | | | (60,739,927 | ) | | | (13,339,822 | ) | | | (55,216,326 | ) | | | (53,997,339 | ) |
| | |
|
|
| |
|
|
| |
|
|
| |
|
|
|
Capital Transactions: | | | | | | | | | | | | | | | | |
Proceeds from shares sold
(27,600,000 shares) | | | — | | | | 394,930,648 | | | | — | | | | — | |
Proceeds from sales of shares as a result of reinvested dividends
(1,832,182 and 479,839 shares) | | | 28,378,514 | | | | 7,198,292 | | | | — | | | | — | |
Proceeds from sales of shares as a result of reinvested dividends
(1,279,613 and 1,308,189 shares) | | | — | | | | — | | | | 20,765,109 | | | | 21,351,697 | |
| | |
|
|
| |
|
|
| |
|
|
| |
|
|
|
Change in net assets from capital transactions | | | 28,378,514 | | | | 402,128,940 | | | | 20,765,109 | | | | 21,351,697 | |
| | |
|
|
| |
|
|
| |
|
|
| |
|
|
|
Change in net assets | | | 13,565,997 | | | | 403,563,139 | | | | (7,031,885 | ) | | | 13,959,252 | |
| | |
|
|
| |
|
|
| |
|
|
| |
|
|
|
Net Assets: | | | | | | | | | | | | | | | | |
Beginning of period | | | 403,663,142 | | | | 100,003 | | | | 313,730,946 | | | | 299,771,694 | |
| | |
|
|
| |
|
|
| |
|
|
| |
|
|
|
End of period | | $ | 417,229,139 | | | $ | 403,663,142 | | | $ | 306,699,061 | | | $ | 313,730,946 | |
| | |
|
|
| |
|
|
| |
|
|
| |
|
|
|
Undistributed net investment income | | $ | 52,072 | | | $ | 104,784 | | | $ | 2,279 | | | $ | 291,458 | |
| | |
|
|
| |
|
|
| |
|
|
| |
|
|
|
| (a) | | From the commencement of investment operations on November 8, 2004. |
(See Accompanying Notes to the Financial Statements)
72
REGIONS MORGAN KEEGAN FUNDS
STATEMENTSOF CHANGESIN NET ASSETS
| | | | | | | | | | | | |
| | | RMK Multi-Sector
High Income Fund
| | | RMK Strategic Income Fund
| |
| | | Period Ended
March 31,
2006(b) | | | Year Ended
March 31,
2006 | | | Year Ended
March 31,
2005 | |
Change in Net Assets: | | | | | | | | | | | | |
Operations: | | | | | | | | | | | | |
Net investment income | | $ | 6,666,576 | | | $ | 46,260,650 | | | $ | 43,543,684 | |
Net realized gains/(losses) on investments | | | 1,109,506 | | | | (6,375,927 | ) | | | 8,604,501 | |
Change in unrealized appreciation/(depreciation) on investments | | | 3,096,969 | | | | (1,310,891 | ) | | | (13,962,527 | ) |
| | |
|
|
| |
|
|
| |
|
|
|
Change in net assets resulting from operations | | | 10,873,051 | | | | 38,573,832 | | | | 38,185,658 | |
| | |
|
|
| |
|
|
| |
|
|
|
Distributions to Shareholders: | | | | | | | | | | | | |
Distributions from net investment income | | | (3,726,838 | ) | | | (48,998,109 | ) | | | (41,437,874 | ) |
Distributions from net realized gain on investments | | | — | | | | (9,912,611 | ) | | | — | |
| | |
|
|
| |
|
|
| |
|
|
|
Total distribution to shareholders | | | (3,726,838 | ) | | | (58,910,720 | ) | | | (41,437,874 | ) |
| | |
|
|
| |
|
|
| |
|
|
|
Capital Transactions: | | | | | | | | | | | | |
Proceeds from shares sold
(31,050,000 shares) | | | 444,197,605 | | | | — | | | | — | |
Proceeds from shares sold
(3,150,000 shares) | | | — | | | | — | | | | 45,123,750 | |
Proceeds from sales of shares as a result of reinvested dividends (138,001 shares) | | | 2,079,255 | | | | — | | | | — | |
Proceeds from sales of shares as a result of reinvested dividends
(1,498,582 and 1,131,683 shares) | | | — | | | | 23,323,447 | | | | 17,362,226 | |
| | |
|
|
| |
|
|
| |
|
|
|
Change in net assets from capital transactions | | | 446,276,860 | | | | 23,323,447 | | | | 62,485,976 | |
| | |
|
|
| |
|
|
| |
|
|
|
Change in net assets | | | 453,423,073 | | | | 2,986,559 | | | | 59,233,760 | |
| | |
|
|
| |
|
|
| |
|
|
|
Net Assets: | | | | | | | | | | | | |
Beginning of period | | | 100,003 | | | | 359,781,496 | | | | 300,547,736 | |
| | |
|
|
| |
|
|
| |
|
|
|
End of period | | $ | 453,523,076 | | | $ | 362,768,055 | | | $ | 359,781,496 | |
| | |
|
|
| |
|
|
| |
|
|
|
Undistributed net investment income | | $ | 2,708,869 | | | $ | 70,384 | | | $ | 1,597,435 | |
| | |
|
|
| |
|
|
| |
|
|
|
| (b) | | From the commencement of investment operations on January 19, 2006. |
(See Accompanying Notes to the Financial Statements)
73
REGIONS MORGAN KEEGAN FUNDS
STATEMENTSOF CASH FLOWS
FOR THE YEAR ENDED MARCH 31, 2006
| | | | | | | | |
| | | RMK Advantage
Income Fund | | | RMK High
Income Fund | |
Cash flows from operating activities | | | | | | | | |
Net increase in net assets from operations | | $ | 45,927,410 | | | $ | 27,419,332 | |
Adjustments to reconcile net increase in net assets from operations to net cash provided by/(used in) operating activities | | | | | | | | |
Purchase of investment securities | | | (619,549,912 | ) | | | (397,920,072 | ) |
Proceeds from disposition of investment securities | | | 498,373,432 | | | | 396,673,211 | |
Purchase of short-term investment securities, net | | | (5,698,848 | ) | | | (23,944,317 | ) |
Proceeds from principal payments | | | 30,813,391 | | | | 26,064,967 | |
Change in unrealized appreciation on investment securities | | | 10,068,183 | | | | 13,910,971 | |
Amortization/accretion of premiums/discount on investment securities | | | (10,657,896 | ) | | | (5,176,567 | ) |
Net realized gain/(loss) on investment securities | | | (945,291 | ) | | | 1,025,157 | |
Net realized gain on principal payments | | | (1,655,265 | ) | | | (2,228,696 | ) |
Amortization of debt issue costs | | | 756,352 | | | | 237,201 | |
(Increase)/decrease in dividends and interest receivable | | | (1,176,083 | ) | | | 1,857,438 | |
(Increase)/decrease in receivables for securities sold | | | 550,344 | | | | 388,587 | |
Increase/(decrease) in payables for securities purchased | | | (14,474,664 | ) | | | (3,527,413 | ) |
Increase/(decrease) in interest payable | | | 568,436 | | | | (142,391 | ) |
Increase/(decrease) in advisory fees | | | 81,125 | | | | (6,238 | ) |
Increase/(decrease) in accounting and administration fees | | | 18,721 | | | | (1,440 | ) |
Increase/(decrease) in accrued expenses | | | 57,483 | | | | 19,045 | |
| | |
|
|
| |
|
|
|
Net cash provided by/(used in) operating activities | | | (66,943,082 | ) | | | 34,648,775 | |
| | |
|
|
| |
|
|
|
Cash flows from financing activities | | | | | | | | |
Increase in loan payable | | | 100,000,000 | | | | — | |
Cash paid for debt issue costs | | | (707,156 | ) | | | (208,448 | ) |
Cash distributions paid | | | (32,361,413 | ) | | | (34,451,217 | ) |
| | |
|
|
| |
|
|
|
Net cash provided by/(used in) financing activities | | | 66,931,431 | | | | (34,659,665 | ) |
| | |
|
|
| |
|
|
|
Net decrease in cash | | | (11,651 | ) | | | (10,890 | ) |
| | |
|
|
| |
|
|
|
Cash | | | | | | | | |
Beginning balance | | | 11,651 | | | | 10,890 | |
| | |
|
|
| |
|
|
|
Ending balance | | $ | — | | | $ | — | |
| | |
|
|
| |
|
|
|
Supplemental disclosure of cash flow information: Noncash financing activities not included herein consist of reinvestment of dividends and distributions of $28,378,514 and $20,765,109 for RMK Advantage Income Fund and RMK High Income Fund, respectively.
Total cash paid for interest was $4,708,780 and $5,237,253 for RMK Advantage Income Fund and RMK High Income Fund, respectively.
(See Accompanying Notes to the Financial Statements)
74
REGIONS MORGAN KEEGAN FUNDS
STATEMENTSOF CASH FLOWS
FOR THE YEAR ENDED MARCH 31, 2006
| | | | |
| | | RMK Strategic
Income Fund | |
Cash flows from operating activities | | | | |
Net increase in net assets from operations | | $ | 38,573,832 | |
Adjustments to reconcile net increase in net assets from operations to net cash provided by/(used in) operating activities | | | | |
Purchase of investment securities | | | (486,799,859 | ) |
Proceeds from disposition of investment securities | | | 456,830,508 | |
Purchase of short-term investment securities, net | | | (14,563,580 | ) |
Proceeds from principal payments | | | 27,188,959 | |
Change in unrealized appreciation on investment securities | | | 1,310,891 | |
Amortization/accretion of premiums/discount on investment securities | | | (7,155,392 | ) |
Net realized gain on investment securities | | | 6,375,927 | |
Net realized gain on principal payments | | | 848,884 | |
Amortization of debt issue costs | | | 296,890 | |
(Increase)/decrease in dividends and interest receivable | | | 1,413,975 | |
(Increase)/decrease in receivables for securities sold | | | 1,649,967 | |
Increase/(decrease) in payables for securities purchased | | | (6,058,826 | ) |
Increase/(decrease) in interest payable | | | 888,093 | |
Increase/(decrease) in advisory fees | | | 8,142 | |
Increase/(decrease) in accounting and administration fees | | | 1,879 | |
Increase/(decrease) in accrued expenses | | | 19,900 | |
| | |
|
|
|
Net cash provided by/(used in) operating activities | | | 20,830,190 | |
| | |
|
|
|
Cash flows from financing activities | | | | |
Increase in loan payable | | | 15,000,000 | |
Cash paid for debt issue costs | | | (242,917 | ) |
Cash distributions paid | | | (35,587,273 | ) |
| | |
|
|
|
Net cash provided by/(used in) financing activities | | | (20,830,190 | ) |
| | |
|
|
|
Net increase/(decrease) in cash | | | — | |
| | |
|
|
|
Cash | | | | |
Beginning balance | | | — | |
| | |
|
|
|
Ending balance | | $ | — | |
| | |
|
|
|
Supplemental disclosure of cash flow information: Noncash financing activities not included herein consist of reinvestment of dividends and distributions of $23,323,447 for RMK Strategic Income Fund.
Total cash paid for interest was $5,100,009 for RMK Strategic Income Fund.
(See Accompanying Notes to the Financial Statements)
75
REGIONS MORGAN KEEGAN FUNDS
FINANCIAL HIGHLIGHTS
SELECTED DATA FORA SHARE OUTSTANDING THROUGHOUTTHE PERIOD INDICATED:
| | | | | | | | | | | | | | | | | |
| | | | | | |
| | | Net Asset
Value,
Beginning
of Period | | | Net
Investment
Income | | Net Realized
and Unrealized
Gains
(Losses) on
Investments | | | Total
From
Investment
Operations | | Dividends
from Net
Investment
Income | | | Distributions
from Capital
Gains | |
RMK Advantage Income Fund | | | | | | | | | | | | | | | | | |
Year Ended March 31, 2006 | | $ | 14.37 | | | 1.90 | | (0.22 | ) | | 1.68 | | (1.86 | ) | | (0.24 | ) |
Period Ended March 31, 2005 (e) | | $ | 14.33 | (b) | | 0.57 | | (0.03 | ) | | 0.54 | | (0.48 | ) | | — | |
| | | | | | |
RMK High Income Fund | | | | | | | | | | | | | | | | | |
Year Ended March 31, 2006 | | $ | 15.03 | | | 1.98 | | (0.58 | ) | | 1.40 | | (1.90 | ) | | (0.68 | ) |
Year Ended March 31, 2005 | | $ | 15.32 | | | 2.15 | | 0.24 | | | 2.39 | | (2.07 | ) | | (0.61 | ) |
Period Ended March 31, 2004 (f) | | $ | 14.33 | (b) | | 1.11 | | 1.09 | | | 2.20 | | (1.01 | ) | | (0.17 | ) |
| | | | | |
RMK Multi-Sector High Income Fund | | | | | | | | | | | | | | |
Period Ended March 31, 2006 (g) | | $ | 14.33 | (b) | | 0.21 | | 0.14 | | | 0.35 | | (0.12 | ) | | — | |
| | | | | | |
RMK Strategic Income Fund | | | | | | | | | | | | | | | | | |
Year Ended March 31, 2006 | | $ | 14.23 | | | 1.78 | | (0.20 | ) | | 1.58 | | (1.89 | ) | | (0.38 | ) |
Year Ended March 31, 2005 | | $ | 14.31 | | | 1.76 | | (0.16 | ) | | 1.60 | | (1.68 | ) | | — | |
Period Ended March 31, 2004 (h) | | $ | 14.33 | (b) | | 0.02 | | (0.02 | ) | | — | | — | | | — | |
| (a) | Total investment return is calculated assuming a purchase of a common share of stock at the opening market price of the first day and a sale at the closing market price on the last day of each period reported. Dividends and distributions are assumed, for purposes of this calculation, to be reinvested at prices obtained under the Fund’s dividend reinvestment plan. Total investment returns do not reflect brokerage commissions. Past performance is no guarantee of future results. |
| (b) | Net of sales load of $0.675 on initial shares issued. |
| (c) | Not annualized for periods less than one year. |
| (d) | Ratio annualized for the periods less than one year. |
| (e) | From the commencement of investment operations on November 8, 2004. |
| (f) | From the commencement of investment operations on June 24, 2003. |
| (g) | From the commencement of investment operations on January 19, 2006. |
| (h) | From the commencement of investment operations on March 18, 2004. |
(See Accompanying Notes to the Financial Statements)
76
REGIONS MORGAN KEEGAN FUNDS
| | | | | | | | | | | | | | | | | | | | | | | | | | | |
| | | | | | | | | | | | | | | | | Ratios to Average
Net Assets
| | | Supplemental Data
| |
Total
Distributions | | | Offering
Costs
Charged
to Paid-in
Capital | | | Net Asset
Value,
End of
Period | | Total
Return,
Net Asset
Value | | | Common
Share
Price,
End of Period | | Total
Return,
Market
Value (a) | | | Net
Expenses | | | Net
Investment
Income | | | Net Assets,
End of
Period
(000’s) | | Portfolio
Turnover
Rate | |
| | | | | | | | | | | | | | | | | | | | | | | | | | | | |
| (2.10 | ) | | — | | | $ | 13.95 | | 11.05 | % | | 16.80 | | 23.28 | % | | 2.62 | % | | 13.45 | % | | $ | 417,229 | | 104 | % |
| (0.48 | ) | | (0.02 | ) | | $ | 14.37 | | 3.53 | %(c) | | 15.59 | | 7.30 | %(c) | | 0.94 | %(d) | | 10.52 | %(d) | | $ | 403,663 | | 57 | % |
| | | | | | | | | |
| | | | | | | | | | | | | | | | | | | | | | | | | | | | |
| (2.58 | ) | | — | | | $ | 13.85 | | 7.80 | % | | 17.51 | | 24.15 | % | | 2.92 | % | | 13.66 | % | | $ | 306,699 | | 97 | % |
| (2.68 | ) | | — | | | $ | 15.03 | | 15.46 | % | | 16.50 | | 16.49 | % | | 2.12 | % | | 14.08 | % | | $ | 313,731 | | 73 | % |
| (1.18 | ) | | (0.03 | ) | | $ | 15.32 | | 15.50 | %(c) | | 16.67 | | 20.06 | %(c) | | 1.11 | %(d) | | 10.15 | %(d) | | $ | 299,772 | | 76 | % |
| | | | | | | | | |
| | | | | | | | | | | | | | | | | | | | | | | | | | | | |
| (0.12 | ) | | (0.02 | ) | | $ | 14.54 | | 2.27 | %(c) | | 15.98 | | 7.38 | %(c) | | 0.71 | %(d) | | 6.72 | %(d) | | $ | 453,523 | | 131 | % |
| | | | | | | | | |
| | | | | | | | | | | | | | | | | | | | | | | | | | | | |
| (2.27 | ) | | — | | | $ | 13.54 | | 9.95 | % | | 16.70 | | 22.60 | % | | 2.94 | % | | 12.80 | % | | $ | 362,768 | | 101 | % |
| (1.68 | ) | | — | | | $ | 14.23 | | 10.87 | % | | 15.74 | | 9.68 | % | | 1.70 | % | | 12.47 | % | | $ | 359,781 | | 69 | % |
| — | | | (0.02 | ) | | $ | 14.31 | | (0.14 | )%(c) | | 16.00 | | 6.67 | %(c) | | 0.87 | %(d) | | 3.87 | %(d) | | $ | 300,547 | | 0 | % |
77
REGIONS MORGAN KEEGAN FUNDS
NOTESTOTHE FINANCIAL STATEMENTS
RMK Advantage Income Fund, Inc., RMK High Income Fund, Inc., RMK Multi-Sector High Income Fund, Inc. and RMK Strategic Income Fund, Inc. (individually referred to as the “Fund,” or collectively as the “Funds”) were organized as separate Maryland corporations on September 7, 2004, April 16, 2003, November 14, 2005 and January 16, 2004, respectively. The Funds are registered under the Investment Company Act of 1940, as amended (the “1940 Act”), as diversified, closed-end management investment companies, each with its own investment objective.
Each Fund is authorized to issue 1,000,000,000 shares of capital stock with a par value of $0.0001 per share. The Funds’ Boards are authorized to classify and reclassify any unissued shares of capital stock from time to time by setting or changing the preferences, conversion or other rights, voting powers, restrictions, limitations as to dividends or terms and conditions of redemption of such shares by the Funds. The common shares have no preemptive, conversion, exchange or redemption rights. All common shares have equal voting, dividend, distribution and liquidation rights. The common shares, when issued, will be fully paid and non-assessable. Common stockholders are entitled to one vote per share and all voting rights for the election of directors are non-cumulative. The Funds have no present intentions of offering additional shares, except as described in the Dividend Reinvestment Plan.
| 2 | Significant Accounting Policies |
The following is a summary of significant accounting policies followed by the Funds in the preparation of their financial statements. These policies are in conformity with the accounting principles generally accepted in the United States of America.
Investment Valuations—Investments in securities listed or traded on a securities exchange are valued at the last quoted sales price on the exchange where the security is primarily traded as of close of business on the New York Stock Exchange, usually 4:00 p.m. Eastern Time, on the valuation date. Equity securities traded on the NASDAQ National Market System are valued at the NASDAQ Official Closing Price, usually 4:00 p.m., Eastern Time, on the valuation date. Securities traded in the over-the-counter market and listed securities for which no sales were reported for that date are valued at the last available bid price. Long-term debt securities, including U. S. government securities, listed corporate bonds,
78
REGIONS MORGAN KEEGAN FUNDS
other fixed income and asset-backed securities, and unlisted securities and private placement securities, are generally valued at the latest price furnished by an independent pricing service or primary market dealer. Short- term debt securities with remaining maturities of more than sixty days for which market quotations are readily available shall be valued by an independent pricing service or primary market dealer. Short-term debt securities with remaining maturities of sixty days or less shall be valued at cost with interest accrued or discount accreted to the date of maturity, unless such valuation, in the judgment of Morgan Asset Management, Inc., the Adviser, does not represent market value. Investments in open-end registered investment companies are valued at net asset value as reported by those investment companies. Investments for which market quotations are not readily available, or available quotations do not appear to accurately reflect the current value of an investment, are valued at fair value as determined in good faith by the Valuation Committee using procedures established by and under the direction of the Board of Directors. The values assigned to fair valued investments are based on available information and do not necessarily represent amounts that might ultimately be realized, since such amounts depend on future developments inherent in long-term investments. Further, because of the inherent uncertainty of valuation, those estimated values may differ significantly from the values that would have been used had a ready market for the investments existed, and the differences could be material.
Investment Transactions and Investment Income—Securities transactions are recorded on the trade date for financial reporting purposes. Realized gains and losses from securities transactions are recorded using the identified cost basis. Dividend income is recorded on the ex-dividend date, net of applicable taxes withheld by foreign countries. Interest income, including amortization of premiums and accretion of discounts, is accrued on a daily basis. Gains or losses realized on sales of securities are determined by comparing the identified cost of the security lot sold with the net sales proceeds.
Expenses—Expenses directly attributable to a Fund are charged directly to that Fund.
Dividends and Distributions to Shareholders—Each Fund pays dividends to its stockholders from the Fund’s net investment income. Income dividends for the Funds are declared and paid monthly. Each Fund also distributes all of its net realized capital gains, if any, on an annual basis. All common shares have equal dividend rights. Dividends and distributions to shareholders are recorded on the ex-dividend date.
The amounts of dividends from net investment income and distributions from net realized gains are determined in accordance with federal income tax regulations
79
REGIONS MORGAN KEEGAN FUNDS
which may differ from accounting principles generally accepted in the United States of America. These “book/tax” differences are either considered temporary or permanent in nature. To the extent these differences are permanent in nature (i.e. reclass of market discounts, net operating gain/loss, paydowns, and distributions), such amounts are reclassified within the composition of net assets based on their federal tax-basis treatment; temporary differences do not require reclassification. To the extent distributions from net investment income and net realized gains exceed net investment income and net realized gains for tax purposes, they are reported as distributions of capital.
Repurchase Agreements—The Funds may purchase instruments from financial institutions, such as banks and broker-dealers, subject to the seller’s agreement to repurchase them at an agreed upon time and price (“repurchase agreement”). The Funds may invest in repurchase agreements with institutions that are deemed by Morgan Asset Management, Inc., the Adviser, to be of good standing and creditworthy. A third party custodian bank takes possession of the underlying securities (“collateral”) of a repurchase agreement, the value of which is at all times at least equal to the principal amount of the repurchase transaction, including accrued interest. In the event of counterparty default on the obligation to repurchase, each Fund has the right to liquidate the collateral and apply the proceeds in satisfaction of the obligation. However, there could be potential losses to the Funds in the event of default or bankruptcy by the counterparty to the agreement and the Funds are delayed or prevented from exercising their rights to dispose of the collateral, including the risk of possible decline in the value of the collateral during the period while the Funds seek to assert their rights.
Option Writing—When a Fund writes an option, an amount equal to the premium received by the Fund is recorded as a liability and is subsequently adjusted to the current fair value of the option written. Premiums received from writing options that expire unexercised are treated by the Fund on the expiration date as realized gains from investments. If a call option is exercised, the premium is added to the proceeds from the sale of the underlying security in determining whether the Fund has realized a gain or loss. If a put option is exercised, the premium reduces the cost basis of the securities purchased by the Fund. The Fund, as writer of an option, bears the market risk of an unfavorable change in the price of the security underlying the written option.
80
REGIONS MORGAN KEEGAN FUNDS
When-Issued and Delayed Delivery Transactions—The Funds may engage in when-issued or delayed delivery transactions. The Funds record when-issued securities on the trade date and maintain security positions such that sufficient liquid assets will be available to make payment for the securities purchased. Securities purchased on a when-issued or delayed delivery basis are marked to market daily and begin earning interest on the settlement date. Losses may occur on these transactions due to changes in market conditions or the failure of counterparties to perform under the contract.
Use of Estimates—The preparation of financial statements in conformity with accounting principles generally accepted in the United States of America requires management to make estimates and assumptions that affect the reported amount of assets and liabilities and disclosure of contingent assets and liabilities at the date of the financial statements and the reported amounts of revenues and expenses during the reporting period. Actual results could differ from these estimates.
Cash—Cash represents deposits in bank accounts.
| 3 | Agreements and Other Transactions with Affiliates |
Investment Adviser—The Funds have entered into Investment Advisory Agreements with Morgan Asset Management, Inc. (the “Adviser”), a wholly owned subsidiary of MK Holding, Inc., which is a wholly owned subsidiary of Regions Financial Corporation (“Regions”). Under the terms of the agreements, the Funds are charged an annual advisory fee of 0.65% based on a percentage of each Fund’s average daily total assets minus the sum of accrued liabilities other than debt entered into for purposes of leverage.
Accounting and Administrative Services—The Funds have entered into Accounting and Administrative Services Agreements with Morgan Keegan & Company, Inc. (“Morgan Keegan”), a wholly owned subsidiary of Regions. Under the terms of the agreements, Morgan Keegan provides portfolio accounting services and certain administrative personnel and services to the Funds for an annual fee of 0.15% based on a percentage of each Fund’s average daily total assets minus the sum of accrued liabilities other than debt entered into for purposes of leverage. Morgan Keegan also provides an employee to serve as the Funds’ Chief Compliance Officer for which Morgan Keegan receives no additional compensation from the Funds.
Directors and Officers—Certain of the Officers and Directors of the Funds are also Officers and Directors of the Adviser, Morgan Keegan, and Regions. Such Officers and Directors of the Company who are “Interested Persons” as defined in the 1940 Act receive no salary or fees from the Funds.
81
REGIONS MORGAN KEEGAN FUNDS
Each Independent Director receives an annual retainer of $4,000 and a fee of $1,000 per quarterly meeting with reimbursement for related expenses for each meeting of the Board attended from each Fund. Each chairperson of the Independent Directors Committee and Audit Committee receives annual compensation of $500 from each Fund. An additional $1,500 is paid to the Independent Directors for attending special meetings in person, and an additional $500 is paid for attending special meetings by telephone. No Officer or Director is entitled to receive pension or retirement benefits from the Funds.
Other Transactions—For the period ended March 31, 2006, Morgan Keegan earned no underwriting discounts, direct commissions, or dealer incentives on the sales and purchases of investment securities.
Transactions in options written during the year or period ended March 31, 2006 were as follows:
| | | | | | | | | | | | | | |
| | | RMK Advantage
Income Fund
| | | RMK High
Income Fund
| |
| | | Number of
Contracts
| | | Premiums
Received
| | | Number of
Contracts
| | | Premiums
Received
| |
Options outstanding at March 31, 2005 | | — | | | $ | — | | | — | | | $ | — | |
Options written | | 15,827 | | | | 307,068 | | | 3,665 | | | | 268,980 | |
Options expired | | (13,330 | ) | | | (83,712 | ) | | (1,468 | ) | | | (80,904 | ) |
Options exercised | | (2,031 | ) | | | (164,790 | ) | | (1,892 | ) | | | (142,213 | ) |
| | |
|
| |
|
|
| |
|
| |
|
|
|
Options outstanding at March 31, 2006 | | 466 | | | $ | 58,566 | | | 305 | | | $ | 45,863 | |
| | |
|
| |
|
|
| |
|
| |
|
|
|
| | |
| | | RMK Multi-Sector
High Income Fund
| | | RMK Strategic Income
Fund
| |
| | | Number of
Contracts
| | | Premiums
Received
| | | Number of
Contracts
| | | Premiums
Received
| |
Options outstanding at March 31, 2005 | | — | | | $ | — | | | — | | | $ | — | |
Options written | | 178 | | | | 20,732 | | | 5,473 | | | | 437,588 | |
Options expired | | (25 | ) | | | (1,783 | ) | | (1,962 | ) | | | (117,350 | ) |
Options exercised | | — | | | | — | | | (2,872 | ) | | | (230,460 | ) |
| | |
|
| |
|
|
| |
|
| |
|
|
|
Options outstanding at March 31, 2006 | | 153 | | | $ | 18,949 | | | 639 | | | $ | 89,778 | |
| | |
|
| |
|
|
| |
|
| |
|
|
|
82
REGIONS MORGAN KEEGAN FUNDS
During the period ended March 31, 2006, cost of purchases and proceeds from sales and maturities of investment securities, including long-term U.S. government securities, but excluding short-term securities, for each Fund were as follows:
| | | | | | | | | | | | |
| | | RMK
Advantage
Income Fund | | RMK
High Income
Fund | | RMK
Multi-Sector High
Income Fund | | RMK
Strategic
Income Fund |
Cost of Investments | | $ | 619,549,912 | | $ | 397,920,072 | | $ | 516,079,447 | | $ | 486,799,859 |
Proceeds from Sales | | | 538,252,055 | | | 426,521,498 | | | 101,593,585 | | | 503,522,111 |
The Funds are permitted to borrow up to one-third of the value of their net assets, before such borrowings, for investment purposes. Such borrowing is referred to as leveraging and the Funds have collateralized bank lines of credit for this purpose. As of March 31, 2006, the Funds’ borrowing arrangements were as follows:
RMK Advantage Income Fund has a collateralized $160,000,000 bank line of credit, which matures in March of 2007. All of the Fund’s investment securities, except for common stocks, are pledged as collateral under the borrowing arrangement and the collateral may be sold. As of March 31, 2006, the outstanding balance on the line of credit was $150,000,000. Borrowings under this agreement bear interest at a variable rate determined by the bank’s conduit program, which has historically been slightly below LIBOR. Fees of 0.13% per annum are paid on the total line of credit, regardless of usage, and of 0.23% per annum on the amount borrowed. The average balance during the period ended March 31, 2006 was $130,769,231 or $4.52 per share, based on average shares outstanding of 28,943,354. The average interest rate during the period ended March 31, 2006 was 3.783%. The maximum amount of borrowings outstanding at any month-end during the period was $150,000,000.
RMK High Income Fund has a collateralized $125,000,000 bank line of credit, which matures in December of 2006. All of the Fund’s investment securities are pledged as collateral under the borrowing arrangement and the collateral may be sold. As of March 31, 2006, the outstanding balance on the line of credit was $115,000,000. Borrowings under this agreement bear interest at a fixed rate on the date of borrowing at LIBOR plus 0.75% per
83
REGIONS MORGAN KEEGAN FUNDS
annum. Fees of 0.10% per annum are paid on the total line of credit, regardless of usage. The average balance during the period ended March 31, 2006 was $115,000,000 or $5.36 per share, based on average shares outstanding of 21,436,549. The average interest rate during the period ended March 31, 2006 was 4.336%. The maximum amount of borrowings outstanding at any month-end during the period was $115,000,000.
RMK Strategic Income Fund has a collateralized $150,000,000 bank line of credit, which matures in July of 2006. All of the Fund’s investment securities are pledged as collateral under the borrowing arrangement and the collateral may be sold. As of March 31, 2006, the outstanding balance on the line of credit was $140,000,000. Borrowings under this agreement bear interest at a fixed rate on the date of borrowing at LIBOR plus 0.60% per annum. Fees of 0.10% per annum are paid on the total line of credit, regardless of usage. The average balance during the period ended March 31, 2006 was $134,230,769 or $5.17 per share, based on average shares outstanding of 25,983,833. The average interest rate during the period ended March 31, 2006 was 4.136%. The maximum amount of borrowings outstanding at any month-end during the period was $140,000,000.
Each Fund is treated as a separate entity for federal tax purposes. No provision for federal income or excise taxes is required since the Funds intend to qualify each year as regulated investment companies under Subchapter M of the Internal Revenue Code (the “Code”) and distribute substantially all their taxable net investment income and capital gains to their shareholders.
Because federal income tax regulations differ from accounting principles generally accepted in the United States of America, income and capital gains distributions determined in accordance with tax regulations may differ from net investment income and realized gains recognized for financial reporting purposes. These differences are primarily due to differing treatments for gains/losses on principal payments of mortgage- and asset-backed securities, REIT adjustments, distribution reclassifications or a return of capital.
Permanent book and tax basis differences, if any, relating to shareholder distributions will result in reclassifications to paid-in-capital. These reclassifications have no effect on net assets or net asset values per share. Any taxable gain remaining at fiscal year end is distributed in the following year.
84
REGIONS MORGAN KEEGAN FUNDS
For the period ended March 31, 2006, permanent differences identified and reclassified among the components of net assets were as follows:
| | | | | | | | | | | | | | | | |
| | | RMK
Advantage
Income Fund | | | RMK
High Income
Fund | | | RMK
Multi-Sector
High Income
Fund | | | RMK
Strategic
Income Fund | |
Undistributed Net Investment Income | | $ | (1,347,924 | ) | | $ | (2,020,239 | ) | | $ | (230,869 | ) | | $ | 1,210,418 | |
Accumulated Net Realized Gain (Loss) on Investments | | | 1,347,924 | | | | 2,020,239 | | | | 230,869 | | | | (649,110 | ) |
Paid in Capital | | | — | | | | — | | | | — | | | | (561,298 | ) |
The tax character of distributions as reported on the Statements of Changes in Net Assets for the year ended March 31, 2006 was as follows:
| | | | | | | | | | | | |
| | | RMK
Advantage
Income Fund | | RMK
High Income
Fund | | RMK
Multi-Sector
High Income
Fund | | RMK
Strategic
Income Fund |
Ordinary Income1 | | $ | 58,852,032 | | $ | 47,664,460 | | $ | 3,726,838 | | $ | 58,120,300 |
Long-term Capital Gains | | | 1,887,895 | | | 7,551,866 | | | — | | | 229,122 |
Return of Capital | | | — | | | — | | | — | | | 561,298 |
| | |
|
| |
|
| |
|
| |
|
|
Total Distributions | | $ | 60,739,927 | | $ | 55,216,326 | | $ | 3,726,838 | | $ | 58,910,720 |
| | |
|
| |
|
| |
|
| |
|
|
| 1 | | For tax purposes, short-term capital gain distributions are considered ordinary income distributions. |
85
REGIONS MORGAN KEEGAN FUNDS
For the year ended March 31, 2006, the tax basis components of net assets were as follows:
| | | | | | | | |
| | | RMK
Advantage
Income Fund | | | RMK
High Income
Fund | |
Gross Unrealized Appreciation | | $ | 14,242,308 | | | $ | 11,317,766 | |
Gross Unrealized (Depreciation) | | | (27,951,023 | ) | | | (27,233,858 | ) |
| | |
|
|
| |
|
|
|
Net Unrealized Appreciation/(Depreciation) | | | (13,708,715 | ) | | | (15,916,092 | ) |
Undistributed Ordinary Income | | | 1,170,107 | | | | 367,169 | |
Undistributed Long-Term Capital Gains | | | — | | | | — | |
Capital Loss Carryforwards and Post October Losses | | | (839,710 | ) | | | — | |
Other | | | — | | | | (42,331 | ) |
| | |
|
|
| |
|
|
|
Distributable Earnings | | | (13,378,318 | ) | | | (15,591,254 | ) |
Paid-in Capital | | | 430,607,457 | | | | 322,290,315 | |
| | |
|
|
| |
|
|
|
Net Assets | | $ | 417,229,139 | | | $ | 306,699,061 | |
| | |
|
|
| |
|
|
|
| | | | | | | | |
| | | RMK
Multi-Sector
High Income
Fund | | | RMK
Strategic
Income Fund | |
Gross Unrealized Appreciation | | $ | 5,377,363 | | | $ | 16,402,371 | |
Gross Unrealized (Depreciation) | | | (2,280,225 | ) | | | (32,238,471 | ) |
| | |
|
|
| |
|
|
|
Net Unrealized Appreciation/(Depreciation) | | | 3,097,138 | | | | (15,836,100 | ) |
Undistributed Ordinary Income | | | 4,049,007 | | | | — | |
Undistributed Long-Term Capital Gains | | | 68 | | | | — | |
Capital Loss Carryforwards and Post October Losses | | | — | | | | (7,129,637 | ) |
| | |
|
|
| |
|
|
|
Distributable Earnings | | | 7,146,213 | | | | (22,965,737 | ) |
Paid-in Capital | | | 446,376,863 | | | | 385,733,792 | |
| | |
|
|
| |
|
|
|
Net Assets | | $ | 453,523,076 | | | $ | 362,768,055 | |
| | |
|
|
| |
|
|
|
At March 31, 2006, the Funds’ cost of investments for federal tax purposes was as follows:
| | | | | | | | | | | | |
| | | RMK
Advantage
Income Fund | | RMK
High Income
Fund | | RMK
Multi-Sector
High Income
Fund | | RMK Strategic
Income Fund |
Cost of Investments | | $ | 576,342,512 | | $ | 432,549,266 | | $ | 447,476,106 | | $ | 514,407,988 |
86
REGIONS MORGAN KEEGAN FUNDS
Capital Loss Carryforwards—At March 31, 2006, the RMK Strategic Income Fund had a capital loss carryforward of $5,339,876 expiring in 2014 which will reduce the Funds’ taxable income arising from future net realized gains on investments, if any, to the extent permitted by the Code, and thus will reduce the amount of the distributions to shareholders which would otherwise be necessary to relieve the Funds of any liability for federal tax.
Post-October Losses Deferred—Pursuant to federal income tax regulations applicable to investment companies, the Funds have elected to treat net capital losses realized between November 1 and March 31 of each year as occurring on the first day of the following tax year. For the period ended March 31, 2006, RMK Advantage Income Fund and RMK Strategic Income Fund had $839,710 and $1,789,761 in post October losses, respectively, which will not be recognized for federal income tax purposes until next year.
| 8 | Concentration of Credit Risk |
The Funds invest primarily in debt instruments. The ability of the issuers of the securities held by the Funds to meet their obligations might be affected by economic developments in a specific industry, state, or region.
As of April 3, 2006, RMK Multi-Sector High Income Fund obtained a collateralized $180,000,000 bank line of credit, which matures in April of 2007. All of the Fund’s investment securities, except for common stocks, are pledged as collateral under the borrowing arrangement and the collateral may be sold. Borrowings under this agreement bear interest at a variable rate determined by the bank’s conduit program, which has historically been slightly below LIBOR. Fees of 0.13% per annum are paid on the total line of credit, regardless of usage, and of 0.23% per annum on the amount borrowed. As of May 1, 2006, the outstanding balance on the line of credit was $50,000,000.
87
[THIS PAGE INTENTIONALLY LEFT BLANK]
88
REPORTOF INDEPENDENT REGISTERED
PUBLIC ACCOUNTING FIRM
To the Board of Directors and Stockholders of RMK Advantage Income Fund, Inc., RMK High Income Fund, Inc., RMK Multi-Sector High Income Fund, Inc., RMK Strategic Income Fund, Inc.:
In our opinion, the accompanying statements of assets and liabilities, including the portfolios of investments, and the related statements of operations, cash flows and of changes in net assets and the financial highlights present fairly, in all material respects, the financial position of RMK Advantage Income Fund, Inc., RMK High Income Fund, Inc., RMK Multi-Sector High Income Fund, Inc., and RMK Strategic Income Fund, Inc. (hereafter referred to as the “Funds”) at March 31, 2006, the results of each of their operations, cash flows and the changes in each of their net assets and the financial highlights for the periods presented, in conformity with accounting principles generally accepted in the United States of America. These financial statements and financial highlights (hereafter referred to as “financial statements”) are the responsibility of the Funds’ management; our responsibility is to express an opinion on these financial statements based on our audits. We conducted our audits of these financial statements in accordance with the standards of the Public Company Accounting Oversight Board (United States). Those standards require that we plan and perform the audits to obtain reasonable assurance about whether the financial statements are free of material misstatement. An audit includes examining, on a test basis, evidence supporting the amounts and disclosures in the financial statements, assessing the accounting principles used and significant estimates made by management, and evaluating the overall financial statement presentation. We believe that our audits, which included confirmation of securities at March 31, 2006 by correspondence with the custodian and brokers, provide a reasonable basis for our opinion.

Memphis, Tennessee
May 22, 2006
89
BOARDOF DIRECTORSAND OFFICERS
The following tables set forth information concerning the Directors and Officers of the Funds. All persons named as Directors and Officers also serve in similar capacities for the other registered investment companies in the Regions Morgan Keegan Fund complex overseeing a total of eighteen portfolios. The Regions Morgan Keegan Fund complex includes Morgan Keegan Select Fund, Inc., Regions Morgan Keegan Select Funds, RMK Advantage Income Fund, Inc., RMK High Income Fund, Inc., RMK Multi-Sector High Income Fund, Inc. and RMK Strategic Income Fund, Inc.
An asterisk (*) indicates Directors and/or Officers who are “interested persons” of the Funds as defined by the 1940 Act. All of the Independent Directors serve on each Fund’s Audit Committee. The Statement of Additional Information for the Funds includes additional information about the Fund’s Directors and is available upon request, without charge, by calling Morgan Keegan at 800-564-2188.
DIRECTORS
| | |
Name, Age, Position,
Length of Service | | Principal Occupation During Past Five Years |
| |
Allen B. Morgan, Jr.* Age 63, Director, Since 2003 / 2004 / 20051 | | Mr. Morgan has served as a Director and Vice-Chairman of Regions Financial Corporation since 2001 and 2003, respectively. He has also served as a Director of Morgan Asset Management, Inc. since 1993. He also has been Chairman of Morgan Keegan & Company, Inc. since 1969 and Executive Managing Director of Morgan Keegan & Company, Inc. since 1969. |
| |
J. Kenneth Alderman* Age 53, Director, Since 2003 / 2004 / 20051 | | Mr. Alderman has been President of Regions Morgan Keegan Trust and Chief Executive Officer of Morgan Asset Management, Inc. since 2002. He has been Executive Vice President of Regions Financial Corporation since 2000. He is a Certified Public Accountant and a Chartered Financial Analyst. |
90
BOARDOF DIRECTORSAND OFFICERS
| | |
Name, Age, Position,
Length of Service | | Principal Occupation During Past Five Years |
| |
Jack R. Blair Age 64, Director, Since 2005 | | Mr. Blair serves as non-executive Chairman of dj Orthopedics, Inc. in Vista, CA. He also serves as a director of NuVasive, Inc. in San Diego, CA, Buckman Laboratories, Inc. and Active Implants Corporation, both located in Memphis, TN. Mr. Blair served as non-executive Chairman of SCB Computer Technology, Inc. from September 2000 until March 2004 when the company was acquired by CIBER, Inc. |
| |
Albert C. Johnson Age 61, Director, Since 2005 | | Mr. Johnson has been an independent financial consultant since 1998. He also has served as Director of Books-A-Million, Inc. since 2005. He was Senior Vice President and Chief Financial Officer of Dunn Investment Company (construction) from 1994 to 1998. He was also with Arthur Andersen LLP from 1965 to 1994, retiring as the Managing Partner of the firm’s Birmingham Office. |
| |
James Stillman R. McFadden Age 48, Director, Since 2003 / 2004 / 20051 | | Mr. McFadden has been Chief Manager of McFadden Communications, LLC (commercial printing) since 2002 and President and Director of 1703, Inc. (restaurant management) since 1998. He also has served as a Director for several private companies since 1997. |
91
BOARDOF DIRECTORSAND OFFICERS
| | |
Name, Age, Position,
Length of Service | | Principal Occupation During Past Five Years |
| |
W. Randall Pittman Age 52, Director, Since 2003 / 2004 / 20051 | | Mr. Pittman has been Chief Financial Officer of Emageon Inc. (healthcare information systems) since 2002. From 1999 to 2002, he was Chief Financial Officer of BioCryst Pharmaceuticals, Inc. (biotechnology). From 1998 to 1999, he was Chief Financial Officer of ScandiPharm, Inc. (pharmaceuticals). From 1995 to 1998, he served as Senior Vice President – Finance of CaremarkRx (pharmacy benefit management). From 1983 to 1995, he held various positions with AmSouth Bancorporation (bank holding company), including Executive Vice President and Controller. He is a Certified Public Accountant, and was with the accounting firm of Ernst & Young, LLP from 1976 to 1983. |
| |
Mary S. Stone Age 55, Director, Since 2003 / 2004 / 20051 | | Ms. Stone has been a professor at the University of Alabama Culverhouse School of Accountancy since 1981 and has held the Hugh Culverhouse Endowed Chair of Accountancy since 2002. She is also a former member of Financial Accounting Standards Advisory Council, AICPA, Accounting Standards Executive Committee and AACSB International Accounting Accreditation Committee. |
| |
Archie W. Willis III Age 48, Director, Since 2003 / 2004 / 20051 | | Mr. Willis has been President of Community Capital (financial advisory and real estate development consulting) since 1999 and Vice President of Community Realty Company (real estate brokerage) since 1999. He was a First Vice President of Morgan Keegan & Company, Inc. from 1991 to 1999. He also has served as a Director of Memphis Telecom, LLC since 2001. |
| 1 | | RMK High Income Fund, RMK Strategic Income Fund, RMK Advantage Income Fund and RMK Multi-Sector High Income Fund commenced investment operations on June 24, 2003, March 18, 2004, November 8, 2004 and January 19, 2006, respectively. |
The address of each Director is c/o the Fund, Fifty North Front Street, 21st Floor, Memphis, TN 38103.
92
BOARDOF DIRECTORSAND OFFICERS
Each Fund’s Board of Directors is divided into three classes: Class I, Class II and Class III. The terms of office of the Class I, Class II and Class III Directors expire at the Annual Meeting of Stockholders in the year 2007, year 2008, and year 2006, respectively, or thereafter in each case when their respective successors are duly elected and qualified. Each Director who is not an interested person of the Fund serves on the Funds’ Audit, Independent Directors and Qualified Legal Compliance Committees.
OFFICERS
| | |
Name, Age, Position,
Length of Service | | Principal Occupation During Past Five Years |
| |
Carter E. Anthony* Age 61, President, Since 2003 / 2004 / 20051 | | From 2002 to present, Mr. Anthony has served as President and Chief Investment Officer of Morgan Asset Management, Inc. From 2000 to 2002, he served as Executive Vice President and Director of Capital Management Group, Regions Financial Corporation. He holds the Chartered Financial Analyst designation. |
| |
Thomas R. Gamble* Age 63, Vice President, Since 2003 / 2004 / 20051 | | Mr. Gamble has been an executive at Regions Financial Corporation since 1981. He was a Corporate IRA Manager from 2000 to 2001 and a Senior Vice President and Manager of Employee Benefits at the Birmingham Trust Department of Regions Bank from 1981 to 2000. |
| |
Joseph C. Weller* Age 67, Treasurer, Since 2003 / 2004 / 20051 | | Mr. Weller has been Executive Vice President and Chief Financial Officer of Morgan Keegan & Company, Inc. since 1969, Treasurer and Secretary of Morgan Keegan & Company, Inc. since 1969 and Executive Managing Director of Morgan Keegan & Company, Inc. since 1969. He also has served as a Director of Morgan Asset Management, Inc. since 1993. |
93
BOARDOF DIRECTORSAND OFFICERS
| | |
Name, Age, Position,
Length of Service | | Principal Occupation During Past Five Years |
| |
Charles D. Maxwell* Age 52, Secretary and Assistant Treasurer, Since 2003 / 2004 / 20051 | | Mr. Maxwell has been a Managing Director of Morgan Keegan & Company, Inc. since 1998 and Assistant Treasurer and Assistant Secretary of Morgan Keegan & Company, Inc. since 1994. He has been Secretary and Treasurer of Morgan Asset Management, Inc. since 1993. He was Senior Vice President of Morgan Keegan & Company, Inc. from 1995 to 1997. Mr. Maxwell was also with the accounting firm of Ernst & Young, LLP from 1976 to 1986 and served as a Senior Manager from 1984 to 1986. |
| |
J. Thompson Weller, Sr.* Age 41, Assistant Secretary, Since 2003 / 2004 / 20051 | | Mr. Weller has been a Managing Director and Controller of Morgan Keegan & Company, Inc. since October 2001. He was Senior Vice President and Controller of Morgan Keegan & Company, Inc. from October 1998 to October 2001, Controller and First Vice President from February 1997 to October 1998, Controller and Vice President from 1995 to February 1997 and Assistant Controller from 1992 to 1995. |
| |
Michele L. Fowler* Age 37, Chief Compliance Officer, Since 2006 | | Ms. Fowler has been the Chief Compliance Officer of Morgan Asset Management, Inc. since April 2006. She was a Senior Attorney and First Vice President of Morgan Keegan & Company, Inc. from April 2002 to April 2006. She was an Attorney with FedEx Corporation from 2001 to 2002 specializing in employment litigation. She was a Staff Attorney with Ford & Harrison, LLP from 1997 to 2001. |
| 1 | | RMK High Income Fund, RMK Strategic Income Fund, RMK Advantage Income Fund and RMK Multi-Sector High Income Fund commenced investment operations on June 24, 2003, March 18, 2004, November 8, 2004 and January 19, 2006, respectively. |
Officers of the Funds are elected and appointed annually by the Board of Directors and hold office until they resign, are removed, or are otherwise disqualified to serve.
94
BOARDOF DIRECTORSAND OFFICERS
Joseph C. Weller is the father of J. Thompson Weller. The address of Messrs. Maxwell, Weller, Weller, and Ms. Fowler is Fifty North Front Street, Memphis, Tennessee 38103. The address of Messrs. Anthony and Gamble is 417 North 20th Street, 15th Floor, Birmingham, Alabama 35203.
95
DIVIDEND REINVESTMENT PLAN
The Funds offer a dividend reinvestment plan (the “Plan”) pursuant to which shareholders, unless they elect otherwise, automatically have dividends and capital gains distributions reinvested in common shares of the fund by EquiServe Trust Company, N.A. and EquiServe, Inc. (together, the “Plan Agent”). Shareholders who elect not to participate in the Plan receive all distributions in cash paid by wire or check mailed directly to the recordholder by the Plan Agent.
How the Plan Works
After the funds declare a dividend or determine to make a capital gain distribution, the Plan Agent will acquire shares for the participants’ accounts, depending upon the circumstances described below, either (i) through receipt of newly-issued shares of the fund or (ii) by open-market purchases as follows:
| n | | If, on the payment date, the NAV is equal to or less than the market price per share plus estimated brokerage commissions, the Plan Agent will invest the distribution amount in newly-issued shares on behalf of the participants. The number of newly-issued shares to be credited to each participant’s account will be determined by dividing the dollar amount of the distribution by the NAV on the date the shares are issued. However, if the NAV is less than 95% of the market price on the payment date, the dollar amount of the distribution will be divided by 95% of the market price on the payment date. Because common shares may be issued at less than their market price, Plan participants may get a benefit that non-participants do not. |
| n | | If, on the payment date, the NAV is greater than the market value per share plus estimated brokerage commissions, the Plan Agent will invest the distribution amount in shares acquired on behalf of the participants in open-market purchases, which may be made on the NYSE, in the over-the-counter market or in negotiated transactions and may be on such terms as to price, delivery and otherwise as the Plan Agent shall determine. It is possible that the market price for the shares may increase before the Plan Agent has completed its purchases. Therefore, the average purchase price per share the Plan Agent pays may exceed the market price thereof on the payment date. If the market price per share increases so that it equals or exceeds the NAV per share (minus estimated brokerage commissions), the Plan Agent will cease its purchases. Otherwise, the Plan Agent will use all distributions received in cash to purchase shares in the open market on or shortly after the payment date, but in no event more than thirty (30) days after the payment date, except where temporary curtailment or suspension of purchase is necessary to comply with applicable provisions of the federal securities laws. If the Plan Agent is unable to invest the full amount through open-market purchases |
96
DIVIDEND REINVESTMENT PLAN
| | during the purchase period, the Plan Agent will request that, with respect to the uninvested portion of such amount, the fund issue new shares at the close of business on the earlier of the last day of the purchase period or the first day during the purchase period on which the NAV per share (minus estimated brokerage commissions) equals or is less than the market price per share. |
Costs of the Plan
The Plan Agent’s fees for the handling of the reinvestment of dividends and other distributions will be paid by the fund. However, each participant will pay a pro rata share of brokerage commissions incurred with respect to the Plan Agent’s open-market purchases in connection with the reinvestment of dividends and other distributions. If a participant elects to have the Plan Agent sell part or all of his or her shares and remit the proceeds, the participant will be subject to a $15.00 service fee and a $0.12 per share sold processing fee (which includes applicable brokerage commissions the Plan Agent is required to pay). The participant will not be charged any other fees for this service. However, the fund reserves the right to amend the Plan to include a service fee payable by the participant.
Tax Implications
The automatic reinvestment of dividends or distributions does not relieve participants of any taxes which may be payable on such dividends or distributions. Participants will receive tax information annually for their personal records and to help them prepare their federal income tax return. For further information as to the tax consequences of participation in the Plan, participants should consult with their own tax advisors.
Right to Withdraw
Participants may withdraw from the Plan by calling the Plan Agent at 800-426-5523, writing to the Plan Agent at P.O. Box 43010, Providence, Rhode Island 02940-3010 or completing and returning the transaction form attached to each Plan statement. The withdrawal will be effective immediately if the participant’s notice is received by the Plan Agent not less than ten days prior to any dividend or distribution record date. Otherwise, the withdrawal will be effective the first trading day after the payment date for the dividend or distribution with respect to any subsequent dividend or distribution.
97
SUPPLEMENTAL INFORMATION
BOARD APPROVALOFTHE INVESTMENT ADVISORY AGREEMENTFOR RMK MULTI-SECTOR HIGH INCOME FUND, INC.
On December 19, 2005, the investment advisory agreement for RMK Multi-Sector High Income Fund, Inc. was considered and unanimously approved by its Board of Directors. The Independent Directors were assisted by independent legal counsel during their deliberations. In evaluating the investment advisory agreement, the Board reviewed information furnished by the Adviser, including information regarding its affiliates and its personnel and operations. The Board also specifically considered the following as relevant to its determination to approve the investment advisory agreement: (1) the history, reputation, qualification and background of the Adviser and the portfolio manager and his team; (2) the breadth of the securities from which the Adviser would select investments for the Fund and the analysis related to those securities; (3) the nature, extent and quality of services provided by the Adviser to other closed-end funds it advises and the nature, extent and quality of the services to be provided by the Adviser under the investment advisory agreement; (4) the advisory fee and estimated expense ratio of the Fund relative to the quality of services expected to be provided and the fee and expense ratios of similar closed-end funds with similar investment objectives and policies; (5) the extent to which potential economies of scale have been taken into account in setting the advisory fees; (6) the level and method of computing the Fund’s advisory fees, including the fact that the Fund would pay fees on assets managed, which will include any amounts borrowed for purposes of leverage; (7) the level of fees the Adviser charges other funds or accounts for the same or similar services; (8) the Adviser’s disciplinary history; (9) the Adviser’s compliance systems and capabilities; (10) potential conflicts of interest, including that the Adviser receives higher fees when the Fund leverages; and (11) other factors deemed relevant by the Board. The Board did not identify any single factor or information as all-important or controlling.
The Board, in examining the nature, extent and quality of the services to be provided by the Adviser considered the Adviser’s experience in serving as an investment adviser for funds comparable to the Fund. The Board noted the responsibilities and success that the Adviser has as investment adviser for these other funds. In particular, the Board considered that the Adviser is responsible for making investment decisions on behalf of these other funds, placing all orders for the purchase and sale of investments for the funds with brokers or dealers and that the same services would be provided to the Fund under the investment advisory
98
SUPPLEMENTAL INFORMATION
agreement. The Board also reviewed information regarding the Adviser’s investment process and the qualifications and experience of the persons who will serve as portfolio managers of the Fund.
The Board considered the fees payable under the investment advisory agreement. In this connection, the Board evaluated the Adviser’s expected costs and profitability (to the extent practicable) in providing services to Fund, including the expected costs associated with the research and investment processes, personnel, systems and equipment necessary to perform their functions. The Board also examined the fees to be paid by the Fund in light of fees paid by comparable funds.
Based on these considerations, the Board concluded that: (1) the Fund was likely to benefit from the nature, quality and extent of the Adviser’s services; and (2) the Adviser has the resources to provide the services and to carry out its responsibilities under the investment advisory agreement. The Board also concluded that the terms of the investment advisory agreement, including the Adviser’s proposed compensation were fair and reasonable and that approval of the investment advisory agreement was in the best interests of the Fund. The Board, including the Independent Directors, unanimously approved the investment advisory agreement.
PRIVACY POLICY NOTICE
The Regions Family of Companies and their agents (referred to as the “Funds,” “we” or “us”) recognize that consumers (referred to as “you” or “your”) expect us to protect both your assets and financial information. We respect your right to privacy and your expectation that all personal information about you or your account will be maintained in a secure manner. We are committed to maintaining the confidentiality, security and integrity of client and shareholder information. We want you to understand the Funds’ policy that governs the handling of your information, how the Funds gather information, how that information is used and how it is kept secure.
Information The Funds Collect
The Funds collect nonpublic personal information about you from the following sources:
| n | | We may receive information from you, or from your financial representative, on account applications, other forms or electronically (such as through the Funds’ website or other electronic trading mechanisms). Examples of this information include your name, address, social security number, assets and income. |
99
SUPPLEMENTAL INFORMATION
| n | | We may receive information from you, or from your financial representative, through transactions with us or others, correspondence and other communications. Examples of this information include specific investments and your account balances. |
| n | | We may obtain other personal information from you in connection with providing you a financial product or service. Examples of this information include depository, debit or credit account numbers. |
Information Sharing Policy
The Funds may share the nonpublic personal information about you, as described above, with financial or non-financial companies or other entities, including companies that may be affiliated with the Funds and other nonaffiliated third parties, for the following purposes:
| n | | We may share information when it is necessary and required to process a transaction or to service a customer relationship. For example, information may be shared with a company that provides account record keeping services or a company that provides proxy services to shareholders. |
| n | | We may share information when it is required or permitted by law. For example, information may be shared in response to a subpoena or to protect you against fraud or with someone who has established a legal beneficial interest, such as a power of attorney. |
| n | | We may disclose all of the information we collect, as described above, to companies that perform marketing or other services on our behalf or to other financial institutions with whom we have agreements, for the limited purpose of jointly offering, endorsing or sponsoring a financial product or service. For example, we may share information about you for these limited purposes with the bank, broker-dealer or other financial intermediary through whom you purchased the Funds’ products or services, or with providers of marketing, legal, accounting or other professional services. The Funds will not, however, disclose a consumer’s account number or similar form of access number or access code for credit card, deposit or transaction accounts to any nonaffiliated third party for use in telemarketing, direct mail or other marketing purposes. |
Except as described above, the Funds do not share customer information. We will not rent, sell, trade, or otherwise release or disclose any personal information about you. Any information you provide to us is for the Funds’ use only. If you decide to close your account(s) or become an inactive customer, we will adhere to the privacy policies and practices as described in this notice.
100
SUPPLEMENTAL INFORMATION
Information Security
When the Funds share nonpublic customer information with third parties hired to facilitate the delivery of certain products or services to our customers, such information is made available for limited purposes and under controlled circumstances designed to protect our customers’ privacy. We require third parties to comply with our standards regarding security and confidentiality of such information. We do not permit them to use that information for their own or any other purposes, or rent, sell, trade or otherwise release or disclose the information to any other party. These requirements are reflected in written agreements between the Funds and the third party service providers.
The Funds protect your personal information in several ways. We maintain physical, electronic, and procedural safeguards to guard your nonpublic personal information. Each of the following sections explains an aspect of the Funds’ commitment to protecting your personal information and respecting your privacy.
Employee Access To Information
All of the Funds’ employees must adhere to the Funds’ policy on confidentiality. Employee access to customer information is authorized for business purposes only, and the degree of access is based on the sensitivity of the information and on an employee’s or agent’s need to know the information in order to service a customer’s account or comply with legal requirements.
Visiting The Funds’ Website
| n | | The Funds’ website (www.rmkfunds.com) gathers and maintains statistics about the number of visitors as well as what information is viewed most frequently. This information is used to improve the content and level of service we provide to our clients and shareholders. |
| n | | Information or data entered into a website will be retained. |
| n | | Where registration to a website or re-entering personal information on a website is required, “cookies” are used to improve your online experience. A cookie is a way for websites to recognize whether or not you have visited the site before. It is a small file that is stored on your computer that identifies you each time you re-visit our site so you don’t have to resubmit personal information. Cookies provide faster access into the website. |
| n | | We may also collect non-personally identifiable Internet Protocol (“IP”) addresses for all other visitors to monitor the number of visitors to the site. These non-personally identifiable IP addresses are never shared with any third party. |
101
SUPPLEMENTAL INFORMATION
E-mail
If you have opted to receive marketing information from the Funds by e-mail, it is our policy to include instructions in all marketing messages on how to unsubscribe from subsequent e-mail programs. Some products or services from the Funds are intended to be delivered and serviced electronically. E-mail communication may be utilized in such cases. If you participate in an employer-sponsored retirement plan administered by the Funds, we may, at your employer’s request, send you e-mail on matters pertaining to the retirement plan.
Please do not provide any account or personal information such as social security numbers, account numbers, or account balances within your e-mail correspondence to us. We cannot use e-mail to execute transaction instructions, provide personal account information, or change account registration. We can, however, use e-mail to provide you with the necessary forms. You can also use customer service to do so. Call us toll-free at 1-877-757-7424.
Surveys/Aggregate Data
Periodically, the Funds may conduct surveys about financial products and services or review elements of customer information in an effort to forecast future business needs. The Funds then generate reports that include aggregate data regarding its customers. Aggregate data classifies customer information in various ways but that does not identify individual customers. These reports may also include information on website traffic patterns and related information. These reports are used for the Funds’ planning, statistical and other corporate purposes. Aggregate data may also be shared with external parties, such as marketing organizations. However, no information is shared by which any individual customer could be identified.
Changes To Our Privacy Statement
The Funds reserve the right to modify or remove parts of this privacy statement at any time. Notice will be provided to you in advance of any changes that would affect your rights under this policy statement.
PROXY VOTING POLICIES & PROCEDURES & RECORDOF VOTING ACTIVITY
The Funds vote proxies related to their portfolios’ securities according to a set of policies and procedures approved by the Funds’ board. You may view the proxy voting activity for each Fund during the most recent twelve month period ended
102
SUPPLEMENTAL INFORMATION
June 30 as well as a description of the policies and procedures, without charge, by calling 800-564-2188, by visiting the Fund’s website at www.rmkfunds.com or by visiting the SEC’s website at www.sec.gov.
QUARTERLY REPORTSON PORTFOLIO HOLDINGS
The Funds file their complete schedule of portfolio holdings as of the first and third quarters of their fiscal years on Form N-Q with the SEC no more than sixty days after the close of those quarters. You may view the Fund’s Form N-Q filings, without charge, by calling 800-564-2188 or by visiting the SEC’s website at www.sec.gov. The Funds’ Form N-Q filings may also be reviewed and copied at the SEC’s Public Reference Room in Washington, D.C. Call 800-SEC-0330 for information regarding the operation of the Public Reference Room.
FEDERAL TAX INFORMATION (UNAUDITED)
For the fiscal year ended March 31, 2006, the amount of long-term capital gain designated by RMK Advantage Income Fund, RMK High Income Fund and RMK Strategic Income Fund were $1,887,895, $7,551,866, $0 and $229,122, respectively.
For the fiscal year ended March 31, 2006, 4.37%, 2.55%, 13.48% and 3.37% of the distributions from net investment income paid by RMK Advantage Income Fund, RMK High Income Fund, RMK Multi-Sector High Income Fund and RMK Strategic Income Fund, respectively, are qualifying dividends which may be subject to a minimum tax rate of 15%, as provided by the Jobs and Growth Tax Relief Act of 2003. Complete information is reported in conjunction with reporting of your distributions on form 1099-DIV.
Of the ordinary income (including short term capital gain) distributions made by RMK Advantage Income Fund, RMK High Income Fund, RMK Multi-Sector High Income Fund and RMK Strategic Income Fund during the fiscal year ended March 31, 2006, 4.37%, 2.55%, 13.48% and 3.37%, respectively, qualified for the dividend received deduction available to corporate shareholders.
103
SUPPLEMENTAL INFORMATION
| | |
| |
INVESTMENT ADVISER Morgan Asset Management, Inc. 417 North 20th Street, 15th Floor Birmingham, AL 35203 | | ADMINISTRATOR Morgan Keegan & Company, Inc. Morgan Keegan Tower 50 North Front Street Memphis, TN 38103 |
| |
CUSTODIAN State Street Bank & Trust Company 108 Myrtle Street Quincy, MA 02171 | | LEGAL COUNSEL Kirkpatrick & Lockhart Nicholson Graham LLP 1601 K Street, N.W. Washington, D.C. 20006 |
| |
TRANSFER AGENT Computershare Investor Services P. O. Box 43010 Providence, RI 02940-3011 | | INDEPENDENT REGISTERED PUBLIC ACCOUNTING FIRM PricewaterhouseCoopers LLP Morgan Keegan Tower 50 North Front Street, Suite 1000 Memphis, TN 38103 |
This report is for shareholder information. This is not a prospectus intended for use in the purchase or sale of Fund shares. Statements and other information contained in this report are as dated and are subject to change.
104
REGIONS MORGAN KEEGAN FUND COMPLEX
The Regions Morgan Keegan fund complex offers mutual funds with a broad variety of investment objectives to meet the financial needs of all types of investors. With approximately $6.6 billion in assets, the fund complex includes five equity funds, one balanced fund, five bond funds, one tax-exempt bond fund, two money market funds and four closed-end funds. You may see an overview of each Fund by visiting the Funds’ website at www.rmkfunds.com. You may also download each Fund’s most recent marketing flyer, prospectus, and annual and semi-annual reports to shareholders.
REGIONS MORGAN KEEGAN SELECT FAMILYOF FUNDS
Regions Morgan Keegan Select Mid Cap Growth Fund
Regions Morgan Keegan Select Growth Fund
Regions Morgan Keegan Select Core Equity Fund
Regions Morgan Keegan Select Mid Cap Value Fund
Regions Morgan Keegan Select Value Fund
Regions Morgan Keegan Select Balanced Fund
Regions Morgan Keegan Select High Income Fund
Regions Morgan Keegan Select Intermediate Bond Fund
Regions Morgan Keegan Select Fixed Income Fund
Regions Morgan Keegan Select Limited Maturity Government Fund
Regions Morgan Keegan Select Short Term Bond Fund
Regions Morgan Keegan Select Intermediate Tax Exempt Bond Fund
Regions Morgan Keegan Select Treasury Money Market Fund
Regions Morgan Keegan Select Money Market Fund
REGIONS MORGAN KEEGAN CLOSED-END FUNDS
| n | | RMK Advantage Income Fund, Inc. (NYSE: RMA) |
| n | | RMK High Income Fund, Inc. (NYSE: RMH) |
| n | | RMK Multi-Sector High Income Fund, Inc. (NYSE: RHY) |
| n | | RMK Strategic Income Fund, Inc. (NYSE: RSF) |
105

RMK High Income Fund, Inc. (the “Fund”) has adopted a code of ethics as defined in Item 2 of Form N-CSR, that applies to the Fund’s principal executive officer and principal financial officer. The Fund’s code of ethics was amended during the covered period to add a new registered closed-end investment company to the list of entities covered by the code of ethics. The Fund has not made any substantial amendments to its code of ethics during the covered period. The Fund also has not granted any waivers from any provisions of the code of ethics during the covered period. A copy of the Fund’s code of ethics is filed as an exhibit pursuant to Item 12(a)(1).
| Item 3. | Audit Committee Financial Expert. |
The Fund’s Board of Directors (the “Board”) has determined that Albert C. Johnson, James Stillman R. McFadden, W. Randall Pittman and Mary S. Stone are audit committee financial experts, as defined in Item 3 of Form N-CSR, serving on its Audit Committee. Messrs. McFadden, Pittman and Johnson and Ms. Stone are independent for purposes of Item 3(a)(2).
| Item 4. | Principal Accountant Fees and Services. |
(a)-(d) Audit and Non-Audit Fees
Fees billed by PricewaterhouseCoopers LLP (“PwC”) for audit and non-audit services provided to the Fund for the fiscal years ended March 31, 2006 and March 31, 2005 were as follows:
| | | | | | |
| | | 2006 | | 2005 |
(a) Audit Fees | | $ | 35,000 | | $ | 34,000 |
(b) Audit-Related Fees | | | 0 | | | 0 |
(c) Tax Fees1 | | | 3,000 | | | 2,000 |
(d) All Other Fees | | | 0 | | | 0 |
| | | | | | |
Total Fees | | $ | 38,000 | | $ | 36,000 |
| | | | | | |
| 1 | Consists of fees for preparing the Fund’s U.S. income tax returns. |
(e)(1) Pre-Approval of Audit and Non-Audit Services
Audit and non-audit services provided to the Fund require pre-approval by the Fund’s Audit Committee. The Audit Committee pre-approves these services on a case-by-case basis. The Audit Committee also must pre-approve those non-audit services provided to the Fund’s investment adviser and any entity controlling, controlled by or under common control with the Fund’s investment adviser (the “Affiliated Service Providers”) that provides ongoing services to the Fund, if the service relates directly to the operations and financial reporting of the Fund. Any individual service that does not exceed $15,000 may be pre-approved by the chair of the Audit Committee. Any proposed service exceeding that cost level requires specific pre-approval by the Audit Committee.
(e)(2) None of the services included under (b)-(d) above was approved by the Audit Committee pursuant to paragraph (c)(7)(i)(C) of Rule 2-01 of Regulation S-X.
(f) Not applicable.
(g) Non-Audit Fees
Non-audit fees billed by PwC for services rendered to the Fund were $3,000 and $2,000 for the fiscal years ended 2006 and 2005, respectively.
Non-audit fees billed by PwC for services rendered to the Fund’s Affiliated Service Providers that provides ongoing services to the Fund were $0 and $0 for the fiscal years ended 2006 and 2005, respectively.
(h) Not applicable as there were no non-audit services rendered to the Fund’s Affiliated Service Providers that provides ongoing services to the Fund for the fiscal years ended 2006 and 2005.
| Item 5. | Audit Committee of Listed Registrants. |
The Fund has a separately-designated standing Audit Committee in accordance with Section 3(a)(58)(A) of the Securities Exchange Act of 1934, consisting of Jack R. Blair, Albert C. Johnson, James Stillman R. McFadden, W. Randall Pittman, Mary S. Stone and Archie W. Willis, III.
| Item 6. | Schedule of Investments. |
This Schedule is included as part of the Report to Shareholders filed under Item 1 of this Form N-CSR.
| Item 7. | Disclosure of Proxy Voting Policies and Procedures for Closed-End Management Investment Companies. |
The Board has delegated to the Fund’s investment adviser, Morgan Asset Management, Inc. (the “Adviser”), the responsibility to vote proxies related to the securities held in the Fund’s portfolios. Under this authority, the Adviser is required to vote proxies related to portfolio securities in the best interests of the Fund and its stockholders. The Board permits the Adviser to contract with a third party to obtain proxy voting and related services, including research of current issues.
The Adviser has implemented written Proxy Voting Policies and Procedures (“Proxy Voting Policy”) that are designed to reasonably ensure that the Adviser votes proxies prudently and in the best interest of its clients for whom the Adviser has voting authority, including the Fund. The Proxy Voting Policy also describes how the Adviser addresses any conflicts that may arise between its interests and those of its clients with respect to proxy voting.
The Adviser’s Proxy Committee is responsible for developing, authorizing, implementing and updating the Proxy Voting Policy, overseeing the proxy voting process and engaging and overseeing any independent third-party vendors as voting delegate to review, monitor and/or vote proxies. In order to apply the Proxy Voting Policy noted above in a timely and consistent manner, the Adviser utilizes Institutional Shareholder Services, Inc. (“ISS”) to vote proxies in accordance with the Adviser’s voting guidelines.
The Adviser’s guidelines adopt the voting recommendations of ISS. The Adviser retains final authority and fiduciary responsibility for proxy voting. The Adviser believes that this process is reasonably designed to address material conflicts of interest that may arise between the Adviser and a client as to how proxies are voted.
In the event that an investment professional at the Adviser believes that it is in the best interests of a client or clients to vote proxies in a manner inconsistent with the Adviser’s proxy voting guidelines or in a manner inconsistent with ISS recommendations, the Proxy Committee will review information submitted by the investment professional to determine that there is no material conflict of interest between the Adviser and the client with respect to the voting of the proxy in that manner.
If the Proxy Committee determines that the voting of a proxy as recommended by the investment professional presents a material conflict of interest between the Adviser and the client or clients with respect to the voting of the proxy, the Proxy Committee shall: (i) take no further action, in which case ISS shall vote such proxy in accordance with the proxy voting guidelines or as ISS recommends; (ii) disclose such conflict to the client or clients and obtain written direction from the client as to how to vote the proxy; (iii) suggest that the client or clients engage another party to determine how to vote the proxy; or (iv) engage another independent third party to determine how to vote the proxy.
| Item 8. | Portfolio Managers of Closed-End Management Investment Companies. |
As of June 7, 2006, day-to-day management of the Fund’s portfolio is the responsibility of a team led by James C. Kelsoe, Jr., CFA. The following individuals at the Adviser share primary responsibility for the management of the Fund.
James C. Kelsoe, Jr., CFA – Mr. Kelsoe serves as lead portfolio manager of the Fund. Mr. Kelsoe has been a portfolio manager with the Adviser since 1992. Mr. Kelsoe serves as portfolio manager of Regions Morgan Keegan Select Short Term Bond Fund, Regions Morgan Keegan Select Intermediate Bond Fund and Regions Morgan Keegan Select High Income Fund, each a series of Morgan Keegan Select Fund, Inc. He also serves as portfolio manager of RMK Advantage Income Fund, Inc., RMK Multi-Sector High Income Fund, Inc. and RMK Strategic Income Fund, Inc., closed-end investment companies traded on the New York Stock Exchange. Mr. Kelsoe is currently a senior portfolio manager for the Adviser, where he is responsible for $3.8 billion in assets under management and serves as a member of the Adviser’s strategy group, which oversees over $16 billion in assets. Mr. Kelsoe has been with the Adviser since 1991. He received a B.S. in Finance from the University of Alabama in 1986 and holds the Chartered Financial Analyst designation.
Accounts Managed by James C. Kelsoe, Jr. as of March 31, 2006:
| | | | | | | | | |
| | | Registered Investment
Companies | | Other Pooled
Investment Vehicles | | Other Accounts |
Number of Accounts Managed | | | 7 | | | 0 | | | 22 |
Number of Accounts Managed with Performance-Based Advisory Fees | | | 0 | | | 0 | | | 0 |
Assets Managed | | $ | 3,803,271,610 | | $ | 0 | | $ | 245,693,741 |
Assets Managed with Performance-Based Advisory Fees | | $ | 0 | | $ | 0 | | $ | 0 |
The dollar range of shares of the Fund beneficially owned by James C. Kelsoe, Jr. as of March 31, 2006 was $100,001-$500,000.
David H. Tannehill, CFA – Mr. Tannehill serves as an assistant portfolio manager of the Fund. Mr. Tannehill serves as an assistant portfolio manager of Regions Morgan Keegan Select Short Term Bond Fund, RMK Advantage Income Fund, Inc., RMK Multi-Sector High Income Fund, Inc. and RMK Strategic Income Fund, Inc. Mr. Tannehill has been a portfolio manager for the Adviser since 2004. From 2001 to 2004, Mr. Tannehill was a portfolio manager for Commerce Capital Management, Inc. where he was responsible for managing over $200 million in individual, individual trust, and endowment accounts. Mr. Tannehill has eight years prior experience with Morgan Keegan & Company, Inc. in investment research of both equity and fixed-income securities. Mr. Tannehill earned a BBA in 1983 and an MBA in 1984 from the University of Mississippi. He holds the Chartered Financial Analyst designation.
Accounts Managed by David H. Tannehill as of March 31, 2006:
| | | | | | | | | |
| | | Registered Investment
Companies | | Other Pooled
Investment Vehicles | | Other Accounts |
Number of Accounts Managed | | | 5 | | | 0 | | | 0 |
Number of Accounts Managed with Performance-Based Advisory Fees | | | 0 | | | 0 | | | 0 |
Assets Managed | | $ | 2,014,574,190 | | $ | 0 | | $ | 0 |
Assets Managed with Performance-Based Advisory Fees | | $ | 0 | | $ | 0 | | $ | 0 |
The dollar range of shares of the Fund beneficially owned by David H. Tannehill as of March 31, 2006 was $10,001 - $50,000.
Conflicts of Interest
Actual or apparent conflicts of interest may arise when a portfolio manager has day-to-day management responsibilities with respect to more than one fund or other account. More specifically, portfolio managers who manage multiple funds and/or other accounts are presented with the following potential conflicts:
| | • | | The management of multiple funds and/or other accounts may result in a portfolio manager devoting unequal time and attention to the management of each fund and/or other account. The Adviser seeks to manage such competing interests for the time and attention of a portfolio manager by having the portfolio managers focus on a particular investment discipline. Most other accounts managed by a portfolio manager are managed using the same investment models that are used in connection with the management of the funds. |
| | • | | If a portfolio manager identifies a limited investment opportunity which may be suitable for more than one fund or other account, a fund may not be able to take full advantage of that opportunity due to an allocation of filled purchase or sale orders across all eligible funds and other accounts. To deal with these situations, the Adviser and the funds have adopted procedures for allocating portfolio transactions across multiple accounts. |
| | • | | With respect to securities transactions for the funds, the Adviser determines which broker to use to execute each order, consistent with its duty to seek best execution of the transaction. However, with respect to certain other accounts (such as mutual funds for which the Adviser or an affiliate acts as sub-adviser, other pooled investment vehicles that are not registered mutual funds, and other accounts managed for organizations and individuals), the Adviser may be limited by the client with respect to the selection of brokers or may be instructed to direct trades through a particular broker. In these cases, the Adviser or its affiliates may place separate, non-simultaneous, transactions for a fund and another account which may temporarily affect the market price of the security or the execution of the transaction, or both, to the detriment of the fund or the other account. |
| | • | | Finally, the appearance of a conflict of interest may arise where the Adviser has an incentive, such as a performance-based management fee, which relates to the management of one fund or account but not all funds and accounts with respect to which a portfolio manager has day-to-day management responsibilities. |
The Adviser and the Fund have adopted certain compliance procedures which are designed to address these types of conflicts. However, there is no guarantee that such procedures will detect each and every situation in which a conflict arises.
Compensation
The Adviser seeks to maintain a compensation program that is competitively positioned to attract and retain high-caliber investment professionals. Portfolio managers receive a base salary, an incentive bonus opportunity, an equity compensation opportunity, and a benefits package. Portfolio manager compensation is reviewed and may be modified each year as appropriate to reflect changes in the market, as well as to adjust the factors used to determine bonuses to promote good sustained fund performance. The Adviser evaluates competitive market compensation by reviewing compensation survey results conducted by an independent third party of investment industry compensation. Each portfolio manager’s compensation consists of the following four elements:
| | • | | Base salary. Each portfolio manager is paid a base salary. In setting the base salary, the Adviser’s intention is to be competitive in light of the particular portfolio manager’s experience and responsibilities. |
| | • | | Annual bonus. Each portfolio manager is eligible to receive an annual cash bonus that may be equal to as much as 50% of his/her annual base salary. This bonus is determined by the portfolio manager’s investment management results compared to the Lehman Brothers Ba U.S. High Yield Index. The portfolio manager may earn 50% of his bonus by meeting target returns and 75% of his bonus by meeting maximum returns. The remaining 25% of his bonus is determined by the Bonus Plan Committee and includes such factors as the portfolio manager’s support of the firm’s policies and procedures, the portfolio manager’s acquisition for new business and portfolio manager’s service to existing clients. |
| | • | | Equity-based compensation. Portfolio managers may be awarded options to purchase common shares and/or granted restricted shares of Regions Financial Corporation’s stock from pools determined from time to time by the Remuneration Committee of Regions Financial Corporation’s Board of Directors. Awards of equity-based compensation typically vest over time, so as to create incentives to retain key talent. |
| | • | | Participation in group insurance programs. Portfolio managers are provided life insurance coverage in the form of a group variable universal life insurance policy, under which they may make additional contributions to purchase additional insurance coverage or for investment purposes. |
| Item 9. | Purchases of Equity Securities by Closed-End Management Investment Company and Affiliated Purchasers. |
There were no reportable purchases for the period covered by this report.
| Item 10. | Submission of Matters to a Vote of Security Holders. |
There have been no material changes to the procedures by which the stockholders may recommend nominees to the Fund’s Board of Directors since the Fund last provided disclosure in response to the requirements of Item 7(d)(2)(ii)(G) of Schedule 14A.
| Item 11. | Controls and Procedures. |
| | (a) | Based on an evaluation of the disclosure controls and procedures (as defined in rule 30a-3(c) under the 1940 Act), as of a date within 90 days of the filing date of this report, the Fund’s certifying officers have concluded that such disclosure controls and procedures are reasonably designed to ensure that information required to be disclosed by the Fund is accumulated and communicated to the Fund’s management to allow timely decisions regarding required disclosure. |
| | (b) | The Fund’s certifying officers are not aware of any changes in the Fund’s internal controls over financial reporting (as defined in Rule 30a-3(d) under the 1940 Act) that occurred during the Fund’s second fiscal quarter of the period covered by this report that has materially affected, or are reasonably likely to materially affect, the Fund’s internal controls over financial reporting. |
| | | |
| (a | )(1) | | The code of ethics pursuant to Item 2 is filed herewith. |
| |
| (a | )(2) | | The certifications required by Rule 30a-2(a) under the 1940 Act and Section 302 of the Sarbanes-Oxley Act are filed herewith. |
| |
| (a | )(3) | | Not applicable. |
| |
| (b | ) | | The certifications required by Rule 30a-2(b) under the 1940 Act and Section 906 of the Sarbanes-Oxley Act are filed herewith. |
The certification provided pursuant to Section 906 of the Sarbanes-Oxley Act is not deemed “filed” for purposes of Section 18 of the Securities Exchange Act of 1934 (“Exchange Act”), or otherwise subject to the liability of that section. Such certification will not be deemed to be incorporated by reference into any filing under the Securities Act of 1933 or the Exchange Act, except to the extent that the Fund specifically incorporates it by reference.
SIGNATURES
Pursuant to the requirements of the Securities Exchange Act of 1934 and the Investment Company Act of 1940, the Fund has duly caused this report to be signed on its behalf by the undersigned, thereunto duly authorized.
| | |
(Fund) RMK High Income Fund, Inc. |
| |
| By (Signature and Title) | | /s/ Carter E. Anthony |
| | Carter E. Anthony, President |
Date: June 7, 2006
Pursuant to the requirements of the Securities Exchange Act of 1934 and the Investment Company Act of 1940, this report has been signed below by the following persons on behalf of the Fund and in the capacities and on the dates indicated.
| | |
| |
| By (Signature and Title) | | /s/ Carter E. Anthony |
| | Carter E. Anthony, President |
Date: June 7, 2006
| | |
| |
| By (Signature and Title) | | /s/ Joseph C. Weller |
| | Joseph C. Weller, Treasurer |
Date: June 7, 2006