UNITED STATES
SECURITIES AND EXCHANGE COMMISSION
Washington, D.C. 20549
FORM 20-F
| [ ] REGISTRATION STATEMENT PURSUANT TO SECTION 12(b) OR (g) OF THE SECURITIES EXCHANGE ACT OF 1934 |
| [X] ANNUAL REPORT PURSUANT TO SECTION 13 OR 15(d) OF THE SECURITIES EXCHANGE ACT OF 1934 |
For the fiscal year ended December 31, 2011
| [ ] | TRANSITION REPORT PURSUANT TO SECTION 13 OR 15(d) OF THE SECURITIES EXCHANGE ACT OF 1934 |
| | For the transition period from ____________ to __________ |
| [ ] | SHELL COMPANY REPORT PURSUANT TO SECTION 13 OR 15(d) OF THE SECURITIES EXCHANGE ACT OF 1934 |
| | Date of event requiring this shell company report: ______ |
Commission file number: 333-104670
STRATA OIL & GAS INC.
(Exact name of Registrant as specified in its charter)
Alberta, Canada
(Jurisdiction of incorporation or organization)
918 16th Avenue NW, Suite 408, Calgary, Alberta, Canada, T2M 0K3
(Address of principal executive offices)
Securities to be registered pursuant to Section 12(b) of the Act:
None
Securities to be registered pursuant to Section 12(g) of the Act:
Common Stock, Fully Paid and Non-Assessable Common Shares, Without Par Value
(Title of Class)
Securities for which there is a reporting obligation pursuant to Section 15(d) of the Act: None
Indicate the number of outstanding shares of each of the issuer's classes of capital or common stock as of the close of the period covered by the annual report: The registrant has one class of Common Stock with 69,412,043 shares outstanding at December 31, 2011 and 69,412,043, shares outstanding as of May 12, 2012. No preferred shares issued and outstanding.
Indicate by check mark if the registrant is a well-known seasoned issuer, as defined in Rule 405 of the Securities Act Yes [ ] No [X]
If this report is an annual or transition report, indicate by check mark if the registrant is not required to file reports pursuant to Section 13 or 15(d) of the Securities Exchange Act of 1934. Yes [ ] No [ ]
Note – Checking the box above will not relieve any registrant required to file reports pursuant to Section 13 or 15(d) of the Securities Exchange Act of 1934 from their obligations under those Sections.
Indicate by check mark whether the registrant (1) has filed all reports required to be filed by Section 13 or 15(d) of the Securities Exchange Act of 1934 during the preceding 12 months (or for such shorter period that the registrant was required to file such reports), and (2) has been subject to such filing requirements for the past ninety days. Yes [X] No [ ]
Indicate by check mark whether the registrant has submitted electronically and posted on its corporate Web site, if any, every Interactive Data File required to be submitted and posted pursuant to Rule 405 of Regulation S-T (§232.405 of this chapter) during the preceding 12 months (or for such shorter period that the registrant was required to submit and post such files). Yes [ X] No [ ]
Indicate by check mark whether the registrant is a large accelerated filer, an accelerated filer, or a non-accelerated filer. See definition of “accelerated filer and large accelerated filer” in Rule 12b-2 of the Exchange Act.
| Large accelerated filer [ ] | Accelerated filer [ ] | Non-accelerated filer [X] |
Indicate by check mark which basis of accounting the registrant has used to prepare the financial statements included in this filing:
| U.S. GAAP [ X ] | International Financial Reporting Standards as issued by the International Accounting Standards Board [ ] | Other [ ] |
If “Other” has been checked in response to the previous question, indicate by check mark which financial statement item the registrant has elected to follow.
Item 17 [ ] Item 18 [ ]
Indicate by check mark whether the registrant is a shell company (as defined in Rule 12b-2 of the Exchange Act) Yes [ ] No [X]
(APPLICABLE ONLY TO ISSUERS INVOLVED IN BANKRUPTCY PROCEEDINGS DURING THE PAST FIVE YEARS)
Indicate by check mark whether the Registrant has filed all documents and reports required to be filed by Sections 12, 13 or 15(d) of the Securities Exchange Act of 1934 subsequent to the distribution of securities under a plan confirmed by a court.
Yes [ ] No [ ]
STRATA OIL & GAS INC.
FORM 20-F ANNUAL REPORT 2011
TABLE OF CONTENTS
| Oil and Gas Glossary |
| Introduction |
| |
| Part I |
| | | |
| Item 1. | Identity of Directors, Senior Management and Advisors | 6 |
| Item 2. | Offer Statistics and Expected Timetable | 6 |
| Item 3. | Key Information | 6 |
| Item 4. | Information on the Company | 14 |
| Item 4A. | Unresolved Staff Comments | 30 |
| Item 5. | Operating and Financial Review and Prospects | 30 |
| Item 6. | Directors, Senior Management and Employees | 37 |
| Item 7. | Major Shareholders and Related Party Transactions | 40 |
| Item 8. | Financial Information | 41 |
| Item 9. | The Offer and Listing | 42 |
| Item 10. | Additional Information | 43 |
| Item 11. | Quantitative and Qualitative Disclosures About Market Risk | 49 |
| Item 12. | Description of Other Securities Other Than Equity Securities | 49 |
| |
| Part II |
| | | |
| Item 13. | Defaults, Dividend Arrearages and Delinquencies | 50 |
| Item 14. | Material Modifications to the Rights of Security Holders and Use of Proceeds | 50 |
| Item 15. | Controls and Procedures | 50 |
| Item 16. | Reserved | |
| A | Audit Committee Financial Expert | 51 |
| B | Code of Ethics | 51 |
| C | Principle Accountant Fees and Services | 52 |
| D | Exemptions from the Listing Standards for Audit Committees | 52 |
| E | Purchases of Equity Securities by the Issuer and Affiliated Purchasers | 52 |
| F | Change in Registrants Certifying Accountant | 52 |
| G | Corporate Governance | 53 |
| |
| Part III |
| | | |
| Item 17. | Financial Statements | 53 |
| Item 18. | Financial Statements | 53 |
| Item 19. | Exhibits | 77 |
| | | |
| Financial Statements | |
| | | |
| Signature Page | | |
| | | |
| Certifications | | |
OIL AND GAS GLOSSARY
| Term | Definition | |
| | | |
| Basin | A depressed area where sediments have accumulated during geologic time and considered to be prospective for oil and gas deposits. | |
| Bitumen | Heavy, viscous crude oil | |
| Bluesky Formation | The Bluesky is fine to medium grained, usually glauconitic, partly calcareous or sideritic, salt and pepper sandstone with fair porosity. Chert granules and pebbles occur near the top, with thin shale interbedded throughout. The thickness is 0-46 meters in the Peace River plains subsurface. It thins to the south and southeast | |
| CHOPS | Cold Heavy Oil Production with Sand | |
| Carboniferous | The period of geological time between 360 and 286 million years ago. A series of stratified rocks and associated volcanic rocks which occur above the Devonian or Old Sandstone and below the Permian or Triassic systems belonging to the Carboniferous period. | |
| Cretaceous Period | A period 144 to 65 million years ago | |
| Debolt Formation | Lies above the Elkton Formation and ranges from mid- to upper Visean in age (345.3 to 326.4 million years ago) | |
| Development | The phase in which a proven oil or gas field is brought into production by drilling production (development) wells. | |
| Drilling | The using of a rig and crew for the drilling, suspension, production testing, capping, plugging and abandoning, deepening, plugging back, sidetracking, re-drilling or reconditioning of a well. | |
| Drilling logs | Recorded observations made of rock chips cut from the formation by the drill bit, and brought to the surface with the mud, as well as rate of penetration of the drill bit through rock formations. Used by geologists to obtain formation data. | |
| Exploration | The phase of operations which covers the search for oil or gas by carrying out detailed geological and geophysical surveys followed up where appropriate by exploratory drilling. Compare to "Development" phase. | |
| Jurassic Period | Between 206 and 144 million years ago | |
| Mineral Lease | A legal instrument executed by a mineral owner granting exclusive right to another to explore, drill, and produce oil and gas from a piece of land | |
| Oil Sands | Sand, clay and rock material containing bitumen | |
| Porosity | The ratio of the volume of void spaces in a rock or sediment to the total volume of the rock or sediment. | |
| Reserves | Generally the amount of oil or gas in a particular reservoir that is available for production. | |
| Reservoir | The underground rock formation where oil and gas has accumulated. It consists of a porous rock to hold the oil or gas, and a cap rock that prevents its escape | |
INTRODUCTION
Strata Oil & Gas Inc. was incorporated under the laws of the State of Nevada on November 18, 1998 and commenced operations in January 1999. We completed our initial public offering in February 2000. In January, 2003, the Company filed a proposal to effect a continuation of the corporate jurisdiction from the State of Nevada to Canada on Form S-4 with the United States Securities and Exchange Commission (SEC). The Form S-4 was declared effective on or about July 7, 2004 and submitted to the shareholders of the Company. The special meeting of stockholders to vote on the adoption of the plan of conversion was held on August 17, 2004 and a majority of the shareholders approved the plan of conversion. Accordingly, the Company changed its name to "Stratabase Inc.," and continued to operate under the Canada Business Corporations Act.
On June 29, 2005 at the Annual General and Special Meeting of shareholders, a majority of the shareholders of the Company approved the sale of all of the rights to the Company’s software assets. At the same meeting, a majority of the Company’s shareholders also approved the change in business of the Company from software development to oil and gas exploration. Our headquarters are located at 918 16th Avenue NW, Suite 408, Calgary, Alberta, Canada, T2M 0K3. The telephone number is (403) 237-5443. The Company’s web address is strataoil.com.
On May 9, 2006, at a Special Meeting of the Company’s stockholders, a majority of the Company’s stockholders approved a 2:1 forward stock split. The record and payment dates of the forward split were May 10 and May 11, 2006 respectively. In addition, on July 13, 2007, at a Special Meeting of the Company’s stockholders, a majority of the Company’s stockholders approved a 2:1 forward stock split. The record and payment dates of the forward split were October 8 and October 9, 2007 respectively. All references to share and per share amounts have been restated in this 20-F to reflect these splits.
In this Annual Report, the “Company”, “Strata Oil & Gas Inc.”, “Strata”, "we", "our", and "us", refer to Strata Oil & Gas Inc. (unless the context otherwise requires). Summary discussions of documents referred to in this Annual Report may not be complete, and we refer you to the actual documents for more complete information.
BUSINESS OF STRATA OIL & GAS INC.
The Company operates in the oil and gas industry with a focus on Canada’s carbonate-hosted bitumen deposits. The Company currently has interests in a total of 18 oil sands leases located in Northern Alberta, Canada.
FINANCIAL AND OTHER INFORMATION
In this Annual Report, unless otherwise specified, all dollar amounts are expressed in United States Dollars (“USD$” or “$”).
FORWARD-LOOKING STATEMENTS
This Annual Report on Form 20-F contains forward-looking information. Forward-looking information includes statements relating to future actions, prospective products, future performance or results of current or anticipated products, sales and marketing efforts, costs and expenses, interest rates, outcome of contingencies, financial condition, results of operations, liquidity, business strategies, cost savings, objectives of management of Strata Oil & Gas Inc. (hereinafter referred to as the “Company,” “Strata” or “we”) and other matters. Forward-looking information may be included in this Annual Report on Form 20-F or may be incorporated by reference from other documents filed with the Securities and Exchange Commission (the “SEC”) by the Company. One can find many of these statements by looking for words including, for example, “believes,” “expects,” “anticipates,” “estimates” or similar expressions in this Annual Report on Form 20-F or in documents incorporated by reference in this Annual Report on Form 20-F. The Company undertakes no obligation to publicly update or revise any forward-looking statements, whether as a result of new information or future events.
The Company has based the forward-looking statements relating to the Company’s operations on management’s current expectations, estimates and projections about the Company and the industry in which it operates. These statements are not guarantees of future performance and involve risks, uncertainties and assumptions that we cannot predict. In particular, we have based many of these forward-looking statements on assumptions about future events that may prove to be inaccurate. Accordingly, the Company’s actual results may differ materially from those contemplated by these forward-looking statements. Any differences could result from a variety of factors, including, but not limited to general economic and business conditions, competition, and other factors.
Item 1. Identity of Directors, Senior Management and Advisors
Item 2. Offer Statistics and Expected Timetable
Item 3. Key Information
A. Selected Financial Data
The following sets forth selected financial information of Strata prepared in accordance with accounting principles generally accepted in the United States for the fiscal years ended December 31, 2011, 2010, 2009, 2008 and 2007.
The selected financial information and operating information may not be indicative of Strata’s future performance and should be read in conjunction with “Management’s Discussion and Analysis of Financial Condition and Results of Operations.” The selected financial data as at and for these periods have been extracted from, and are qualified by reference to the audited consolidated financial statements included herein at Item 18.
(in U.S. dollars)
| | | Strata Oil & Gas Inc. | |
| | | Years Ended December 31, | |
| | | | | | | | | | | | | | | | |
| | | 2011 | | | 2010 | | | 2009 | | | 2008 | | | 2007 | |
| Revenue | | $ | - | | | $ | - | | | $ | - | | | $ | - | | | $ | - | |
| Expenses | | | 172,252 | | | | 972,357 | | | | 331,369 | | | | 654,240 | | | | 468,031 | |
| Other income (expense), net | | | 1,806,507 | | | | 4,474,395 | | | | (6,209,807 | ) | | | 12,497 | | | | 13,306 | |
| Net income (loss) | | $ | 1,629,255 | | | $ | 3,502,038 | | | $ | (6,541,176 | ) | | $ | (641,743 | ) | | $ | (454,725 | ) |
| Basic and income (loss) per share: | | | | | | | | | | | | | |
| From continuing operations | | $ | 0.02 | | | $ | 0.05 | | | $ | (0.10 | ) | | $ | (0.01 | ) | | $ | (0.01 | ) |
| Basic weighted average number of common shares outstanding (in millions) | | | 68.8 | | | | 66.4 | | | | 62.9 | | | | 61.7 | | | | 57.4 | |
| Diluted weighted average number of common shares outstanding (in millions) | | | 69.2 | | | | 73.2 | | | | N/A | | | | N/A | | | | N/A | |
BALANCE SHEET DATA
| (in U.S. Dollars) | | Strata Oil & Gas Inc. | |
| | | December 31, | |
| | | 2011 | | | 2010 | | | 2009 | | | 2008 | | | 2007 | |
| | | | | | | | | | | | | | | | |
| Cash and cash equivalents | | $ | 217,504 | | | $ | 151,283 | | | $ | 79,447 | | | $ | 121,776 | | | $ | 27,963 | |
| Other current assets | | | 23,827 | | | | 51,157 | | | | 43,822 | | | | 47,504 | | | | 23,449 | |
| Deposits | | | 116,172 | | | | 114,139 | | | | 94,533 | | | | 94,533 | | | | 16,596 | |
| Property and equipment, net | | | 1,361 | | | | 2,244 | | | | 4,467 | | | | 6,692 | | | | 8,712 | |
| Oil and gas property interests | | | 7,901,703 | | | | 7,967,915 | | | | 8,398,439 | | | | 7,039,208 | | | | 7,717,683 | |
| Total assets | | | 8,260,567 | | | | 8,286,738 | | | | 8,620,708 | | | | 7,309,713 | | | | 7,794,403 | |
| Current liabilities | | | 541,947 | | | | 2,097,438 | | | | 7,284,197 | | | | 120,350 | | | | 364,528 | |
| Asset retirement obligations | | | 127,688 | | | | 119,041 | | | | 104,653 | | | | 88,606 | | | | 68,563 | |
| Additional paid-in capital | | | 21,028,596 | | | | 21,025,596 | | | | 20,371,947 | | | | 19,559,938 | | | | 19,178,750 | |
| (Accumulated deficit) retained earnings | | | (14,008,796 | ) | | | (15,638,051 | ) | | | (19,140,089 | ) | | | (12,459,181 | ) | | | (11,817,438 | ) |
| Total liabilities and stockholders’ equity | | | 8,260,567 | | | | 8,286,738 | | | | 8,620,708 | | | | 7,309,713 | | | | 7,794,403 | |
Dividends
We have never paid or declared dividends on our shares of common stock.
Exchange Rates
In this Annual Report, unless otherwise specified, all dollar amounts are expressed in United States Dollars (USD$). The Government of Canada permits a floating exchange rate to determine the value of the Canadian Dollar against the U.S. Dollar (US$), therefore, this annual report may contain conversions of certain amounts in United States dollars into the Company’s functional currency, Canadian dollars, based upon the exchange rate in effect at the end of the month or of the fiscal year to which the amount relates, or the exchange rate on the date specified. For such purposes, the exchange rate means the noon buying rate for United States dollars from the Bank of Canada. These translations should not be construed as representations that the Canadian dollar amounts actually represent such United States dollar amounts or that Canadian dollars could be converted into United States dollars at the rate indicated or at any other rate.
Table No. 2 sets forth the exchange rates for the Canadian Dollar at the end of each of the three fiscal years ended December 31, 2011, 2010, and 2009, and the average rates for the period and the range of high and low rates for the period. The data for April, 2012 and for each month during the most recent six months is also provided.
Exchange Rates for Canadian Versus U.S. Dollars
The exchange rate as of December 31, 2011 was CDN $1.02 per U.S. $1.00.
The exchange rate as of May 12, 2012 was CDN $1.01 per U.S. $1.00.
| Exchange Rates for Canadian Versus U.S. Dollars | | |
(High/low rates for latest six months) | High | Low |
| April, 2012 | 1.00 | 1.00 |
| March, 2012 | 1.01 | 1.00 |
| February, 2012 | 1.00 | 1.00 |
| January, 2012 | 1.00 | 0.97 |
| December, 2011 | 1.02 | 0.99 |
| November, 2011 | .98 | 0.95 |
Exchange Rates for Canadian Versus U.S. Dollars | Average ($) |
| For the twelve months ended December 31, 2011 | 1.02 |
| For the twelve months ended December 31, 2010 | 1.00 |
For the twelve months ended December 31, 2009 | 1.14 |
| For the twelve months ended December 31, 2008 | 1.07 |
| For the twelve months ended December 31, 2007 | 1.07 |
B. Capitalization and Indebtedness
Not applicable.
C. Reasons for the offer and use of proceeds
Not applicable.
D. Risk Factors
This investment has a high degree of risk. Before you invest you should carefully consider the risks and uncertainties described below and the other information in this prospectus. If any of the following risks actually occur, our business, operating results and financial condition could be harmed and the value of our stock could go down. This means you could lose all or a part of your investment.
RISKS RELATING TO OUR COMPANY
1. We are an exploration stage company, with limited operating history, which raises substantial doubt as to our ability to successfully develop profitable business operations and makes an investment in our common shares very risky.
We have only recently commenced oil and gas exploration operations. Our prospects must be considered in light of the risks, expenses and difficulties frequently encountered in establishing a business in the oil and natural gas industries. We have yet to generate any revenues from operations. There is nothing at this time on which to base an assumption that our business operations will prove to be successful or that we will ever be able to operate profitably. Our future operating results will depend on many factors, including:
| • | our ability to raise adequate working capital; |
| • | success of our development and exploration; |
| • | demand for natural gas and oil; |
| • | the level of our competition; |
| • | our ability to attract and maintain key management and employees; and |
| • | our ability to efficiently explore, develop and produce sufficient quantities of marketable natural gas or oil in a highly competitive and speculative environment while maintaining quality and controlling costs. |
To achieve profitable operations, we must, alone or with others, successfully execute on the factors stated above. If we are not successful in executing any of the above stated factors, our business will not be profitable and may never even generate any revenue, which make our common shares a less attractive investment and may harm the trading of our common shares trading on the OTC Markets.
2. At this stage of our business, even with our good faith efforts, potential investors have a high probability of losing their investment.
Because the nature of our business is expected to change as a result of shifts in the market price of oil and natural gas, competition, and the development of new and improved technology, management forecasts are not necessarily indicative of future operations and should not be relied upon as an indication of future performance.
Our Management may incorrectly estimate projected occurrences and events within the timetable of its business plan, which would have an adverse effect on our results of operations and, consequently, make our common shares a less attractive investment and harm the trading of our common shares trading on the OTC Markets. Investors may find it difficult to sell their shares on the OTC Markets.
3. If capital is not available to fund future operations, we will not be able to pursue our business plan and operations would come to a halt and our common shares would be nearly worthless.
Cash on hand is not sufficient to fund our anticipated operating needs for the next twelve months. We will require substantial additional capital to participate in the development of our properties which have not had any production of oil or natural gas as well as for acquisition and/or development of other producing properties. Because we currently do not have any cash flow from operations we need to raise additional capital, which may be in the form of loans from current shareholders and/or from private equity offerings. Our ability to access capital will depend on our success in participating in properties that are successful in exploring for and producing oil and gas at profitable prices. It will also be dependent upon the status of the capital markets at the time such capital is sought. Should sufficient capital not be available, the development of our business plan could be delayed and, accordingly, the implementation of our business strategy would be adversely affected. In such event it would not be likely that investors would obtain a profitable return on their investments or a return of their investments at all.
4. We are heavily dependent on Ron Daems, our CEO, President and Chairman. The loss of Mr. Daems, whose knowledge, leadership and technical expertise upon which we rely, would harm our ability to execute our business plan.
Our success depends heavily upon the continued contributions of Ron Daems, whose knowledge, leadership and technical expertise would be difficult to replace. Our success is also dependent on our ability to retain and attract experienced engineers, geoscientists and other technical and professional staff. We do not maintain any key person insurance on Mr. Daems. If we were to lose his services, our ability to execute our business plan would be harmed and we may be forced to cease operations until such time as we could hire a suitable replacement for Mr. Daems.
5. Volatility of oil and gas prices and markets could make it difficult for us to achieve profitability and less likely investors in our common shares will receive a return on their investment.
Our ability to achieve profitability is substantially dependent on prevailing prices for natural gas and oil. The amounts of and price obtainable for any oil and gas production that we achieve will be affected by market factors beyond our control. If these factors are not favorable over time to our financial interests, it is likely that owners of our common shares will lose their investments. Such factors include:
| • | worldwide or regional demand for energy, which is affected by economic conditions; |
| • | the domestic and foreign supply of natural gas and oil; |
| • | domestic and foreign governmental regulations; |
| • | political conditions in natural gas and oil producing regions; |
| • | the ability of members of the Organization of Petroleum Exporting Countries to agree upon and maintain oil prices and production levels; and |
| • | the price and availability of other fuels. |
6. Drilling wells is speculative, often involving significant costs that may be more than our estimates. Any material inaccuracies in drilling costs, estimates or underlying assumptions will reduce the profitability of our business and will negatively affect our results of operations.
Developing and exploring for natural gas and oil involves a high degree of operational and financial risk, which precludes definitive statements as to the time required and costs involved in reaching certain objectives. The budgeted costs of drilling, completing and operating wells are often exceeded and can increase significantly when drilling costs rise due to a tightening in the supply of various types of oilfield equipment and related services. Drilling may be unsuccessful for many reasons, including title problems, weather, cost overruns, equipment shortages and mechanical difficulties. Moreover, the successful drilling of a natural gas or oil well does not ensure a profit on investment. Exploratory wells bear a much greater risk of loss than development wells. A variety of factors, both geological and market-related, can cause a well to become uneconomical or only marginally economic such as:
| • | blow-outs and surface cratering; |
| • | uncontrollable flows of oil, natural gas, and formation water; |
| • | natural disasters, such as hurricanes and other adverse weather conditions; |
| • | pipe, cement, or pipeline failures; |
| • | embedded oil field drilling and service tools; |
| • | abnormally pressured formations; and |
| • | environmental hazards, such as natural gas leaks, oil spills, pipeline ruptures and discharges of toxic gases. |
If we experience any of these problems, it could affect well bores, gathering systems and processing facilities, which could adversely affect our ability to conduct operations. We could also incur substantial losses as a result of:
| • | injury or loss of life; |
| • | severe damage to and destruction of property, natural resources and equipment; |
| • | pollution and other environmental damage; |
| • | clean-up responsibilities; |
| • | regulatory investigation and penalties; |
| • | suspension of our operations; and |
| • | repairs to resume operations. |
7. The unavailability or high cost of drilling rigs, equipment, supplies, personnel and other services could adversely affect our ability to execute on a timely basis our development, exploitation and exploration plans within our budget.
Shortages or an increase in cost of drilling rigs, equipment, supplies or personnel could delay or interrupt our operations, which could impact our financial condition and results of operations. Drilling activity in the geographic areas in which we conduct drilling activities may increase, which would lead to increases in associated costs, including those related to drilling rigs, equipment, supplies and personnel and the services and products of other vendors to the industry. Increased drilling activity in these areas may also decrease the availability of rigs. We do not have any contracts with providers of drilling rigs and, consequently we may not be able to obtain drilling rigs when we need them. Therefore, our drilling and other costs may increase further and necessary equipment and services may not be available to us at economical prices.
8. We are subject to complex laws and regulations, including environmental regulations, which can adversely affect the cost, manner or feasibility of doing business.
Development, production and sale of natural gas and oil in Canada are subject to extensive laws and regulations, including environmental laws and regulations. We may be required to make large expenditures to comply with environmental and other governmental regulations. Matters subject to regulation include:
| • | location and density of wells; |
| • | the handling of drilling fluids and obtaining discharge permits for drilling operations; |
| • | accounting for and payment of royalties on production from state, federal and Indian lands; |
| • | bonds for ownership, development and production of natural gas and oil properties; |
| • | transportation of natural gas and oil by pipelines; |
| • | operation of wells and reports concerning operations; and |
Under these laws and regulations, we could be liable for personal injuries, property damage, oil spills, discharge of hazardous materials, remediation and clean-up costs and other environmental damages. Failure to comply with these laws and regulations also may result in the suspension or termination of our operations and subject us to administrative, civil and criminal penalties. Moreover, these laws and regulations could change in ways that substantially increase our costs. Accordingly, any of these liabilities, penalties, suspensions, terminations or regulatory changes could materially adversely affect our financial condition and results of operations enough to possibly force us to cease our business operations.
9. Our oil and gas operations may expose us to environmental liabilities.
If we experience any leakage of crude oil and/or gas from the subsurface portions of a well, our gathering system could cause degradation of fresh groundwater resources, as well as surface damage, potentially resulting in suspension of operation of a well, fines and penalties from governmental agencies, expenditures for remediation of the affected resource, and liabilities to third parties for property damages and personal injuries. In addition, any sale of residual crude oil collected as part of the drilling and recovery process could impose liability on us if the entity to which the oil was transferred fails to manage the material in accordance with applicable environmental health and safety laws.
10. Exploratory drilling involves many risks and we may become liable for pollution or other liabilities which may have an adverse effect on our financial position.
Drilling operations generally involve a high degree of risk. Hazards such as unusual or unexpected geological formations, power outages, labor disruptions, blow-outs, sour gas leakage, fire, inability to obtain suitable or adequate machinery, equipment or labor, and other risks are involved. We may become subject to liability for pollution or hazards against which it cannot adequately insure or which it may elect not to insure. Incurring any such liability may have a material adverse effect on our financial position and operations.
11. The potential profitability of oil and gas ventures depends upon factors beyond the control of our company.
The potential profitability of oil and gas properties is dependent upon many factors beyond our control. For instance, world prices and markets for oil and gas are unpredictable, highly volatile, potentially subject to governmental fixing, pegging, controls, or any combination of these and other factors, and respond to changes in domestic, international, political, social, and economic environments. Additionally, due to worldwide economic uncertainty, the availability and cost of funds for production and other expenses have become increasingly difficult, if not impossible, to project. These changes and events may materially affect our financial performance.
12. Our auditors’ opinion on our December 31, 2011 financial statements includes an explanatory paragraph in respect of there being substantial doubt about our ability to continue as a going concern.
We have incurred net losses of $11,260,006 from July 1, 2005 (the date we commenced our oil and gas operations) to December 31, 2011. Our financial statements do not include any adjustments relating to the recoverability and classification of recorded assets, or the amounts of and classification of liabilities that might be necessary in the event the Company cannot continue in existence. We anticipate generating losses for at least the next 12 months. Therefore, there is substantial doubt about our ability to continue operations in the future as a going concern. We will need to obtain additional funds in the future. Our plans to deal with this cash requirement include loans from existing shareholders, raising additional capital from the private sale of our equity securities or entering into a strategic arrangement with a third party. If we cannot continue as a viable entity, our shareholders may lose some or all of their investment in our company.
13. If we do not maintain the property lease payments on our properties, we will lose our interest in the properties as well as losing all monies incurred in connection with the properties.
We have two land packages in Alberta, Canada that were acquired through auction directly from the government of Alberta. The land packages are made up of a number of underlying individual leases. All of our leases require annual lease payments to the Alberta provincial government. See Item 4.D for a more detailed description of the property obligations. If we do not continue to make the annual lease payments, we will lose our ability to explore and develop the properties and we will not retain any kind of interest in the properties.
14. We may not be able to compete with current and potential exploration companies, some of whom have greater resources and experience than we do in locating and commercializing oil and natural gas reserves.
The natural gas and oil market is intensely competitive, highly fragmented and subject to rapid change. We may be unable to compete successfully with our existing competitors or with any new competitors. We compete with many exploration companies which have significantly greater personnel, financial, managerial, and technical resources than we do. This competition from other companies with greater resources and reputations may result in our failure to maintain or expand our business.
15. We expect losses to continue in the future because we have no oil or gas reserves and, consequently, no revenue to offset losses.
Based upon the fact that we currently do not have any oil or gas reserves, we expect to incur operating losses in next 12 months. The operating losses will occur because there are expenses associated with the acquisition, exploration, and development of natural gas and oil properties which do not have any income-producing reserves. Failure to generate revenues may cause us to go out of business. We will require additional funds to achieve our current business strategy and our inability to obtain additional financing will interfere with our ability to expand our current business operations.
16. Because we are in the exploration stage of operations of our business our securities are considered highly speculative.
We are in the exploration stage of our business. As a result, our securities must be considered highly speculative. We are engaged in the business of exploring and, if warranted and feasible, developing natural gas and oil properties. Our current properties are without known reserves of natural gas or oil. Accordingly, we have not generated any revenues nor have we realized a profit from our operations to date and there is little likelihood that we will generate any revenues or realize any profits in the short term. Any profitability in the future from our business will be dependent upon locating and developing economic reserves of natural gas and oil, which itself is subject to numerous risk factors as set forth herein. Since we have not generated any revenues, we will have to raise additional funds through loans from existing shareholders, the sale of our equity securities or strategic arrangement with a third party in order to continue our business operations.
17. Since our Directors work for other natural resource exploration companies, their other activities for those other companies could slow down our operations or negatively affect our profitability.
Our Officer and Directors are not required to work exclusively for us and they do not devote all of their time to our operations. In fact, our Directors work for other natural resource exploration companies. Therefore, it is possible that a conflict of interest with regard to their time may arise based on their consulting or employment by such other companies. Their other activities could slow our operations and may reduce our financial results because of the slowdown in operations. It is expected that each of our Directors will devote approximately 1 hour per week to our operations on an ongoing basis, and when required will devote whole days and even multiple days at a stretch when property visits are required or when extensive analysis of information is needed.
RISKS RELATING TO OUR COMMON SHARES
18. We may, in the future, issue additional common shares, which would reduce investors’ percent of ownership and may dilute our share value.
Our Articles of Incorporation authorize the issuance of an unlimited number of common shares without par value and an unlimited number of preferred shares without par value. The future issuance of our unlimited authorized common shares may result in substantial dilution in the percentage of our common shares held by our then existing shareholders. We may value any common shares issued in the future on an arbitrary basis. The issuance of common shares for future services or acquisitions or other corporate actions may have the effect of diluting the value of the shares held by our investors, and might have an adverse effect on any trading market for our common shares.
19. Our common shares are subject to the "Penny Stock" Rules of the SEC and we have no established market for our securities, which makes transactions in our stock cumbersome and may reduce the value of an investment in our stock.
Section 15(g) of the Securities Exchange Act of 1934, as amended, and Rule 15g-2 promulgated there under by the Commission require broker-dealers dealing in penny stocks to provide potential investors with a document disclosing the risks of penny stocks and to obtain a manually signed and dated written receipt of the document before effecting any transaction in a penny stock for the investor's account. These rules may have the effect of reducing the level of trading activity in the secondary market, if and when one develops. Potential investors in the Company’s common stock are urged to obtain and read such disclosures carefully before purchasing any shares that are deemed to be "penny stock." Moreover, the Securities and Exchange Commission has adopted Rule 15g-9 which establishes the definition of a "penny stock," for the purposes relevant to us, as any equity security that has a market price of less than USD $5.00 per share or with an exercise price of less than USD $5.00 per share, subject to certain exceptions. For any transaction involving a penny stock, unless exempt, the rules require:
| • | that a broker or dealer approve a person's account for transactions in penny stocks; and |
| • | the broker or dealer receives from the investor a written agreement to the transaction, setting forth the identity and quantity of the penny stock to be purchased. |
In order to approve a person's account for transactions in penny stocks, the broker or dealer must:
| • | obtain financial information and investment experience objectives of the person; and |
| • | make a reasonable determination that the transactions in penny stocks are suitable for that person and the person has sufficient knowledge and experience in financial matters to be capable of evaluating the risks of transactions in penny stocks. |
The broker or dealer must also deliver, prior to any transaction in a penny stock, a disclosure schedule prescribed by the Commission relating to the penny stock market, which, in highlight form:
| • | sets forth the basis on which the broker or dealer made the suitability determination; and |
| • | that the broker or dealer received a signed, written agreement from the investor prior to the transaction. |
Generally, brokers may be less willing to execute transactions in securities subject to the "penny stock" rules. This may make it more difficult for investors to dispose of our common shares and cause a decline in the market value of our stock.
Pursuant to the Penny Stock Reform Act of 1990, broker-dealers are further obligated to provide customers with monthly account statements. Compliance with the foregoing requirements may make it more difficult for investors in the Company's stock to resell their shares to third parties or to otherwise dispose of them in the market or otherwise.
20. We are a “foreign private issuer”, and you may not have access to the information you could obtain about us if we were not a “foreign private issuer”.
We are considered a "foreign private issuer" under the Securities Act of 1933, as amended. As a foreign private issuer we will not have to file quarterly reports with the SEC nor will our Directors, Officer and 10% stockholders be subject to Section 16(b) of the Exchange Act. As a foreign private issuer we will not be subject to the proxy rules of Section 14 of the Exchange Act. Furthermore, Regulation FD does not apply to non-U.S. companies and will not apply to us. Accordingly, you may not be able to obtain information about us as you could obtain if we were not a “foreign private issuer”.
21. Because we do not intend to pay any cash dividends on our Common shares, our stockholders will not be able to receive a return on their shares unless they sell them.
We intend to retain any future earnings to finance the development and expansion of our business. We do not anticipate paying any cash dividends on our common shares in the foreseeable future. Unless we pay dividends, our stockholders will not be able to receive a return on their shares unless they sell them.
22. We may become a passive foreign investment company, or PFIC, which could result in adverse U.S. tax consequences to U.S. investors.
If we are a “passive foreign investment company” or “PFIC” as defined in Section 1297 of the Code, U.S. Holders will be subject to U.S. federal income taxation under one of two alternative tax regimes at the election of each such U.S. Holder. Section 1297 of the Code defines a PFIC as a corporation that is not formed in the United States and either (i) 75% or more of its gross income for the taxable year is “passive income”, which generally includes interest, dividends and certain rents and royalties or (ii) the average percentage, by fair market value (or, if we elect, adjusted tax basis), of its assets that produce or are held for the production of “passive income” is 50% or more. Whether we are a PFIC in any year and the tax consequences relating to PFIC status will depend on the composition of our income and assets, including cash. U.S. Holders should be aware, however, that if we become a PFIC, we may not be able or willing to satisfy record-keeping requirements that would enable U.S. Holders to make an election to treat us as a “qualified electing fund” for purposes of one of the two alternative tax regimes applicable to a PFIC, which would result in adverse tax consequences to our shareholders who are U.S. citizens.
23. Because we are organized under the Canada Business Corporations Act and all of our assets and our Officers and Directors are located outside the United States, it may be difficult for an investor to enforce within the United States any judgments obtained against us or our Officers and Directors.
All of our assets are located outside of the United States and we do not currently maintain a permanent place of business within the United States. In addition, our Directors and Officers are nationals and/or residents of countries other than the United States, and all or a substantial portion of such persons' assets are located outside the United States. As a result, it may be difficult for an investor to effect service of process or enforce within the United States any judgments obtained against us or our Officers or Directors, including judgments predicated upon the civil liability provisions of the securities laws of the United States or any state thereof. In addition, there is uncertainty as to whether the courts of Canada would recognize or enforce judgments of United States courts obtained against us or our Directors and Officers predicated upon the civil liability provisions of the securities laws of the United States or any state thereof. There is even uncertainty as to whether the Canadian courts would have jurisdiction to hear original actions brought in Canada against us or our Directors and Officers predicated upon the securities laws of the United States or any state thereof.
Item 4. Information on Strata Oil & Gas Inc.
A. History and Development of Strata Oil & Gas Inc.
Strata Oil & Gas Inc. (formerly Stratabase) was incorporated under the laws of the State of Nevada on November 18, 1998 and commenced operations in January 1999. We completed our initial public offering in February 2000. The Company operates in the oil and gas industry with a focus on Canada’s carbonate-hosted bitumen deposits. The Company has interests in a total of 18 oil sands leases located in Northern Alberta, Canada.
Continuance to Canada
We are presently incorporated under the Canada Business Corporations Act. In January 2003, the Company filed a proposal to effect a continuation of the corporate jurisdiction from the State of Nevada to Canada on Form S-4 with the United States Securities and Exchange Commission (SEC). The Form S-4 was declared effective on or about July 7, 2004 and submitted to the shareholders of the Company. The special meeting of stockholders to vote on the adoption of the plan of conversion was held on August 17, 2004 and a majority of the shareholders approved the plan of conversion. Accordingly, the Company changed its name to "Stratabase Inc.," and continued to operate under the Canada Business Corporations Act. "Continuance" is a process by which a corporation which is not incorporated under the laws of Canada may change its jurisdiction of incorporation to Canada. Under the Canada Business Corporations Act, if the laws of its home jurisdiction allow for it and a resolution authorizing the continuance is approved by 66 2/3% of the company's shareholders, the company may be "continued" as a Canadian corporation by filing of Articles of Continuance with the Director under the Canada Business Corporations Act. Under the corporate law of Nevada, this process is treated as a conversion of the outstanding shares of a Nevada company to shares of a Canadian company. The business and operations of Strata following the conversion were identical in most respects to our previous business, except that we were no longer subject to the corporate laws of the State of Nevada but became subject to the Canada Business Corporations Act. The Canadian company is liable for all the debts and obligations of the Nevada company, and the officers and directors of the company are the officers and directors of Strata. On August 17, 2004, Strata filed a Form 8-A with the SEC registering its class of common shares under Section 12(g) of the Exchange Act.
Discontinued Operations
Until the end of June 2005, the Company had developed software which was designed to allow users to interface with and manage databases and customer relationships. On June 29, 2005 at an annual general and special meeting of shareholders, a majority of the shareholders of the Company approved the sale of all of the rights to the Company’s software assets to a private company controlled by our former president. At the same meeting, a majority of the Company’s shareholders also approved the change in business of the Company from software development to oil and gas exploration.
On June 29, 2005 pursuant to approval by a majority of the shareholders of the Company, the Company entered into a letter of intent to dispose of all of its interest in its proprietary software to a company (the “Purchaser”) controlled by its former president for $130,000. On July 11, 2005 a definitive agreement was completed, and in exchange for the rights to all of its software the Company received a non-interest bearing promissory note (the “Note”) which was due July 11, 2006. The entire amount of the promissory note was received on June 30, 2006 and was recorded as income from discontinued operations in the Statement of Operations and Comprehensive Loss at December 31, 2006. The Company had a lien and security interest in all of the assets that were acquired by the Purchaser.
The assets acquired by the Purchaser included all rights and use to the “Strata”, “Relata”, and “Resync” names, all rights and use of the trademarks, web pages, and domain names for “Strata”, “Relata”, and “Resync”, and all rights to the source code and related documentation for the “Relata” and “Resync” software. The value of the assets disposed of was based on the results of an evaluation prepared for the Company by an independent evaluator.
B. Business Overview
HISTORICAL CORPORATE DEVELOPMENT
The Company was originally a United States incorporated software development company. In August 2004 the Company formally completed the process of becoming a Canadian-based company and on June 29, 2005 the Company sold all of its interests in its software assets and became a business engaged in oil and gas exploration.
The Company currently has interests in oil sands properties located in the Peace River and Wabiskaw areas of Northern Alberta, Canada.
The Company is an exploration stage company and there is no assurance that a commercially viable oil or gas deposit exists on any of its properties. Further evaluation will be required on each property before a final evaluation as to the economics and legal feasibility of the property is determined.
The Company originally had an interest in 43 oil sands leases in northern Alberta, Canada. In December 2010, the Company sold 25 of its oil sands leases to an Alberta Company considered to be a related party by common Director and Officer. As of December 31, 2010 the Company holds 17 leases in the in the Peace River oil sands area and 1 lease in the Athabasca oil sands area.
MATERIAL EFFECTS OF GOVERNMENT REGULATION
Development, production and sale of natural gas and oil in Canada are subject to extensive laws and regulations, including environmental laws and regulations. The oil and gas leases currently leased by the Company are owned by the Province of Alberta and are managed by the Department of Energy. We may be required to make large expenditures to comply with environmental and other governmental regulations. Matters subject to regulation include:
| • | location and density of wells; |
| • | the handling of drilling fluids and obtaining discharge permits for drilling operations; |
| • | accounting for and payment of royalties on production from state, federal and Indian lands; |
| • | bonds for ownership, development and production of natural gas and oil properties; |
| • | transportation of natural gas and oil by pipelines; |
| • | operation of wells and reports concerning operations; and |
Under these laws and regulations, we could be liable for personal injuries, property damage, oil spills, discharge of hazardous materials, remediation and clean-up costs and other environmental damages. Failure to comply with these laws and regulations also may result in the suspension or termination of our operations and subject us to administrative, civil and criminal penalties. Moreover, these laws and regulations could change in ways that substantially increase our costs. Accordingly, any of these liabilities, penalties, suspensions, terminations or regulatory changes could materially adversely affect our financial condition and results of operations enough to possibly force us to cease our business operations.
ANTICIPATED CHANGES TO FACILITIES AND EMPLOYEES
The Company utilizes third party consultants and does not have employees. Management of the Company anticipates no changes in connection with the facilities in the near future.
SEASONALITY, DEPENDENCY UPON PATENTS, LICENSES, CONTRACTS, PROCESSES, SOURCES AND AVAILIBILTY OF RAW MATERIALS
Certain of the Company’s properties are in remote locations and subject to significant temperature variations and changes in working conditions. It may not be possible to actively explore the Company’s properties in Alberta throughout the year because of seasonal changes in the weather. If exploration is pursued at the wrong time of year, the Company may incur additional costs to address issues relating to the weather.
Shortages or an increase in cost of drilling rigs, equipment, supplies or personnel could delay or interrupt our operations, which could impact our financial condition and results of operations. Drilling activity in the geographic areas in which we conduct drilling activities may increase, which would lead to increases in associated costs, including those related to drilling rigs, equipment, supplies and personnel and the services and products of other vendors to the industry. Increased drilling activity in these areas may also decrease the availability of rigs. We do not have any contracts with providers of drilling rigs and, consequently we may not be able to obtain drilling rigs when we need them. Therefore, our drilling and other costs may increase further and necessary equipment and services may not be available to us at economical prices.
COMPETITION
The natural gas and oil exploration industry is intensely competitive, highly fragmented and subject to rapid change. We may be unable to compete successfully with our existing competitors or with any new competitors. We compete with many exploration companies which have significantly greater personnel, financial, managerial, and technical resources than we do. This competition from other companies with greater resources and reputations may result in our failure to maintain or expand our business.
C. Organizational Structure
The Company is not part of a group and has no subsidiaries.
D. Property Plant and Equipment
CORPORATE OFFICES
We do not own any real property. Our corporate offices are located at 918 16th Avenue NW, Suite 408, Calgary, Alberta, Canada, T2M 0K3. The operational offices at 703 - 6th Avenue SW, Suite 410, Calgary, Alberta T2P 0T9 were leased over a 20 month period and expired December 30, 2011. We believe that the facilities will be adequate for the foreseeable future. All costs described in this section are stated in U.S. dollars as converted from Canadian dollars. Accordingly, the costs may vary to some degree with the currency exchange rate.
OIL SANDS LEASES
The Company currently has an interest in 18 oil sands leases in northern Alberta, Canada. 17 of the leases are located in the Peace River oil sands area, and 1 lease is located in the Athabasca oil sands area.
Oil Sands Background
“Oil Sands” refers to unconsolidated, bitumen-saturated sands containing varying amounts of clay and rock material. The bitumen content refers to a heavy, viscous crude oil that generally does not flow under natural reservoir conditions. As a result, it cannot be recovered from a conventional well the way lighter oil is most often produced. The oil sands are contained in three major areas beneath an approximate 140,800 square kilometers (54,363 square miles) of north-eastern Alberta - an area larger than the state of Florida. As of December 2002, according to the Alberta Department of Energy, these three areas, Athabasca/Wabiskaw, Peace River, and Cold Lake, contained 1.6 trillion barrels of bitumen in-place, of which 174 billion barrels are proven reserves that can be recovered using current technology.
These deposits contain a significant amount of oil but until recently the cost of extraction has created a barrier to economic development. Extraction of oil from oil sands requires technologically intensive activity and the input of significant amounts of energy to exploit the oil sands deposits. There are two main types of oil sands production methods: mining and in-situ. Oil sands mining is accomplished using an open pit operation whereby the oil sands are dug up and trucked to a processing facility. For oil sands reservoirs too deep to support economic surface mining, some form of in-situ recovery is required to produce bitumen. In-situ production is similar to that of conventional oil production where oil is recovered through a well. The Alberta Energy and Utilities Board estimates that 80 percent of the total bitumen ultimately recovered will be with in-situ techniques. Numerous in-situ technologies have been developed that apply thermal energy to heat the bitumen and allow it to flow to the well bore.
There are some oil sands reservoirs where primary or “cold” production is possible. The lighter bitumen in these areas can flow towards a well and bitumen production can be enhanced by the co-production of sand, thereby creating a down hole cavity around the well bore which facilitates the flow of oil towards the well. This type of production technology is commonly referred to as “Cold Heavy Oil Production with Sand” (“CHOPS”). While this type of bitumen is marginally lighter and less viscous than the conventional bitumen found in mineable and other in-situ reserves, it is also slightly heavier than the conventional “Heavy Oil” reservoirs produced in the “heavy oil belt” region, located around the central Alberta - Saskatchewan border. Another production technology, which may be suitable for some of the lighter oil sands reservoirs, is the use of horizontal well bores. Horizontal production wells, which have been drilled up to more than 2 kilometers away from their surface locations, have been successfully applied to cold in-situ bitumen production, where it is suitable. In general, open pit oil sands mines are found in central Athabasca deposits, while in-situ bitumen production technology is used in the Cold Lake, south Athabasca, and Peace River deposits, where the overburden thickness exceeds 50 meters.
Oil in oil sands is found mainly in high porosity quartz arenites to arkosic sands that cover large areas and lie up-dip from the purported source rocks to the southwest. There are also vast amounts of heavy oil as well in fractured carbonate rocks of 10-14% porosity underlying a large triangular region of north central Alberta. In addition, there is a large amount of heavy oil in a series of thinner blanket sands and channel sands extending all the way from Suffield, Alberta to zones overlying the Cold Lake Oil Sands near Bonnyville, and extending well into Saskatchewan. The latter deposits called the ‘heavy oil belt” are the sites of the most development attention because the oil is less viscous and it can be produced using either CHOPS or horizontal well technology.
The source rocks for the oil sands are from the Cretaceous and Jurassic shales in the Alberta Syncline. Rapid sedimentation of organic rich argillaceous material caused large flow volumes to be generated as the result of compaction. Deep burial of the kerogeneous source rocks allowed organic diagenesis to occur resulting in the generation of oil and gas from the kerogen. The oil sands are 98% un-cemented (unconsolidated sandstones). The ingress of bitumen has essentially stopped diagenetic processes and the sands do show strong evidence of the early effects of pressure solution and re-crystallization but true cementation is quite rare as are significant calcite cemented zones.
Carboniferous Oil Sands
Strata has focused its efforts on carbonate-hosted bitumen sands. The carbonates are the next challenge in the Alberta oil sands industry. Like oil sands two decades ago, carbonates represent an enormous and relatively untapped petroleum resource. The means for producing bitumen from carbonates is still being studied. The nature of the carbonate triangle in Alberta tends to vary and there is unlikely to be a single one-size-fits-all strategy for production. Cold production may be possible in some areas although in most cases production requires an in-situ treatment. Various technologies have been tested and others considered, including similar technologies to those employed in oil sands (cyclic steam, SAGD, etc.). Bitumen carbonates are still being studied, and as yet there are several techniques which may prove to be effective. We are in the process of determining the most efficient means of producing the bitumen from our Peace River project.
Carbonate oil sands are an unconventional resource that remains almost untapped. While much of the world now knows about Alberta’s vast oil sands resource, many people are unaware that a bitumen resource of similar magnitude is locked in carbonate rock. According to a report by Petroleum Technology Alliance Canada (PTAC), 26% of Alberta’s bitumen resources are contained in carbonate rather than sand formations. One northern Alberta carbonate formation alone — the Devonian-age Grosmont complex — has bitumen volumes in place comparable to the huge Athabasca oil sands deposit. This comparison is made in the 176-page official history of the Alberta Oil Sands Technology and Research Authority (AOSTRA), the long-since disbanded provincial agency set up in 1974 to promote bitumen recovery technologies. The history devotes four well-illustrated pages to bitumen carbonates. The resource received serious attention during the AOSTRA years with a series of pilot tests running in the Grosmont formation between 1975 and 1987. However, oil prices fell and funding was cut. The remotely located and little known bitumen carbonates were largely forgotten until Royal Dutch Shell plc paid nearly $500 million for leases in 2006.
Contained in a roughly triangular 70,000 square-kilometer area of northern Alberta called the Carbonate Triangle, the deposits may be the most technically challenging of the province’s bitumen resources. The basic difference between oil sands and bitumen carbonates is the former is bitumen mixed with unconsolidated sand, which can be either mined or produced from wells. The latter, as the name implies, is bitumen in carbonate rock — both dense limestone and heavily karsted rock. Grosmont bitumen is even heavier than the Athabasca bitumen and the reservoir is extremely variable, meaning that a single recovery method is unlikely to work throughout the formation. The lack of understanding of the heterogeneous nature of the reservoir is the main hurdle for developing successful bitumen recovery schemes. The bitumen is contained in a dual porosity system — both in the vugs (cavities or fractures) and in the rock matrix itself. The vugs could potentially be good news in that they could conceivably improve permeability once the viscosity of the bitumen is raised by heat or other means, but bad news if they serve as channels for steam to escape from the area of interest. In the karsted areas, these irregular cavities and tunnels are often the diameter of a man’s arm, and sometimes much larger. According to the PTAC review of the pilot results, challenges of drilling through this karsted rock include the potential for loss of drilling fluids into the formation, and problems with the placement of cement to maintain a strong well-to-formation bond.
DROWNED AREA OIL SANDS LEASE
Acquisition of Interest
On September 7, 2005 the Company acquired a 100% interest in Alberta Oil Sands Lease #7400100011 (the “Drowned Property’). The rights to the Drowned Property were acquired for a payment of CDN $25,000 (USD $20,635) as well as other closing costs of CDN$9,874 (USD $8,150). The Drowned Property covers 512 hectares of land in the Drowned Area of the Wabiskaw oil sands in the West Athabasca area of Northern Alberta. The lease gives the Company the right to explore the Drowned Property covered by the lease.
Strata's acquisition of the Drowned Property lease includes an overriding 4% royalty agreement with the vendor. The royalty is to be paid on a well-to-well basis and is payable on all petroleum substances produced by any well on the Property. In addition, the Company must pay the province of Alberta CDN $1,792 (USD $1,471) per year to maintain its right to the lease. The lease is subject to a royalty payable to the government of Alberta.
Alberta's project-based generic oil sands royalty regime operates on the principle of revenue minus cost. Royalty is paid at one of two rates, depending on the project’s financial status. The deciding factor is the project’s payout date. A project has “reached payout” once its cumulative revenues have exceeded its cumulative costs. Before the payout date, the applicable royalty is 1% of the project’s gross revenue. This low rate recognizes the high costs, long lead times and high risks associated with oil sands investment. It prevents undue strain on the developer’s financial resources during the most critical, start-up stages of the project. After the payout date, the applicable royalty is the greater of 1% of the project’s gross revenue or 25% of the net revenue for the period.
Location
The Drowned Property lies near the southern edge of the Wabiskaw Heavy Oil/Oil sands field in west Athabasca approximately 45km south of the town of Wabiskaw or 60km Northeast of Slave Lake.
| Lease Number | Hectares | Townships | Range | Section |
| | | | | |
| 7400100011 | 512 | 75, 76 | 23 | 1 and 36 |
Drowned Project Lease Information
The Drowned Property is comprised of a single lease with the government of the province of Alberta, Canada. The lease is a fifteen year lease and expires on October 4, 2015.
| Lease Number | Hectares | Rent / Hectare | Annual Minimum Lease Payments |
| | | | |
| 7400100011 | 512 | CDN $3.50 (USD $3.52) per year | CDN $1,792 (USD $1,802) per year |
Regional Geology
Regionally, the Wabiskaw Reservoir consists of three overlapping en-echelon sand bodies interpreted as shoreface sand which coarsen upwards from shale to fine sand. The three bodies are informally referred to as Wabiskaw “A” Sand, Wabiskaw “B” Sand, and Wabiskaw “C” Sand. The three bodies are separated from each other by shales and each has proven to be correlatable and mappable over a wide area. All three bodies contain bitumen but only the bitumen sand of the Wabiskaw “A” is being cold produced at the present time. The “B” and “C” are generally thinner and contain smaller bitumen accumulations.
Gas and water are also significant components of the reservoir fluids in the Wabiskaw sands. Several associated gas fields are currently in production. There may be a distinct basal water leg below the bitumen. This is especially true in the southwestern part of the Wabiskaw reservoirs.
The deposit lies above the western part of the Athabasca oil sands and extends westward somewhat beyond the McMurray Formation edge. In many regions, the Wabiskaw is oil rich and it overlies the McMurray forming two stacked reservoirs. Detrital matter arrived mainly from the west but mixed with a small component of sediments from the shield. The bitumen is highly viscous and is at a depth of 100 to 700 meters. The Wabiskaw is classified as the lowest Member of the Clearwater Formation and therefore overlies the McMurray Formation. The reservoir and the thickness of oil saturated material vary from 0 to 10 meters.
Property Geology
Several pre-existing bore holes indicate that neither the Wabiskaw “A” sand nor the Wabiskaw “B” sand is present on the Company’s Drowned Property, although it appears that 0 to 4 meters of a thin bitumen-bearing Wabiskaw “C” sand may be present. In addition, the McMurray Formation is present beneath the Wabiskaw and fills a local north-south oriented valley system incised into the older limestone basement. These McMurray valley filled sediments appear to be complex, consisting mainly of water-bearing silts and clays, and hold only minor, discontinuous, bitumen-bearing sands of an unknown quality. The Wabiskaw and McMurray sands lie at a depth of 550 to 600 meters and the Grand Rapids reservoir lies at a depth of 425 to 500 meters.
Previous Work
Historically, the Drowned Project has had four wells drilled on it by companies owning the gas exploration rights. The geophysical well logs demonstrate the presence of bitumen in all four wells, one of which shows the presence of oil sands. The Company did not undertake any exploration work on the Drowned Property in 2011.
Planned Work by the Company for 2012
The Company has focused its exploration efforts on its Peace River Property and as a result, does not have any current plans to undertake an exploration program on the Drowned Property in 2012 due to our limited funds.
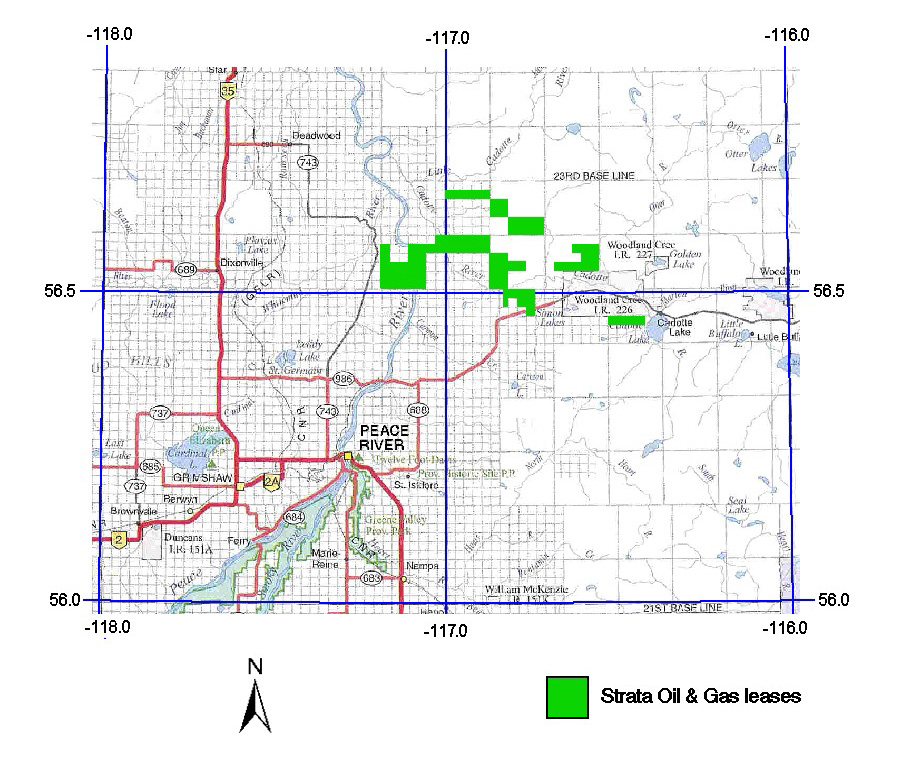
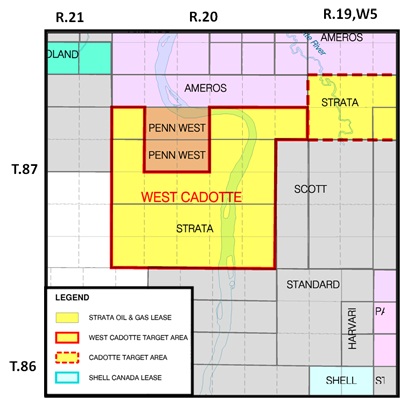
PEACE RIVER OIL SANDS LEASES
The following are two maps showing the location of the Company’s 17 oil sands leases in the Peace River region of northern Alberta, Canada.
Acquisition of Interest
The Company has entered into a series of leases in multiple transactions with the province of Alberta in the Peace River area of Alberta, Canada (the “Peace River Property”). All of the leases were acquired through a public auction process that requires the Company to submit sealed bids for land packages being auctioned by the provincial government. Upon being notified that it has submitted the highest bid for a specific land parcel the Company immediately pays the government the bid price and enters into a formal lease with the government. The bid price includes the first year’s minimum annual lease payments. The specific transactions entered into by the Company are as noted below.
Date | Number of Leases | Land Area (Hectares) | Annual Minimum Lease Payments |
| | | | |
| June 15, 2006 | 3 | 4,864 | CDN $17,024 / USD $17,116 |
| October 19, 2006 | 4 | 3,584 | CDN $12,544 / USD $12,612 |
| November 2, 2006 | 4 | 5,632 | CDN $19,712 / USD $19,818 |
| January 11, 2007 | 4 | 4,608 | CDN $16,128 / USD $16,216 |
| January 24, 2007 | 2 | 2,304 | CDN $8,064 / USD $8,107 |
| | 17 | 20,992 | CDN $73,472 / USD $73,869 |
On December 20, 2010, the Company entered into an assignment and assumption agreement with an Alberta company, a related party by common Director and Officer, assigning an undivided 100% right and interest in 25 Alberta Crown Oil Sands Lease Agreements, pursuant to respective individual lease agreements with the Province of Alberta for the sale price of CDN $300,000 (USD $303,833). The fair market value of CDN $300,000 was established through third party evidence and recent sales comparables. There was a loss recognized of $731,866 on the disposition of properties due to the combination of all acquisition costs and prior year’s annual lease payments being capitalized.
The Peace River Property consists of a total of 20,992 hectares of land in a region of northern Alberta known as Peace River. The leases are subject to royalties payable to the government of Alberta. Alberta's project-based generic oil sands royalty regime operates on the principle of revenue minus cost. Royalty is paid at one of two rates, depending on the project’s financial status. The deciding factor is the project’s payout date. A project has “reached payout” once its cumulative revenues have exceeded its cumulative costs. Before the payout date, the applicable royalty is 1% of the project’s gross revenue. This low rate recognizes the high costs, long lead times and high risks associated with oil sands investment. It prevents undue strain on the developer’s financial resources during the most critical, start-up stages of the project. After the payout date, the applicable royalty is the greater of 1% of the project’s gross revenue or 25% of the net revenue for the period.
Location
The Peace River Property lies in the Peace River oil sands field in Alberta approximate 40 to 50 kilometers northeast of the town of Peace River. These holdings are situated near Cadotte Lake.
Peace River Project Lease Information
The Peace River Property is comprised of 17 leases with the government of the Province of Alberta, Canada. All of the leases are for a 15 year term, require minimum annual lease payments, and grant the Company the right to explore for potential oil sands opportunities on the respective lease.
Regional Geology
The Peace River Cretaceous clastic reservoir consists of a complex stratigraphy similar in nature to the Athabasca Deposit to the east. These are thought to comprise fossil estuarine systems where the best reservoirs are contained in tidal inlet and barrier sands. Secondary reservoir targets may be tidal delta, bayhead delta, tidal channel, and tidal flat sands. The Peace River Carboniferous reservoir consists of platform sediments with relatively few reef building organisms. Structurally, the Peace River strata dip to the southwest and the elevation of the bitumen-bearing interval lies between 50 and 100 meters below sea level or at a depth of between 680 to 790 meters below the surface.
Property Geology (Cadotte Leases)
Strata has focused its efforts on the bitumen resources contained in the Debolt/Elkton carbonate Carboniferous Formation and the Bluesky/Gething clastic Cretaceous Formation in the Cadotte area. In particular, our exploration programs to date have focused on 29 sections in the Cadotte area located in Townships 86 and 87, Ranges 18 and 19W (the “Target Area”).
The nature of the geology of the carbonate sequence in the Target Area has a significant influence on the distribution of the bitumen resource. The principal reference source for this section is the Alberta Research Council’s publication, “Geological Atlas of the Western Canada Sedimentary Basin”. The sequence that hosts the bitumen deposits is the Rundle Group of Lower Carboniferous age. The Rundle Group in this area includes three stratigraphic units which, in ascending order, are the Pekisko, Shunda and Debolt Formations. From place-to-place the Debolt Formation may also include another distinct unit, the Elkton Member. In the Cadotte Lease area, the Elkton Member is usually present, as long as the overlying unconformity with the Cretaceous sequence has not eroded the entire Debolt Formation sequence. Although there are many intervals that are bitumen enriched in the Rundle sequence in the Cadotte Lease area, the principal enrichment zones occur in the Elkton Member, the upper half of the Debolt but usually not right at the top of the formation and, to a lesser extent, in the Shunda Formation. The high grade zones of enrichment are those that occur in the Elkton Member and the Debolt Formation.
A Cretaceous clastic sequence that includes the Gething and Bluesky Formations at the base, unconformably overlies the Carboniferous rocks in this area. All the beds dip gently to the west with those lying below the unconformity having a somewhat greater dip than those above it. This causes the sequence below the unconformity to be eroded to a greater degree to the east and to be less complete, compared with the west. These westerly dips are the result of post-depositional tectonic events and do not reflect the original orientation of the accumulation of sediment. The Carboniferous sequence of the Rundle assemblage accumulated as a result of a series of prograding events that developed in a southerly to south-westerly direction.
The Carboniferous sequence mainly includes platform sediments that show generally shallower-water characteristics up-section. In a basinward direction the depositional facies proceed from beach and lagoonal environments through shoals of the shelf margin to marine basin muds. The lithologies that result include high energy siliciclastics of the beach environment, through various types of carbonates on the platform and its slope to shale in the deep marine environment. There even appear to be beds present that have the character of unconsolidated coarse sediments. Several transgressive events therefore resulted in the accumulation of clastic sediments interbedded with carbonate units.
The carbonate units included relatively few reef building organisms and thus there was little tendency for irregular geological bodies such as reefs to form in this sequence in this area. From one well to the next the regular nature of the deposition that took place at this time is apparent and it is relatively easy to show the correlation that exists between the same units in adjacent wells in the target area. This feature of regular bed continuity is in strong contrast to the variability of the clastic units of the overlying Cretaceous sequence as seen in the Athabasca region.
It is also most noteworthy that the bitumen enrichment is strongly influenced by the bedded nature and continuity of the sediments. It is readily possible in many cases to show the same details of the enriched sequence in adjacent wells even when they are spaced a kilometer or more apart. This has a very strong impact on the selection of data separation distances for the classification of resources; in this sequence an equivalent assurance of existence is achieved with much wider spacing of wells than that used in the classification of bitumen resources for the Cretaceous surface mineable oil sand deposits presently being explored and developed near Fort McMurray.
Previous Work
During the winter drill season of 2006 – 2007, Strata drilled four wells on the Cadotte leases. Three of these wells were within the Cadotte Target Area and one was in the Cadotte East leases. All of the wells were drilled and cored. Three wells were drilled with cores in the Cadotte Target Area, two of which were cased allowing for production testing with the ability to re-enter these wells for future testing. The other well was abandoned due to drilling fluid losses during drilling which did not allow the well to be cased for testing in the future. The fourth well drilled in the Cadotte East location was cored and cased. Due to natural gas flowing from the well, to which the Company did not have the rights to, additional borehole tests were not conducted. The cores of all of these wells were tested and examined in a laboratory in Calgary. The results of these tests were that cold production was not viable. However, the results indicated that the bitumen would flow at approximately 85°C. These results will allow the Company to explore different means of extraction in addition to steam.
Former lease holders have drilled wells on and around the Company’s Target Area. Geophysical well logs are of variable quality but generally consist of a full suite of tools to evaluate the potential reservoirs. With respect to available drilling data, the leases of the Target Area are drilled at an average spacing of one well per section. However, not all of these existing wells were drilled to investigate the sequence located on the Company’s Cadotte leases. The effective average spacing with wells that have penetrated the Carboniferous sequence is approximately 0.8 wells per section. This spacing is from twenty-three wells on or immediately adjacent to the leases. There are an additional two hundred nineteen wells in the surrounding area, the data from which has also been referenced and inspected by the Company to assist with its evaluation of the Cadotte leases.
However, the quality of the data from the wells of different vintage is quite variable. Several of the wells were drilled in the 1950’s. The drilling records and logs for these wells are sometimes poor or absent or they may be less complete than those of more recently drilled wells. A database search was done to identify higher quality data which was restricted to wells drilled since 1970 and this, plus the new Strata wells was used as the primary reference data. A total of eighteen wells of this vintage are located on or immediately adjacent to the lease blocks. The well log data from these wells is the primary source of information on the leases available for the present evaluation but this was supplemented by high quality data from a further thirty-nine more distant wells in the area.
Planned Work by the Company for 2012
Strata intends to continue to discuss a variety of funding arrangements with potential partners in 2012, but until funding can be secured the Company's development plans will temporarily be put on hold. Once financing has been secured, the Company plans to undertake an engineering and production testing/drilling program in the Cadotte main target area. The Company does not have any plans to undertake land acquisitions in 2012. The company plans on conducting a 51-101 compliant engineering resource study of the 22 sections (approximately 14,080 acres) of its Cadotte West holdings.
Cadotte Main – Contingent Bitumen Resource
In the United States, registrants, including foreign private issuers like us, are required to disclose proved reserves using the standards contained in Rule 4-10(a) of the United States Securities and Exchange Commission’s (“SEC”) Regulation S-X.
The Company completed the drilling of its first four wells in the winter drilling season of 2006 – 2007. Strata had engaged Norwest Corporation (”Norwest”) of Calgary, Alberta, Canada to assist Strata with the planning and undertaking of its exploration of the Cadotte leases. On August 16, 2007 Norwest completed a technical report titled Evaluation of In-Place Bitumen Resources - Cadotte Leases and on February 29, 2008 Norwest Questa Engineering Corporation (“Norwest Questa”) of Golden, Colorado completed a report titled Preliminary Feasibility Study of the Cadotte Leases, Alberta, Canada. On April 28, 2010 Norwest completed a follow up report titled Cadotte Project – Resource Reclassification. All of these reports are available to the public on the www.sec.gov web site. All discussion in this section is qualified by reference to the three reports above and readers are advised to read the three technical reports in their entirety.
Evaluation of In-Place Bitumen Resources - Cadotte Leases – August 16, 2007
The study was designed to comply with the requirements of National Instrument 51-101 and the resource classification scheme and criteria elaborated in Volume 1, of the Canadian Oil and Gas Evaluation Handbook. Recoverable bitumen volumes were not addressed in this report because no estimate of the recovery factor was available at the time. Mr. Geoff Jordan, P. Geol., former Senior Vice President of Norwest Corporation and a qualified person as defined by National Instrument 51-101 was responsible for the preparation of the technical information in the report.
The amount of exploration drilling and testing on the Cadotte Target Area was sufficient for that part of the Peace River Oil Sand deposit to be classified as a Discovered Resource (the classification system was subsequently changed such that the Discovered Resource would now be called Discovered Petroleum Initially In-Place (PIIP)). The classification of the Discovered Resource into Low, Best (Most Likely) and High categories was based on the following criteria:
| • | The Low Estimate includes all of the material that has a minimum grade of 8 wt% and a minimum thickness of 10 m; |
| • | The Best (Most Likely) Estimate includes all of the material that has a minimum grade of 8 wt% but no minimum thickness; and |
| • | The High Estimate includes all of the material without any grade or thickness constraint. Hence the latter is an estimate of the original bitumen in place for the zones under investigation in the Cadotte Target Area. |
The results of the different estimates for the Original Bitumen In Place (“OBIP”) are presented on the following table:
Effective OBIP for the Cadotte Area by Target Zone in millions of Stock Tank Barrels (MMSTB), Using 8% wt Cut-off |
| Formation | Low Estimate | Best (Most Likely) Estimate | High Estimate |
| Bluesky/Gething | N/A | N/A | 103 |
| Debolt | 1,443 | 1,500 | 1,503 |
| Elkton | N/A | 490 | 644 |
| Total | 1,443 | 1,990 | 2,251 |
In the Bluesky/Gething Formations the results indicate that there are some areas where grades above the threshold of 8 wt% occur but these are somewhat scattered and there are no areas where especially high grade results were found. At the same time, the ore thickness is generally relatively low.
It is important to note that the resource estimates presented in this report are made for quantities on an in-place basis. This is not an estimate of quantities that may be recovered. Such an estimate could not be made at the time because there was no reliable value available for the bitumen recovery factor that should be applied. Such a factor is determined as a result of the completion of various engineering tests and analyses.
The accuracy of resource estimates is, in part, a function of the quality and quantity of available data and of engineering and geological interpretation and judgment. Given the data available at the time this report was prepared, the estimates presented herein are considered reasonable. However, they should be accepted with the understanding that additional data and analysis available subsequent to the date of the estimates may necessitate revision. These revisions may be material. There is no guarantee that all or any part of the estimated resources of bitumen will be recoverable.
Neither Strata nor Norwest make any express or implied warranties or guarantees of any kind concerning this report; including without limitation any implied warranty of merchantability or fitness for a particular purpose. Specifically, neither Strata nor Norwest make any warranties or guarantees that any property identified in this report will produce oil and/or gas in any quantity, or that any property identified in this report will produce or receive any economic, commercial, or other benefit.
Readers of this 20-F are advised to read the August 16, 2007 report titled Evaluation of In-Place Bitumen Resources - Cadotte Leases, that is publicly available on the www.sec.gov web site and was filed by the Company on September 27, 2007 under cover of 6-K.
Preliminary Feasibility Study of the Cadotte Leases, Alberta, Canada – February 29, 2008
The preliminary feasibility report was prepared in compliance with Canadian National Instrument 51-101 guidelines for disclosure concerning oil and gas resources in Canada. NI 51-101 requires that the procedures and criteria of the Canadian Oil and Gas Evaluation Handbook (“COGE Handbook) be used for resource classification and these standards and criteria have been used in this report. In this case it has been found that the estimate of potentially recoverable bitumen in the Cadotte Target Area at the time of the report could not be classified as a Contingent Resource. The major factor was that there is no pilot project at the time that applied in-situ recovery methods to bitumen in a hardrock carbonate host that could be used as a demonstration of recoverability. This meant that existing pilot projects in clastic hosts, which have different physical characteristics from carbonates, had to be used for performance prediction. This additional risk prevented the “Contingent Resource” classification being made. The additional factors that also prevented classification as a Contingent Resource include:
| 1. | A lack of a cost estimate for the full-field development and operation of a bitumen recovery and upgrading project; |
| 2. | Lack of permeability data for the target zones; and |
| 3. | Limited geologic and reservoir data samples for the target zones |
The Norwest August 16, 2007 report resource estimate is classified as “Discovered Resources”, in accordance with the criteria and former classification scheme of the COGE Handbook. The current version of the COGE Handbook has re-titled “Discovered Resources” as “Discovered Petroleum Initially In Place” (“Discovered PIIP”). The Pre-Feasibility estimate prepared by Norwest Questa is compliant with the requirements of National Instrument 51-101 with respect to classifying the resource as Discovered PIIP. Dr. John D. Wright, Ph.D., P.E., who was President and Chief Engineer, of Norwest Questa Engineering Corporation at the time of the preparation of the Preliminary Feasibility, is a qualified person as defined by National Instrument 51-101. Dr. Wright supervised the preparation of the technical information in this report.
The analogy method was utilized to develop recovery factors that were applied to the OBIP estimates to obtain a low, most likely, and high estimate for potentially recoverable bitumen. Several projects using technology similar to that expected to be implemented on the Cadotte leases were used as analogies for a bitumen recovery method and a resultant range of recovery factors. Shell’s Carmon Project (“Carmon Creek”) was one of the primary analogies utilized by Norwest for the recovery factor estimates. Norwest reviewed the Carmon Creek Project and concluded that some bitumen bearing stratigraphy on Strata’s land correlates with the same stratigraphy at Carmon Creek. Over the last 25 years, Shell has tested numerous recovery methods at Peace River and has recently concluded that Horizontal Cyclic Steam (“HCS”) is the optimal recovery method for Carmon Creek. The Preliminary Feasibility Study for Cadotte is based on the application of that method of extraction, as well as the Shell Carmon Project well layout and designs which were obtained from various public disclosure reports.
A production schedule was developed for the Cadotte leases over the key Target Area of twenty nine sections. Each section, which has an area of one square mile, is about the same size as the Carmon Project pad and development block design. Each pad and development block includes 20 wells of 1,400 m length, each of which is about 600 m in the vertical direction and 800 m horizontally. In the design the pads are “brought on stream” over a four year build-up period. The development block sequence is implemented such that the highest grade and thickest ore blocks are addressed first as long as the local infrastructure is able to service those areas. During the main period of development, the daily production rate for the leases is about 56,000 barrels. The production life for this schedule exceeds 20 years. Cost estimates for this preliminary feasibility study were obtained from a review of public literature.
Based on the analogy method with an adjustment for difference between gross and effective OBIP calculations, Norwest Questa estimated the following recovery factors for application to the effective OBIP deterministic cases:
| · | 17 percent for the Low estimate |
| · | 26 percent for the Most Likely estimate, and |
| · | 38 percent for the High estimate. |
Norwest Questa then applied the estimated recovery factors shown above to the effective OBIP estimates from the August 16, 2007 report, which is the in-place Best estimate at an 8 wt% grade cut-off, to obtain the Low, Most Likely, and High Resource estimates for the Cadotte Area.
On April 28, 2010 Norwest issued a report upgrading the resource classification to “Contingent Resource” from “Discovered Resource”, in accordance with the criteria and former classification scheme of the COGE Handbook. The Resource Reclassification report prepared by Norwest is compliant with the requirements of National Instrument 51-101 with respect to classifying the resource as “Contingent”. Geoff Jordan, P. Geol., Senior Geologist at Norwest Corporation prepared the Resource Reclassification report, is a qualified person as defined by National Instrument 51-101.
With the Cadotte Recoverable bitumen quantity classified as a Contingent Resource, it is a requirement for reporting to identify and list the contingencies. These are as follows:
| • | The company will have to develop a suitable Debolt Formation carbonate Pilot to demonstrate the technical and commercial viability of operating any specific planned in situ recovery method for this project. The cost estimate for development of the project includes a provision for completing this work; |
| • | The company will have to obtain all of the legal permits necessary for the initiation of the project and for construction and operation of it; |
| • | The company will have to secure a suitable market for the bitumen; |
| • | The company will have to ensure that all of the environmental requirements, including those that relate to water usage and disposal are satisfied. |
The 2010 Norwest Corporation report modified the classification of the resources, and not the quantities, to reflect the following recoverable portion of the effective OBIP estimates:
Contingent Resource for the Cadotte Area by Target Zone in millions of Stock Tank Barrels (MMSTB) |
| Formation | Low Estimate | Most Likely Estimate | High Estimate |
| Bluesky/Gething | N/A | N/A | 39 |
| Debolt | 245 | 390 | 571 |
| Elkton | N/A | 127 | 245 |
| Total | 245 | 517 | 855 |
In 2008 Norwest Questa conducted an initial economic evaluation of the Cadotte area, at a level of study consistent with that of a Preliminary Feasibility Study, based on the Most Likely potentially recoverable Discovered PIIP estimate of 517 MMSTB. Based on a forecast price of $65 per barrel and constant costs, this Preliminary Feasibility economic analysis indicated that the development of the Cadotte area was economically viable with a net present value (discounted at 10%) of cash flows before income taxes of about $1.2 billion.
In 2010 Norwest Corporation completed a revised sensitivity analysis based on three different oil prices. The assumptions utilized in the 2010 economic evaluation were based on a review of published public data for similar projects. The analogy method was originally utilized to develop recovery factors that were applied to the original bitumen-in-place estimates to obtain a low, most likely, and high estimate for potentially recoverable bitumen. Several projects using technology similar to that expected to be implemented on Strata's Cadotte Project were used as analogies for a bitumen recovery method and a resultant range of recovery factors. See the table below for the 2010 revised sensitivity analysis:
Revised 2010 Summary of Economic Evaluations at Different Oil Price Assumptions ($US Billions) |
| Oil Price | Gross Oil Revenue | Net Investment | Total Operating Expenses | Crown Royalties | Cumulative Cash Flow | Cumulative Disc. (10%) Cash Flow | IRR |
| Constant $85 WTI | 27.1 | 1.9 | 12.1 | 4.1 | 9.1 | 1.3 | 28% |
| Constant $75 WTI | 22.2 | 1.9 | 12.1 | 2.4 | 5.8 | 0.6 | 20% |
| Constant $95 WTI | 32.1 | 1.9 | 12.1 | 5.9 | 12.1 | 1.9 | 36% |
Based on forecast prices and costs, this revised economic analysis indicates that the development of the Cadotte area is economically viable with a return on capital investment of 28% and Net Present Value (“NPV”) discounted at 10% of $1.3 billion. At a WTI crude oil pride of $85 per barrel, the impact of the planned royalty change is only about a 1% reduction of return on capital investment. At a constant $75 per barrel WTI price, the return on capital investment is just over 20%. Based on the favorable results of the pre-feasibility and revised economic analysis, the Cadotte area warrants further evaluation including a pilot well test program and feasibility level project design and cost estimates.
This report is limited in scope to document only the potentially recoverable portion of the Contingent Resource, formerly referred to as Discovered Petroleum Initially In Place (Discovered PIIP), within the Target Area of the Cadotte properties. This report does not attempt to place a Fair Market Value on that resource portion.
Norwest Corporation reserves the right to revise its opinions of all estimates of resources if new information is deemed sufficiently credible to do so.
The accuracy of any estimate is a function of available time, data, geological engineering, commercial interpretation, and judgment. While the resource estimates presented herein are believed to be reasonable, they should be viewed with an understanding that additional analysis of new data may justify their revision and Norwest Corporation reserves the right to make such revisions.
Readers of this 20-F Annual Report are advised to read the February 29, 2008 report titled Preliminary Feasibility Study of the Cadotte Leases, Alberta, Canada, and the April 28, 2010 report titled Cadotte Project - Resource Reclassification that were filed under cover of Form 6-K on March 6, 2008 and December 23, 2010, respectively, and are publicly available on the www.sec.gov web site.
Cadotte West – Bitumen Resource
Strata's Cadotte West project is located on 22 sections northwest of Shell's Carmon Creek Project and is contiguous to the company's Cadotte Main property holdings in Peace River. Data from prior years drill logs in the area indicate the Bluesky/Gething, Debolt, and Elkton ore zones are present on the lease. This same data reports bitumen in these ore zones.
Historical information obtained from logs in the area indicates the Net Thickness of the Bluesky/Gething ore zone in this region appears to range from about 10 m to 25 m. There are actually two ore zones in the Bluesky/Gething in this area and these appear to individually thicken and come together to the south. Additionally, the logs include confirmation of hydrocarbons in the cuttings samples and are noted to have fluorescence response for hydrocarbons. This does not show the grade but it shows that bitumen is present in the ore zone. The resistivity responses for hydrocarbons in the elastic interval are strong and this indicates that there is a good chance that the zone contains bitumen at ore grade concentrations.
The same logs indicate that the ore zone of the Debolt can be expected to be present throughout the Cadotte West Area. This zone appears to be 25 m to 30 m thick. The logs consistently record that the interval of the Debolt ore zone has "vuggy porosity". This is the same as the Debolt reported under Cadotte Main Target area. The records consistently record strong hydrocarbon fluorescence in this interval, and note "oil saturation" or "strong oil saturation" in the cuttings from well to well over this interval. This suggests that the bitumen ore potential of the zone in this area is much the same as that found in the Cadotte Main Target Area.
Item 4A. Unresolved Staff Comments
Not applicable.
Item 5. Operating and Financial Review and Prospects
Management’s Discussion and Analysis of Financial Condition and Results of Operations
Management’s Discussion and Analysis of Financial Condition and Results of Operations should be read in conjunction with the accompanying audited financial statements for the fiscal years ended December 31, 2011, 2010 and 2009. These reports are presented in United States dollars and have been prepared in accordance with accounting principles generally accepted in the United States, referred to in this annual report as US GAAP.
Certain statements contained in the foregoing MD&A and elsewhere in this 20-F constitute forward-looking statements. Such forward-looking statements involve a number of known and unknown risks, uncertainties and other factors which may cause actual results, performance or achievements of the Company to be materially different from any future results, performance or achievements expressed or implied by such forward-looking statements. Readers are cautioned not to place undue reliance on these forward-looking statements, which speak only as of the date of the financial statements were made, and readers are advised to consider such forward-looking statements in light of the risks set forth above.
The following table sets forth the audited statement of operations data for Strata for the fiscal years indicated:
| | | 2011 | | | 2010 | | | 2009 | |
| Expenses | | $ | (177,252 | ) | | $ | (972,357 | ) | | $ | (331,369 | ) |
| Other income (expenses) | | | 1,806,379 | | | | 4,474,395 | | | | (6,209,807 | ) |
| Net income ( loss) | | | 1,629,255 | | | | 3,502,038 | | | | (6,541,176 | ) |
| From continuing operations | | $ | 0.02 | | | $ | 0.05 | | | $ | (0.10 | ) |
| Basic weighted average common shares outstanding (in millions) | | | 68.8 | | | | 66.4 | | | | 62.9 | |
| Diluted weighted average common shares outstanding (in millions) | | | 69.2 | | | | 73.2 | | | | N/A | |
Year ended December 31, 2011 compared to the year ended December 31, 2010
RESULTS OF OPERATIONS
During the year ended December 31, 2011, the Company had net income of $1,629,255 compared to net income of $3,502,038 for the year ended December 31, 2010, a decrease of $1,872,784. Not including the non-cash changes in fair value derivative liability gain of $1,806,379 (2010 – gain of $4,474,283), expenses for the period decreased $795,104 from $972,357 in 2010 to $177,253 for the year ended December 31, 2011. The decrease is primarily due to the $731,866 loss on disposition of properties recorded in 2010 along with a decrease in consulting fees of $66,264.
For the year ended December 31, 2011, the Company recorded a gain for a change in fair value of derivative liability of $1,806,379 (2010 – gain $4,474,283). This item is a non-cash item and was recorded in accordance with ASC 850-40-15. This guidance requires entities to evaluate whether an equity-linked financial instrument (or embedded feature) is indexed to its own stock by assessing the instrument’s contingent exercise provisions and settlement provisions. Instruments not indexed to their own stock fail to meet the scope exception of Accounting for Derivative Instruments and Hedging Activities, ASC 815-10-15-74(a), and should be classified as a liability and marked-to-market. ASC 815-40-15 was effective for fiscal years beginning after December 15, 2008 and thus, upon its adoption on January 1, 2009, was applied to the Company’s outstanding equity instruments.
REVENUES
The Company did not earn any revenue for the year ended December 31, 2011, 2010 or 2009. We do not anticipate earning revenues until such time as we have entered into commercial production of our oil and gas properties. We are presently in the exploration stage of our business and we can provide no assurance that we will discover commercially exploitable levels of oil or gas resources on our properties, or if such resources are discovered, that we will enter into commercial production of our oil and gas properties.
CONTINUING OPERATIONS
The Company recognized income from continuing operations of $1,629,254 for the year ended December 31, 2011 compared to income from continuing operations in 2010 of $3,502,038, a decrease of $1,872,784. Excluding the non-cash change in derivative liability expenses for 2011 decreased significantly primarily due to the loss on property disposition recognized in 2010 along with the decrease in consulting fees. The Company experienced increase in rent expense for the year, which was offset by decreases in professional fees and office expenses. Stock-based compensation included with consulting fees decreased to $3,000 in 2011 compared to $4,775 in 2010.
DISCONTINUED OPERATIONS
There was no discontinued operations activity in 2011 or 2010.
INTEREST AND OTHER INCOME (EXPENSE)
Included in other income (expense) is a gain of $1,806,379 relating to the change in fair value of derivative liability resulting from a lower fair value of the derivative liability as at December 31, 2011 compared to December 31, 2010. The decrease in derivative liability was the result of a lower option unit value due to deceased share price in 2011. See Note 4 of the Financial Statements. The Company recorded a derivative liability in the amount of $2,004,159 at December 31, 2010. The Company determined the fair value of the derivative liability to be $484,777 as of December 31, 2011 based on an acceptable valuation model. As a result of the changes in fair value, the Company recorded a gain on the change in the fair value of derivative liability of $1,806,379 to the statement of operations for the year ended December 31, 2011.
Year ended December 31, 2010 compared to the year ended December 31, 2009
RESULTS OF OPERATIONS
During the year ended December 31, 2010, we incurred a net income of $3,502,038 compared to a net loss of $6,541,176 for the year ended December 31, 2009, a change of $10,043,214. Not including the non-cash changes in fair value derivative liability gain of $4,474,283 (2009 – loss of $6,210,218), and disposal of properties of $(731,866), the net loss for the period decreased $90,467 largely due to a reduction in consulting fees and rent.
For the year ended December 31, 2010, the Company recorded a gain for a change in fair value of derivative liability of $4,474,283 (2009 – loss $6,210,218). This item is a non-cash item and was recorded in accordance with the new accounting pronouncement of ASC 850-40-15. This guidance requires entities to evaluate whether an equity-linked financial instrument (or embedded feature) is indexed to its own stock by assessing the instrument’s contingent exercise provisions and settlement provisions. Instruments not indexed to their own stock fail to meet the scope exception of Accounting for Derivative Instruments and Hedging Activities, ASC 815-10-15-74(a), and should be classified as a liability and marked-to-market. ASC 815-40-15 was effective for fiscal years beginning after December 15, 2008 and thus, upon its adoption on January 1, 2009, was applied to the Company’s outstanding equity instruments.
REVENUES
The Company did not earn any revenue for the year ended December 31, 2010, 2009 or 2008. We do not anticipate earning revenues until such time as we have entered into commercial production of our oil and gas properties. We are presently in the exploration stage of our business and we can provide no assurance that we will discover commercially exploitable levels of oil or gas resources on our properties, or if such resources are discovered, that we will enter into commercial production of our oil and gas properties.
CONTINUING OPERATIONS
The Company incurred income from continuing operations of $3,502,038 for the year ended December 31, 2010 compared to a loss from continuing operations in 2009 of $6,541,176, an increase of $10,043,214. Not including the non-cash fair value changes in the derivative liability as noted above, a large portion of the decrease in the loss from continuing operations relates to the recognition of $121,120 in consulting fees in 2010 compared to $234,127 in 2009 due to a decrease in salary paid to the former President in 2010. Excluding the decrease of consulting services in 2010 and therefore lower expense due to less outside consulting service activities, stock-based compensation was $4,775 in 2010 compared to a compensation expense of $94,164 in 2009. Office and sundry increased in 2010 to $36,920 from $2,325 in 2009 due mainly to a reversal of accrued liabilities of $47,483 recorded in the prior year. Rent decreased in 2010 to $18,670 from $67,993 in 2009 as a result of the Company not incurring rent on office space in Calgary for the period October 31, 2009 to April 30, 2010. Professional fees increased to $53,101 in 2010 from $17,430 in 2009. The increase in professional fees is due to an overall increased level of Company activity in 2010 compared to 2009 resulting in an increased need in legal, audit related and accounting services.
DISCONTINUED OPERATIONS
There was no discontinued operations activity in 2010 or 2009.
INTEREST AND OTHER INCOME (EXPENSE)
Included in other income (expense) is a gain of $4,474,283 relating to the change in fair value of derivative liability resulting from a lower fair value of the derivative liability as at December 31, 2010 compared to December 31, 2009. The decrease in derivative liability was from the cancelling of options, exercising of warrants and a lower option unit value due to deceased share price in 2010. See Note 4 of the Financial Statements. The Company recorded a derivative liability in the amount of $7,218,561 at December 31, 2009. The Company determined the fair value of the derivative liability to be $2,004,159 as of December 31, 2010 based on an acceptable valuation model. As a result of the changes in fair value, the Company recorded a change in the fair value of derivative liability of $4,474,283 to the statement of operations for the year ended December 31, 2010.
B. Liquidity and Capital Resources
| (in U.S. dollars) | | As at December 31, | |
| | | 2011 | | | 2010 | | | 2009 | |
| Cash and cash equivalents | | $ | 217,504 | | | $ | 151,283 | | | $ | 79,447 | |
| Working capital (deficit) | | | (300,616 | ) | | | (1,894,719 | ) | | | (7,160,928 | ) |
| | | | | | | | | | | | | |
| Net cash provided by (used in) | | | | | | | | | | | | |
| Operating activities | | | (171,862 | ) | | | (224,383 | ) | | | (285,977 | ) |
| Investing activities | | | (69,756 | ) | | | 96,649 | | | | (180,251 | ) |
| Financing activities | | | 325,716 | | | | 200,000 | | | | 413,750 | |
Net cash used in operating activities during the twelve months ended December 31, 2011 was $171,862 compared to $224,383 in 2010. The decrease in cash used in operating activities was as a result of less activity during the year and the collection of receivables. During 2011 the Company collected $26,779 from the Canadian government related to GST tax refundable for prior years.
Cash used in investing activities for 2011 was $69,756 compared to cash provided by investing of $96,649 in 2010. The Company spent $66,212 related to payments due to the Province of Alberta to maintain the Company’s property leases, compared to $187,578 in 2010. The decrease in lease payments is as a result of the decreases in leases held by the Company after the sale of several property leases in 2010. The Company sold more than half of its property leases, generating cash inflow from investing activities of $303,833 in 2010.
The Company generated cash inflows from financing activities of $325,716 compared to $200,000 in 2010. The Company raised $325,716 in funds from five private placements executed during 2011. In 2010 the Company raised $200,000 in proceeds from the exercise of 1,733,335 in stock purchase warrants. See Note 8 to the financial statements.
We expect our oil and gas operations to similarly be financed by equity.
We had cash of $217,504 as of December 31, 2011. We anticipate that we will incur through the end of our next fiscal year:
| · | $175,000 in connection with property lease payments and follow up analysis on the Company’s oil sands properties; |
| · | $175,000 for operating expenses, including working capital, consulting fees, general and administrative, professional, legal and accounting expenses. |
We have no long-term debt. In 2012 our most significant expense is expected to be for the exploration of our oil and gas properties. During 2011 we received $325,716 in proceeds from private placements closed during the year. We believe that our available cash will not be sufficient to fund our working capital requirements for the next twelve months. If we are to continue to explore and develop our oil sands properties, we will require additional funding. We cannot be certain that any required additional financing will be available on terms favorable to us. If additional funds are raised by the issuance of our equity securities, such as through the issuance and exercise of warrants, then existing stockholders will experience dilution of their ownership interest. We believe that debt financing will not be an alternative for funding. The risky nature of this enterprise and lack of tangible assets places debt financing beyond the credit-worthiness required by most banks or typical investors of corporate debt until such time as the economic viability of our oil sands properties can be demonstrated. If adequate funds are not available or not available on acceptable terms, we may be unable to fund expansion, develop or enhance services or respond to competitive pressures.
Critical Accounting Estimates:
The preparation of the Company's financial statements requires management to make estimates and assumptions regarding future events. These estimates and assumptions affect the reported amounts of certain assets and liabilities, and disclosure of contingent liabilities.
The Company follows the full cost method of accounting for natural gas and oil operations. Under the full cost method all costs incurred in the acquisition, exploration and development of natural gas and oil reserves are initially capitalized into cost centers on a country-by-country basis. The Company’s current cost centers are located in Canada. Such costs include land acquisition costs, geological and geophysical expenditures, carrying charges on non-producing properties, costs of drilling and overhead charges directly related to acquisition, exploration and development activities.
Costs capitalized, together with the costs of production equipment, are depleted and amortized on the unit-of-production method based on the estimated net proved reserves, as determined by independent petroleum engineers. The percentage of total reserve volumes produced during the year is multiplied by the net capitalized investment plus future estimated development costs in those reserves. Costs of acquiring and evaluating unproved properties are initially excluded from depletion calculations. These unevaluated properties are assessed periodically to ascertain whether an impairment has occurred. When proved reserves are assigned or the property is considered to be impaired, the cost of the property or the amount of the impairment is added to costs subject to depletion calculations.
Under full cost accounting rules, capitalized costs, less accumulated amortization and related deferred income taxes, shall not exceed an amount (the ceiling) equal to the sum of: (i) the after tax present value of estimated future net revenues computed by applying current prices of oil and gas reserves to estimated future production of proved oil and gas reserves as of the date of the latest balance sheet presented, less estimated future expenditures (based on currents costs) to be incurred in developing and producing the proved reserves computed using a discount factor of ten percent and assuming continuation of existing economic conditions; (ii) the cost of properties not being amortized; and (iii) the lower of cost or estimated fair value of unproven properties included in the costs being amortized. If unamortized costs capitalized within a cost center, less related deferred income taxes, exceed the ceiling, the excess shall be charged to expense and separately disclosed during the period in which the excess occurs. Amounts thus required to be written off shall not be reinstated for any subsequent increase in the cost center ceiling.
Estimates of undiscounted future cash flows that we use for conducting impairment tests are subject to significant judgment decisions based on assumptions of highly uncertain future factors such as, crude oil and natural gas prices, production quantities, estimates of recoverable reserves, and production and transportation costs. Given the significant assumptions required and the strong possibility that actual future factors will differ, we consider the impairment test to be a critical accounting procedure.
The Company has not recognized any revenue from its oil and gas exploration activities which commenced in the last quarter of 2005. During the year ended December 31, 2010 a property impairment was recorded in relation to disposal of non-core oil and gas leases of $731,866. No property impairment adjustments were recorded in 2011 or 2009.
In accordance with ASC 410, Asset Retirement and Environmental Obligations, the fair value of an asset retirement cost, and corresponding liability, should be recorded as part of the cost of the related long-lived asset and subsequently allocated to expense using a systematic and rational method. The Company has recorded an asset retirement obligation at December 31, 2011 and 2010 (Note 6) to reflect its legal obligations related to future abandonment of its oil and gas interests using estimated expected cash flow associated with the obligation and discounting the amount using a credit-adjusted, risk-free interest rate. At least annually, the Company will reassess the obligation to determine whether a change in any estimated obligation is necessary. The Company will evaluate whether there are indicators that suggest the estimated cash flows underlying the obligation have materially changed. Should those indicators suggest the estimated obligation has materially changed the Company will accordingly update its assessment. The asset retirement obligation is measured at fair value on a non-recurring basis using level 3 inputs based on discounted cash flows involving estimates, assumptions, and judgments regarding the cost, timing of settlement, credit-adjusted risk-free rate and inflation rates.
Management has made significant assumptions and estimates determining the fair market value of stock-based compensation granted to employees and non-employees. These estimates have an effect on the stock-based compensation expense recognized and the contributed surplus and share capital balances on the Company’s Balance Sheet. The value of each option award is estimated on the date of grant using the Black-Scholes option-pricing model. To date, all of our stock option grants have been to non-employees. Increases in our share price will likely result in increased stock option compensation expense. The Black-Scholes option-pricing model requires the input of subjective assumptions, including the expected term of the option award and stock price volatility. The expected term of options granted for the purposes of the Black-Scholes calculation is the term of the award since all grants are to non-employees. These estimates involve inherent uncertainties and the application of management judgment. An expected forfeiture rate of nil was used in the recognition of compensation expense for those options not yet vested at December 31, 2011.
These accounting policies are applied consistently for all years presented. Our operating results would be affected if other alternatives were used. Information about the impact on our operating results is included in the notes to our financial statements.
Valuation of Derivative Instruments
US GAAP requires that embedded derivative instruments be bifurcated and assessed, along with free-standing derivative instruments such as warrants and stock-options to determine whether they should be considered a derivative liability and subject to re-measurement at their fair value. Warrants with such provisions will no longer be recorded to equity. In estimating the appropriate fair value, the Company uses a Black-Scholes option pricing model.
Inflation
We operate in Canada only, where inflation for our operational costs is at low levels (i.e. in the 2%-5% range).
Impact of Foreign Currency Fluctuations
We hold our cash reserves in Canadian dollars. We incur the majority of our expenses and capital expenditures in Canadian dollars. We do have US transactions, therefore, an increase or decrease in the value of the Canadian dollar versus the U.S. dollar would have an effect on us.
Government Policies
We are subject to regulations of the Government of Canada and the Government of Alberta. Such regulations may relate directly and indirectly to our operations including production, marketing and sale of hydrocarbons, royalties, taxation, environmental matters and other factors. There is no assurance that the laws relating to our operations will not change in a manner that may materially and adversely affect us; however, there has been no material impact on us from changes to such laws in the past three fiscal periods.
C. Research and development, patents, and licenses, etc.
See Item 4.B. “Business Overview”.
D. Trends
No disclosure is necessary aside from any trend information already disclosed above in Items 5.A. and 5.B.
E. Off-balance sheet arrangements
We do not have any off balance sheet arrangements as of December 31, 2011 and December 31, 2010 or of the date of this report.
F. Contractual obligations
The following table outlines contractual obligations at December 31, 2011.
| Contractual Obligations | | Payments due by period | |
| | | Total | | | Less than 1 year | | | 1-3 years | | | 4-5 years | | | More than five years | |
| Annual Oil Sands Lease Payments: | | | | | | | | | | | | | | | |
| Drowned property lease | | $ | 5,486 | | | | 1,829 | | | $ | 3,657 | | | $ | 0 | | | $ | 0 | |
| Peace River property leases | | | 699,296 | | | | 74,971 | | | | 149,943 | | | | 149,943 | | | | 324,439 | |
| Capital (Finance) Lease Obligations | | | 0 | | | | 0 | | | | 0 | | | | 0 | | | | 0 | |
| Operating Lease Obligations | | | 0 | | | | 0 | | | | 0 | | | | 0 | | | | 0 | |
| Purchase Obligations | | | 0 | | | | 0 | | | | 0 | | | | 0 | | | | 0 | |
| Other Long-Term Liabilities Reflected on the Company’s Balance Sheet Under the GAAP of the primary financial statements | | | 0 | | | | 0 | | | | 0 | | | | 0 | | | | 0 | |
| Total | | $ | 704,782 | | | $ | 76,800 | | | $ | 153,600 | | | $ | 149,943 | | | $ | 324,439 | |
The Drowned Property is comprised of a single lease with the government of the Province of Alberta, Canada requiring annual lease payments of $1,829. The lease is a fifteen year lease and expires on October 4, 2015.
The Peace River Project is currently comprised of 17 leases with the government of the Province of Alberta, Canada requiring annual lease payments of $74,971. The leases are fifteen year leases that begin expiring on June 15, 2020.
At December 31, 2011, the Company had trade payables and accrued liabilities of $57,170 . All of these obligations are due in less than one year.
At December 31, 2011, the Company had a derivative liability of $484,777 that relates to equity instruments with an exercise price in a different currency than the Company’s functional currency (see Note 4 in the financial statements).
Recent Accounting Pronouncements:
ASC No. 2010-03
In January 2010, the Financial Accounting Standards Board (“FASB”) issued Accounting Standards Update (ASU) 2010-03, Extractive Activities Oil and Gas (Topic 932) — Oil and Gas Reserve Estimation and Disclosures, and in April 2010 issued ASU 2010-14, Accounting for extractive activities — Oil and Gas —Amendments to paragraph 932-10-599-1, to align the oil and gas reserve estimation and disclosure requirements of FASB ASC Topic 932, Extractive Activities — Oil and Gas, with the requirements in the SEC’s new oil and gas reporting requirements. The ASU is effective for the Company for the fiscal year ended December 31, 2010.
ASU No. 2010-04
In May 2011, the FASB issued Accounting Standards Update No. 2011-04 (ASU No. 2011-04) “Fair Value Measurement (Topic 820): Amendments to Achieve Common Fair Value Measurement and Disclosure.
Requirements in U.S. GAAP
ASU No. 2011-04 amends Topic 820 in two ways. Specifically, some of the amendments clarify how to apply the existing fair value measurement and disclosure requirements, while some of the amendments change a particular principle or requirement for measuring fair value or disclosing information about fair value measurements. ASU No. 2011-04 does not extend the use of fair value accounting, but rather provide guidance on how it should be applied where its use is already required or permitted by other standards within U.S. GAAP. ASU No. 2011-04 supersedes much of the guidance in ASC Topic 820, but also clarifies existing guidance and changes certain wording in order to align ASC Topic 820 with IFRS 13. The Company’s adoption of this policy will not have a material effect on the Company’s financial statements.
The Company has implemented all new accounting pronouncements that are in effect. These pronouncements did not have any material impact on the financial statements unless otherwise disclosed, and the Company does not believe that there are any other new accounting pronouncements that have been issued that might have a material impact on its financial position or results of operations.
Item 6. Directors, Senior Management and Employees
A. Directors and Senior Management
The directors, officers and other employees upon whose work the Company is dependent are as follows:
| Name | | Position | | Position HeldSince |
| Ron Daems | | President, Chief Executive Officer, Secretary, Director | | July 19, 2010 |
RON DAEMS, age 44, brings extensive financial and resource industry experience to Strata Oil & Gas Inc. In the span of his career, he has focused primarily on business development, strategic planning and financial analysis, while serving as project manager for numerous capital ventures. From 2000 through 2003, Mr. Daems founded and became the CEO of Emerging Business Solutions Inc., a privately held business development company focused primarily on assisting startup companies in the resource sector to develop their land acquisition strategies and their operational and administrative systems. Since January 2007, Mr. Daems has also served as President and CEO of Capex Energy Services Inc., a privately held company and is currently a Director of Power Resource Exploration Inc., Giant Resources Inc., and Rush Exploration Inc.
B. Compensation
The following table shows compensation paid to the Company’s executives for the fiscal year ended December 31, 2011.
| Name | Title | Year | Salary | Bonus | Stock Options Granted | Other Annual Compensation | Restricted Stock Awarded | LTIP Payouts ($) | All Other Compensation |
Ron Daems(1) | Director, CEO, President and Secretary | 2011 | - | - | - | - | - | - | - |
Pratt Barndollar(2) | Director | 2011 | - | - | - | - | - | - | - |
Charlie Perity(3) | Director | 2011 | - | - | - | - | - | - | - |
| (1) | Ron Daems was appointed President, Chief Executive Officer, Secretary and Director on July 19, 2010. Mr. Daems does not bill the Company for these services, however he does have a service agreement with the Company to assist the Company with the identification, acquisition and service of certain exploration style properties that fit the parameters of the Company’s business plan. |
| (2) | Pratt Barndollar was appointed Director on October 14, 2005 and resigned on March 22, 2012. Pursuant to an agreement dated February 8, 2008, Mr. Barndollar began receiving $500 per month to serve as a Director of the Company, however no director fees were recorded during the year due to the reduced activity of the Company and the limited involvement of the Directors throughout the year. The service contract terminated upon Mr. Barndollar’s resignation as Director on March 22, 2012. |
| (3) | On February 1, 2011, Mr. Perity resigned as Director of the Company and therefore his service agreement has been terminated. |
Change of Control Remuneration.
The Company had no plans or arrangements in respect of remuneration received or that may be received by executive officers of the Company in Fiscal 2011 to compensate such officers in the event of termination of employment (as a result of resignation, retirement, change of control) or a change of responsibilities following a change of control.
6.C. Board Practices
6.C.1. Terms of Office.
Refer to Item 6.A.1.
6.C.2. Directors’ Service Contracts.
Mr. Daems, President, CEO, Secretary and Director supervises the company's operations. Mr. Daems does not bill the Company for these services, however he does have a service agreement with the Company to assist the Company with the identification, acquisition and service of certain exploration style properties that fit the parameters of the Company’s business plan. Mr. Barndollar had a service contract providing for payment of CDN $500 per month for his services as a Director of our Company; however, the fees were temporarily suspended due to lessened activity of the Board and to conserve cash flow. Mr. Barndollar resigned as Director on March 22, 2012 and his service agreement simultaneously terminated. The agreement did not provide for any termination benefits of any kind, However, the Board of Directors of the Company has agreed that Mr. Barndollar will retain the right to exercise his 100,000 stock options until their expiration date. No director fees were recorded during the year due to the reduced activity of the Company and the limited involvement of the Directors throughout the year.
On July 19, 2010, due to shareholder vote Mr. Brisset was not re-elected as Director of the Company and therefore his service agreement was terminated.
On February 1, 2011, Mr. Perity resigned as Director of the Company and therefore his service agreement has been terminated.
6.C.3. Board of Director Committees.
The Audit Committee oversees the accounting and financial reporting processes of the Company and all audits and external reviews of the financial statements of the Company on behalf of the Board, and has general responsibility for oversight of internal controls, accounting and auditing activities of the Company. The Committee reviews, on a continuous basis, any reports prepared by the Company's external auditors relating to the Company's accounting policies and procedures, as well as internal control procedures and systems. The Committee is also responsible for examining all financial information, including annual financial statements, prepared for securities commissions and similar regulatory bodies prior to filing or delivery of the same. The Audit Committee also oversees the annual audit process, the Company's internal accounting controls, any complaints and concerns regarding accounting, internal controls or auditing matters and the resolution of issues identified by the Company's external auditors. The Audit Committee recommends to the Board the firm of independent auditors to be nominated for appointment by the shareholders and the compensation of the auditors. The Audit Committee meets on an as needed basis. Currently the Board of Directors functions as the audit committee.
6.D. Employees
The Company had no full-time employees for the year ended December 31, 2011, 2010 and 2009. It is anticipated that we will need to add managerial, technical and administrative staff in the future in order to realize our business objectives. We currently outsource to outside engineers, geologists and consultants on an as-needed basis.
6.E. Share Ownership
The table below indicates as of May 12, 2012, the beneficial ownership of shares of the Company held by each of our officers and directors and all of our officers and directors as a group. Information relating to beneficial ownership of common shares by our principal stockholders and management is based upon information furnished by each person using "beneficial ownership" concepts under the rules of the Securities and Exchange Commission. Under these rules, a person is deemed to be a beneficial owner of a security if that person has or shares voting power, which includes the power to vote or direct the voting of the security, or investment power, which includes the power to vote or direct the voting of the security. The person is also deemed to be a beneficial owner of any security of which that person has a right to acquire beneficial ownership within 60 days. Under the Securities and Exchange Commission rules, more than one person may be deemed to be a beneficial owner of the same securities, and a person may be deemed to be a beneficial owner of securities as to which he or she may not have any pecuniary beneficial interest.
The percentages below are calculated based on 69,412,043 shares of common stock issued and outstanding as of May 12, 2012, plus in the case of a person who has the right to acquire additional shares within 60 days, any new shares which would be issued to effect such acquisition.
| Officers and Directors | Number of Shares | Beneficial Ownership (%) |
| | | |
| Ron Daems | 3,441,000 | 4.96% |
| All Directors and Executive Officers as a Group (1 person) | 3,441,000 | 4.96% |
The persons or entities named in this table, based upon the information they have provided to us, have sole voting and investment power with respect to all shares of common stock beneficially owned by them.
Stock Option Plans:
The Company has three option plans pursuant to which officers, directors, employees and consultants and other agents of the Company could receive shares. The Company has a 2006 Stock Option Plan (“the 2006 Plan”) and a 2002 Stock Option Plan (“the 2002 Plan”).
The principal purposes of the Company’s stock option programs are to (a) promote a proprietary interest in the Company among the officers, directors, employees and consultants of the Company, (b) retain and attract the qualified officers, directors, employees and consultants the Company requires, (c) provide a long-term incentive element in overall compensation, and (d) promote the long-term profitability of the Company.
The Company grants stock options to non-employees for services that include researching Crown land availability and Crown lease acquisitions, geological consulting and geophysicist services including interpretation of seismic data.
Item 7. Major Shareholders and Related Party Transactions
A. Major Shareholders
7.A.1.a. Holdings By Major Shareholders.
The table below indicates the share ownership as of May 12, 2012 of any person or entity that management believes is the beneficial owner of more than 5% of our outstanding common shares.
| Major Shareholders | Number of Shares | Beneficial Ownership (%) |
| Trevor Newton | 5,690,628 | 8.22% |
7.A.1.b. Significant Changes in Major Shareholders’ Holdings.
No significant change has occurred since the date of the financial statements included in this Annual Report.
7.A.1.c. Different Voting Rights.
The Company’s major shareholders do not have different voting rights.
7.A.2 Share Ownership.
On May 12, 2012, the Company had one hundred thirty-seven (132) registered shareholders holding 25,475,919 shares. Of these, twenty-one (21) registered shareholders holding 22,454,477shares have addresses in Canada.
7.A.3 Ownership or Control of the Company.
The Company is not directly or indirectly owned or controlled by another corporation, by any foreign government or by any other natural or legal persons, severally or jointly.
7.A.4. Change of Control of Company Arrangements.
There are no arrangements, known to the Company, the operation of which may at a subsequent date result in a change in control of the Company.
B. Related Party Transactions
On December 20, 2010, the Company entered into an assignment and assumption agreement with an Alberta company, a related party by common Director and Officer, assigning an undivided 100% right and interest in 25 Alberta Crown Oil Sands Lease Agreements, pursuant to respective individual lease agreements with the Province of Alberta for the sale price of CDN $300,000. Fair market value of CDN $300,000 was established through third party evidence and matched with recent sales comparables of leased properties with similar characteristics to and in close proximity to our leases. There was a loss recognized of $731,866 on the disposition of properties due to the combination of all acquisition costs and prior year’s annual lease payments being capitalized.
Shareholder Loans
There are no loans to shareholders outstanding at December 31, 2011 or 2010.
Amounts Owing to Senior Management/Directors
At December 31, 2011 and 2010, $Nil (2009 $2,807) were owing to senior management, directors and companies controlled by directors. Other than as noted above, there have been no transactions since inception, or proposed transactions, which have materially affected or will materially affect the Company in which any director, executive officer, or beneficial holder of more than 5% of the outstanding common shares, or any of their respective relatives, spouses, associates or affiliates has had or will have any direct or material indirect interest. Management believes the transactions referenced above were on terms at least as favorable to the Company as the Company could have obtained from unaffiliated parties.
C. Interests of Experts and Counsel
Not applicable.
Item 8. Financial Information
A. Financial Statements and Other Financial Information
The Company's financial statements are stated in United States Dollars and are prepared in accordance with U.S. Generally Accepted Accounting Principles (GAAP).
The financial statements as required under Item 18 are included in that item. The audit report of Peterson Sullivan LLP is included herein immediately preceding the financial statements.
Audited Financial Statements:
Fiscal years ended December 31, 2011 and 2010, and period from July 1, 2005 (the date entering into the exploration stage) to December 31, 2011.
8.A.7. Legal/Arbitration Proceedings
On November 17, 2010, we received a statement of claim filed in the Court of the Queen’s Bench of Alberta against the Company. The plaintiff alleges that the Company is indebted to the Plaintiff in the sum of $34,190 ($33,506 Canadian dollars) for goods and services rendered by the Plaintiff. We believe this claim is without merit and intend to vigorously defend it.
8.A.8. Policy on Dividend Distributions
We have never declared or paid any cash dividends on our common shares nor do we anticipate paying any in the foreseeable future. Furthermore, we expect to retain any future earnings to finance our operations and expansion. The payment of cash dividends in the future will be at the discretion of our Board of Directors and will depend upon our earnings levels, capital requirements, any restrictive loan covenants and other factors the Board considers relevant.
B. Significant Changes
Not Applicable
Item 9. The Offer and Listing
A. Offer and Listing Details
The following tables set forth the price history of the Company’s stock. All share prices have been adjusted to reflect the 2:1 forward split of the Company’s stock completed in October 2007.
| 1. | Annual high and low market prices for the last five full financial years: |
| Year | Market Price |
| | High Price | Low Price |
| 2011 | $0.375 | $0.08 |
| 2010 | $0.52 | $0.01 |
| 2009 | $0.76 | $0.12 |
| 2008 | $1.54 | $0.10 |
| 2007 | $1.74 | $0.25 |
| 2. | High and low market prices for each full financial quarter during the two most recent full financial years: |
| Financial Quarter | Market Price |
| Year | Quarter | High Price | Low Price |
| 2011 | Fourth Quarter of 2011 | $0.135 | $0.08 |
| Third Quarter of 2011 | $0.22 | $0.101 |
| Second Quarter of 2011 | $0.24 | $0.1345 |
| First Quarter of 2011 | $0.375 | $0.181 |
| 2010 | Fourth Quarter of 2010 | $0.44 | $0.01 |
| Third Quarter of 2010 | $0.28 | $0.12 |
| Second Quarter of 2010 | $0.43 | $0.25 |
| First Quarter of 2010 | $0.52 | $0.33 |
| 3. | High and low market prices for each of the six most recent months: |
| Month | Market Price |
| | High Price. | Low Price |
| November 2011 | $0.135 | $0.10 |
| December 2011 | $0.12 | $0.08 |
| January 2012 | $0.104 | $0.08 |
| February 2012 | $0.15 | $0.08 |
| March 2012 | $0.12 | $0.091 |
| April 2012 | $0.12 | $0.095 |
B. Plan of distribution.
Not applicable.
C. Markets.
In July 2000, our common stock began trading on the Over the Counter Bulletin Board sponsored by the National Association of Securities Dealers, Inc. under the symbol "SBSF.OB". Subsequent to our continuance to Canada, our symbol was changed to “SBASF.OB”. On June 29, 2005, the shareholders approved the sale of the Company’s software assets as well as approved the Company’s change of business to oil and gas exploration. Subsequent to the meeting, the Company’s symbol was changed to “SOIGF.OB”.
In 2010, the new “OTC Markets” quotation tiers began replacing the former OTCBB. OTC Markets Group, Inc. launched the OTCQB marketplace to help investors easily identify SEC reporting companies and regulated banks that are current with their disclosure obligations. Issuers on the OTCQB must be fully reporting and current in their reporting obligations with the SEC, the same as companies traded on the OTCBB. Although, the entire Over the Counter market is regulated by the SEC and FINRA, the OTC Markets and the OTCBB are both now privately owned and merely serve as quotation mediums. The OTC Markets is more user friendly, factually up-to-date and accurate than the website for the OTCBB. Over the Counter quotes can be found at www.otcmarkets.com. Effective February 22, 2011, through progressive changes of the OTC Markets platform, the Company’s stock is now quoted on the OTCQB.
D. Selling shareholders.
Not applicable.
E. Dilution.
Not applicable.
F. Expenses of the issue.
Not applicable.
Item 10. Additional Information
A. Share Capital.
Not applicable.
B. Memorandum and Articles of Incorporation
Securities Register
We maintain at Holladay Stock Transfer (“transfer agent”) a securities register in which we record the securities issued by us in registered form, showing with respect to each class or series of securities:
| a. | the names, alphabetically arranged and the latest known address of each person who is or has been a security holder; |
| b. | the number of securities held by each security holder; and |
| c. | the date and particulars of the issue and transfer of each security. |
The transfer agent keeps information relating to a security holder that is entered in the securities register for at least seven years after the security holder ceases to be a security holder.
Registration
This section summarizes certain material provisions of the Company’s charter and bylaws.
The Company is authorized to issue an unlimited number of shares of common stock (the “Common Shares”) as well as an unlimited number of shares of preferred stock (the “Preferred Shares”).
Subject to the rights of holders of Preferred Shares in the future, if any, holders of the Common Shares are entitled to share equally on a per share basis in such dividends as may be declared by the Board of Directors out of funds legally available therefore. There are presently no plans to pay dividends with respect to the Common Shares. Upon the Company’s liquidation, dissolution or winding up, after payment of creditors and the holders of any of the Preferred Shares, if any, the Company’s assets will be divided pro rata on a per share basis among the holders of the Common Shares. The Common Shares are not subject to any liability for further assessments. There are no conversions or redemption privileges nor any sinking fund provisions with respect to the Common Shares and the Common Shares are not subject to call. The holders of Common Shares do not have any pre-emptive or other subscription rights. Holders of the Common Shares are entitled to cast one vote for each share held at all shareholders’ meetings for all purposes, including the election of directors. The Common Shares do not have cumulative voting rights.
None of the Preferred Shares are currently outstanding. The Board of Directors has the authority, without further action by the holders of the outstanding Common Shares, to issue preferred shares from time to time in one or more series, to fix the number of shares constituting any series, and to fix the terms of any such series, including dividend rights, dividend rates, conversion or exchange rights, voting rights, rights and terms of redemption (including sinking fund provisions), the redemption price and the liquidation preference or such series.
Powers of Directors
The Company’s Bylaws provide that Board of Directors may, from time to time, with or without the authority or the authorization of the shareholders, in such amounts and on such terms as it deems expedient, cause the Company to borrow money. The Board may from time to time delegate to a committee, to a Director, or to an Officer of the Company all or any of the powers conferred on the board by law or the by-laws to such extent and in such manner as the Board from time to time determines.
Description of Securities
Annual and special meetings of the shareholders may be called by the Board of Directors. Notice of a shareholder meeting shall be given not less than 21 days and not more than 60 days prior to the date of such meeting to each Director, the auditor of the Company, and each shareholder of record entitled to vote at the meeting. A quorum for any shareholder meeting shall be persons present not being less than two in number and holding or representing by proxy not less than 5% of the total number of issued shares entitled to vote at the meeting.
C. Material Contracts
We have not entered into any material contracts, other than contracts entered into in the ordinary course of business, for the two years immediately preceding publication of this document. Significant property contracts are as described in Item 4.D.
D. Exchange Controls
There are no government laws, decrees or regulations in Canada which restrict the export or import of capital or, subject to the following sentence, which affect the remittance of dividends or other payments to nonresident holders of Strata’s common shares. However, any such remittance to a resident of the United States is generally subject to non-resident tax pursuant to the 1980 Canada-United States Income Tax Convention. See “Item 10.E Taxation” for additional discussion on tax matters.
There are currently no limitations of general application imposed by Canadian federal or provincial laws on the rights of non-residents of Canada to hold or vote Strata’s common shares. There are also no such limitations imposed by the articles of incorporation with respect to Strata’s common shares. There are, however, certain requirements on the acquisition of control of Strata’s securities by non-residents of Canada. The Investment Canada Act requires notification to and, in certain cases, advance review and approval by, the Government of Canada, of the acquisition by a “non-Canadian” of “control” of a “Canadian business”, all as defined in the Investment Canada Act. Generally speaking, in order for an acquisition to be subject to advance review and approval, the asset value of the Canadian business being acquired must meet or exceed certain monetary thresholds.
E. Taxation
NOTHING HEREIN SHOULD BE INTERPRETED AS LEGAL OR TAX ADVICE AND EACH SHAREHOLDER SHOULD CONSULT WITH HIS OR HER OWN ATTORNEY, ACCOUNTANT AND OTHER PROFESSIONAL ADVISORS ABOUT THE TAX CONSEQUENCES. THE DISCUSSION IS PRESENTED FOR INFORMATION PURPOSES ONLY AND IS INTENDED TO BE A DISCUSSION PRIMARILY OF THE CANADIAN AND UNITED STATES INCOME TAX CONSEQUENCES. EACH SHAREHOLDER IS URGED TO CONSULT WITH HIS OR HER PROFESSIONAL TAX ADVISER WITH RESPECT TO ALL FEDERAL, PROVINCIAL, STATE AND LOCAL INCOME TAXES, GIFT, ESTATE AND OTHER TAX CONSEQUENCES IN THE UNITED STATES AND CANADA. THE TAX AND OTHER MATTERS DESCRIBED HEREIN DO NOT CONSTITUTE, AND SHOULD NOT BE CONSIDERED AS LEGAL OR TAX ADVICE TO SHAREHOLDERS.
CANADIAN FEDERAL INCOME TAX CONSEQUENCES
This summary is based upon the current provisions of the Income Tax Act (Canada), the regulations there under, the current publicly announced administrative and assessing policies of the Canada Revenue Agency, and all specific proposals (the “Tax Proposals”) to amend the Income Tax Act and regulations announced by the Minister of Finance (Canada) prior to the date hereof. This discussion is not exhaustive of all possible Canadian federal income tax consequences and, except for the Tax Proposals, does not take into account or anticipate any changes in law, whether by legislative, governmental or judicial action, nor does it take into account provincial or foreign tax considerations which may differ significantly from those discussed herein.
The summary applies to beneficial owners of common shares who, for the purposes of the Income Tax Act, are residents of the United States and are not resident in Canada, and who hold common shares of Strata as capital property.
Dividends
The Income Tax Act provides that dividends and other distributions deemed to be dividends paid or deemed to be paid by a Canadian resident corporation (such as Strata) to a non-resident of Canada shall be subject to a non-resident withholding tax equal to 25% of the gross amount of the dividend or deemed dividend.
Provisions in the Income Tax Act relating to dividend and deemed dividend payments to and capital gains realized by non-residents of Canada who are residents of the United States are subject to the 1980 Canada-United States Income Tax Convention.
Article X of the 1980 Canada-United States Income Tax Convention provides that the rate of Canadian non-resident withholding tax on dividends or deemed dividends paid to a United States corporation that beneficially owns at least 10% of the voting shares of the corporation paying the dividend shall not exceed 5% of the dividend or deemed dividend, and in any other case, the rate of non-resident withholding tax shall not exceed 15% of the dividend or deemed dividend.
Disposition of Shares
The Income Tax Act provides that a non-resident person is subject to tax in Canada on the disposition of “taxable Canadian property.” Common shares of Strata are considered to be “taxable Canadian property” as defined in the Income Tax Act. Therefore, under the Income Tax Act, a non-resident would be subject to tax in Canada on the disposition of common shares of Strata. Article XIII of the 1980 Canada-United States Income Tax Convention provides that gains realized by a United States resident on the disposition of shares of a Canadian corporation may not generally be taxed in Canada unless the value of the Canadian corporation is derived principally from real property situated in Canada.
Generally, certain filing and reporting obligations exist where a non-resident of Canada disposes of taxable Canadian property. In particular, the non-resident must make an application to the Canada Revenue Agency in advance of the disposition for the purpose of obtaining a certificate issued by the Canada Revenue Agency pursuant to section 116 of the Income Tax Act. If the non-resident fails to secure such certificate from the Canada Revenue Agency in advance of the disposition, the purchaser is required to withhold and remit to the Canada Revenue Agency 25% of the amount otherwise payable to the non-resident.
UNITED STATES FEDERAL INCOME TAX CONSEQUENCES
The following discussion is based on the U.S. Internal Revenue Code of 1986, as amended (the “Code”), existing and proposed Treasury Regulations, published Internal Revenue Service rulings, published administrative positions of the Internal Revenue Service and court decisions that are currently applicable, any or all of which could be materially and adversely changed, possibly on a retroactive basis, at any time. In addition, this discussion does not consider the potential effects, both adverse and beneficial, of any recently proposed legislation that, if enacted, could be applied, possibly on a retroactive basis, at any time. In addition, this discussion does not cover any state, local or foreign tax consequences. The following is a discussion of United States federal income tax consequences, under current law, generally applicable to a U.S. Holder (as defined below) of common shares of Strata who holds such shares as capital assets. This discussion does not address all potentially relevant federal income tax matters and it does not address consequences peculiar to persons subject to special provisions of federal income tax law, such as those described below that are excluded from the definition of a U.S. Holder.
U.S. Holder
As used herein, a “U.S. Holder” includes a holder of common shares of Strata who is a citizen or resident of the United States, a corporation created or organized in or under the laws of the United States or of any political subdivision thereof, any United States entity which is taxable as a corporation for United States tax purposes and any other person or entity whose ownership of common shares of Strata is effectively connected with the conduct of a trade or business in the United States. A U.S. Holder does not include persons subject to special provisions of federal income tax law, such as tax-exempt organizations, qualified retirement plans, financial institutions, insurance companies, real estate investment trusts, regulated investment companies, broker-dealers, nonresident alien individuals or foreign corporations whose ownership of common shares is not effectively connected with the conduct of a trade or business in the United States and shareholders who acquired their shares through the exercise of employee stock options or otherwise as compensation.
Dividends
Except as otherwise discussed below under “Passive Foreign Investment Company Considerations,” U.S. Holders receiving dividend distributions (including constructive dividends) with respect to common shares of Strata are required to include in gross income for United States federal income tax purposes the gross amount of such distributions to the extent that Strata has current or accumulated earnings and profits, without reduction for any Canadian income tax withheld from such distributions. Such Canadian tax withheld may be credited, subject to certain limitations, against the U.S. Holder’s United States federal tax liability or, alternatively, may be deducted in computing the U.S. Holder’s federal taxable income (but in the case of individuals, only if they itemize deductions). See “Foreign Tax Credit.” To the extent that distributions exceed current or accumulated earnings and profits of Strata, they will be treated first as a return of capital up to the U.S. Holder’s adjusted basis in the common shares (which adjusted basis must therefore be reduced) and thereafter as a gain from the sale or exchange of the common shares. Preferential tax rates for long-term capital gains are applicable to a U.S. Holder that is an individual, estate or trust. Moreover, “qualified dividends” received by U.S. Holders who are individuals, during tax years beginning before January 1, 2009, from any “qualified foreign corporation” are subject to a preferential tax rate, provided such individual U.S. Holder meets a certain holding period requirement. A “qualified foreign corporation” is generally any corporation formed in a foreign jurisdiction which has a comprehensive income tax treaty with the United States or, if not, the dividend is paid with respect to stock that is readily tradable on an established United States market. However, a “qualified foreign corporation” excludes a foreign corporation that is a foreign personal holding company, a foreign investment company, or a passive foreign investment company for the year the dividend is paid or the previous year. Strata believes that it qualifies as a “qualified foreign corporation”. There are currently no preferential tax rates for a U.S. Holder that is a corporation.
In general, dividends paid on common shares of Strata will not be eligible for the same dividends received deduction provided to corporations receiving dividends from certain United States corporations. A U.S. Holder which is a corporation may, under certain circumstances, be entitled to a 70% deduction of the United States source portion of dividends received from Strata (unless Strata is a “foreign personal holding company” as defined in Section 552 of the Code, or a “passive foreign investment company” as defined below) if such U.S. Holder owns shares representing at least 10% of the voting power and value of Strata. The availability of this deduction is subject to several complex limitations that are beyond the scope of this discussion.
Foreign Tax Credit
A U.S. Holder who pays (or has withheld from distributions) Canadian or other foreign income tax with respect to the ownership of common shares of Strata may be entitled, at the election of the U.S. Holder, to either a tax credit or a deduction for such foreign tax paid or withheld. This election is made on a year-by-year basis and generally applies to all foreign income taxes paid by (or withheld from) the U.S. Holder during that year. There are significant and complex limitations that apply to the credit, among which is the general limitation that the credit cannot exceed the proportionate share of the U.S. Holder’s United States income tax liability that the U.S. Holder’s foreign source income bears to his or its worldwide taxable income. In the determination of the application of this limitation, the various items of income and deduction must be classified into foreign and domestic sources. Complex rules govern income such as “passive income”, “high withholding tax interest”, “financial services income”, “shipping income” and certain other classifications of income. In addition, U.S. Holders that are corporations and that own 10% or more of the voting stock of Strata may be entitled to an “indirect” foreign tax credit under Section 902 of the Code with respect to the payment of dividends by Strata under certain circumstances and subject to complex rules and limitations. The availability of the foreign tax credit and the application of the limitations on the foreign tax credit are fact specific and holders and prospective holders of common shares should consult their own tax advisors regarding their individual circumstances.
Disposition of Shares
Except as otherwise discussed below under “Passive Foreign Investment Company Considerations,” a gain or loss realized on a sale of common shares will generally be a capital gain or loss, and will be long-term if the shareholder has a holding period of more than one year. The amount of gain or loss recognized by a selling U.S. Holder will be measured by the difference between (i) the amount realized on the sale and (ii) his or its tax basis in the common shares. Gains and losses are netted and combined according to special rules in arriving at the overall capital gain or loss for a particular tax year. Deductions for net capital losses are subject to significant limitations. Individual U.S. Holders may carryover unused capital losses to offset capital gains realized in subsequent years. For U.S. Holders that are corporations (other than corporations subject to Subchapter S of the Code), any unused capital losses may only be carried back three and forward five years from the loss year to offset capital gains until such net capital losses are exhausted.
Foreign Personal Holding Company Considerations
Special rules apply to a U.S. Holder of a “foreign personal holding company” or “FPHC” as defined in Section 552 of the Code. Strata will not be classified as a FPHC for U.S. federal income tax purposes unless (i) five or fewer individuals who are U.S. citizens or residents own or are deemed to own more than 50% of the total voting power of all classes of stock entitled to vote or the total value of Strata stock; and (ii) at least 60% (or 50% in certain cases) of Strata’s gross income consists of “foreign personal holding company income,” which generally includes passive income such as dividends, interest, gains from the sale or exchange of stock or securities, certain rents, and royalties. Strata believes that it is not a FPHC; however, no assurance can be provided that Strata will not be classified as a FPHC in the future.
Passive Foreign Investment Company Considerations
If Strata is a “passive foreign investment company” or “PFIC” as defined in Section 1297 of the Code, U.S. Holders will be subject to U.S. federal income taxation under one of two alternative tax regimes at the election of each such U.S. Holder. Section 1297 of the Code defines a PFIC as a corporation that is not formed in the United States and either (i) 75% or more of its gross income for the taxable year is “passive income”, which generally includes interest, dividends and certain rents and royalties or (ii) the average percentage, by fair market value (or, if Strata elects, adjusted tax basis), of its assets that produce or are held for the production of “passive income” is 50% or more. The rules applicable to a FPHC take priority over the rules applicable to a PFIC, so that amounts includable in gross income under the FPHC rules will not be taxable again under the PFIC rules. Strata does not believe that it will be a PFIC for the current fiscal year or for future years. Whether Strata is a PFIC in any year and the tax consequences relating to PFIC status will depend on the composition of Strata’s income and assets, including cash. U.S. Holders should be aware, however, that if Strata becomes a PFIC, it may not be able or willing to satisfy record-keeping requirements that would enable U.S. Holders to make an election to treat Strata as a “qualified electing fund” for purposes of one of the two alternative tax regimes applicable to a PFIC. U.S. Holders or potential shareholders should consult their own tax advisor concerning the impact of these rules on their investment in Strata.
F. Dividends and Paying Agents
Not applicable.
G. Statement by Experts
Not applicable.
H. Documents on Display
We are subject to the periodic reporting and other informational requirements of the Exchange Act. Under the Exchange Act, we are required to file reports and other information with the SEC. Specifically, we are required to file annually a Form 20-F annual report no later than four months after the close of each fiscal year, which is December 31. Copies of reports and other information, when so filed, may be inspected without charge and may be obtained at prescribed rates at the public reference facilities maintained by the SEC at 100 F Street, N.E., Room 1580, Washington, D.C. 20549. The public may obtain information regarding the Washington, D.C. Public Reference Room by calling the SEC at 1-800-SEC-0330. The SEC also maintains a web site at www.sec.gov that contains reports, proxy and information statements, and other information regarding registrants that make electronic filings with the SEC using its EDGAR system. As a foreign private issuer, we are exempt from the rules under the Exchange Act prescribing the furnishing and content of quarterly reports and proxy statements, and officers, directors and principal shareholders are exempt from the reporting and short-swing profit recovery provisions contained in Section 16 of the Exchange Act.
The Company is not required to file reports and other information with any securities commissions in Canada.
I. Subsidiary Information
Item 11. Quantitative and Qualitative Disclosures About Market Risk
Market risk represents the potential risk of loss in the future earnings of Strata due to adverse changes in financial markets. Strata is exposed to market risk from changes in its common share price, foreign exchange rates and interest rates. Inflation has not had a significant impact on Strata’s results of operations.
Foreign Currency Sensitivity
While our financial statements are reported in US dollars and are intended to comply with U.S. GAAP requirements, a significant portion of our business operations may be conducted in Canadian dollars. Since June 1, 1970, the government of Canada has permitted a floating exchange rate to determine the value of the Canadian dollar as compared to the United States dollar. On May 12, 2012, the exchange rate in effect for Canadian dollars exchanged for United States dollars, expressed in terms of Canadian dollars was $1.01. This exchange rate is based on the noon buying rates of the Bank of Canada.
Interest Rate Sensitivity
The Company currently has no significant long-term or short-term debt requiring interest payments. Thus, the Company has not entered into any agreement or purchased any instrument to hedge against possible interest rate risks at this time.
The Company's interest earning investments are primarily short-term, or can be held to maturity, and thus, any reductions in carrying values due to future interest rate declines are believed to be immaterial. However, as the Company has a significant cash or near-cash position, which is invested in such instruments, reductions in interest rates will reduce the interest income from these investments.
Item 12. Description of Securities Other than Equity Securities
Not applicable.
Item 13. Defaults, Dividend Arrearages and Delinquencies
Item 14. Material Modifications to the Rights of Security Holders and Use of Proceeds
Item 15. Controls and Procedures
Evaluation of Disclosure Controls and Procedures
Our management, under supervision and with the participation of the Principal Executive Officer and the Principal Financial Officer, evaluated the effectiveness of our disclosure controls and procedures, as defined under Exchange Act Rule 13a-15(e). Based upon this evaluation, the Principal Executive Officer and Principal Financial Officer concluded that, as of December 31, 2011, our disclosure controls and procedures were effective.
Disclosure controls and procedures are controls and other procedures that are designed to ensure that information required to be disclosed in our reports filed or submitted under the Securities Exchange Act is recorded, processed, summarized and reported within the time periods specified in the Securities and Exchange Commission’s rules and forms. Disclosure controls and procedures include, without limitation, controls and procedures designed to ensure that information required to be disclosed in our reports filed under the Exchange Act is accumulated and communicated to our management, including our principal executive officer and our principal financial officer, as appropriate, to allow timely decisions regarding required disclosure.
Management’s Report on Internal Controls over Financial Reporting
Our management is responsible for establishing and maintaining adequate internal control over financial reporting, as defined under Exchange Act Rules 13a-15(f) and 15d-15(f). Our internal control over financial reporting is designed to provide reasonable assurance regarding the reliability of financial reporting and the preparation of financial statements for external purposes in accordance with generally accepted accounting principles.
All internal control systems, no matter how well designed, have inherent limitations and may not prevent or detect misstatements. Therefore, even those systems determined to be effective can only provide reasonable assurance with respect to financial reporting reliability and financial statement preparation and presentation. In addition, projections of any evaluation of effectiveness to future periods are subject to risk that controls become inadequate because of changes in conditions and that the degree of compliance with the policies or procedures may deteriorate.
Management assessed the effectiveness of the Company’s internal control over financial reporting as of December 31, 2011. In making the assessment, management used the criteria issued by the Committee of Sponsoring Organizations of the Treadway Commission (COSO) in Internal Control-Integrated Framework. Based on its assessment, management concluded that, as of December 31, 2011, the Company’s internal control over financial reporting was effective.
As defined by Auditing Standard No. 5, “An Audit of Internal Control Over Financial Reporting that is Integrated with an Audit of Financial Statements and Related Independence Rule and Conforming Amendments,” established by the Public Company Accounting Oversight Board (“PCAOB”), a material weakness is a deficiency or combination of deficiencies that results in more than a remote likelihood that a material misstatement of annual or interim financial statements will not be prevented or detected. In connection with the assessment described above, management concluded the Company does not have control deficiencies that represent material weaknesses as of December 31, 2011.
Attestation Report of Registered Public Accounting Firm
This annual report does not include an attestation report of the Company’s independent registered public accounting firm regarding internal control over financial reporting. Management’s report was not subject to attestation by the Company’s independent registered public accounting firm pursuant to permanent rules of the SEC that permit the Company to provide only management’s report in this annual report.
Changes in Internal Controls over Financial Reporting
As of December 31, 2011, management assessed the effectiveness of our internal control over financial reporting and based on that evaluation, they concluded that from January 1, 2011 through December 31, 2011 and to date, the internal controls and procedures were effective. During the course of their evaluation, we did not discover any fraud involving management or any other personnel who play a significant role in our disclosure controls and procedures or internal controls over financial reporting.
We believe that our financial statements contained in our Form 20-F for the twelve months ended December 31, 2011, fairly present our financial position, results of operations and cash flows for the years covered thereby in all material respects. We are committed to improving our financial organization. We will continue to monitor and evaluate the effectiveness of our internal controls and procedures and our internal controls over financial reporting on an ongoing basis and are committed to taking further action and implementing additional enhancements or improvements as necessary.
The Company has made significant changes to improve the segregation of responsibilities during the twelve months ended fiscal December 31, 2011, that have materially improved our internal control over financial reporting.
Item 16A. Audit Committee
Members of the Company’s Audit Committee are financially literate and knowledgeable about the Company’s affairs. Due to unfilled vacancies on the Board of Directors, the Company currently does not have at least one audit committee financial expert serving on its audit committee.
Item 16B. Code of Ethics
The Company has adopted a code of ethics that applies to its Principal Executive Officer, Principal Financial Officer, Principal Accounting Officer or controller, or persons performing similar functions. For purposes of this Item, the term code of ethics means written standards that are reasonably designed to deter wrongdoing and to promote:
| • | honest and ethical conduct, including the ethical handling of actual or apparent conflicts of interest between personal and professional relationships; |
| • | full, fair, accurate, timely, and understandable disclosure in reports and documents that the issuer files with, or submits to, the Commission and in other public communications made by the issuer; |
| • | compliance with applicable governmental laws, rules and regulations; |
| • | the prompt internal reporting of violations of the code to the board of directors or another appropriate person or persons; and |
| • | accountability for adherence to the code. |
The Company hereby undertakes to provide to any person without charge, upon request, a copy of such code of ethics. Such request may be made in writing to the Board of Directors at the address of the issuer.
Item 16C. Principal Accountant Fees and Services
Effective February 29, 2012, the Company changed its principal independent accountants, BDO Canada LLP (“BDO”). On such date, BDO was terminated from serving as the Company’s independent registered public accounting firm and the Company retained Peterson Sullivan LLP (“Peterson Sullivan”) as its principal independent accountants. The pre-approved fees to the Company (including an estimate of year end audit fees) are set forth below:
| | | Fiscal year ending December 31, 2011 (1)(2) | | | Fiscal year ending December 31, 2010 (1) | |
| Audit Fees | | $ | 21,000 | | | $ | 44,720 | |
| Audit Related Fees | | | - | | | | 1,000 | |
| Tax Fees | | | - | | | | - | |
| All Other Fees | | | - | | | | - | |
| | | $ | 21,000 | | | $ | 45,720 | |
| (1) | As of December 31, 2011, the Company’s Audit Committee did not have a formal documented pre-approval policy for the fees of the principal accountant. |
| (2) | Estimated to date for the year ended December 31, 2011 |
Item 16D. Exemptions from the Listing Standards for Audit Committees
Not applicable.
Item 16E. Purchases of Equity Securities by the Issuer and Affiliated Purchasers
Neither the Company nor any “affiliated purchasers” as defined in Rule 10b-18(a)(3) under the Exchange Act purchased any shares of the Company.
Item 16F. Change in Registrant’s Certifying Accountant
Effective February 29, 2012, the Company dismissed BDO Canada LLP (“BDO”) from serving as the Company’s principal independent accountants and retained Peterson Sullivan LLP, Certified Public Accountants (“Peterson Sullivan”) as its principal independent accountants. The decision to change accountants was approved by the Company’s Board of Directors.
BDO’s report on the financial statements for the Company’s fiscal years ended December 31, 2010 and 2009 did not contain any adverse opinion or disclaimer of opinion and was not qualified or modified as to uncertainty, audit scope, or accounting principles.
During the 2010 and 2009 fiscal years and the subsequent interim period that preceded BDO’s dismissal, there was no disagreement with BDO on any matter of accounting principles or practices, financial statement disclosure, or auditing scope or procedure, which disagreement, if not resolved to BDO’s satisfaction, would have caused them to make reference to the subject matter of the disagreement in connection with their report, and there was no reportable event described in Item 16F(a)(1)(v).
However, without qualifying their opinion, BDO included an explanatory paragraph in their report on our financial statements for the 2010 and 2009 fiscal years which noted that there was substantial doubt as to our ability to continue as a going concern.
The Company has provided BDO with a copy of this disclosure and has requested that BDO furnish the Company with a letter addressed to the U.S. Securities and Exchange Commission stating whether they agree with the above statements, and if not, stating the respects in which they do not agree. A copy of that letter from BDO dated May 14, 2012 is filed as an exhibit to this Form 20-F annual report.
Prior to February 29, 2012, when Peterson Sullivan was retained as the Company’s principal independent accountants, the Company did not consult Peterson Sullivan regarding:
(1) Either: The application of accounting principles to a specified transaction, either completed or proposed; or the type of audit opinion that might be rendered on the Company’s financial statements, and either a written report was provided to the Company or oral advice was provided that the new auditors concluded was an important factor considered by the Company in reaching a decision as to the accounting, auditing or financial reporting issue; or
(2) Any matter that was either the subject of a disagreement (as defined in Item 16F(a)(1)(iv) and the related instructions to that item) or a reportable event (as described in Item 16F(a)(1)(v)).
Item 16G. Corporate Governance
We are subject to a variety of corporate governance guidelines and requirements enacted by the SEC under its rules and those mandated by the U.S. Sarbanes Oxley Act of 2002. Today, we are in compliance with the corporate governance legal requirements in the United States. We are listed on the OTCQB and, although we are not required to comply with all of the Exchange’s corporate governance requirements to which we would be subject if we were a U.S. corporation, we feel our governance practices comply with the OTCQB’s requirements as if we were a U.S. domestic issuer.
Item 16H. Mine Health and Safety, Conflict Minerals and Government Payments
Not applicable.
Item 17. Financial Statements
The Company has provided financial statements pursuant to Item 18.
Item 18. Financial Statements
The Company's financial statements are stated in United States Dollars and are prepared in accordance with U.S. Generally Accepted Accounting Principles (GAAP).
The financial statements provided under this item are listed in the table of contents below, and the audit report of Peterson Sullivan LLP immediately precedes the audited financial statements.
Strata Oil & Gas Inc.
(An Exploration Stage Company)
FINANCIAL STATEMENTS
December 31, 2011 and 2010
(Stated in US Dollars)
Strata Oil & Gas Inc.
(An Exploration Stage Company)
Financial Statements
December 31, 2011 and 2010
| Report of Independent Registered Public Accounting Firm | 56 |
| | |
| Financial Statements | |
| | |
| Balance Sheets | 57 |
| Statements of Operations and Comprehensive Income (Loss) | 58 |
| Statements of Changes in Stockholders’ Equity | 59 |
| Statements of Cash Flows | 60 |
| Notes to the Financial Statements | 61 |
REPORT OF INDEPENDENT REGISTERED PUBLIC ACCOUNTING FIRM
To the Board of Directors and Stockholders
Strata Oil and Gas Inc.
We have audited the accompanying balance sheets of Strata Oil and Gas Inc. (an exploration stage company) ("the Company") as of December 31, 2011 and 2010, and the related statements of operations and comprehensive income (loss), changes in stockholders' equity (deficiency), and cash flows for the years ended December 31, 2011, 2010, and 2009, and for the period from July 1, 2005 (the date of entering into exploration stage) to December 31, 2011. These financial statements are the responsibility of the Company's management. Our responsibility is to express an opinion on these financial statements based on our audits.
We conducted our audits in accordance with the standards of the Public Company Accounting Oversight Board (United States). Those standards require that we plan and perform the audit to obtain reasonable assurance about whether the financial statements are free of material misstatement. The Company has determined that it is not required to have, nor were we engaged to perform, an audit of its internal control over financial reporting. Our audits included consideration of internal control over financial reporting as a basis for designing audit procedures that are appropriate in the circumstances, but not for the purpose of expressing an opinion on the effectiveness of the Company's internal control over financial reporting. Accordingly, we express no such opinion. An audit includes examining, on a test basis, evidence supporting the amounts and disclosures in the financial statements. An audit also includes assessing the accounting principles used and significant estimates made by management, as well as evaluating the overall financial statement presentation. We believe that our audits provide a reasonable basis for our opinion.
In our opinion, the financial statements referred to above present fairly, in all material respects, the financial position of Strata Oil and Gas Inc. (an exploration stage company) as of December 31, 2011 and 2010, and the results of its operations and its cash flows for the years ended December 31, 2011, 2010 and 2009, and for the period from July 1, 2005 (the date of entering into exploration stage) to December 31, 2011, in conformity with accounting principles generally accepted in the United States.
The accompanying financial statements have been prepared assuming the Company will continue as a going concern. As discussed in Note 2 to the financial statements, the Company has not been able to generate any operating revenues to date and has incurred cumulative losses during the exploration stage of $11,260,006 through December 31, 2011. These conditions raise substantial doubt about the Company's ability to continue as a going concern. Management's plans regarding those matters are also described in Note 2. The financial statements do not include any adjustments that might result from the outcome of this uncertainty.
/S/ PETERSON SULLIVAN LLP
Seattle, Washington
May 14, 2012
STRATA OIL & GAS INC.
(An Exploration Stage Company)
BALANCE SHEETS
(Expressed in US Dollars)
| | | DECEMBER 31 | |
| | | | | | | |
| | | 2011 | | | 2010 | |
| Assets | | | | | | |
| Current | | | | | | |
| Cash | | $ | 217,504 | | | $ | 151,283 | |
| GST Receivables | | | 15,091 | | | | 42,468 | |
| Prepaid expenses | | | 8,736 | | | | 8,689 | |
Total current assets | | | 241,331 | | | | 202,440 | |
| Deposits | | | 116,172 | | | | 114,139 | |
Office equipment, net (Note 3) | | | 1,361 | | | | 2,244 | |
Oil and gas property interests (Note 5) | | | 7,901,703 | | | | 7,967,915 | |
| Total Assets | | $ | 8,260,567 | | | $ | 8,286,738 | |
| | | | | | | | | |
| Liabilities and Stockholders’ Equity | | | | | | | | |
| Liabilities | | | | | | | | |
| Current | | | | | | | | |
| Accounts payable (Note 7) | | $ | 30,987 | | | $ | 43,673 | |
| Accrued liabilities | | | 26,183 | | | | 49,606 | |
| Derivative liability (Note 4) | | | 484,777 | | | | 2,004,159 | |
Total current liabilities | | | 541,947 | | | | 2,097,438 | |
Asset retirement obligations (Note 6) | | | 127,688 | | | | 119,041 | |
| Total Liabilities | | | 669,635 | | | | 2,216,479 | |
| | | | | | | | | |
| Commitments and contingencies (Note 12) | | | | | | | | |
| Stockholders’ equity | | | | | | | | |
| Preferred stock, no par value, unlimited shares authorized and unissued | | | - | | | | - | |
| Common stock, no par value, unlimited shares authorized; 69,412,043 shares issued and outstanding at December 31, 2011 (2010 – 69,412,043) | | | - | | | | - | |
| Additional paid-in capital | | | 21,028,596 | | | | 21,025,596 | |
| Accumulated deficit | | | (2,748,790 | ) | | | (2,748,790 | ) |
| Deficit accumulated during the exploration stage | | | (11,260,006 | ) | | | (12,889,261 | ) |
| Accumulated other comprehensive income | | | | | | | | |
| Foreign currency translation adjustments | | | 571,132 | | | | 682,714 | |
Total stockholders’ equity | | | 7,590,932 | | | | 6,070,259 | |
| Total Liabilities and Stockholders’ Equity | | $ | 8,260,567 | | | $ | 8,286,738 | |
The accompanying notes are an integral part of these financial statements
STRATA OIL & GAS INC.
(An Exploration Stage Company)
STATEMENTS OF OPERATIONS AND COMPREHENSIVE INCOME (LOSS)
(Expressed in US Dollars)
| | | FOR THE YEAR ENDED DECEMBER 31 | | | | |
| | | | | | | | | | | | From July 1, 2005 (the date of entering into exploration stage) to | |
| | | 2011 | | | 2010 | | | 2009 | | | DECEMBER 31, 2011 | |
| Expenses | | | | | | | | | | | | |
| Salaries and benefits | | $ | - | | | $ | - | | | $ | - | | | $ | 67,335 | |
| Professional fees | | | 46,599 | | | | 53,101 | | | | 17,430 | | | | 328,502 | |
| Office and sundry | | | 29,525 | | | | 36,921 | | | | 2,325 | | | | 496,943 | |
| Rent | | | 31,539 | | | | 18,670 | | | | 67,993 | | | | 256,978 | |
| | | | | | | | | | | | | | | | | |
| Consulting fees (including $3,000, $4,775 and $94,164 of non-employee stock compensation expense for 2011, 2010 and 2009, Note 3 & 7) | | | 57,856 | | | | 121,120 | | | | 234,127 | | | | 9,701,946 | |
| Transfer agent fees | | | 692 | | | | 112 | | | | 240 | | | | 13,407 | |
| Loss on disposal of properties (Note 5) | | | - | | | | 731,866 | | | | - | | | | 731,866 | |
| Accretion expense (Note 6) | | | 8,647 | | | | 8,344 | | | | 7,029 | | | | 29,758 | |
| Depreciation | | | 2,394 | | | | 2,223 | | | | 2,225 | | | | 15,860 | |
| | | | (177,252 | ) | | | (972,357 | ) | | | (331,369 | ) | | | (11,642,595 | ) |
| Other income (expenses) | | | | | | | | | | | | | | | | |
| Interest and miscellaneous income | | | 128 | | | | 112 | | | | 411 | | | | 138,227 | |
| Interest expense | | | - | | | | - | | | | - | | | | (26,444 | ) |
| Loss on disposal of shares | | | - | | | | - | | | | - | | | | (37,736 | ) |
| Gain on settlement of loan | | | - | | | | - | | | | - | | | | 115,343 | |
| Change in fair value of derivative liability (Note 4) | | | 1,806,379 | | | | 4,474,283 | | | | (6,210,218 | ) | | | 70,444 | |
| | | | | | | | | | | | | | | | | |
| | | | 1,806,507 | | | | 4,474,395 | | | | (6,209,807 | ) | | | 259,834 | |
| Income (loss) from continuing operations | | | 1,629,255 | | | | 3,502,038 | | | | (6,541,176 | ) | | | (11,382,761 | ) |
| Income (loss) from discontinued operations | | | - | | | | - | | | | - | | | | 122,755 | |
| Net income (loss) for the period | | | 1,629,255 | | | | 3,502,038 | | | | (6,541,176 | ) | | | (11,260,006 | ) |
| Other comprehensive income (loss) | | | | | | | | | | | | | | | | |
| Foreign currency translation adjustments | | | (111,582 | ) | | | 391,469 | | | | 1,172,706 | | | | 600,948 | |
| Comprehensive income (loss) | | $ | 1,517,673 | | | $ | 3,893,507 | | | $ | (5,368,470 | ) | | $ | (10,519,326 | ) |
| Basis and diluted earnings (loss) per share (Note 8) | | | | | | | | | | | | | | | | |
| Basic income (loss) per common share | | $ | 0.02 | | | $ | 0.05 | | | $ | (0.10 | ) | | | | |
| Diluted income (loss) per common share | | $ | 0.02 | | | $ | 0.05 | | | $ | (0.10 | ) | | | | |
| Basic weighted average number of shares outstanding | | | 68,847,251 | | | | 66,437,025 | | | | 62,881,499 | | | | | |
| Diluted weighted average number of shares outstanding (Note 8) | | | 69,185,451 | | | | 73,223,918 | | | | 62,881,499 | | | | | |
The accompanying notes are an integral part of these financial statements
STRATA OIL & GAS INC.
(An Exploration Stage Company)
STATEMENTS OF CHANGES IN STOCKHOLERS’ EQUITY
(Expressed in US Dollars)
| | | | | | | | | | | | | | | Accumulated | |
| | | | | | Additional | | | | | | Other | | | Total | |
| | | Common Stock | | | Paid-in | | | Accumulated | | | Comprehensive | | | Stockholders’ | |
| | | Shares | | | | | | Deficit | | | Loss | | | Equity | |
| | | | | | | | | | | | | | | | |
| Balance, July 1, 2005 | | | 43,667,888 | | | $ | 2,896,421 | | | $ | (2,748,790 | ) | | $ | (29,816 | ) | | $ | 117,815 | |
| Private placement common stock and warrants issuances for cash, November 2005 (Note 8) | | | 560,000 | | | | 210,000 | | | | - | | | | - | | | | 210,000 | |
| Issuance of common shares as collateral for a loan | | | 240,000,000 | | | | - | | | | - | | | | - | | | | - | |
| Cancellation of common shares upon repayment of the loan | | | (240,000,000 | ) | | | - | | | | - | | | | - | | | | - | |
| Stock-based compensation | | | - | | | | 1,691,671 | | | | - | | | | - | | | | 1,691,671 | |
| Net loss and comprehensive loss | | | - | | | | - | | | | (1,866,518 | ) | | | (390 | ) | | | (1,866,908 | ) |
| | | | | | | | | | | | | | | | | | | | | |
| Balance, December 31, 2005 | | | 44,227,888 | | | | 4,798,092 | | | | (4,615,308 | ) | | | (30,206 | ) | | | 152,578 | |
| | | | | | | | | | | | | | | | | | | | | |
| Private placement common stock and warrants issuances for cash, June 2006 (Note 8) | | | 500,000 | | | | 1,000,000 | | | | - | | | | - | | | | 1,000,000 | |
| Stock option exercises Feb to Aug 2006 | | | 7,324,000 | | | | 5,151,990 | | | | - | | | | - | | | | 5,151,990 | |
| Warrant exercises May to July 2006 | | | 4,523,200 | | | | 508,860 | | | | - | | | | - | | | | 508,860 | |
| Stock-based compensation | | | - | | | | 6,746,118 | | | | - | | | | - | | | | 6,746,118 | |
| Net loss and comprehensive loss | | | - | | | | - | | | | (6,747,405 | ) | | | (328,092 | ) | | | (7,075,497 | ) |
| | | | | | | | | | | | | | | | | | | | | |
| Balance, December 31, 2006 | | | 56,575,088 | | | | 18,205,060 | | | | (11,362,713 | ) | | | (358,298 | ) | | | 6,484,049 | |
| | | | | | | | | | | | | | | | | | | | | |
| Warrant exercises June to December 2007 | | | 2,120,000 | | | | 337,500 | | | | - | | | | - | | | | 337,500 | |
| Stock option exercises Sept to Nov 2007 | | | 1,166,000 | | | | 164,260 | | | | - | | | | - | | | | 164,260 | |
| Stock-based compensation | | | - | | | | (120,151 | ) | | | - | | | | - | | | | (120,151 | ) |
| Net loss and comprehensive income | | | - | | | | - | | | | (454,725 | ) | | | 950,379 | | | | 495,654 | |
| | | | | | | | | | | | | | | | | | | | | |
| Balance, December 31, 2007 | | | 59,861,088 | | | | 18,586,669 | | | | (11,817,438 | ) | | | 592,081 | | | | 7,361,312 | |
| | | | | | | | | | | | | | | | | | | | | |
| Warrant exercise January 2008 (Note 8) | | | 320,000 | | | | 60,000 | | | | - | | | | - | | | | 60,000 | |
| Private placement common stock issuances for cash, January 2008 (Note 8) | | | 1,700,000 | | | | 1,700,000 | | | | - | | | | - | | | | 1,700,000 | |
| Stock-based compensation (Note 3) | | | - | | | | 94,730 | | | | - | | | | - | | | | 94,730 | |
| Net loss and comprehensive loss | | | - | | | | - | | | | (641,743 | ) | | | (1,473,542 | ) | | | (2,115,285 | ) |
| | | | | | | | | | | | | | | | | | | | | |
| Balance, December 31, 2008 | | | 61,881,088 | | | | 20,441,399 | | | | (12,459,181 | ) | | | (881,461 | ) | | | 7,100,757 | |
| | | | | | | | | | | | | | | | | | | | | |
| Cumulative adjustment | | | - | | | | (2,279,016 | ) | | | (139,732 | ) | | | - | | | | (2,418,748 | ) |
| Warrant exercises Jun- Nov 2009 (Note 8) | | | 3,250,000 | | | | 413,750 | | | | - | | | | - | | | | 413,750 | |
| Derivative liability adjustments (Note 4) | | | - | | | | 1,410,405 | | | | - | | | | - | | | | 1,410,405 | |
| Common stock and warrants | | | - | | | | 94,164 | | | | - | | | | - | | | | 94,164 | |
| Net loss and comprehensive income (loss) | | | - | | | | - | | | | (6,541,176 | ) | | | 1,172,706 | | | | (5,368,470 | ) |
| | | | | | | | | | | | | | | | | | | | | |
| Balance, December 31, 2009 | | | 65,131,088 | | | | 20,080,702 | | | | (19,140,089 | ) | | | 291,245 | | | | 1,231,858 | |
| | | | | | | | | | | | | | | | | | | | | |
| Warrant exercises March 2010 (Note 8) | | | 1,733,335 | | | | 200,000 | | | | - | | | | - | | | | 200,000 | |
| Derivative liability adjustments (Note 4) | | | - | | | | 740,119 | | | | - | | | | - | | | | 740,119 | |
| Stock compensation, non-employees | | | - | | | | 4,775 | | | | - | | | | - | | | | 4,775 | |
| Net income and comprehensive income | | | - | | | | - | | | | 3,502,038 | | | | 391,469 | | | | 3,893,507 | |
| | | | | | | | | | | | | | | | | | | | | |
| Balance, December 31, 2010 | | | 69,412,043 | | | | 21,025,596 | | | | (15,638,051 | ) | | | 682,714 | | | | 6,070,259 | |
| | | | | | | | | | | | | | | | | | | | | |
| Stock compensation, non-employees | | | - | | | | 3,000 | | | | - | | | | - | | | | 3,000 | |
| Private placement, common stock and warrants issuance for cash (Note 8) | | | 2,547,620 | | | | 325,716 | | | | - | | | | - | | | | 325,716 | |
| Derivative liability adjustment (Note 4) | | | - | | | | (325,716 | ) | | | - | | | | - | | | | (325,716 | ) |
| Net income and comprehensive income | | | - | | | | | | | | 1,629,255 | | | | (111,582 | ) | | | 1,517,673 | |
| | | | | | | | | | | | | | | | | | | | | |
| Balance, December 31, 2011 | | | 69,412,043 | | | $ | 21,028,596 | | | $ | (14,008,796 | ) | | $ | 571,132 | | | $ | 7,590,932 | |
The accompanying notes are an integral part of these financial statements
STRATA OIL & GAS INC.
(An Exploration Stage Company)
STATEMENTS OF CASH FLOWS
(Expressed in US Dollars)
| | | | | | FROM | |
| | | FOR THE YEARS ENDED DECEMBER 31 | | | July 1, 2005 (the date of entering into exploration stage) to | |
| | | 2011 | | | 2010 | | | 2009 | | | DECEMBER 31, 2011 | |
| Cash flows from operating activities | | | | | | | | | | | | |
| Net income (loss) | | $ | 1,629,255 | | | $ | 3,502,038 | | | $ | (6,541,176 | ) | | $ | (11,260,006 | ) |
| Adjustments to reconcile net income (loss) to net cash used in operating activities: | | | | | | | | | | | | | | | | |
Depreciation and amortization | | | 2,394 | | | | 2,223 | | | | 2,225 | | | | 15,860 | |
Stock option expense for consulting fees | | | 3,000 | | | | 4,775 | | | | 94,164 | | | | 8,654,039 | |
| Accretion expense | | | 8,647 | | | | 8,344 | | | | 7,029 | | | | 29,758 | |
| Loss on disposal of shares | | | - | | | | - | | | | - | | | | 37,736 | |
| Gain on settlement of loan | | | - | | | | - | | | | - | | | | (115,343 | ) |
| Gain on sale of software | | | - | | | | - | | | | - | | | | (130,000 | ) |
| Reversal of liability | | | - | | | | - | | | | (47,483 | ) | | | (47,483 | ) |
| Change in fair value of derivative liability (Note 4) | | | (1,806,379 | ) | | | (4,474,283 | ) | | | 6,210,218 | | | | (70,444 | ) |
| Loss on disposal of oil and gas properties | | | - | | | | 731,866 | | | | - | | | | 731,866 | |
| Change in assets and liabilities: | | | | | | | | | | | | | | | | |
GST Receivables | | | 27,377 | | | | 638 | | | | 3,682 | | | | (11,430 | ) |
Prepaid expenses | | | (47 | ) | | | (7,973 | ) | | | - | | | | (6,390 | ) |
Accounts payable | | | (12,686 | ) | | | (8,175 | ) | | | 918 | | | | 15,159 | |
Accrued liabilities | | | (23,423 | ) | | | 16,164 | | | | (15,554 | ) | | | 21,884 | |
Net cash used in operating activities | | | (171,862 | ) | | | (224,383 | ) | | | (285,977 | ) | | | (2,134,794 | ) |
| | | | | | | | | | | | | | | | | |
| Cash flows from investing activities | | | | | | | | | | | | | | | | |
| Deposits | | | (2,033 | ) | | | (19,606 | ) | | | - | | | | (116,172 | ) |
| Acquisition of oil and gas interests | | | (66,212 | ) | | | (187,578 | ) | | | (180,251 | ) | | | (7,961,045 | ) |
| Proceeds from the sale of oil and gas properties (Note 5) | | | - | | | | 303,833 | | | | | | | | 303,833 | |
| Acquisition of office equipment | | | (1,511 | ) | | | - | | | | - | | | | (11,614 | ) |
| Proceeds on the sale of investments | | | - | | | | - | | | | - | | | | 77,607 | |
| Proceeds on the sale of software | | | - | | | | - | | | | - | | | | 130,000 | |
| Net cash provided by (used in) investing activities | | | (69,756 | ) | | | 96,649 | | | | (180,251 | ) | | | (7,577,391 | ) |
| | | | | | | | | | | | | | | | | |
| Cash flows from financing activities | | | | | | | | | | | | | | | | |
| Proceeds from the issuance of common stock and warrants | | | 325,716 | | | | - | | | | - | | | | 3,235,716 | |
| Proceeds from the exercise of stock options | | | - | | | | - | | | | - | | | | 5,316,250 | |
| Proceeds from the exercise of warrants | | | - | | | | 200,000 | | | | 413,750 | | | | 1,520,110 | |
| Proceeds from loan financing | | | - | | | | - | | | | - | | | | 1,020,000 | |
| Repayment of loan financing | | | - | | | | - | | | | - | | | | (1,020,000 | ) |
| Net cash provided by financing activities | | | 325,716 | | | | 200,000 | | | | 413,750 | | | | 10,072,076 | |
| Foreign exchange effect on cash | | | (17,877 | ) | | | (430 | ) | | | 10,149 | | | | (272,384 | ) |
| Net increase (decrease) in cash | | | 66,221 | | | | 71,836 | | | | (42,329 | ) | | | 87,507 | |
Cash, beginning of period | | | 151,283 | | | | 79,447 | | | | 121,776 | | | | 129,997 | |
Cash, end of period | | $ | 217,504 | | | $ | 151,283 | | | $ | 79,447 | | | $ | 217,504 | |
| Supplemental disclosure of cash flow information | | | | | | | | | | | | | | | | |
| Cash paid during the period for: | | | | | | | | | | | | | | | | |
Interest | | $ | - | | | $ | - | | | $ | - | | | $ | 26,444 | |
Income taxes | | | - | | | | - | | | | - | | | | - | |
| | | | | | | | | | | | | | | | | |
| Non-cash investing and financing activities | | | | | | | | | | | | | | | | |
| Receipt of marketable securities for settlement of loan, net | | $ | - | | | $ | - | | | $ | - | | | $ | 115,343 | |
| Accounts payable related to oil and gas properties interests | | $ | - | | | $ | 19,655 | | | $ | 7,045 | | | $ | 24,160 | |
| Asset retirement obligation | | $ | - | | | $ | - | | | $ | - | | | $ | 82,868 | |
The accompanying notes are an integral part of these financial statements
Notes to the Financial Statements
1. NATURE OF BUSINESS AND OPERATIONS
Strata Oil & Gas Inc. (the ‘Company’) is engaged in the exploration for oil and natural gas in oil sands in the Canadian province of Alberta. The Company was formerly engaged in the development of Knowledge Worker Automation (KWA) software.
Upon disposal of the Company’s software assets and change in focus to oil and gas exploration, the Company has entered the exploration stage of its new business activity and follows Accounting Standards Codification (“ASC”) 915, Development Stage Enterprises.
2. ABILITY TO CONTINUE AS A GOING CONCERN
The accompanying financial statements have been prepared in US dollars and in accordance with accounting principles generally accepted in the United States on a going concern basis, which contemplates the realization of assets and the satisfaction of liabilities and commitments in the normal course of business. The Company commenced its oil and gas exploration activities in the last quarter of 2005. The Company has not realized any revenue from its present operations. During the year ended December 31, 2011, the Company incurred income from continuing operations of $1,629,255 primarily as a result of a $1,806,379 gain from the change in fair value of a derivative liability. In addition, the Company had negative cash flows from operations of $171,862 and is expected to continue to incur further negative operating cash flows in the foreseeable future. Since the Company had re-entered the exploration stage, it has an accumulated deficit of $11,260,006 at December 31, 2011. These conditions raise substantial doubt about the Company's ability to continue as a going concern.
The Company's ability to continue as a going concern is dependent on its ability to develop its oil and gas properties and ultimately achieve profitable operations and to generate sufficient cash flow from financing and operations to meet its obligations as they become payable. The Company expects that it will need approximately $350,000 to fund its operations during the next twelve months which will include minimum annual property lease payments, exploration expenditures as well as operating expenses. Management has plans to seek additional capital through a private placement and public offering of its common stock. Although there are no assurances that management’s plans will be realized, management believes that the Company will be able to continue operations in the future. Accordingly, no adjustment relating to the recoverability and classification of recorded asset amounts and the classification of liabilities has been made to the accompanying financial statements in anticipation of the Company not being able to continue as a going concern.
3. SIGNIFICANT ACCOUNTING POLICIES
Management’s Estimates and Assumptions
The preparation of financial statements in conformity with United States Generally Accepted Accounting Principles requires management to make estimates and assumptions that affect the reported amounts of assets and liabilities as of the balance sheet date, and revenues and expenses for the period then ended. Actual results could differ significantly from those estimates
Oil and Gas Property Payments and Exploration Costs
The Company follows the full cost method of accounting for natural gas and oil operations. Under the full cost method all costs incurred in the acquisition, exploration and development of natural gas and oil reserves are initially capitalized into cost centers on a country-by-country basis. The Company’s current cost center is located in Canada. Such costs include land acquisition costs, geological and geophysical expenditures, carrying charges on non-producing properties, costs of drilling and overhead charges directly related to acquisition, exploration and development activities.
3. SIGNIFICANT ACCOUNTING POLICIES - continued
Costs capitalized, together with the costs of production equipment, are depleted and amortized on the unit-of-production method based on the estimated net proved reserves, as determined by independent petroleum engineers. In December 2009, the Company adopted revised oil and gas reserve estimation and disclosure requirements. The primary impact of the new disclosures is to conform the definition of proved reserves with the SEC Modernization of Oil and Gas Reporting rules, which were issued by the SEC at the end of 2008. The accounting standards update revised the definition of proved oil and gas reserves to require that the average, first-day-of-the-month price during the 12-month period before the end of the year rather than the year-end price, must be used when estimating whether reserve quantities are economical to produce. This same 12-month average price is also used in calculating the aggregate amount of (and changes in) future cash inflows related to the standardized measure of discounted future net cash flows. Costs of acquiring and evaluating unproved properties are initially excluded from depletion calculations. These unevaluated properties are assessed periodically to ascertain whether impairment has occurred. When proved reserves are assigned or the property is considered to be impaired, the cost of the property or the amount of the impairment is added to costs subject to depletion calculations.
Under full cost accounting rules, capitalized costs, less accumulated amortization and related deferred income taxes, shall not exceed an amount (the ceiling) equal to the sum of: (i) the after tax present value of estimated future net revenues computed by applying current prices of oil and gas reserves to estimated future production of proved oil and gas reserves as of the date of the latest balance sheet presented, less estimated future expenditures (based on currents costs) to be incurred in developing and producing the proved reserves computed using a discount factor of ten percent and assuming continuation of existing economic conditions; (ii) the cost of properties not being amortized; and (iii) the lower of cost or estimated fair value of unproven properties included in the costs being amortized. If unamortized costs capitalized within a cost center, less related deferred income taxes, exceed the ceiling, the excess shall be charged to expense and separately disclosed during the period in which the excess occurs. Amounts thus required to be written off shall not be reinstated for any subsequent increase in the cost center ceiling.
The Company has not recognized any revenue from its oil and gas exploration activities which commenced in the last quarter of 2005.
Cash and Cash Equivalents
The Company considers all highly liquid investments purchased with a maturity of 90 days or less to be cash equivalents. There was no cash equivalent balances for the year ended December 31, 2011 (2010 – $Nil).
GST Receivables
GST Receivables are presented net of an allowance for doubtful accounts. Receivables consist of goods and services input tax credits. The allowance was $Nil at both December 31, 2011 and 2010.
Office Equipment
Office equipment is recorded at cost less accumulated depreciation using the straight-line method over the estimated useful lives of the assets which is estimated to be five years.
| | | December 31, 2011 | | | December 31, 2010 | |
| Office equipment | | $ | 11,614 | | | $ | 10,103 | |
| Accumulated depreciation | | | 10,253 | | | | 7,859 | |
| Net book value | | $ | 1,361 | | | $ | 2,244 | |
3. SIGNIFICANT ACCOUNTING POLICIES - continued
Impairment of Long-lived Assets
In accordance with ASC 360, Property, Plant and Equipment, long lived assets such as equipment are reviewed for impairment whenever events or changes in circumstances indicate that the carrying amount of an asset may not be recoverable. Recoverability of assets to be held and used is measured by a comparison of the carrying amount of an asset to estimated undiscounted future cash flows expected to be generated by the asset. If the carrying amount of an asset exceeds its estimated future cash flows, an impairment charge is recognized by the amount by which the carrying amount of the asset exceeds the fair value of the asset. Assets to be disposed of would be separately presented in the balance sheet and reported at the lower of the carrying amount of fair value less costs to sell, and are no longer depreciated. The assets and liabilities of a disposed group classified as held for sale would be presented separately in the appropriate asset and liability sections of the balance sheet.
Asset Retirement Obligations
In accordance with ASC 410, Asset Retirement and Environmental Obligations the fair value of an asset retirement cost, and corresponding liability, should be recorded as part of the cost of the related long-lived asset and subsequently allocated to expense using a systematic and rational method. The Company has recorded an asset retirement obligation at December 31, 2011 and 2010 (Note 6) to reflect its legal obligations related to future abandonment of its oil and gas interests using estimated expected cash flow associated with the obligation and discounting the amount using a credit-adjusted, risk-free interest rate. At least annually, the Company will reassess the obligation to determine whether a change in any estimated obligation is necessary. The Company will evaluate whether there are indicators that suggest the estimated cash flows underlying the obligation have materially changed. Should those indicators suggest the estimated obligation has materially changed the Company will accordingly update its assessment. The asset retirement obligation is measured at fair value on a non-recurring basis using level 3 inputs based on discounted cash flows involving estimates, assumptions, and judgments regarding the cost, timing of settlement, credit-adjusted risk-free rate and inflation rates.
Income Taxes
The Company follows the asset and liability method of accounting for income taxes whereby deferred tax assets and liabilities are recognized for the future tax consequences of differences between the financial statement carrying amounts of existing assets and liabilities and their respective tax bases. If it is determined that the realization of the future tax benefit is not more likely than not, the enterprise establishes a valuation allowance.
Foreign Exchange Translation
The Company's functional currency is the Canadian dollar, but reports its financial statements in US dollars. The Company translates its Canadian dollar balances to US dollars in the following manner: Assets and liabilities have been translated using the rate of exchange at the balance sheet date. The Company’s results of operations have been translated using average rates. Translation gains or losses resulting from the changes in the exchange rates are accumulated as other comprehensive income or loss in a separate component of stockholders' equity.
All amounts included in the accompanying financial statements and footnotes are stated in U.S. dollars.
Derivative Financial Instruments
The Company reviews the terms of its equity instruments and other financing arrangements to determine whether there are embedded derivative instruments that are required to be accounted for separately as a derivative financial instrument. Also, in connection with the issuance of financing instruments, the Company may issue freestanding options or warrants that may, depending on their terms, be accounted for as derivative instrument liabilities because they are exercisable in a currency other than the functional currency of the Company and thus do not meet the “fixed-for-fixed” criteria of ASC 815-40-15. The Company may also issue options or warrants to employees and non-employees in connection with consulting or other services.
3. SIGNIFICANT ACCOUNTING POLICIES - continued
Derivative financial instruments are initially measured at their fair value. For derivative financial instruments that are accounted for as liabilities, the derivative instrument is initially recorded at its fair value and is then re-valued at each reporting date, with changes in the fair value reported as charges or credits to income. For option and warrant-based derivative financial instruments, the Company uses the Black-Scholes option pricing model to value the derivative instruments.
The change in the fair value of unvested options issued to non-employees for goods and services which meet the classification of a derivative financial instrument are charged as a compensation expense in consulting fees over the vesting period. Upon vesting, the change in the fair value of vested options to non-employees is charged to consulting fees.
Any exercise or cancellation of an equity instrument which meets the classification of a derivative financial instrument is true-up to fair value at that date and the fair value of the exercised or cancelled instrument is then re-classed from liability to additional paid in capital.
The classification of derivative instruments, including whether such instruments should be recorded as liabilities or as equity, is reassessed at the end of each reporting period. If reclassification is required, the fair value of the derivative instrument, as of the determination date, is reclassified. Any previous charges or credits to income for changes in the fair value of the derivative instrument are not reversed. Derivative instrument liabilities are classified in the balance sheet as current or non-current based on whether or not net-cash settlement of the derivative instrument could be required within 12 months of the balance sheet date.
Stock Option Plans
The Company has elected to use the Black-Scholes option pricing model to determine the fair value of stock options granted. In accordance with the accounting standard for employees, the compensation expense is amortized on a graded vesting basis over the requisite service period which approximates the vesting period. Compensation expense for stock options granted to non-employees is amortized over the contract services period or, if none exists, from the date of grant until the options vest. Compensation associated with unvested options granted to non-employees is re-measured on each balance sheet date using the Black-Scholes option pricing model. For those options to non-employees which meet the classification of a derivative instrument, the instrument will follow the derivative financial instrument policy.
The expected volatility of options granted has been determined using the methods described under the relevant accounting standard. The Company uses historical data to estimate option exercise, forfeiture and employee termination within the valuation model. For non-employees, the expected term of the options approximates the full term of the options. The risk-free interest rate is based on a treasury instrument whose term is consistent with the expected term of the stock options. The Company has not paid and does not anticipate paying dividends on its common stock; therefore, the expected dividend yield is assumed to be zero. In addition, accounting standard requires companies to utilize an estimated forfeiture rate when calculating the expense for the reporting period. Based on its best estimate, management applied the estimated forfeiture rate of nil in determining the expense recorded in the accompanying Statement of Operations and Comprehensive Loss.
Compensation expense is recognized immediately for past services and pro-rata for future services over the option vesting period. During 2011, the Company recognized $3,000 (2010 - $4,775 expense; 2009 - $94,164) in stock-based compensation expense in the Statement of Operations and Comprehensive Loss in respect of options granted to non-employees. All stock options granted in 2011, 2010 and 2009 were to non-employees of the Company. All unvested stock options which are classified as liability instruments follow the policy in derivative financial instruments.
3. SIGNIFICANT ACCOUNTING POLICIES - continued
The fair value of each option granted is estimated using the Black-Scholes option-pricing model on the date of grant. During the years ended December 31, 2011, 2010 and 2009 the following weighted average assumptions were used:
| | | 2011 | | | 2010 | | | 2009 | |
| Dividend yield | | | 0 | % | | | 0 | % | | | 0 | % |
| Expected volatility | | | 106.5 | % | | | 108.82 | % | | | 108.82 | % |
| Risk-free rate | | | 0.92 | % | | | 3.11 | % | | | 2.82 | % |
| Expected life in years | | | 9 | | | | 10 | | | | 10 | |
The weighted average grant date fair value per option in 2011 was $Nil (2010 - $0.27; 2009 – $Nil)
Expected volatilities are calculated using the historical volatility of the Company’s stock. When applicable, the Company will use historical data to estimate option exercise, forfeiture and employees termination within the valuation model. For non-employees, the expected term of the options approximates the full term of the options.
Earnings (Loss) Per Share of Common Stock
Basic earnings (loss) per share of common stock is computed by dividing net income (loss) available to common shareholders by the weighted-average number of common shares outstanding for the period. Diluted earnings per share of common stock reflect the potential dilution that could occur if securities or other contracts to issue common stock were exercised or converted into common stock or resulted in the issuance of common stock that then shared in the earnings of the Company.
At December 31, 2011, 2010 and 2009, potential common shares of 8,657,486, 7,813,372 and 17,113,600 respectively, related to stock options and warrants were excluded from the computation of diluted earnings per share since their effect was anti-dilutive. See Note 8 for calculation of diluted income per common share.
Fair Value of Financial Instruments
The book values of cash, GST receivables and accounts payable approximate their respective fair values due to the short-term nature of these instruments. The fair value hierarchy under GAAP distinguishes between assumptions based on market data (observable inputs) and an entity’s own assumptions (unobservable inputs). The hierarchy consists of three levels:
| | • | Level one — Quoted market prices in active markets for identical assets or liabilities; |
| | • | Level two — Inputs other than level one inputs that are either directly or indirectly observable; and |
| | • | Level three — Unobservable inputs developed using estimates and assumptions, which are developed by the reporting entity and reflect those assumptions that a market participant would use. |
Determining which category an asset or liability falls within the hierarchy requires significant judgment. We evaluate our hierarchy disclosures each quarter. Liabilities measured at fair value are summarized as follows as of December 31, 2011:
| | | Level 1 | | | Level 2 | | | Level 3 | | | Total | |
| Derivative liability | | $ | — | | | $ | — | | | $ | 484,777 | | | $ | 484,777 | |
| Asset retirement obligation | | $ | — | | | $ | — | | | $ | 127,688 | | | $ | 127,688 | |
As of December 31, 2010:
| | | Level 1 | | | Level 2 | | | Level 3 | | | Total | |
| Derivative liability | | $ | — | | | $ | — | | | $ | 2,004,159 | | | $ | 2,004,159 | |
| Asset retirement obligation | | $ | — | | | $ | — | | | $ | 119,041 | | | $ | 119,041 | |
3. SIGNIFICANT ACCOUNTING POLICIES - continued
We currently measure and report the fair value liability for stock options and warrants with a strike price currency different than the functional currency of the Company on a recurring basis. The fair value liabilities for non-employee stock options and warrants have been recorded as determined utilizing the Black-Scholes option pricing model. See Note 4 for further discussion of the inputs used in determining the fair value.
The asset retirement obligation is measured at fair value on a non-recurring basis using level 3 inputs based on discounted cash flows involving estimates, assumptions, and judgments regarding the cost, timing of settlement, credit-adjusted risk-free rate and inflation rates. See Note 6 for further discussion of the inputs used in determining the fair value.
Comprehensive Income (Loss)
Comprehensive income (loss) is defined to include all changes in equity except those resulting from investments by owners and distributions to owners. The Company's items of other comprehensive income (loss) are foreign currency translation adjustments and unrealized gains and losses on available-for-sale securities.
New Accounting Pronouncements
ASC No. 2010-03
In January 2010, the Financial Accounting Standards Board (“FASB”) issued Accounting Standards Update (ASU) 2010-03, Extractive Activities Oil and Gas (Topic 932) — Oil and Gas Reserve Estimation and Disclosures, and in April 2010 issued ASU 2010-14, Accounting for extractive activities — Oil and Gas —Amendments to paragraph 932-10-599-1, to align the oil and gas reserve estimation and disclosure requirements of FASB ASC Topic 932, Extractive Activities — Oil and Gas, with the requirements in the SEC’s new oil and gas reporting requirements. The ASU is effective for the Company for the fiscal year ended December 31, 2010.
ASU No. 2011-04
In May 2011, the FASB issued Accounting Standards Update No. 2011-04 (ASU No. 2011-04) “Fair Value Measurement (Topic 820): Amendments to Achieve Common Fair Value Measurement and Disclosure
Requirements in U.S. GAAP. ASU No. 2011-04 amends Topic 820 in two ways. Specifically, some of the amendments clarify how to apply the existing fair value measurement and disclosure requirements, while some of the amendments change a particular principle or requirement for measuring fair value or disclosing information about fair value measurements. ASU No. 2011-04 does not extend the use of fair value accounting, but rather provide guidance on how it should be applied where its use is already required or permitted by other standards within U.S. GAAP. ASU No. 2011-04 supersedes much of the guidance in ASC Topic 820, but also clarifies existing guidance and changes certain wording in order to align ASC Topic 820 with IFRS 13. The effective date for ASU 2011-04 is entities for interim and annual periods beginning after December 15, 2011, and should be applied prospectively. The Company’s adoption of this policy will not have a material effect on the Company’s financial statements.
The Company has implemented all new accounting pronouncements that are in effect. These pronouncements did not have any material impact on the financial statements unless otherwise disclosed, and the Company does not believe that there are any other new accounting pronouncements that have been issued that might have a material impact on its financial position or results of operations.
Reclassifications
Certain amounts from the December 31, 2010 and 2009 financial statements have been reclassified to conform with the current year presentation.
4. DERIVATIVE LIABILITIES
Derivative liabilities, consisting of the equity instruments such as options to non-employees and common share warrants with an exercise price in a different currency than the Company’s functional currency, are accounted for as separate liabilities measured at their respective fair values as follows:
| Balance, December 31,2008 | | $ | 2,418,748 | |
| Re-classification to additional paid-in capital on exercise of warrants | | | (1,296,425 | ) |
| Re-classification to additional paid-in capital on cancellation of warrants | | | (208,144 | ) |
| Fair value on unvested options issued as stock compensation | | | 94,164 | |
| Change in fair value of derivative liability | | | 6,210,218 | |
| | | | | |
| Balance, December 31, 2009 | | | 7,218,561 | |
| | | | | |
| Re-classification to common stock on exercise of warrants | | | (622,134 | ) |
| Re-classification to additional paid-in capital on cancellation of options | | | (117,985 | ) |
| | | | | |
| Change in fair value of derivative liabilities | | | (4,474,283 | ) |
| | | | | |
| Balance, December 31, 2010 | | | 2,004,159 | |
| | | | | |
| Fair value on warrants issued in private placements | | | 325,716 | |
| Foreign exchange effect on derivative liability | | | (38,719 | ) |
| Change in fair value of derivative liabilities | | | (1,806,379 | ) |
| | | | | |
| Balance, December 31, 2011 | | $ | 484,777 | |
The fair value of the derivative liabilities has been determined using the Black-Scholes option pricing model using the following range of assumptions:
| | December 31, | December 31, |
| | 2011 | 2010 |
| | | |
| Risk-free interest rate | 0.86 to 0.92% | 2.61 to 3.00% |
| Expected life of derivative liability | 1 to 9 yrs | 2 to 6.5 yrs |
| Annualized volatility | 106.5% | 100% to 113% |
| Dividend rate | 0.00% | 0.00% |
Re-classifications from liability to equity are supplemental non-cash transactions in the cash flow statement.
5. OIL AND GAS PROPERTY INTERESTS
| | | 2011 (Cumulative) | |
| | | Peace River | | | Drowned | | | Total | |
| Property acquisition and lease payments | | $ | 2,626,608 | | | $ | 40,732 | | | $ | 2,667,340 | |
| Geological and geophysical | | | 312,177 | | | | 14,385 | | | | 326,562 | |
| Project management | | | 918,096 | | | | - | | | | 918,096 | |
| Drilling | | | 3,643,735 | | | | - | | | | 3,643,735 | |
| Assaying and analysis | | | 67,564 | | | | - | | | | 67,564 | |
| Asset retirement obligations | | | 105,253 | | | | - | | | | 105,253 | |
| Camp and field supplies | | | 43,217 | | | | - | | | | 43,217 | |
| Travel and accommodation | | | 129,936 | | | | - | | | | 129,936 | |
| Total expenditures | | $ | 7,846,586 | | | $ | 55,117 | | | $ | 7,901,703 | |
5. OIL AND GAS PROPERTY INTERESTS - continued
| | | 2010 (Cumulative) | |
| | | Peace River | | | Drowned | | | Total | |
| Property acquisition and lease payments | | $ | 2,593,951 | | | $ | 41,535 | | | $ | 2,635,486 | |
| Geological and geophysical | | | 318,327 | | | | 14,669 | | | | 332,996 | |
| Project management | | | 936,183 | | | | - | | | | 936,183 | |
| Drilling | | | 3,715,108 | | | | - | | | | 3,715,108 | |
| Assaying and analysis | | | 68,895 | | | | - | | | | 68,895 | |
| Asset retirement obligations | | | 102,684 | | | | - | | | | 102,684 | |
| Camp and field supplies | | | 44,068 | | | | - | | | | 44,068 | |
| Travel and accommodation | | | 132,495 | | | | - | | | | 132,495 | |
| Total expenditures | | $ | 7,911,711 | | | $ | 56,204 | | | $ | 7,967,915 | |
Peace River Property
The Company has entered into a series of leases in multiple transactions with the Province of Alberta in the Peace River area of Alberta, Canada (the “Peace River Property”). All of the leases were acquired through a public auction process that requires the Company to submit sealed bids for land packages being auctioned by the provincial government. Upon being notified that it has submitted the highest bid for a specific land parcel the Company immediately pays the government the bid price and enters into a formal lease with the government. All of the leases are for a 15 year term, require minimum annual lease payments, and grant the Company the right to explore for potential oil sands opportunities on the respective lease. The specific transactions entered into by the Company are as noted below.
| Date | Number of Leases | Land Area (Hectares) | Annual Lease Payments |
| June 15, 2006 | 3 | 4,864 | CDN $17,024 / USD $16,690 |
| October 19, 2006 | 4 | 3,584 | CDN $12,544 / USD $12,298 |
| November 2, 2006 | 4 | 5,632 | CDN $19,712 / USD $19,326 |
| January 11, 2007 | 4 | 4,608 | CDN $16,128 / USD $15,812 |
| January 24, 2007 | 2 | 2,304 | CDN $8,064 / USD $7,906 |
| | 17 | 20,992 | CDN $73,472 / USD $72,032 |
On December 20, 2010, the Company entered into an assignment and assumption agreement with Alberta Company, a related party by common director and officer, assigning an undivided 100% right and interest in 25 Alberta Crown Oil Sands Lease Agreements, pursuant to respective individual lease agreements with the Province of Alberta for the sale price of $303,833 (CDN $300,000) being the approximate fair value of the leases. The fair market value of CDN $300,000 was established through the combination of third party evidence and recent sales comparables. There was a loss recognized of $731,866 on the disposition of properties due to the combination of all acquisition costs and prior year’s annual lease payments being capitalized.
5. OIL AND GAS PROPERTY INTERESTS - continued
Drowned Property
On September 7, 2005 the Company acquired a 100% interest in an Alberta oil sands lease (the “Drowned Property”). The rights to the Drowned Property were acquired for $20,635 plus fees and closing costs of $8,150 which were paid. The Property covers 512 hectares of land in the Drowned Area of the Wabasca oil sands in the West Athabasca area of Northern Alberta. The lease, which expires in October 2015, gives the Company the right
to explore the Property covered by the lease. The Company’s acquisition of the lease includes an overriding 4% royalty agreement with the vendor. The royalty is to be paid on a well-to-well basis and is payable on all petroleum substances produced by any well on the Property. The Property is subject to an annual lease payment payable to the government of Alberta in the amount of CDN $1,792 (USD $1,802) until expiry on October 4, 2015.
All of the Company’s leases for the Peace River and Drowned Properties are also subject to royalties payable to the government of Alberta. The royalties payable to the government of Alberta is in addition to the royalties payable to the vendor above. The royalty is calculated using a revenue-less-cost formula. In years prior to the recovery of the project’s capital investment, the royalty is 1% of gross revenue. Once the project costs have been recovered, the royalty is the greater of 1% of gross revenue or 25% of net revenue.
The following table sets forth the Company’s future minimum lease payments on its oil and gas properties.
| | Total | Less than 1 year | 1-3 years | 4-5 years | More than five years |
| Peace River and Drowned properties | $704,782 | $76,800 | $153,600 | $149,943 | $324,439 |
6. ASSET RETIRMENT OBLIGATIONS
During 2007, the Company drilled four wells on its Peace River Property. Total future asset retirement obligations were estimated by management based on the Company’s working interest in its wells and facilities, estimated costs to remediate, reclaim and abandon the wells and facilities and the estimated timing of the costs to be incurred in future periods. The Company has estimated the net present value of its total asset retirement obligations to be approximately $127,688 at December 31, 2011 (2010 - $119,041), based on an undiscounted total future liability of $278,782 (CDN$293,000). These payments are expected to be incurred between 2015 and 2030. The Company used a credit adjusted discount rate of 10% per annum and an inflation rate of 2% to calculate the present value of the asset retirement obligation. Accretion expense of $8,647 (2010 – $8,344, 2009 - $7,029) has been recorded in the Statements of Operations and Comprehensive Loss at December 31, 2011.
7. RELATED PARTY TRANSACTIONS
Related party transactions not disclosed elsewhere in these financial statements include:
Management Fees
Total compensation expense to the former President and current President of $5,487 (2010 - $26,130, 2009 - $12,775) has been recognized as consulting fees for the year ended December 31, 2011.
Mr. Daems does not bill the Company for his services as President, however he does have a service agreement with the Company to assist with identification, acquisition and service of certain exploration style properties that fit the parameters for the Company’s acquisition plan.
Directors’ fees
Directors’ fees of $Nil (2010 and 2009 - $Nil) have been recorded as consulting fees at December 31, 2011.
8. SHARE CAPITAL
On November 15, 2005 the Company closed a private placement of 560,000 units at $0.375 per unit for a total offering price of $210,000. Each unit consisted of one share of the common stock of the Company, one Class A Warrant exercisable for one share of Common Stock at an exercise price of $0.44 for a period of four years commencing on November 15, 2006, and one Class B Warrant exercisable for one share of Common Stock at an exercise price of $0.50 for a period of three years commencing on November 15, 2007. The Company has the right to accelerate the exercise date or reduce the exercise price of the Class A and Class B Warrants.
On May 9, 2006, at a Special Meeting of the Company’s stockholders, a majority of the Company’s stockholders approved a 2:1 forward stock split. The record and payment dates of the forward split were May 10 and May 11, 2006 respectively. All of the common shares issued and outstanding on May 10, 2006 were split. All references to share and per share amounts have been restated in these financial statements to reflect the split.
On June 13, 2006 the Company closed a private placement of 500,000 units at $2.00 per unit for a total offering price of $1,000,000. Each unit consisted of one share of the common stock of the Company, one Class A Warrant exercisable for one share of Common Stock at an exercise price of $2.125 for a period of four years commencing on June 13, 2007 and one Class B Warrant exercisable for one share of Common Stock at an exercise price of $2.25 for a period of three and one half years commencing on December 13, 2007. The Company has the right to accelerate the exercise date or reduce the exercise price of the Class A and Class B Warrants.
On July 13, 2007, at a Special Meeting of the Company’s stockholders, a majority of the Company’s stockholders approved a 2:1 forward stock split. The record and payment dates of the forward split were October 8 and October 9, 2007 respectively. All of the common shares issued and outstanding on October 8, 2007 were split. All references to share and per share amounts have been restated in these financial statements to reflect the split.
On January 9, 2008, 320,000 common share warrants were exercised at an exercise price of $0.1875 for total proceeds of $60,000.
On January 28, 2008, the Company closed a private placement of 1,700,000 common shares at $1.00 per share for total proceeds of $1,700,000.
On June 19, 2009, 100,000 common share warrants were exercised at an exercise price of $0.20 for total proceeds of $20,000. Upon exercise, the fair value of this liability instrument at this date of $39,890 was re-classified from liability to additional paid in capital.
On July 07, 2009, 1,550,000 common share warrants were exercised at an exercise price of $0.1250 for total proceeds of $193,750. Upon exercise, the fair value of this liability instrument at this date of $598,525 was re-classified from liability to additional paid in capital.
On November 17, 2009, 1,600,000 common share warrants were exercised at an exercise price of $0.1250 for total proceeds of $200,000. Upon exercise, the fair value of this liability instrument at this date of $658,010 was re-classified from liability to additional paid in capital.
On March 3, 2010, 888,890 common share warrants were exercised at an exercise price of $0.11 for total proceeds of $100,000. Upon exercise, the fair value of this liability instrument at this date of $321,689 was re-classified from liability to additional paid in capital. See Note 4.
On March 18, 2010, 844,445 common share warrants were exercised at exercise prices ranging from $0.1125 to $0.19 for total proceeds of $100,000. Upon exercise, the fair value of this liability instrument at this date of $300,445 was re-classified from liability to additional paid in capital. See Note 4.
On January 06, 2011, the Company closed a private placement for a total of 1,000,000 units at $0.10 per unit for total offering price of $100,000. Each unit consisted of one share of the common stock of the Company and one Class A Warrant exercisable for one share of common stock at an exercise price of $0.15 for a period of four years commencing on January 25, 2012 and expiring on January 25, 2016.
8. SHARE CAPITAL - Continued
On March 30, 2011, the Company closed two private placements for a total of 625,000 units at $0.16 per unit for a total offering price of $100,000. Each unit consisted of one share of the common stock of the Company and one Class A Warrant exercisable for one share of common stock at an exercise price of $0.24 for a period of four years commencing on March 30, 2012 and expiring on March 30, 2016.
On May 17, 2011, the Company closed a private placement for a total of 714,286 units at $0.14 per unit for a total offering price of $100,000. Each unit consisted of one share of the common stock of the Company and one Class A Warrant exercisable for one share of common stock at an exercise price of $0.21 for a period of four years commencing on May 17, 2012 and expiring on May 17, 2016.
On August 12, 2011, the Company closed a private placement for a total of 208,334 units at $0.12 per unit for a total offering price of $25,000. Each unit consisted of one share of the common stock of the Company and one Class A Warrant exercisable for one share of common stock at an exercise price of $0.18 for a period of four years commencing on August 12, 2012 and expiring on August 12, 2016.
The Company classified the entire proceeds of $325,716 from private placements closed in 2011 as a derivative liability related to the warrants.
Earnings per share
Basic income per common share is computed by dividing income available to the Company’s common stockholders by the weighted average number of common shares outstanding during the period. Diluted income per common stock is computed similarly to basic income per common stock except that weighted average common stock is increased to include the potential issuance of dilutive common stock.
| | | 2011 | | | 2010 | |
| Net income (loss) for the year | | $ | 1,629,255 | | | $ | 3,502,038 | |
| | | | | | | | | |
| Weighted average common stock basic | | | 68,847,251 | | | | 66,437,025 | |
| Effect of options | | | 8,128 | | | | 72,984 | |
| Effect of warrants | | | 330,072 | | | | 6,713,909 | |
| Diluted | | | 69,185,451 | | | | 73,223,918 | |
9. STOCK OPTION PLANS
During 2001, the Company adopted its 2002 Stock Option Plan (“the 2002 Plan”). The 2002 Plan provides for the granting of up to an additional 7,000,000 stock options to key employees, directors and consultants, of common shares of the Company. Under the 2002 Plan, the granting of incentive and non-qualified stock options, exercise prices and terms are determined by the Company's Option Committee, a committee designated to administer the 2002 Plan by the Board of Directors. For incentive options, the exercise price shall not be less than the fair market value of the Company's common stock on the grant date. (In the case of options granted to an employee who owns stock possessing more than 10% of the voting power of all classes of the Company's stock on the date of grant, the option price must not be less than 110% of the fair market value of common stock on the grant date.) Options granted are not to exceed terms beyond ten years (five years in the case of an incentive stock option granted to a holder of 10 percent of the Company's common stock)
Activity under the 2002 Plan is summarized as follows:
9. STOCK OPTION PLANS- continued
| | Available for Grant | Options Outstanding | Weighted Average Exercise Price |
| | | | |
| Balance December, 31, 2008 | 200,000 | 1,150,000 | 0.11 |
| Cancelled | 336,000 | (336,000) | 0.11 |
| Balance, December 31, 2009 | 536,000 | 814,000 | 0.11 |
| Cancelled | 680,000 | (680,000) | 0.11 |
| Balance, December 31, 2010 | 1,216,000 | 134,000 | 0.11 |
| Cancelled | 134,000 | (134,000) | 0.11 |
| Balance, December 31, 2011 | 1,350,000 | - | - |
At the Annual General and Special Meeting of Shareholders held in June 2006 the stockholders approved and the Company adopted its 2006 Stock Option Plan (“the 2006 Plan”). The 2006 Plan provides for the granting of up to an additional 8,000,000 stock options to key employees, directors and consultants, of common shares of the Company. Under the 2006 Plan, the granting of incentive and non-qualified stock options, exercise prices and terms are determined by the Company's Option Committee, a committee designated to administer the 2006 Plan by the Board of Directors. For incentive options, the exercise price shall not be less than the fair market value of the Company's common stock on the grant date. (In the case of options granted to an employee who owns stock possessing more than 10% of the voting power of all classes of the Company's stock on the date of grant, the option price must not be less than 110% of the fair market value of common stock on the grant date.) Options granted are not to exceed terms beyond ten years (five years in the case of an incentive stock option granted to a holder of 10 percent of the Company's common stock).
Activity under the 2006 Plan is summarized as follows:
| | Available for Grant | Options Outstanding | Weighted Average Exercise Price |
| Balance, December 31, 2008 | 5,400,000 | 1,300,000 | 0.98 |
| Cancelled | 600,000 | (600,000) | 0.82 |
| Balance, December 31, 2009 | 6,000,000 | 700,000 | 1.11 |
| Cancelled | 200,000 | (200,000) | 2.29 |
| Granted | (100,000) | 100,000 | 0.33 |
| Balance, December 31, 2010 | 6,100,000 | 600,000 | 1.14 |
| Granted | - | - | - |
| Cancelled | - | - | - |
| Balance, December 31, 2011 | 6,100,000 | 600,000 | $1.14 |
| | | | |
Balance exercisable, December 31, 2011 | | 550,000 | $1.20 |
The following table summarizes information concerning outstanding and exercisable common stock options under the 2006 and 2002 Plans at December 31, 2011:
9. STOCK OPTION PLANS- continued
Range of Exercise Prices | Number of Options Outstanding | Remaining Contractual Life (in Years) | Weighted Average Exercise Price | Number of Options Currently Exercisable | Weighted Average Exercise Price |
| $0.13 | 25,000 | 9.92 | $0.13 | 25,000 | $0.13 |
| $0.20 | 25,000 | 9.92 | $0.20 | 25,000 | $0.20 |
| $0.40 | 25,000 | 9.92 | $0.40 | - | $- |
| $0.60 | 25,000 | 9.92 | $0.60 | - | $- |
| $0.61 | 200,000 | 6.25 | $0.61 | 200,000 | $0.61 |
| $0.74 | 100,000 | 7.58 | $0.74 | 100,000 | $0.74 |
| $2.29 | 200,000 | 5.58 | $2.29 | 200,000 | $2.29 |
| | 600,000 | | | 550,000 | |
The aggregate intrinsic value of stock options outstanding at December 31, 2011 was $ Nil (2010 - $19,330, 2009 - $448,500) while the aggregate intrinsic value of stock options exercisable at December 31, 2011 was $Nil (2010 - $18,580, 2009 - $448,500). No stock options were exercised in 2011, 2010, or 2009.
During the years ended December 31, 2010 and 2009, 200,000 and 680,000 options were cancelled unexercised. Upon cancellation, the fair value of these liability instruments of $117,985 and 208,144 was re-classified from liability to additional paid-in capital. See Note 4.
The following table summarizes information concerning unvested common stock options under the 2006 and 2002 Plans at December 31, 2011:
| | Number of Options | Weighted Average Exercise Price | Weighted Average Grant Date Fair Value |
| | | | |
| Unvested at December 31, 2008 | 1,100,000 | $ 0.74 | $ 0.68 |
| Vested | (230,000) | 0.63 | 0.55 |
| Cancelled | (600,000) | (0.82) | (0.22) |
| | | | |
| Unvested at December 31, 2009 | 270,000 | 0.73 | 0.60 |
| Granted | 100,000 | 0.33 | 0.21 |
| Vested | (55,000) | (0.46) | (0.47) |
| Cancelled | (200,000) | (0.61) | (0.57) |
| | | | |
| Unvested at December 31, 2010 | 115,000 | 0.52 | 0.37 |
| Vested | 65,000 | 0.51 | 0.37 |
| Cancelled | | | |
| Unvested at December 31, 2011 | 50,000 | $ 0.13 | $ 0.37 |
9. STOCK OPTION PLANS - continued
As of December 31, 2011, there was $5,605 (2010 – $16,385, 2009 - $20,319) of total unrecognized compensation cost related to all unvested options granted and outstanding. This unrecognized compensation cost is expected to be recognized over a weighted average period of approximately 2 years (2009 – 3 years, 2008 – 4 years)
During the year ended December 31, 2011, the Company recorded consulting fees of $3,000 (2010 – $4,775 2009 – $94,164) in the statement of operations related to stock options granted to non-employees that vested during the year.
10. WARRANTS
| (a) Issued | | Warrants | | | Weighted Average Exercise Price | |
Balance, December 31, 2008 | | | 18,849,600 | | | $ | 0.29 | |
| Warrants exercised | | | (3,250,000 | ) | | | 0.13 | |
Balance, December 31, 2009 | | | 15,599,600 | | | | 0.32 | |
| Warrants exercised | | | (1,733,335 | ) | | | 0.13 | |
Balance, December 31, 2010 | | | 13,866,265 | | | | 0.35 | |
| Warrants issued | | | 2,547,620 | | | | 0.19 | |
| Balance, December 31, 2011 | | | 16,413,885 | | | $ | 0.33 | |
The following table lists the common share warrants outstanding at December 31, 2011. Each warrant is exchangeable for one common share.
| Number Outstanding | Number Vested | Exercise Price | Expiry |
| 1,634,310 | 1,634,310 | $0.11 | December 23, 2012 |
| 5,761,955 | 5,761,955 | $0.19 | December 23, 2012 |
| 450,000 | 450,000 | $0.125 | February 14, 2014 |
| 3,900,000 | 3,900,000 | $0.20 | February 14, 2014 |
| 560,000 | 560,000 | $0.44 | November 15, 2012 |
| 560,000 | 560,000 | $0.50 | November 15, 2012 |
| 500,000 | 500,000 | $2.125 | June 13, 2013 |
| 500,000 | 500,000 | $2.25 | June 13, 2013 |
| 1,000,000 | - | $0.15 | January 6, 2016 |
| 625,000 | - | $0.24 | March 16, 2016 |
| 714,286 | - | $0.21 | May 17, 2016 |
| 208,334 | - | $0.18 | August 12, 2016 |
| 16,413,885 | 13,866,265 | $0.325 | |
11. INCOME TAXES
The tax effects of temporary differences that give rise to the Company’s deferred tax assets are as follows:
| | | 2011 | | | 2010 | |
| Deferred tax assets (liabilities) | | | | | | |
| Net operating loss carry-forwards | | $ | 962,000 | | | $ | 911,000 | |
| Capital losses | | | 5,000 | | | | 5,000 | |
| Office equipment | | | 12,500 | | | | 11,000 | |
| Oil and gas properties | | | 281,000 | | | | 281,000 | |
| Asset retirement obligation | | | 34,000 | | | | 30,000 | |
| | | | 1,294,500 | | | | 1,238,000 | |
| Valuation allowance | | | (1,294,500 | ) | | | (1,238,000 | ) |
Net deferred tax asset | | $ | - | | | $ | - | |
11. INCOME TAXES – continued
Upon continuation to Canada in 2004, all losses carried forward at that time expired. As of December 31, 2011, the Company had available to offset future taxable income, net Canadian operating loss carry-forwards of approximately $3.6 million. The carry-forwards will begin expiring in 2014 unless utilized in earlier years. The Company also has approximately $8.8 million in Canadian oil and gas dedication pools that can be used to offset income of future periods.
The Company evaluates its valuation allowance requirements based on projected future operations. When circumstances change and this causes a change in management's judgment about the recoverability of deferred tax assets, the impact of the change on the valuation allowance is reflected in current income. During the years ended December 31, 2011, 2010 and 2009, changes in valuation allowance was $52,500, $357,000 and $154,000, respectively.
The (benefit) provision for income taxes differs from the amount of income tax determined by applying the applicable Canadian statutory federal income tax rate to pre-tax loss as a result of the following differences:
| | 2011 | 2010 | 2009 |
| Statutory federal income tax rate | (27%) | (29%) | (30%) |
| Change in valuation allowance | (5%) | (10%) | 20% |
| Non-deductible stock-based compensation | 2% | 1% | 4% |
| Non-deductible change in fair value of derivative Liability | 30% | 36% | 17% |
| Effect of foreign exchange | 2% | 3% | (16%) |
| Effect of reduction in income tax rate | (2%) | (1%) | 5% |
| | -% | -% | -% |
The Company has evaluated its tax positions for the years ended December 31, 2011, 2010 and 2009 and determined that it has no uncertain tax positions requiring financial statement recognition.
Under ASC 740-10-25, the impact of an uncertain income tax position on income tax expense must be recognized at the largest amount that is more-likely-than-not to be sustained. An uncertain income tax position will not be recognized if it has 50% or less likelihood of being sustained.
We accrue interest and penalties on our uncertain tax positions as a component of our provision for income taxes. There was no amount of interest and penalties accrued during 2011 or 2010.
Our income tax returns are generally considered closed to examination when we file a notice of determination with the taxing authority. No such notice has been filed to date.
12. COMMITMENTS AND CONTINGENCIES
Environmental Matters
The Company is engaged in oil and gas exploration and may become subject to certain liabilities as they relate to environmental cleanup of sites or other environmental restoration procedures as they relate to the exploration of oil and gas. Should it be determined that a liability exists with respect to any environmental clean up or restoration, the liability to cure such a violation could fall upon the Company. No claim has been made, nor is the Company aware of any liability, which it may have, as it relates to any environmental clean-up, restoration or the violation of any rules or regulations relating thereto. Liabilities for expenditures are recorded when environmental assessment and/or remediation is probable and the costs can be reasonably estimated.
12. COMMITMENTS AND CONTINGENCIES continued
Leased Office Premises
During the year ended December 31, 2010, the Company entered into a sub-lease arrangement with a third party and agreed to pay approximately $33,000 in basic and additional rent through November 30, 2011. Subsequent to the end of the sub-lease arrangement the Company continued to pay rent on a month to month basis. The lease agreement ended December 31, 2011.
Legal Contingencies
On November 17, 2010, we received a statement of claim filed in the Court of the Queen’s Bench of Alberta against the Company. The plaintiff alleges that the Company is indebted to the Plaintiff in the sum of $34,190 (CDN $34,898) for goods and services rendered by the Plaintiff. The Company believes this claim is without merit and intends to vigorously defend it.
13. SUBSEQUENT EVENTS
Pratt Barndollar resigned as a Director of the Company on March 22, 2012 and Mr. Barndollar’s service contract simultaneously terminated with such resignation. The Board of Directors of the Company has agreed that Mr. Barndollar will retain the right to exercise his 100,000 stock options until their expiration date.
Item 19. Exhibits
| Exhibit No. | Description |
| 1.1 | Articles of Continuance(1) |
| 1.2 | Bylaws(1) |
| 2.1 | Description of Capital Stock (contained in the Articles of Continuance filed as Exhibit 1.1) |
| 2.2 | Form of Class A warrant issued in February 2005 (2) |
| 2.3 | Form of Class B warrant issued in February 2005 (2) |
| 2.4 | Form of Class A warrant issued in November 2005 (2) |
| 2.5 | Form of Class B warrant issued in November 2005 (2) |
| 2.6 | Form of Class A warrant issued in June 2006 (6) |
| 2.7 | Form of Class B warrant issued in June 2006 (6) |
| 12.1* | Section 302 Certification of Principal Executive Officer |
| 12.2* | Section 302 Certification of Principal Financial Officer |
| 13.1* | Section 906 Certification of Principal Executive Officer |
| 13.2* | Section 906 Certification of Principal Financial Officer |
| 14.1 | BDO Consent |
| 15.1 | 2002 Stock Option Plan (4) |
| 15.2 | 2006 Stock Option Plan (5) |
* Filed herewith.
(1) Previously filed with the Company’s Registration Statement on Form S-4 on April 22, 2003
(2) Previously filed with the Company’s 2005 Form 20-F filed on June 1, 2006
(3) Filed with the Company’s Form S-8 Registration Statement on January 29, 2001
(4) Filed with the Company’s Form S-8 Registration Statement on February 12, 2002
(5) Filed with the Company’s Form S-8 Registration Statement on June 1, 2006
(6) Previously filed with the Company’s Form 6-K filed on June 23, 2006
(7) Previously filed with the Company’s Form 6-K filed on March 28, 2012.
SIGNATURES
The Registrant hereby certifies that it meets all of the requirements for filing on Form 20-F and that it has duly caused and authorized the undersigned to sign this Annual Report on its behalf.
| | STRATA OIL & GAS INC. |
| | (Registrant) |
| | |
| Dated: May 14, 2012 | By: /s/ Ron Daems |
| | Ron Daems |
| | President, Chief Executive Officer, |
| | Secretary and Director |
78