UNITED STATES
SECURITIES AND EXCHANGE COMMISSION
Washington, D.C. 20549
FORM 8-K
CURRENT REPORT
Pursuant to Section 13 or 15(d) of The Securities Exchange Act of 1934
Date of Report (Date of earliest event reported): July 19, 2021
EQUITY BANCSHARES, INC.
(Exact name of registrant as specified in its charter)
Kansas | 001-37624 | 72-1532188 |
(State or other jurisdiction of incorporation or organization) | (Commission File Number) | (I.R.S. Employer Identification No.) |
|
|
|
7701 East Kellogg Drive, Suite 300 Wichita, KS |
|
67207 |
(Address of principal executive offices) |
| (Zip Code) |
Registrant’s telephone number, including area code: 316.612.6000
Former name or former address, if changed since last report: Not Applicable
Check the appropriate box below if the Form 8-K filing is intended to simultaneously satisfy the filing obligation of the registrant under any of the following provisions:
☒ | Written communications pursuant to Rule 425 under the Securities Act (17 CFR 230.425) |
☐ | Soliciting material pursuant to Rule 14a-12 under the Exchange Act (17 CFR 240.14a-12) |
☐ | Pre-commencement communications pursuant to Rule 14d-2(b) under the Exchange Act (17 CFR 240.14d-2(b)) |
Pre-commencement communications pursuant to Rule 13e-4(c) under the Exchange Act (17 CFR 240.13e-4(c)) |
Securities registered pursuant to Section 12(b) of the Act:
Title of each class Class A, Common Stock, par value $0.01 per share | Trading Symbol EQBK | Name of each exchange on which registered The Nasdaq Stock Market LLC |
Indicate by check mark whether the registrant is an emerging growth company as defined in Rule 405 of the Securities Act of 1933 (§230.405 of this chapter) or Rule 12b-2 of the Securities Exchange Act of 1934 (§240.12b-2 of this chapter).
☐ Emerging growth company
☐ If an emerging growth company, indicate by check mark if the registrant has elected not to use the extended transition period for complying with any new or revised financial accounting standards provided pursuant to Section 13(a) of the Exchange Act.
Item 2.02Results of Operations and Financial Condition.
On July 19, 2021, Equity Bancshares, Inc. (the “Company”) issued a press release announcing its financial results for the second quarter ended June 30, 2021. A copy of the press release is furnished as Exhibit 99.1 and is incorporated by reference herein.
The information in this Item 2.02, including Exhibit 99.1, is being furnished pursuant to Item 2.02 of Form 8-K and shall not be deemed “filed” for purposes of Section 18 of the Securities Exchange Act of 1934, as amended (the “Exchange Act”), or otherwise subject to liabilities of that section, nor shall it be deemed incorporated by reference into any filing under the Securities Act of 1933, as amended (the “Securities Act”), or the Exchange Act, unless specifically identified therein as being incorporated therein by reference.
Item 7.01Regulation FD Disclosure.
Branch Purchase and Assumption
On July 19, 2021, Equity Bancshares, Inc. (the ”Company”) announced that Equity Bank (“Equity Bank”), a wholly owned subsidiary of the Company, signed a definitive branch purchase and assumption agreement to acquire the assets and assume the deposits of three bank locations from Security Bank of Kansas City (“Security”), a subsidiary of Valley View Financial Co. (“Valley”) of Overland Park, Kansas. The Company anticipates closing the transaction in the fourth quarter of 2021.
Quarterly Investor Call
The Company intends to hold an investor call and webcast to discuss its financial results for the second quarter ended June 30, 2021 on Tuesday, July 20, 2021, at 9:00 a.m. Central Time. The Company’s presentation to analysts and investors contains additional information about the Company’s financial results for the second quarter ended June 30, 2021 and is furnished as Exhibit 99.2 and is incorporated by reference herein.
The information in this Item 7.01, including Exhibit 99.2, is being furnished pursuant to Item 7.01 of Form 8-K and shall not be deemed “filed” for purposes of Section 18 of the Exchange Act, or otherwise subject to liabilities of that section, nor shall it be deemed incorporated by reference into any filing under the Securities Act or the Exchange Act, unless specifically identified therein as being incorporated therein by reference.
Item 8.01Other Events.
The only information contained in this Form 8-K being filed for the purposes of Rule 425 of the Securities Act is the information relating solely to the previously announced proposed merger between the Company and American State Bancshares, Inc. contained in the press release furnished herewith as Exhibit 99.1.
Item 9.01Financial Statements and Exhibits.
(d) Exhibits
Exhibit No. |
| Description |
99.1 |
| Earnings Press Release, dated July 19, 2021 |
99.2 |
| Equity Bancshares, Inc. Investor Presentation |
104 |
| Cover Page Interactive Data File |
SIGNATURES
Pursuant to the requirements of the Securities Exchange Act of 1934, the registrant has duly caused this report to be signed on its behalf by the undersigned, thereunto duly authorized.
| Equity Bancshares, Inc. |
|
|
Date: July 19, 2021 | By: /s/ Eric R. Newell |
| Eric R. Newell |
| Executive Vice President and Chief Financial Officer |
Exhibit 99.1
Equity Bancshares, Inc.
PRESS RELEASE - 07/19/2021
Equity Bancshares, Inc. Second Quarter Results Include Strong Organic Loan Growth, Company to Acquire St. Joseph Bank Locations, Expanding Missouri Network
Annualized organic non-PPP loan growth contributes to $1.03 per diluted share,
Company will acquire three Security Bank of KC branch locations in St. Joseph, Missouri
WICHITA, Kansas, July 19, 2021 (GLOBE NEWSWIRE) – Equity Bancshares, Inc. (NASDAQ: EQBK), (“Equity”, “the Company”, “we”, “us”, “our”), the Wichita-based holding company of Equity Bank, reported net income of $15.2 million and $1.03 per diluted share for the second quarter ended June 30, 2021.
“Our Equity Bank team had an excellent quarter serving our customers, expanding our delivery channels and adding shareholder value. Exclusive of the Paycheck Protection Program, we organically grew gross loans by $81.8 million, an annualized rate of 14.75%, through the focused efforts of our sales and operational teams,” said Brad S. Elliott, Chairman and CEO of Equity. “A key component of our results is growth in our core deposit customer base, with new banking products contributing to a $1.1 million increase in service fee revenue, as well as the continued addition of trust and wealth management customer relationships.”
Equity customers successfully had $99.7 million of Paycheck Protection Program (“PPP”) loans forgiven during the quarter, resulting in the recognition of fee income totaling $5.7 million in the three-month period ended June 30, 2021. At June 30, 2021, the total unrecognized fee income associated with PPP loans was $10.7 million. Through two rounds of PPP, Equity originated more than $610.0 million in PPP loans.
Further driving results this quarter was customer and relationship growth within Equity Trust and Wealth Management and Equity’s consumer deposit base, expansion of non-interest income with Equity’s debit card platform and increased transaction activity within our deposit customer base.
The Company has announced its expansion into St. Joseph, Missouri, with a definitive branch purchase and assumption agreement to acquire the assets and assume the deposits of three bank locations from Security Bank of Kansas City (“Security”), a subsidiary of Valley View Financial Co. (“Valley”) of Overland Park, Kansas. Equity anticipates closing the transaction in the fourth quarter of 2021.
“We are pleased with the opportunity to offer Equity Bank products and services to customers in Northwest Missouri, and St. Joseph is a great fit within our network,” said Mr. Elliott. “We have been able to grow loans, fee income and our core deposit base effectively in Western Missouri with a focus on local community banking and we believe this approach will serve customers well in our new St. Joseph region.”
“Our recent merger announcement with American State Bancshares, Inc. is a great cultural fit for us as well as an expansion of our Kansas market, and our teams have worked diligently alongside one another. We remain on target for a closing and conversion of data systems in early October,” said Mr. Elliott. “I thank everyone on both the Equity and American State Bancshares, Inc. teams for their collaboration and hard work to make sure we continue to deliver excellent customer service while increasing shareholder value.”
Notable Items:
| • | Quarter over quarter, service fee revenue, including deposit services, mortgage banking, trust and wealth and insurance services increased to $6.4 million from $5.3 million, or 20.77%. |
| • | The Company authorized a second stock repurchase program in the third quarter of 2020 totaling 800,000 shares. During the quarter ended June 30, 2021, the Company repurchased 73,070 shares at a weighted average cost of $28.94 per share, totaling $2.1 million. At the end of the quarter, capacity of 180,687 shares remained under the current repurchase program. |
Equity Bancshares, Inc.
PRESS RELEASE - 07/19/2021
| • | Additional information attained on the assets purchased through the Almena State Bank (“Almena”) transaction indicated a more positive outcome than originally expected, resulting in a net reduction in reserves on the balance sheet and an increase in gain on acquisition of $663 thousand during the quarter. |
| • | During the quarter ended June 30, 2021, there was a release of allowance for credit losses of $1.7 million as compared to a release of $5.8 million in the quarter ended March 31, 2021. The release in the second quarter was driven primarily by improvement in assets specifically assessed for impairment as asset quality improved quarter over quarter. |
Equity’s Balance Sheet Highlights:
| • | Total loans held for investment of $2.82 billion at June 30, 2021, as compared to total loans held for investment of $2.80 billion at March 31, 2021. The periodic change included organic loan production of $81.8 million, or 14.75%. |
| • | Total deposits of $3.69 billion at June 30, 2021, as compared to $3.63 billion at March 31, 2021. Checking, savings and money market accounts were $3.03 billion at June 30, 2021, relative to $3.05 billion at March 31, 2021. Included in the periodic change was a $20.2 million increase in non-interest-bearing deposits. As compared to December 31, 2020, the Bank has increased non-interest-bearing deposits by $200.9 million, or 25.38%. |
| • | The allowance for credit losses as of June 30, 2021, was $51.8 million, or 1.84% of total loans and 2.04% of total loans excluding PPP assets. |
Acquisition of Three Bank Locations in St. Joseph, Missouri
Equity will operate each of the three Security locations in St. Joseph as Equity Bank locations following completion of the acquisition, expected in December of 2021. Joshua J. Means, President of Western Missouri, will oversee the St. Joseph community bank locations. Equity will operate a total of 16 locations in Missouri, including the three Security locations, eight bank locations in legacy Western Missouri communities and five bank locations on the Missouri side of the Kansas City metropolitan area.
In Equity’s Western Missouri region, notable for communities like Warrensburg, Sedalia and Higginsville, deposits as of June 30, 2018, were $478.4 million, compared to $614.8 million as of June 30, 2021. Total loans in Equity’s Western Missouri region were $147.0 million as of June 30, 2018, compared to $218.3 million as of June 30, 2021, growing by 48.5% during the three-year period.
“Each of our Missouri locations delivers outstanding service to our consumer, mortgage and business customers and we expect St. Joseph to serve as a key market for us in Northwest Missouri. Josh Means and his regional leadership team have helped our local banks grow in loans, fee income and deposits, one relationship at a time,” said Mr. Elliott. “We are pleased to welcome talented community bankers to our Equity team and to offer St. Joseph-area consumers enhanced commercial and business banking solutions.”
Equity announced in May its merger with American State Bancshares, Inc. (“ASBI”), the holding company of American State Bank, a $779 million bank with headquarters in Wichita, Kansas, and 17 locations in its Kansas footprint. Equity expects to complete the merger with ASBI in October 2021. Pro forma Equity Bank, including ASBI and Security deposits and locations, will comprise more than 70 locations throughout our four-state footprint and hold more than $5 billion in assets.
Pursuant to the terms of the Branch Purchase and Assumption Agreement, between Equity Bank and Security, Equity will acquire certain loans and other branch-related assets and assume certain deposits and other liabilities associated with the Security branches.
Equity Bancshares, Inc.
PRESS RELEASE - 07/19/2021
Financial Results for the Quarter Ended June 30, 2021
Net income allocable to common stockholders was $15.2 million, or $1.03 per diluted share, for the three months ended June 30, 2021, as compared to $15.1 million, or $1.02 per diluted share, for the three months ended March 31, 2021, an increase of $91 thousand. This second quarter increase was attributable to a net interest income increase of $2.9 million and a non-interest income increase of $2.4 million, partially offset by a $4.1 million decrease in reversal of provision for credit losses, a $925 thousand increase in non-interest expense and a $144 thousand increase in provision for income taxes.
Net Interest Income
Net interest income was $34.6 million for the three months ended June 30, 2021, as compared to $31.8 million for the three months ended March 31, 2021, an increase of $2.9 million, or 9.0%. The increase in net interest income was primarily driven by a 15-basis point increase in the average yield earned on interest-earning assets, to 3.88% for the quarter ended June 30, 2021, from 3.73% for the quarter ended March 31, 2021. In addition, there was a 6-basis point decrease in average rate paid on interest-bearing liabilities, to 0.52% for the quarter ended June 30, 2021, from 0.58% for the quarter ended March 31, 2021. The cost of interest-bearing deposits declined by 5 basis points to 0.31% for the three months ended June 30, 2021 from 0.36% in the previous quarter primarily attributed to the reduction in the cost of time deposits, that slipped 19 basis points between the quarters.
Provision for Credit Losses
During the three months ended June 30, 2021, there was a net release of $1.7 million in the allowance for credit losses recognized through the provision for credit losses as compared to a net release of $5.8 million provision for credit losses for the three months ended March 31, 2021. For the three months ended June 30, 2021, we had net charge-offs of $567 thousand as compared to $65 thousand for the three months ended March 31, 2021. The release in the second quarter was driven primarily by improvement in assets individually evaluated for impairment as asset quality improved quarter over quarter.
Non-Interest Income
Total non-interest income was $9.1 million for the three months ended June 30, 2021, as compared to $6.7 million for the three months ended March 31, 2021, or $8.4 million excluding the $663 thousand net gain on the purchase and assumption of Almena State Bank. Other non-interest income was $2.1 million, an increase of $774 thousand, or 60.0%, from the quarter ended March 31, 2021. The increase in other non-interest income was primarily due to income of $917 thousand related to the reversal of potential repurchase obligation on acquired assets as Equity was able to improve our position on those assets during the quarter.
During the quarter, service fee revenue, including deposit services, mortgage banking, trust and wealth management, credit cards and insurance increased to $6.4 million from $5.3 million during the first quarter. The growth was driven by increasing balances, transaction activity and relationship development within our trust and wealth management business line.
Non-Interest Expense
Total non-interest expense for the quarter ended June 30, 2021, was $25.8 million as compared to $24.9 million for the quarter ended March 31, 2021. The $925 thousand change is primarily attributed to an increase of $811 thousand in data processing expense, as deposit accounts and activity have increased so too has the associated expense. The periodic increase also included $308 thousand in merger expense.
Asset Quality
As of June 30, 2021, Equity’s allowance for credit losses to total loans was 1.84%, as compared to 1.99% at March 31, 2021. Exclusive of PPP assets, the reserve to total loans was 2.04% as of June 30, 2021 as compared to 2.33% at March
Equity Bancshares, Inc.
PRESS RELEASE - 07/19/2021
31, 2021. Nonperforming assets were $66.7 million as of June 30, 2021, or 1.56% of total assets, compared to $70.1 million at March 31, 2021, or 1.67% of total assets. Total classified assets, including loans rated special mention or worse, other real estate owned and other repossessed assets were $103.1 million, or 23.11% of regulatory capital, down from $112.6 million, or 26.45% of regulatory capital as of March 31, 2021.
Regulatory Capital
The Company’s ratio of common equity tier 1 capital to risk-weighted assets was 12.4%, the total capital to risk-weighted assets was 16.7% and the total leverage ratio was 8.9% at June 30, 2021. At December 31, 2020, the Company’s common equity tier 1 capital to risk-weighted assets ratio was 12.8%, the total capital to risk-weighted assets ratio was 17.4% and the total leverage ratio was 9.3%. The Company’s subsidiary, Equity Bank, had a ratio of common equity tier 1 capital to risk-weighted assets of 14.4%, a ratio of total capital to risk-weighted assets of 15.6% and a total leverage ratio of 9.9% at June 30, 2021. At December 31, 2020, Equity Bank’s ratio of common equity tier 1 capital to risk-weighted assets was 14.5%, the ratio of total capital to risk-weighted assets was 15.7% and the total leverage ratio was 10.1%.
Non-GAAP Financial Measures
In addition to evaluating the Company’s results of operations in accordance with accounting principles generally accepted in the United States of America (“GAAP”), management periodically supplements this evaluation with an analysis of certain non-GAAP financial measures that are intended to provide the reader with additional perspectives on operating results, financial condition and performance trends, while facilitating comparisons with the performance of other financial institutions. Non-GAAP financial measures are not a substitute for GAAP measures, rather, they should be read and used in conjunction with the Company’s GAAP financial information.
The efficiency ratio is used as a common measure by banks as a comparable metric to understand the Company’s expense structure relative to its total revenue; in other words, for every dollar of total revenue recognized, how much of that dollar is expended. To improve the comparability of the ratio to our peers, non-core items are excluded. To improve transparency and acknowledging that banks are not consistent in their definition of the efficiency ratio, we include our calculation of this non-GAAP measure.
Return on average assets before income tax provision, provision for loan losses and goodwill impairment is a measure that the Company uses to understand fundamental operating performance before these expenses. Used as a ratio relative to average assets, we believe it demonstrates the “core” performance and can be viewed as an alternative measure of how efficiently the Company services its asset base. Used as a ratio relative to average equity, it can function as an alternative measure of the Company’s earnings performance in relationship to its equity.
Tangible common equity and related measures are non-GAAP financial measures that exclude the impact of intangible assets, net of deferred taxes, and their related amortization. These financial measures are useful for evaluating the performance of a business consistently, whether acquired or developed internally. Return on average tangible common equity is used by management and readers of our financial statements to understand how efficiently the Company is deploying its common equity. Companies that are able to demonstrate more efficient use of common equity are more likely to be viewed favorably by current and prospective investors.
The Company believes that disclosing these non-GAAP financial measures is both useful internally and is expected by our investors and analysts in order to understand the overall performance of the Company. Other companies may calculate and define their non-GAAP financial measures and supplemental data differently. A reconciliation of GAAP financial measures to non-GAAP measures and other performance ratios, as adjusted, are included in Table 8 in the following press release tables.
Conference Call and Webcast
Equity Chairman and Chief Executive Officer, Brad Elliott, and Executive Vice President and Chief Financial Officer, Eric Newell, will hold a conference call and webcast to discuss the 2021 second quarter results on Tuesday, July 20, 2021, at 10:00 a.m. eastern time, 9:00 a.m. central time.
Equity Bancshares, Inc.
PRESS RELEASE - 07/19/2021
Investors, news media and other participants should register for the call or audio webcast at investor.equitybank.com. On Tuesday, July 20, 2021, participants may also dial into the call toll-free at (844) 534-7311 from anywhere in the U.S. or (574) 990-1419 internationally, using conference ID no. 9999830.
Participants are encouraged to dial into the call or access the webcast approximately 10 minutes prior to the start time. Presentation slides to pair with the call or webcast will be posted one hour prior to the call at investor.equitybank.com.
A replay of the call and webcast will be available two hours following the close of the call until July 27, 2021, accessible at (855) 859-2056 with conference ID no. 9999830 at investor.equitybank.com.
About Equity Bancshares, Inc.
Equity Bancshares, Inc. is the holding company for Equity Bank, offering a full range of financial solutions, including commercial loans, consumer banking, mortgage loans, trust and wealth management services and treasury management services, while delivering the high-quality, relationship-based customer service of a community bank. Equity’s common stock is traded on the NASDAQ Global Select Market under the symbol “EQBK.” Learn more at www.equitybank.com.
Important Additional Information
The information contained herein does not constitute an offer to sell or a solicitation of an offer to buy any securities or a solicitation of any vote or approval.
In connection with the proposed transaction, Equity filed with the Securities and Exchange Commission (“SEC”) a registration statement on Form S-4 to register the shares of Equity common stock to be issued to ASBI stockholders. The registration statement included a proxy statement/prospectus, which will be sent to the stockholders of ASBI seeking their approval of the proposed transaction.
WE URGE INVESTORS AND SECURITY HOLDERS TO READ THE REGISTRATION STATEMENT ON FORM S-4, THE PROXY STATEMENT/PROSPECTUS INCLUDED WITHIN THE REGISTRATION STATEMENT ON FORM S-4 AND ANY OTHER RELEVANT DOCUMENTS TO BE FILED WITH THE SEC IN CONNECTION WITH THE PROPOSED TRANSACTION BECAUSE THEY CONTAIN IMPORTANT INFORMATION ABOUT EQUITY, ASB AND THE PROPOSED TRANSACTION.
The documents filed by Equity with the SEC may be obtained free of charge at Equity’s investor relations website at investor.equitybank.com or at the SEC’s website at www.sec.gov. Alternatively, these documents, when available, can be obtained free of charge from Equity upon written request to Equity Bancshares, Inc., Attn: Investor Relations, 7701 East Kellogg Drive, Suite 300, Wichita, Kansas 67207 or by calling (316) 612-6000.
Participants in the Transaction
Equity, ASBI and certain of their respective directors and executive officers may be deemed to be participants in the solicitation of proxies from ASBI’s stockholders in connection with the proposed transaction under the rules of the SEC. Information about the directors and executive officers of Equity is set forth in the proxy statement for Equity’s 2021 annual meeting of stockholders filed with the SEC on Schedule 14A on March 18, 2021, and Equity’s annual report on Form 10-K for the year ended December 31, 2020 filed with the SEC on March 9, 2021. Free copies of these documents may be obtained free of charge as described in the preceding paragraph. Additional information regarding the interests of these participants and other persons who may be deemed participants in the transaction may be obtained by reading the proxy statement/prospectus regarding the proposed transaction when it becomes available.
No Offer or Solicitation
This press release shall not constitute an offer to sell, a solicitation of an offer to sell, or the solicitation or an offer to buy any securities. There will be no sale of securities in any jurisdiction in which such an offer, solicitation or sale would be
Equity Bancshares, Inc.
PRESS RELEASE - 07/19/2021
unlawful prior to registration or qualification under the securities laws of any such jurisdiction. No offer of securities shall be made except by means of a prospectus meeting the requirement of Section 10 of the Securities Act of 1933, as amended.
Special Note Concerning Forward-Looking Statements
This press release contains “forward-looking statements” within the meaning of Section 27A of the Securities Act of 1933, as amended, and Section 21E of the Securities Exchange Act of 1934, as amended. These forward-looking statements reflect the current views of Equity’s management with respect to, among other things, future events and Equity’s financial performance. These statements are often, but not always, made through the use of words or phrases such as “may,” “should,” “could,” “predict,” “potential,” “believe,” “will likely result,” “expect,” “continue,” “will,” “anticipate,” “seek,” “estimate,” “intend,” “plan,” “project,” “forecast,” “goal,” “target,” “would” and “outlook,” or the negative variations of those words or other comparable words of a future or forward-looking nature. These forward-looking statements are not historical facts, and are based on current expectations, estimates and projections about Equity’s industry, management’s beliefs and certain assumptions made by management, many of which, by their nature, are inherently uncertain and beyond Equity’s control. Accordingly, Equity cautions you that any such forward-looking statements are not guarantees of future performance and are subject to risks, assumptions and uncertainties that are difficult to predict. Although Equity believes that the expectations reflected in these forward-looking statements are reasonable as of the date made, actual results may prove to be materially different from the results expressed or implied by the forward-looking statements. Factors that could cause actual results to differ materially from Equity’s expectations include COVID-19 related impacts; competition from other financial institutions and bank holding companies; the effects of and changes in trade, monetary and fiscal policies and laws, including interest rate policies of the Federal Reserve Board; changes in the demand for loans; fluctuations in value of collateral and loan reserves; inflation, interest rate, market and monetary fluctuations; changes in consumer spending, borrowing and savings habits; and acquisitions and integration of acquired businesses; and similar variables. The foregoing list of factors is not exhaustive.
For discussion of these and other risks that may cause actual results to differ from expectations, please refer to “Cautionary Note Regarding Forward-Looking Statements” and “Risk Factors” in Equity’s Annual Report on Form 10-K filed with the Securities and Exchange Commission on March 9, 2021, and any updates to those risk factors set forth in Equity’s subsequent Quarterly Reports on Form 10-Q or Current Reports on Form 8-K. If one or more events related to these or other risks or uncertainties materialize, or if Equity’s underlying assumptions prove to be incorrect, actual results may differ materially from what Equity anticipates. Accordingly, you should not place undue reliance on any such forward-looking statements. Any forward-looking statement speaks only as of the date on which it is made, and Equity does not undertake any obligation to publicly update or review any forward-looking statement, whether as a result of new information, future developments or otherwise. New risks and uncertainties arise from time to time, such as COVID-19, and it is not possible for us to predict those events or how they may affect us. In addition, Equity cannot assess the impact of each factor on Equity’s business or the extent to which any factor, or combination of factors, may cause actual results to differ materially from those contained in any forward-looking statements. All forward-looking statements, expressed or implied, included in this press release are expressly qualified in their entirety by this cautionary statement. This cautionary statement should also be considered in connection with any subsequent written or oral forward-looking statements that Equity or persons acting on Equity’s behalf may issue.
Investor Contact:
Chris Navratil
SVP, Finance
Equity Bancshares, Inc.
(316) 612-6014
cnavratil@equitybank.com
Equity Bancshares, Inc.
PRESS RELEASE - 07/19/2021
Media Contact:
John J. Hanley
SVP, Senior Director of Marketing
Equity Bancshares, Inc.
(816) 505-4063
jhanley@equitybank.com
Unaudited Financial Tables
| • | Table 1. Consolidated Statements of Income |
| • | Table 2. Quarterly Consolidated Statements of Income |
| • | Table 3. Consolidated Balance Sheets |
| • | Table 4. Selected Financial Highlights |
| • | Table 5. Year-To-Date Net Interest Income Analysis |
| • | Table 6. Quarter-To-Date Net Interest Income Analysis |
| • | Table 7. Quarter-Over-Quarter Net Interest Income Analysis |
| • | Table 8. Non-GAAP Financial Measures |
Equity Bancshares, Inc.
PRESS RELEASE - 07/19/2021
TABLE 1. CONSOLIDATED STATEMENTS OF INCOME (Unaudited)
(Dollars in thousands, except per share data)
|
| Three months ended June 30, |
|
| Six months ended June 30, |
| ||||||||||
|
| 2021 |
|
| 2020 |
|
| 2021 |
|
| 2020 |
| ||||
Interest and dividend income |
|
|
|
|
|
|
|
|
|
|
|
|
|
|
|
|
Loans, including fees |
| $ | 33,810 |
|
| $ | 32,627 |
|
| $ | 64,811 |
|
| $ | 67,003 |
|
Securities, taxable |
|
| 3,523 |
|
|
| 4,017 |
|
|
| 7,322 |
|
|
| 8,637 |
|
Securities, nontaxable |
|
| 717 |
|
|
| 880 |
|
|
| 1,441 |
|
|
| 1,846 |
|
Federal funds sold and other |
|
| 268 |
|
|
| 409 |
|
|
| 556 |
|
|
| 1,004 |
|
Total interest and dividend income |
|
| 38,318 |
|
|
| 37,933 |
|
|
| 74,130 |
|
|
| 78,490 |
|
Interest expense |
|
|
|
|
|
|
|
|
|
|
|
|
|
|
|
|
Deposits |
|
| 2,025 |
|
|
| 3,899 |
|
|
| 4,435 |
|
|
| 10,763 |
|
Federal funds purchased and retail repurchase agreements |
|
| 26 |
|
|
| 24 |
|
|
| 48 |
|
|
| 55 |
|
Federal Home Loan Bank advances |
|
| 80 |
|
|
| 552 |
|
|
| 145 |
|
|
| 1,727 |
|
Federal Reserve Bank discount window |
|
| — |
|
|
| 6 |
|
|
| — |
|
|
| 6 |
|
Bank stock loan |
|
| — |
|
|
| 306 |
|
|
| — |
|
|
| 415 |
|
Subordinated debt |
|
| 1,557 |
|
|
| 255 |
|
|
| 3,113 |
|
|
| 538 |
|
Total interest expense |
|
| 3,688 |
|
|
| 5,042 |
|
|
| 7,741 |
|
|
| 13,504 |
|
|
|
|
|
|
|
|
|
|
|
|
|
|
|
|
|
|
Net interest income |
|
| 34,630 |
|
|
| 32,891 |
|
|
| 66,389 |
|
|
| 64,986 |
|
Provision (reversal) for credit losses |
|
| (1,657 | ) |
|
| 12,500 |
|
|
| (7,413 | ) |
|
| 22,440 |
|
Net interest income after provision (reversal) for credit losses |
|
| 36,287 |
|
|
| 20,391 |
|
|
| 73,802 |
|
|
| 42,546 |
|
Non-interest income |
|
|
|
|
|
|
|
|
|
|
|
|
|
|
|
|
Service charges and fees |
|
| 2,169 |
|
|
| 1,365 |
|
|
| 3,765 |
|
|
| 3,391 |
|
Debit card income |
|
| 2,679 |
|
|
| 2,201 |
|
|
| 5,029 |
|
|
| 4,244 |
|
Mortgage banking |
|
| 848 |
|
|
| 831 |
|
|
| 1,783 |
|
|
| 1,421 |
|
Increase in value of bank-owned life insurance |
|
| 676 |
|
|
| 481 |
|
|
| 1,277 |
|
|
| 963 |
|
Net gain on acquisition |
|
| 663 |
|
|
| — |
|
|
| 585 |
|
|
| — |
|
Net gains (losses) from securities transactions |
|
| — |
|
|
| 4 |
|
|
| 17 |
|
|
| 12 |
|
Other |
|
| 2,065 |
|
|
| 850 |
|
|
| 3,356 |
|
|
| 1,007 |
|
Total non-interest income |
|
| 9,100 |
|
|
| 5,732 |
|
|
| 15,812 |
|
|
| 11,038 |
|
Non-interest expense |
|
|
|
|
|
|
|
|
|
|
|
|
|
|
|
|
Salaries and employee benefits |
|
| 12,769 |
|
|
| 12,695 |
|
|
| 25,491 |
|
|
| 26,199 |
|
Net occupancy and equipment |
|
| 2,327 |
|
|
| 2,119 |
|
|
| 4,695 |
|
|
| 4,354 |
|
Data processing |
|
| 3,474 |
|
|
| 2,763 |
|
|
| 6,137 |
|
|
| 5,426 |
|
Professional fees |
|
| 999 |
|
|
| 943 |
|
|
| 2,072 |
|
|
| 2,310 |
|
Advertising and business development |
|
| 799 |
|
|
| 403 |
|
|
| 1,481 |
|
|
| 1,099 |
|
Telecommunications |
|
| 512 |
|
|
| 390 |
|
|
| 1,092 |
|
|
| 877 |
|
FDIC insurance |
|
| 425 |
|
|
| 414 |
|
|
| 840 |
|
|
| 931 |
|
Courier and postage |
|
| 327 |
|
|
| 353 |
|
|
| 696 |
|
|
| 737 |
|
Free nationwide ATM cost |
|
| 513 |
|
|
| 327 |
|
|
| 985 |
|
|
| 747 |
|
Amortization of core deposit intangibles |
|
| 1,030 |
|
|
| 974 |
|
|
| 2,064 |
|
|
| 1,776 |
|
Loan expense |
|
| 181 |
|
|
| 287 |
|
|
| 419 |
|
|
| 521 |
|
Other real estate owned |
|
| (468 | ) |
|
| 269 |
|
|
| (463 | ) |
|
| 577 |
|
Merger expenses |
|
| 460 |
|
|
| — |
|
|
| 612 |
|
|
| — |
|
Other |
|
| 2,458 |
|
|
| 2,000 |
|
|
| 4,566 |
|
|
| 4,141 |
|
Total non-interest expense |
|
| 25,806 |
|
|
| 23,937 |
|
|
| 50,687 |
|
|
| 49,695 |
|
Income (loss) before income tax |
|
| 19,581 |
|
|
| 2,186 |
|
|
| 38,927 |
|
|
| 3,889 |
|
Provision for income taxes |
|
| 4,415 |
|
|
| 497 |
|
|
| 8,686 |
|
|
| 942 |
|
Net income (loss) and net income (loss) allocable to common stockholders |
| $ | 15,166 |
|
| $ | 1,689 |
|
| $ | 30,241 |
|
| $ | 2,947 |
|
Basic earnings (loss) per share |
| $ | 1.06 |
|
| $ | 0.11 |
|
| $ | 2.10 |
|
| $ | 0.19 |
|
Diluted earnings (loss) per share |
| $ | 1.03 |
|
| $ | 0.11 |
|
| $ | 2.06 |
|
| $ | 0.19 |
|
Weighted average common shares |
|
| 14,356,958 |
|
|
| 15,209,483 |
|
|
| 14,410,328 |
|
|
| 15,298,590 |
|
Weighted average diluted common shares |
|
| 14,674,838 |
|
|
| 15,304,009 |
|
|
| 14,704,240 |
|
|
| 15,449,517 |
|
Equity Bancshares, Inc.
PRESS RELEASE - 07/19/2021
TABLE 2. QUARTERLY CONSOLIDATED STATEMENTS OF INCOME (Unaudited)
(Dollars in thousands, except per share data)
|
| As of and for the three months ended |
| |||||||||||||||||
|
| June 30, 2021 |
|
| March 31, 2021 |
|
| December 31, 2020 |
|
| September 30, 2020 |
|
| June 30, 2020 |
| |||||
Interest and dividend income |
|
|
|
|
|
|
|
|
|
|
|
|
|
|
|
|
|
|
|
|
Loans, including fees |
| $ | 33,810 |
|
| $ | 31,001 |
|
| $ | 35,383 |
|
| $ | 32,278 |
|
| $ | 32,627 |
|
Securities, taxable |
|
| 3,523 |
|
|
| 3,799 |
|
|
| 3,408 |
|
|
| 3,476 |
|
|
| 4,017 |
|
Securities, nontaxable |
|
| 717 |
|
|
| 724 |
|
|
| 913 |
|
|
| 923 |
|
|
| 880 |
|
Federal funds sold and other |
|
| 268 |
|
|
| 288 |
|
|
| 285 |
|
|
| 405 |
|
|
| 409 |
|
Total interest and dividend income |
|
| 38,318 |
|
|
| 35,812 |
|
|
| 39,989 |
|
|
| 37,082 |
|
|
| 37,933 |
|
Interest expense |
|
|
|
|
|
|
|
|
|
|
|
|
|
|
|
|
|
|
|
|
Deposits |
|
| 2,025 |
|
|
| 2,410 |
|
|
| 2,755 |
|
|
| 3,064 |
|
|
| 3,899 |
|
Federal funds purchased and retail repurchase agreements |
|
| 26 |
|
|
| 22 |
|
|
| 25 |
|
|
| 25 |
|
|
| 24 |
|
Federal Home Loan Bank advances |
|
| 80 |
|
|
| 65 |
|
|
| 94 |
|
|
| 471 |
|
|
| 552 |
|
Federal Reserve Bank discount window |
|
| — |
|
|
| — |
|
|
| — |
|
|
| — |
|
|
| 6 |
|
Bank stock loan |
|
| — |
|
|
| — |
|
|
| — |
|
|
| — |
|
|
| 306 |
|
Subordinated debt |
|
| 1,557 |
|
|
| 1,556 |
|
|
| 1,556 |
|
|
| 1,415 |
|
|
| 255 |
|
Total interest expense |
|
| 3,688 |
|
|
| 4,053 |
|
|
| 4,430 |
|
|
| 4,975 |
|
|
| 5,042 |
|
|
|
|
|
|
|
|
|
|
|
|
|
|
|
|
|
|
|
|
|
|
Net interest income |
|
| 34,630 |
|
|
| 31,759 |
|
|
| 35,559 |
|
|
| 32,107 |
|
|
| 32,891 |
|
Provision (reversal) for credit losses |
|
| (1,657 | ) |
|
| (5,756 | ) |
|
| 1,000 |
|
|
| 815 |
|
|
| 12,500 |
|
Net interest income after provision (reversal) for credit losses |
|
| 36,287 |
|
|
| 37,515 |
|
|
| 34,559 |
|
|
| 31,292 |
|
|
| 20,391 |
|
Non-interest income |
|
|
|
|
|
|
|
|
|
|
|
|
|
|
|
|
|
|
|
|
Service charges and fees |
|
| 2,169 |
|
|
| 1,596 |
|
|
| 1,759 |
|
|
| 1,706 |
|
|
| 1,365 |
|
Debit card income |
|
| 2,679 |
|
|
| 2,350 |
|
|
| 2,401 |
|
|
| 2,491 |
|
|
| 2,201 |
|
Mortgage banking |
|
| 848 |
|
|
| 935 |
|
|
| 855 |
|
|
| 877 |
|
|
| 831 |
|
Increase in value of bank-owned life insurance |
|
| 676 |
|
|
| 601 |
|
|
| 489 |
|
|
| 489 |
|
|
| 481 |
|
Net gain on acquisition |
|
| 663 |
|
|
| (78 | ) |
|
| 2,145 |
|
|
| — |
|
|
| — |
|
Net gains (losses) from securities transactions |
|
| — |
|
|
| 17 |
|
|
| (1 | ) |
|
| — |
|
|
| 4 |
|
Other |
|
| 2,065 |
|
|
| 1,291 |
|
|
| 852 |
|
|
| 922 |
|
|
| 850 |
|
Total non-interest income |
|
| 9,100 |
|
|
| 6,712 |
|
|
| 8,500 |
|
|
| 6,485 |
|
|
| 5,732 |
|
Non-interest expense |
|
|
|
|
|
|
|
|
|
|
|
|
|
|
|
|
|
|
|
|
Salaries and employee benefits |
|
| 12,769 |
|
|
| 12,722 |
|
|
| 14,053 |
|
|
| 13,877 |
|
|
| 12,695 |
|
Net occupancy and equipment |
|
| 2,327 |
|
|
| 2,368 |
|
|
| 2,206 |
|
|
| 2,224 |
|
|
| 2,119 |
|
Data processing |
|
| 3,474 |
|
|
| 2,663 |
|
|
| 2,748 |
|
|
| 2,817 |
|
|
| 2,763 |
|
Professional fees |
|
| 999 |
|
|
| 1,073 |
|
|
| 1,095 |
|
|
| 877 |
|
|
| 943 |
|
Advertising and business development |
|
| 799 |
|
|
| 682 |
|
|
| 801 |
|
|
| 598 |
|
|
| 403 |
|
Telecommunications |
|
| 512 |
|
|
| 580 |
|
|
| 510 |
|
|
| 486 |
|
|
| 390 |
|
FDIC insurance |
|
| 425 |
|
|
| 415 |
|
|
| 797 |
|
|
| 360 |
|
|
| 414 |
|
Courier and postage |
|
| 327 |
|
|
| 369 |
|
|
| 338 |
|
|
| 366 |
|
|
| 353 |
|
Free nationwide ATM cost |
|
| 513 |
|
|
| 472 |
|
|
| 423 |
|
|
| 439 |
|
|
| 327 |
|
Amortization of core deposit intangibles |
|
| 1,030 |
|
|
| 1,034 |
|
|
| 1,044 |
|
|
| 1,030 |
|
|
| 974 |
|
Loan expense |
|
| 181 |
|
|
| 238 |
|
|
| 161 |
|
|
| 107 |
|
|
| 287 |
|
Other real estate owned |
|
| (468 | ) |
|
| 5 |
|
|
| 1,600 |
|
|
| 133 |
|
|
| 269 |
|
Merger expenses |
|
| 460 |
|
|
| 152 |
|
|
| 299 |
|
|
| — |
|
|
| — |
|
Goodwill impairment |
|
| — |
|
|
| — |
|
|
| — |
|
|
| 104,831 |
|
|
| — |
|
Other |
|
| 2,458 |
|
|
| 2,108 |
|
|
| 2,385 |
|
|
| 2,690 |
|
|
| 2,000 |
|
Total non-interest expense |
|
| 25,806 |
|
|
| 24,881 |
|
|
| 28,460 |
|
|
| 130,835 |
|
|
| 23,937 |
|
Income (loss) before income tax |
|
| 19,581 |
|
|
| 19,346 |
|
|
| 14,599 |
|
|
| (93,058 | ) |
|
| 2,186 |
|
Provision for income taxes (benefit) |
|
| 4,415 |
|
|
| 4,271 |
|
|
| 2,111 |
|
|
| (2,653 | ) |
|
| 497 |
|
Net income (loss) and net income (loss) allocable to common stockholders |
| $ | 15,166 |
|
| $ | 15,075 |
|
| $ | 12,488 |
|
| $ | (90,405 | ) |
| $ | 1,689 |
|
Basic earnings (loss) per share |
| $ | 1.06 |
|
| $ | 1.04 |
|
| $ | 0.85 |
|
| $ | (6.01 | ) |
| $ | 0.11 |
|
Equity Bancshares, Inc.
PRESS RELEASE - 07/19/2021
Diluted earnings (loss) per share |
| $ | 1.03 |
|
| $ | 1.02 |
|
| $ | 0.84 |
|
| $ | (6.01 | ) |
| $ | 0.11 |
|
Weighted average common shares |
|
| 14,356,958 |
|
|
| 14,464,291 |
|
|
| 14,760,810 |
|
|
| 15,040,407 |
|
|
| 15,209,483 |
|
Weighted average diluted common shares |
|
| 14,674,838 |
|
|
| 14,734,083 |
|
|
| 14,934,058 |
|
|
| 15,040,407 |
|
|
| 15,304,009 |
|
Equity Bancshares, Inc.
PRESS RELEASE - 07/19/2021
TABLE 3. CONSOLIDATED BALANCE SHEETS (Unaudited)
(Dollars in thousands)
|
| June 30, 2021 |
|
| March 31, 2021 |
|
| December 31, 2020 |
|
| September 30, 2020 |
|
| June 30, 2020 |
| |||||
ASSETS |
|
|
|
|
|
|
|
|
|
|
|
|
|
|
|
|
|
|
|
|
Cash and due from banks |
| $ | 138,869 |
|
| $ | 136,190 |
|
| $ | 280,150 |
|
| $ | 65,534 |
|
| $ | 178,045 |
|
Federal funds sold |
|
| 452 |
|
|
| 498 |
|
|
| 548 |
|
|
| 305 |
|
|
| 245 |
|
Cash and cash equivalents |
|
| 139,321 |
|
|
| 136,688 |
|
|
| 280,698 |
|
|
| 65,839 |
|
|
| 178,290 |
|
Interest-bearing time deposits in other banks |
|
| — |
|
|
| 249 |
|
|
| 249 |
|
|
| 499 |
|
|
| 2,248 |
|
Available-for-sale securities |
|
| 1,041,614 |
|
|
| 998,100 |
|
|
| 871,827 |
|
|
| 798,576 |
|
|
| 177,228 |
|
Held-to-maturity securities(1) |
|
| — |
|
|
| — |
|
|
| — |
|
|
| — |
|
|
| 662,522 |
|
Loans held for sale |
|
| 6,183 |
|
|
| 8,609 |
|
|
| 12,394 |
|
|
| 9,053 |
|
|
| 4,802 |
|
Loans, net of allowance for credit losses(2) |
|
| 2,763,227 |
|
|
| 2,740,215 |
|
|
| 2,557,987 |
|
|
| 2,691,626 |
|
|
| 2,772,256 |
|
Other real estate owned, net |
|
| 10,861 |
|
|
| 10,559 |
|
|
| 11,733 |
|
|
| 8,727 |
|
|
| 7,374 |
|
Premises and equipment, net |
|
| 90,876 |
|
|
| 90,322 |
|
|
| 89,412 |
|
|
| 86,087 |
|
|
| 87,055 |
|
Bank-owned life insurance |
|
| 103,321 |
|
|
| 102,645 |
|
|
| 77,044 |
|
|
| 76,555 |
|
|
| 76,066 |
|
Federal Reserve Bank and Federal Home Loan Bank stock |
|
| 18,454 |
|
|
| 15,174 |
|
|
| 16,415 |
|
|
| 32,545 |
|
|
| 31,832 |
|
Interest receivable |
|
| 15,064 |
|
|
| 16,655 |
|
|
| 15,831 |
|
|
| 18,110 |
|
|
| 19,598 |
|
Goodwill |
|
| 31,601 |
|
|
| 31,601 |
|
|
| 31,601 |
|
|
| 31,601 |
|
|
| 136,432 |
|
Core deposit intangibles, net |
|
| 13,993 |
|
|
| 15,023 |
|
|
| 16,057 |
|
|
| 17,101 |
|
|
| 18,131 |
|
Other |
|
| 33,701 |
|
|
| 30,344 |
|
|
| 32,108 |
|
|
| 29,252 |
|
|
| 31,435 |
|
Total assets |
| $ | 4,268,216 |
|
| $ | 4,196,184 |
|
| $ | 4,013,356 |
|
| $ | 3,865,571 |
|
| $ | 4,205,269 |
|
LIABILITIES AND STOCKHOLDERS’ EQUITY |
|
|
|
|
|
|
|
|
|
|
|
|
|
|
|
|
|
|
|
|
Deposits |
|
|
|
|
|
|
|
|
|
|
|
|
|
|
|
|
|
|
|
|
Demand |
| $ | 992,565 |
|
| $ | 972,364 |
|
| $ | 791,639 |
|
| $ | 693,967 |
|
| $ | 756,613 |
|
Total non-interest-bearing deposits |
|
| 992,565 |
|
|
| 972,364 |
|
|
| 791,639 |
|
|
| 693,967 |
|
|
| 756,613 |
|
Savings, NOW and money market |
|
| 2,035,496 |
|
|
| 2,074,261 |
|
|
| 2,029,097 |
|
|
| 1,816,307 |
|
|
| 1,800,132 |
|
Time |
|
| 659,494 |
|
|
| 587,905 |
|
|
| 626,854 |
|
|
| 623,344 |
|
|
| 690,522 |
|
Total interest-bearing deposits |
|
| 2,694,990 |
|
|
| 2,662,166 |
|
|
| 2,655,951 |
|
|
| 2,439,651 |
|
|
| 2,490,654 |
|
Total deposits |
|
| 3,687,555 |
|
|
| 3,634,530 |
|
|
| 3,447,590 |
|
|
| 3,133,618 |
|
|
| 3,247,267 |
|
Federal funds purchased and retail repurchase agreements |
|
| 47,184 |
|
|
| 40,339 |
|
|
| 36,029 |
|
|
| 46,295 |
|
|
| 51,557 |
|
Federal Home Loan Bank advances |
|
| 9,208 |
|
|
| 9,926 |
|
|
| 10,144 |
|
|
| 167,862 |
|
|
| 344,900 |
|
Subordinated debt |
|
| 87,908 |
|
|
| 87,788 |
|
|
| 87,684 |
|
|
| 87,537 |
|
|
| 55,575 |
|
Contractual obligations |
|
| 4,469 |
|
|
| 4,856 |
|
|
| 5,189 |
|
|
| 5,478 |
|
|
| 5,571 |
|
Interest payable and other liabilities |
|
| 18,897 |
|
|
| 20,930 |
|
|
| 19,071 |
|
|
| 22,609 |
|
|
| 20,633 |
|
Total liabilities |
|
| 3,855,221 |
|
|
| 3,798,369 |
|
|
| 3,605,707 |
|
|
| 3,463,399 |
|
|
| 3,725,503 |
|
Commitments and contingent liabilities |
|
|
|
|
|
|
|
|
|
|
|
|
|
|
|
|
|
|
|
|
Stockholders’ equity |
|
|
|
|
|
|
|
|
|
|
|
|
|
|
|
|
|
|
|
|
Common stock |
|
| 176 |
|
|
| 175 |
|
|
| 174 |
|
|
| 174 |
|
|
| 174 |
|
Additional paid-in capital |
|
| 389,394 |
|
|
| 387,939 |
|
|
| 386,820 |
|
|
| 386,017 |
|
|
| 384,955 |
|
Retained earnings |
|
| 68,625 |
|
|
| 53,459 |
|
|
| 50,787 |
|
|
| 38,299 |
|
|
| 128,704 |
|
Accumulated other comprehensive income, net of tax |
|
| 13,450 |
|
|
| 12,019 |
|
|
| 19,781 |
|
|
| 21,074 |
|
|
| 3,390 |
|
Employee stock loans |
|
| — |
|
|
| — |
|
|
| (43 | ) |
|
| (43 | ) |
|
| (43 | ) |
Treasury stock |
|
| (58,650 | ) |
|
| (55,777 | ) |
|
| (49,870 | ) |
|
| (43,349 | ) |
|
| (37,414 | ) |
Total stockholders’ equity |
|
| 412,995 |
|
|
| 397,815 |
|
|
| 407,649 |
|
|
| 402,172 |
|
|
| 479,766 |
|
Total liabilities and stockholders’ equity |
| $ | 4,268,216 |
|
| $ | 4,196,184 |
|
| $ | 4,013,356 |
|
| $ | 3,865,571 |
|
| $ | 4,205,269 |
|
|
|
|
|
|
|
|
|
|
|
|
|
|
|
|
|
|
|
|
|
|
(1) Fair market value of held-to-maturity securities |
| $ | — |
|
| $ | — |
|
| $ | — |
|
| $ | — |
|
| $ | 689,206 |
|
(2) Allowance for credit losses |
|
| 51,834 |
|
|
| 55,525 |
|
|
| 33,709 |
|
|
| 34,087 |
|
|
| 34,078 |
|
Equity Bancshares, Inc.
PRESS RELEASE - 07/19/2021
TABLE 4. SELECTED FINANCIAL HIGHLIGHTS (Unaudited)
(Dollars in thousands, except per share data)
|
| As of and for the three months ended |
| |||||||||||||||||
|
| June 30, |
|
| March 31, |
|
| December 31, |
|
| September 30, |
|
| June 30, |
| |||||
|
| 2021 |
|
| 2021 |
|
| 2020 |
|
| 2020 |
|
| 2020 |
| |||||
Loans Held-For-Investment by Type |
|
|
|
|
|
|
|
|
|
|
|
|
|
|
|
|
|
|
|
|
Commercial real estate |
| $ | 1,261,214 |
|
| $ | 1,218,537 |
|
| $ | 1,188,696 |
|
| $ | 1,188,329 |
|
| $ | 1,191,336 |
|
Commercial and industrial |
|
| 732,126 |
|
|
| 820,736 |
|
|
| 734,495 |
|
|
| 857,244 |
|
|
| 883,355 |
|
Residential real estate |
|
| 503,110 |
|
|
| 438,503 |
|
|
| 381,958 |
|
|
| 402,242 |
|
|
| 442,486 |
|
Agricultural real estate |
|
| 129,020 |
|
|
| 134,944 |
|
|
| 133,693 |
|
|
| 127,349 |
|
|
| 129,080 |
|
Agricultural |
|
| 97,912 |
|
|
| 93,764 |
|
|
| 94,322 |
|
|
| 83,084 |
|
|
| 89,040 |
|
Consumer |
|
| 91,679 |
|
|
| 89,256 |
|
|
| 58,532 |
|
|
| 67,465 |
|
|
| 71,037 |
|
Total loans held-for-investment |
|
| 2,815,061 |
|
|
| 2,795,740 |
|
|
| 2,591,696 |
|
|
| 2,725,713 |
|
|
| 2,806,334 |
|
Allowance for credit losses |
|
| (51,834 | ) |
|
| (55,525 | ) |
|
| (33,709 | ) |
|
| (34,087 | ) |
|
| (34,078 | ) |
Net loans held-for-investment |
| $ | 2,763,227 |
|
| $ | 2,740,215 |
|
| $ | 2,557,987 |
|
| $ | 2,691,626 |
|
| $ | 2,772,256 |
|
|
|
|
|
|
|
|
|
|
|
|
|
|
|
|
|
|
|
|
|
|
|
|
|
|
|
|
|
|
|
|
|
|
|
|
|
|
|
|
|
|
|
Asset Quality Ratios |
|
|
|
|
|
|
|
|
|
|
|
|
|
|
|
|
|
|
|
|
Allowance for credit losses on loans to total loans |
|
| 1.84 | % |
|
| 1.99 | % |
|
| 1.30 | % |
|
| 1.25 | % |
|
| 1.21 | % |
Past due or nonaccrual loans to total loans |
|
| 2.09 | % |
|
| 2.30 | % |
|
| 1.99 | % |
|
| 2.12 | % |
|
| 1.88 | % |
Nonperforming assets to total assets |
|
| 1.56 | % |
|
| 1.67 | % |
|
| 1.36 | % |
|
| 1.55 | % |
|
| 1.37 | % |
Nonperforming assets to total loans plus other real estate owned |
|
| 2.36 | % |
|
| 2.50 | % |
|
| 2.10 | % |
|
| 2.19 | % |
|
| 2.05 | % |
Classified assets to bank total regulatory capital |
|
| 23.11 | % |
|
| 26.45 | % |
|
| 25.50 | % |
|
| 18.35 | % |
|
| 20.81 | % |
|
|
|
|
|
|
|
|
|
|
|
|
|
|
|
|
|
|
|
|
|
|
|
|
|
|
|
|
|
|
|
|
|
|
|
|
|
|
|
|
|
|
Selected Average Balance Sheet Data (QTD Average) |
|
|
|
|
|
|
|
|
|
|
|
|
|
|
|
|
|
|
|
|
Investment securities |
| $ | 986,986 |
|
| $ | 947,453 |
|
| $ | 814,114 |
|
| $ | 802,525 |
|
| $ | 877,308 |
|
Total gross loans receivable |
|
| 2,853,145 |
|
|
| 2,736,918 |
|
|
| 2,692,223 |
|
|
| 2,758,680 |
|
|
| 2,806,865 |
|
Interest-earning assets |
|
| 3,964,633 |
|
|
| 3,891,140 |
|
|
| 3,647,730 |
|
|
| 3,679,168 |
|
|
| 3,786,629 |
|
Total assets |
|
| 4,231,439 |
|
|
| 4,143,752 |
|
|
| 3,910,628 |
|
|
| 4,041,187 |
|
|
| 4,159,336 |
|
Interest-bearing deposits |
|
| 2,656,052 |
|
|
| 2,690,159 |
|
|
| 2,551,219 |
|
|
| 2,430,407 |
|
|
| 2,487,187 |
|
Borrowings |
|
| 171,658 |
|
|
| 139,360 |
|
|
| 172,730 |
|
|
| 377,158 |
|
|
| 384,727 |
|
Total interest-bearing liabilities |
|
| 2,827,710 |
|
|
| 2,829,519 |
|
|
| 2,723,949 |
|
|
| 2,807,565 |
|
|
| 2,871,914 |
|
Total deposits |
|
| 3,624,950 |
|
|
| 3,577,625 |
|
|
| 2,960,791 |
|
|
| 3,145,810 |
|
|
| 3,257,631 |
|
Total liabilities |
|
| 3,827,400 |
|
|
| 3,748,114 |
|
|
| 3,501,056 |
|
|
| 3,558,099 |
|
|
| 3,675,731 |
|
Total stockholders' equity |
|
| 404,039 |
|
|
| 395,638 |
|
|
| 409,572 |
|
|
| 483,088 |
|
|
| 483,605 |
|
Tangible common equity* |
|
| 356,705 |
|
|
| 347,262 |
|
|
| 355,025 |
|
|
| 329,039 |
|
|
| 327,411 |
|
|
|
|
|
|
|
|
|
|
|
|
|
|
|
|
|
|
|
|
|
|
|
|
|
|
|
|
|
|
|
|
|
|
|
|
|
|
|
|
|
|
|
Performance ratios |
|
|
|
|
|
|
|
|
|
|
|
|
|
|
|
|
|
|
|
|
Return on average assets (ROAA) annualized |
|
| 1.44 | % |
|
| 1.48 | % |
|
| 1.27 | % |
|
| (8.90 | )% |
|
| 0.16 | % |
Return on average assets before income tax, provision for loan losses and goodwill impairment* |
|
| 1.70 | % |
|
| 1.33 | % |
|
| 1.59 | % |
|
| 1.24 | % |
|
| 1.42 | % |
Return on average equity (ROAE) annualized |
|
| 15.06 | % |
|
| 15.45 | % |
|
| 12.13 | % |
|
| (74.45 | )% |
|
| 1.40 | % |
Return on average equity before income tax, provision for loan losses and goodwill impairment* |
|
| 17.79 | % |
|
| 13.93 | % |
|
| 15.15 | % |
|
| 10.37 | % |
|
| 12.21 | % |
Return on average tangible common equity (ROATCE) annualized* |
|
| 17.98 | % |
|
| 18.57 | % |
|
| 14.93 | % |
|
| (108.31 | )% |
|
| 3.03 | % |
Return on average tangible common equity adjusted for goodwill impairment* |
|
| 17.98 | % |
|
| 18.57 | % |
|
| 14.93 | % |
|
| 12.01 | % |
|
| 3.03 | % |
Yield on loans annualized |
|
| 4.75 | % |
|
| 4.59 | % |
|
| 5.23 | % |
|
| 4.65 | % |
|
| 4.68 | % |
Cost of interest-bearing deposits annualized |
|
| 0.31 | % |
|
| 0.36 | % |
|
| 0.43 | % |
|
| 0.50 | % |
|
| 0.63 | % |
Cost of total deposits annualized |
|
| 0.22 | % |
|
| 0.27 | % |
|
| 0.37 | % |
|
| 0.39 | % |
|
| 0.48 | % |
Net interest margin annualized |
|
| 3.50 | % |
|
| 3.31 | % |
|
| 3.88 | % |
|
| 3.47 | % |
|
| 3.49 | % |
Efficiency ratio* |
|
| 58.85 | % |
|
| 64.18 | % |
|
| 67.19 | % |
|
| 67.38 | % |
|
| 61.98 | % |
Non-interest income / average assets |
|
| 0.86 | % |
|
| 0.66 | % |
|
| 0.86 | % |
|
| 0.64 | % |
|
| 0.55 | % |
Non-interest expense / average assets |
|
| 2.45 | % |
|
| 2.44 | % |
|
| 2.90 | % |
|
| 12.88 | % |
|
| 2.31 | % |
|
|
|
|
|
|
|
|
|
|
|
|
|
|
|
|
|
|
|
|
|
|
|
|
|
|
|
|
|
|
|
|
|
|
|
|
|
|
|
|
|
|
Equity Bancshares, Inc.
PRESS RELEASE - 07/19/2021
Capital Ratios |
|
|
|
|
|
|
|
|
|
|
|
|
|
|
|
|
|
|
|
|
Tier 1 Leverage Ratio |
|
| 8.88 | % |
|
| 8.73 | % |
|
| 9.30 | % |
|
| 8.76 | % |
|
| 8.52 | % |
Common Equity Tier 1 Capital Ratio |
|
| 12.41 | % |
|
| 12.53 | % |
|
| 12.82 | % |
|
| 12.76 | % |
|
| 12.02 | % |
Tier 1 Risk Based Capital Ratio |
|
| 12.93 | % |
|
| 13.08 | % |
|
| 13.37 | % |
|
| 13.32 | % |
|
| 12.57 | % |
Total Risk Based Capital Ratio |
|
| 16.73 | % |
|
| 17.02 | % |
|
| 17.35 | % |
|
| 17.35 | % |
|
| 15.33 | % |
Total stockholders' equity to total assets |
|
| 9.68 | % |
|
| 9.48 | % |
|
| 10.16 | % |
|
| 10.40 | % |
|
| 11.41 | % |
Tangible common equity to tangible assets* |
|
| 8.68 | % |
|
| 8.44 | % |
|
| 9.05 | % |
|
| 9.23 | % |
|
| 8.00 | % |
Book value per common share |
| $ | 28.76 |
|
| $ | 27.66 |
|
| $ | 28.04 |
|
| $ | 27.08 |
|
| $ | 31.53 |
|
Tangible book value per common share* |
| $ | 25.51 |
|
| $ | 24.34 |
|
| $ | 24.68 |
|
| $ | 23.72 |
|
| $ | 21.29 |
|
Tangible book value per diluted common share* |
| $ | 24.98 |
|
| $ | 23.87 |
|
| $ | 24.32 |
|
| $ | 23.57 |
|
| $ | 21.13 |
|
* The value noted is considered a Non-GAAP financial measure. For a reconciliation of Non-GAAP financial measures, see Table 8. Non-GAAP Financial Measures
Equity Bancshares, Inc.
PRESS RELEASE - 07/19/2021
TABLE 5. YEAR-TO-DATE NET INTEREST INCOME ANALYSIS (Unaudited)
(Dollars in thousands)
| For the six months ended |
|
| For the six months ended |
| ||||||||||||||||||
June 30, 2021 |
|
| June 30, 2020 |
| |||||||||||||||||||
| Average Outstanding Balance |
|
| Interest Income/ Expense |
|
| Average Yield/Rate(3)(4) |
|
| Average Outstanding Balance |
|
| Interest Income/ Expense |
|
| Average Yield/Rate(3)(4) |
| ||||||
Interest-earning assets |
|
|
|
|
|
|
|
|
|
|
|
|
|
|
|
|
|
|
|
|
|
|
|
Loans (1) |
|
|
|
|
|
|
|
|
|
|
|
|
|
|
|
|
|
|
|
|
|
|
|
Commercial and industrial | $ | 814,895 |
|
| $ | 20,962 |
|
|
| 5.19 | % |
| $ | 712,115 |
|
| $ | 16,258 |
|
|
| 4.59 | % |
Commercial real estate |
| 981,482 |
|
|
| 22,873 |
|
|
| 4.70 | % |
|
| 923,625 |
|
|
| 25,134 |
|
|
| 5.47 | % |
Real estate construction |
| 254,807 |
|
|
| 4,531 |
|
|
| 3.59 | % |
|
| 260,530 |
|
|
| 6,413 |
|
|
| 4.95 | % |
Residential real estate |
| 430,123 |
|
|
| 9,093 |
|
|
| 4.26 | % |
|
| 481,716 |
|
|
| 10,156 |
|
|
| 4.24 | % |
Agricultural real estate |
| 136,366 |
|
|
| 3,384 |
|
|
| 5.00 | % |
|
| 134,098 |
|
|
| 4,046 |
|
|
| 6.07 | % |
Agricultural |
| 94,596 |
|
|
| 2,062 |
|
|
| 4.40 | % |
|
| 87,892 |
|
|
| 2,576 |
|
|
| 5.89 | % |
Consumer |
| 83,083 |
|
|
| 1,906 |
|
|
| 4.63 | % |
|
| 66,128 |
|
|
| 2,420 |
|
|
| 7.36 | % |
Total loans |
| 2,795,352 |
|
|
| 64,811 |
|
|
| 4.68 | % |
|
| 2,666,104 |
|
|
| 67,003 |
|
|
| 5.05 | % |
Securities |
|
|
|
|
|
|
|
|
|
|
|
|
|
|
|
|
|
|
|
|
|
|
|
Taxable securities |
| 863,801 |
|
|
| 7,322 |
|
|
| 1.71 | % |
|
| 763,992 |
|
|
| 8,637 |
|
|
| 2.27 | % |
Nontaxable securities |
| 103,529 |
|
|
| 1,441 |
|
|
| 2.81 | % |
|
| 128,616 |
|
|
| 1,846 |
|
|
| 2.89 | % |
Total securities |
| 967,330 |
|
|
| 8,763 |
|
|
| 1.83 | % |
|
| 892,608 |
|
|
| 10,483 |
|
|
| 2.36 | % |
Federal funds sold and other |
| 165,408 |
|
|
| 556 |
|
|
| 0.68 | % |
|
| 94,234 |
|
|
| 1,004 |
|
|
| 2.14 | % |
Total interest-earning assets | $ | 3,928,090 |
|
|
| 74,130 |
|
|
| 3.81 | % |
| $ | 3,652,946 |
|
|
| 78,490 |
|
|
| 4.32 | % |
Interest-bearing liabilities |
|
|
|
|
|
|
|
|
|
|
|
|
|
|
|
|
|
|
|
|
|
|
|
Savings, NOW and money market deposits | $ | 2,073,658 |
|
|
| 1,865 |
|
|
| 0.18 | % |
| $ | 1,739,527 |
|
|
| 4,048 |
|
|
| 0.47 | % |
Time deposits |
| 599,353 |
|
|
| 2,570 |
|
|
| 0.86 | % |
|
| 769,820 |
|
|
| 6,715 |
|
|
| 1.75 | % |
Total interest-bearing deposits |
| 2,673,011 |
|
|
| 4,435 |
|
|
| 0.33 | % |
|
| 2,509,347 |
|
|
| 10,763 |
|
|
| 0.86 | % |
FHLB advances |
| 23,911 |
|
|
| 145 |
|
|
| 1.22 | % |
|
| 283,231 |
|
|
| 1,727 |
|
|
| 1.23 | % |
Other borrowings |
| 131,687 |
|
|
| 3,161 |
|
|
| 4.84 | % |
|
| 86,784 |
|
|
| 1,014 |
|
|
| 2.35 | % |
Total interest-bearing liabilities | $ | 2,828,609 |
|
|
| 7,741 |
|
|
| 0.55 | % |
| $ | 2,879,362 |
|
|
| 13,504 |
|
|
| 0.94 | % |
|
|
|
|
|
|
|
|
|
|
|
|
|
|
|
|
|
|
|
|
|
|
|
|
Net interest income |
|
|
|
| $ | 66,389 |
|
|
|
|
|
|
|
|
|
| $ | 64,986 |
|
|
|
|
|
Interest rate spread |
|
|
|
|
|
|
|
|
| 3.26 | % |
|
|
|
|
|
|
|
|
|
| 3.38 | % |
|
|
|
|
|
|
|
|
|
|
|
|
|
|
|
|
|
|
|
|
|
|
|
|
Net interest margin (2) |
|
|
|
|
|
|
|
|
| 3.41 | % |
|
|
|
|
|
|
|
|
|
| 3.58 | % |
|
|
|
|
|
|
|
|
|
|
|
|
|
|
|
|
|
|
|
|
|
|
|
|
(1) Average loan balances include nonaccrual loans. |
| ||||||||||||||||||||||
(2) Net interest margin is calculated by dividing annualized net interest income by average interest-earning assets for the period. |
| ||||||||||||||||||||||
(3) Tax exempt income is not included in the above table on a tax-equivalent basis. |
| ||||||||||||||||||||||
(4) Actual unrounded values are used to calculate the reported yield or rate disclosed. Accordingly, recalculations using the amounts in thousands as disclosed in this report may not produce the same amounts. |
| ||||||||||||||||||||||
Equity Bancshares, Inc.
PRESS RELEASE - 07/19/2021
TABLE 6. QUARTER-TO-DATE NET INTEREST INCOME ANALYSIS (Unaudited)
(Dollars in thousands)
| For the three months ended |
|
| For the three months ended |
| ||||||||||||||||||
| June 30, 2021 |
|
| June 30, 2020 |
| ||||||||||||||||||
| Average Outstanding Balance |
|
| Interest Income/ Expense |
|
| Average Yield/Rate(3)(4) |
|
| Average Outstanding Balance |
|
| Interest Income/ Expense |
|
| Average Yield/Rate(3)(4) |
| ||||||
Interest-earning assets |
|
|
|
|
|
|
|
|
|
|
|
|
|
|
|
|
|
|
|
|
|
|
|
Loans (1) |
|
|
|
|
|
|
|
|
|
|
|
|
|
|
|
|
|
|
|
|
|
|
|
Commercial and industrial | $ | 826,647 |
|
| $ | 11,729 |
|
|
| 5.69 | % |
| $ | 868,302 |
|
| $ | 8,378 |
|
|
| 3.88 | % |
Commercial real estate |
| 991,033 |
|
|
| 11,433 |
|
|
| 4.63 | % |
|
| 934,186 |
|
|
| 12,192 |
|
|
| 5.25 | % |
Real estate construction |
| 253,947 |
|
|
| 2,352 |
|
|
| 3.71 | % |
|
| 253,672 |
|
|
| 2,837 |
|
|
| 4.50 | % |
Residential real estate |
| 465,525 |
|
|
| 4,642 |
|
|
| 4.00 | % |
|
| 467,246 |
|
|
| 4,854 |
|
|
| 4.18 | % |
Agricultural real estate |
| 131,906 |
|
|
| 1,687 |
|
|
| 5.13 | % |
|
| 130,533 |
|
|
| 1,955 |
|
|
| 6.02 | % |
Agricultural |
| 94,407 |
|
|
| 1,024 |
|
|
| 4.35 | % |
|
| 87,830 |
|
|
| 1,266 |
|
|
| 5.80 | % |
Consumer |
| 89,680 |
|
|
| 943 |
|
|
| 4.22 | % |
|
| 65,096 |
|
|
| 1,145 |
|
|
| 7.07 | % |
Total loans |
| 2,853,145 |
|
|
| 33,810 |
|
|
| 4.75 | % |
|
| 2,806,865 |
|
|
| 32,627 |
|
|
| 4.68 | % |
Securities |
|
|
|
|
|
|
|
|
|
|
|
|
|
|
|
|
|
|
|
|
|
|
|
Taxable securities |
| 887,983 |
|
|
| 3,523 |
|
|
| 1.59 | % |
|
| 753,332 |
|
|
| 4,017 |
|
|
| 2.14 | % |
Nontaxable securities |
| 99,003 |
|
|
| 717 |
|
|
| 2.90 | % |
|
| 123,976 |
|
|
| 880 |
|
|
| 2.86 | % |
Total securities |
| 986,986 |
|
|
| 4,240 |
|
|
| 1.72 | % |
|
| 877,308 |
|
|
| 4,897 |
|
|
| 2.25 | % |
Federal funds sold and other |
| 124,502 |
|
|
| 268 |
|
|
| 0.86 | % |
|
| 102,456 |
|
|
| 409 |
|
|
| 1.61 | % |
Total interest-earning assets | $ | 3,964,633 |
|
|
| 38,318 |
|
|
| 3.88 | % |
| $ | 3,786,629 |
|
|
| 37,933 |
|
|
| 4.03 | % |
Interest-bearing liabilities |
|
|
|
|
|
|
|
|
|
|
|
|
|
|
|
|
|
|
|
|
|
|
|
Savings, NOW and money market deposits | $ | 2,068,319 |
|
|
| 895 |
|
|
| 0.17 | % |
| $ | 1,754,280 |
|
|
| 923 |
|
|
| 0.21 | % |
Time deposits |
| 587,733 |
|
|
| 1,130 |
|
|
| 0.77 | % |
|
| 732,907 |
|
|
| 2,976 |
|
|
| 1.63 | % |
Total interest-bearing deposits |
| 2,656,052 |
|
|
| 2,025 |
|
|
| 0.31 | % |
|
| 2,487,187 |
|
|
| 3,899 |
|
|
| 0.63 | % |
FHLB advances |
| 37,656 |
|
|
| 80 |
|
|
| 0.86 | % |
|
| 270,785 |
|
|
| 552 |
|
|
| 0.82 | % |
Other borrowings |
| 134,002 |
|
|
| 1,583 |
|
|
| 4.74 | % |
|
| 113,942 |
|
|
| 591 |
|
|
| 2.09 | % |
Total interest-bearing liabilities | $ | 2,827,710 |
|
|
| 3,688 |
|
|
| 0.52 | % |
| $ | 2,871,914 |
|
|
| 5,042 |
|
|
| 0.71 | % |
|
|
|
|
|
|
|
|
|
|
|
|
|
|
|
|
|
|
|
|
|
|
|
|
Net interest income |
|
|
|
| $ | 34,630 |
|
|
|
|
|
|
|
|
|
| $ | 32,891 |
|
|
|
|
|
Interest rate spread |
|
|
|
|
|
|
|
|
| 3.36 | % |
|
|
|
|
|
|
|
|
|
| 3.32 | % |
|
|
|
|
|
|
|
|
|
|
|
|
|
|
|
|
|
|
|
|
|
|
|
|
Net interest margin (2) |
|
|
|
|
|
|
|
|
| 3.50 | % |
|
|
|
|
|
|
|
|
|
| 3.49 | % |
|
|
|
|
|
|
|
|
|
|
|
|
|
|
|
|
|
|
|
|
|
|
|
|
(1) Average loan balances include nonaccrual loans. |
| ||||||||||||||||||||||
(2) Net interest margin is calculated by dividing annualized net interest income by average interest-earning assets for the period. |
| ||||||||||||||||||||||
(3) Tax exempt income is not included in the above table on a tax-equivalent basis. |
| ||||||||||||||||||||||
Equity Bancshares, Inc.
PRESS RELEASE - 07/19/2021
TABLE 7. QUARTER-OVER-QUARTER NET INTEREST INCOME ANALYSIS (Unaudited)
(Dollars in thousands)
| For the three months ended |
|
| For the three months ended |
| ||||||||||||||||||
| June 30, 2021 |
|
| March 31, 2021 |
| ||||||||||||||||||
| Average Outstanding Balance |
|
| Interest Income/ Expense |
|
| Average Yield/Rate(3)(4) |
|
| Average Outstanding Balance |
|
| Interest Income/ Expense |
|
| Average Yield/Rate(3)(4) |
| ||||||
Interest-earning assets |
|
|
|
|
|
|
|
|
|
|
|
|
|
|
|
|
|
|
|
|
|
|
|
Loans (1) |
|
|
|
|
|
|
|
|
|
|
|
|
|
|
|
|
|
|
|
|
|
|
|
Commercial and industrial | $ | 826,647 |
|
| $ | 11,729 |
|
|
| 5.69 | % |
| $ | 803,012 |
|
| $ | 9,234 |
|
|
| 4.66 | % |
Commercial real estate |
| 991,033 |
|
|
| 11,433 |
|
|
| 4.63 | % |
|
| 971,825 |
|
|
| 11,441 |
|
|
| 4.77 | % |
Real estate construction |
| 253,947 |
|
|
| 2,352 |
|
|
| 3.71 | % |
|
| 255,677 |
|
|
| 2,178 |
|
|
| 3.45 | % |
Residential real estate |
| 465,525 |
|
|
| 4,642 |
|
|
| 4.00 | % |
|
| 394,329 |
|
|
| 4,452 |
|
|
| 4.58 | % |
Agricultural real estate |
| 131,906 |
|
|
| 1,687 |
|
|
| 5.13 | % |
|
| 140,875 |
|
|
| 1,696 |
|
|
| 4.88 | % |
Agricultural |
| 94,407 |
|
|
| 1,024 |
|
|
| 4.35 | % |
|
| 94,787 |
|
|
| 1,037 |
|
|
| 4.44 | % |
Consumer |
| 89,680 |
|
|
| 943 |
|
|
| 4.22 | % |
|
| 76,413 |
|
|
| 963 |
|
|
| 5.11 | % |
Total loans |
| 2,853,145 |
|
|
| 33,810 |
|
|
| 4.75 | % |
|
| 2,736,918 |
|
|
| 31,001 |
|
|
| 4.59 | % |
Securities |
|
|
|
|
|
|
|
|
|
|
|
|
|
|
|
|
|
|
|
|
|
|
|
Taxable securities |
| 887,983 |
|
|
| 3,523 |
|
|
| 1.59 | % |
|
| 839,349 |
|
|
| 3,799 |
|
|
| 1.84 | % |
Nontaxable securities |
| 99,003 |
|
|
| 717 |
|
|
| 2.90 | % |
|
| 108,104 |
|
|
| 724 |
|
|
| 2.72 | % |
Total securities |
| 986,986 |
|
|
| 4,240 |
|
|
| 1.72 | % |
|
| 947,453 |
|
|
| 4,523 |
|
|
| 1.94 | % |
Federal funds sold and other |
| 124,502 |
|
|
| 268 |
|
|
| 0.86 | % |
|
| 206,769 |
|
|
| 288 |
|
|
| 0.56 | % |
Total interest-earning assets | $ | 3,964,633 |
|
|
| 38,318 |
|
|
| 3.88 | % |
| $ | 3,891,140 |
|
|
| 35,812 |
|
|
| 3.73 | % |
Interest-bearing liabilities |
|
|
|
|
|
|
|
|
|
|
|
|
|
|
|
|
|
|
|
|
|
|
|
Savings, NOW and money market deposits | $ | 2,068,319 |
|
|
| 895 |
|
|
| 0.17 | % |
| $ | 2,079,057 |
|
|
| 971 |
|
|
| 0.19 | % |
Time deposits |
| 587,733 |
|
|
| 1,130 |
|
|
| 0.77 | % |
|
| 611,102 |
|
|
| 1,439 |
|
|
| 0.96 | % |
Total interest-bearing deposits |
| 2,656,052 |
|
|
| 2,025 |
|
|
| 0.31 | % |
|
| 2,690,159 |
|
|
| 2,410 |
|
|
| 0.36 | % |
FHLB advances |
| 37,656 |
|
|
| 80 |
|
|
| 0.86 | % |
|
| 10,013 |
|
|
| 65 |
|
|
| 2.63 | % |
Other borrowings |
| 134,002 |
|
|
| 1,583 |
|
|
| 4.74 | % |
|
| 129,347 |
|
|
| 1,578 |
|
|
| 4.96 | % |
Total interest-bearing liabilities | $ | 2,827,710 |
|
|
| 3,688 |
|
|
| 0.52 | % |
| $ | 2,829,519 |
|
|
| 4,053 |
|
|
| 0.58 | % |
|
|
|
|
|
|
|
|
|
|
|
|
|
|
|
|
|
|
|
|
|
|
|
|
Net interest income |
|
|
|
| $ | 34,630 |
|
|
|
|
|
|
|
|
|
| $ | 31,759 |
|
|
|
|
|
Interest rate spread |
|
|
|
|
|
|
|
|
| 3.36 | % |
|
|
|
|
|
|
|
|
|
| 3.15 | % |
|
|
|
|
|
|
|
|
|
|
|
|
|
|
|
|
|
|
|
|
|
|
|
|
Net interest margin (2) |
|
|
|
|
|
|
|
|
| 3.50 | % |
|
|
|
|
|
|
|
|
|
| 3.31 | % |
|
|
|
|
|
|
|
|
|
|
|
|
|
|
|
|
|
|
|
|
|
|
|
|
(1) Average loan balances include nonaccrual loans. |
| ||||||||||||||||||||||
(2) Net interest margin is calculated by dividing annualized net interest income by average interest-earning assets for the period. |
| ||||||||||||||||||||||
(3) Tax exempt income is not included in the above table on a tax-equivalent basis. |
| ||||||||||||||||||||||
Equity Bancshares, Inc.
PRESS RELEASE - 07/19/2021
TABLE 8. NON-GAAP FINANCIAL MEASURES (Unaudited)
(Dollars in thousands, except per share data)
|
| As of and for the three months ended |
| |||||||||||||||||
|
| June 30, |
|
| March 31, |
|
| December 31, |
|
| September 30, |
|
| June 30, |
| |||||
|
| 2021 |
|
| 2021 |
|
| 2020 |
|
| 2020 |
|
| 2020 |
| |||||
|
|
|
|
|
|
|
|
|
|
|
|
|
|
|
|
|
|
|
|
|
Income before income taxes |
| $ | 19,581 |
|
| $ | 19,346 |
|
| $ | 14,599 |
|
| $ | (93,058 | ) |
| $ | 2,186 |
|
Add: goodwill impairment |
|
| — |
|
|
| — |
|
|
| — |
|
|
| 104,831 |
|
|
| — |
|
Less: tax effect |
|
| 4,415 |
|
|
| 4,271 |
|
|
| 2,111 |
|
|
| 2,652 |
|
|
| 497 |
|
Adjusted income |
| $ | 15,166 |
|
| $ | 15,075 |
|
| $ | 12,488 |
|
| $ | 9,121 |
|
| $ | 1,689 |
|
Weighted average common shares outstanding |
|
| 14,356,958 |
|
|
| 14,464,291 |
|
|
| 14,760,810 |
|
|
| 15,040,407 |
|
|
| 15,209,483 |
|
Effect of weighted average dilutive shares assuming positive net income |
|
| 317,880 |
|
|
| 269,792 |
|
|
| 173,248 |
|
|
| 82,804 |
|
|
| 94,526 |
|
Weighted average diluted shares |
|
| 14,674,838 |
|
|
| 14,734,083 |
|
|
| 14,934,058 |
|
|
| 15,123,211 |
|
|
| 15,304,009 |
|
Diluted earnings per share adjusted for goodwill impairment |
| $ | 1.03 |
|
| $ | 1.02 |
|
| $ | 0.84 |
|
| $ | 0.60 |
|
| $ | 0.11 |
|
|
|
|
|
|
|
|
|
|
|
|
|
|
|
|
|
|
|
|
|
|
Total stockholders' equity |
| $ | 412,995 |
|
| $ | 397,815 |
|
| $ | 407,649 |
|
| $ | 402,172 |
|
| $ | 479,766 |
|
Less: goodwill |
|
| 31,601 |
|
|
| 31,601 |
|
|
| 31,601 |
|
|
| 31,601 |
|
|
| 136,432 |
|
Less: core deposit intangibles, net |
|
| 13,993 |
|
|
| 15,023 |
|
|
| 16,057 |
|
|
| 17,101 |
|
|
| 18,131 |
|
Less: mortgage servicing asset, net |
|
| — |
|
|
| — |
|
|
| — |
|
|
| 1 |
|
|
| 2 |
|
Less: naming rights, net |
|
| 1,109 |
|
|
| 1,119 |
|
|
| 1,130 |
|
|
| 1,141 |
|
|
| 1,152 |
|
Tangible common equity |
| $ | 366,292 |
|
| $ | 350,072 |
|
| $ | 358,861 |
|
| $ | 352,328 |
|
| $ | 324,049 |
|
Common shares issued at period end |
|
| 14,360,172 |
|
|
| 14,383,913 |
|
|
| 14,540,556 |
|
|
| 14,853,487 |
|
|
| 15,218,301 |
|
Diluted common shares outstanding at period end |
|
| 14,664,603 |
|
|
| 14,668,287 |
|
|
| 14,756,378 |
|
|
| 14,945,282 |
|
|
| 15,334,144 |
|
Book value per common share |
| $ | 28.76 |
|
| $ | 27.66 |
|
| $ | 28.04 |
|
| $ | 27.08 |
|
| $ | 31.53 |
|
Tangible book value per common share |
| $ | 25.51 |
|
| $ | 24.34 |
|
| $ | 24.68 |
|
| $ | 23.72 |
|
| $ | 21.29 |
|
Tangible book value per diluted common share |
| $ | 24.98 |
|
| $ | 23.87 |
|
| $ | 24.32 |
|
| $ | 23.57 |
|
| $ | 21.13 |
|
|
|
|
|
|
|
|
|
|
|
|
|
|
|
|
|
|
|
|
|
|
Total assets |
| $ | 4,268,216 |
|
| $ | 4,196,184 |
|
| $ | 4,013,356 |
|
| $ | 3,865,571 |
|
| $ | 4,205,269 |
|
Less: goodwill |
|
| 31,601 |
|
|
| 31,601 |
|
|
| 31,601 |
|
|
| 31,601 |
|
|
| 136,432 |
|
Less: core deposit intangibles, net |
|
| 13,993 |
|
|
| 15,023 |
|
|
| 16,057 |
|
|
| 17,101 |
|
|
| 18,131 |
|
Less: mortgage servicing asset, net |
|
| — |
|
|
| — |
|
|
| — |
|
|
| 1 |
|
|
| 2 |
|
Less: naming rights, net |
|
| 1,109 |
|
|
| 1,119 |
|
|
| 1,130 |
|
|
| 1,141 |
|
|
| 1,152 |
|
Tangible assets |
| $ | 4,221,513 |
|
| $ | 4,148,441 |
|
| $ | 3,964,568 |
|
| $ | 3,815,727 |
|
| $ | 4,049,552 |
|
Total stockholders' equity to total assets |
|
| 9.68 | % |
|
| 9.48 | % |
|
| 10.16 | % |
|
| 10.40 | % |
|
| 11.41 | % |
Tangible common equity to tangible assets |
|
| 8.68 | % |
|
| 8.44 | % |
|
| 9.05 | % |
|
| 9.23 | % |
|
| 8.00 | % |
|
|
|
|
|
|
|
|
|
|
|
|
|
|
|
|
|
|
|
|
|
Total average stockholders' equity |
| $ | 404,039 |
|
| $ | 395,638 |
|
| $ | 409,572 |
|
| $ | 483,088 |
|
| $ | 483,605 |
|
Less: average intangible assets |
|
| 47,334 |
|
|
| 48,376 |
|
|
| 54,547 |
|
|
| 154,049 |
|
|
| 156,194 |
|
Average tangible common equity |
| $ | 356,705 |
|
| $ | 347,262 |
|
| $ | 355,025 |
|
| $ | 329,039 |
|
| $ | 327,411 |
|
Net income (loss) allocable to common stockholders |
| $ | 15,166 |
|
| $ | 15,075 |
|
| $ | 12,488 |
|
| $ | (90,405 | ) |
| $ | 1,689 |
|
Add: goodwill impairment |
|
| — |
|
|
| — |
|
|
| — |
|
|
| 104,831 |
|
|
| — |
|
Less: tax effect of goodwill impairment |
|
| — |
|
|
| — |
|
|
| — |
|
|
| 5,305 |
|
|
| — |
|
Adjusted net income (loss) plus goodwill impairment |
|
| 15,166 |
|
|
| 15,075 |
|
|
| 12,488 |
|
|
| 9,121 |
|
|
| 1,689 |
|
Amortization of intangible assets |
|
| 1,041 |
|
|
| 1,045 |
|
|
| 1,055 |
|
|
| 1,043 |
|
|
| 986 |
|
Less: tax effect of intangible assets amortization |
|
| 219 |
|
|
| 219 |
|
|
| 222 |
|
|
| 234 |
|
|
| 207 |
|
Adjusted net income (loss) allocable to common stockholders |
| $ | 15,988 |
|
| $ | 15,901 |
|
| $ | 13,321 |
|
| $ | 9,930 |
|
| $ | 2,468 |
|
Return on total average stockholders' equity (ROAE) annualized |
|
| 15.06 | % |
|
| 15.45 | % |
|
| 12.13 | % |
|
| (74.45 | )% |
|
| 1.40 | % |
Return on average tangible common equity (ROATCE) annualized |
|
| 17.98 | % |
|
| 18.57 | % |
|
| 14.93 | % |
|
| (108.31 | )% |
|
| 3.03 | % |
Adjusted return on average tangible common equity |
|
| 17.98 | % |
|
| 18.57 | % |
|
| 14.93 | % |
|
| 12.01 | % |
|
| 3.03 | % |
|
|
|
|
|
|
|
|
|
|
|
|
|
|
|
|
|
|
|
|
|
Non-interest expense |
| $ | 25,806 |
|
| $ | 24,881 |
|
| $ | 28,460 |
|
| $ | 130,835 |
|
| $ | 23,937 |
|
Equity Bancshares, Inc.
PRESS RELEASE - 07/19/2021
Less: merger expense |
|
| 460 |
|
|
| 152 |
|
|
| 299 |
|
|
| — |
|
|
| — |
|
Less: goodwill impairment |
|
| — |
|
|
| — |
|
|
| — |
|
|
| 104,831 |
|
|
| — |
|
Non-interest expense, excluding merger expense and goodwill impairment |
| $ | 25,346 |
|
| $ | 24,729 |
|
| $ | 28,161 |
|
| $ | 26,004 |
|
| $ | 23,937 |
|
Net interest income |
| $ | 34,630 |
|
| $ | 31,759 |
|
| $ | 35,559 |
|
| $ | 32,107 |
|
| $ | 32,891 |
|
Non-interest income |
|
| 9,100 |
|
|
| 6,712 |
|
|
| 8,500 |
|
|
| 6,485 |
|
|
| 5,732 |
|
Less: net gain on acquisition |
|
| 663 |
|
|
| (78 | ) |
|
| 2,145 |
|
|
| — |
|
|
| — |
|
Less: net gains (losses) from securities transactions |
|
| — |
|
|
| 17 |
|
|
| (1 | ) |
|
| — |
|
|
| 4 |
|
Non-interest income, excluding gains (losses) from securities transactions |
| $ | 8,437 |
|
| $ | 6,773 |
|
| $ | 6,356 |
|
| $ | 6,485 |
|
| $ | 5,728 |
|
Net interest income plus non-interest income, excluding net gain on acquisition and net gains (losses) from securities transactions |
| $ | 43,067 |
|
| $ | 38,532 |
|
| $ | 41,915 |
|
| $ | 38,592 |
|
| $ | 38,619 |
|
Non-interest expense less goodwill impairment to net interest income plus non-interest income |
|
| 59.01 | % |
|
| 64.67 | % |
|
| 64.60 | % |
|
| 67.38 | % |
|
| 61.98 | % |
Efficiency ratio |
|
| 58.85 | % |
|
| 64.18 | % |
|
| 67.19 | % |
|
| 67.38 | % |
|
| 61.98 | % |
Net income (loss) allocable to common stockholders |
| $ | 15,166 |
|
| $ | 15,075 |
|
| $ | 12,488 |
|
| $ | (90,405 | ) |
| $ | 1,689 |
|
Add: income tax provision |
|
| 4,415 |
|
|
| 4,271 |
|
|
| 2,111 |
|
|
| (2,653 | ) |
|
| 497 |
|
Add: provision (reversal) of credit losses |
|
| (1,657 | ) |
|
| (5,756 | ) |
|
| 1,000 |
|
|
| 815 |
|
|
| 12,500 |
|
Add: goodwill impairment |
|
| — |
|
|
| — |
|
|
| — |
|
|
| 104,831 |
|
|
| — |
|
Adjusted net income |
| $ | 17,924 |
|
| $ | 13,590 |
|
| $ | 15,599 |
|
| $ | 12,588 |
|
| $ | 14,686 |
|
Total average assets |
| $ | 4,231,439 |
|
| $ | 4,143,752 |
|
| $ | 3,910,628 |
|
| $ | 4,041,187 |
|
| $ | 4,159,336 |
|
Total average stockholders' equity |
| $ | 404,039 |
|
| $ | 395,638 |
|
| $ | 409,572 |
|
| $ | 483,088 |
|
| $ | 483,605 |
|
Return on average assets (ROAA) annualized |
|
| 1.44 | % |
|
| 1.48 | % |
|
| 1.27 | % |
|
| (8.90 | )% |
|
| 0.16 | % |
Adjusted return on average assets |
|
| 1.70 | % |
|
| 1.33 | % |
|
| 1.59 | % |
|
| 1.24 | % |
|
| 1.42 | % |
Adjusted return on average equity |
|
| 17.79 | % |
|
| 13.93 | % |
|
| 15.15 | % |
|
| 10.37 | % |
|
| 12.21 | % |

Second Quarter 2021 Results Presentation July 19, 2021 Exhibit 99.2
Disclaimers Special Note Concerning Forward-Looking Statements This press release contains “forward-looking statements” within the meaning of Section 27A of the Securities Act of 1933, as amended, and Section 21E of the Securities Exchange Act of 1934, as amended. These forward-looking statements reflect the current views of Equity’s management with respect to, among other things, future events and Equity’s financial performance. These statements are often, but not always, made through the use of words or phrases such as “may,” “should,” “could,” “predict,” “potential,” “believe,” “will likely result,” “expect,” “continue,” “will,” “anticipate,” “seek,” “estimate,” “intend,” “plan,” “project,” “forecast,” “goal,” “target,” “would” and “outlook,” or the negative variations of those words or other comparable words of a future or forward-looking nature. These forward-looking statements are not historical facts, and are based on current expectations, estimates and projections about Equity’s industry, management’s beliefs and certain assumptions made by management, many of which, by their nature, are inherently uncertain and beyond Equity’s control. Accordingly, Equity cautions you that any such forward-looking statements are not guarantees of future performance and are subject to risks, assumptions and uncertainties that are difficult to predict. Although Equity believes that the expectations reflected in these forward-looking statements are reasonable as of the date made, actual results may prove to be materially different from the results expressed or implied by the forward-looking statements. Factors that could cause actual results to differ materially from Equity’s expectations include COVID-19 related impacts; competition from other financial institutions and bank holding companies; the effects of and changes in trade, monetary and fiscal policies and laws, including interest rate policies of the Federal Reserve Board; changes in the demand for loans; fluctuations in value of collateral and loan reserves; inflation, interest rate, market and monetary fluctuations; changes in consumer spending, borrowing and savings habits; and acquisitions and integration of acquired businesses; and similar variables. The foregoing list of factors is not exhaustive. For discussion of these and other risks that may cause actual results to differ from expectations, please refer to “Cautionary Note Regarding Forward-Looking Statements” and “Risk Factors” in Equity’s Annual Report on Form 10-K filed with the Securities and Exchange Commission on March 9, 2021, and any updates to those risk factors set forth in Equity’s subsequent Quarterly Reports on Form 10-Q or Current Reports on Form 8-K. If one or more events related to these or other risks or uncertainties materialize, or if Equity’s underlying assumptions prove to be incorrect, actual results may differ materially from what Equity anticipates. Accordingly, you should not place undue reliance on any such forward-looking statements. Any forward-looking statement speaks only as of the date on which it is made, and Equity does not undertake any obligation to publicly update or review any forward-looking statement, whether as a result of new information, future developments or otherwise. New risks and uncertainties arise from time to time, such as COVID-19, and it is not possible for us to predict those events or how they may affect us. In addition, Equity cannot assess the impact of each factor on Equity’s business or the extent to which any factor, or combination of factors, may cause actual results to differ materially from those contained in any forward-looking statements. All forward-looking statements, expressed or implied, included in this press release are expressly qualified in their entirety by this cautionary statement. This cautionary statement should also be considered in connection with any subsequent written or oral forward-looking statements that Equity or persons acting on Equity’s behalf may issue. NON-GAAP FINANCIAL MEASURES This presentation contains certain non-GAAP financial measures intended to supplement, not substitute for, comparable GAAP measures. Reconciliations of non-GAAP financial measures to GAAP financial measures are provided at the end of this presentation. Numbers in the presentation may not sum due to rounding.
Disclaimers Important Additional Information The information contained herein does not constitute an offer to sell or a solicitation of an offer to buy any securities or a solicitation of any vote or approval. In connection with the proposed transaction, Equity intends to file with the Securities and Exchange Commission (“SEC”) a registration statement on Form S-4 to register the shares of Equity common stock to be issued to ASB stockholders. The registration statement will include a proxy statement/prospectus, which will be sent to the stockholders of ASB seeking their approval of the proposed transaction. WE URGE INVESTORS AND SECURITY HOLDERS TO READ THE REGISTRATION STATEMENT ON FORM S-4, THE PROXY STATEMENT/PROSPECTUS INCLUDED WITHIN THE REGISTRATION STATEMENT ON FORM S-4 AND ANY OTHER RELEVANT DOCUMENTS TO BE FILED WITH THE SEC IN CONNECTION WITH THE PROPOSED TRANSACTION BECAUSE THEY CONTAIN IMPORTANT INFORMATION ABOUT EQUITY, ASB AND THE PROPOSED TRANSACTION. The documents filed by Equity with the SEC may be obtained free of charge at Equity’s investor relations website at investor.equitybank.com or at the SEC’s website at www.sec.gov. Alternatively, these documents, when available, can be obtained free of charge from Equity upon written request to Equity Bancshares, Inc., Attn: Investor Relations, 7701 East Kellogg Drive, Suite 300, Wichita, Kansas 67207 or by calling (316) 612-6000. Participants in the Transaction Equity, ASB and certain of their respective directors and executive officers may be deemed to be participants in the solicitation of proxies from ASB’s stockholders in connection with the proposed transaction under the rules of the SEC. Information about the directors and executive officers of Equity is set forth in the proxy statement for Equity’s 2021 annual meeting of stockholders filed with the SEC on Schedule 14A on March 18, 2021, and Equity’s annual report on Form 10-K for the year ended December 31, 2020 filed with the SEC on March 9, 2021. Free copies of these documents may be obtained free of charge as described in the preceding paragraph. Additional information regarding the interests of these participants and other persons who may be deemed participants in the transaction may be obtained by reading the proxy statement/prospectus regarding the proposed transaction when it becomes available.
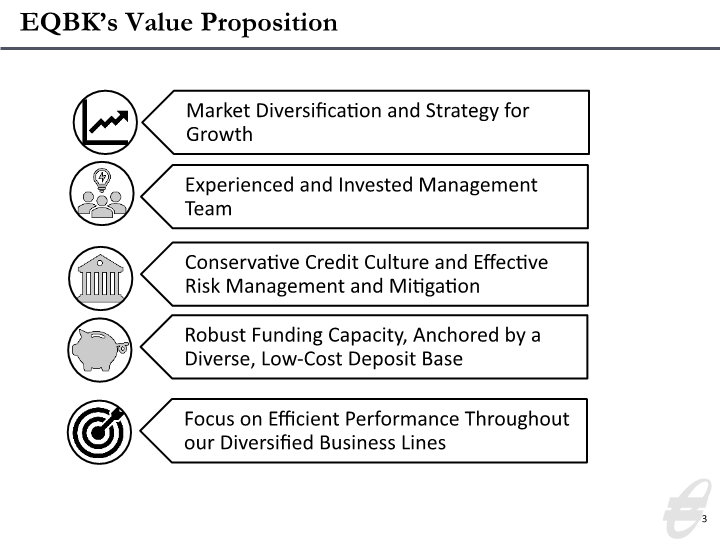
EQBK’s Value Proposition 3
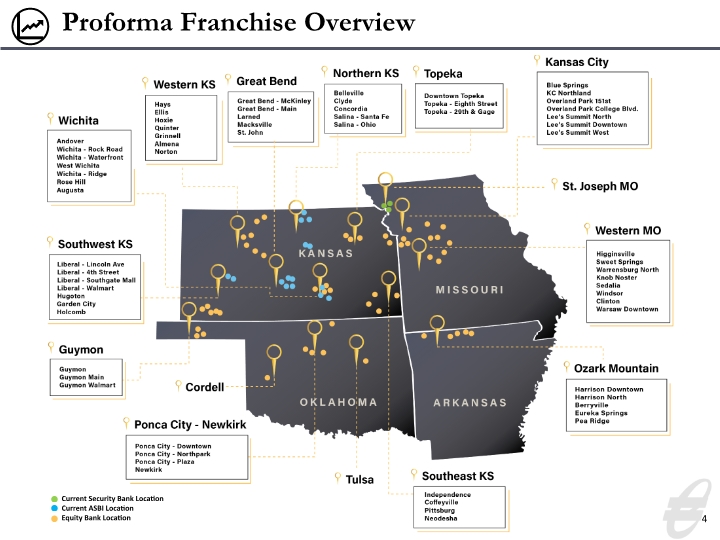
Proforma Franchise Overview 4 Current Security Bank Location Current ASBI Location Equity Bank Location
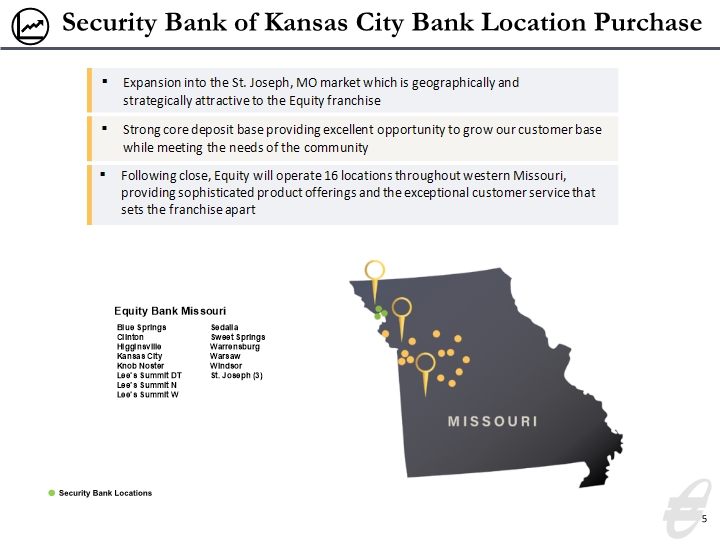
Security Bank of Kansas City Bank Location Purchase 5 Security Bank Locations

Executive Leadership 6 Founded Equity Bank in 2002 2018 EY Entrepreneur of the Year National Finalist 2014 Most Influential CEO, Wichita Business Journal Served as Regional President of Sunflower Bank prior to forming Equity Bank Served as Director of Sales and Marketing for Koch Industries Brad Elliott Chairman & CEO Years at Equity: 19 | Years in Banking: 32 Greg Kossover EVP, COO & CFO Became COO in April 2020 Served as CFO from 2013 to 2020 EQBK Board of Directors, 2011-current Served as president of Physicians Development Group Served as CEO of Value Place, LLC, growing the franchise to more than 150 locations in 25 states Greg Kossover Chief Operating Officer Years at Equity: 8 | Years in Banking: 21 Eric Newell Chief Financial Officer Years at Equity 1 | Years in Banking: 19 Craig Anderson President Years at Equity: 3 | Years in Banking: 39 Became President in April 2020 Served as COO from 2018 to 2020 Joined Equity Bank in March 2018 Served as President of UMBF Commercial Banking More than 38 years of banking experience, concentrated in commercial lending roles Joined Equity Bank in April 2020 Served as CFO at United Bank in Hartford, CT ($7.3B assets) Served as CFO and head of Treasury at Rockville Bank, Glastonbury, Conn. Served as Analyst for AllianceBernstein and Fitch Began career as examiner with FDIC
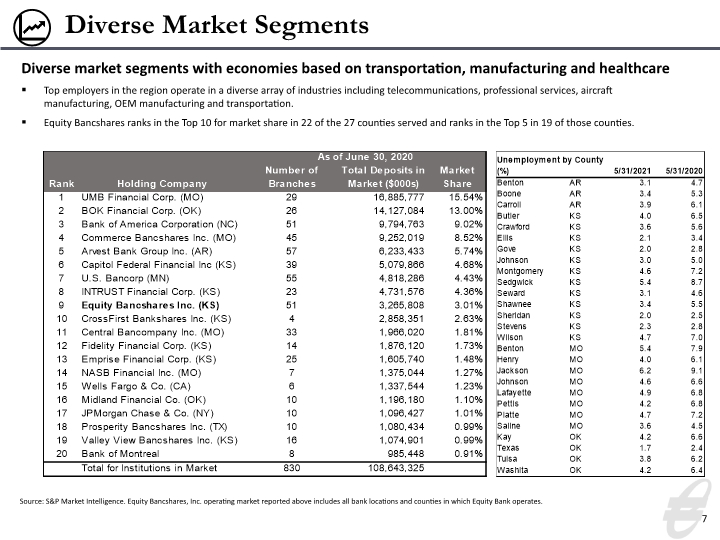
Diverse Market Segments 7 Source: S&P Market Intelligence. Equity Bancshares, Inc. operating market reported above includes all bank locations and counties in which Equity Bank operates. Diverse market segments with economies based on transportation, manufacturing and healthcare Top employers in the region operate in a diverse array of industries including telecommunications, professional services, aircraft manufacturing, OEM manufacturing and transportation. Equity Bancshares ranks in the Top 10 for market share in 22 of the 27 counties served and ranks in the Top 5 in 19 of those counties.
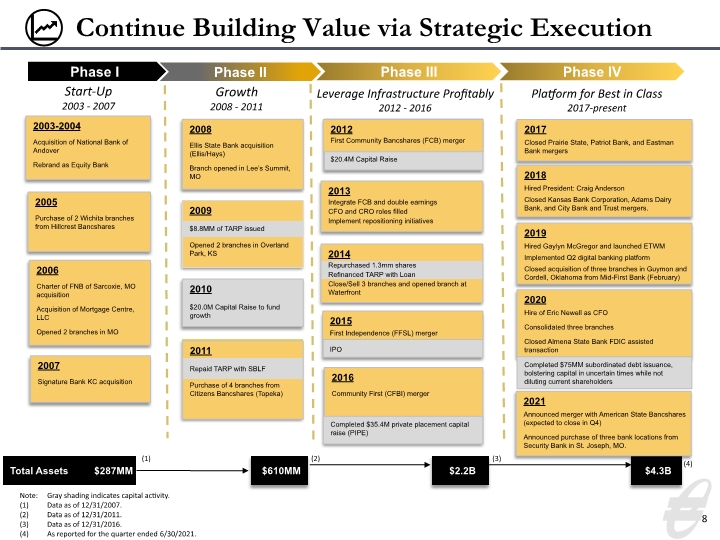
Continue Building Value via Strategic Execution 8 2009 $8.8MM of TARP issued Opened 2 branches in Overland Park, KS 2014 Repurchased 1.3mm shares Refinanced TARP with Loan Close/Sell 3 branches and opened branch at Waterfront 2012 First Community Bancshares (FCB) merger $20.4M Capital Raise 2011 Repaid TARP with SBLF Purchase of 4 branches from Citizens Bancshares (Topeka) 2003-2004 Acquisition of National Bank of Andover Rebrand as Equity Bank 2005 Purchase of 2 Wichita branches from Hillcrest Bancshares 2006 Charter of FNB of Sarcoxie, MO acquisition Acquisition of Mortgage Centre, LLC Opened 2 branches in MO 2008 Ellis State Bank acquisition (Ellis/Hays) Branch opened in Lee’s Summit, MO 2010 $20.0M Capital Raise to fund growth 2013 Integrate FCB and double earnings CFO and CRO roles filled Implement repositioning initiatives 2007 Signature Bank KC acquisition Phase I Phase II Phase III Start-Up 2003 - 2007 Growth 2008 - 2011 Leverage Infrastructure Profitably 2012 - 2016 2015 First Independence (FFSL) merger IPO 2016 Community First (CFBI) merger Completed $35.4M private placement capital raise (PIPE) Phase IV Platform for Best in Class 2017-present 2017 Closed Prairie State, Patriot Bank, and Eastman Bank mergers $2.2B $610MM (1) (2) (3) $4.3B (4) 2018 Hired President: Craig Anderson Closed Kansas Bank Corporation, Adams Dairy Bank, and City Bank and Trust mergers. 2019 Hired Gaylyn McGregor and launched ETWM Implemented Q2 digital banking platform Closed acquisition of three branches in Guymon and Cordell, Oklahoma from Mid-First Bank (February) 2020 Hire of Eric Newell as CFO Consolidated three branches Closed Almena State Bank FDIC assisted transaction Note: Gray shading indicates capital activity. (1) Data as of 12/31/2007. (2) Data as of 12/31/2011. (3) Data as of 12/31/2016. (4) As reported for the quarter ended 6/30/2021. Completed $75MM subordinated debt issuance, bolstering capital in uncertain times while not diluting current shareholders 2021 Announced merger with American State Bancshares (expected to close in Q4) Announced purchase of three bank locations from Security Bank in St. Joseph, MO.
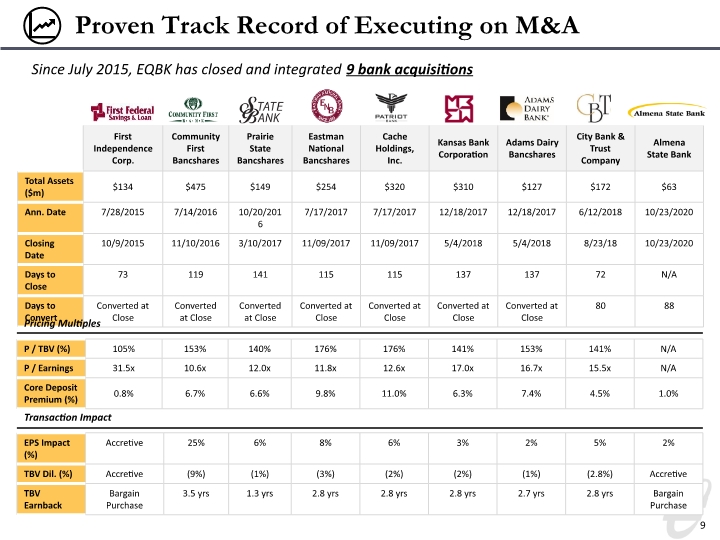
9 Proven Track Record of Executing on M&A Since July 2015, EQBK has closed and integrated 9 bank acquisitions Pricing Multiples Transaction Impact
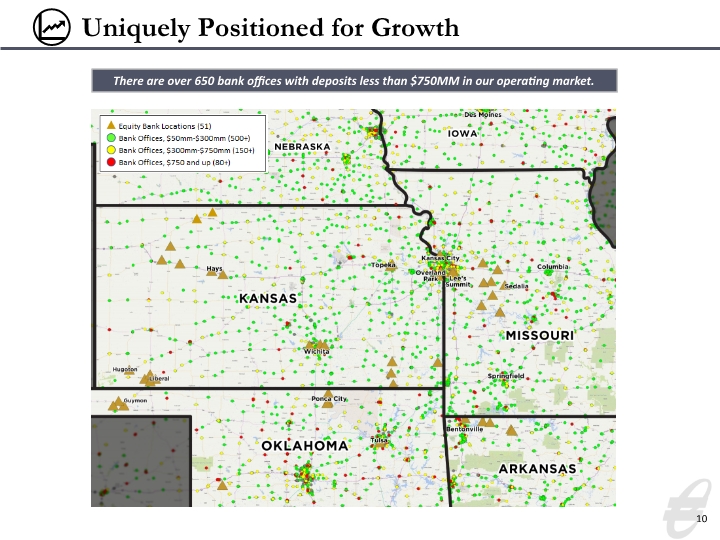
10 Uniquely Positioned for Growth There are over 650 bank offices with deposits less than $750MM in our operating market.
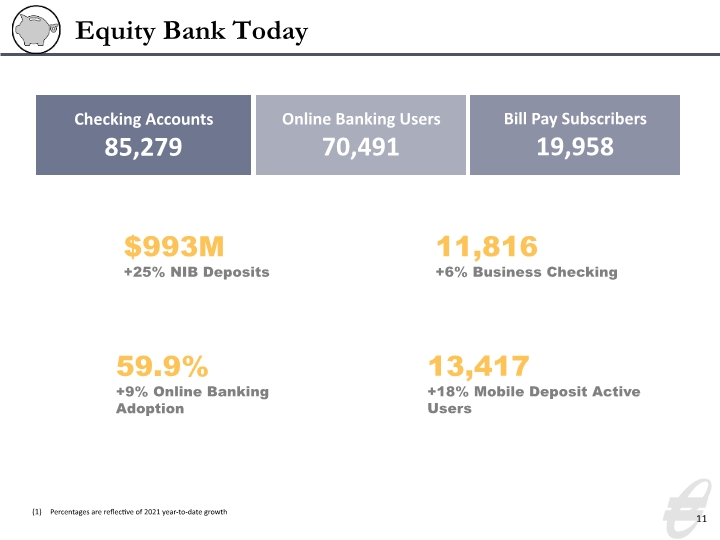
11 Equity Bank Today Percentages are reflective of 2021 year-to-date growth Checking Accounts 85,279 Online Banking Users 70,491 Bill Pay Subscribers 19,958 $993M +25% NIB Deposits 11,816 +6% Business Checking 59.9% +9% Online Banking Adoption 13,417 +18% Mobile Deposit Active Users
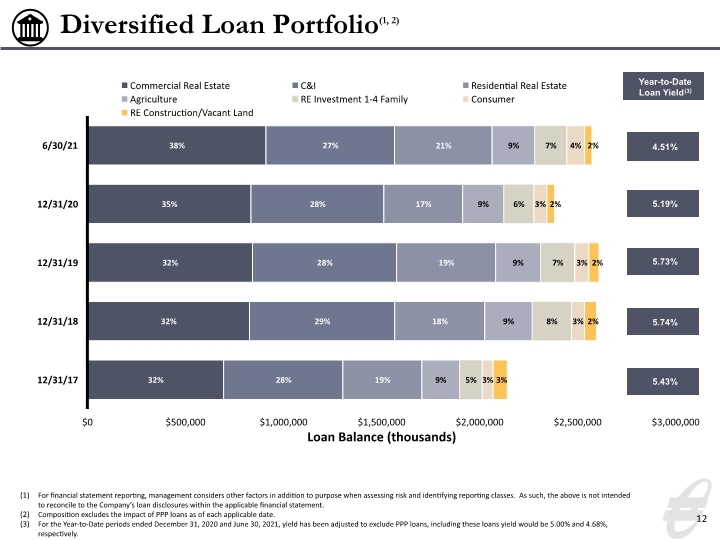
Diversified Loan Portfolio(1, 2) 12 Year-to-Date Loan Yield(3) 4.51% 5.43% 5.74% 5.73% For financial statement reporting, management considers other factors in addition to purpose when assessing risk and identifying reporting classes. As such, the above is not intended to reconcile to the Company’s loan disclosures within the applicable financial statement. Composition excludes the impact of PPP loans as of each applicable date. For the Year-to-Date periods ended December 31, 2020 and June 30, 2021, yield has been adjusted to exclude PPP loans, including these loans yield would be 5.00% and 4.68%, respectively. 5.19%

Credit Quality & Capital Ratios 13 Non-GAAP financial measure. See the non-GAAP reconciliation at the end of this presentation. (1) Capital Ratios Total Reserve Ratio Classified Assets
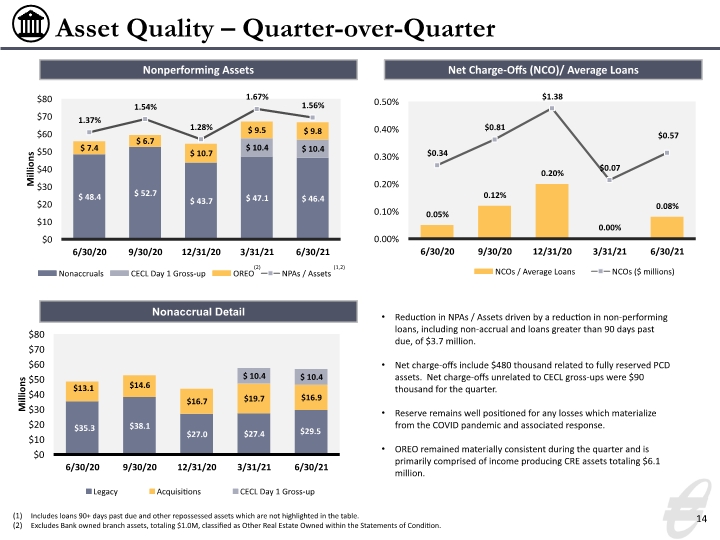
Asset Quality – Quarter-over-Quarter 14 Nonperforming Assets Net Charge-Offs (NCO)/ Average Loans Nonaccrual Detail Includes loans 90+ days past due and other repossessed assets which are not highlighted in the table. Excludes Bank owned branch assets, totaling $1.0M, classified as Other Real Estate Owned within the Statements of Condition. (1,2) Reduction in NPAs / Assets driven by a reduction in non-performing loans, including non-accrual and loans greater than 90 days past due, of $3.7 million. Net charge-offs include $480 thousand related to fully reserved PCD assets. Net charge-offs unrelated to CECL gross-ups were $90 thousand for the quarter. Reserve remains well positioned for any losses which materialize from the COVID pandemic and associated response. OREO remained materially consistent during the quarter and is primarily comprised of income producing CRE assets totaling $6.1 million. (2)
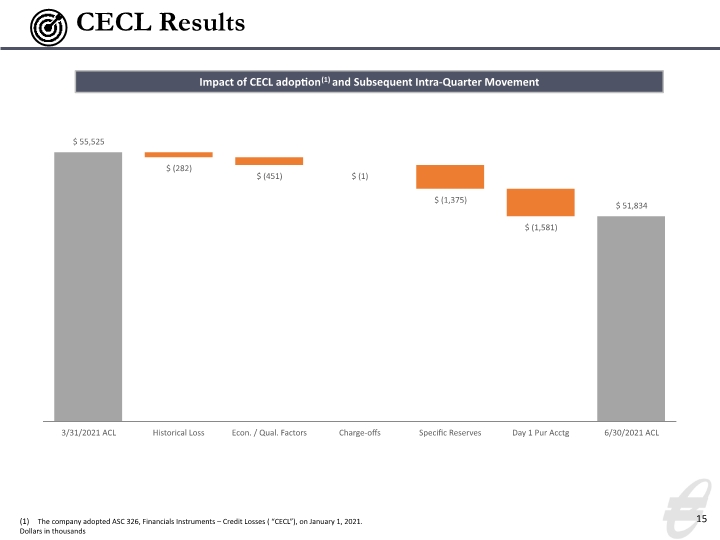
CECL Results 15 The company adopted ASC 326, Financials Instruments – Credit Losses ( “CECL”), on January 1, 2021. Dollars in thousands Impact of CECL adoption(1) and Subsequent Intra-Quarter Movement
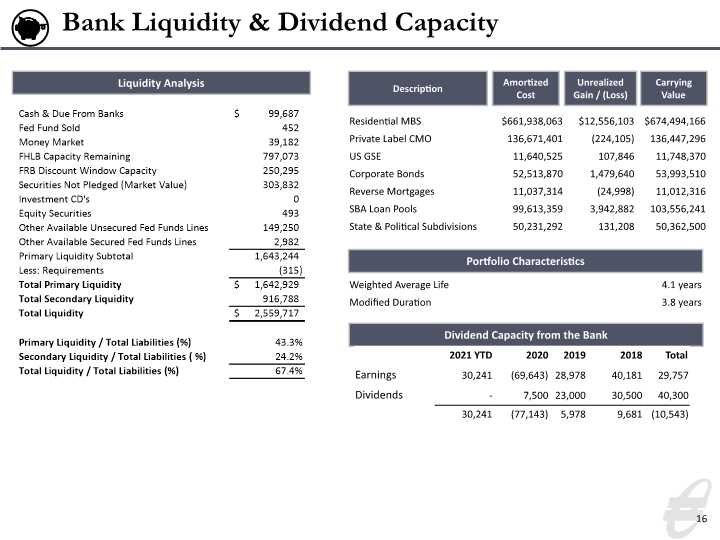
Bank Liquidity & Dividend Capacity 16 Dividend Capacity from the Bank Liquidity Analysis Amortized Cost Carrying Value Unrealized Gain / (Loss) Description Portfolio Characteristics
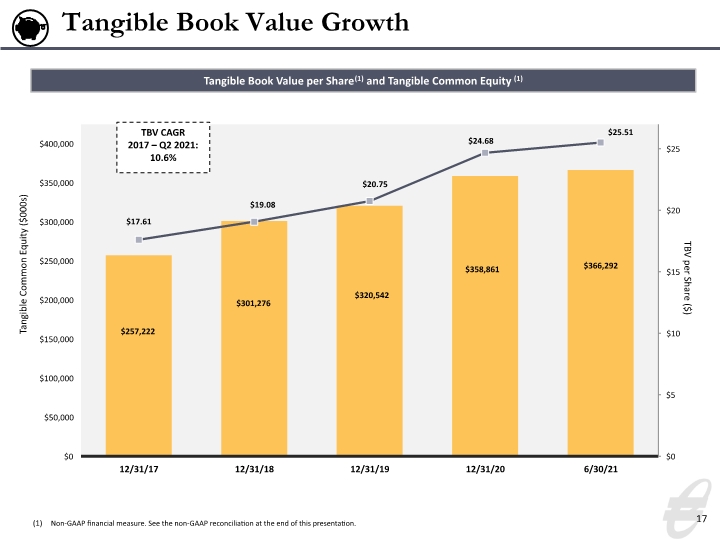
Tangible Book Value Growth 17 Tangible Book Value per Share(1) and Tangible Common Equity (1) TBV CAGR 2017 – Q2 2021: 10.6% Non-GAAP financial measure. See the non-GAAP reconciliation at the end of this presentation.

Tangible Book Value 18 Tangible Book Value per Share(1) Intra-Quarter movement Non-GAAP financial measure. See the non-GAAP reconciliation at the end of this presentation.
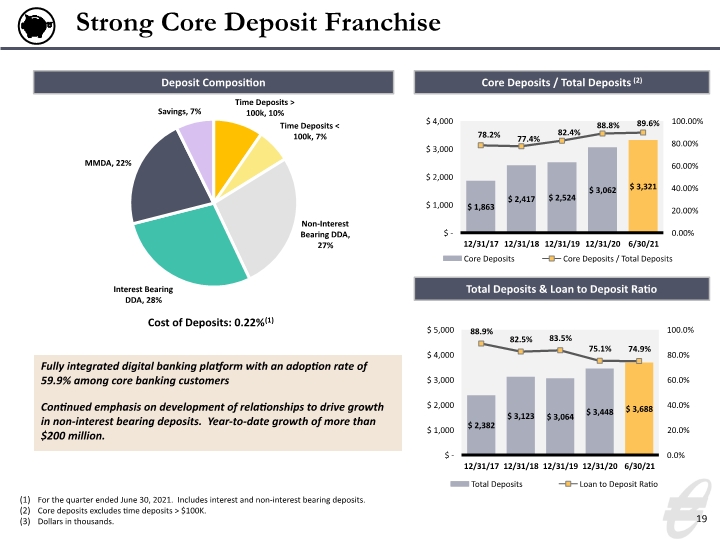
Fully integrated digital banking platform with an adoption rate of 59.9% among core banking customers Continued emphasis on development of relationships to drive growth in non-interest bearing deposits. Year-to-date growth of more than $200 million. 19 Strong Core Deposit Franchise For the quarter ended June 30, 2021. Includes interest and non-interest bearing deposits. Core deposits excludes time deposits > $100K. Dollars in thousands. Cost of Deposits: 0.22%(1) Deposit Composition Core Deposits / Total Deposits (2) Total Deposits & Loan to Deposit Ratio
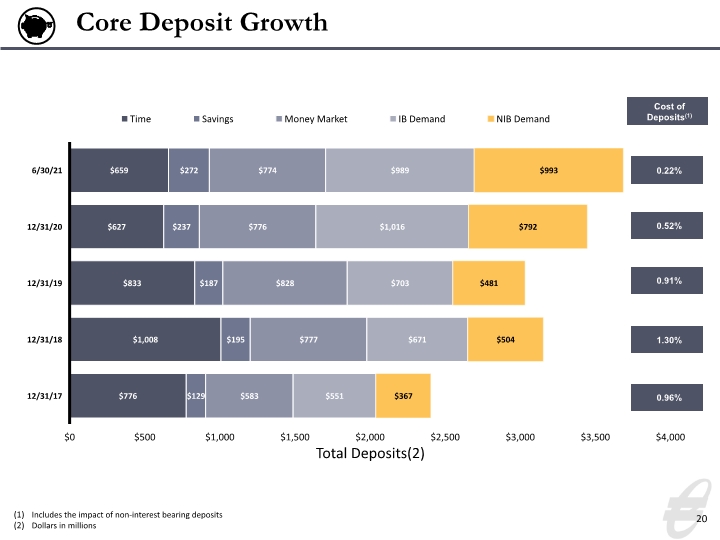
20 Core Deposit Growth Includes the impact of non-interest bearing deposits Dollars in millions Cost of Deposits(1) 0.22% 0.96% 1.30% 0.91% 0.52%
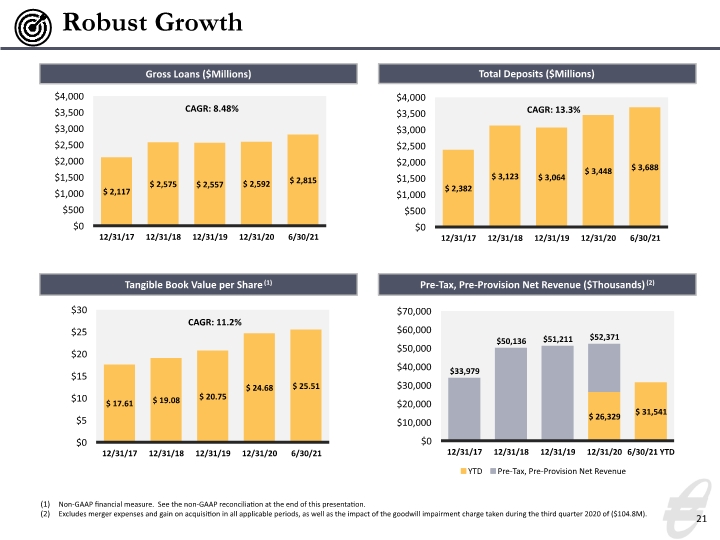
Robust Growth 21 Gross Loans ($Millions) Total Deposits ($Millions) Tangible Book Value per Share(1) Pre-Tax, Pre-Provision Net Revenue ($Thousands)(2) Non-GAAP financial measure. See the non-GAAP reconciliation at the end of this presentation. Excludes merger expenses and gain on acquisition in all applicable periods, as well as the impact of the goodwill impairment charge taken during the third quarter 2020 of ($104.8M).

Net Interest Income & Net Interest Margin 22 ($) Thousands (1) (1) (1) Excludes the impact of PPP loans. Including these balances the second, third, fourth quarter 2020, first and second quarter 2021 results would be 3.49%, 3.47%, 3.88%, 3.31% and 3.50%, respectively, while YTD 2020 and 2021 results would be 3.63% and 3.41%, respectively. Annual Results
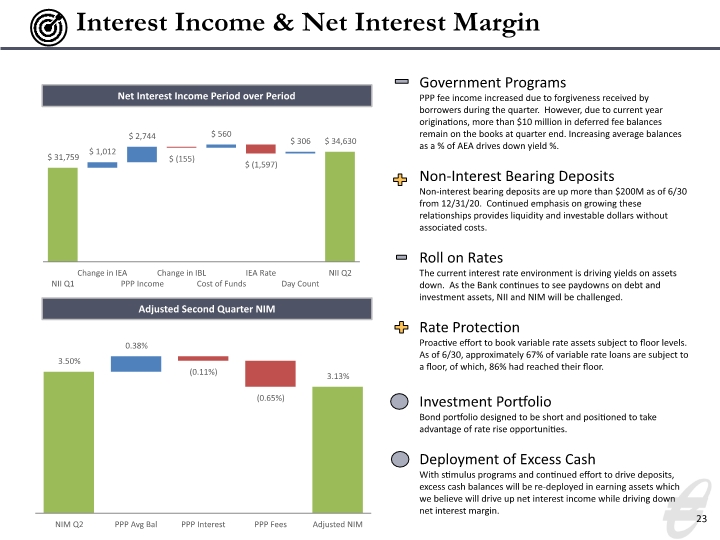
Interest Income & Net Interest Margin 23 Government Programs PPP fee income increased due to forgiveness received by borrowers during the quarter. However, due to current year originations, more than $10 million in deferred fee balances remain on the books at quarter end. Increasing average balances as a % of AEA drives down yield %. Non-Interest Bearing Deposits Non-interest bearing deposits are up more than $200M as of 6/30 from 12/31/20. Continued emphasis on growing these relationships provides liquidity and investable dollars without associated costs. Roll on Rates The current interest rate environment is driving yields on assets down. As the Bank continues to see paydowns on debt and investment assets, NII and NIM will be challenged. Rate Protection Proactive effort to book variable rate assets subject to floor levels. As of 6/30, approximately 67% of variable rate loans are subject to a floor, of which, 86% had reached their floor. Investment Portfolio Bond portfolio designed to be short and positioned to take advantage of rate rise opportunities. Deployment of Excess Cash With stimulus programs and continued effort to drive deposits, excess cash balances will be re-deployed in earning assets which we believe will drive up net interest income while driving down net interest margin. Adjusted Second Quarter NIM Net Interest Income Period over Period
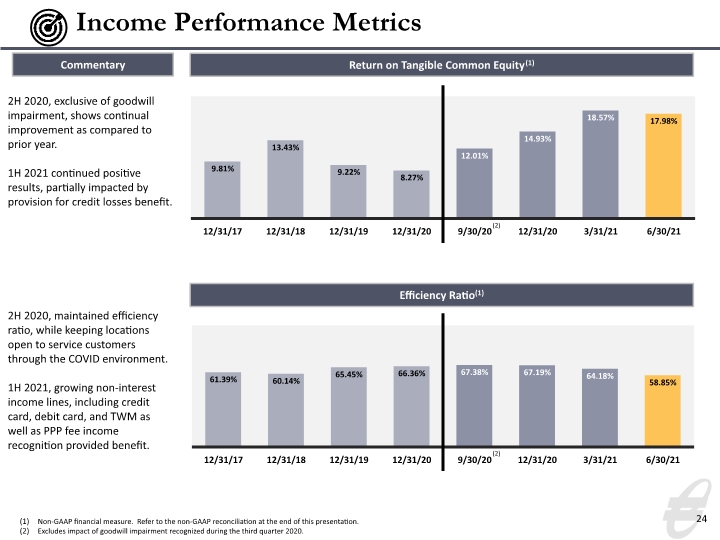
Income Performance Metrics 24 Non-GAAP financial measure. Refer to the non-GAAP reconciliation at the end of this presentation. Excludes impact of goodwill impairment recognized during the third quarter 2020. Return on Tangible Common Equity(1) Efficiency Ratio(1) 2H 2020, exclusive of goodwill impairment, shows continual improvement as compared to prior year. 1H 2021 continued positive results, partially impacted by provision for credit losses benefit. Commentary 2H 2020, maintained efficiency ratio, while keeping locations open to service customers through the COVID environment. 1H 2021, growing non-interest income lines, including credit card, debit card, and TWM as well as PPP fee income recognition provided benefit. (2) (2)
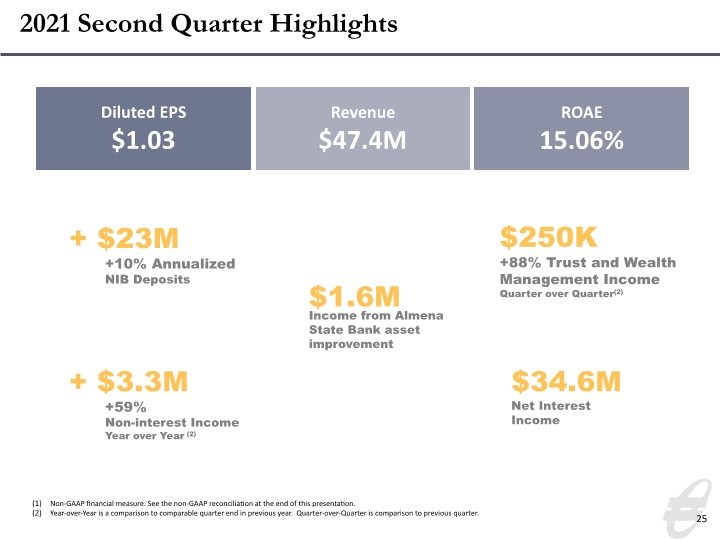
25 2021 Second Quarter Highlights Non-GAAP financial measure. See the non-GAAP reconciliation at the end of this presentation. Year-over-Year is a comparison to comparable quarter end in previous year. Quarter-over-Quarter is comparison to previous quarter. Diluted EPS $1.03 Revenue $47.4M ROAE 15.06% $34.6M Net Interest Income + $23M +10% Annualized NIB Deposits $1.6M Income from Almena State Bank asset improvement $250K +88% Trust and Wealth Management Income Quarter over Quarter(2) + $3.3M +59% Non-interest Income Year over Year(2)
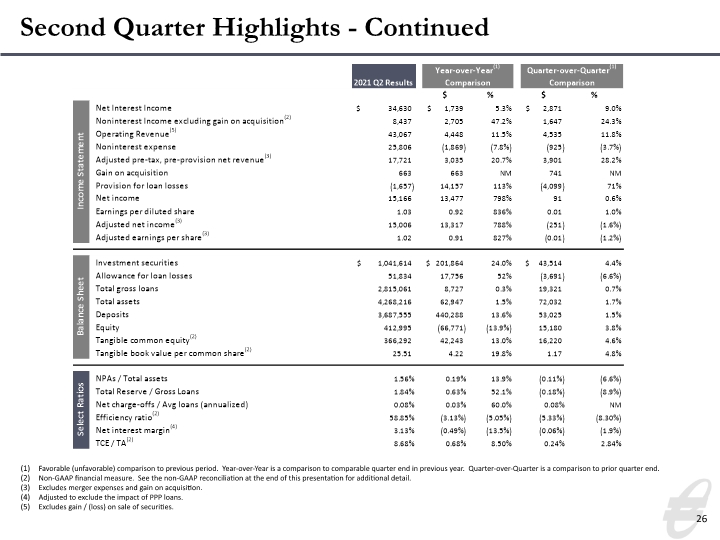
Second Quarter Highlights - Continued 26 Favorable (unfavorable) comparison to previous period. Year-over-Year is a comparison to comparable quarter end in previous year. Quarter-over-Quarter is a comparison to prior quarter end. Non-GAAP financial measure. See the non-GAAP reconciliation at the end of this presentation for additional detail. Excludes merger expenses and gain on acquisition. Adjusted to exclude the impact of PPP loans. Excludes gain / (loss) on sale of securities.
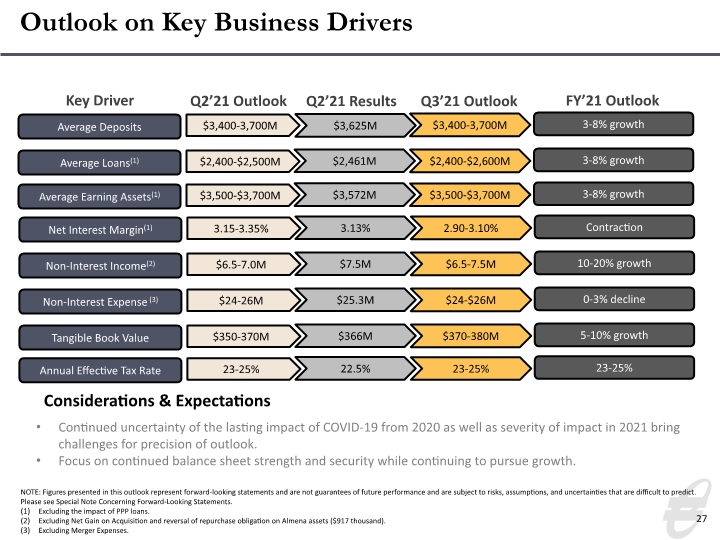
27 Outlook on Key Business Drivers Average Deposits $3,400-3,700M $3,625M 3-8% growth Key Driver Q2’21 Results Q2’21 Outlook Average Loans(1) $2,400-$2,500M $2,461M 3-8% growth Net Interest Margin(1) 3.15-3.35% 3.13% Contraction Non-Interest Income(2) $6.5-7.0M $7.5M 10-20% growth Non-Interest Expense (3) $24-26M $25.3M 0-3% decline Tangible Book Value $350-370M $366M 5-10% growth Considerations & Expectations Continued uncertainty of the lasting impact of COVID-19 from 2020 as well as severity of impact in 2021 bring challenges for precision of outlook. Focus on continued balance sheet strength and security while continuing to pursue growth. FY’21 Outlook NOTE: Figures presented in this outlook represent forward-looking statements and are not guarantees of future performance and are subject to risks, assumptions, and uncertainties that are difficult to predict. Please see Special Note Concerning Forward-Looking Statements. Excluding the impact of PPP loans. Excluding Net Gain on Acquisition and reversal of repurchase obligation on Almena assets ($917 thousand). Excluding Merger Expenses. Average Earning Assets(1) $3,500-$3,700M $3,572M 3-8% growth Annual Effective Tax Rate 23-25% 22.5% 23-25% Q3’21 Outlook $3,400-3,700M $2,400-$2,600M 2.90-3.10% $6.5-7.5M $24-$26M $370-380M $3,500-$3,700M 23-25%
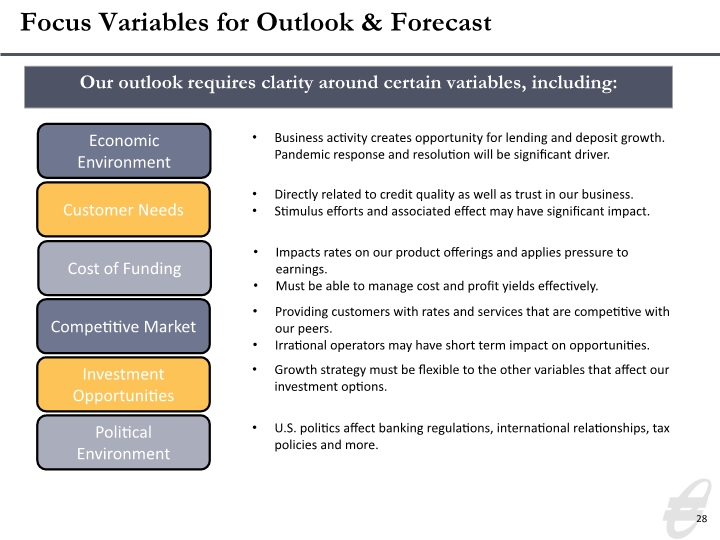
28 Focus Variables for Outlook & Forecast Business activity creates opportunity for lending and deposit growth. Pandemic response and resolution will be significant driver. Directly related to credit quality as well as trust in our business. Stimulus efforts and associated effect may have significant impact. Impacts rates on our product offerings and applies pressure to earnings. Must be able to manage cost and profit yields effectively. Providing customers with rates and services that are competitive with our peers. Irrational operators may have short term impact on opportunities. Growth strategy must be flexible to the other variables that affect our investment options. U.S. politics affect banking regulations, international relationships, tax policies and more. Economic Environment Customer Needs Cost of Funding Competitive Market Investment Opportunities Political Environment Our outlook requires clarity around certain variables, including:
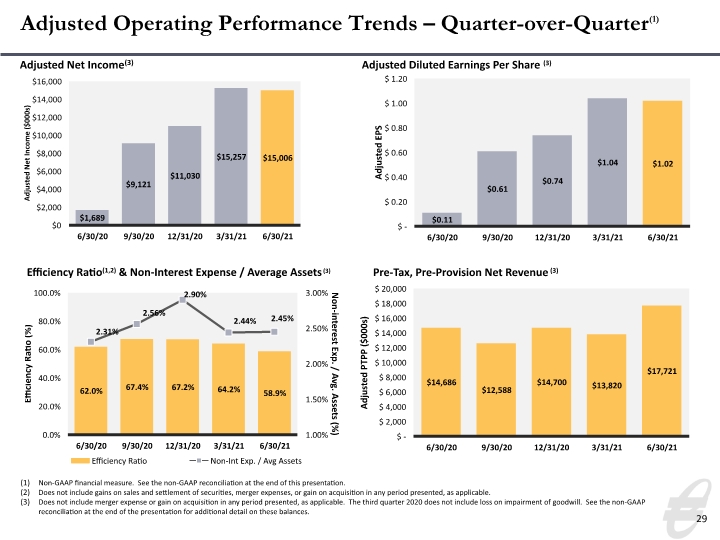
29 Adjusted Operating Performance Trends – Quarter-over-Quarter(1) Adjusted Diluted Earnings Per Share (3) Efficiency Ratio(1,2) & Non-Interest Expense / Average Assets(3) Non-GAAP financial measure. See the non-GAAP reconciliation at the end of this presentation. Does not include gains on sales and settlement of securities, merger expenses, or gain on acquisition in any period presented, as applicable. Does not include merger expense or gain on acquisition in any period presented, as applicable. The third quarter 2020 does not include loss on impairment of goodwill. See the non-GAAP reconciliation at the end of the presentation for additional detail on these balances. Adjusted Net Income(3) Pre-Tax, Pre-Provision Net Revenue(3)
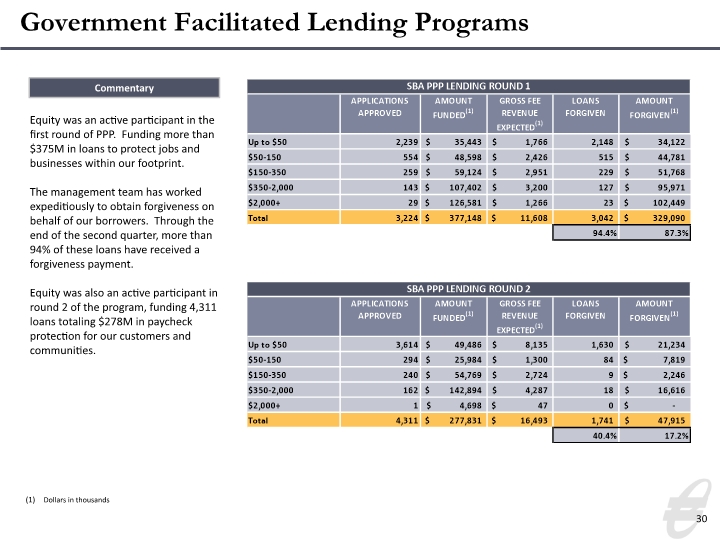
30 Government Facilitated Lending Programs Equity was an active participant in the first round of PPP. Funding more than $375M in loans to protect jobs and businesses within our footprint. The management team has worked expeditiously to obtain forgiveness on behalf of our borrowers. Through the end of the second quarter, more than 94% of these loans have received a forgiveness payment. Equity was also an active participant in round 2 of the program, funding 4,311 loans totaling $278M in paycheck protection for our customers and communities. Commentary Dollars in thousands

Appendix 31
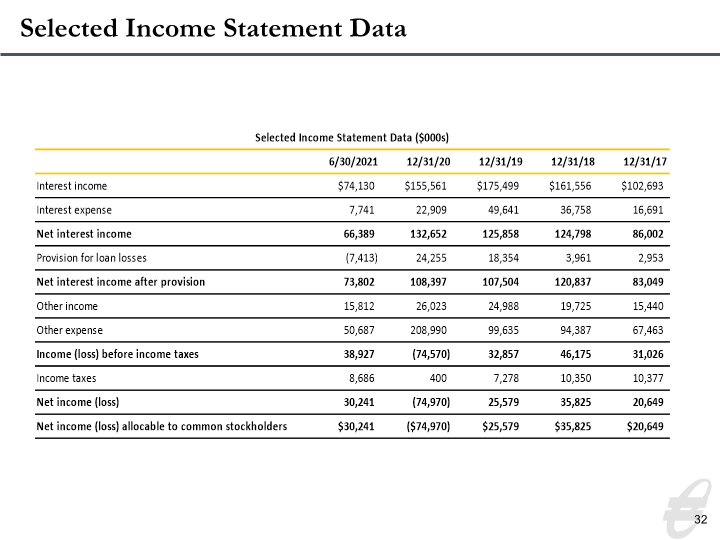
Selected Income Statement Data 32
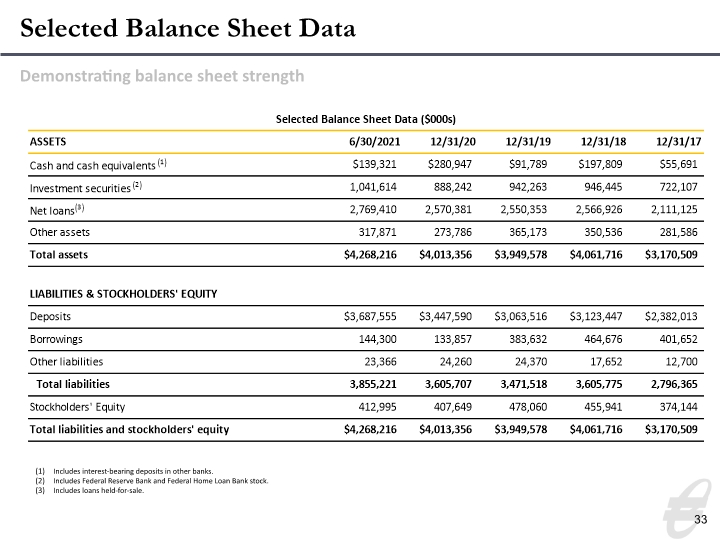
Selected Balance Sheet Data 33 Demonstrating balance sheet strength Includes interest-bearing deposits in other banks. Includes Federal Reserve Bank and Federal Home Loan Bank stock. Includes loans held-for-sale.
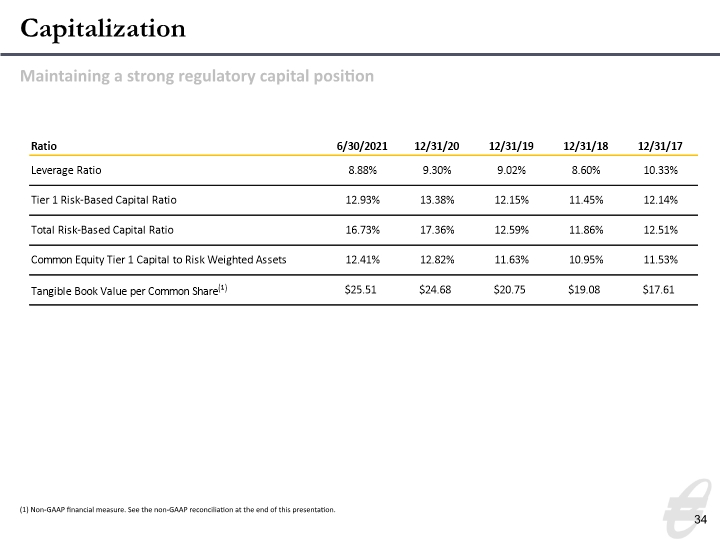
Capitalization 34 (1) Non-GAAP financial measure. See the non-GAAP reconciliation at the end of this presentation. Maintaining a strong regulatory capital position
The subsequent tables present non-GAAP reconciliations of the following calculations: Tangible Common Equity (TCE) to Tangible Assets (TA) Ratio Tangible Book Value per Common Share Return on Average Tangible Common Equity (ROATCE) Efficiency Ratio 35
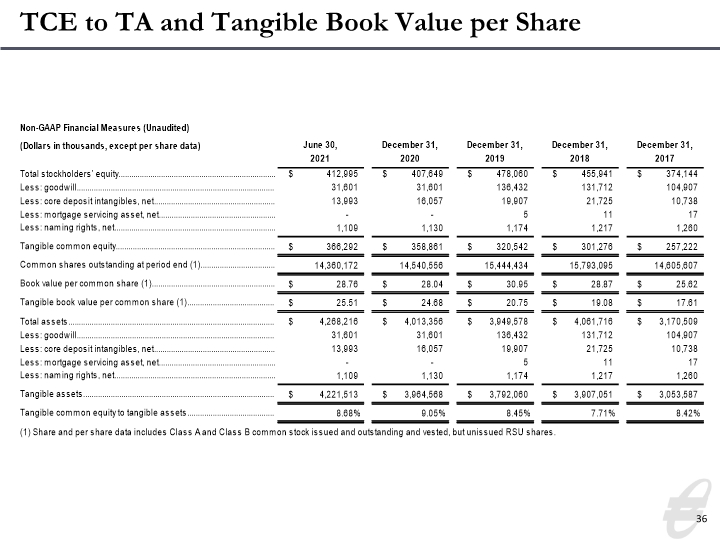
TCE to TA and Tangible Book Value per Share 36
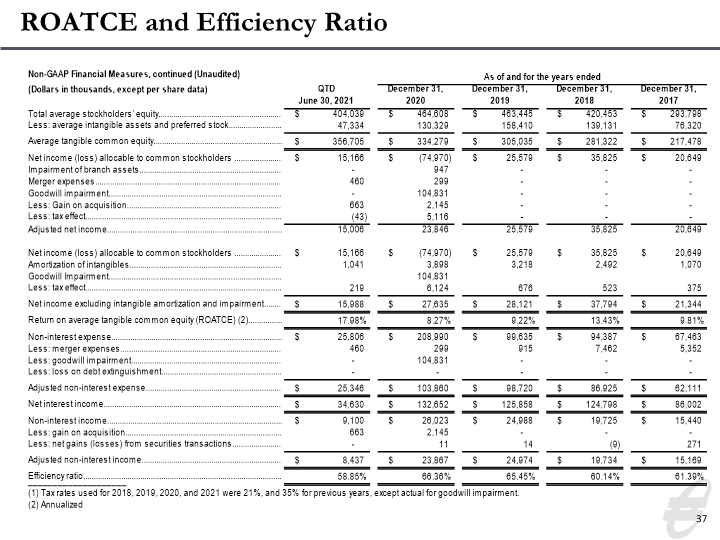
ROATCE and Efficiency Ratio 37

investor.equitybank.com