COWEN MOBILITY DISRUPTION CONFERENCE March 3, 2022

Forward-Looking Statements and Other Disclaimers This presentation may contain forward-looking statements within the meaning of the Private Securities Litigation Reform Act of 1995, including, without limitation, statements about the company’s ability to raise and increase earnings capacity as well as drive and maximize shareholder value; future growth prospects; the company’s strategic priorities, including its ability to build a sustainable culture, deliver on commitments and leverage assets; the company’s ability to sustain and improve operations, including improvements at Goderich mine and Cote Blanche barge dock upgrades, invest in growth, maintain financial stability and credit profile, return capital to shareholders and balance operations with value-creating growth opportunities; the company’s ability to accelerate growth and reduce weather dependency; growth avenues; optimization efforts, including ability to recoup costs, restore productivity, advance mine plan, increase efficiency, reduce costs; lithium resource development, including our ability to leverage existing production and assets, annual production, capacity, emissions footprint, vision, economic assessment, life cycle analysis completion, direct lithium extraction provider selection; market entry, lifecycle, cost competitiveness, delivery lead time and permitting; fire retardant business (Fortress North America) investment, including growth potential, seasonality, ability to leverage asset base, capital needs; product approvals and qualifications and ability to bid, and customers; costs; pricing; margins; profitability; and the company’s outlook for the first half of fiscal 2022 and fiscal 2022, including its expectations regarding adjusted EBITDA, volumes, revenue, EBITDA, corporate and other expense, interest expense, depreciation, depletion and amortization, capital expenditures and tax rates. Forward-looking statements are those that predict or describe future events or trends and that do not relate solely to historical matters. We use words such as “may,” “would,” “could,” “should,” “will,” “likely,” “expect,” “anticipate,” “believe,” “intend,” “plan,” “forecast,” “outlook,” “project,” “estimate” and similar expressions suggesting future outcomes or events to identify forward-looking statements or forward-looking information. These statements are based on the company’s current expectations and involve risks and uncertainties that could cause the company’s actual results to differ materially. he differences could be caused by a number of factors, including without limitation (i) weather conditions, (ii) foreign exchange rates and the cost and availability of transportation for the distribution of the company’s products, (iii) pressure on prices and impact from competitive products, (iv) any inability by the company to successfully implement its strategic priorities or its cost-saving or enterprise optimization initiatives, (v) the risk that the company may not realize the expected financial or other benefits from the proposed development of its lithium mineral resource or its investment in Fortress North America, (vi) the timing and the outcome of the sale process for the company’s South America chemicals business, and (vii) impacts of the COVID-19 pandemic. For further information on these and other risks and uncertainties that may affect the company’s business, see the “Risk Factors” and “Management’s Discussion and Analysis of Financial Condition and Results of Operations” sections of the company’s Transition Report on Form 10-KT for the transition period ended Sept. 30, 2021 and the company’s Quarterly Report on Form 10-Q for the quarter ended December 31, 2021 filed with the SEC, as well as the company’s other SEC filings. The company undertakes no obligation to update any forward-looking statements made in this presentation to reflect future events or developments, except as required by law. Because it is not possible to predict or identify all such factors, this list cannot be considered a complete set of all potential risks or uncertainties. The company has completed an initial assessment to define the lithium resource at Compass Minerals’ existing operations in accordance with applicable SEC regulations, including Subpart 1300. Pursuant to Subpart 1300, mineral resources are not mineral reserves and do not have demonstrated economic viability. The company’s mineral resource estimates, including estimates of the lithium resource, are based on many factors, including assumptions regarding extraction rates and duration of mining operations, and the quality of in-place resources. For example, the process technology for commercial extraction of lithium from brines with low lithium and high impurity (primarily magnesium) is still developing. Accordingly, there is no certainty that all or any part of the lithium mineral resource identified by the company’s initial assessment will be converted into an economically extractable mineral reserve.
AN ESSENTIAL MINERALS COMPANY
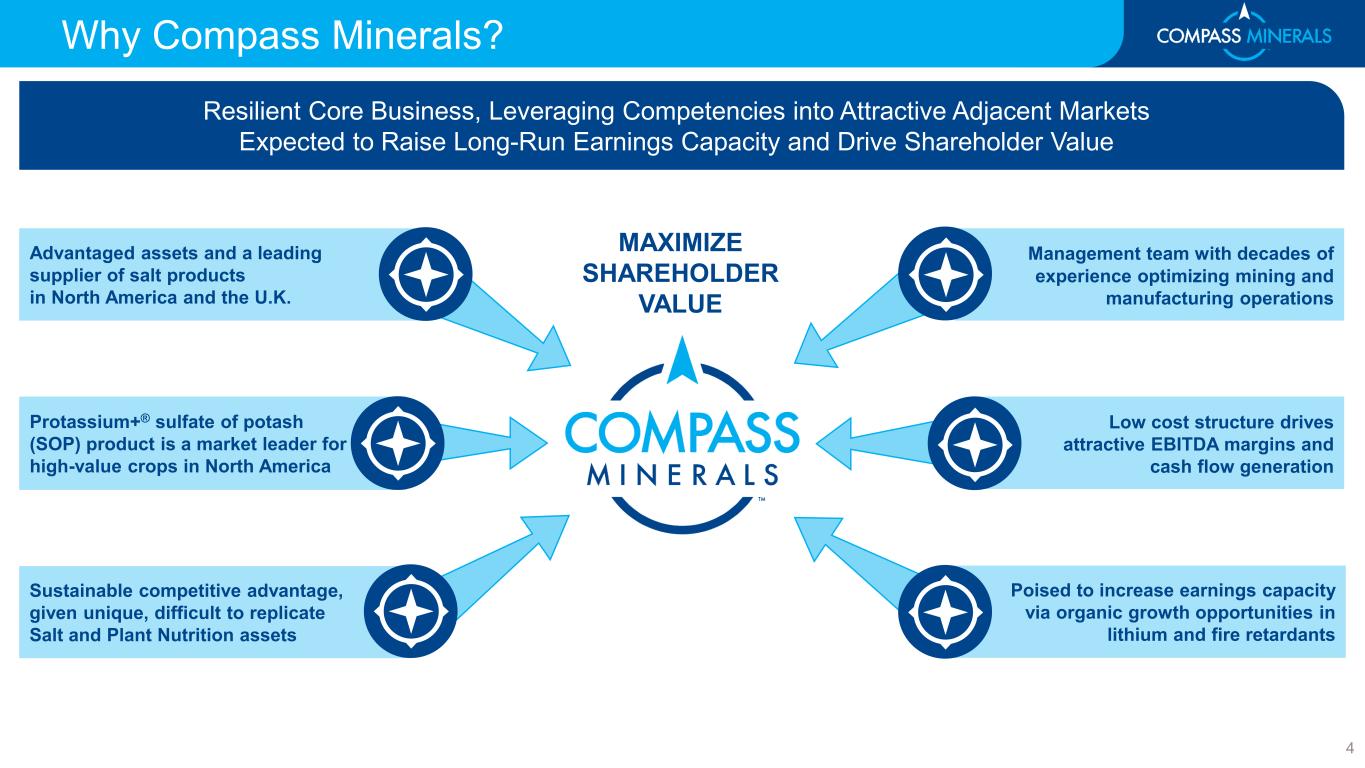
MAXIMIZE SHAREHOLDER VALUE Advantaged assets and a leading supplier of salt products in North America and the U.K. Sustainable competitive advantage, given unique, difficult to replicate Salt and Plant Nutrition assets Protassium+® sulfate of potash (SOP) product is a market leader for high-value crops in North America Management team with decades of experience optimizing mining and manufacturing operations Poised to increase earnings capacity via organic growth opportunities in lithium and fire retardants Low cost structure drives attractive EBITDA margins and cash flow generation Resilient Core Business, Leveraging Competencies into Attractive Adjacent Markets Expected to Raise Long-Run Earnings Capacity and Drive Shareholder Value 4 Why Compass Minerals?
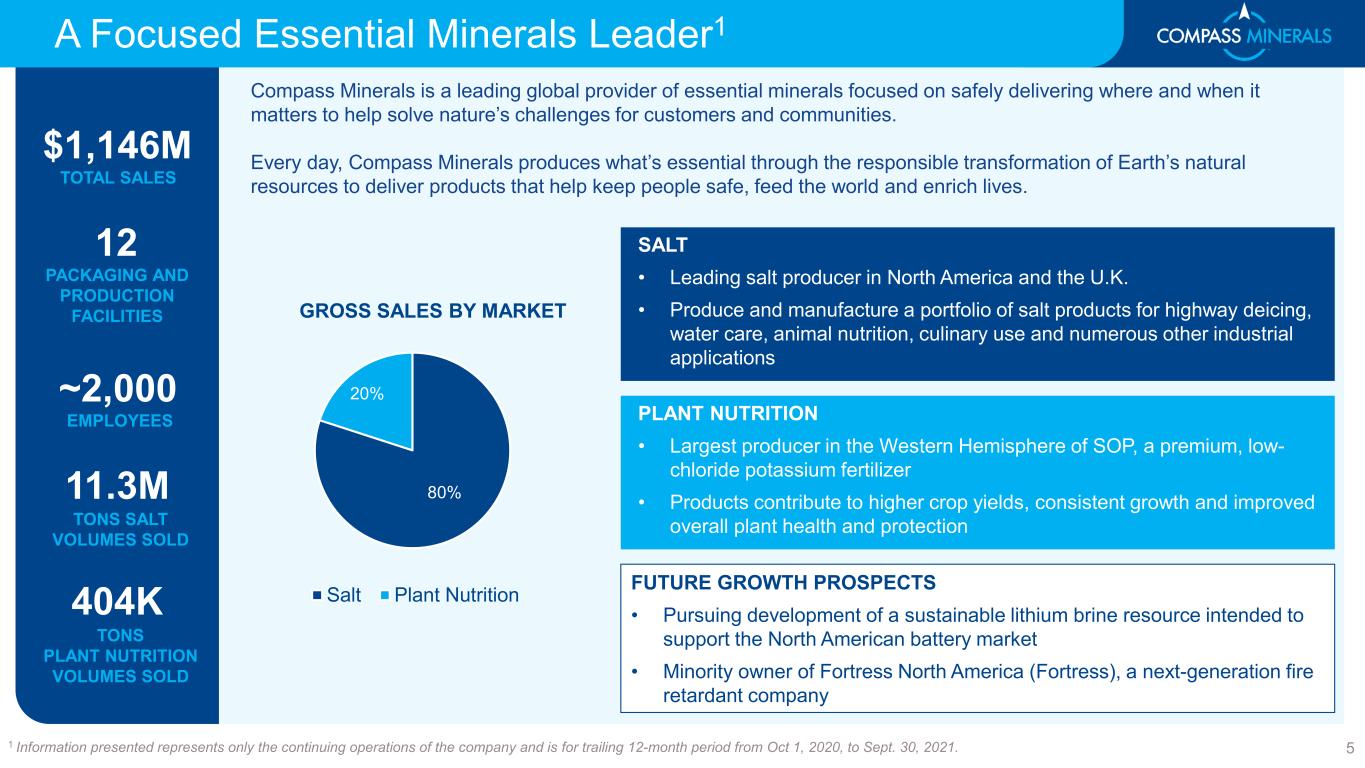
A Focused Essential Minerals Leader1 51 Information presented represents only the continuing operations of the company and is for trailing 12-month period from Oct 1, 2020, to Sept. 30, 2021. TOTAL SALES $1,146M 12 PACKAGING AND PRODUCTION FACILITIES ~2,000 EMPLOYEES 11.3M TONS SALT VOLUMES SOLD 404K TONS PLANT NUTRITION VOLUMES SOLD 80% 20% GROSS SALES BY MARKET Salt Plant Nutrition Compass Minerals is a leading global provider of essential minerals focused on safely delivering where and when it matters to help solve nature’s challenges for customers and communities. Every day, Compass Minerals produces what’s essential through the responsible transformation of Earth’s natural resources to deliver products that help keep people safe, feed the world and enrich lives. PLANT NUTRITION • Largest producer in the Western Hemisphere of SOP, a premium, low- chloride potassium fertilizer • Products contribute to higher crop yields, consistent growth and improved overall plant health and protection SALT • Leading salt producer in North America and the U.K. • Produce and manufacture a portfolio of salt products for highway deicing, water care, animal nutrition, culinary use and numerous other industrial applications FUTURE GROWTH PROSPECTS • Pursuing development of a sustainable lithium brine resource intended to support the North American battery market • Minority owner of Fortress North America (Fortress), a next-generation fire retardant company
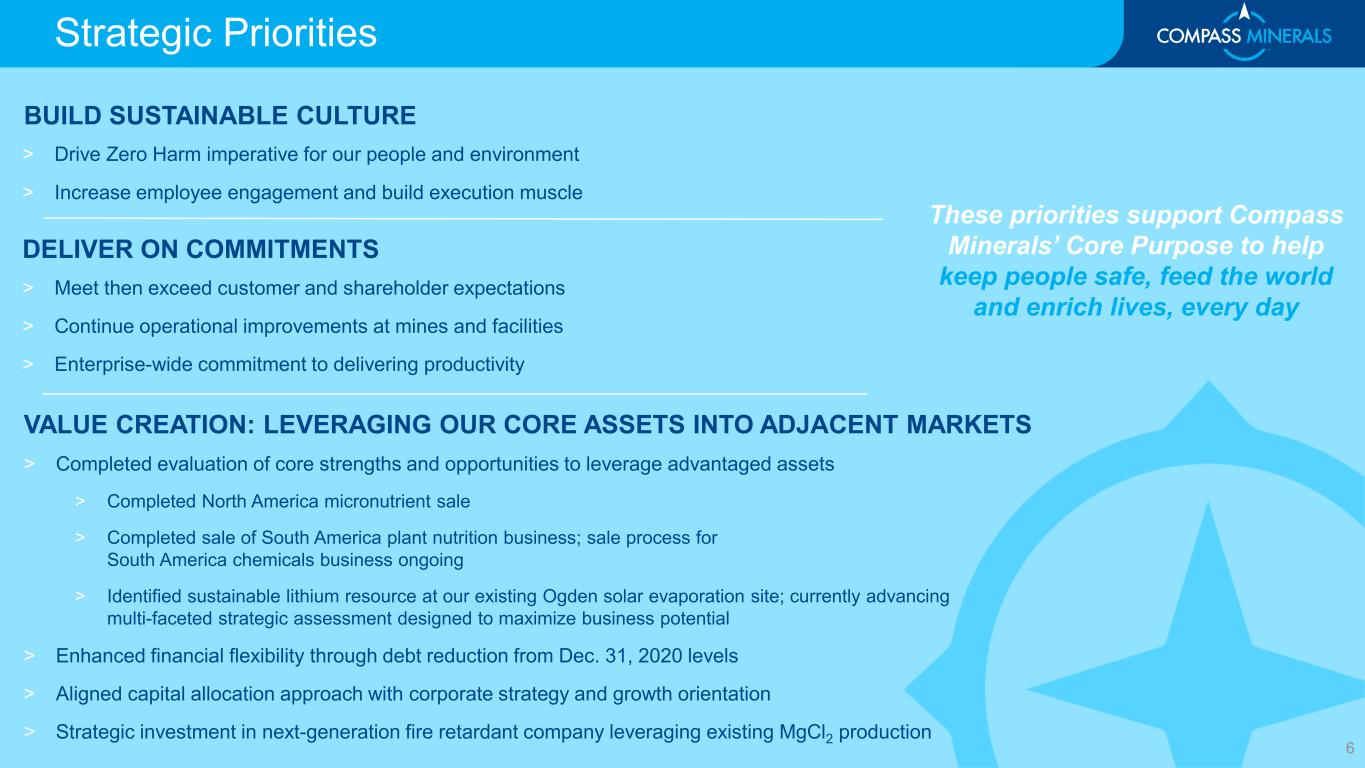
Strategic Priorities BUILD SUSTAINABLE CULTURE > Drive Zero Harm imperative for our people and environment > Increase employee engagement and build execution muscle DELIVER ON COMMITMENTS > Meet then exceed customer and shareholder expectations > Continue operational improvements at mines and facilities > Enterprise-wide commitment to delivering productivity VALUE CREATION: LEVERAGING OUR CORE ASSETS INTO ADJACENT MARKETS > Completed evaluation of core strengths and opportunities to leverage advantaged assets > Completed North America micronutrient sale > Completed sale of South America plant nutrition business; sale process for South America chemicals business ongoing > Identified sustainable lithium resource at our existing Ogden solar evaporation site; currently advancing multi-faceted strategic assessment designed to maximize business potential > Enhanced financial flexibility through debt reduction from Dec. 31, 2020 levels > Aligned capital allocation approach with corporate strategy and growth orientation > Strategic investment in next-generation fire retardant company leveraging existing MgCl2 production These priorities support Compass Minerals’ Core Purpose to help keep people safe, feed the world and enrich lives, every day 6
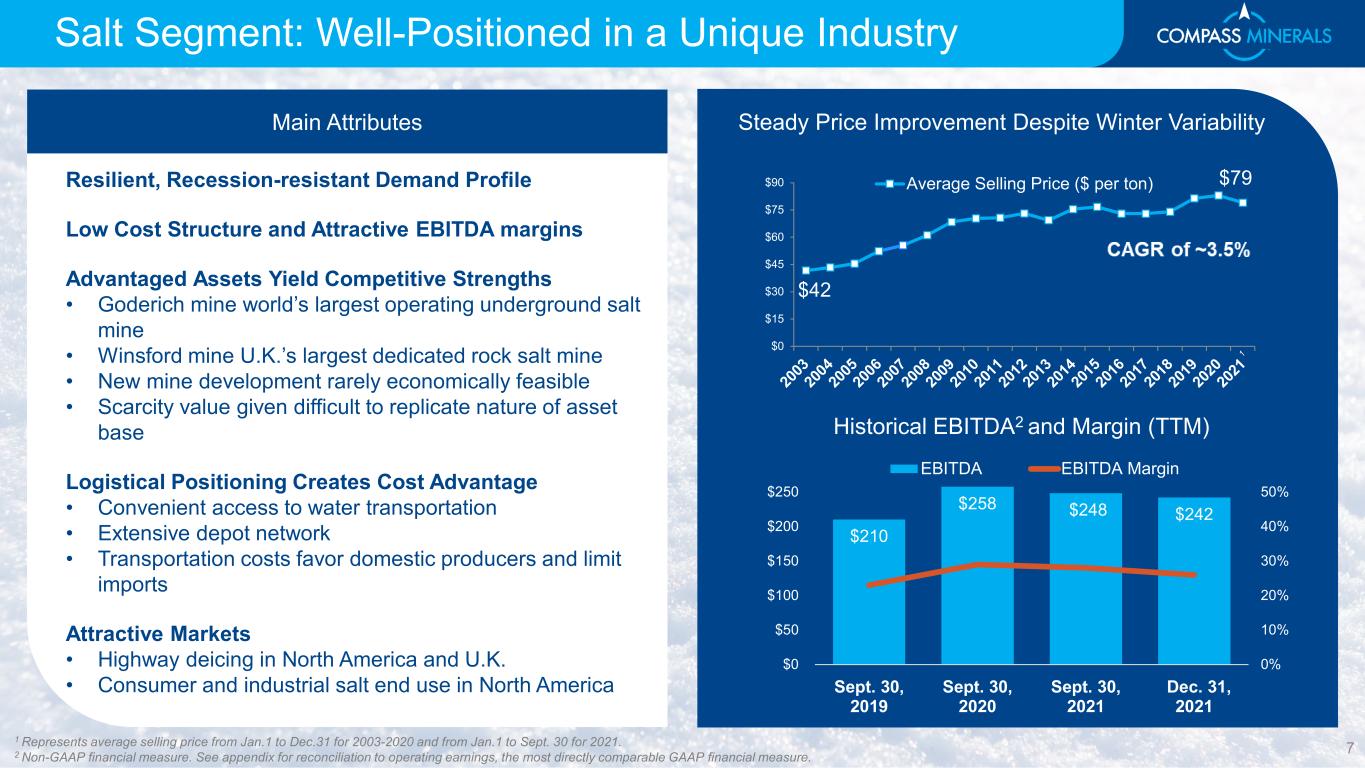
Salt Segment: Well-Positioned in a Unique Industry Main Attributes Resilient, Recession-resistant Demand Profile Low Cost Structure and Attractive EBITDA margins Advantaged Assets Yield Competitive Strengths • Goderich mine world’s largest operating underground salt mine • Winsford mine U.K.’s largest dedicated rock salt mine • New mine development rarely economically feasible • Scarcity value given difficult to replicate nature of asset base Logistical Positioning Creates Cost Advantage • Convenient access to water transportation • Extensive depot network • Transportation costs favor domestic producers and limit imports Attractive Markets • Highway deicing in North America and U.K. • Consumer and industrial salt end use in North America 7 Steady Price Improvement Despite Winter Variability $42 $79 $0 $15 $30 $45 $60 $75 $90 Average Selling Price ($ per ton) Historical EBITDA2 and Margin (TTM) $210 $258 $248 $242 0% 10% 20% 30% 40% 50% $0 $50 $100 $150 $200 $250 Sept. 30, 2019 Sept. 30, 2020 Sept. 30, 2021 Dec. 31, 2021 EBITDA EBITDA Margin 1 Represents average selling price from Jan.1 to Dec.31 for 2003-2020 and from Jan.1 to Sept. 30 for 2021. 2 Non-GAAP financial measure. See appendix for reconciliation to operating earnings, the most directly comparable GAAP financial measure.
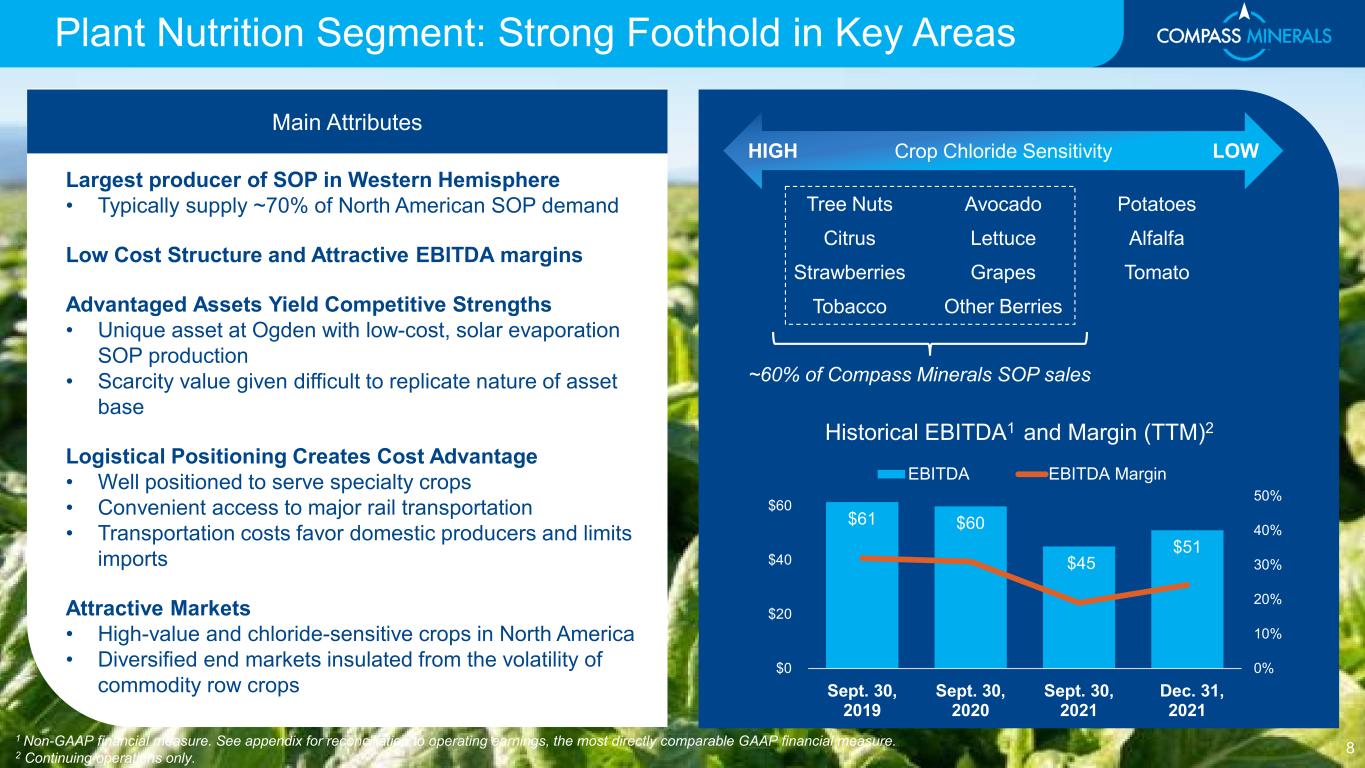
Plant Nutrition Segment: Strong Foothold in Key Areas Main Attributes Historical EBITDA1 and Margin (TTM)2 $61 $60 $45 $51 0% 10% 20% 30% 40% 50% $0 $20 $40 $60 Sept. 30, 2019 Sept. 30, 2020 Sept. 30, 2021 Dec. 31, 2021 EBITDA EBITDA Margin HIGH LOWCrop Chloride Sensitivity Tree Nuts Avocado Potatoes Citrus Lettuce Alfalfa Strawberries Grapes Tomato Tobacco Other Berries ~60% of Compass Minerals SOP sales 8 1 Non-GAAP financial measure. See appendix for reconciliation to operating earnings, the most directly comparable GAAP financial measure. 2 Continuing operations only. Largest producer of SOP in Western Hemisphere • Typically supply ~70% of North American SOP demand Low Cost Structure and Attractive EBITDA margins Advantaged Assets Yield Competitive Strengths • Unique asset at Ogden with low-cost, solar evaporation SOP production • Scarcity value given difficult to replicate nature of asset base Logistical Positioning Creates Cost Advantage • Well positioned to serve specialty crops • Convenient access to major rail transportation • Transportation costs favor domestic producers and limits imports Attractive Markets • High-value and chloride-sensitive crops in North America • Diversified end markets insulated from the volatility of commodity row crops
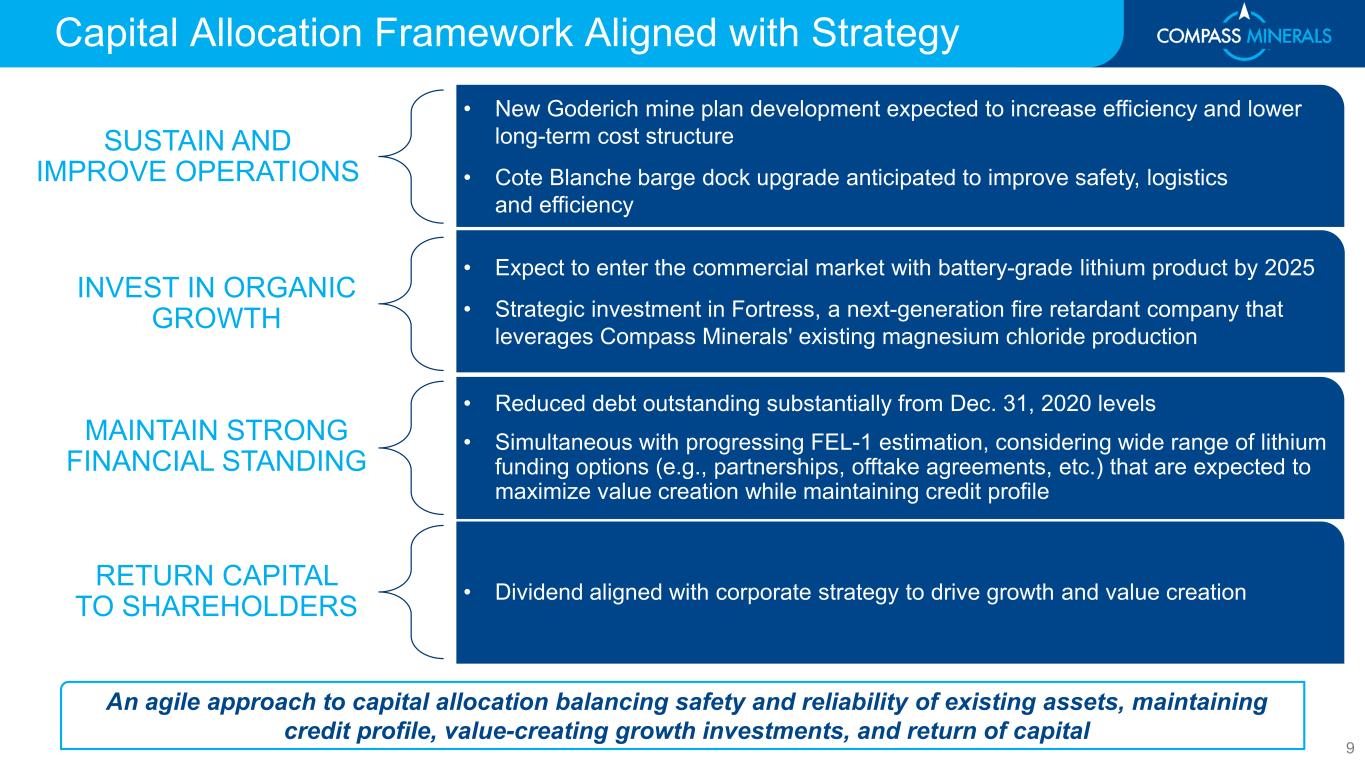
An agile approach to capital allocation balancing safety and reliability of existing assets, maintaining credit profile, value-creating growth investments, and return of capital SUSTAIN AND IMPROVE OPERATIONS • New Goderich mine plan development expected to increase efficiency and lower long-term cost structure • Cote Blanche barge dock upgrade anticipated to improve safety, logistics and efficiency INVEST IN ORGANIC GROWTH • Expect to enter the commercial market with battery-grade lithium product by 2025 • Strategic investment in Fortress, a next-generation fire retardant company that leverages Compass Minerals' existing magnesium chloride production RETURN CAPITAL TO SHAREHOLDERS • Dividend aligned with corporate strategy to drive growth and value creation MAINTAIN STRONG FINANCIAL STANDING Capital Allocation Framework Aligned with Strategy • Reduced debt outstanding substantially from Dec. 31, 2020 levels • Simultaneous with progressing FEL-1 estimation, considering wide range of lithium funding options (e.g., partnerships, offtake agreements, etc.) that are expected to maximize value creation while maintaining credit profile 9
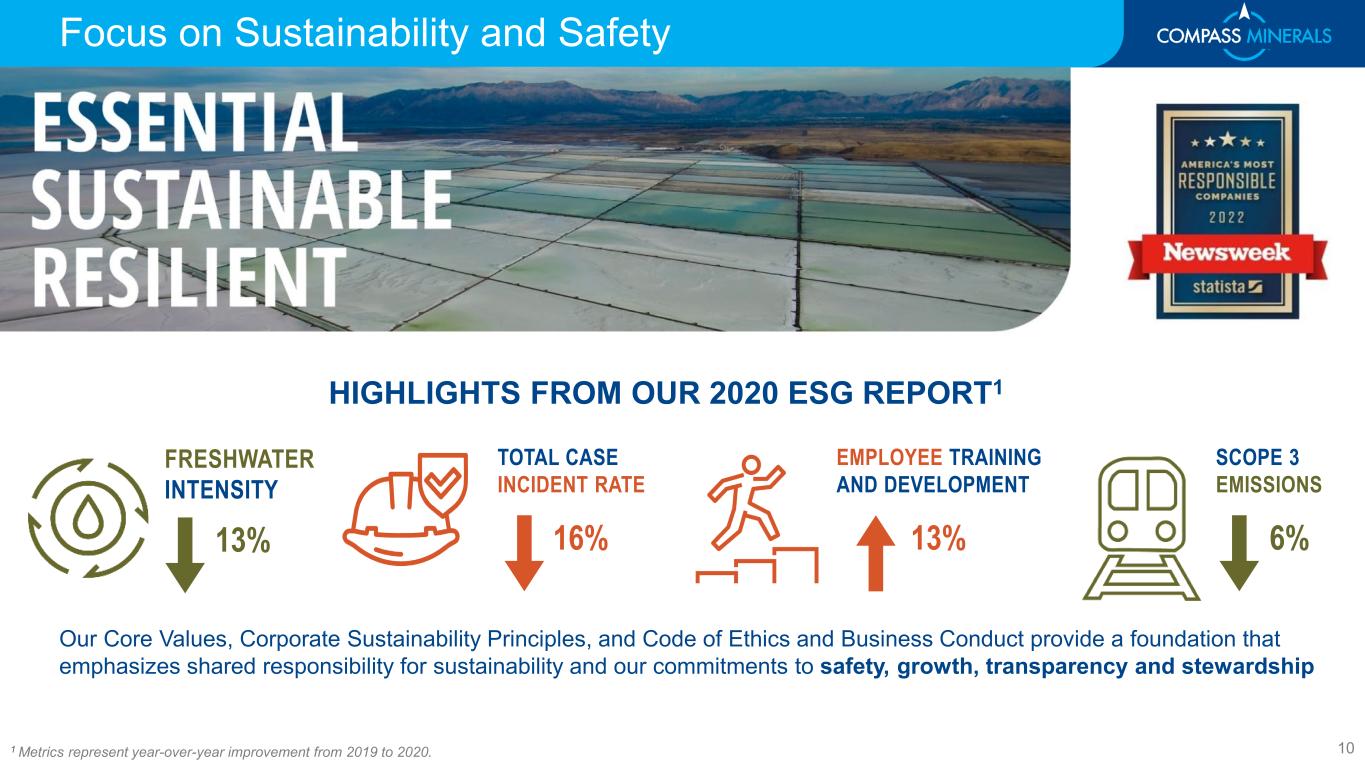
Focus on Sustainability and Safety FRESHWATER INTENSITY 13% HIGHLIGHTS FROM OUR 2020 ESG REPORT1 1 Metrics represent year-over-year improvement from 2019 to 2020. SCOPE 3 EMISSIONS 6% TOTAL CASE INCIDENT RATE 16% EMPLOYEE TRAINING AND DEVELOPMENT 13% Our Core Values, Corporate Sustainability Principles, and Code of Ethics and Business Conduct provide a foundation that emphasizes shared responsibility for sustainability and our commitments to safety, growth, transparency and stewardship 10

CHARTING A PATH TO LONG- TERM VALUE CREATION
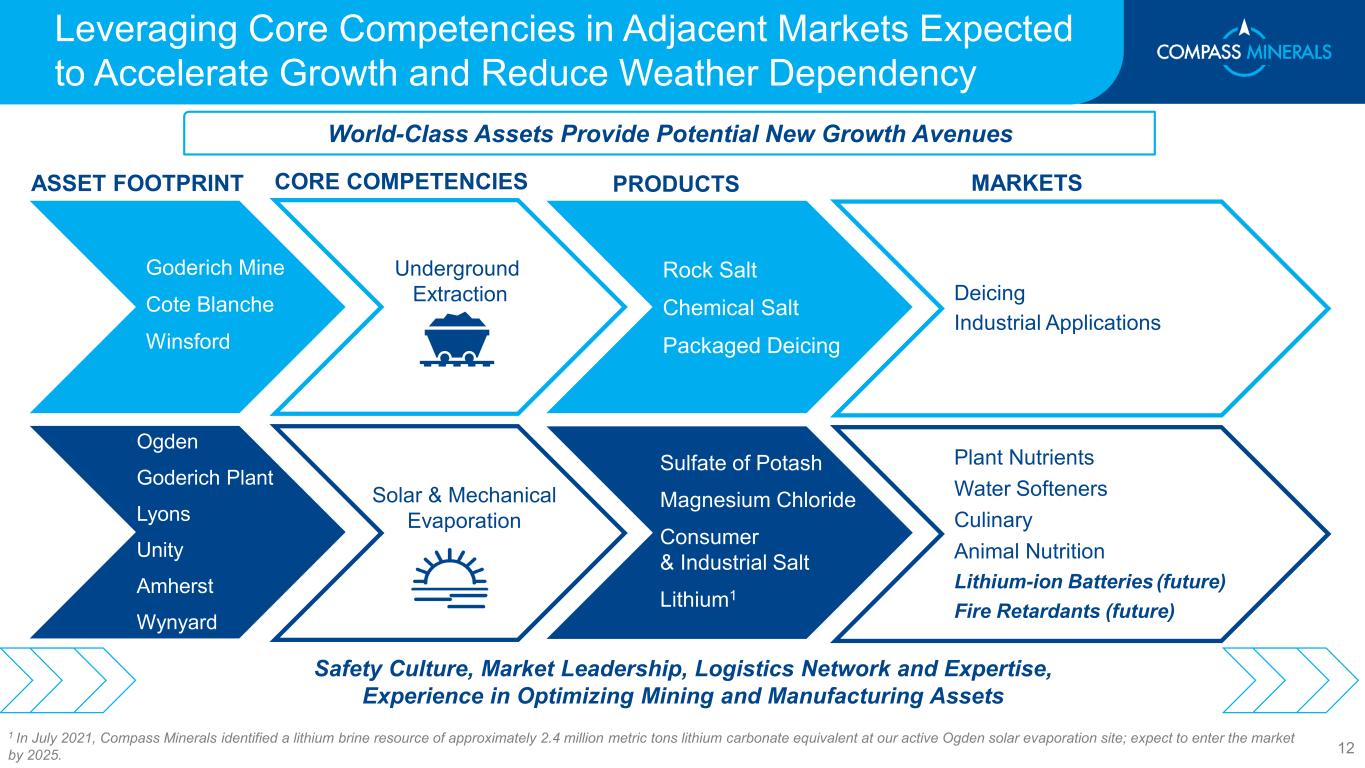
Leveraging Core Competencies in Adjacent Markets Expected to Accelerate Growth and Reduce Weather Dependency 12 World-Class Assets Provide Potential New Growth Avenues ASSET FOOTPRINT CORE COMPETENCIES PRODUCTS MARKETS Goderich Mine Cote Blanche Winsford Ogden Goderich Plant Lyons Unity Amherst Wynyard Deicing Industrial Applications Solar & Mechanical Evaporation Sulfate of Potash Magnesium Chloride Consumer & Industrial Salt Lithium1 Rock Salt Chemical Salt Packaged Deicing Plant Nutrients Water Softeners Culinary Animal Nutrition Lithium-ion Batteries (future) Fire Retardants (future) Underground Extraction 1 In July 2021, Compass Minerals identified a lithium brine resource of approximately 2.4 million metric tons lithium carbonate equivalent at our active Ogden solar evaporation site; expect to enter the market by 2025. Safety Culture, Market Leadership, Logistics Network and Expertise, Experience in Optimizing Mining and Manufacturing Assets 12

Path Ahead Targets Value Creation and Growth • Seek to recoup inflationary costs during upcoming 2023 North America highway deicing bid season • Restore Ogden pond productivity to historical levels • Advance long-term Goderich mine plan to increase efficiency and reduce costs • Leverage advantaged assets to drive value creation and reduce weather dependency ORGANIC OPTIMIZATION FORTRESS INVESTMENT • Portfolio of proprietary, magnesium chloride-based fire retardant formulations developed with essential minerals supplied from Compass Minerals’ solar evaporation site on the Great Salt Lake • Strategic investment in eco-friendly, highly-effective product portfolio expected to enhance growth, counter-balance our highway deicing seasonality and leverage existing asset base • Adequately capitalized for next phase of growth and expansion • Leverage existing infrastructure at Ogden production facility to streamline path to market for planned lithium brine production • Pathway to annual production in the range of ~30 to 40 kMT lithium carbonate equivalent anticipated • Market entry expected by 2025 with initial capacity of ~10 kMT lithium carbonate equivalent • Anticipate lower emissions footprint compared to other lithium projects due to solar evaporation synergies with existing operations LITHIUM DEVELOPMENT 13
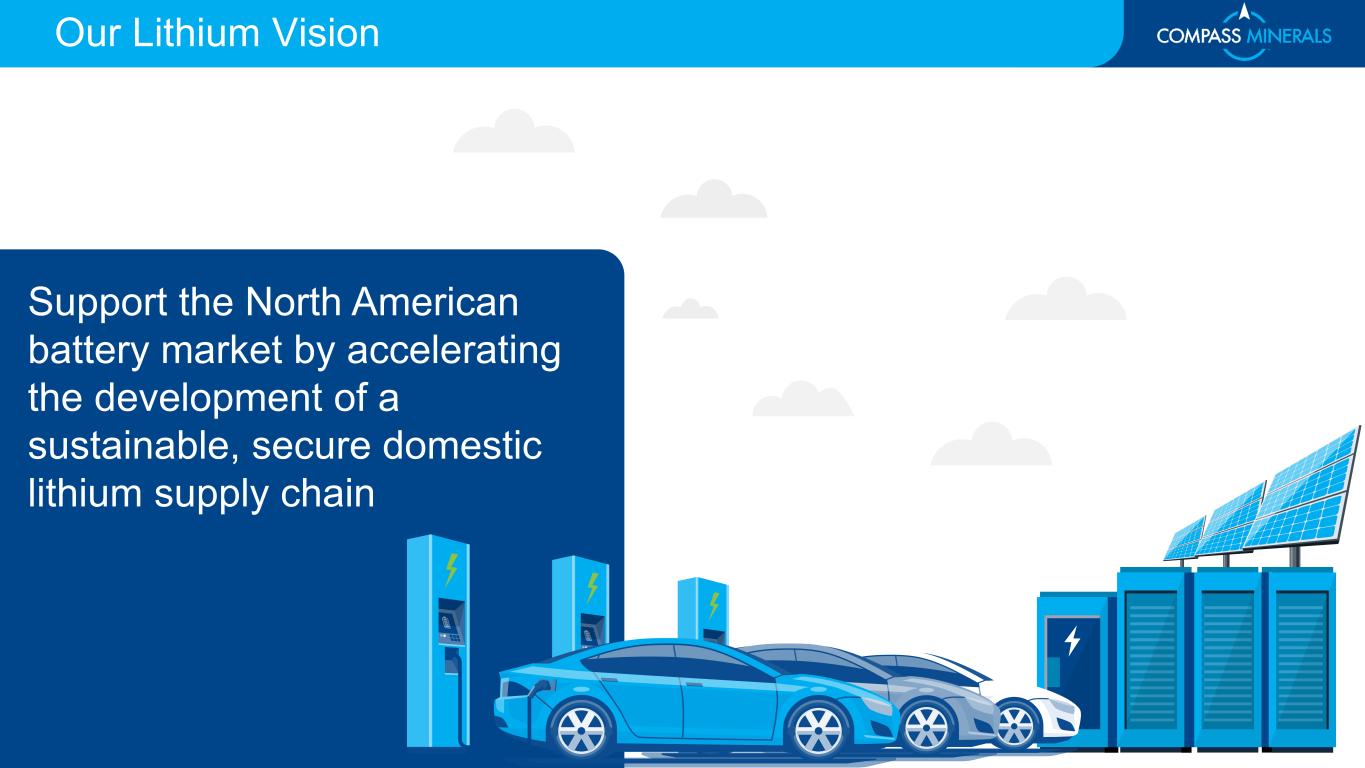
Support the North American battery market by accelerating the development of a sustainable, secure domestic lithium supply chain Our Lithium Vision
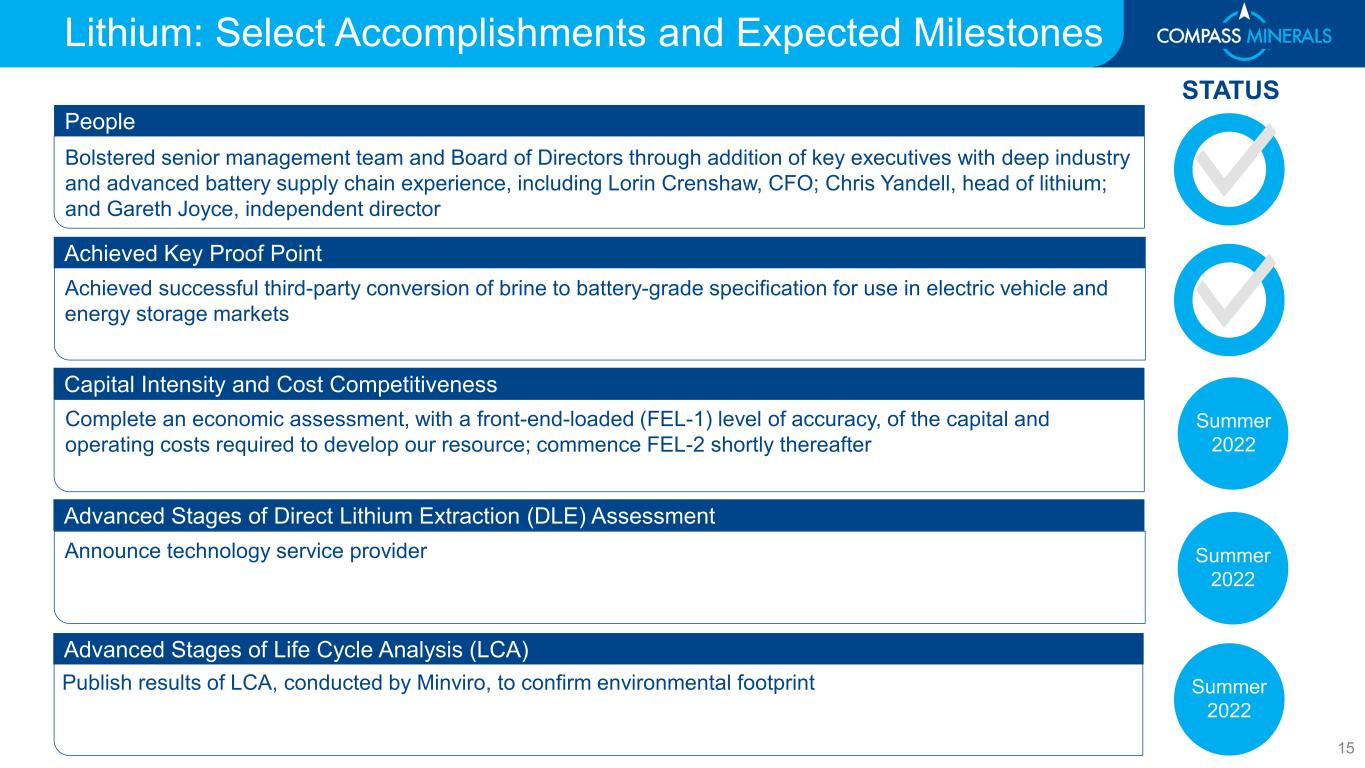
People Bolstered senior management team and Board of Directors through addition of key executives with deep industry and advanced battery supply chain experience, including Lorin Crenshaw, CFO; Chris Yandell, head of lithium; and Gareth Joyce, independent director Summer 2022 Achieved Key Proof Point Achieved successful third-party conversion of brine to battery-grade specification for use in electric vehicle and energy storage markets Capital Intensity and Cost Competitiveness Complete an economic assessment, with a front-end-loaded (FEL-1) level of accuracy, of the capital and operating costs required to develop our resource; commence FEL-2 shortly thereafter Advanced Stages of Direct Lithium Extraction (DLE) Assessment Announce technology service provider Advanced Stages of Life Cycle Analysis (LCA) Publish results of LCA, conducted by Minviro, to confirm environmental footprint STATUS Lithium: Select Accomplishments and Expected Milestones Summer 2022 Summer 2022 15
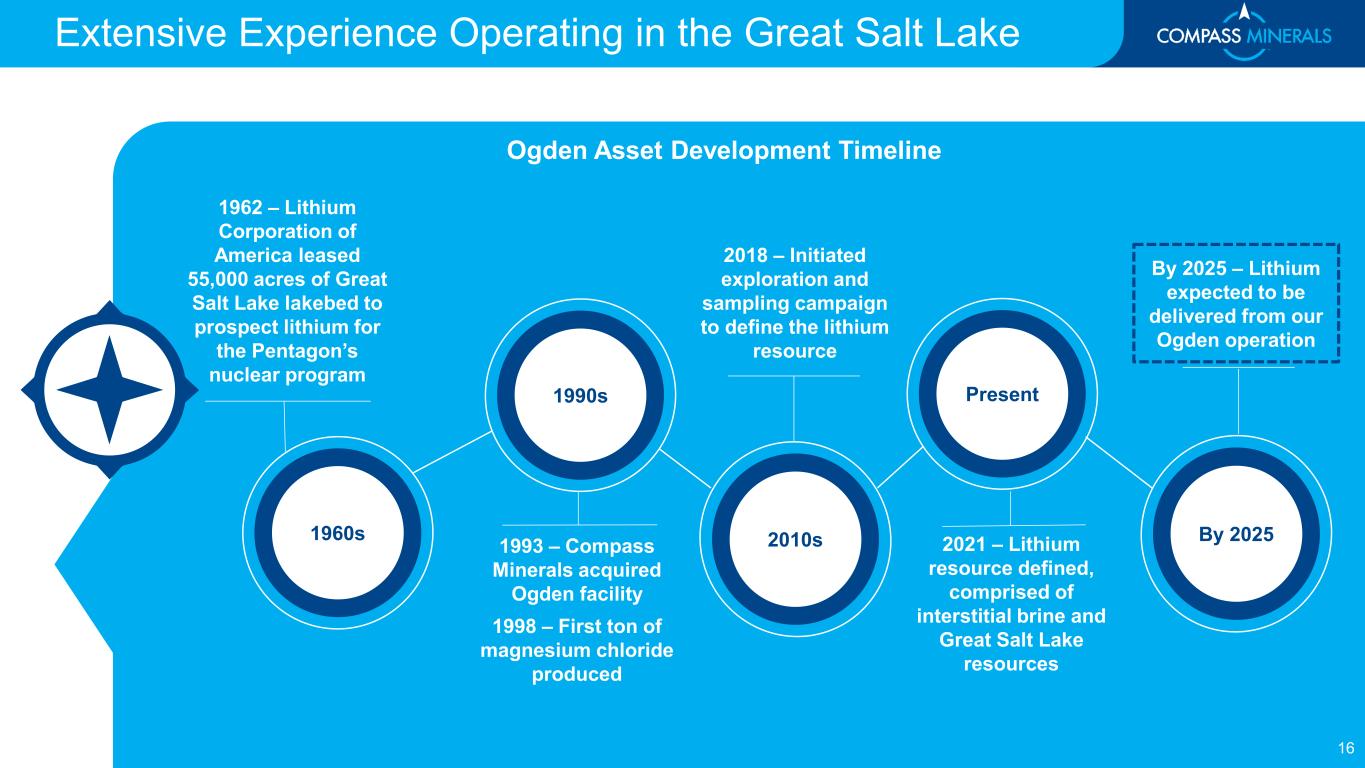
Ogden Asset Development Timeline 1962 – Lithium Corporation of America leased 55,000 acres of Great Salt Lake lakebed to prospect lithium for the Pentagon’s nuclear program 2018 – Initiated exploration and sampling campaign to define the lithium resource 2021 – Lithium resource defined, comprised of interstitial brine and Great Salt Lake resources 1993 – Compass Minerals acquired Ogden facility 1998 – First ton of magnesium chloride produced 1990s 2010s Present By 20251960s By 2025 – Lithium expected to be delivered from our Ogden operation 16 Extensive Experience Operating in the Great Salt Lake
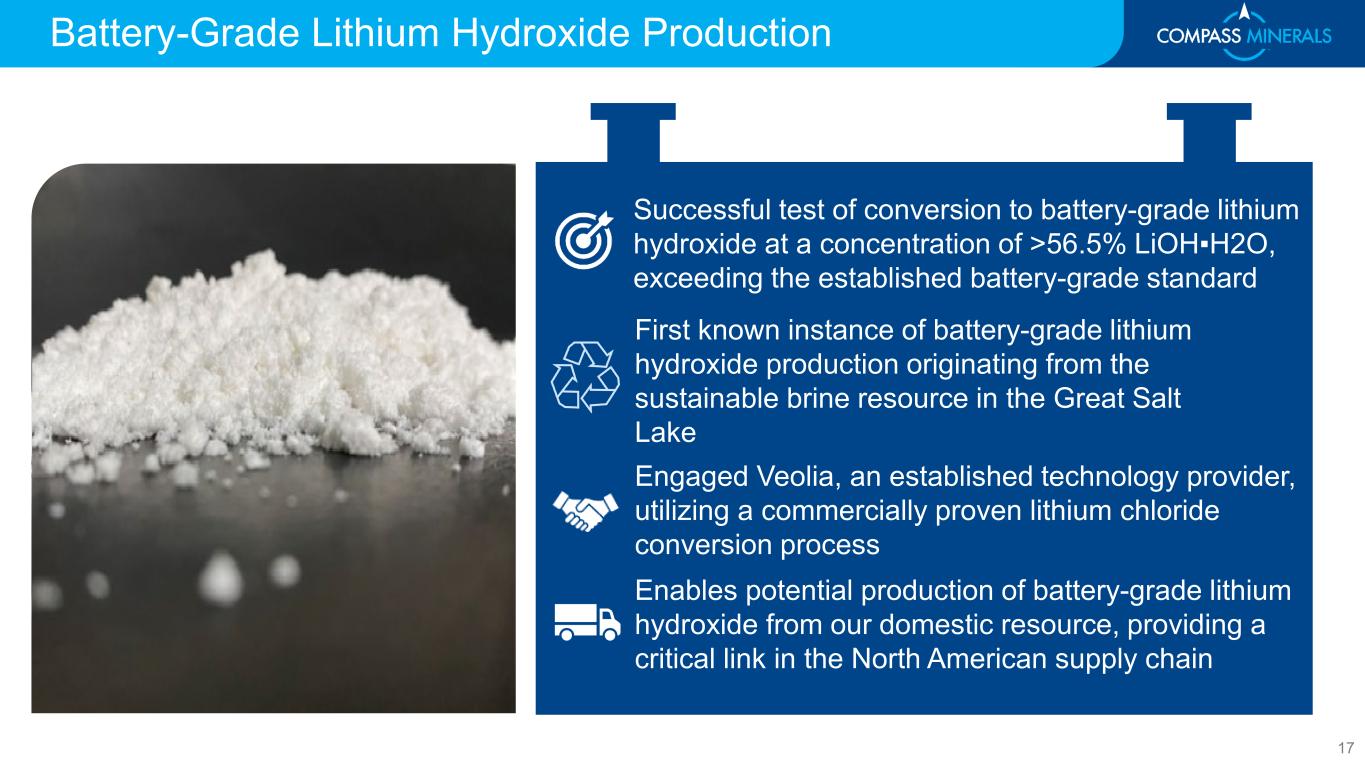
Battery-Grade Lithium Hydroxide Production Successful test of conversion to battery-grade lithium hydroxide at a concentration of >56.5% LiOH▪H2O, exceeding the established battery-grade standard First known instance of battery-grade lithium hydroxide production originating from the sustainable brine resource in the Great Salt Lake Engaged Veolia, an established technology provider, utilizing a commercially proven lithium chloride conversion process Enables potential production of battery-grade lithium hydroxide from our domestic resource, providing a critical link in the North American supply chain 17
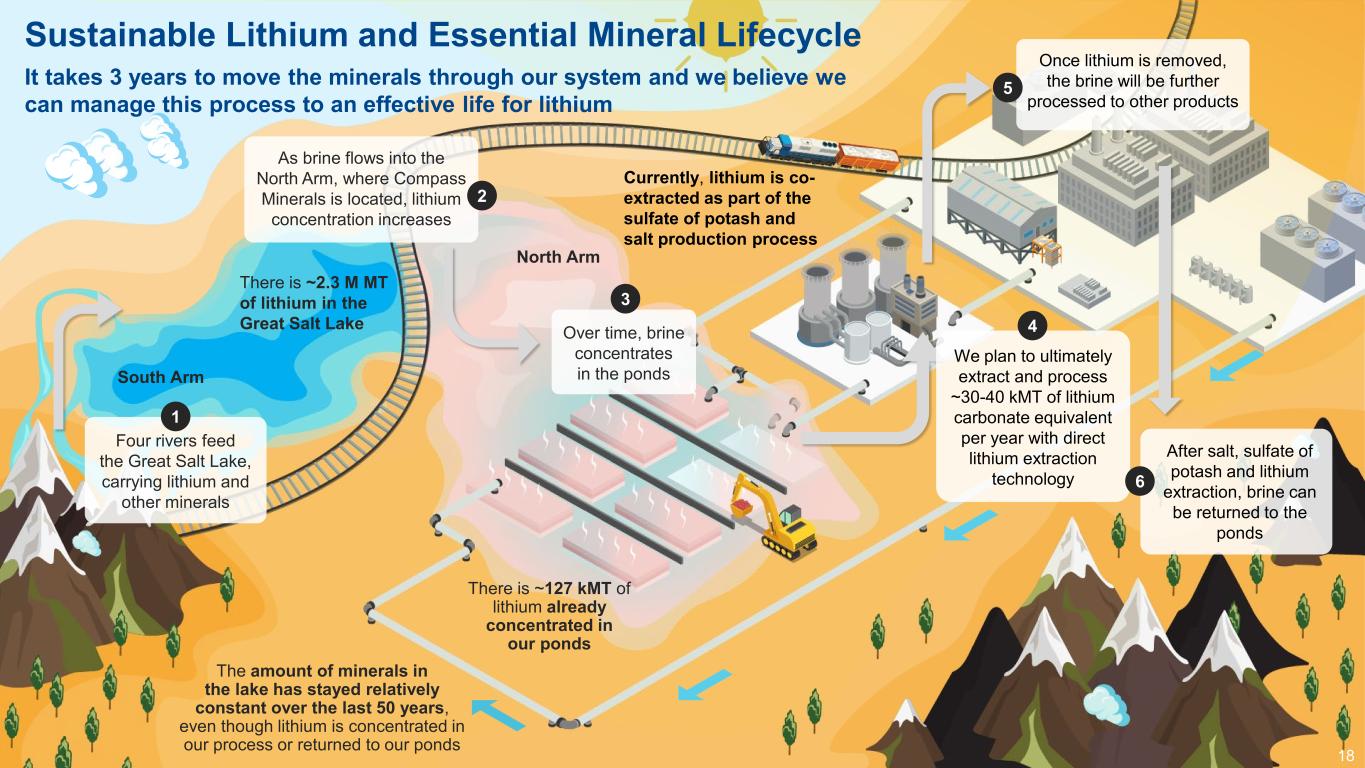
South Arm North Arm Four rivers feed the Great Salt Lake, carrying lithium and other minerals 1 Over time, brine concentrates in the ponds 3 We plan to ultimately extract and process ~30-40 kMT of lithium carbonate equivalent per year with direct lithium extraction technology 4 Once lithium is removed, the brine will be further processed to other products 5 Currently, lithium is co- extracted as part of the sulfate of potash and salt production process After salt, sulfate of potash and lithium extraction, brine can be returned to the ponds 6 There is ~127 kMT of lithium already concentrated in our ponds The amount of minerals in the lake has stayed relatively constant over the last 50 years, even though lithium is concentrated in our process or returned to our ponds There is ~2.3 M MT of lithium in the Great Salt Lake As brine flows into the North Arm, where Compass Minerals is located, lithium concentration increases 2 Sustainable Lithium and Essential Mineral Lifecycle It takes 3 years to move the minerals through our system and we believe we can manage this process to an effective life for lithium 18
We anticipate a lower emissions footprint compared to other projects because we use brine that is already being processed We expect to be cost competitive due to synergy with existing operations As a long-standing operator and engaged stakeholder on the Great Salt Lake, we have strong working relationships with local stakeholders We expect to have a low lead time to deliver our product domestically We do not expect any additional permitting to access our lithium resource and minimal additional permitting for production of lithium, including for a conversion facility 19 Capable and Ready to Deliver Our Vision
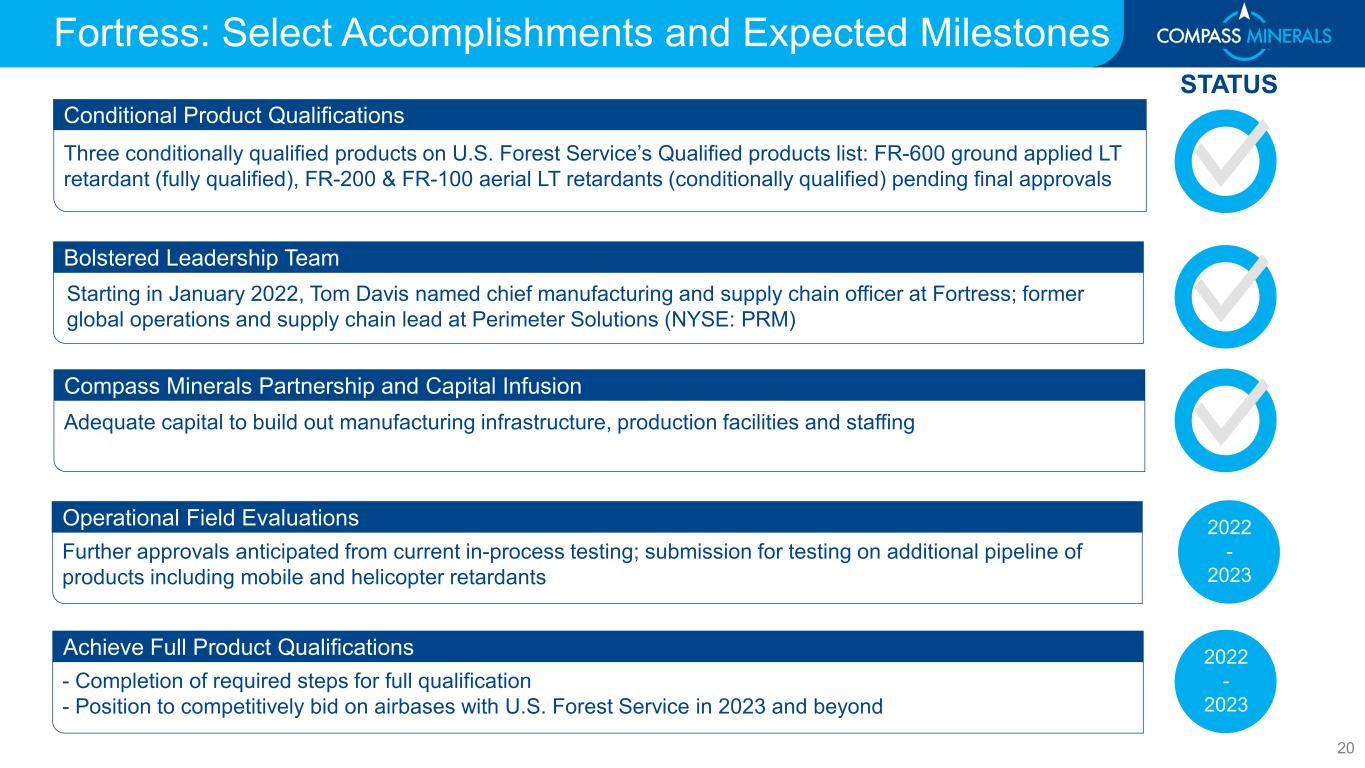
STATUS Conditional Product Qualifications Three conditionally qualified products on U.S. Forest Service’s Qualified products list: FR-600 ground applied LT retardant (fully qualified), FR-200 & FR-100 aerial LT retardants (conditionally qualified) pending final approvals Achieve Full Product Qualifications - Completion of required steps for full qualification - Position to competitively bid on airbases with U.S. Forest Service in 2023 and beyond Bolstered Leadership Team Starting in January 2022, Tom Davis named chief manufacturing and supply chain officer at Fortress; former global operations and supply chain lead at Perimeter Solutions (NYSE: PRM) Compass Minerals Partnership and Capital Infusion Adequate capital to build out manufacturing infrastructure, production facilities and staffing Operational Field Evaluations Further approvals anticipated from current in-process testing; submission for testing on additional pipeline of products including mobile and helicopter retardants Fortress: Select Accomplishments and Expected Milestones 2022 - 2023 2022 - 2023 20
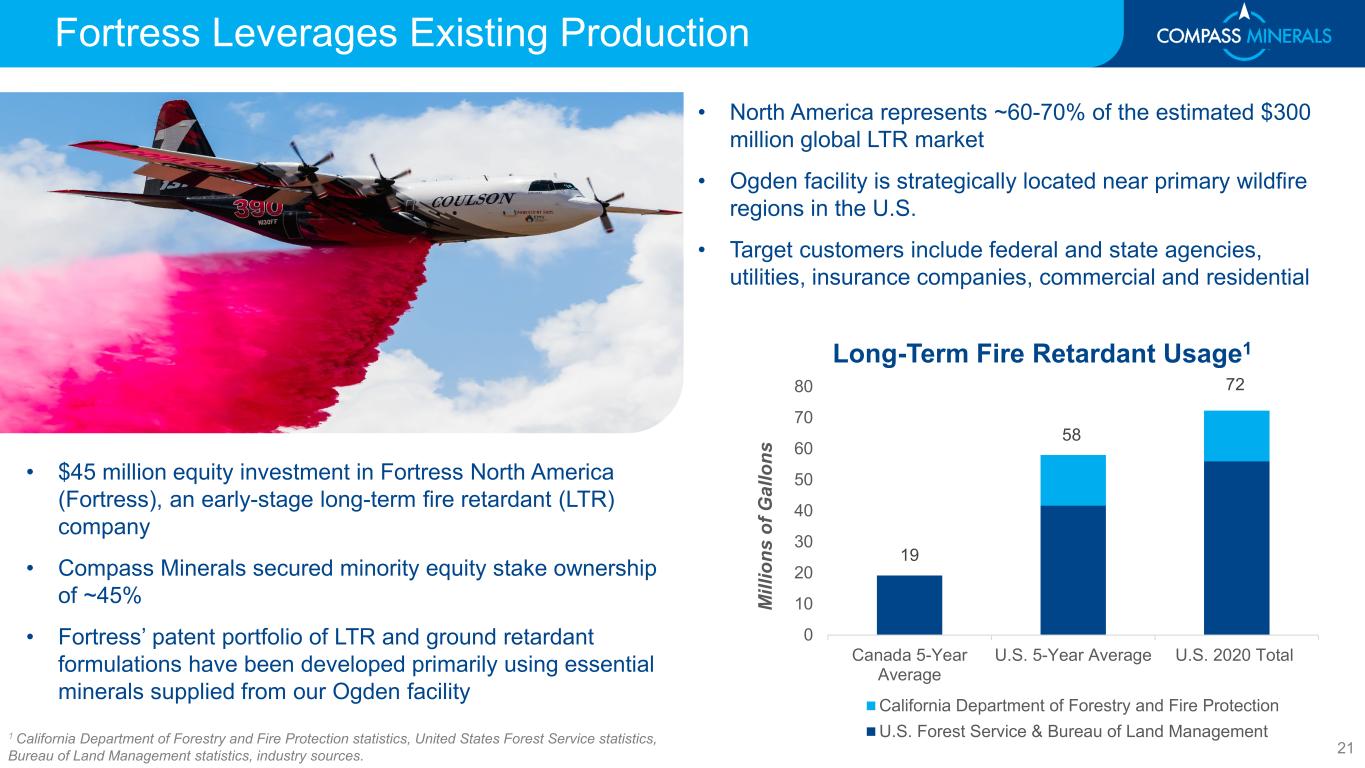
Fortress Leverages Existing Production • $45 million equity investment in Fortress North America (Fortress), an early-stage long-term fire retardant (LTR) company • Compass Minerals secured minority equity stake ownership of ~45% • Fortress’ patent portfolio of LTR and ground retardant formulations have been developed primarily using essential minerals supplied from our Ogden facility 19 58 72 0 10 20 30 40 50 60 70 80 Canada 5-Year Average U.S. 5-Year Average U.S. 2020 Total M ill io ns o f G al lo ns Long-Term Fire Retardant Usage1 California Department of Forestry and Fire Protection U.S. Forest Service & Bureau of Land Management • North America represents ~60-70% of the estimated $300 million global LTR market • Ogden facility is strategically located near primary wildfire regions in the U.S. • Target customers include federal and state agencies, utilities, insurance companies, commercial and residential 1 California Department of Forestry and Fire Protection statistics, United States Forest Service statistics, Bureau of Land Management statistics, industry sources. 21
Appendix
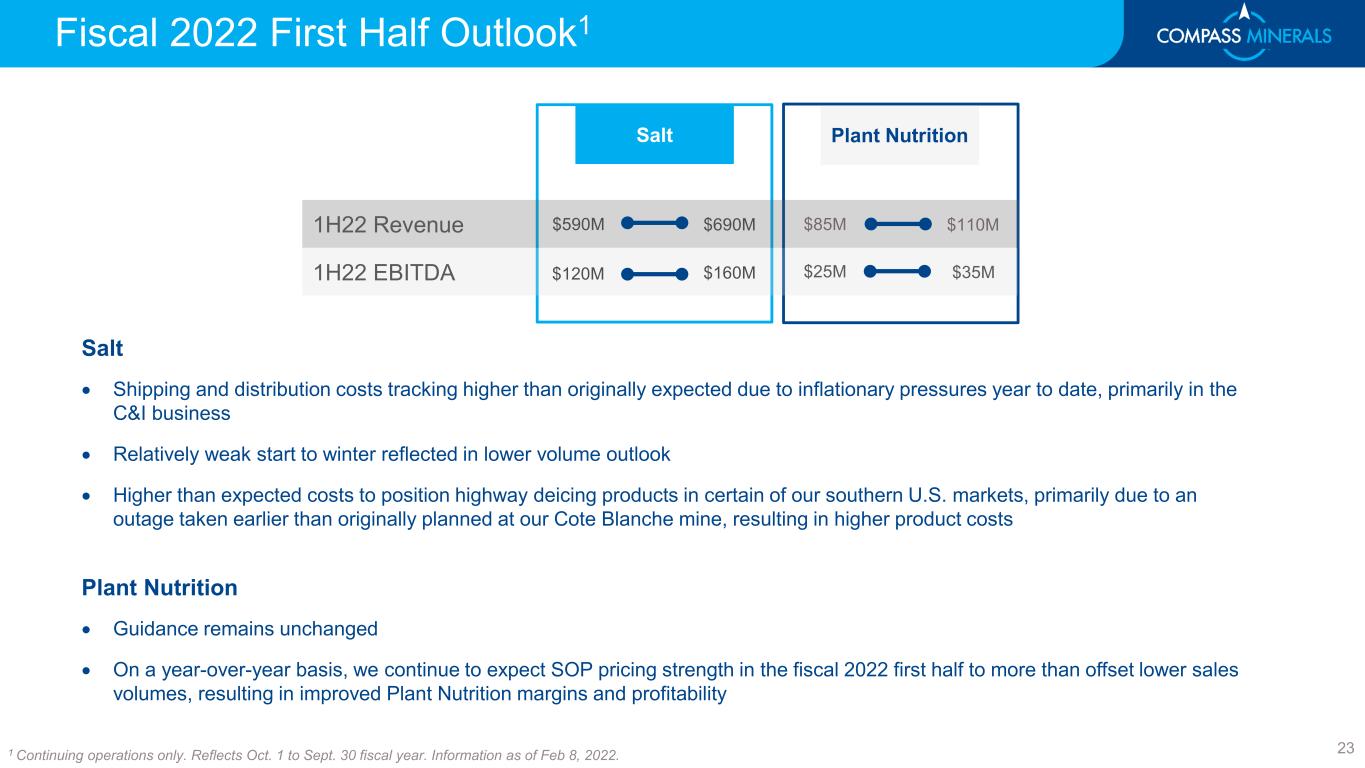
1 Continuing operations only. Reflects Oct. 1 to Sept. 30 fiscal year. Information as of Feb 8, 2022. Salt • Shipping and distribution costs tracking higher than originally expected due to inflationary pressures year to date, primarily in the C&I business • Relatively weak start to winter reflected in lower volume outlook • Higher than expected costs to position highway deicing products in certain of our southern U.S. markets, primarily due to an outage taken earlier than originally planned at our Cote Blanche mine, resulting in higher product costs Plant Nutrition • Guidance remains unchanged • On a year-over-year basis, we continue to expect SOP pricing strength in the fiscal 2022 first half to more than offset lower sales volumes, resulting in improved Plant Nutrition margins and profitability 1H22 EBITDA 1H22 Revenue $590M $690M $160M$120M $85M $25M $35M $110M Salt Plant Nutrition Fiscal 2022 First Half Outlook1 23
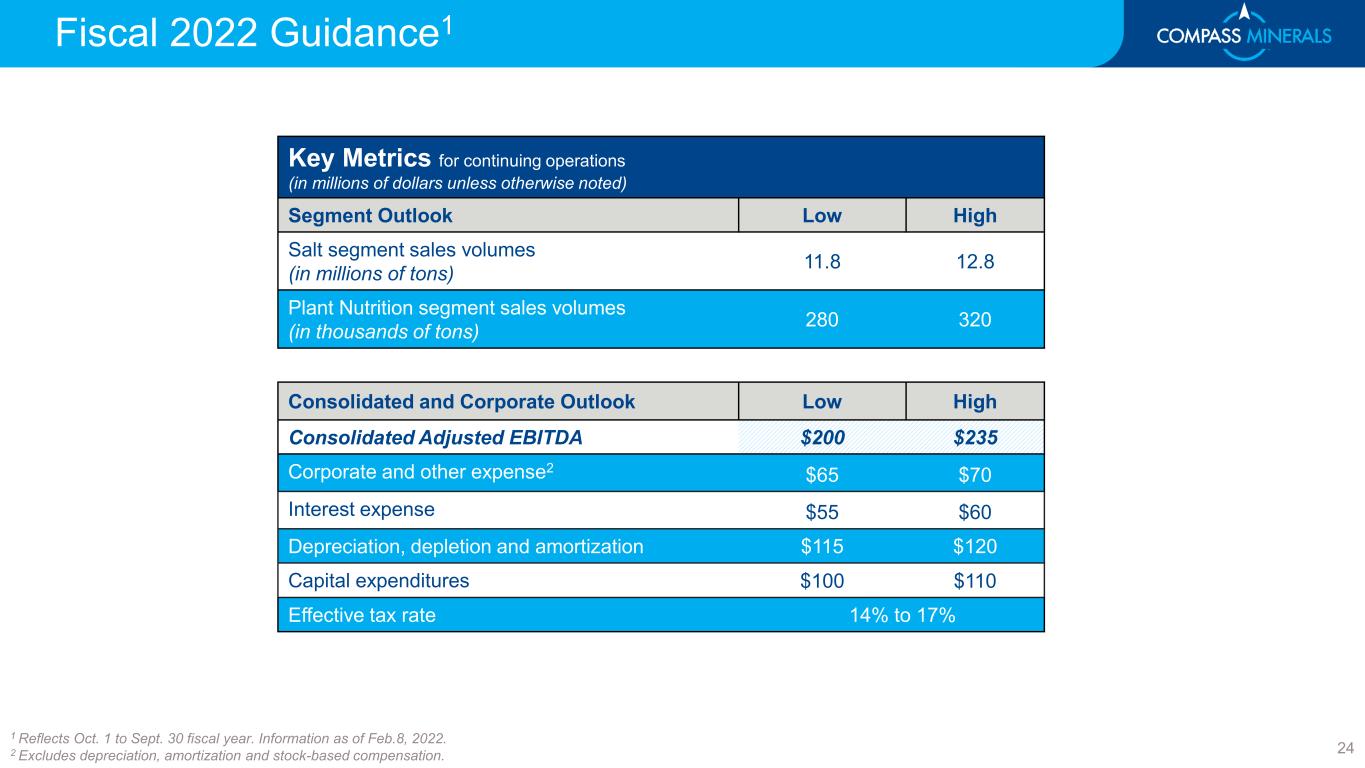
Key Metrics for continuing operations (in millions of dollars unless otherwise noted) Segment Outlook Low High Salt segment sales volumes (in millions of tons) 11.8 12.8 Plant Nutrition segment sales volumes (in thousands of tons) 280 320 Consolidated and Corporate Outlook Low High Consolidated Adjusted EBITDA $200 $235 Corporate and other expense2 $65 $70 Interest expense $55 $60 Depreciation, depletion and amortization $115 $120 Capital expenditures $100 $110 Effective tax rate 14% to 17% 1 Reflects Oct. 1 to Sept. 30 fiscal year. Information as of Feb.8, 2022. 2 Excludes depreciation, amortization and stock-based compensation. Fiscal 2022 Guidance1 24
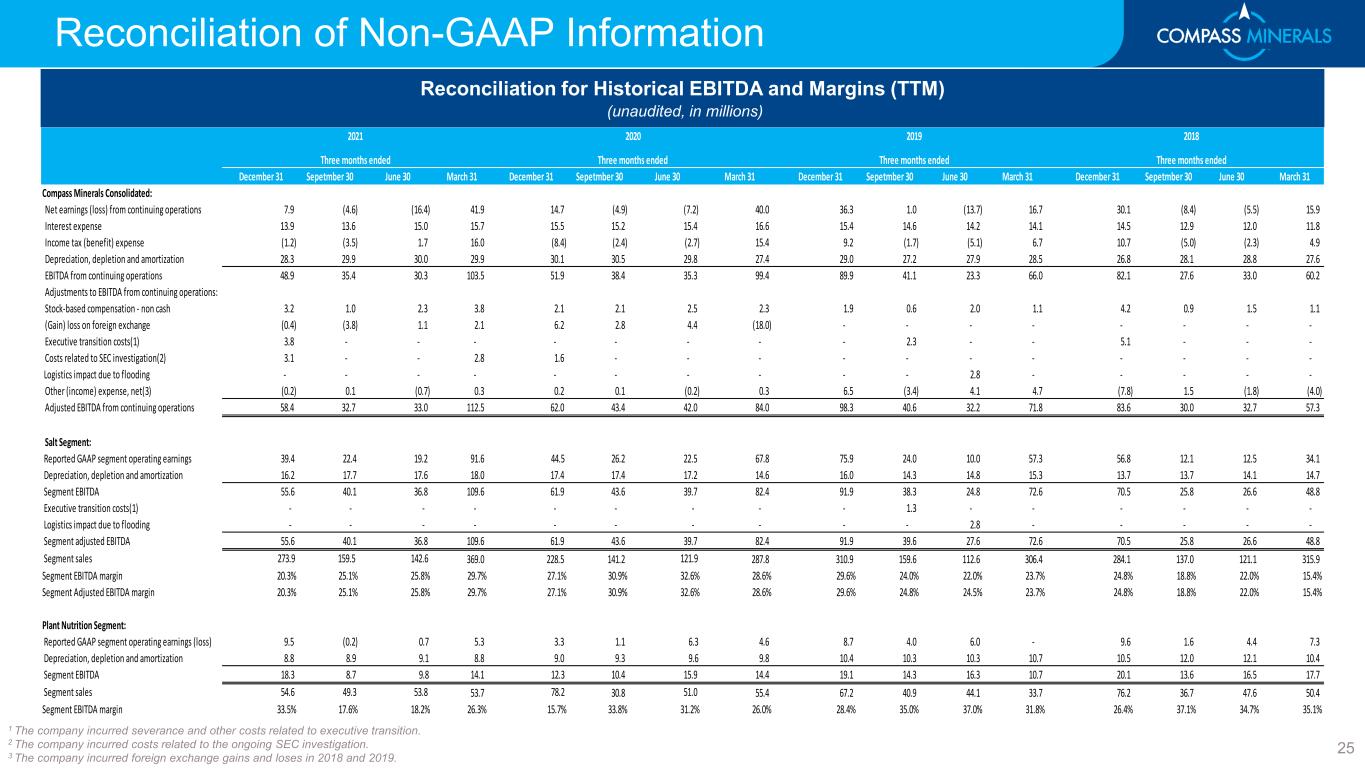
Reconciliation of Non-GAAP Information Reconciliation for Historical EBITDA and Margins (TTM) (unaudited, in millions) 1 The company incurred severance and other costs related to executive transition. 2 The company incurred costs related to the ongoing SEC investigation. 3 The company incurred foreign exchange gains and loses in 2018 and 2019. 25 December 31 Sepetmber 30 June 30 March 31 December 31 Sepetmber 30 June 30 March 31 December 31 Sepetmber 30 June 30 March 31 December 31 Sepetmber 30 June 30 March 31 Compass Minerals Consolidated: Net earnings (loss) from continuing operations 7.9 (4.6) (16.4) 41.9 14.7 (4.9) (7.2) 40.0 36.3 1.0 (13.7) 16.7 30.1 (8.4) (5.5) 15.9 Interest expense 13.9 13.6 15.0 15.7 15.5 15.2 15.4 16.6 15.4 14.6 14.2 14.1 14.5 12.9 12.0 11.8 Income tax (benefit) expense (1.2) (3.5) 1.7 16.0 (8.4) (2.4) (2.7) 15.4 9.2 (1.7) (5.1) 6.7 10.7 (5.0) (2.3) 4.9 Depreciation, depletion and amortization 28.3 29.9 30.0 29.9 30.1 30.5 29.8 27.4 29.0 27.2 27.9 28.5 26.8 28.1 28.8 27.6 EBITDA from continuing operations 48.9 35.4 30.3 103.5 51.9 38.4 35.3 99.4 89.9 41.1 23.3 66.0 82.1 27.6 33.0 60.2 Adjustments to EBITDA from continuing operations: Stock-based compensation - non cash 3.2 1.0 2.3 3.8 2.1 2.1 2.5 2.3 1.9 0.6 2.0 1.1 4.2 0.9 1.5 1.1 (Gain) loss on foreign exchange (0.4) (3.8) 1.1 2.1 6.2 2.8 4.4 (18.0) - - - - - - - - Executive transition costs(1) 3.8 - - - - - - - - 2.3 - - 5.1 - - - Costs related to SEC investigation(2) 3.1 - - 2.8 1.6 - - - - - - - - - - - Logistics impact due to flooding - - - - - - - - - - 2.8 - - - - - Other (income) expense, net(3) (0.2) 0.1 (0.7) 0.3 0.2 0.1 (0.2) 0.3 6.5 (3.4) 4.1 4.7 (7.8) 1.5 (1.8) (4.0) Adjusted EBITDA from continuing operations 58.4 32.7 33.0 112.5 62.0 43.4 42.0 84.0 98.3 40.6 32.2 71.8 83.6 30.0 32.7 57.3 Salt Segment: Reported GAAP segment operating earnings 39.4 22.4 19.2 91.6 44.5 26.2 22.5 67.8 75.9 24.0 10.0 57.3 56.8 12.1 12.5 34.1 Depreciation, depletion and amortization 16.2 17.7 17.6 18.0 17.4 17.4 17.2 14.6 16.0 14.3 14.8 15.3 13.7 13.7 14.1 14.7 Segment EBITDA 55.6 40.1 36.8 109.6 61.9 43.6 39.7 82.4 91.9 38.3 24.8 72.6 70.5 25.8 26.6 48.8 Executive transition costs(1) - - - - - - - - - 1.3 - - - - - - Logistics impact due to flooding - - - - - - - - - - 2.8 - - - - - Segment adjusted EBITDA 55.6 40.1 36.8 109.6 61.9 43.6 39.7 82.4 91.9 39.6 27.6 72.6 70.5 25.8 26.6 48.8 Segment sales 273.9 159.5 142.6 369.0 228.5 141.2 121.9 287.8 310.9 159.6 112.6 306.4 284.1 137.0 121.1 315.9 Segment EBITDA margin 20.3% 25.1% 25.8% 29.7% 27.1% 30.9% 32.6% 28.6% 29.6% 24.0% 22.0% 23.7% 24.8% 18.8% 22.0% 15.4% Segment Adjusted EBITDA margin 20.3% 25.1% 25.8% 29.7% 27.1% 30.9% 32.6% 28.6% 29.6% 24.8% 24.5% 23.7% 24.8% 18.8% 22.0% 15.4% Plant Nutrition Segment: Reported GAAP segment operating earnings (loss) 9.5 (0.2) 0.7 5.3 3.3 1.1 6.3 4.6 8.7 4.0 6.0 - 9.6 1.6 4.4 7.3 Depreciation, depletion and amortization 8.8 8.9 9.1 8.8 9.0 9.3 9.6 9.8 10.4 10.3 10.3 10.7 10.5 12.0 12.1 10.4 Segment EBITDA 18.3 8.7 9.8 14.1 12.3 10.4 15.9 14.4 19.1 14.3 16.3 10.7 20.1 13.6 16.5 17.7 Segment sales 54.6 49.3 53.8 53.7 78.2 30.8 51.0 55.4 67.2 40.9 44.1 33.7 76.2 36.7 47.6 50.4 Segment EBITDA margin 33.5% 17.6% 18.2% 26.3% 15.7% 33.8% 31.2% 26.0% 28.4% 35.0% 37.0% 31.8% 26.4% 37.1% 34.7% 35.1% Three months ended Three months ended Three months ended Three months ended 2021 2020 2019 2018


