UNITED STATES
SECURITIES AND EXCHANGE COMMISSION
Washington, D.C. 20549
FORM N-CSR
CERTIFIED SHAREHOLDER REPORT OF REGISTERED
MANAGEMENT INVESTMENT COMPANIES
Investment Company Act file number: 811-21338
AllianzGI Convertible & Income Fund II
(Exact name of registrant as specified in charter)
1633 Broadway, New York, NY 10019
(Address of principal executive offices) (Zip code)
Scott Whisten – 1633 Broadway, New York, New York 10019
(Name and address of agent for service)
Registrant’s telephone number, including area code: 212-739-3367
Date of fiscal year end: February 28
Date of reporting period: February 28, 2018
Item 1. Report to Shareholders
AllianzGI Convertible & Income 2024 Target Term Fund
AllianzGI Convertible & Income Fund
AllianzGI Convertible & Income Fund II
Annual Report
February 28, 2018


Table of Contents
Letter from the President

Thomas J. Fuccillo
President & Chief Executive Officer
Dear Shareholder:
The US economy continued to expand during the twelve-month fiscal reporting period ended February 28, 2018. This trend also occurred outside the US, and global inflation remained well-contained. Against this backdrop, US and international equities generated very strong results. Elsewhere, the US bond market posted a modest gain during the reporting period.
For the period since it’s inception on June 30, 2017 through February 28, 2018:
| ∎ | | AllianzGI Convertible & Income 2024 Target Term Fund returned 2.87% on net asset value (“NAV”) and -4.59% on market price. |
For the twelve-month reporting period ended February 28, 2018:
| ∎ | | AllianzGI Convertible & Income Fund returned 7.04% on NAV and 12.22% on market price. |
| ∎ | | AllianzGI Convertible & Income Fund II returned 7.33% on NAV and 10.84% on market price. |
During the twelve-month period ended February 28, 2018, the Standard & Poor’s (“S&P”) 500 Index, an unmanaged index generally representative of the US stock market, rose 17.09% and the ICE BofA Merrill Lynch High Yield Master II Index, an unmanaged index generally representative of the high yield bond market, gained 4.12%. Convertible securities, which share characteristics of both stocks and bonds, also generated strong results. The ICE BofA Merrill Lynch All Convertibles All Qualities Index, an unmanaged index generally representative of the convertible securities market, returned 10.77%.
Turning to the US economy, gross domestic product (“GDP”), the value of goods and services produced in the country, which is the broadest measure of economic activity and the principal indicator of economic performance, expanded at a 1.2% annualized pace during the first quarter of 2017. GDP growth then improved to an annual pace of 3.1% and 3.2% during the second and third quarters of 2017, respectively. Finally, the Commerce Department’s third reading — released after the reporting period had ended — showed that GDP grew at an annual pace of 2.9% for the fourth quarter of 2017.
The US Federal Reserve (the “Fed”) raised interest rates three times during the reporting period: in March 2017, June 2017 and December 2017. With the rate hike in December, the federal funds rate moved to a range between 1.25% and 1.50%. Meanwhile, in October 2017 the Fed started to gradually reduce its balance sheet — a process that will likely take several years. The Fed’s actions during the fiscal year were well telegraphed and there were minimal market disruptions. On March 21, 2018 — after the reporting period had ended — the Fed again raised rates, pushing the federal funds rate to a range between 1.50% and 1.75%.
| | | | |
| 2 | | Annual Report | | | February 28, 2018 |
Outlook
Since the depths of the global financial crisis, central banks have supported financial markets and the economies they serve through expansionary monetary policies, increasing their balance sheets to previously unheard-of sizes. In our opinion, the strong growth in corporate profits and diminishing fears of deflation show that this approach has worked, and central banks will be careful not to stifle current gains.
Receive this report electronically and eliminate paper mailings.
To enroll, visit
us.allianzgi.com/edelivery.
So, while we anticipate the scale of central bank support will diminish in 2018 — led by the Fed — we expect the overall shift to be slow and the precise actions to vary from one central bank to the next. In our view, interest rates will stay low overall in 2018. Consequently, we believe investors should continue to keep a careful eye on inflation, particularly because official data appear to understate rises in real-world costs. In addition to macroeconomic considerations, we feel several dominant investment themes, including geopolitical risk and business disruption, will persist in 2018.
Against this backdrop, we will continue to use our fundamental research and insights — and our strong global network — to help our clients balance risk and reward. Where appropriate, we will also seek to capitalize on volatility spikes and prepare to trim exposure to risky assets if cyclical data start to lose momentum.
For specific information on the Funds and their performance, please refer to the following pages. If you have any questions regarding the information provided, we encourage you to contact your financial advisor or call the Funds’ shareholder servicing agent at (800) 254-5197. In addition, a wide range of information and resources is available on our website, us.allianzgi.com/en-us/products-solutions/closed-end-funds.
On behalf of Allianz Global Investors U.S. LLC, the Funds’ investment manager, thank you for investing with us.
We remain dedicated to serving your investment needs.
Sincerely,
|
 |
| Thomas J. Fuccillo |
| President & Chief Executive Officer |
| | | | | | |
| February 28, 2018 | | | Annual Report | | | 3 | |
Fund Insights
AllianzGI Convertible & Income 2024 Target Term Fund / AllianzGI Convertible & Income Fund /AllianzGI Convertible & Income Fund II
February 28, 2018 (unaudited)
AllianzGI Convertible & Income 2024 Target Term Fund
For the period from inception on June 30, 2017 through February 28, 2018, as provided by Doug Forsyth, CFA, Portfolio Manager.
For the period since the Fund’s inception through February 28, 2018, the AllianzGI Convertible & Income 2024 Target Term Fund (the “Fund”) returned 2.87% on net asset value (“NAV”) and -4.59% on market price.
Market Environment
Several factors influenced convertible bonds, high-yield bonds, and senior secured loans throughout the reporting period, including constructive economic trends, corporate fundamentals, the US Federal Reserve’s (the “Fed”) actions and commentary, tax reform and rising commodity prices.
Strong US economic trends supported the market over the reporting period. Key manufacturing and service surveys signaled ongoing expansion and housing prices rose. The unemployment rate continued to decline, consumer confidence remained elevated and inflation remained relatively stable.
Credit and profitability trends showed sustained improvement during the reporting period with most convertible, high-yield bond, and senior secured loan issuers reporting financial results that met or exceeded expectations. In particular, net leverage and interest coverage for the high-yield market were better quarter-over-quarter.
The Fed increased its benchmark interest rate three times in 2017, ending the year with a range of 1.25% to 1.50%. The Fed also began to
trim its balance sheet holdings, starting with a $10 billion reduction in October 2017.
All three markets also benefited from optimism tied to tax reform progress and the resulting expectation of greater corporate profitability. The Tax Cuts and Jobs Act included several positive elements such as a reduction in the corporate tax rate and the immediate expensing of capital expenditures. However, the bill placed limits on the deductibility of interest expense. On balance, the prospect of US companies capturing tax savings lifted investor sentiment.
Crude oil prices rose during the reporting period and in January 2018 reached levels not seen since 2014, which benefited energy- and commodity-related issuers.
Portfolio Specifics
The Fund was a natural beneficiary of investors’ increased appetite for risk assets. The convertible, high-yield bond, and senior secured loan asset classes all finished the reporting period higher. In addition to providing a strong total return, the Fund also provided a high level of income over the reporting period.
In the convertible bond sleeve, sectors that contributed positively to relative performance were energy, materials, and industrials. On the other hand, transportation, media, and utilities pressured relative performance.
In the high-yield bond sleeve, industry exposure that helped relative performance included healthcare, financial services, and technology and electronics. Conversely, the telecommunication, energy, and support-services industries hindered relative performance.
| | | | |
| 4 | | Annual Report | | | February 28, 2018 |
In the senior secured loan sleeve, all industries were positive. The top-contributing industries included technology and electronics, healthcare, and trucking and delivery.
Outlook
At the end of the reporting period, US stock markets were trading near all-time highs and interest rates were above their prior lows on an improving economic outlook. Historically, these factors have been positive indicators for both economic and corporate earnings growth and supportive of investments in risk assets.
We believe the US economy will expand at a moderate pace in 2018 given favorable economic indicators exiting 2017. We believe the impact of tax cuts, progress toward an infrastructure spending bill and continued deregulation efforts could result in even stronger US growth. Conversely, potential risks to the economy include geopolitical and US political missteps, monetary policy surprises by the Fed or unexpected high rates of inflation.
After bottoming in the second quarter of 2016, corporate profits have accelerated through the fourth quarter of 2017. Based on bottom-up estimates, we believe earnings are poised to trend higher throughout 2018.
AllianzGI Convertible & Income Fund / AllianzGI Convertible & Income Fund II
For the period of March 1, 2017, through February 28, 2018, as provided by Doug Forsyth, CFA, Portfolio Manager.
For the twelve-month period ended February 28, 2018, the AllianzGI Convertible & Income Fund returned 7.04% on net asset value (“NAV”) and 12.22% on market price.
For the twelve-month period ended February 28, 2018, the AllianzGI Convertible & Income Fund II returned 7.33% on NAV and 10.84% on market price.
Market Environment
Several factors influenced convertible bonds and high-yield bonds throughout the reporting period, including constructive economic trends, corporate fundamentals, the US Federal Reserve’s (the “Fed”) actions and commentary, tax reform and rising commodity prices.
Strong US economic trends supported the market over the reporting period. Key manufacturing and service surveys signaled ongoing expansion and housing prices rose. The unemployment rate continued to decline, consumer confidence remained elevated and inflation remained relatively stable.
Credit and profitability trends showed sustained improvement during the reporting period with most convertible and high-yield bond issuers reported financial results that met or exceeded expectations. In particular, net leverage and interest coverage for the high-yield market were better quarter-over-quarter.
The Fed increased its benchmark interest rate three times in 2017, ending the year with a range of 1.25% to 1.50%. The Fed also began to trim its balance sheet holdings, starting with a $10 billion reduction in October.
Both markets also benefited from optimism tied to tax reform progress and the resulting expectation of greater corporate profitability. The Tax Cuts and Jobs Act included several positive elements such as a reduction in the corporate tax rate and the immediate expensing of capital expenditures. However, the bill placed limits on the deductibility of interest expense. On balance, the prospect of US companies capturing tax savings lifted investor sentiment.
Crude oil prices rose during the reporting period and in January reached levels not seen since 2014, which benefited energy- and commodity-related issuers.
Portfolio Specifics
The Funds were natural beneficiaries of investors’ increased risk appetite across the convertible and high-yield bond asset classes. In addition to providing a strong total return, the Funds also provided a high level of income over the reporting period.
In the convertible sleeve, sectors that contributed positively to relative performance were consumer discretionary, healthcare, and media. On the other hand, technology, telecommunication, and financials sectors pressured relative performance.
| | | | | | |
| February 28, 2018 | | | Annual Report | | | 5 | |
In the high-yield bond sleeve, industries that aided relative performance were financial services, retail, and healthcare. In contrast, printing and publishing, telecommunications, and support-services hampered relative performance.
Outlook
At the end of the reporting period, US stock markets were trading near all-time highs and interest rates were above their prior lows on an improving economic outlook. Historically, these factors have been positive indicators for both economic and corporate earnings growth and supportive of investments in risk assets.
We believe the US economy will expand at a moderate pace in 2018 given favorable economic indicators exiting 2017. Corporate profits have accelerated and based on bottom-up estimates, earnings are poised to trend higher throughout 2018.
In addition, US monetary policy continues to be modestly accommodative with the Fed and new Chair Jerome Powell expected to take a gradual approach toward policy adjustments.
| | | | |
| 6 | | Annual Report | | | February 28, 2018 |
Performance & Statistics
AllianzGI Convertible & Income 2024 Target Term Fund
February 28, 2018 (unaudited)
| | | | | | | | |
| Total Return(1): | | Market Price | | | NAV | |
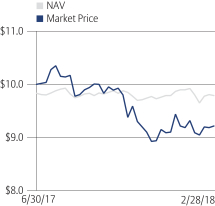
Commencement of Operations (6/30/17) to 2/28/18 | | | -4.59% | | | | 2.87% | |
| | |
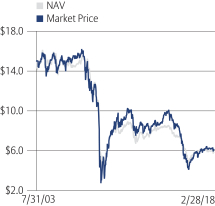
| Market Price/NAV Performance: | | |
Commencement of Operations (6/30/17) to 2/28/18
| | | | |
| Market Price/NAV: | | | |
Market Price | | | $9.22 | |
NAV(2) | | | $9.79 | |
Discount to NAV | | | -5.82% | |
Market Price Yield(3) | | | 5.99% | |
Leverage(4) | | | 28.05% | |
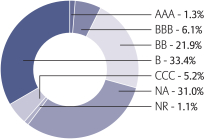
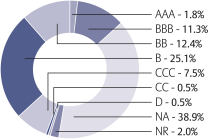
S&P Global Ratings*
(as a % of total investments)
See “Notes to Performance & Statistics” on page 10.
| | | | | | |
| February 28, 2018 | | | Annual Report | | | 7 | |
Performance & Statistics
AllianzGI Convertible & Income Fund
February 28, 2018 (unaudited)
| | | | | | | | |
| Total Return(1): | | Market Price | | | NAV | |
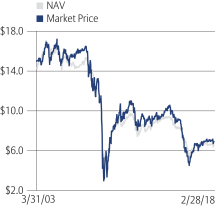
1 Year | | | 12.22% | | | | 7.04% | |
5 Year | | | 6.69% | | | | 6.44% | |
10 Year | | | 7.28% | | | | 6.82% | |
Commencement of Operations (3/31/03) to 2/28/18 | | | 7.72% | | | | 7.77% | |
| | |
| Market Price/NAV Performance: | | |
Commencement of Operations (3/31/03) to 2/28/18
| | | | |
| Market Price/NAV: | | | |
Market Price | | | $6.93 | |
NAV(2) | | | $6.54 | |
Premium to NAV | | | 5.96% | |
Market Price Yield(3) | | | 11.10% | |
Leverage(5) | | | 38.07% | |
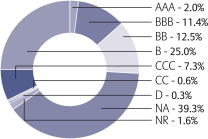
S&P Global Ratings*
(as a % of total investments)
See “Notes to Performance & Statistics” on page 10.
| | | | |
| 8 | | Annual Report | | | February 28, 2018 |
Performance & Statistics
AllianzGI Convertible & Income Fund II
February 28, 2018 (unaudited)
| | | | | | | | |
| Total Return(1): | | Market Price | | | NAV | |
1 Year | | | 10.84% | | | | 7.33% | |
5 Year | | | 5.67% | | | | 6.48% | |
10 Year | | | 6.53% | | | | 6.17% | |
Commencement of Operations (7/31/03) to 2/28/18 | | | 6.51% | | | | 6.76% | |
| | |
| Market Price/NAV Performance: | | |
Commencement of Operations (7/31/03) to 2/28/18
| | | | |
| Market Price/NAV: | | | |
Market Price | | | $6.10 | |
NAV(2) | | | $5.87 | |
Premium to NAV | | | 3.92% | |
Market Price Yield(3) | | | 10.01% | |
Leverage(5) | | | 38.37% | |
S&P Global Ratings*
(as a % of total investments)
See “Notes to Performance & Statistics” on page 10.
| | | | | | |
| February 28, 2018 | | | Annual Report | | | 9 | |
Performance and Statistics
AllianzGI Convertible & Income Funds
February 28, 2018 (unaudited)
Notes to Performance & Statistics:
* Credit ratings apply to the underlying holdings of the Funds and not the Funds themselves and are divided into categories ranging from highest to lowest credit quality, determined for purposes of presentations in this report by using ratings provided by S&P Global Ratings (“S&P”). Presentations of credit ratings information in this report use ratings provided by S&P for this purpose, among other reasons, because of the access to background information and other materials provided by S&P, as well as the Funds’ considerations of industry practice. Securities not rated by S&P, or bonds that do not have a rating available from S&P, or bonds that had a rating withdrawn by S&P are designated as “NR” or “NA”, respectively. Credit quality ratings assigned by a rating agency are subjective opinions, not statements of fact, and are subject to change periodically, even as frequently as daily. Ratings assigned by S&P or another rating agency are not absolute standards of credit quality and do not evaluate market risk. Rating agencies may fail to make timely changes in credit ratings, and an issuer’s current financial condition may be better or worse than a rating indicates. In formulating investment decisions for the Funds, Allianz Global Investors U.S. LLC develops its own analysis of the credit quality and risks associated with individual debt instruments, rather than relying exclusively on rating agencies or third-party research.
(1) Past performance is no guarantee of future results. Total return is calculated by determining the percentage change in NAV or market price (as applicable) in the specified period. The calculation assumes that all dividends and distributions, if any, have been reinvested. Total return does not reflect broker commissions or sales charges in connection with the purchase or sale of Fund shares. Total return for a period of more than one year represents the average annual total return. Total return for a period of less than one year is not annualized.
Performance at market price will differ from results at NAV. Although market price returns tend to reflect investment results over time, during shorter periods returns at market price can also be influenced by factors such as changing views about the Funds, market conditions, supply and demand for each Fund’s shares, or changes in each Fund’s dividends.
An investment in each Fund involves risk, including the loss of principal. Total return, market price, market price yield and NAV will fluctuate with changes in market conditions. This data is provided for information purposes only and is not intended for trading purposes. Closed-end funds, unlike open-end funds, are not continuously offered. There is a one time public offering and once issued, shares of closed-end funds are traded in the open market through a stock exchange. NAV is equal to total assets attributable to common shareholders less total liabilities divided by the number of common shares outstanding. Holdings are subject to change daily.
(2) The NAV disclosed in the Funds’ financial statements may differ from this NAV due to accounting principles generally accepted in the United States of America.
(3) Market Price Yield is determined by dividing the annualized current monthly dividend per common share (comprised of net investment income) by the market price per common share at February 28, 2018.
(4) Represents amounts drawn under the short-term margin loan facility (“Leverage”) outstanding, as a percentage of total managed assets. Total managed assets refer to total assets (including assets attributable to Leverage) minus liabilities (other than liabilities representing Leverage).
(5) Represents Preferred Shares (“Leverage”) outstanding, as a percentage of total managed assets. Total managed assets refer to total assets (including assets attributable to Leverage) minus liabilities (other than liabilities representing Leverage).
| | | | |
| 10 | | Annual Report | | | February 28, 2018 |
Schedule of Investments
AllianzGI Convertible & Income 2024 Target Term Fund
February 28, 2018
| | | | | | | | | | | | |
Principal
Amount
(000s) | | | | | | | | Value | |
| | Corporate Bonds & Notes – 58.9% | | | | | | | | |
| | | | Aerospace & Defense – 1.7% | | | | | | | | |
| | $1,500 | | | KLX, Inc., 5.875%, 12/1/22 (a)(c)(d) | | | | | | | $1,550,625 | |
| | 1,500 | | | TransDigm, Inc., 6.50%, 7/15/24 (d) | | | | | | | 1,550,625 | |
| | | | | | | | | | | | 3,101,250 | |
| | | | Auto Components – 0.9% | | | | | | | | |
| | 1,500 | | | American Axle & Manufacturing, Inc., 6.625%, 10/15/22 (d) | | | | | | | 1,552,500 | |
| | | | Building Materials – 0.8% | | | | | | | | |
| | 1,500 | | | Builders FirstSource, Inc., 5.625%, 9/1/24 (a)(c)(d) | | | | | | | 1,531,875 | |
| | | | Chemicals – 3.5% | | | | | | | | |
| | 1,500 | | | Chemours Co., 6.625%, 5/15/23 (d) | | | | | | | 1,584,375 | |
| | 1,500 | | | Platform Specialty Products Corp., 6.50%, 2/1/22 (a)(c)(d) | | | | | | | 1,543,125 | |
| | 1,500 | | | Tronox Finance LLC, 7.50%, 3/15/22 (a)(c)(d) | | | | | | | 1,560,000 | |
| | 1,500 | | | Univar USA, Inc., 6.75%, 7/15/23 (a)(c)(d) | | | | | | | 1,565,625 | |
| | | | | | | | | | | | 6,253,125 | |
| | | | Computers – 1.9% | | | | | | | | |
| | 1,500 | | | Dell International LLC, 7.125%, 6/15/24 (a)(c)(d) | | | | | | | 1,620,347 | |
| | 1,500 | | | Western Digital Corp., 10.50%, 4/1/24 (d) | | | | | | | 1,745,625 | |
| | | | | | | | | | | | 3,365,972 | |
| | | | Diversified Financial Services – 4.4% | | | | | | | | |
| | 2,000 | | | Community Choice Financial, Inc., 10.75%, 5/1/19 (d) | | | | | | | 1,905,000 | |
| | 1,500 | | | Nationstar Mortgage LLC, 7.875%, 10/1/20 (d) | | | | | | | 1,540,313 | |
| | 2,000 | | | Navient Corp., 7.25%, 9/25/23 (d) | | | | | | | 2,135,000 | |
| | 2,000 | | | Springleaf Finance Corp., 8.25%, 10/1/23 (d) | | | | | | | 2,210,000 | |
| | | | | | | | | | | | 7,790,313 | |
| | | | Electric Utilities – 0.9% | | | | | | | | |
| | 1,500 | | | NRG Energy, Inc., 6.25%, 5/1/24 (d) | | | | | | | 1,560,000 | |
| | | | Engineering & Construction – 0.9% | | | | | | | | |
| | 1,500 | | | AECOM, 5.875%, 10/15/24 (d) | | | | | | | 1,571,250 | |
| | | | Entertainment – 0.9% | | | | | | | | |
| | 1,500 | | | Cedar Fair L.P., 5.375%, 6/1/24 (d) | | | | | | | 1,546,875 | |
| | | | Healthcare-Services – 5.3% | | | | | | | | |
| | 1,500 | | | Community Health Systems, Inc., 6.25%, 3/31/23 (d) | | | | | | | 1,372,500 | |
| | 1,500 | | | DaVita, Inc., 5.125%, 7/15/24 (d) | | | | | | | 1,492,500 | |
| | 215 | | | Encompass Health Corp., 5.75%, 11/1/24 | | | | | | | 218,762 | |
| | 1,500 | | | Envision Healthcare Corp., 6.25%, 12/1/24 (a)(c)(d) | | | | | | | 1,586,250 | |
| | 1,500 | | | HCA, Inc., 7.50%, 2/15/22 (d) | | | | | | | 1,663,125 | |
| | 1,500 | | | Kindred Healthcare, Inc., 8.75%, 1/15/23 (d) | | | | | | | 1,612,500 | |
| | 1,500 | | | Tenet Healthcare Corp., 8.125%, 4/1/22 (d) | | | | | | | 1,584,375 | |
| | | | | | | | | | | | 9,530,012 | |
| | | | Home Builders – 1.5% | | | | | | | | |
| | 1,000 | | | Beazer Homes USA, Inc., 8.75%, 3/15/22 (d) | | | | | | | 1,082,500 | |
| | 1,500 | | | Lennar Corp., 5.875%, 11/15/24 (a)(c) | | | | | | | 1,601,250 | |
| | | | | | | | | | | | 2,683,750 | |
| | | | Internet & Catalog Retail – 0.9% | | | | | | | | |
| | 1,500 | | | Netflix, Inc., 5.875%, 2/15/25 | | | | | | | 1,588,665 | |
| | | | | | | | |
| See accompanying Notes to Financial Statements | | | February 28, 2018 | | | Annual Report | | | 11 | |
Schedule of Investments
AllianzGI Convertible & Income 2024 Target Term Fund
February 28, 2018 (continued)
| | | | | | | | | | | | |
Principal
Amount
(000s) | | | | | | | | Value | |
| | | | Iron/Steel – 1.6% | | | | | | | | |
| | $1,500 | | | AK Steel Corp., 7.50%, 7/15/23 (d) | | | | | | | $1,608,750 | |
| | 1,193 | | | United States Steel Corp., 8.375%, 7/1/21 (a)(c)(d) | | | | | | | 1,279,493 | |
| | | | | | | | | | | | 2,888,243 | |
| | | | Lodging – 0.8% | | | | | | | | |
| | 1,500 | | | Wynn Las Vegas LLC, 5.50%, 3/1/25 (a)(c)(d) | | | | | | | 1,524,375 | |
| | | | Machinery-Construction & Mining – 1.1% | | | | | | | | |
| | 2,000 | | | Terex Corp., 5.625%, 2/1/25 (a)(c)(d) | | | | | | | 2,022,500 | |
| | | | Media – 5.2% | | | | | | | | |
| | 1,500 | | | CCO Holdings LLC, 5.75%, 1/15/24 (d) | | | | | | | 1,530,000 | |
| | 1,500 | | | Clear Channel Worldwide Holdings, Inc., 6.50%, 11/15/22, Ser. B (d) | | | | | | | 1,548,750 | |
| | 1,500 | | | CSC Holdings LLC, 6.75%, 11/15/21 (d) | | | | | | | 1,581,563 | |
| | 1,500 | | | DISH DBS Corp., 5.875%, 7/15/22 (d) | | | | | | | 1,468,125 | |
| | 1,659 | | | McClatchy Co., 9.00%, 12/15/22 (d) | | | | | | | 1,737,802 | |
| | 1,500 | | | Nexstar Broadcasting, Inc., 5.625%, 8/1/24 (a)(c)(d) | | | | | | | 1,511,250 | |
| | | | | | | | | | | | 9,377,490 | |
| | | | Mining – 4.2% | | | | | | | | |
| | 1,500 | | | Alcoa Nederland Holding BV, 6.75%, 9/30/24 (a)(c)(d) | | | | | | | 1,616,250 | |
| | 2,000 | | | Constellium NV, 6.625%, 3/1/25 (a)(c) | | | | | | | 2,075,000 | |
| | 2,000 | | | Hudbay Minerals, Inc., 7.625%, 1/15/25 (a)(c)(d) | | | | | | | 2,185,000 | |
| | 1,500 | | | Joseph T. Ryerson & Son, Inc., 11.00%, 5/15/22 (a)(c)(d) | | | | | | | 1,673,775 | |
| | | | | | | | | | | | 7,550,025 | |
| | | | Miscellaneous Manufacturing – 0.9% | | | | | | | | |
| | 1,500 | | | Koppers, Inc., 6.00%, 2/15/25 (a)(c)(d) | | | | | | | 1,556,250 | |
| | | | Oil, Gas & Consumable Fuels – 4.9% | | | | | | | | |
| | 1,500 | | | Callon Petroleum Co., 6.125%, 10/1/24 | | | | | | | 1,537,500 | |
| | 1,500 | | | Calumet Specialty Products Partners L.P., 6.50%, 4/15/21 | | | | | | | 1,470,000 | |
| | 1,500 | | | Carrizo Oil & Gas, Inc., 6.25%, 4/15/23 (d) | | | | | | | 1,511,250 | |
| | 1,500 | | | Continental Resources, Inc., 5.00%, 9/15/22 (d) | | | | | | | 1,526,250 | |
| | 825 | | | CVR Refining LLC, 6.50%, 11/1/22 | | | | | | | 848,719 | |
| | 280 | | | Noble Holding International Ltd., 7.75%, 1/15/24 | | | | | | | 256,200 | |
| | 1,500 | | | Oasis Petroleum, Inc., 6.875%, 3/15/22 (d) | | | | | | | 1,540,312 | |
| | | | | | | | | | | | 8,690,231 | |
| | | | Pharmaceuticals – 2.0% | | | | | | | | |
| | 2,000 | | | Horizon Pharma, Inc., 6.625%, 5/1/23 | | | | | | | 2,010,000 | |
| | 1,500 | | | Valeant Pharmaceuticals International, Inc., 7.50%, 7/15/21 (a)(c)(d) | | | | | | | 1,513,125 | |
| | | | | | | | | | | | 3,523,125 | |
| | | | Real Estate – 1.9% | | | | | | | | |
| | 1,500 | | | Kennedy-Wilson, Inc., 5.875%, 4/1/24 (d) | | | | | | | 1,505,625 | |
| | 1,950 | | | Uniti Group L.P., 8.25%, 10/15/23 (d) | | | | | | | 1,828,125 | |
| | | | | | | | | | | | 3,333,750 | |
| | | | Retail – 1.1% | | | | | | | | |
| | 2,000 | | | Conn’s, Inc., 7.25%, 7/15/22 (d) | | | | | | | 1,990,000 | |
| | | | Semiconductors – 0.9% | | | | | | | | |
| | 1,515 | | | Advanced Micro Devices, Inc., 7.00%, 7/1/24 | | | | | | | 1,592,644 | |
| | | | Software – 3.5% | | | | | | | | |
| | 2,000 | | | Camelot Finance S.A., 7.875%, 10/15/24 (a)(c) | | | | | | | 2,125,600 | |
| | | | | | |
| 12 | | Annual Report | | | February 28, 2018 | | | See accompanying Notes to Financial Statements |
Schedule of Investments
AllianzGI Convertible & Income 2024 Target Term Fund
February 28, 2018 (continued)
| | | | | | | | | | | | |
Principal
Amount
(000s) | | | | | | | | Value | |
| | | | Software (continued) | | | | | | | | |
| | $1,500 | | | First Data Corp., 7.00%, 12/1/23 (a)(c)(d) | | | | | | | $1,580,625 | |
| | 1,000 | | | Rackspace Hosting, Inc., 8.625%, 11/15/24 (a)(c) | | | | | | | 1,045,000 | |
| | 1,500 | | | SS&C Technologies Holdings, Inc., 5.875%, 7/15/23 (d) | | | | | | | 1,584,375 | |
| | | | | | | | | | | | 6,335,600 | |
| | | | Telecommunications – 6.3% | | | | | | | | |
| | 2,000 | | | CenturyLink, Inc., 7.50%, 4/1/24, Ser. Y (d) | | | | | | | 2,015,000 | |
| | 1,500 | | | Cincinnati Bell, Inc., 7.00%, 7/15/24 (a)(c)(d) | | | | | | | 1,427,250 | |
| | 2,000 | | | Consolidated Communications, Inc., 6.50%, 10/1/22 (d) | | | | | | | 1,760,000 | |
| | 2,000 | | | GTT Communications, Inc., 7.875%, 12/31/24 (a)(c)(d) | | | | | | | 2,083,750 | |
| | 1,500 | | | Hughes Satellite Systems Corp., 7.625%, 6/15/21 (d) | | | | | | | 1,620,000 | |
| | 1,500 | | | Sprint Corp., 7.125%, 6/15/24 (d) | | | | | | | 1,480,312 | |
| | 1,620 | | | Windstream Services LLC, 6.375%, 8/1/23 (a)(c) | | | | | | | 915,300 | |
| | | | | | | | | | | | 11,301,612 | |
| | | | Transportation – 0.9% | | | | | | | | |
| | 1,500 | | | XPO Logistics, Inc., 6.50%, 6/15/22 (a)(c)(d) | | | | | | | 1,564,500 | |
| | Total Corporate Bonds & Notes (cost-$107,312,512) | | | | | | | 105,325,932 | |
| | Convertible Bonds & Notes – 56.9% | | | | | | | | |
| | | | Auto Components – 1.3% | | | | | | | | |
| | 2,825 | | | Horizon Global Corp., 2.75%, 7/1/22 (d) | | | | | | | 2,300,609 | |
| | | | Auto Manufacturers – 0.6% | | | | | | | | |
| | 1,000 | | | Navistar International Corp., 4.75%, 4/15/19 (d) | | | | | | | 1,040,174 | |
| | | | Biotechnology – 2.6% | | | | | | | | |
| | 2,500 | | | Exact Sciences Corp., 1.00%, 1/15/25 | | | | | | | 2,279,687 | |
| | 1,500 | | | Innoviva, Inc., 2.125%, 1/15/23 (d) | | | | | | | 1,556,471 | |
| | 1,000 | | | PTC Therapeutics, Inc., 3.00%, 8/15/22 (d) | | | | | | | 880,000 | |
| | | | | | | | | | | | 4,716,158 | |
| | | | Commercial Services – 2.0% | | | | | | | | |
| | 2,500 | | | Macquarie Infrastructure Corp., 2.00%, 10/1/23 | | | | | | | 2,261,640 | |
| | 1,250 | | | Team, Inc., 5.00%, 8/1/23 (a)(c) | | | | | | | 1,350,296 | |
| | | | | | | | | | | | 3,611,936 | |
| | | | Computers – 1.1% | | | | | | | | |
| | 2,000 | | | KeyW Holding Corp., 2.50%, 7/15/19 (d) | | | | | | | 1,922,236 | |
| | | | Distribution/Wholesale – 1.7% | | | | | | | | |
| | 3,000 | | | Titan Machinery, Inc., 3.75%, 5/1/19 (d) | | | | | | | 2,980,062 | |
| | | | Diversified Financial Services – 3.1% | | | | | | | | |
| | 2,550 | | | Encore Capital Group, Inc., 2.875%, 3/15/21 (d) | | | | | | | 2,541,786 | |
| | 3,000 | | | PRA Group, Inc., 3.00%, 8/1/20 (d) | | | | | | | 2,919,849 | |
| | | | | | | | | | | | 5,461,635 | |
| | | | Electrical Equipment – 1.5% | | | | | | | | |
| | 3,215 | | | SunPower Corp., 4.00%, 1/15/23 (d) | | | | | | | 2,602,221 | |
| | | | Electronics – 0.8% | | | | | | | | |
| | 1,500 | | | OSI Systems, Inc., 1.25%, 9/1/22 (a)(c) | | | | | | | 1,347,188 | |
| | | | Energy-Alternate Sources – 3.3% | | | | | | | | |
| | 500 | | | NextEra Energy Partners L.P., 1.50%, 9/15/20 (a)(c) | | | | | | | 490,002 | |
| | 3,000 | | | Pattern Energy Group, Inc., 4.00%, 7/15/20 | | | | | | | 2,988,498 | |
| | 2,500 | | | SolarCity Corp., 1.625%, 11/1/19 (d) | | | | | | | 2,343,420 | |
| | | | | | | | | | | | 5,821,920 | |
| | | | | | | | |
| See accompanying Notes to Financial Statements | | | February 28, 2018 | | | Annual Report | | | 13 | |
Schedule of Investments
AllianzGI Convertible & Income 2024 Target Term Fund
February 28, 2018 (continued)
| | | | | | | | | | | | |
Principal
Amount
(000s) | | | | | | | | Value | |
| | | | Equity Real Estate Investment Trusts (REITs) – 7.8% | | | | | | | | |
| | $2,850 | | | IAS Operating Partnership L.P., 5.00%, 3/15/18 (a)(c)(d) | | | | | | | $2,857,125 | |
| | 3,000 | | | PennyMac Corp., 5.375%, 5/1/20 (d) | | | | | | | 3,003,753 | |
| | 1,000 | | | Redwood Trust, Inc., 4.75%, 8/15/23 | | | | | | | 962,200 | |
| | 2,850 | | | Starwood Property Trust, Inc., 4.375%, 4/1/23 (d) | | | | | | | 2,878,372 | |
| | 2,750 | | | Two Harbors Investment Corp., 6.25%, 1/15/22 (d) | | | | | | | 2,827,146 | |
| | 1,500 | | | Western Asset Mortgage Capital Corp., 6.75%, 10/1/22 | | | | | | | 1,479,000 | |
| | | | | | | | | | | | 14,007,596 | |
| | | | Healthcare/Healthcare Distributors – 1.5% | | | | | | | | |
| | 3,100 | | | Aceto Corp., 2.00%, 11/1/20 (d) | | | | | | | 2,743,199 | |
| | | | Insurance – 2.3% | | | | | | | | |
| | 1,500 | | | AmTrust Financial Services, Inc., 2.75%, 12/15/44 (d) | | | | | | | 1,319,654 | |
| | 3,000 | | | HCI Group, Inc., 4.25%, 3/1/37 (a)(c) | | | | | | | 2,724,996 | |
| | | | | | | | | | | | 4,044,650 | |
| | | | Internet – 2.8% | | | | | | | | |
| | 3,000 | | | FireEye, Inc., 1.625%, 6/1/35, Ser. B (d) | | | | | | | 2,795,424 | |
| | 2,500 | | | Pandora Media, Inc., 1.75%, 12/1/20 (d) | | | | | | | 2,266,250 | |
| | | | | | | | | | | | 5,061,674 | |
| | | | Investment Companies – 5.1% | | | | | | | | |
| | 2,900 | | | Goldman Sachs BDC, Inc., 4.50%, 4/1/22 | | | | | | | 2,948,395 | |
| | 3,000 | | | Prospect Capital Corp., 4.95%, 7/15/22 (d) | | | | | | | 3,006,411 | |
| | 3,000 | | | TPG Specialty Lending, Inc., 4.50%, 8/1/22 (a) | | | | | | | 3,098,169 | |
| | | | | | | | | | | | 9,052,975 | |
| | | | Oil, Gas & Consumable Fuels – 7.2% | | | | | | | | |
| | 1,500 | | | Ensco Jersey Finance Ltd., 3.00%, 1/31/24 | | | | | | | 1,241,250 | |
| | 3,000 | | | Green Plains, Inc., 4.125%, 9/1/22 | | | | | | | 2,991,477 | |
| | 3,000 | | | Helix Energy Solutions Group, Inc., 4.25%, 5/1/22 (d) | | | | | | | 2,833,827 | |
| | 3,425 | | | Nabors Industries, Inc., 0.75%, 1/15/24 (a)(c)(d) | | | | | | | 2,613,200 | |
| | 3,150 | | | PDC Energy, Inc., 1.125%, 9/15/21 (d) | | | | | | | 3,188,253 | |
| | | | | | | | | | | | 12,868,007 | |
| | | | Pharmaceuticals – 4.8% | | | | | | | | |
| | 2,000 | | | Depomed, Inc., 2.50%, 9/1/21 | | | | | | | 1,655,890 | |
| | 1,750 | | | DexCom, Inc., 0.75%, 5/15/22 (a)(c) | | | | | | | 1,636,607 | |
| | 3,250 | | | Horizon Pharma Investment Ltd., 2.50%, 3/15/22 (d) | | | | | | | 3,010,312 | |
| | 1,000 | | | Jazz Investments I Ltd., 1.50%, 8/15/24 (a)(c) | | | | | | | 953,798 | |
| | 1,500 | | | Pacira Pharmaceuticals, Inc., 2.375%, 4/1/22 (a)(c) | | | | | | | 1,381,760 | |
| | | | | | | | | | | | 8,638,367 | |
| | | | Retail – 0.5% | | | | | | | | |
| | 1,000 | | | RH, zero coupon, 7/15/20 (a)(c) | | | | | | | 965,676 | |
| | | | Semiconductors – 3.7% | | | | | | | | |
| | 2,000 | | | Inphi Corp., 0.75%, 9/1/21 | | | | | | | 1,843,240 | |
| | 1,750 | | | Synaptics, Inc., 0.50%, 6/15/22 (a)(c) | | | | | | | 1,685,598 | |
| | 3,300 | | | Veeco Instruments, Inc., 2.70%, 1/15/23 (d) | | | | | | | 3,059,305 | |
| | | | | | | | | | | | 6,588,143 | |
| | | | Software – 1.1% | | | | | | | | |
| | 2,000 | | | Evolent Health, Inc., 2.00%, 12/1/21 | | | | | | | 2,057,094 | |
| | | | | | |
| 14 | | Annual Report | | | February 28, 2018 | | | See accompanying Notes to Financial Statements |
Schedule of Investments
AllianzGI Convertible & Income 2024 Target Term Fund
February 28, 2018 (continued)
| | | | | | | | | | | | |
Principal
Amount
(000s) | | | | | | | | Value | |
| | | | Transportation – 2.1% | | | | | | | | |
| | $3,000 | | | Echo Global Logistics, Inc., 2.50%, 5/1/20 (d) | | | | | | | $3,072,003 | |
| | 750 | | | Teekay Corp., 5.00%, 1/15/23 (a)(c) | | | | | | | 719,456 | |
| | | | | | | | | | | | 3,791,459 | |
| | Total Convertible Bonds & Notes (cost-$101,701,569) | | | | | | | 101,622,979 | |
| | Senior Loans (a)(b) – 20.3% | | | | | | | | |
| | | | Aerospace & Defense – 0.5% | | | | | | | | |
| | 912 | | | Engility Corp., 1 mo. LIBOR + 3.250%, 4.898%, 8/12/23, Term Loan B2 | | | | | | | 920,895 | |
| | | | Airlines – 0.6% | | | | | | | | |
| | 995 | | | Delta Air Lines, Inc., 1 mo. LIBOR + 2.500%, 4.09%, 10/18/18, 2018 Term Loan B1 | | | | | | | 1,001,046 | |
| | | | Automobiles – 0.5% | | | | | | | | |
| | | | Winnebago Industries, Inc., 11/8/23, 2017 Term Loan B | | | | | | | | |
| | 317 | | | 1 mo. LIBOR + 3.500%, 5.0793% | | | | | | | 321,655 | |
| | 598 | | | 3 mo. LIBOR + 3.500%, 5.0226% | | | | | | | 607,570 | |
| | | | | | | | | | | | 929,225 | |
| | | | Building Materials – 0.6% | | | | | | | | |
| | 995 | | | GYP Holdings III Corp., 3 mo. LIBOR + 3.000%, 4.772%, 4/1/23, 2017 Term Loan | | | | | | | 1,002,296 | |
| | | | Building Products – 0.5% | | | | | | | | |
| | 839 | | | Ply Gem Industries, Inc., 3 mo. LIBOR + 3.000%, 4.693%, 2/1/21, Term Loan B | | | | | | | 843,961 | |
| | | | Chemicals – 0.8% | | | | | | | | |
| | 547 | | | Kraton Polymers LLC, 1 mo. LIBOR + 3.000%, 4.648%, 1/6/22, 2017 USD Term Loan B | | | | | | | 550,883 | |
| | 877 | | | Omnova Solutions Inc., 1 mo. LIBOR + 4.250%, 5.898%, 8/28/23, 2016 Term Loan B2 | | | | | | | 884,422 | |
| | | | | | | | | | | | 1,435,305 | |
| | | | Commercial Services & Supplies – 0.5% | | | | | | | | |
| | 995 | | | Advanced Disposal Services, Inc., 1 Week LIBOR + 2.250%, 3.721%, 11/10/23, Term Loan B3 | | | | | | | 999,978 | |
| | | | Diversified Consumer Services – 0.4% | | | | | | | | |
| | 776 | | | Laureate Education, Inc., 1 mo. LIBOR + 3.500%, 5.148%, 4/26/24, 2017 Term Loan B | | | | | | | 781,569 | |
| | | | Electronic Equipment, Instruments & Components – 0.5% | | | | | | | | |
| | 841 | | | Zebra Technologies Corp., 3 mo. LIBOR + 2.000%, 3.753%, 10/27/21, 2017 Term Loan B | | | | | | | 846,062 | |
| | | | Electronics – 0.5% | | | | | | | | |
| | 975 | | | Kemet Electronic Corp., 1 mo. LIBOR + 6.000%, 7.648%, 4/26/24, Term Loan B | | | | | | | 993,281 | |
| | | | Food & Staples Retailing – 0.6% | | | | | | | | |
| | 995 | | | US Foods, Inc., 1 mo. LIBOR + 2.50%, 4.148%, 6/27/23, 2016 Term Loan B | | | | | | | 1,003,994 | |
| | | | Healthcare Providers & Services – 0.6% | | | | | | | | |
| | | | Select Medical Corporation, 3/6/24, 2017 Term Loan B | | | | | | | | |
| | 992 | | | 3 mo. LIBOR + 3.500%, 5.21% | | | | | | | 998,245 | |
| | 3 | | | 2 mo. LIBOR + 3.500%, 5.13% | | | | | | | 2,632 | |
| | – | † | | PRIME + 2.500%, 7.00% | | | | | | | 329 | |
| | | | | | | | | | | | 1,001,206 | |
| | | | Healthcare-Products – 0.5% | | | | | | | | |
| | 909 | | | Greatbatch Ltd., 1 mo. LIBOR + 3.250%, 4.83%, 10/27/22, 2017 1st Lien Term Loan B | | | | | | | 918,492 | |
| | | | | | | | |
| See accompanying Notes to Financial Statements | | | February 28, 2018 | | | Annual Report | | | 15 | |
Schedule of Investments
AllianzGI Convertible & Income 2024 Target Term Fund
February 28, 2018 (continued)
| | | | | | | | | | | | |
Principal
Amount
(000s) | | | | | | | | Value | |
| | | | Hotels, Restaurants & Leisure – 3.3% | | | | | | | | |
| | | | 1011778 B.C. Unlimited Liability Company, 2/16/24, Term Loan B3 | | | | | | | | |
| | $390 | | | 3 mo. LIBOR + 2.250%, 3.943% | | | | | | | $391,403 | |
| | 607 | | | 1 mo. LIBOR + 2.250%, 3.898% | | | | | | | 608,822 | |
| | 929 | | | Boyd Gaming Corp., 1 Week LIBOR + 2.500%, 3.974%, 9/15/23, Term Loan B | | | | | | | 934,872 | |
| | 1,000 | | | Golden Entertainment, Inc., 1 mo. LIBOR + 3.00, 4.59%, 10/20/24, 2017 1st Lien Term Loan | | | | | | | 1,007,190 | |
| | | | Playa Resorts Holding B.V., 4/5/24, 2017 Term Loan B | | | | | | | | |
| | 993 | | | 3 mo. LIBOR + 3.25%, 5.00% | | | | | | | 1,000,358 | |
| | 2 | | | 2 mo. LIBOR + 3.25%, 4.89% | | | | | | | 2,517 | |
| | 998 | | | Scientific Games International, Inc., 3 mo. LIBOR + 2.75%, 4.324%, 8/14/24, 2017 Term Loan B4 | | | | | | | 1,003,241 | |
| | 948 | | | Travelport Finance (Luxembourg) Sarl, 3 mo. LIBOR + 2.750%, 4.589%, 9/2/21, New 2017 Term Loan D | | | | | | | 951,659 | |
| | | | | | | | | | | | 5,900,062 | |
| | | | Internet – 0.6% | | | | | | | | |
| | 995 | | | Everi Payments, Inc., 1 mo. LIBOR + 3.500%, 5.148%, 5/9/24, Term Loan B | | | | | | | 1,004,642 | |
| | | | Internet Software & Services – 1.1% | | | | | | | | |
| | 972 | | | Blucora, Inc., 3 mo. LIBOR + 3.000%, 4.693%, 5/22/24, Term Loan | | | | | | | 979,314 | |
| | 1,000 | | | Match Group Inc., 1 mo. LIBOR + 2.500%, 4.088%, 11/16/22, 2017 Term Loan B | | | | | | | 1,007,500 | |
| | | | | | | | | | | | 1,986,814 | |
| | | | IT Services – 1.1% | | | | | | | | |
| | 923 | | | First Data Corporation, 1 mo. LIBOR + 2.250%, 3.871%, 4/26/24, 2024 USD Term Loan | | | | | | | 925,912 | |
| | 995 | | | Xerox Business Services LLC, 1 mo. LIBOR + 3.000%, 4.648%, 12/7/23, USD Term Loan B | | | | | | | 1,005,547 | |
| | | | | | | | | | | | 1,931,459 | |
| | | | Leisure – 0.6% | | | | | | | | |
| | | | Planet Fitness Holdings LLC, 3/31/21, Incremental Term Loan B | | | | | | | | |
| | 188 | | | 3 mo. LIBOR + 3.000%, 4.693% | | | | | | | 190,271 | |
| | 807 | | | 1 mo. LIBOR + 3.000%, 4.648% | | | | | | | 817,128 | |
| | | | | | | | | | | | 1,007,399 | |
| | | | Machinery – 1.1% | | | | | | | | |
| | 998 | | | Gardner Denver, Inc., 3 mo. LIBOR + 2.750%, 4.443%, 7/30/24, 2017 USD Term Loan B | | | | | | | 1,002,148 | |
| | 997 | | | Harsco Corporation, 1 mo. LIBOR + 3.000%, 4.688%, 12/6/24, 2017 Term Loan B1 | | | | | | | 1,011,577 | |
| | | | | | | | | | | | 2,013,725 | |
| | | | Media – 1.0% | | | | | | | | |
| | 995 | | | Gray Television, Inc., 1 mo. LIBOR + 2.250%, 3.83%, 2/7/24, 2017 Term Loan B2 | | | | | | | 1,002,233 | |
| | 722 | | | Lions Gate Entertainment Corp., 1 mo. LIBOR + 2.250%, 3.898%, 12/8/23, 2017 Term Loan B | | | | | | | 727,798 | |
| | | | | | | | | | | | 1,730,031 | |
| | | | Pharmaceuticals – 1.1% | | | | | | | | |
| | 962 | | | HLF Financing Sarl, 1 mo. LIBOR + 5.500%, 7.148%, 2/15/23, Term Loan B | | | | | | | 969,300 | |
| | 948 | | | Lannett Company, Inc., 1 mo. LIBOR + 5.375%, 7.023%, 11/25/22, Term Loan B | | | | | | | 947,521 | |
| | | | | | | | | | | | 1,916,821 | |
| | | | | | |
| 16 | | Annual Report | | | February 28, 2018 | | | See accompanying Notes to Financial Statements |
Schedule of Investments
AllianzGI Convertible & Income 2024 Target Term Fund
February 28, 2018 (continued)
| | | | | | | | | | | | |
Principal
Amount
(000s) | | | | | | | | Value | |
| | | | Retail – 0.6% | | | | | | | | |
| | | | CWGS Group LLC, 11/8/23, 2016 Term Loan | | | | | | | | |
| | $5 | | | 1 mo. LIBOR + 3.000%, 4.65% | | | | | | | $5,604 | |
| | 992 | | | 1 mo. LIBOR + 3.000%, 4.58% | | | | | | | 1,002,371 | |
| | | | | | | | | | | | 1,007,975 | |
| | | | Road & Rail – 0.5% | | | | | | | | |
| | | | YRC Worldwide, Inc., 7/24/22, 2017 Term Loan | | | | | | | | |
| | 932 | | | 3 mo. LIBOR + 8.500%, 10.271% | | | | | | | 941,309 | |
| | 7 | | | 1 mo. LIBOR + 8.500%, 10.148% | | | | | | | 7,167 | |
| | | | | | | | | | | | 948,476 | |
| | | | Semiconductors & Semiconductor Equipment – 0.5% | | | | | | | | |
| | 974 | | | Cypress Semiconductor Corp., 1 mo. LIBOR + 2.750%, 4.35%, 7/5/21, 2016 Term Loan B | | | | | | | 980,378 | |
| | | | Specialty Retail – 1.1% | | | | | | | | |
| | 998 | | | Burlington Coat Factory Warehouse Corporation, 3 mo. LIBOR + 2.500%, 4.09%, 11/17/24, 2017 Term Loan B5 | | | | | | | 1,001,864 | |
| | 998 | | | National Vision, Inc., 1 mo. LIBOR + 2.75%, 4.398%, 11/20/24, 2017 Repriced Term Loan | | | | | | | 1,003,580 | |
| | | | | | | | | | | | 2,005,444 | |
| | | | Textiles, Apparel & Luxury Goods – 0.6% | | | | | | | | |
| | | | G-III Apparel Group, Ltd., 12/1/22, Term Loan B | | | | | | | | |
| | 753 | | | 3 mo. LIBOR + 5.25%, 7.063% | | | | | | | 762,260 | |
| | 188 | | | 1 mo. LIBOR + 5.25%, 6.875% | | | | | | | 190,565 | |
| | 188 | | | 3 mo. PRIME + 4.25%, 8.75% | | | | | | | 190,565 | |
| | | | | | | | | | | | 1,143,390 | |
| | Total Senior Loans (cost-$36,168,464) | | | | | | | 36,253,926 | |
| | | | Repurchase Agreements – 1.8% | | | | | | | | |
| | 3,233 | | | State Street Bank and Trust Co.,
dated 2/28/18, 0.20%, due 3/1/18, proceeds $3,233,018; collateralized by U.S. Treasury Notes, 1.25%, due 7/31/23, valued at $3,300,455 including accrued interest (cost-$3,233,000) | | | | | | | 3,233,000 | |
| | Total Investments (cost-$248,415,545) – 137.9% | | | | | | | 246,435,837 | |
| | Liabilities in excess of other assets – (37.9)% | | | | | | | (67,675,565 | ) |
| | Net Assets – 100.0% | | | | | | | $178,760,272 | |
Notes to Schedule of Investments:
| (a) | | Private Placement–Restricted as to resale and may not have a readily available market. Securities with an aggregate value of $98,335,937, representing 55.0% of net assets. | |
| (b) | | These securities generally pay interest at rates which are periodically pre-determined by reference to a base lending rate plus a premium. These base lending rates are generally either the lending rate offered by one or more major European banks, such as the “LIBOR” or the prime rate offered by one or more major United States banks, or the certificate of deposit rate. These securities are generally considered to be restricted as the Fund is ordinarily contractually obligated to receive approval from the Agent bank and/or borrower prior to disposition. Remaining maturities of senior loans may be less than the stated maturities shown as a result of contractual or optional payments by the borrower. Such prepayments cannot be predicted with certainty. The interest rate disclosed reflects the rate in effect on February 28, 2018. | |
| (c) | | 144A–Exempt from registration under Rule 144A of the Securities Act of 1933. These securities may be resold in transactions exempt from registration, typically only to qualified institutional buyers. Securities with an aggregate value of $58,983,842, representing 33.0% of net assets. | |
| | | | | | | | |
| See accompanying Notes to Financial Statements | | | February 28, 2018 | | | Annual Report | | | 17 | |
Schedule of Investments
AllianzGI Convertible & Income 2024 Target Term Fund
February 28, 2018 (continued)
| (d) | | All or partial amount segregated for the benefit of the counterparty as collateral for long-term and short-term loan financing. | |
| (e) | | Fair Value Measurements-See Note 1(b) in the Notes to Financial Statements. | |
| | | | | | | | | | | | | | | | |
| | | Level 1 –
Quoted
Prices | | | Level 2 –
Other Significant
Observable
Inputs | | | Level 3 –
Significant
Unobservable
Inputs | | | Value at
2/28/18 | |
Investments in Securities – Assets | | | | | | | | | | | | | | | | |
Corporate Bonds & Notes | | | – | | | | $105,325,932 | | | | – | | | | $105,325,932 | |
Convertible Bonds & Notes | | | – | | | | 101,622,979 | | | | – | | | | 101,622,979 | |
Senior Loans | | | – | | | | 36,253,926 | | | | – | | | | 36,253,926 | |
Repurchase Agreements | | | – | | | | 3,233,000 | | | | – | | | | 3,233,000 | |
Totals | | | – | | | | $246,435,837 | | | | – | | | | $246,435,837 | |
Glossary:
| | | | |
| LIBOR | | - | | London Inter-Bank Offered Rate |
| REIT | | - | | Real Estate Investment Trust |
| | | | | | |
| 18 | | Annual Report | | | February 28, 2018 | | | See accompanying Notes to Financial Statements |
Schedule of Investments
AllianzGI Convertible & Income Fund
February 28, 2018
| | | | | | | | | | | | |
Principal
Amount
(000s) | | | | | | | | Value | |
| | Corporate Bonds & Notes – 40.3% | | | | | | | | |
| | | | Aerospace & Defense – 1.0% | | | | | | | | |
| | $7,540 | | | TransDigm, Inc., 6.50%, 5/15/25 | | | | | | | $7,747,350 | |
| | 1,420 | | | Triumph Group, Inc., 7.75%, 8/15/25 | | | | | | | 1,471,475 | |
| | | | | | | | | | | | 9,218,825 | |
| | | | Auto Manufacturers – 0.5% | | | | | | | | |
| | 4,660 | | | Navistar International Corp., 6.625%, 11/1/25 (a)(b) | | | | | | | 4,811,450 | |
| | | | Building Materials – 0.7% | | | | | | | | |
| | 5,665 | | | U.S. Concrete, Inc., 6.375%, 6/1/24 | | | | | | | 6,047,388 | |
| | | | Chemicals – 2.8% | | | | | | | | |
| | 7,500 | | | Chemours Co., 6.625%, 5/15/23 | | | | | | | 7,921,875 | |
| | 4,790 | | | Kraton Polymers LLC, 7.00%, 4/15/25 (a)(b) | | | | | | | 4,969,625 | |
| | 5,670 | | | Platform Specialty Products Corp., 6.50%, 2/1/22 (a)(b) | | | | | | | 5,833,013 | |
| | 6,720 | | | Tronox Finance LLC, 7.50%, 3/15/22 (a)(b) | | | | | | | 6,988,800 | |
| | | | | | | | | | | | 25,713,313 | |
| | | | Commercial Services – 1.2% | | | | | | | | |
| | 8,050 | | | Cenveo Corp., 6.00%, 5/15/24 (a)(b)(c)(h)
(acquisition cost-$11,247,777; purchased 3/22/12) | | | | | | | 644,000 | |
| | 7,375 | | | Monitronics International, Inc., 9.125%, 4/1/20 | | | | | | | 6,453,125 | |
| | 3,500 | | | United Rentals North America, Inc., 5.50%, 7/15/25 | | | | | | | 3,618,125 | |
| | | | | | | | | | | | 10,715,250 | |
| | | | Computers – 1.9% | | | | | | | | |
| | 5,242 | | | DynCorp International, Inc., PIK 1.50%, 11.875%, 11/30/20 | | | | | | | 5,503,831 | |
| | 7,350 | | | Harland Clarke Holdings Corp., 9.25%, 3/1/21 (a)(b) | | | | | | | 7,625,625 | |
| | 3,935 | | | Western Digital Corp., 10.50%, 4/1/24 | | | | | | | 4,579,356 | |
| | | | | | | | | | | | 17,708,812 | |
| | | | Distribution/Wholesale – 0.6% | | | | | | | | |
| | 5,380 | | | H&E Equipment Services, Inc., 5.625%, 9/1/25 (a)(b) | | | | | | | 5,514,500 | |
| | | | Diversified Financial Services – 3.7% | | | | | | | | |
| | | | Community Choice Financial, Inc., | | | | | | | | |
| | 10,085 | | | 10.75%, 5/1/19 | | | | | | | 9,605,962 | |
| | 7,130 | | | 12.75%, 5/1/20 (a)(b) | | | | | | | 6,096,150 | |
| | | | Nationstar Mortgage LLC, | | | | | | | | |
| | 2,500 | | | 7.875%, 10/1/20 | | | | | | | 2,567,187 | |
| | 5,300 | | | 9.625%, 5/1/19 | | | | | | | 5,427,200 | |
| | | | Navient Corp., | | | | | | | | |
| | 1,575 | | | 7.25%, 9/25/23 | | | | | | | 1,681,313 | |
| | 3,210 | | | 8.45%, 6/15/18 | | | | | | | 3,258,150 | |
| | 4,935 | | | Springleaf Finance Corp., 8.25%, 10/1/23 | | | | | | | 5,453,175 | |
| | | | | | | | | | | | 34,089,137 | |
| | | | Electric Utilities – 0.6% | | | | | | | | |
| | 5,585 | | | NRG Energy, Inc., 6.25%, 5/1/24 | | | | | | | 5,808,400 | |
| | | | Engineering & Construction – 0.6% | | | | | | | | |
| | 5,100 | | | Tutor Perini Corp., 6.875%, 5/1/25 (a)(b) | | | | | | | 5,367,750 | |
| | | | Entertainment – 1.0% | | | | | | | | |
| | 4,990 | | | AMC Entertainment Holdings, Inc., 6.125%, 5/15/27 | | | | | | | 4,865,250 | |
| | 4,000 | | | Cedar Fair L.P., 5.375%, 6/1/24 | | | | | | | 4,125,000 | |
| | | | | | | | | | | | 8,990,250 | |
| | | | | | | | |
| See accompanying Notes to Financial Statements | | | February 28, 2018 | | | Annual Report | | | 19 | |
Schedule of Investments
AllianzGI Convertible & Income Fund
February 28, 2018 (continued)
| | | | | | | | | | | | |
Principal
Amount
(000s) | | | | | | | | Value | |
| | | | Healthcare-Services – 3.1% | | | | | | | | |
| | $2,835 | | | Community Health Systems, Inc., 6.25%, 3/31/23 | | | | | | | $2,594,025 | |
| | 5,430 | | | DaVita, Inc., 5.125%, 7/15/24 | | | | | | | 5,402,850 | |
| | 3,860 | | | Envision Healthcare Corp., 6.25%, 12/1/24 (a)(b) | | | | | | | 4,081,950 | |
| | 3,800 | | | HCA, Inc., 7.50%, 2/15/22 | | | | | | | 4,213,250 | |
| | 7,955 | | | Kindred Healthcare, Inc., 8.75%, 1/15/23 | | | | | | | 8,551,625 | |
| | 3,500 | | | Tenet Healthcare Corp., 7.00%, 8/1/25 (a)(b) | | | | | | | 3,504,375 | |
| | | | | | | | | | | | 28,348,075 | |
| | | | Home Builders – 0.5% | | | | | | | | |
| | 4,395 | | | Beazer Homes USA, Inc., 8.75%, 3/15/22 | | | | | | | 4,757,588 | |
| | | | Internet & Catalog Retail – 0.3% | | | | | | | | |
| | 2,800 | | | Netflix, Inc., 5.875%, 2/15/25 | | | | | | | 2,965,508 | |
| | | | Iron/Steel – 0.9% | | | | | | | | |
| | | | AK Steel Corp., | | | | | | | | |
| | 2,025 | | | 7.00%, 3/15/27 | | | | | | | 2,069,297 | |
| | 1,315 | | | 7.50%, 7/15/23 | | | | | | | 1,410,337 | |
| | 4,750 | | | United States Steel Corp., 8.375%, 7/1/21 (a)(b) | | | | | | | 5,094,375 | |
| | | | | | | | | | | | 8,574,009 | |
| | | | Machinery-Construction & Mining – 0.5% | | | | | | | | |
| | 4,695 | | | Terex Corp., 5.625%, 2/1/25 (a)(b) | | | | | | | 4,747,819 | |
| | | | Media – 2.0% | | | | | | | | |
| | 7,370 | | | Cablevision Systems Corp., 8.00%, 4/15/20 | | | | | | | 7,850,524 | |
| | 3,740 | | | Gray Television, Inc., 5.875%, 7/15/26 (a)(b) | | | | | | | 3,716,625 | |
| | 4,671 | | | LiveStyle, Inc., 9.625%, 2/1/19 (a)(b)(c)(h)(j) | | | | | | | | |
| | | | | (acquisition cost-$4,879,905; purchased 5/7/14-2/26/15) | | | | | | | 93 | |
| | 6,930 | | | McClatchy Co., 9.00%, 12/15/22 | | | | | | | 7,259,175 | |
| | | | | | | | | | | | 18,826,417 | |
| | | | Metal Fabricate/Hardware – 0.4% | | | | | | | | |
| | 3,830 | | | Park-Ohio Industries, Inc., 6.625%, 4/15/27 | | | | | | | 4,021,500 | |
| | | | Mining – 1.9% | | | | | | | | |
| | 5,100 | | | Alcoa Nederland Holding BV, 7.00%, 9/30/26 (a)(b) | | | | | | | 5,533,500 | |
| | 4,405 | | | Constellium NV, 6.625%, 3/1/25 (a)(b) | | | | | | | 4,570,187 | |
| | 2,775 | | | Hudbay Minerals, Inc., 7.625%, 1/15/25 (a)(b) | | | | | | | 3,031,688 | |
| | 3,950 | | | Joseph T. Ryerson & Son, Inc., 11.00%, 5/15/22 (a)(b) | | | | | | | 4,407,608 | |
| | | | | | | | | | | | 17,542,983 | |
| | | | Oil, Gas & Consumable Fuels – 4.8% | | | | | | | | |
| | 2,700 | | | Calumet Specialty Products Partners L.P., 6.50%, 4/15/21 | | | | | | | 2,646,000 | |
| | 1,900 | | | Carrizo Oil & Gas, Inc., 6.25%, 4/15/23 | | | | | | | 1,914,250 | |
| | 16,950 | | | Cobalt International Energy, Inc., 10.75%, 12/1/21 (c) | | | | | | | 18,390,750 | |
| | 590 | | | Ensco PLC, 5.20%, 3/15/25 | | | | | | | 492,650 | |
| | 7,225 | | | EP Energy LLC, 9.375%, 5/1/20 | | | | | | | 6,755,375 | |
| | 2,835 | | | NGL Energy Partners L.P., 7.50%, 11/1/23 | | | | | | | 2,856,263 | |
| | 975 | | | Noble Holding International Ltd., 7.75%, 1/15/24 | | | | | | | 892,125 | |
| | 4,895 | | | Oasis Petroleum, Inc., 6.875%, 3/15/22 | | | | | | | 5,026,553 | |
| | 4,530 | | | Sanchez Energy Corp., 6.125%, 1/15/23 | | | | | | | 3,420,150 | |
| | 1,670 | | | Transocean, Inc., 7.50%, 1/15/26 (a)(b) | | | | | | | 1,686,700 | |
| | 820 | | | Weatherford International Ltd., 8.25%, 6/15/23 | | | | | | | 797,450 | |
| | | | | | | | | | | | 44,878,266 | |
| | | | | | |
| 20 | | Annual Report | | | February 28, 2018 | | | See accompanying Notes to Financial Statements |
Schedule of Investments
AllianzGI Convertible & Income Fund
February 28, 2018 (continued)
| | | | | | | | | | | | |
Principal
Amount
(000s) | | | | | | | | Value | |
| | | | Pharmaceuticals – 1.3% | | | | | | | | |
| | $2,290 | | | Endo Finance LLC, 5.375%, 1/15/23 (a)(b) | | | | | | | $1,711,775 | |
| | 5,865 | | | Horizon Pharma, Inc., 6.625%, 5/1/23 | | | | | | | 5,894,325 | |
| | 4,000 | | | Valeant Pharmaceuticals International, Inc., 7.50%, 7/15/21 (a)(b) | | | | | | | 4,035,000 | |
| | | | | | | | | | | | 11,641,100 | |
| | | | Pipelines – 0.4% | | | | | | | | |
| | 3,550 | | | Energy Transfer Equity L.P., 5.50%, 6/1/27 | | | | | | | 3,683,125 | |
| | | | Real Estate – 0.9% | | | | | | | | |
| | 3,085 | | | Kennedy-Wilson, Inc., 5.875%, 4/1/24 | | | | | | | 3,096,569 | |
| | 5,365 | | | Uniti Group L.P., 8.25%, 10/15/23 | | | | | | | 5,029,687 | |
| | | | | | | | | | | | 8,126,256 | |
| | | | Retail – 2.0% | | | | | | | | |
| | 3,500 | | | Claire’s Stores, Inc., 9.00%, 3/15/19 (a)(b) | | | | | | | 2,397,500 | |
| | 5,980 | | | Conn’s, Inc., 7.25%, 7/15/22 | | | | | | | 5,950,100 | |
| | 2,835 | | | Dollar Tree, Inc., 5.75%, 3/1/23 | | | | | | | 2,953,716 | |
| | 1,530 | | | L Brands, Inc., 6.875%, 11/1/35 | | | | | | | 1,535,278 | |
| | 9,465 | | | Neiman Marcus Group Ltd. LLC, 8.00%, 10/15/21 (a)(b) | | | | | | | 5,773,650 | |
| | | | | | | | | | | | 18,610,244 | |
| | | | Semiconductors – 1.1% | | | | | | | | |
| | 5,355 | | | Advanced Micro Devices, Inc., 7.00%, 7/1/24 | | | | | | | 5,629,444 | |
| | 4,645 | | | Amkor Technology, Inc., 6.375%, 10/1/22 | | | | | | | 4,795,962 | |
| | | | | | | | | | | | 10,425,406 | |
| | | | Software – 0.7% | | | | | | | | |
| | 5,035 | | | Camelot Finance S.A., 7.875%, 10/15/24 (a)(b) | | | | | | | 5,351,198 | |
| | 1,480 | | | Rackspace Hosting, Inc., 8.625%, 11/15/24 (a)(b) | | | | | | | 1,546,600 | |
| | | | | | | | | | | | 6,897,798 | |
| | | | Telecommunications – 4.4% | | | | | | | | |
| | 4,080 | | | Cincinnati Bell, Inc., 7.00%, 7/15/24 (a)(b) | | | | | | | 3,882,120 | |
| | 9,370 | | | Consolidated Communications, Inc., 6.50%, 10/1/22 | | | | | | | 8,245,600 | |
| | 5,290 | | | Frontier Communications Corp., 10.50%, 9/15/22 | | | | | | | 4,529,562 | |
| | 2,685 | | | GTT Communications, Inc., 7.875%, 12/31/24 (a)(b) | | | | | | | 2,797,434 | |
| | | | Hughes Satellite Systems Corp., | | | | | | | | |
| | 1,460 | | | 6.625%, 8/1/26 | | | | | | | 1,496,938 | |
| | 4,250 | | | 7.625%, 6/15/21 | | | | | | | 4,590,000 | |
| | 7,205 | | | Sprint Communications, Inc., 11.50%, 11/15/21 | | | | | | | 8,537,925 | |
| | 1,865 | | | Sprint Corp., 7.625%, 3/1/26 | | | | | | | 1,860,338 | |
| | 8,229 | | | Windstream Services LLC, 6.375%, 8/1/23 (a)(b) | | | | | | | 4,649,385 | |
| | | | | | | | | | | | 40,589,302 | |
| | | | Transportation – 0.5% | | | | | | | | |
| | 4,830 | | | XPO Logistics, Inc., 6.50%, 6/15/22 (a)(b) | | | | | | | 5,037,690 | |
| | Total Corporate Bonds & Notes (cost-$392,648,337) | | | | | | | 373,658,161 | |
| | Convertible Bonds & Notes – 34.9% | | | | | | | | |
| | | | Apparel & Textiles – 1.8% | | | | | | | | |
| | 14,580 | | | Iconix Brand Group, Inc., 5.75%, 8/15/23 | | | | | | | 16,661,295 | |
| | | | Auto Components – 1.0% | | | | | | | | |
| | 11,855 | | | Horizon Global Corp., 2.75%, 7/1/22 | | | | | | | 9,654,416 | |
| | | | | | | | |
| See accompanying Notes to Financial Statements | | | February 28, 2018 | | | Annual Report | | | 21 | |
Schedule of Investments
AllianzGI Convertible & Income Fund
February 28, 2018 (continued)
| | | | | | | | | | | | |
Principal
Amount
(000s) | | | | | | | | Value | |
| | | | Auto Manufacturers – 1.0% | | | | | | | | |
| | $6,225 | | | Navistar International Corp., 4.75%, 4/15/19 | | | | | | | $6,475,083 | |
| | 2,850 | | | Tesla, Inc., 1.25%, 3/1/21 | | | | | | | 3,249,108 | |
| | | | | | | | | | | | 9,724,191 | |
| | | | Biotechnology – 0.8% | | | | | | | | |
| | 9,625 | | | Intercept Pharmaceuticals, Inc., 3.25%, 7/1/23 | | | | | | | 7,718,509 | |
| | | | Building Materials – 0.5% | | | | | | | | |
| | 4,275 | | | Cemex S.A.B de C.V., 3.72%, 3/15/20 | | | | | | | 4,418,965 | |
| | | | Commercial Services – 2.6% | | | | | | | | |
| | 13,510 | | | Ascent Capital Group, Inc., 4.00%, 7/15/20 | | | | | | | 10,486,462 | |
| | 10,530 | | | Huron Consulting Group, Inc., 1.25%, 10/1/19 | | | | | | | 9,858,712 | |
| | 3,705 | | | ServiceSource International, Inc., 1.50%, 8/1/18 | | | | | | | 3,641,645 | |
| | | | | | | | | | | | 23,986,819 | |
| | | | Distribution/Wholesale – 0.7% | | | | | | | | |
| | 6,600 | | | Titan Machinery, Inc., 3.75%, 5/1/19 | | | | | | | 6,556,136 | |
| | | | Diversified Financial Services – 2.4% | | | | | | | | |
| | 9,320 | | | Encore Capital Group, Inc., 3.00%, 7/1/20 | | | | | | | 10,447,720 | |
| | 12,165 | | | PRA Group, Inc., 3.00%, 8/1/20 | | | | | | | 11,839,988 | |
| | | | | | | | | | | | 22,287,708 | |
| | | | Electric Utilities – 1.0% | | | | | | | | |
| | 9,230 | | | NRG Yield, Inc., 3.25%, 6/1/20 (a)(b) | | | | | | | 9,203,011 | |
| | | | Electrical Equipment – 1.1% | | | | | | | | |
| | | | SunPower Corp., | | | | | | | | |
| | 3,135 | | | 0.875%, 6/1/21 | | | | | | | 2,410,188 | |
| | 9,405 | | | 4.00%, 1/15/23 | | | | | | | 7,612,407 | |
| | | | | | | | | | | | 10,022,595 | |
| | | | Electronics – 0.6% | | | | | | | | |
| | 5,895 | | | OSI Systems, Inc., 1.25%, 9/1/22 (a)(b) | | | | | | | 5,294,447 | |
| | | | Energy-Alternate Sources – 2.1% | | | | | | | | |
| | 3,990 | | | Pattern Energy Group, Inc., 4.00%, 7/15/20 | | | | | | | 3,974,702 | |
| | 16,800 | | | SolarCity Corp., 1.625%, 11/1/19 | | | | | | | 15,747,783 | |
| | | | | | | | | | | | 19,722,485 | |
| | | | Engineering & Construction – 0.4% | | | | | | | | |
| | 3,230 | | | Layne Christensen Co., 4.25%, 11/15/18 | | | | | | | 3,266,212 | |
| | | | Equity Real Estate Investment Trusts (REITs) – 1.4% | | | | | | | | |
| | 5,400 | | | Two Harbors Investment Corp., 6.25%, 1/15/22 | | | | | | | 5,551,486 | |
| | 7,690 | | | Western Asset Mortgage Capital Corp., 6.75%, 10/1/22 | | | | | | | 7,582,340 | |
| | | | | | | | | | | | 13,133,826 | |
| | | | Healthcare/Healthcare Distributors – 1.1% | | | | | | | | |
| | 11,415 | | | Aceto Corp., 2.00%, 11/1/20 | | | | | | | 10,101,168 | |
| | | | Insurance – 1.2% | | | | | | | | |
| | 12,210 | | | AmTrust Financial Services, Inc., 2.75%, 12/15/44 | | | | | | | 10,741,980 | |
| | | | Iron/Steel – 0.1% | | | | | | | | |
| | 910 | | | AK Steel Corp., 5.00%, 11/15/19 | | | | | | | 1,142,393 | |
| | | | Oil, Gas & Consumable Fuels – 3.0% | | | | | | | | |
| | 18,235 | | | Helix Energy Solutions Group, Inc., 3.25%, 3/15/32 | | | | | | | 18,270,522 | |
| | 9,980 | | | Whiting Petroleum Corp., 1.25%, 4/1/20 | | | | | | | 9,443,565 | |
| | | | | | | | | | | | 27,714,087 | |
| | | | | | |
| 22 | | Annual Report | | | February 28, 2018 | | | See accompanying Notes to Financial Statements |
Schedule of Investments
AllianzGI Convertible & Income Fund
February 28, 2018 (continued)
| | | | | | | | | | | | |
Principal
Amount
(000s) | | | | | | | | Value | |
| | | | Pharmaceuticals – 3.5% | | | | | | | | |
| | $16,145 | | | Herbalife Ltd., 2.00%, 8/15/19 | | | | | | | $18,814,527 | |
| | 3,260 | | | Horizon Pharma Investment Ltd., 2.50%, 3/15/22 | | | | | | | 3,019,575 | |
| | 7,800 | | | Impax Laboratories, Inc., 2.00%, 6/15/22 | | | | | | | 7,678,773 | |
| | 3,415 | | | Jazz Investments I Ltd., 1.50%, 8/15/24 (a)(b) | | | | | | | 3,257,220 | |
| | | | | | | | | | | | 32,770,095 | |
| | | | Pipelines – 1.1% | | | | | | | | |
| | 13,370 | | | Cheniere Energy, Inc., 4.25%, 3/15/45 | | | | | | | 10,362,378 | |
| | | | Retail – 1.1% | | | | | | | | |
| | 10,425 | | | RH, zero coupon, 6/15/19 (a)(b) | | | | | | | 10,303,924 | |
| | | | Semiconductors – 0.9% | | | | | | | | |
| | | | Cypress Semiconductor Corp., | | | | | | | | |
| | 845 | | | 2.00%, 2/1/23 (a)(b) | | | | | | | 928,920 | |
| | 2,850 | | | 4.50%, 1/15/22 | | | | | | | 4,100,335 | |
| | 3,935 | | | Veeco Instruments, Inc., 2.70%, 1/15/23 | | | | | | | 3,647,989 | |
| | | | | | | | | | | | 8,677,244 | |
| | | | Software – 1.9% | | | | | | | | |
| | 15,785 | | | Avid Technology, Inc., 2.00%, 6/15/20 | | | | | | | 13,595,620 | |
| | 3,985 | | | Synchronoss Technologies, Inc., 0.75%, 8/15/19 | | | | | | | 3,681,419 | |
| | | | | | | | | | | | 17,277,039 | |
| | | | Telecommunications – 1.0% | | | | | | | | |
| | 11,065 | | | Gogo, Inc., 3.75%, 3/1/20 | | | | | | | 9,728,636 | |
| | | | Tobacco – 1.6% | | | | | | | | |
| | | | Vector Group Ltd. (g), | | | | | | | | |
| | 5,665 | | | 3 mo. Cash Dividends on Common Stock + 1.75%, 1.75%, 4/15/20 | | | | | | | 6,200,665 | |
| | 6,215 | | | 3 mo. Cash Dividends on Common Stock + 2.50%, 2.50%, 1/15/19 | | | | | | | 8,720,801 | |
| | | | | | | | | | | | 14,921,466 | |
| | | | Transportation – 1.0% | | | | | | | | |
| | 3,990 | | | Aegean Marine Petroleum Network, Inc., 4.25%, 12/15/21 | | | | | | | 2,432,304 | |
| | 4,560 | | | Echo Global Logistics, Inc., 2.50%, 5/1/20 | | | | | | | 4,669,444 | |
| | 1,995 | | | Teekay Corp., 5.00%, 1/15/23 (a)(b) | | | | | | | 1,913,754 | |
| | | | | | | | | | | | 9,015,502 | |
| | Total Convertible Bonds & Notes (cost-$303,958,191) | | | | | | | 324,406,527 | |
| | | |
| Shares | | | | | | | | | |
| | Convertible Preferred Stock – 21.6% | | | | | | | | |
| | | | Banks – 4.0% | | | | | | | | |
| | 12,080 | | | Bank of America Corp., 7.25%, Ser. L (e) | | | | | | | 15,456,723 | |
| | 16,980 | | | Wells Fargo & Co., 7.50%, Ser. L (e) | | | | | | | 21,649,500 | |
| | | | | | | | | | | | 37,106,223 | |
| | | | Chemicals – 1.0% | | | | | | | | |
| | 68,495 | | | Rayonier Advanced Materials, Inc., 8.00%, 8/15/19, Ser. A | | | | | | | 9,785,538 | |
| | | | Commercial Services & Supplies – 0.7% | | | | | | | | |
| | 145,890 | | | Stericycle, Inc., 5.25%, 9/15/18 | | | | | | | 7,087,336 | |
| | | | Diversified Financial Services – 0.5% | | | | | | | | |
| | 5,700 | | | Cowen, Inc., 5.625%, Ser. A (e) | | | | | | | 4,728,777 | |
| | | | Diversified Telecommunication Services – 0.2% | | | | | | | | |
| | 155,900 | | | Frontier Communications Corp., 11.125%, 6/29/18, Ser. A | | | | | | | 1,975,253 | |
| | | | | | | | |
| See accompanying Notes to Financial Statements | | | February 28, 2018 | | | Annual Report | | | 23 | |
Schedule of Investments
AllianzGI Convertible & Income Fund
February 28, 2018 (continued)
| | | | | | | | | | | | |
| Shares | | | | | | | | Value | |
| | | | Electric Utilities – 2.0% | | | | | | | | |
| | 302,350 | | | Dominion Energy, Inc., 6.75%, 8/15/19, Ser. A | | | | | | | $14,745,609 | |
| | 66,215 | | | NextEra Energy, Inc., 6.123%, 9/1/19 | | | | | | | 3,661,690 | |
| | | | | | | | | | | | 18,407,299 | |
| | | | Equity Real Estate Investment Trusts (REITs) – 4.2% | | | | | | | | |
| | 4,625 | | | Crown Castle International Corp., 6.875%, 8/1/20, Ser. A | | | | | | | 5,176,346 | |
| | 631,070 | | | RLJ Lodging Trust, 1.95%, Ser. A (e) | | | | | | | 16,401,509 | |
| | 410,065 | | | Sutherland Asset Management Corp., 7.00%, 8/15/23 | | | | | | | 10,251,625 | |
| | 141,135 | | | Welltower, Inc., 6.50%, Ser. I (e) | | | | | | | 7,691,858 | |
| | | | | | | | | | | | 39,521,338 | |
| | | | Hand/Machine Tools – 1.8% | | | | | | | | |
| | 139,055 | | | Stanley Black & Decker, Inc., 5.375%, 5/15/20 | | | | | | | 16,387,632 | |
| | | | Healthcare Providers & Services – 2.5% | | | | | | | | |
| | 401,015 | | | Anthem, Inc., 5.25%, 5/1/18 | | | | | | | 23,010,241 | |
| | | | Healthcare-Products – 1.3% | | | | | | | | |
| | 199,155 | | | Becton Dickinson and Co., 6.125%, 5/1/20, Ser. A | | | | | | | 11,731,464 | |
| | | | Oil, Gas & Consumable Fuels – 2.2% | | | | | | | | |
| | 159,375 | | | Anadarko Petroleum Corp., 7.50%, 6/7/18 | | | | | | | 5,179,688 | |
| | 173,410 | | | Kinder Morgan, Inc., 9.75%, 10/26/18, Ser. A | | | | | | | 5,778,021 | |
| | 230,425 | | | Sanchez Energy Corp., 6.50%, Ser. B (e) | | | | | | | 4,114,999 | |
| | 82,895 | | | WPX Energy, Inc., 6.25%, 7/31/18, Ser. A | | | | | | | 5,100,529 | |
| | | | | | | | | | | | 20,173,237 | |
| | | | Pharmaceuticals – 1.2% | | | | | | | | |
| | 30,895 | | | Teva Pharmaceutical Industries Ltd., 7.00%, 12/15/18 | | | | | | | 10,910,569 | |
| | Total Convertible Preferred Stock (cost-$214,689,387) | | | | | | | 200,824,907 | |
| | Preferred Stock (a)(d)(f)(i)(j) – 0.9% | | | | | | | | |
| | | | Media – 0.9% | | | | | | | | |
| | 8,339 | | | LiveStyle, Inc., Ser. A | | | | | | | 833,900 | |
| | 76,572 | | | LiveStyle, Inc., Ser. B | | | | | | | 7,657,200 | |
| | 6,750 | | | LiveStyle, Inc., Ser. B | | | | | | | 67 | |
| | Total Preferred Stock (cost-$15,074,564) | | | | | | | 8,491,167 | |
| | Common Stock (a)(d)(f)(i) – 0.3% | | | | | | | | |
| | | | Advertising – 0.3% | | | | | | | | |
| | 173,720 | | | Affinion Group Holdings, Inc., Class A (h) | | | | | | | | |
| | | | | (acquisition cost-$3,080,312; purchased 11/9/15-11/12/15) | | | | | | | 2,630,121 | |
| | | | Aerospace & Defense – 0.0% | | | | | | | | |
| | 8,295 | | | Erickson, Inc. | | | | | | | 260,380 | |
| | | | Media – 0.0% | | | | | | | | |
| | 90,407 | | | LiveStyle, Inc. (j) | | | | | | | 9 | |
| | Total Common Stock (cost-$10,187,309) | | | | | | | 2,890,510 | |
| | | |
| Units | | | | | | | | | |
| | Warrants (d)(f)(i) – 0.0% | | | | | | | | |
| | | | Commercial Services – 0.0% | | | | | | | | |
| | 2,062,338 | | | Cenveo, Inc., strike price $12.00, expires 6/10/24 (b) | | | | | | | 361 | |
| | | | Media – 0.0% | | | | | | | | |
| | 19,500 | | | LiveStyle, Inc., expires 11/30/21, Ser. C. (a)(j) | | | | | | | 2 | |
| | Total Warrants (cost-$246,984) | | | | | | | 363 | |
| | | | | | |
| 24 | | Annual Report | | | February 28, 2018 | | | See accompanying Notes to Financial Statements |
Schedule of Investments
AllianzGI Convertible & Income Fund
February 28, 2018 (continued)
| | | | | | | | | | | | |
Principal
Amount
(000s) | | | | | | | | Value | |
| | | | Repurchase Agreements – 2.0% | | | | | | | | |
| | $18,273 | | | State Street Bank and Trust Co.,
dated 2/28/18, 0.20%, due 3/1/18, proceeds $18,273,102; collateralized by U.S. Treasury Notes, 1.25%, due 7/31/23, valued at $18,639,225 including accrued interest (cost-$18,273,000) | | | | | | | $18,273,000 | |
| | Total Investments (cost-$955,077,772) – 100.0% | | | | | | | 928,544,635 | |
| | Other assets in excess of liabilities | | | | | | | 9,322,203 | |
| | Preferred Shares | | | | | | | (357,000,000 | ) |
| | Net Assets Applicable to Common Shareholders | | | | | | | $580,866,838 | |
Notes to Schedule of Investments:
| (a) | | Private Placement–Restricted as to resale and may not have a readily available market. Securities with an aggregate value of $167,691,140, representing 18.1% of total investments. | |
| (b) | | 144A–Exempt from registration under Rule 144A of the Securities Act of 1933. These securities may be resold in transactions exempt from registration, typically only to qualified institutional buyers. Securities with an aggregate value of $156,309,822, representing 16.8% of total investments. | |
| (d) | | Fair-Valued–Securities with an aggregate value of $11,382,040, representing 1.2% of total investments. See Note 1(a) and Note 1(b) in the Notes to Financial Statements. | |
| (e) | | Perpetual maturity. The date shown, if any, is the next call date. | |
| (f) | | Level 3 security. See Note 1(a) and Note 1(b) in the Notes to Financial Statements. | |
| (g) | | In addition to the coupon rate shown, the issuer is expected to pay additional interest based on the actual dividends paid on its common stock. | |
| (h) | | Restricted. The aggregate acquisition cost of such securities is $19,207,994. The aggregate value is $3,274,214, representing 0.4% of total investments. | |
| (i) | | Non-income producing. | |
| (j) | | A member of the Fund’s portfolio management team is a member of the board of directors of LiveStyle, Inc. The Fund’s aggregate value of investments in LiveStyle, Inc. represents 0.9% of total investments. | |
| (k) | | Fair Value Measurements-See Note 1(b) in the Notes to Financial Statements. | |
| | | | | | | | | | | | | | | | |
| | | Level 1 –
Quoted Prices | | | Level 2 –
Other Significant
Observable
Inputs | | | Level 3 –
Significant
Unobservable
Inputs | | | Value at
2/28/18 | |
Investments in Securities – Assets | |
Corporate Bonds & Notes | | | – | | | | $373,658,161 | | | | – | | | | $373,658,161 | |
Convertible Bonds & Notes | | | – | | | | 324,406,527 | | | | – | | | | 324,406,527 | |
Convertible Preferred Stock: | |
Chemicals | | | – | | | | 9,785,538 | | | | – | | | | 9,785,538 | |
Diversified Financial Services | | | – | | | | 4,728,777 | | | | – | | | | 4,728,777 | |
Healthcare-Products | | | – | | | | 11,731,464 | | | | – | | | | 11,731,464 | |
Oil, Gas & Consumable Fuels | | | $16,058,238 | | | | 4,114,999 | | | | – | | | | 20,173,237 | |
Pharmaceuticals | | | – | | | | 10,910,569 | | | | – | | | | 10,910,569 | |
All Other | | | 143,495,322 | | | | – | | | | – | | | | 143,495,322 | |
Preferred Stock | | | – | | | | – | | | $ | 8,491,167 | | | | 8,491,167 | |
Common Stock | | | – | | | | – | | | | 2,890,510 | | | | 2,890,510 | |
Warrants | | | – | | | | – | | | | 363 | | | | 363 | |
Repurchase Agreements | | | – | | | | 18,273,000 | | | | – | | | | 18,273,000 | |
Totals | | $ | 159,553,560 | | | | $757,609,035 | | | $ | 11,382,040 | | | | $928,544,635 | |
At February 28, 2018, there were no transfers between Levels 1 and 2.
| | | | | | | | |
| See accompanying Notes to Financial Statements | | | February 28, 2018 | | | Annual Report | | | 25 | |
Schedule of Investments
AllianzGI Convertible & Income Fund
February 28, 2018 (continued)
A roll forward of fair value measurements using significant unobservable inputs (Level 3) for year ended February 28, 2018, was as follows:
| | | | | | | | | | | | | | | | | | | | |
| | | Beginning
Balance
2/28/17 | | | Purchases | | | Sales | | | Accrued
Discount
(Premiums) | | | Net
Realized
Gain (Loss) | |
Investments in Securities – Assets | | | | | | | | | | | | | | | | | | | | |
Corporate Bonds & Notes: | | | | | | | | | | | | | | | | | | | | |
Commercial Services | | | $7,224,875 | | | | $ – | | | | $ – | | | | $(109,870 | ) | | | $ – | |
Preferred Stock: | | | | | | | | | | | | | | | | | | | | |
Media | | | 7,759,048 | | | | – | | | | – | | | | – | | | | – | |
Common Stock: | | | | | | | | | | | | | | | | | | | | |
Advertising | | | 2,581,479 | | | | – | | | | – | | | | – | | | | – | |
Aerospace & Defense | | | – | | | | 7,106,998 | † | | | – | | | | – | | | | – | |
Media | | | 9 | | | | – | | | | – | | | | – | | | | – | |
Warrants: | | | | | | | | | | | | | | | | | | | | |
Commercial Services | | | 449,705 | | | | – | | | | – | | | | – | | | | – | |
Media | | | 2 | | | | – | | | | – | | | | – | | | | – | |
Totals | | | $18,015,118 | | | | $7,106,998 | | | | $ – | | | | $(109,870 | ) | | | $ – | |
| | | | | | | | | | | | | | | | |
| | | Net Change
in Unrealized
Appreciation/
Depreciation | | | Transfers
into
Level 3 | | | Transfers
out of
Level 3* | | | Ending
Balance
2/28/18 | |
Investments in Securities – Assets | | | | | | | | | | | | | | | | |
Corporate Bonds & Notes: | | | | | | | | | | | | | | | | |
Commercial Services | | | $(6,471,005 | ) | | | $ – | | | | $(644,000 | ) | | | $ – | |
Preferred Stock: | | | | | | | | | | | | | | | | |
Media | | | 732,119 | | | | – | | | | – | | | | 8,491,167 | |
Common Stock: | | | | | | | | | | | | | | | | |
Advertising | | | 48,642 | | | | – | | | | – | | | | 2,630,121 | |
Aerospace & Defense | | | (6,846,618 | ) | | | – | | | | – | | | | 260,380 | |
Media | | | – | | | | – | | | | – | | | | 9 | |
Warrants: | | | | | | | | | | | | | | | | |
Commercial Services | | | (449,344 | ) | | | – | | | | – | | | | 361 | |
Media | | | – | | | | – | | | | – | | | | 2 | |
Totals | | | $(12,986,206 | ) | | | $ – | | | | $(644,000 | ) | | | $11,382,040 | |
| † | | Issued via reorganization. | |
| * | | Transferred out of Level 3 into Level 2 because an evaluated price from a third-party independent pricing vendor was used on February 28, 2018. | |
The following tables present additional information about valuation techniques and inputs used for investments that are measured at fair value and categorized within Level 3 at February 28, 2018:
| | | | | | | | | | | | | | | | |
| | | Ending Balance
at 2/28/18 | | | Valuation
Technique Used | | | Unobservable
Inputs | | | Input Values | |
Investments in Securities – Assets | | | | | | | | | | | | | |
Preferred Stock | | | $8,491,100 | | |
| Market and Company
Comparables |
| |
| EV Multiples
Illiquidity Discount |
| |
| 0.69x (0.24x – 1.10x)
20% |
|
Common Stock | | | $2,630,121 | | |
| Market and Company
Comparables |
| |
| EV Multiples
Illiquidity Discount |
| |
| 4.00x (1.72x – 10.26x)
30% |
|
| | | | $260,380 | | |
| Market and Company
Comparables |
| |
| EV Multiples
M&A Transaction Multiples
Illiquidity Discount |
| |
| 0.71x (0.48x – 1.10x)
0.87x (0.32x – 2.12x) 40% |
|
| | | | | | |
| 26 | | Annual Report | | | February 28, 2018 | | | See accompanying Notes to Financial Statements |
Schedule of Investments
AllianzGI Convertible & Income Fund
February 28, 2018 (continued)
The net change in unrealized appreciation/depreciation of Level 3 investments held at February 28, 2018, was $(6,515,201). Net change in unrealized appreciation/depreciation is reflected on the Statements of Operations.
Glossary:
| | | | |
| PIK | | - | | Payment-in-Kind |
| REIT | | - | | Real Estate Investment Trust |
| | | | | | | | |
| See accompanying Notes to Financial Statements | | | February 28, 2018 | | | Annual Report | | | 27 | |
Schedule of Investments
AllianzGI Convertible & Income Fund II
February 28, 2018
| | | | | | | | | | | | |
Principal
Amount
(000s) | | | | | | | | Value | |
| | Corporate Bonds & Notes – 40.6% | | | | | | | | |
| | | | Aerospace & Defense – 1.0% | | | | | | | | |
| | $5,750 | | | TransDigm, Inc., 6.50%, 5/15/25 | | | | | | | $5,908,125 | |
| | 1,080 | | | Triumph Group, Inc., 7.75%, 8/15/25 | | | | | | | 1,119,150 | |
| | | | | | | | | | | | 7,027,275 | |
| | | | Auto Manufacturers – 0.5% | | | | | | | | |
| | 3,560 | | | Navistar International Corp., 6.625%, 11/1/25 (a)(b) | | | | | | | 3,675,700 | |
| | | | Building Materials – 0.7% | | | | | | | | |
| | 4,335 | | | U.S. Concrete, Inc., 6.375%, 6/1/24 | | | | | | | 4,627,613 | |
| | | | Chemicals – 2.7% | | | | | | | | |
| | 5,500 | | | Chemours Co., 6.625%, 5/15/23 | | | | | | | 5,809,375 | |
| | 3,640 | | | Kraton Polymers LLC, 7.00%, 4/15/25 (a)(b) | | | | | | | 3,776,500 | |
| | 4,330 | | | Platform Specialty Products Corp., 6.50%, 2/1/22 (a)(b) | | | | | | | 4,454,487 | |
| | 5,120 | | | Tronox Finance LLC, 7.50%, 3/15/22 (a)(b) | | | | | | | 5,324,800 | |
| | | | | | | | | | | | 19,365,162 | |
| | | | Commercial Services – 1.2% | | | | | | | | |
| | 5,974 | | | Cenveo Corp., 6.00%, 5/15/24 (a)(b)(c)(h)
(acquisition cost-$8,347,108; purchased 3/22/12) | | | | | | | 477,920 | |
| | 5,925 | | | Monitronics International, Inc., 9.125%, 4/1/20 | | | | | | | 5,184,375 | |
| | 2,500 | | | United Rentals North America, Inc., 5.50%, 7/15/25 | | | | | | | 2,584,375 | |
| | | | | | | | | | | | 8,246,670 | |
| | | | Computers – 1.9% | | | | | | | | |
| | 3,946 | | | DynCorp International, Inc., PIK 1.50%, 11.875%, 11/30/20 | | | | | | | 4,143,550 | |
| | 5,650 | | | Harland Clarke Holdings Corp., 9.25%, 3/1/21 (a)(b) | | | | | | | 5,861,875 | |
| | 3,155 | | | Western Digital Corp., 10.50%, 4/1/24 | | | | | | | 3,671,631 | |
| | | | | | | | | | | | 13,677,056 | |
| | | | Distribution/Wholesale – 0.6% | | | | | | | | |
| | 4,110 | | | H&E Equipment Services, Inc., 5.625%, 9/1/25 (a)(b) | | | | | | | 4,212,750 | |
| | | | Diversified Financial Services – 3.7% | | | | | | | | |
| | | | Community Choice Financial, Inc., | | | | | | | | |
| | 7,465 | | | 10.75%, 5/1/19 | | | | | | | 7,110,412 | |
| | 5,370 | | | 12.75%, 5/1/20 (a)(b) | | | | | | | 4,591,350 | |
| | | | Nationstar Mortgage LLC, | | | | | | | | |
| | 2,000 | | | 7.875%, 10/1/20 | | | | | | | 2,053,750 | |
| | 4,250 | | | 9.625%, 5/1/19 | | | | | | | 4,352,000 | |
| | | | Navient Corp., | | | | | | | | |
| | 1,200 | | | 7.25%, 9/25/23 | | | | | | | 1,281,000 | |
| | 2,605 | | | 8.45%, 6/15/18 | | | | | | | 2,644,075 | |
| | 3,865 | | | Springleaf Finance Corp., 8.25%, 10/1/23 | | | | | | | 4,270,825 | |
| | | | | | | | | | | | 26,303,412 | |
| | | | Electric Utilities – 0.6% | | | | | | | | |
| | 4,265 | | | NRG Energy, Inc., 6.25%, 5/1/24 | | | | | | | 4,435,600 | |
| | | | Engineering & Construction – 0.6% | | | | | | | | |
| | 3,900 | | | Tutor Perini Corp., 6.875%, 5/1/25 (a)(b) | | | | | | | 4,104,750 | |
| | | | Entertainment – 1.0% | | | | | | | | |
| | 3,810 | | | AMC Entertainment Holdings, Inc., 6.125%, 5/15/27 | | | | | | | 3,714,750 | |
| | 3,045 | | | Cedar Fair L.P., 5.375%, 6/1/24 | | | | | | | 3,140,156 | |
| | | | | | | | | | | | 6,854,906 | |
| | | | | | |
| 28 | | Annual Report | | | February 28, 2018 | | | See accompanying Notes to Financial Statements |
Schedule of Investments
AllianzGI Convertible & Income Fund II
February 28, 2018 (continued)
| | | | | | | | | | | | |
Principal
Amount
(000s) | | | | | | | | Value | |
| | | | Healthcare-Services – 3.1% | | | | | | | | |
| | $2,165 | | | Community Health Systems, Inc., 6.25%, 3/31/23 | | | | | | | $1,980,975 | |
| | 4,125 | | | DaVita, Inc., 5.125%, 7/15/24 | | | | | | | 4,104,375 | |
| | 2,950 | | | Envision Healthcare Corp., 6.25%, 12/1/24 (a)(b) | | | | | | | 3,119,625 | |
| | 2,950 | | | HCA, Inc., 7.50%, 2/15/22 | | | | | | | 3,270,812 | |
| | 6,045 | | | Kindred Healthcare, Inc., 8.75%, 1/15/23 | | | | | | | 6,498,375 | |
| | 2,750 | | | Tenet Healthcare Corp., 7.00%, 8/1/25 (a)(b) | | | | | | | 2,753,438 | |
| | | | | | | | | | | | 21,727,600 | |
| | | | Home Builders – 0.5% | | | | | | | | |
| | 3,365 | | | Beazer Homes USA, Inc., 8.75%, 3/15/22 | | | | | | | 3,642,613 | |
| | | | Internet & Catalog Retail – 0.3% | | | | | | | | |
| | 2,200 | | | Netflix, Inc., 5.875%, 2/15/25 | | | | | | | 2,330,042 | |
| | | | Iron/Steel – 0.9% | | | | | | | | |
| | | | AK Steel Corp., | | | | | | | | |
| | 1,550 | | | 7.00%, 3/15/27 | | | | | | | 1,583,906 | |
| | 1,005 | | | 7.50%, 7/15/23 | | | | | | | 1,077,863 | |
| | 3,597 | | | United States Steel Corp., 8.375%, 7/1/21 (a)(b) | | | | | | | 3,857,782 | |
| | | | | | | | | | | | 6,519,551 | |
| | | | Machinery-Construction & Mining – 0.5% | | | | | | | | |
| | 3,585 | | | Terex Corp., 5.625%, 2/1/25 (a)(b) | | | | | | | 3,625,331 | |
| | | | Media – 2.1% | | | | | | | | |
| | 5,630 | | | Cablevision Systems Corp., 8.00%, 4/15/20 | | | | | | | 5,997,076 | |
| | 2,850 | | | Gray Television, Inc., 5.875%, 7/15/26 (a)(b) | | | | | | | 2,832,187 | |
| | 3,589 | | | LiveStyle, Inc., 9.625%, 2/1/19 (a)(b)(c)(h)(j) | | | | | | | | |
| | | | | (acquisition cost-$3,749,795; purchased 5/7/14-2/26/15) | | | | | | | 72 | |
| | 5,512 | | | McClatchy Co., 9.00%, 12/15/22 | | | | | | | 5,773,820 | |
| | | | | | | | | | | | 14,603,155 | |
| | | | Metal Fabricate/Hardware – 0.4% | | | | | | | | |
| | 2,920 | | | Park-Ohio Industries, Inc., 6.625%, 4/15/27 | | | | | | | 3,066,000 | |
| | | | Mining – 1.9% | | | | | | | | |
| | 3,900 | | | Alcoa Nederland Holding BV, 7.00%, 9/30/26 (a)(b) | | | | | | | 4,231,500 | |
| | 3,365 | | | Constellium NV, 6.625%, 3/1/25 (a)(b) | | | | | | | 3,491,187 | |
| | 2,135 | | | Hudbay Minerals, Inc., 7.625%, 1/15/25 (a)(b) | | | | | | | 2,332,488 | |
| | 3,050 | | | Joseph T. Ryerson & Son, Inc., 11.00%, 5/15/22 (a)(b) | | | | | | | 3,403,343 | |
| | | | | | | | | | | | 13,458,518 | |
| | | | Oil, Gas & Consumable Fuels – 5.0% | | | | | | | | |
| | 2,300 | | | Calumet Specialty Products Partners L.P., 6.50%, 4/15/21 | | | | | | | 2,254,000 | |
| | 1,420 | | | Carrizo Oil & Gas, Inc., 6.25%, 4/15/23 | | | | | | | 1,430,650 | |
| | 12,800 | | | Cobalt International Energy, Inc., 10.75%, 12/1/21 (c) | | | | | | | 13,888,000 | |
| | 450 | | | Ensco PLC, 5.20%, 3/15/25 | | | | | | | 375,750 | |
| | 6,180 | | | EP Energy LLC, 9.375%, 5/1/20 | | | | | | | 5,778,300 | |
| | 2,165 | | | NGL Energy Partners L.P., 7.50%, 11/1/23 | | | | | | | 2,181,237 | |
| | 740 | | | Noble Holding International Ltd., 7.75%, 1/15/24 | | | | | | | 677,100 | |
| | 3,745 | | | Oasis Petroleum, Inc., 6.875%, 3/15/22 | | | | | | | 3,845,647 | |
| | 3,470 | | | Sanchez Energy Corp., 6.125%, 1/15/23 | | | | | | | 2,619,850 | |
| | 1,280 | | | Transocean, Inc., 7.50%, 1/15/26 (a)(b) | | | | | | | 1,292,800 | |
| | 630 | | | Weatherford International Ltd., 8.25%, 6/15/23 | | | | | | | 612,675 | |
| | | | | | | | | | | | 34,956,009 | |
| | | | | | | | |
| See accompanying Notes to Financial Statements | | | February 28, 2018 | | | Annual Report | | | 29 | |
Schedule of Investments
AllianzGI Convertible & Income Fund II
February 28, 2018 (continued)
| | | | | | | | | | | | |
Principal
Amount
(000s) | | | | | | | | Value | |
| | | | Pharmaceuticals – 1.3% | | | | | | | | |
| | $1,755 | | | Endo Finance LLC, 5.375%, 1/15/23 (a)(b) | | | | | | | $1,311,863 | |
| | 4,425 | | | Horizon Pharma, Inc., 6.625%, 5/1/23 | | | | | | | 4,447,125 | |
| | 3,000 | | | Valeant Pharmaceuticals International, Inc., 7.50%, 7/15/21 (a)(b) | | | | | | | 3,026,250 | |
| | | | | | | | | | | | 8,785,238 | |
| | | | Pipelines – 0.4% | | | | | | | | |
| | 2,715 | | | Energy Transfer Equity L.P., 5.50%, 6/1/27 | | | | | | | 2,816,813 | |
| | | | Real Estate – 0.9% | | | | | | | | |
| | 2,345 | | | Kennedy-Wilson, Inc., 5.875%, 4/1/24 | | | | | | | 2,353,794 | |
| | 4,090 | | | Uniti Group L.P., 8.25%, 10/15/23 | | | | | | | 3,834,375 | |
| | | | | | | | | | | | 6,188,169 | |
| | | | Retail – 2.0% | | | | | | | | |
| | 4,500 | | | Claire’s Stores, Inc., 9.00%, 3/15/19 (a)(b) | | | | | | | 3,082,500 | |
| | 4,370 | | | Conn’s, Inc., 7.25%, 7/15/22 | | | | | | | 4,348,150 | |
| | 2,165 | | | Dollar Tree, Inc., 5.75%, 3/1/23 | | | | | | | 2,255,659 | |
| | 1,170 | | | L Brands, Inc., 6.875%, 11/1/35 | | | | | | | 1,174,037 | |
| | 5,785 | | | Neiman Marcus Group Ltd. LLC, 8.00%, 10/15/21 (a)(b) | | | | | | | 3,528,850 | |
| | | | | | | | | | | | 14,389,196 | |
| | | | Semiconductors – 1.0% | | | | | | | | |
| | 4,090 | | | Advanced Micro Devices, Inc., 7.00%, 7/1/24 | | | | | | | 4,299,612 | |
| | 2,875 | | | Amkor Technology, Inc., 6.375%, 10/1/22 | | | | | | | 2,968,438 | |
| | | | | | | | | | | | 7,268,050 | |
| | | | Software – 0.8% | | | | | | | | |
| | 3,850 | | | Camelot Finance S.A., 7.875%, 10/15/24 (a)(b) | | | | | | | 4,091,780 | |
| | 1,135 | | | Rackspace Hosting, Inc., 8.625%, 11/15/24 (a)(b) | | | | | | | 1,186,075 | |
| | | | | | | | | | | | 5,277,855 | |
| | | | Telecommunications – 4.4% | | | | | | | | |
| | 3,125 | | | Cincinnati Bell, Inc., 7.00%, 7/15/24 (a)(b) | | | | | | | 2,973,437 | |
| | 7,130 | | | Consolidated Communications, Inc., 6.50%, 10/1/22 | | | | | | | 6,274,400 | |
| | 4,045 | | | Frontier Communications Corp., 10.50%, 9/15/22 | | | | | | | 3,463,531 | |
| | 2,050 | | | GTT Communications, Inc., 7.875%, 12/31/24 (a)(b) | | | | | | | 2,135,844 | |
| | | | Hughes Satellite Systems Corp., | | | | | | | | |
| | 1,130 | | | 6.625%, 8/1/26 | | | | | | | 1,158,589 | |
| | 3,500 | | | 7.625%, 6/15/21 | | | | | | | 3,780,000 | |
| | 5,545 | | | Sprint Communications, Inc., 11.50%, 11/15/21 | | | | | | | 6,570,825 | |
| | 1,425 | | | Sprint Corp., 7.625%, 3/1/26 | | | | | | | 1,421,438 | |
| | 6,283 | | | Windstream Services LLC, 6.375%, 8/1/23 (a)(b) | | | | | | | 3,549,895 | |
| | | | | | | | | | | | 31,327,959 | |
| | | | Transportation – 0.6% | | | | | | | | |
| | 3,920 | | | XPO Logistics, Inc., 6.50%, 6/15/22 (a)(b) | | | | | | | 4,088,560 | |
| | Total Corporate Bonds & Notes (cost-$300,741,968) | | | | | | | 286,601,553 | |
| | Convertible Bonds & Notes – 34.6% | | | | | | | | |
| | | | Apparel & Textiles – 1.8% | | | | | | | | |
| | 11,020 | | | Iconix Brand Group, Inc., 5.75%, 8/15/23 | | | | | | | 12,593,105 | |
| | | | Auto Components – 1.0% | | | | | | | | |
| | 8,945 | | | Horizon Global Corp., 2.75%, 7/1/22 | | | | | | | 7,284,584 | |
| | | | | | |
| 30 | | Annual Report | | | February 28, 2018 | | | See accompanying Notes to Financial Statements |
Schedule of Investments
AllianzGI Convertible & Income Fund II
February 28, 2018 (continued)
| | | | | | | | | | | | |
Principal
Amount
(000s) | | | | | | | | Value | |
| | | | Auto Manufacturers – 1.0% | | | | | | | | |
| | $4,675 | | | Navistar International Corp., 4.75%, 4/15/19 | | | | | | | $4,862,813 | |
| | 2,150 | | | Tesla, Inc., 1.25%, 3/1/21 | | | | | | | 2,451,082 | |
| | | | | | | | | | | | 7,313,895 | |
| | | | Biotechnology – 0.8% | | | | | | | | |
| | 7,260 | | | Intercept Pharmaceuticals, Inc., 3.25%, 7/1/23 | | | | | | | 5,821,961 | |
| | | | Building Materials – 0.5% | | | | | | | | |
| | 3,225 | | | Cemex S.A.B de C.V., 3.72%, 3/15/20 | | | | | | | 3,333,605 | |
| | | | Commercial Services – 2.6% | | | | | | | | |
| | 10,220 | | | Ascent Capital Group, Inc., 4.00%, 7/15/20 | | | | | | | 7,932,764 | |
| | 7,960 | | | Huron Consulting Group, Inc., 1.25%, 10/1/19 | | | | | | | 7,452,550 | |
| | 2,795 | | | ServiceSource International, Inc., 1.50%, 8/1/18 | | | | | | | 2,747,206 | |
| | | | | | | | | | | | 18,132,520 | |
| | | | Distribution/Wholesale – 0.7% | | | | | | | | |
| | 4,975 | | | Titan Machinery, Inc., 3.75%, 5/1/19 | | | | | | | 4,941,936 | |
| | | | Diversified Financial Services – 2.4% | | | | | | | | |
| | 7,030 | | | Encore Capital Group, Inc., 3.00%, 7/1/20 | | | | | | | 7,880,630 | |
| | 9,160 | | | PRA Group, Inc., 3.00%, 8/1/20 | | | | | | | 8,915,272 | |
| | | | | | | | | | | | 16,795,902 | |
| | | | Electric Utilities – 1.0% | | | | | | | | |
| | 6,905 | | | NRG Yield, Inc., 3.25%, 6/1/20 (a)(b) | | | | | | | 6,884,810 | |
| | | | Electrical Equipment – 1.1% | | | | | | | | |
| | | | SunPower Corp., | | | | | | | | |
| | 2,365 | | | 0.875%, 6/1/21 | | | | | | | 1,818,212 | |
| | 7,095 | | | 4.00%, 1/15/23 | | | | | | | 5,742,693 | |
| | | | | | | | | | | | 7,560,905 | |
| | | | Electronics – 0.6% | | | | | | | | |
| | 4,450 | | | OSI Systems, Inc., 1.25%, 9/1/22 (a)(b) | | | | | | | 3,996,656 | |
| | | | Energy-Alternate Sources – 2.1% | | | | | | | | |
| | 3,010 | | | Pattern Energy Group, Inc., 4.00%, 7/15/20 | | | | | | | 2,998,460 | |
| | 12,690 | | | SolarCity Corp., 1.625%, 11/1/19 | | | | | | | 11,895,200 | |
| | | | | | | | | | | | 14,893,660 | |
| | | | Engineering & Construction – 0.3% | | | | | | | | |
| | 2,445 | | | Layne Christensen Co., 4.25%, 11/15/18 | | | | | | | 2,472,411 | |
| | | | Equity Real Estate Investment Trusts (REITs) – 1.4% | | | | | | | | |
| | 4,100 | | | Two Harbors Investment Corp., 6.25%, 1/15/22 | | | | | | | 4,215,017 | |
| | 5,810 | | | Western Asset Mortgage Capital Corp., 6.75%, 10/1/22 | | | | | | | 5,728,660 | |
| | | | | | | | | | | | 9,943,677 | |
| | | | Healthcare/Healthcare Distributors – 1.1% | | | | | | | | |
| | 8,615 | | | Aceto Corp., 2.00%, 11/1/20 | | | | | | | 7,623,439 | |
| | | | Insurance – 1.1% | | | | | | | | |
| | 9,260 | | | AmTrust Financial Services, Inc., 2.75%, 12/15/44 | | | | | | | 8,146,661 | |
| | | | Iron/Steel – 0.1% | | | | | | | | |
| | 690 | | | AK Steel Corp., 5.00%, 11/15/19 | | | | | | | 866,210 | |
| | | | Oil, Gas & Consumable Fuels – 3.0% | | | | | | | | |
| | 13,775 | | | Helix Energy Solutions Group, Inc., 3.25%, 3/15/32 | | | | | | | 13,801,833 | |
| | 7,525 | | | Whiting Petroleum Corp., 1.25%, 4/1/20 | | | | | | | 7,120,524 | |
| | | | | | | | | | | | 20,922,357 | |
| | | | | | | | |
| See accompanying Notes to Financial Statements | | | February 28, 2018 | | | Annual Report | | | 31 | |
Schedule of Investments
AllianzGI Convertible & Income Fund II
February 28, 2018 (continued)
| | | | | | | | | | | | |
Principal
Amount
(000s) | | | | | | | | Value | |
| | | | Pharmaceuticals – 3.5% | | | | | | | | |
| | $12,175 | | | Herbalife Ltd., 2.00%, 8/15/19 | | | | | | | $14,188,100 | |
| | 2,460 | | | Horizon Pharma Investment Ltd., 2.50%, 3/15/22 | | | | | | | 2,278,575 | |
| | 5,885 | | | Impax Laboratories, Inc., 2.00%, 6/15/22 | | | | | | | 5,793,535 | |
| | 2,585 | | | Jazz Investments I Ltd., 1.50%, 8/15/24 (a)(b) | | | | | | | 2,465,568 | |
| | | | | | | | | | | | 24,725,778 | |
| | | | Pipelines – 1.1% | | | | | | | | |
| | 10,095 | | | Cheniere Energy, Inc., 4.25%, 3/15/45 | | | | | | | 7,824,100 | |
| | | | Retail – 1.1% | | | | | | | | |
| | 7,860 | | | RH, zero coupon, 6/15/19 (a)(b) | | | | | | | 7,768,714 | |
| | | | Semiconductors – 0.9% | | | | | | | | |
| | | | Cypress Semiconductor Corp., | | | | | | | | |
| | 635 | | | 2.00%, 2/1/23 (a)(b) | | | | | | | 698,065 | |
| | 2,150 | | | 4.50%, 1/15/22 | | | | | | | 3,093,235 | |
| | 2,970 | | | Veeco Instruments, Inc., 2.70%, 1/15/23 | | | | | | | 2,753,374 | |
| | | | | | | | | | | | 6,544,674 | |
| | | | Software – 1.8% | | | | | | | | |
| | 11,915 | | | Avid Technology, Inc., 2.00%, 6/15/20 | | | | | | | 10,262,390 | |
| | 3,015 | | | Synchronoss Technologies, Inc., 0.75%, 8/15/19 | | | | | | | 2,785,314 | |
| | | | | | | | | | | | 13,047,704 | |
| | | | Telecommunications – 1.0% | | | | | | | | |
| | 8,310 | | | Gogo, Inc., 3.75%, 3/1/20 | | | | | | | 7,306,368 | |
| | | | Tobacco – 1.6% | | | | | | | | |
| | | | Vector Group Ltd. (g), | | | | | | | | |
| | 4,335 | | | 3 mo. Cash Dividends on Common Stock + 1.75%, 1.75%, 4/15/20 | | | | | | | 4,744,905 | |
| | 4,685 | | | 3 mo. Cash Dividends on Common Stock + 2.50%, 2.50%, 1/15/19 | | | | | | | 6,573,926 | |
| | | | | | | | | | | | 11,318,831 | |
| | | | Transportation – 1.0% | | | | | | | | |
| | 3,010 | | | Aegean Marine Petroleum Network, Inc., 4.25%, 12/15/21 | | | | | | | 1,834,896 | |
| | 3,440 | | | Echo Global Logistics, Inc., 2.50%, 5/1/20 | | | | | | | 3,522,563 | |
| | 1,505 | | | Teekay Corp., 5.00%, 1/15/23 (a)(b) | | | | | | | 1,443,709 | |
| | | | | | | | | | | | 6,801,168 | |
| | Total Convertible Bonds & Notes (cost-$229,450,234) | | | | | | | 244,865,631 | |
| | | |
| Shares | | | | | | | | | |
| | Convertible Preferred Stock – 21.5% | | | | | | | | |
| | | | Banks – 4.0% | | | | | | | | |
| | 9,140 | | | Bank of America Corp., 7.25%, Ser. L (e) | | | | | | | 11,694,904 | |
| | 12,835 | | | Wells Fargo & Co., 7.50%, Ser. L (e) | | | | | | | 16,364,625 | |
| | | | | | | | | | | | 28,059,529 | |
| | | | Chemicals – 1.0% | | | | | | | | |
| | 51,505 | | | Rayonier Advanced Materials, Inc., 8.00%, 8/15/19, Ser. A | | | | | | | 7,358,262 | |
| | | | Commercial Services & Supplies – 0.8% | | | | | | | | |
| | 110,120 | | | Stericycle, Inc., 5.25%, 9/15/18 | | | | | | | 5,349,630 | |
| | | | Diversified Financial Services – 0.5% | | | | | | | | |
| | 4,300 | | | Cowen, Inc., 5.625%, Ser. A (e) | | | | | | | 3,567,323 | |
| | | | | | |
| 32 | | Annual Report | | | February 28, 2018 | | | See accompanying Notes to Financial Statements |
Schedule of Investments
AllianzGI Convertible & Income Fund II
February 28, 2018 (continued)
| | | | | | | | | | | | |
| Shares | | | | | | | | Value | |
| | | | Diversified Telecommunication Services – 0.2% | | | | | | | | |
| | 117,480 | | | Frontier Communications Corp., 11.125%, 6/29/18, Ser. A | | | | | | | $1,488,472 | |
| | | | Electric Utilities – 2.0% | | | | | | | | |
| | 228,650 | | | Dominion Energy, Inc., 6.75%, 8/15/19, Ser. A | | | | | | | 11,151,260 | |
| | 50,060 | | | NextEra Energy, Inc., 6.123%, 9/1/19 | | | | | | | 2,768,318 | |
| | | | | | | | | | | | 13,919,578 | |
| | | | Equity Real Estate Investment Trusts (REITs) – 4.2% | | | | | | | | |
| | 3,490 | | | Crown Castle International Corp., 6.875%, 8/1/20, Ser. A | | | | | | | 3,906,043 | |
| | 476,235 | | | RLJ Lodging Trust, 1.95%, Ser. A (e) | | | | | | | 12,377,347 | |
| | 309,935 | | | Sutherland Asset Management Corp., 7.00%, 8/15/23 | | | | | | | 7,748,375 | |
| | 106,440 | | | Welltower, Inc., 6.50%, Ser. I (e) | | | | | | | 5,800,980 | |
| | | | | | | | | | | | 29,832,745 | |
| | | | Hand/Machine Tools – 1.7% | | | | | | | | |
| | 104,940 | | | Stanley Black & Decker, Inc., 5.375%, 5/15/20 | | | | | | | 12,367,179 | |
| | | | Healthcare Providers & Services – 2.5% | | | | | | | | |
| | 302,850 | | | Anthem, Inc., 5.25%, 5/1/18 | | | | | | | 17,377,533 | |
| | | | Healthcare-Products – 1.3% | | | | | | | | |
| | 150,440 | | | Becton Dickinson and Co., 6.125%, 5/1/20, Ser. A | | | | | | | 8,861,849 | |
| | | | Oil, Gas & Consumable Fuels – 2.1% | | | | | | | | |
| | 120,125 | | | Anadarko Petroleum Corp., 7.50%, 6/7/18 | | | | | | | 3,904,063 | |
| | 130,590 | | | Kinder Morgan, Inc., 9.75%, 10/26/18, Ser. A | | | | | | | 4,351,259 | |
| | 173,845 | | | Sanchez Energy Corp., 6.50%, Ser. B (e) | | | | | | | 3,104,576 | |
| | 62,570 | | | WPX Energy, Inc., 6.25%, 7/31/18, Ser. A | | | | | | | 3,849,932 | |
| | | | | | | | | | | | 15,209,830 | |
| | | | Pharmaceuticals – 1.2% | | | | | | | | |
| | 23,315 | | | Teva Pharmaceutical Industries Ltd., 7.00%, 12/15/18 | | | | | | | 8,233,692 | |
| | Total Convertible Preferred Stock (cost-$161,179,713) | | | | | | | 151,625,622 | |
| | Preferred Stock (a)(d)(f)(i)(j) – 1.2% | | | | | | | | |
| | | | Media – 1.2% | | | | | | | | |
| | 8,339 | | | LiveStyle, Inc., Ser. A | | | | | | | 833,900 | |
| | 76,572 | | | LiveStyle, Inc., Ser. B | | | | | | | 7,657,200 | |
| | 5,000 | | | LiveStyle, Inc., Ser. B | | | | | | | 50 | |
| | Total Preferred Stock (cost-$13,324,564) | | | | | | | 8,491,150 | |
| | Common Stock (a)(d)(f)(i) – 0.3% | | | | | | | | |
| | | | Advertising – 0.3% | | | | | | | | |
| | 133,715 | | | Affinion Group Holdings, Inc., Class A (h) | | | | | | | | |
| | | | | (acquisition cost-$2,371,020; purchased 11/9/15-11/12/15) | | | | | | | 2,024,445 | |
| | | | Aerospace & Defense – 0.0% | | | | | | | | |
| | 6,354 | | | Erickson, Inc. | | | | | | | 199,452 | |
| | | | Media – 0.0% | | | | | | | | |
| | 90,407 | | | LiveStyle, Inc. (j) | | | | | | | 9 | |
| | Total Common Stock (cost-$7,842,203) | | | | | | | 2,223,906 | |
| | | |
| Units | | | | | | | | | |
| | Warrants (d)(f)(i) – 0.0% | | | | | | | | |
| | | | Commercial Services – 0.0% | | | | | | | | |
| | 1,562,241 | | | Cenveo, Inc., strike price $12.00, expires 6/10/24 (b) | | | | | | | 273 | |
| | | | | | | | |
| See accompanying Notes to Financial Statements | | | February 28, 2018 | | | Annual Report | | | 33 | |
Schedule of Investments
AllianzGI Convertible & Income Fund II
February 28, 2018 (continued)
| | | | | | | | | | | | |
| Units | | | | | | | | Value | |
| | | | Media – 0.0% | | | | | | | | |
| | 19,500 | | | LiveStyle, Inc., expires 11/30/21, Ser. C. (a)(j) | | | | | | | $2 | |
| | Total Warrants (cost-$183,305) | | | | | �� | | 275 | |
| | | |
Principal
Amount
(000s) | | | | | | | | | |
| | | | Repurchase Agreements – 1.8% | | | | | | | | |
| | $12,978 | | | State Street Bank and Trust Co.,
dated 2/28/18, 0.20%, due 3/1/18, proceeds $12,978,072; collateralized by U.S. Treasury Notes, 1.25%, due 7/31/23, valued at $13,238,902 including accrued interest (cost-$12,978,000) | | | | | | | 12,978,000 | |
| | Total Investments (cost-$725,699,987) – 100.0% | | | | | | | 706,786,137 | |
| | Other assets in excess of liabilities | | | | | | | 7,319,649 | |
| | Preferred Shares | | | | | | | (274,000,000 | ) |
| | Net Assets Applicable to Common Shareholders | | | | | | | $440,105,786 | |
Notes to Schedule of Investments:
| (a) | | Private Placement–Restricted as to resale and may not have a readily available market. Securities with an aggregate value of $130,367,519, representing 18.4% of total investments. | |
| (b) | | 144A–Exempt from registration under Rule 144A of the Securities Act of 1933. These securities may be resold in transactions exempt from registration, typically only to qualified institutional buyers. Securities with an aggregate value of $119,652,734, representing 16.9% of total investments. | |
| (d) | | Fair-Valued–Securities with an aggregate value of $10,715,331, representing 1.5% of total investments. See Note 1(a) and Note 1(b) in the Notes to Financial Statements. | |
| (e) | | Perpetual maturity. The date shown, if any, is the next call date. | |
| (f) | | Level 3 security. See Note 1(a) and Note 1(b) in the Notes to Financial Statements. | |
| (g) | | In addition to the coupon rate shown, the issuer is expected to pay additional interest based on the actual dividends paid on its common stock. | |
| (h) | | Restricted. The aggregate acquisition cost of such securities is $14,467,923. The aggregate value is $2,502,437, representing 0.4% of total investments. | |
| (i) | | Non-income producing. | |
| (j) | | A member of the Fund’s portfolio management team is a member of the board of directors of LiveStyle, Inc. The Fund’s aggregate value of investments in LiveStyle, Inc. represents 1.2% of total investments. | |
| (k) | | Fair Value Measurements-See Note 1(b) in the Notes to Financial Statements. | |
| | | | | | | | | | | | | | | | |
| | | Level 1 –
Quoted
Prices | | | Level 2 –
Other Significant
Observable
Inputs | | | Level 3 –
Significant
Unobservable
Inputs | | | Value at
2/28/18 | |
Investments in Securities – Assets | |
Corporate Bonds & Notes | | | – | | | | $286,601,553 | | | | – | | | | $286,601,553 | |
Convertible Bonds & Notes | | | – | | | | 244,865,631 | | | | – | | | | 244,865,631 | |
Convertible Preferred Stock: | |
Chemicals | | | – | | | | 7,358,262 | | | | – | | | | 7,358,262 | |
Diversified Financial Services | | | – | | | | 3,567,323 | | | | – | | | | 3,567,323 | |
Healthcare-Products | | | – | | | | 8,861,849 | | | | – | | | | 8,861,849 | |
Oil, Gas & Consumable Fuels | | | $12,105,254 | | | | 3,104,576 | | | | – | | | | 15,209,830 | |
Pharmaceuticals | | | – | | | | 8,233,692 | | | | – | | | | 8,233,692 | |
All Other | | | 108,394,666 | | | | – | | | | – | | | | 108,394,666 | |
Preferred Stock | | | – | | | | – | | | | $8,491,150 | | | | 8,491,150 | |
Common Stock | | | – | | | | – | | | | 2,223,906 | | | | 2,223,906 | |
Warrants | | | – | | | | – | | | | 275 | | | | 275 | |
Repurchase Agreements | | | – | | | | 12,978,000 | | | | – | | | | 12,978,000 | |
Totals | | | $120,499,920 | | | | $575,570,886 | | | | $10,715,331 | | | | $706,786,137 | |
| | | | | | |
| 34 | | Annual Report | | | February 28, 2018 | | | See accompanying Notes to Financial Statements |
Schedule of Investments
AllianzGI Convertible & Income Fund II
February 28, 2018 (continued)
At February 28, 2018, there were no transfers between Levels 1 and 2.
A roll forward of fair value measurements using significant unobservable inputs (Level 3) for the year ended February 28, 2018, was as follows:
| | | | | | | | | | | | | | | | | | | | |
| | | Beginning
Balance
2/28/17 | | | Purchases | | | Sales | | | Accrued
Discount
(Premiums) | | | Net
Realized
Gain (Loss) | |
Investments in Securities – Assets | | | | | | | | | | | | | | | | | | | | |
Corporate Bonds & Notes: | | | | | | | | | | | | | | | | | | | | |
Commercial Services | | | $5,361,665 | | | | $ – | | | | $ – | | | | $(81,535 | ) | | | $ – | |
Preferred Stock: | | | | | | | | | | | | | | | | | | | | |
Media | | | 7,759,031 | | | | – | | | | – | | | | – | | | | – | |
Common Stock: | | | | | | | | | | | | | | | | | | | | |
Advertising | | | 1,987,005 | | | | – | | | | – | | | | – | | | | – | |
Aerospace & Defense | | | – | | | | 5,471,184 | † | | | – | | | | – | | | | | |
Media | | | 9 | | | | – | | | | – | | | | – | | | | – | |
Warrants: | | | | | | | | | | | | | | | | | | | | |
Commercial Services | | | 340,656 | | | | – | | | | – | | | | – | | | | – | |
Media | | | 2 | | | | – | | | | – | | | | – | | | | – | |
Totals | | | $15,448,368 | | | | $5,471,184 | | | | $ – | | | | $(81,535 | ) | | | $ – | |
| | | | | | | | | | | | | | | | |
| | | Net Change
in Unrealized
Appreciation/
Depreciation | | | Transfers
into
Level 3 | | | Transfers
out of
Level 3* | | | Ending
Balance
2/28/18 | |
Investments in Securities – Assets | | | | | | | | | | | | | | | | |
Corporate Bonds & Notes: | | | | | | | | | | | | | | | | |
Commercial Services | | | $(4,802,210 | ) | | | $ – | | | | $(477,920 | ) | | | $ – | |
Preferred Stock: | | | | | | | | | | | | | | | | |
Media | | | 732,119 | | | | – | | | | – | | | | 8,491,150 | |
Common Stock: | | | | | | | | | | | | | | | | |
Advertising | | | 37,440 | | | | – | | | | – | | | | 2,024,445 | |
Aerospace & Defense | | | (5,271,732 | ) | | | – | | | | – | | | | 199,452 | |
Media | | | – | | | | – | | | | – | | | | 9 | |
Warrants: | | | | | | | | | | | | | | | | |
Commercial Services | | | (340,383 | ) | | | – | | | | – | | | | 273 | |
Media | | | – | | | | – | | | | – | | | | 2 | |
Totals | | | $(9,644,766 | ) | | | $ – | | | | $(477,920 | ) | | | $10,715,331 | |
| † | | Issued via reorganization. | |
| * | | Transferred out of Level 3 into Level 2 because an evaluated price from a third-party independent pricing vendor was used on February 28, 2018. | |
| | | | | | | | |
| See accompanying Notes to Financial Statements | | | February 28, 2018 | | | Annual Report | | | 35 | |
Schedule of Investments
AllianzGI Convertible & Income Fund II
February 28, 2018 (continued)
The following tables present additional information about valuation techniques and inputs used for investments that are measured at fair value and categorized within Level 3 at February 28, 2018:
| | | | | | | | | | |
| | | Ending Balance
at 2/28/18 | | | Valuation
Technique Used | | Unobservable
Inputs | | Input Values |
Investments in Securities – Assets |
Preferred Stock | | | $8,491,100 | | | Market and Company
Comparables | | EV Multiples
Illiquidity Discount | | 0.69x (0.24x – 1.10x)
20% |
Common Stock | | | $2,024,445 | | | Market and Company
Comparables | | EV Multiples
Illiquidity Discount | | 4.00x (1.72x – 10.26x)
30% |
| | | | $199,452 | | | Market and Company
Comparables | | EV Multiples
M&A Transaction Multiples Illiquidity Discount | | 0.71x (0.48x – 1.10x)
0.87x (0.32x – 2.12x) 40% |
The net change in unrealized appreciation/depreciation of Level 3 investments held at February 28, 2018, was $(4,842,556). Net change in unrealized appreciation/depreciation is reflected on the Statements of Operations.
Glossary:
| | | | |
| PIK | | - | | Payment-in-Kind |
| REIT | | - | | Real Estate Investment Trust |
| | | | | | |
| 36 | | Annual Report | | | February 28, 2018 | | | See accompanying Notes to Financial Statements |
Statements of Assets and Liabilities
AllianzGI Convertible & Income Funds
February 28, 2018
| | | | | | | | | | | | | | | | | | | | | | | | |
| | | | | | Convertible &
Income 2024
Target Term | | | | | | Convertible &
Income | | | | | | Convertible &
Income II | |
| Assets: | | | | | | | | | | | | | | | | | | | | | | | | |
| Investments, at value (cost-$248,415,545, $955,077,772 and $725,699,987, respectively) | | | | | | | $246,435,837 | | | | | | | | $928,544,635 | | | | | | | | $706,786,137 | |
| Interest and dividends receivable | | | | | | | 3,266,137 | | | | | | | | 11,378,225 | | | | | | | | 8,728,993 | |
| Receivable for investments sold | | | | | | | 1,929,931 | | | | | | | | 6,844,055 | | | | | | | | 5,262,748 | |
| Receivable for principal paydowns | | | | | | | 19,790 | | | | | | | | – | | | | | | | | – | |
| Tax reclaims receivable | | | | | | | 9,625 | | | | | | | | – | | | | | | | | – | |
| Investments in Affiliated Funds – Trustees Deferred Compensation Plan (see Note 3) | | | | | | | 2,708 | | | | | | | | 80,435 | | | | | | | | 60,855 | |
| Prepaid expenses | | | | | | | 15,972 | | | | | | | | 68,331 | | | | | | | | 94,822 | |
Total Assets | | | | | | | 251,680,000 | | | | | | | | 946,915,681 | | | | | | | | 720,933,555 | |
| | | | | | |
| Liabilities: | | | | | | | | | | | | | | | | | | | | | | | | |
| Loan payable (See Note 7) | | | | | | | 69,700,000 | | | | | | | | – | | | | | | | | – | |
| Payable for investments purchased | | | | | | | 2,005,608 | | | | | | | | 2,275,779 | | | | | | | | 1,716,816 | |
| Dividends payable to common and preferred shareholders | | | | | | | 839,823 | | | | | | | | 5,854,069 | | | | | | | | 4,369,826 | |
| Investment management fees payable | | | | | | | 142,748 | | | | | | | | 502,963 | | | | | | | | 382,944 | |
| Payable to custodian for cash overdraft | | | | | | | 12,308 | | | | | | | | 46,931 | | | | | | | | 39,603 | |
| Loan interest payable | | | | | | | 11,274 | | | | | | | | – | | | | | | | | – | |
| Trustees Deferred Compensation Plan payable (see Note 3) | | | | | | | 2,708 | | | | | | | | 80,435 | | | | | | | | 60,855 | |
| Accrued expenses and other liabilities | | | | | | | 205,259 | | | | | | | | 288,666 | | | | | | | | 257,725 | |
Total Liabilities | | | | | | | 72,919,728 | | | | | | | | 9,048,843 | | | | | | | | 6,827,769 | |
| Preferred Shares ($0.00001 par value and $25,000 liquidation preference per share applicable to an aggregate of 0, 14,280 and 10,960 shares issued and outstanding, respectively) | | | | | | | – | | | | | | | | 357,000,000 | | | | | | | | 274,000,000 | |
| Net Assets Applicable to Common Shareholders | | | | | | | $178,760,272 | | | | | | | | $580,866,838 | | | | | | | | $440,105,786 | |
| | | | | | |
| Composition of Net Assets Applicable to Common Shareholders: | | | | | | | | | | | | | | | | | | | | | | | | |
| Common Shares: | | | | | | | | | | | | | | | | | | | | | | | | |
Par value ($0.00001 per share) | | | | | | | $183 | | | | | | | | $888 | | | | | | | | $749 | |
Paid-in-capital in excess of par | | | | | | | 179,156,440 | | | | | | | | 791,029,201 | | | | | | | | 606,025,486 | |
| Undistributed (dividends in excess of) net investment income | | | | | | | 574,250 | | | | | | | | (8,534,373) | | | | | | | | (6,418,474) | |
| Accumulated net realized gain (loss) | | | | | | | 1,009,107 | | | | | | | | (175,095,741) | | | | | | | | (140,588,125) | |
| Net unrealized depreciation | | | | | | | (1,979,708) | | | | | | | | (26,533,137) | | | | | | | | (18,913,850) | |
| Net Assets Applicable to Common Shareholders | | | | | | | $178,760,272 | | | | | | | | $580,866,838 | | | | | | | | $440,105,786 | |
| Common Shares Issued and Outstanding | | | | | | | 18,257,012 | | | | | | | | 88,808,652 | | | | | | | | 74,921,851 | |
| Net Asset Value Per Common Share | | | | | | | $9.79 | | | | | | | | $6.54 | | | | | | | | $5.87 | |
| | | | | | | | |
| See accompanying Notes to Financial Statements | | | February 28, 2018 | | | Annual Report | | | 37 | |
Statements of Operations
AllianzGI Convertible & Income Funds
Period or Year ended February 28, 2018
| | | | | | | | | | | | | | | | | | | | | | | | |
| | | | | | Convertible &
Income 2024
Target Term (1) | | | | | | Convertible &
Income | | | | | | Convertible &
Income II | |
| Investment Income: | | | | | | | | | | | | | | | | | | | | | | | | |
| Interest | | | | | | | $7,939,270 | | | | | | | | $52,039,070 | | | | | | | | $39,612,251 | |
| Dividends (net of foreign withholding taxes of $42,000, $234,701 and $177,004, respectively) | | | | | | | 818,594 | | | | | | | | 16,407,387 | | | | | | | | 12,299,268 | |
| Miscellaneous | | | | | | | 115,342 | | | | | | | | 82,682 | | | | | | | | 31,206 | |
Total Investment Income | | | | | | | 8,873,206 | | | | | | | | 68,529,139 | | | | | | | | 51,942,725 | |
| | | | | | |
| Expenses: | | | | | | | | | | | | | | | | | | | | | | | | |
| Investment management | | | | | | | 1,201,486 | | | | | | | | 6,632,033 | | | | | | | | 5,044,992 | |
| Loan interest | | | | | | | 1,064,542 | | | | | | | | – | | | | | | | | – | |
| Audit and tax services | | | | | | | 88,700 | | | | | | | | 111,140 | | | | | | | | 117,577 | |
| Custodian and accounting agent | | | | | | | 46,071 | | | | | | | | 118,909 | | | | | | | | 100,507 | |
| Excise tax | | | | | | | 36,150 | | | | | | | | – | | | | | | | | – | |
| Legal | | | | | | | 36,000 | | | | | | | | 61,503 | | | | | | | | 53,257 | |
| Shareholder communications | | | | | | | 28,205 | | | | | | | | 86,189 | | | | | | | | 72,062 | |
| Transfer agent | | | | | | | 14,700 | | | | | | | | 25,281 | | | | | | | | 26,241 | |
| Trustees | | | | | | | 7,844 | | | | | | | | 41,561 | | | | | | | | 32,208 | |
| Insurance | | | | | | | 5,057 | | | | | | | | 20,396 | | | | | | | | 16,609 | |
| Auction agent and commissions | | | | | | | – | | | | | | | | 417,416 | | | | | | | | 324,616 | |
| New York Stock Exchange listing | | | | | | | – | | | | | | | | 43,778 | | | | | | | | 36,624 | |
| Miscellaneous | | | | | | | 7,504 | | | | | | | | 27,765 | | | | | | | | 50,237 | |
Total Expenses | | | | | | | 2,536,259 | | | | | | | | 7,585,971 | | | | | | | | 5,874,930 | |
| | | | | | |
| Net Investment Income | | | | | | | 6,336,947 | | | | | | | | 60,943,168 | | | | | | | | 46,067,795 | |
| | | | | | |
| Realized and Change in Unrealized Gain (Loss): | | | | | | | | | | | | | | | | | | | | | | | | |
| Net realized gain on investments | | | | | | | 1,089,016 | | | | | | | | 18,030,865 | | | | | | | | 15,554,119 | |
| Net change in unrealized appreciation/depreciation of investments | | | | | | | (1,979,708) | | | | | | | | (32,466,081) | | | | | | | | (25,318,362) | |
| Net realized and change in unrealized loss | | | | | | | (890,692) | | | | | | | | (14,435,216) | | | | | | | | (9,764,243) | |
| Net Increase in Net Assets Resulting from Investment Operations | | | | | | | 5,446,255 | | | | | | | | 46,507,952 | | | | | | | | 36,303,552 | |
| Dividends on Preferred Shares from Net Investment Income | | | | | | | – | | | | | | | | (6,007,597) | | | | | | | | (4,610,846) | |
| Net Increase in Net Assets Applicable to Common Shareholders Resulting from Investment Operations | | | | | | | $5,446,255 | | | | | | | | $40,500,355 | | | | | | | | $31,692,706 | |
(1) Commencement of operations was June 30, 2017. Information represents the period from June 30, 2017 through February 28, 2018.
| | | | | | |
| 38 | | Annual Report | | | February 28, 2018 | | | See accompanying Notes to Financial Statements |
Statements of Changes in Net Assets
AllianzGI Convertible & Income 2024 Target Term Fund
| | | | | | | | |
| | | | | | Period from
June 30, 2017**
through
February 28, 2018 | |
| Investment Operations: | | | | | | | | |
| Net investment income | | | | | | | $6,336,947 | |
| Net realized gain | | | | | | | 1,089,016 | |
| Net change in unrealized appreciation/depreciation | | | | | | | (1,979,708) | |
| Net increase in net assets resulting from investment operations | | | | | | | 5,446,255 | |
| | |
| Dividends to Common Shareholders from Net Investment Income | | | | | | | (5,878,756) | |
| | |
| Share Transactions: | | | | | | | | |
| Net proceeds from shares issued in offering | | | | | | | 179,457,239 | |
| Offering costs charged to paid-in capital in excess of par (Note 9) | | | | | | | (364,936) | |
| Reinvestment of dividends | | | | | | | 468 | |
| Net increase in net assets from share transactions | | | | | | | 179,092,771 | |
| Total increase in net assets applicable to shareholders | | | | | | | 178,660,270 | |
| | |
| Net Assets: | | | | | | | | |
| Beginning of period | | | | | | | 100,002 | |
| End of period* | | | | | | | $178,760,272 | |
| *Including undistributed net investment income of: | | | | | | | $574,250 | |
| | |
| Shares Activity: | | | | | | | | |
| Shares outstanding, beginning of period | | | | | | | 10,168 | |
| Shares issued in offering | | | | | | | 18,246,796 | |
| Shares issued in reinvestment of dividends | | | | | | | 48 | |
| Shares outstanding, end of period | | | | | | | 18,257,012 | |
** Commencement of operations.
| | | | | | | | |
| See accompanying Notes to Financial Statements | | | February 28, 2018 | | | Annual Report | | | 39 | |
Statements of Changes in Net Assets Applicable to Common Shareholders
AllianzGI Convertible & Income Fund
| | | | | | | | | | | | | | | | |
| | | | | | Year ended
February 28, 2018 | | | | | | Year ended
February 28, 2017 | |
| Investment Operations: | | | | | | | | | | | | | | | | |
| Net investment income | | | | | | | $60,943,168 | | | | | | | | $64,277,340 | |
| Net realized gain (loss) | | | | | | | 18,030,865 | | | | | | | | (49,853,202) | |
| Net change in unrealized appreciation/depreciation | | | | | | | (32,466,081) | | | | | | | | 176,239,359 | |
| Net increase in net assets resulting from investment operations | | | | | | | 46,507,952 | | | | | | | | 190,663,497 | |
| | | | |
| Dividends on Preferred Shares from Net Investment Income | | | | | | | (6,007,597) | | | | | | | | (2,357,962) | |
| Net increase in net assets applicable to common shareholders resulting from investment operations | | | | | | | 40,500,355 | | | | | | | | 188,305,535 | |
| | | | |
| Dividends and Distributions to Common Shareholders from: | | | | | | | | | | | | | | | | |
| Net investment income | | | | | | | (68,079,863) | | | | | | | | (68,722,510) | |
| Return of capital | | | | | | | (959,598) | | | | | | | | – | |
Total dividends and distributions to common shareholders | | | | | | | (69,039,461) | | | | | | | | (68,722,510) | |
| | | | |
| Common Share Transactions: | | | | | | | | | | | | | | | | |
| Reinvestment of dividends and distributions | | | | | | | 4,211,517 | | | | | | | | 1,099,679 | |
| Total increase (decrease) in net assets applicable to common shareholders | | | | | | | (24,327,589) | | | | | | | | 120,682,704 | |
| | | | |
| Net Assets Applicable to Common Shareholders: | | | | | | | | | | | | | | | | |
| Beginning of year | | | | | | | 605,194,427 | | | | | | | | 484,511,723 | |
| End of year* | | | | | | | $580,866,838 | | | | | | | | $605,194,427 | |
| *Including dividends in excess of net investment income of: | | | | | | | $(8,534,373) | | | | | | | | $(4,716,720) | |
| | | | |
| Common Shares Activity: | | | | | | | | | | | | | | | | |
| Common shares outstanding, beginning of year | | | | | | | 88,185,843 | | | | | | | | 88,018,356 | |
| Common shares issued in reinvestment of dividends and distributions | | | | | | | 622,809 | | | | | | | | 167,487 | |
| Common shares outstanding, end of year | | | | | | | 88,808,652 | | | | | | | | 88,185,843 | |
| | | | | | |
| 40 | | Annual Report | | | February 28, 2018 | | | See accompanying Notes to Financial Statements |
Statements of Changes in Net Assets Applicable to Common Shareholders
AllianzGI Convertible & Income Fund II
| | | | | | | | | | | | | | | | |
| | | | | | Year ended
February 28, 2018 | | | | | | Year ended
February 28, 2017 | |
| Investment Operations: | | | | | | | | | | | | | | | | |
| Net investment income | | | | | | | $46,067,795 | | | | | | | | $49,013,543 | |
| Net realized gain (loss) | | | | | | | 15,554,119 | | | | | | | | (37,695,132) | |
| Net change in unrealized appreciation/depreciation | | | | | | | (25,318,362) | | | | | | | | 134,580,526 | |
| Net increase in net assets resulting from investment operations | | | | | | | 36,303,552 | | | | | | | | 145,898,937 | |
| | | | |
| Dividends on Preferred Shares from Net Investment Income | | | | | | | (4,610,846) | | | | | | | | (1,809,753) | |
| Net increase in net assets applicable to common shareholders resulting from investment operations | | | | | | | 31,692,706 | | | | | | | | 144,089,184 | |
| | | | |
| Dividends and Distributions to Common Shareholders from: | | | | | | | | | | | | | | | | |
| Net investment income | | | | | | | (45,589,913) | | | | | | | | (51,344,679) | |
| Return of capital | | | | | | | (5,945,822) | | | | | | | | – | |
Total dividends and distributions to common shareholders | | | | | | | (51,535,735) | | | | | | | | (51,344,679) | |
| | | | |
| Common Share Transactions: | | | | | | | | | | | | | | | | |
| Reinvestment of dividends and distributions | | | | | | | 2,964,037 | | | | | | | | 249,618 | |
| Total increase (decrease) in net assets applicable to common shareholders | | | | | | | (16,878,992) | | | | | | | | 92,994,123 | |
| | | | |
| Net Assets Applicable to Common Shareholders: | | | | | | | | | | | | | | | | |
| Beginning of year | | | | | | | 456,984,778 | | | | | | | | 363,990,655 | |
| End of year* | | | | | | | $440,105,786 | | | | | | | | $456,984,778 | |
| *Including dividends in excess of net investment income of: | | | | | | | $(6,418,474) | | | | | | | | $(11,019,612) | |
| | | | |
| Common Shares Activity: | | | | | | | | | | | | | | | | |
| Common shares outstanding, beginning of year | | | | | | | 74,430,542 | | | | | | | | 74,387,429 | |
| Common shares issued in reinvestment of dividends and distributions | | | | | | | 491,309 | | | | | | | | 43,113 | |
| Common shares outstanding, end of year | | | | | | | 74,921,851 | | | | | | | | 74,430,542 | |
| | | | | | | | |
| See accompanying Notes to Financial Statements | | | February 28, 2018 | | | Annual Report | | | 41 | |
Statement of Cash Flows*
AllianzGI Convertible & Income 2024 Target Term Fund
Period from June 30, 2017** through February 28, 2018
| | | | | | | | |
| Decrease in Cash from: | | | | | | | | |
| | |
| Cash Flows used for Operating Activities: | | | | | | | | |
Net increase in net assets resulting from investment operations | | | | | | | $5,446,255 | |
| | |
| Adjustments to Reconcile Net Increase in Net Assets Resulting from Investment Operations to Net Cash used for Operating Activities: | | | | | | | | |
Purchases of long-term investments | | | | | | | (378,546,063) | |
Proceeds from sales of long-term investments | | | | | | | 139,569,668 | |
Purchases of short-term portfolio investments, net | | | | | | | (7,857,937) | |
Net change in unrealized appreciation/depreciation | | | | | | | 1,979,708 | |
Net amortization/accretion on investments | | | | | | | (492,197) | |
Net realized gain | | | | | | | (1,089,016) | |
Increase in payable for investments purchased | | | | | | | 2,005,608 | |
Increase in investments in Affiliated Funds – Trustees Deferred Compensation Plan | | | | | | | (2,708) | |
Increase in Trustees Compensation Plan payable | | | | | | | 2,708 | |
Increase in receivable for investments sold | | | | | | | (1,929,931) | |
Increase in interest and dividends receivable | | | | | | | (3,266,137) | |
Increase in tax reclaims receivable | | | | | | | (9,625) | |
Increase in receivable for principal paydowns | | | | | | | (19,790) | |
Increase in prepaid expenses | | | | | | | (15,972) | |
Increase in investment management fees payable | | | | | | | 142,748 | |
Increase in accrued expenses and other liabilities | | | | | | | 205,259 | |
Increase in loan interest payable | | | | | | | 11,274 | |
| Net cash used for operating activities | | | | | | | (243,866,148) | |
| | |
| Cash Flows provided by Financing Activities: | | | | | | | | |
Proceeds from common shares sold | | | | | | | 179,457,239 | |
Increase in loan payable | | | | | | | 69,700,000 | |
Increase in payable to custodian for cash overdraft | | | | | | | 12,308 | |
Offering costs paid from issuance of common shares | | | | | | | (364,936) | |
Cash dividends paid (excluding reinvestment of dividends of $468) | | | | | | | (5,038,465) | |
| Net cash provided by financing activities | | | | | | | 243,766,146 | |
| Net decrease in cash | | | | | | | (100,002) | |
| | |
| Cash: | | | | | | | | |
| Beginning of period | | | | | | | 100,002 | |
| End of period | | | | | | | $ – | |
| | |
| Supplemental Disclosure of Cash Flow Information: | | | | | | | | |
Interest expense paid on loan | | | | | | | $1,053,268 | |
* Statement of Cash Flows is not required for Convertible & Income and Convertible & Income II.
** Commencement of operations.
| | | | | | |
| 42 | | Annual Report | | | February 28, 2018 | | | See accompanying Notes to Financial Statements |
Financial Highlights
AllianzGI Convertible & Income 2024 Target Term Fund
For a common share outstanding throughout each period:
| | | | | | |
| | | | | Period from June 30, 2017*
through February 28,
2018 | |
| Net asset value, beginning of period | | | | | $9.84 | ** |
| Investment Operations: | | | | | | |
| Net investment income | | | | | 0.35 | |
| Net realized and change in unrealized loss | | | | | (0.06 | ) |
| Total from investment operations | | | | | 0.29 | |
| Dividends to Shareholders from Net Investment Income | | | | | (0.32 | ) |
| Share Transactions: | | | | | | |
| Capital charge resulting from issuance of shares and related offering costs | | | | | (0.02 | ) |
| Net asset value, end of period | | | | | $9.79 | |
| Market price, end of period | | | | | $9.22 | |
| Total Investment Return (1) | | | | | (4.59 | )% |
| RATIOS/SUPPLEMENTAL DATA: | | | | | | |
| Net assets, end of period (000s) | | | | | $178,760 | |
| Ratio of expenses to average net assets, including interest expense (2)(3)(4)(5) | | | | | 2.14 | % |
| Ratio of expenses to average net assets, excluding interest expense (2)(3)(4)(5) | | | | | 1.23 | % |
| Ratio of net investment income to average net assets (2)(4)(5) | | | | | 5.47 | % |
| Portfolio turnover rate | | | | | 66 | % |
| * | | Commencement of operations. | |
| ** | | Initial public offering price of $10.00 per share less sales load of 1.65% of the offering price. | |
| (1) | | Total investment return is calculated assuming a purchase of a common share at the market price on the first day and a sale of a common share at the market price on the last day of each period reported. Dividends and distributions, if any, are assumed, for purposes of this calculation, to be reinvested at prices obtained under the Fund’s dividend reinvestment plan. Total investment return does not reflect brokerage commissions or sales charges in connection with the purchase or sale of Fund shares. Total investment return for a period of less than one year is not annualized. | |
| (2) | | Annualized, unless otherwise noted. | |
| (3) | | Interest expense relates to participation in debt financing (See Note 7). | |
| (4) | | Certain expenses incurred by the Fund were not annualized. | |
| (5) | | Inclusive of excise tax expense of 0.02% (not annualized). | |
| | | | | | | | |
| See accompanying Notes to Financial Statements | | | February 28, 2018 | | | Annual Report | | | 43 | |
Financial Highlights
AllianzGI Convertible & Income Fund
For a common share outstanding throughout each year:
| | | | | | | | | | | | | | | | | | | | | | | | | | | | | | | | | | | | |
| | | | | Year ended | |
| | | | | February 28,
2018 | | | | | February 28,
2017 | | | | | | February 29,
2016 | | | | | | February 28,
2015 | | | | | | February 28,
2014 | |
| Net asset value, beginning of year | | | | | $6.86 | | | | | | $5.50 | | | | | | | | $8.44 | | | | | | | | $9.49 | | | | | | | | $8.78 | |
| Investment Operations: | | | | | | | | | | | | | | | | | | | | | | | | | | | | | | | | | | | | |
| Net investment income | | | | | 0.69 | | | | | | 0.73 | | | | | | | | 0.83 | | | | | | | | 0.87 | | | | | | | | 1.02 | (1) |
| Net realized and change in unrealized gain (loss) | | | | | (0.16 | ) | | | | | 1.44 | | | | | | | | (2.83 | ) | | | | | | | (0.85 | ) | | | | | | | 0.75 | |
| Total from investment operations | | | | | 0.53 | | | | | | 2.17 | | | | | | | | (2.00 | ) | | | | | | | 0.02 | | | | | | | | 1.77 | |
| Dividends on Preferred Shares from Net Investment Income (1) | | | | | (0.07 | ) | | | | | (0.03 | ) | | | | | | | (0.01 | ) | | | | | | | (0.00 | )(2) | | | | | | | (0.01 | ) |
| Net increase (decrease) in net assets applicable to common shareholders resulting from investment operations | | | | | 0.46 | | | | | | 2.14 | | | | | | | | (2.01 | ) | | | | | | | 0.02 | | | | | | | | 1.76 | |
| Dividends and Distributions to Common Shareholders from: | | | | | | | | | | | | | | | | | | | | | | | | | | | | | | | | | | | | |
| Net investment income | | | | | (0.77 | ) | | | | | (0.78 | ) | | | | | | | (0.93 | ) | | | | | | | (1.08 | ) | | | | | | | (1.08 | ) |
| Return of capital | | | | | (0.01 | ) | | | | | – | | | | | | | | – | | | | | | | | – | | | | | | | | – | |
| Total dividends and distributions to common shareholders | | | | | (0.78 | ) | | | | | (0.78 | ) | | | | | | | (0.93 | ) | | | | | | | (1.08 | ) | | | | | | | (1.08 | ) |
| Common Share Transactions: | | | | | | | | | | | | | | | | | | | | | | | | | | | | | | | | | | | | |
| Accretion to net asset value, resulting from offerings | | | | | – | | | | | | – | | | | | | | | – | | | | | | | | 0.01 | | | | | | | | 0.03 | |
| Capital charge resulting from issuance of common shares and related offering costs | | | | | – | | | | | | – | | | | | | | | – | | | | | | | | (0.00 | )(2) | | | | | | | (0.00 | )(2) |
| Total common share transactions | | | | | – | | | | | | – | | | | | | | | – | | | | | | | | 0.01 | | | | | | | | 0.03 | |
| Net asset value, end of year | | | | | $6.54 | | | | | | $6.86 | | | | | | | | $5.50 | | | | | | | | $8.44 | (3) | | | | | | | $9.49 | |
| Market price, end of year | | | | | $6.93 | | | | | | $6.93 | | | | | | | | $4.92 | | | | | | | | $9.12 | | | | | | | | $10.20 | |
| Total Investment Return (4) | | | | | 12.22 | % | | | | | 59.15 | % | | | | | | | (38.23 | )% | | | | | | | 0.37 | % | | | | | | | 24.87 | % |
| RATIOS/SUPPLEMENTAL DATA: | | | | | | | | | | | | | | | | | | | | | | | | | | | | | | | | | | | | |
| Net assets, applicable to common shareholders, end of year (000s) | | | | | $580,867 | | | | | | $605,194 | | | | | | | | $484,512 | | | | | | | | $739,983 | | | | | | | | $811,397 | |
| Ratio of expenses to average net assets (5) | | | | | 1.28 | % | | | | | 1.36 | %(7) | | | | | | | 1.26 | %(7) | | | | | | | 1.23 | %(7) | | | | | | | 1.21 | %(6)(7) |
| Ratio of net investment income to average net assets (5) | | | | | 10.32 | % | | | | | 11.33 | %(7) | | | | | | | 11.51 | %(7) | | | | | | | 9.73 | %(7) | | | | | | | 11.13 | %(6)(7) |
| Preferred shares asset coverage per share | | | | | $65,668 | | | | | | $67,376 | | | | | | | | $58,927 | | | | | | | | $76,819 | | | | | | | | $81,820 | |
| Portfolio turnover rate | | | | | 34 | % | | | | | 28 | % | | | | | | | 51 | % | | | | | | | 56 | % | | | | | | | 79 | % |
| (1) | | Calculated on average common shares outstanding. | |
| (2) | | Less than $(0.005) per common share. | |
| (3) | | Payment from affiliate increased the net asset value by less than $0.01. | |
| (4) | | Total investment return is calculated assuming a purchase of a common share at the market price on the first day and a sale of a common share at the market price on the last day of each year reported. Dividends and distributions, if any, are assumed, for purposes of this calculation, to be reinvested at prices obtained under the Fund’s dividend reinvestment plan. Total investment return does not reflect brokerage commissions or sales charges in connection with the purchase or sale of Fund shares. | |
| (5) | | Calculated on the basis of income and expenses applicable to both common and preferred shares relative to average net assets of common shareholders. | |
| (6) | | Inclusive of expense reimbursement from Investment Manager of 0.01%. | |
| (7) | | Inclusive of excise tax expense of 0.03%, less than 0.005%, 0.05% and 0.04% for the years ended February 28, 2017, February 29, 2016, February 28, 2015 and February 28, 2014, respectively. | |
| | | | | | |
| 44 | | Annual Report | | | February 28, 2018 | | | See accompanying Notes to Financial Statements |
Financial Highlights
AllianzGI Convertible & Income Fund II
For a common share outstanding throughout each year:
| | | | | | | | | | | | | | | | | | | | | | | | | | | | | | | | | | | | |
| | | | | Year ended | |
| | | | | February 28,
2018 | | | | | February 28,
2017 | | | | | | February 29,
2016 | | | | | | February 28,
2015 | | | | | | February 28,
2014 | |
| Net asset value, beginning of year | | | | | $6.14 | | | | | | $4.89 | | | | | | | | $7.56 | | | | | | | | $8.53 | | | | | | | | $7.97 | |
| Investment Operations: | | | | | | | | | | | | | | | | | | | | | | | | | | | | | | | | | | | | |
| Net investment income | | | | | 0.62 | | | | | | 0.66 | | | | | | | | 0.75 | | | | | | | | 0.80 | | | | | | | | 0.95 | (1) |
| Net realized and change in unrealized gain (loss) | | | | | (0.14 | ) | | | | | 1.30 | | | | | | | | (2.55 | ) | | | | | | | (0.75 | ) | | | | | | | 0.62 | |
| Total from investment operations | | | | | 0.48 | | | | | | 1.96 | | | | | | | | (1.80 | ) | | | | | | | 0.05 | | | | | | | | 1.57 | |
| Dividends on Preferred Shares from Net Investment Income (1) | | | | | (0.06 | ) | | | | | (0.02 | ) | | | | | | | (0.01 | ) | | | | | | | (0.00 | )(2) | | | | | | | (0.01 | ) |
| Net increase (decrease) in net assets applicable to common shareholders resulting from investment operations | | | | | 0.42 | | | | | | 1.94 | | | | | | | | (1.81 | ) | | | | | | | 0.05 | | | | | | | | 1.56 | |
| Dividends and Distributions to Common Shareholders from: | | | | | | | | | | | | | | | | | | | | | | | | | | | | | | | | | | | | |
| Net investment income | | | | | (0.61 | ) | | | | | (0.69 | ) | | | | | | | (0.86 | ) | | | | | | | (1.02 | ) | | | | | | | (1.02 | ) |
| Return of capital | | | | | (0.08 | ) | | | | | – | | | | | | | | – | | | | | | | | – | | | | | | | | – | |
| Total dividends and distributions to common shareholders | | | | | (0.69 | ) | | | | | (0.69 | ) | | | | | | | (0.86 | ) | | | | | | | (1.02 | ) | | | | | | | (1.02 | ) |
| Common Share Transactions: | | | | | | | | | | | | | | | | | | | | | | | | | | | | | | | | | | | | |
| Accretion to net asset value, resulting from offerings | | | | | – | | | | | | – | | | | | | | | – | | | | | | | | – | | | | | | | | 0.02 | |
| Capital charge resulting from issuance of common shares and related offering costs | | | | | – | | | | | | – | | | | | | | | – | | | | | | | | – | | | | | | | | (0.00 | )(2) |
| Total common share transactions | | | | | – | | | | | | – | | | | | | | | – | | | | | | | | – | | | | | | | | 0.02 | |
| Net asset value, end of year | | | | | $5.87 | | | | | | $6.14 | | | | | | | | $4.89 | | | | | | | | $7.56 | (3) | | | | | | | $8.53 | |
| Market price, end of year | | | | | $6.10 | | | | | | $6.17 | | | | | | | | $4.46 | | | | | | | | $8.58 | | | | | | | | $9.71 | |
| Total Investment Return (4) | | | | | 10.84 | % | | | | | 56.31 | % | | | | | | | (40.34 | )% | | | | | | | (0.81 | )% | | | | | | | 28.50 | % |
| RATIOS/SUPPLEMENTAL DATA: | | | | | | | | | | | | | | | | | | | | | | | | | | | | | | | | | | | | |
| Net assets, applicable to common shareholders, end of year (000s) | | | | | $440,106 | | | | | | $456,985 | | | | | | | | $363,991 | | | | | | | | $559,342 | | | | | | | | $627,112 | |
| Ratio of expenses to average net assets (5) | | | | | 1.32 | % | | | | | 1.37 | % | | | | | | | 1.28 | % | | | | | | | 1.19 | % | | | | | | | 1.18 | %(6) |
| Ratio of net investment income to average net assets (5) | | | | | 10.31 | % | | | | | 11.46 | % | | | | | | | 11.58 | % | | | | | | | 9.87 | % | | | | | | | 11.50 | %(6) |
| Preferred shares asset coverage per share | | | | | $65,147 | | | | | | $66,691 | | | | | | | | $58,208 | | | | | | | | $76,034 | | | | | | | | $82,218 | |
| Portfolio turnover rate | | | | | 33 | % | | | | | 28 | % | | | | | | | 51 | % | | | | | | | 57 | % | | | | | | | 93 | % |
| (1) | | Calculated on average common shares outstanding. | |
| (2) | | Less than $(0.005) per common share. | |
| (3) | | Payment from affiliate increased the net asset value by less than $0.01. | |
| (4) | | Total investment return is calculated assuming a purchase of a common share at the market price on the first day and a sale of a common share at the market price on the last day of each year reported. Dividends and distributions, if any, are assumed, for purposes of this calculation, to be reinvested at prices obtained under the Fund’s dividend reinvestment plan. Total investment return does not reflect brokerage commissions or sales charges in connection with the purchase or sale of Fund shares. | |
| (5) | | Calculated on the basis of income and expenses applicable to both common and preferred shares relative to average net assets of common shareholders. | |
| (6) | | Inclusive of expense reimbursement from Investment Manager of 0.02%. | |
| | | | | | | | |
| See accompanying Notes to Financial Statements | | | February 28, 2018 | | | Annual Report | | | 45 | |
Notes to Financial Statements
AllianzGI Convertible & Income 2024 Target Term Fund/AllianzGI Convertible & Income Fund/AllianzGI Convertible & Income Fund II
February 28, 2018
1. Organization and Significant Accounting Policies
AllianzGI Convertible & Income 2024 Target Term Fund (“Convertible & Income 2024 Target Term”), AllianzGI Convertible & Income Fund (“Convertible & Income”) and AllianzGI Convertible & Income Fund II (“Convertible & Income II”) (each, a “Fund” and, collectively, the “Funds”), were organized as Massachusetts business trusts on March 21, 2017, January 17, 2003 and April 22, 2003, respectively and accordingly follow the investment company accounting and reporting guidance of the Financial Accounting Standards Board (“FASB”) Accounting Standards Codification (“ASC”) Topic 946 Financial Services — Investment Companies. Prior to commencing operations on June 30, 2017, Convertible & Income 2024 Target Term had no operations other than matters relating to its organization and registration as a diversified, closed-end management investment company registered under the Investment Company Act of 1940, as amended (the “1940 Act”), and the rules and regulations thereunder and the sale and issuance of 10,168 shares at an aggregate price of $100,002 (net of sales load) to Allianz Asset Management of America L.P. (“AAM”). Convertible & Income and Convertible & Income II are organized and registered as diversified, closed-end management investment companies registered under the 1940 Act, and the rules and regulations thereunder. Allianz Global Investors U.S. LLC (“AllianzGI U.S.” or the “Investment Manager”), serves as the Funds’ investment manager. AllianzGI U.S. is an indirect, wholly-owned subsidiary of AAM. AAM is an indirect, wholly-owned subsidiary of Allianz SE, a publicly-traded European insurance and financial services company. Each Fund has authorized an unlimited amount of common shares with $0.00001 par value.
Convertible & Income 2024 Target Term’s investment objectives are to provide a high level of income and to return at least $9.835 per common share (the original net asset value per common share of beneficial interest before deducting offering costs of $0.02 per share) (the “Original NAV”) to holders of common shares on or about September 1, 2024 (the “Termination Date”). The objective to return Convertible & Income 2024 Target Term’s Original NAV is not an express or implied guarantee obligation of Convertible & Income 2024 Target Term, the Investment Manager or any other entity, and an investor may receive less than the Original NAV upon termination of Convertible & Income 2024 Target Term. Convertible & Income 2024 Target Term attempts to achieve its investment objectives by investing in a diversified portfolio of high yield securities, convertible securities and other income-producing debt instruments, including senior secured loans, primarily of U.S. issuers. The Fund intends, on or about the Termination Date, to cease its investment operations, liquidate its portfolio (to the extent possible), retire or redeem any outstanding leverage facilities and distribute all its liquidated assets to the then-record holders of common shares, unless such term is extended by the Trustees and absent Trustee and shareholder approval to amend the limited term.
Convertible & Income and Convertible & Income II each have an investment objective to provide total return through a combination of capital appreciation and high current income. Convertible & Income and Convertible & Income II attempt to achieve this objective by investing in a portfolio of domestic convertible securities and non-convertible income-producing securities.
There can be no assurance that the Funds will meet their stated objectives.
| | | | |
| 46 | | Annual Report | | | February 28, 2018 |
Notes to Financial Statements
AllianzGI Convertible & Income 2024 Target Term Fund/AllianzGI Convertible & Income Fund/AllianzGI Convertible & Income Fund II
February 28, 2018
1. Organization and Significant Accounting Policies (continued)
The preparation of the Funds’ financial statements in accordance with accounting principles generally accepted in the United States of America (“U.S. GAAP”) requires the Funds’ management to make estimates and assumptions that affect the reported amounts and disclosures in each Fund’s financial statements. Actual results could differ from those estimates.
In the normal course of business, the Funds enter into contracts that contain a variety of representations that provide general indemnifications. The Funds’ maximum exposures under these arrangements are unknown as this would involve future claims that may be made against the Funds that have not yet occurred.
In August 2016, the FASB issued Accounting Standards Update (“ASU”) 2016-15 which amends ASC 230 to clarify guidance on the classification of certain cash receipts and cash payments in the statement of cash flows. The ASU 2016-15 is effective for annual periods beginning after December 15, 2017, and interim periods within those annual periods. At this time, management is evaluating the implications of these changes on the financial statements.
In October 2016, the U.S. Securities and Exchange Commission (“SEC”) adopted new rules and forms, and amendments to certain current rules and forms, to modernize reporting and disclosure of information by registered investment companies. The amendments to Regulation S-X require standardized, enhanced disclosure about derivatives in investment company financial statements, and also change the rules governing the form and content of such
financial statements. The amendments to Regulation S-X took effect on August 1, 2017 and the financial statements have been modified accordingly, as applicable.
In November 2016, the FASB issued ASU 2016-18 which amends ASC 230 to provide guidance on the classification and presentation of changes in restricted cash and restricted cash equivalents on the statement of cash flows. The ASU 2016-18 is effective for annual periods beginning after December 15, 2017, and interim periods within those annual periods. At this time, management is evaluating the implications of these changes on the financial statements.
In March 2017, the FASB issued ASU No. 2017-08, Receivables — Nonrefundable Fees and Other Costs (Subtopic 310-20): Premium Amortization on Purchased Callable Debt Securities. The amendments in the ASU shorten the amortization period for certain callable debt securities, held at a premium, to be amortized to the earliest call date. The ASU is effective for fiscal years and interim periods within those fiscal years beginning after December 15, 2018. At this time, management is evaluating the implications of these changes on the financial statements.
The following is a summary of significant accounting policies consistently followed by the Funds:
(a) Valuation of Investments
Portfolio securities and other financial instruments for which market quotations are readily available are stated at market value. Market value is generally determined on the basis of official closing prices, last reported sales prices, or if no sales or closing prices are reported, on the basis of quotes obtained from a quotation reporting system, established market makers, or independent pricing services. The
| | | | | | |
| February 28, 2018 | | | Annual Report | | | 47 | |
Notes to Financial Statements
AllianzGI Convertible & Income 2024 Target Term Fund/AllianzGI Convertible & Income Fund/AllianzGI Convertible & Income Fund II
February 28, 2018
1. Organization and Significant Accounting Policies (continued)
Funds’ investments are valued daily using prices supplied by an independent pricing service or broker/dealer quotations, or by using the last sale or settlement price on the exchange that is the primary market for such securities, or the mean between the last bid and ask quotations. Independent pricing services use information provided by market makers or estimates of market values obtained from yield data relating to investments or securities with similar characteristics.
The Board of Trustees of each Fund (together, the “Board”) has adopted procedures for valuing portfolio securities and other financial instruments in circumstances where market quotations are not readily available (including in cases where available market quotations are deemed to be unreliable), and has delegated primary responsibility for applying the valuation methods to the Investment Manager. The Funds’ Valuation Committee was established by the Board to oversee the implementation of the Funds’ valuation methods and to make fair value determinations on behalf of the Board, as necessary. The Investment Manager monitors the continued appropriateness of methods applied and identifies circumstances and events that may require fair valuation. The Investment Manager determines if adjustments should be made in light of market changes, events affecting the issuer, or other factors. If the Investment Manager determines that a valuation method may no longer be appropriate, another valuation method previously approved by the Funds’ Valuation Committee may be selected or the Funds’ Valuation Committee will be convened to consider the matter and take any appropriate action in accordance with procedures adopted by the Board. The Board shall review and ratify the appropriateness of the valuation methods and these methods may be amended or supplemented from time to time by the Funds’ Valuation Committee.
Short-term debt instruments maturing in 60 days or less are valued at amortized cost, if their original term to maturity was 60 days or less, or by amortizing premiums or discounts based on their value on the 61st day prior to maturity, if the original term to maturity exceeded 60 days.
The prices used by the Funds to value investments may differ from the value that would be realized if the investments were sold, and these differences could be material to the Funds’ financial statements. Each Fund’s net asset value (“NAV”) is normally determined as of the close of regular trading (normally, 4:00 p.m. Eastern Time) on the New York Stock Exchange (“NYSE”) on each day the NYSE is open for business. In unusual circumstances, the Board or the Valuation Committee may in good faith determine the NAV as of 4:00 p.m., Eastern Time, notwithstanding an earlier, unscheduled close or halt of trading on the NYSE.
(b) Fair Value Measurements
Fair value is defined as the price that would be received to sell an asset or paid to transfer a liability (i.e., the “exit price”) in an orderly transaction between market participants. The three levels of the fair value hierarchy are described below:
| ∎ | | Level 1 – quoted prices in active markets for identical investments that the Funds have the ability to access |
| ∎ | | Level 2 – valuations based on other significant observable inputs, which may include, but are not limited to, quoted prices for similar assets or liabilities, interest rates, yield curves, volatilities, prepayment speeds, loss severities, credit risks and default rates or other market corroborated inputs |
| ∎ | | Level 3 – valuations based on significant unobservable inputs (including the Investment Manager’s or Valuation Committee’s own assumptions and securities whose price was determined by using a single broker’s quote) |
| | | | |
| 48 | | Annual Report | | | February 28, 2018 |
Notes to Financial Statements
AllianzGI Convertible & Income 2024 Target Term Fund/AllianzGI Convertible & Income Fund/AllianzGI Convertible & Income Fund II
February 28, 2018
1. Organization and Significant Accounting Policies (continued)
The valuation techniques used by the Funds to measure fair value during the period ended February 28, 2018 were intended to maximize the use of observable inputs and to minimize the use of unobservable inputs.
The Funds’ policy is to recognize transfers between levels at the end of the reporting period. An investment asset’s or liability’s level within the fair value hierarchy is based on the lowest level input, individually or in aggregate, that is significant to the fair value measurement. The objective of fair value measurement remains the same even when there is a significant decrease in the volume and level of activity for an asset or liability and regardless of the valuation techniques used. Investments categorized as Level 1 or 2 as of period end may have been transferred between Levels 1 and 2 since the prior period due to changes in the valuation method utilized in valuing the investments.
The inputs or methodology used for valuing securities are not necessarily an indication of the risk associated with investing in those securities. The following are certain inputs and techniques that the Funds generally use to evaluate how to classify each major category of assets and liabilities within Level 2 and Level 3, in accordance with U.S. GAAP.
Equity Securities (Common and Preferred Stock and Warrants) – Equity securities traded in inactive markets are valued using inputs which include broker-dealer quotes, recently executed transactions adjusted for changes in the benchmark index, or evaluated price quotes received from independent pricing services that take into account the integrity of the market sector and issuer, the individual characteristics of the security, and information received from
broker-dealers and other market sources pertaining to the issuer or security. To the extent that these inputs are observable, the values of equity securities are categorized as Level 2. To the extent that these inputs are unobservable, the values are categorized as Level 3.
Convertible Bonds & Notes – Convertible bonds & notes are valued by independent pricing services based on various inputs and techniques, which include broker-dealer quotations from relevant market makers and recently executed transactions in securities of the issuer or comparable issuers. The broker-dealer quotations received are supported by credit analysis of the issuer that takes into consideration credit quality assessments, daily trading activity, and the activity of the underlying equities, listed bonds and sector-specific trends. To the extent that these inputs are observable, the values of convertible bonds & notes are categorized as Level 2. To the extent that these inputs are unobservable, the values are categorized as Level 3.
Corporate Bonds & Notes – Corporate bonds & notes are generally comprised of two main categories: investment grade bonds and high yield bonds. Investment grade bonds are valued by independent pricing services using various inputs and techniques, which include broker-dealer quotations, live trading levels, recently executed transactions in securities of the issuer or comparable issuers, and option adjusted spread models that include base curve and spread curve inputs. Adjustments to individual bonds can be applied to recognize trading differences compared to other bonds issued by the same issuer. High yield bonds are valued by independent pricing services based primarily on broker-dealer quotations from relevant market makers and recently executed transactions in securities of the issuer or comparable issuers. The broker-dealer quotations received are
| | | | | | |
| February 28, 2018 | | | Annual Report | | | 49 | |
Notes to Financial Statements
AllianzGI Convertible & Income 2024 Target Term Fund/AllianzGI Convertible & Income Fund/AllianzGI Convertible & Income Fund II
February 28, 2018
1. Organization and Significant Accounting Policies (continued)
supported by credit analysis of the issuer that takes into consideration credit quality assessments, daily trading activity, and the activity of the underlying equities, listed bonds and sector-specific trends. To the extent that these inputs are observable, the values of corporate bonds & notes are categorized as Level 2. To the extent that these inputs are unobservable, the values are categorized as Level 3.
Senior Loans – Senior Loans generally are valued by independent pricing services based on the average of quoted prices received from multiple dealers or valued relative to other benchmark securities when broker-dealer quotes are unavailable. These quoted prices are based on interest rates, yield curves, option adjusted spreads, credit spreads and/or other criteria. To the extent that these inputs are observable, the values of Senior Loans are categorized as Level 2. To the extent that these inputs are unobservable, the values are categorized as Level 3.
(c) Investment Transactions and Investment Income
Investment transactions are accounted for on the trade date. Realized gains and losses on investments are determined on an identified cost basis. Interest income adjusted for the accretion of discounts and amortization of premiums is recorded on an accrual basis. Discounts or premiums on debt securities purchased are accreted or amortized, respectively, to interest income. Conversion premium is not amortized. Dividend income is recorded on the ex-dividend date, except for certain dividends from foreign securities where the ex-dividend date may have passed, and then are recorded as soon after the ex-dividend date as the Funds, using reasonable diligence,
become aware of such dividends. Facility fees and other fees (such as origination fees) received on settlement date are amortized as income over the expected term of the senior loan. Consent fees relating to corporate actions and facility fees and other fees received after settlement date relating to senior loans and commitment fees received relating to unfunded purchase commitments are recorded as miscellaneous income upon receipt. Payments received from certain investments may be comprised of dividends, realized gains and return of capital. These payments may initially be recorded as dividend income and may subsequently be reclassified as realized gains and/or return of capital upon receipt of information from the issuer. Payments considered return of capital reduce the cost basis of the respective security. Distributions, if any, in excess of the cost basis of a security are recognized as capital gains. Expenses are recorded on an accrual basis.
(d) Federal Income Taxes
The Funds intend to distribute all of their taxable income and to comply with the other requirements of Subchapter M of the U.S. Internal Revenue Code of 1986, as amended, applicable to regulated investment companies. Accordingly, no provision for U.S. federal income taxes is required. The Funds may be subject to excise tax based on distributions to shareholders.
Accounting for uncertainty in income taxes establishes for all entities, including pass-through entities such as the Funds, a minimum threshold for financial statement recognition of the benefit of positions taken in filing tax returns (including whether an entity is taxable in a particular jurisdiction), and requires certain expanded tax disclosures. In accordance with provisions set forth under U.S. GAAP, the Investment Manager has reviewed the Funds’ tax positions for all open tax years. As of
| | | | |
| 50 | | Annual Report | | | February 28, 2018 |
Notes to Financial Statements
AllianzGI Convertible & Income 2024 Target Term Fund/AllianzGI Convertible & Income Fund/AllianzGI Convertible & Income Fund II
February 28, 2018
1. Organization and Significant Accounting Policies (continued)
February 28, 2018, the Funds have recorded no liability for net unrecognized tax benefits relating to uncertain income tax positions they have taken. The Investment Manager does not believe that its conclusion will change materially in the next twelve months. The Funds’ federal income tax returns for the prior three years, as applicable, remain subject to examination by the Internal Revenue Service.
(e) Dividends and Distributions to Shareholders – Common Shares
The Funds declare dividends from net investment income to common shareholders monthly. These dividends may be comprised in varying proportions of net investment income and return of capital. Distributions of net realized capital gains, if any, are paid at least annually. The Funds record dividends and distributions on the ex-dividend date. The amount of dividends from net investment income and distributions from net realized capital gains or return of capital is determined in accordance with federal income tax regulations, which may differ from U.S. GAAP. These “book-tax” differences are considered either temporary or permanent in nature. To the extent these differences are permanent in nature, such amounts are reclassified within the capital accounts based on their federal income tax treatment. Temporary differences do not require reclassification. To the extent dividends and/or distributions exceed current and accumulated earnings and profits for federal income tax purposes, they are reported as dividends and/or distributions to shareholders from return of capital.
(f) Convertible Securities
Each of the Funds invests a portion of its assets in convertible securities. Although convertible securities derive part of their value from that of
the securities into which they are convertible, they are not considered derivative financial instruments. However, certain of the Funds’ investments in convertible securities include features which render them sensitive to price changes in their underlying securities. The value of structured/synthetic convertible securities can be affected by interest rate changes and credit risks of the issuer. Such securities may be structured in ways that limit their potential for capital appreciation and the entire value of the security may be at risk of loss depending on the performance of the underlying equity security. Consequently, the Funds are exposed to greater downside risk than traditional convertible securities, but typically still less than that of the underlying stock.
(g) Senior Loans
The Funds may purchase assignments of, and participations in, Senior Loans originated, negotiated and structured by a U.S. or foreign commercial bank, insurance company, finance company or other financial institution for a lending syndicate of financial institutions (the “Lender”). When purchasing an assignment, the Funds succeed to all the rights and obligations under the loan agreement with the same rights and obligations as the assigning Lender. Assignments may, however, be arranged through private negotiations between potential assignees and potential assignors, and the rights and obligations acquired by the purchaser of an assignment may differ from, and be more limited than, those held by the assigning Lender. The Funds may also enter into lending arrangements involving unfunded loan commitments, which are contractual obligations for future funding. Unfunded loan commitments may include revolving credit facilities, which may obligate the Funds to supply additional cash to the borrower on demand. Unfunded loan commitments
| | | | | | |
| February 28, 2018 | | | Annual Report | | | 51 | |
Notes to Financial Statements
AllianzGI Convertible & Income 2024 Target Term Fund/AllianzGI Convertible & Income Fund/AllianzGI Convertible & Income Fund II
February 28, 2018
1. Organization and Significant Accounting Policies (continued)
represent a future obligation in full, even though a percentage of the principal amounts may never be utilized by the borrower.
The Funds may purchase the securities of distressed companies (including assignments or direct investments), including companies engaged in restructurings or bankruptcy proceedings. Investments in distressed companies may include senior obligations of an issuer issued in connection with a restructuring under Chapter 11 of the U.S. Bankruptcy Code (commonly known as “debtor-in-possession” or “DIP” financings). Debtor-in-possession financings generally allow the issuer to continue its operations while reorganizing. Such financings constitute senior liens on unencumbered collateral (i.e., collateral not subject to other creditors’ claims). There is risk that the issuer under a debtor-in-possession financing will not emerge from Chapter 11 and be forced to liquidate its assets under Chapter 7 of the U.S. Bankruptcy Code. In the event of liquidation, the Funds’ only recourse would be against the collateral securing the debtor-in-possession financing.
(h) Payment In-Kind Securities
The Funds may invest in payment in-kind securities, which are debt or preferred stock securities that require or permit payment of interest in the form of additional securities. Payment in-kind securities allow the issuer to avoid or delay the need to generate cash to meet current interest payments and, as a result, may involve greater risk than securities that pay interest currently or in cash.
(i) Warrants
The Funds may receive warrants. Warrants are securities that are usually issued together with a debt security or preferred stock and that give the holder the right to buy a proportionate
amount of common stock at a specified price. Warrants may be freely transferable and are often traded on major exchanges. Warrants normally have a life that is measured in years and entitle the holder to buy common stock of a company at a price that is usually higher than the market price at the time the warrant is issued. Warrants may entail greater risks than certain other types of investments. Generally, warrants do not carry the right to receive dividends or exercise voting rights with respect to the underlying securities, and they do not represent any rights in the assets of the issuer. In addition, their value does not necessarily change with the value of the underlying securities, and they cease to have value if they are not exercised on or before their expiration date. If the market price of the underlying stock does not exceed the exercise price during the life of the warrant, the warrant will expire worthless. Warrants may increase the potential profit or loss to be realized from the investment as compared with investing the same amount in the underlying securities. Similarly, the percentage increase or decrease in the value of an equity security warrant may be greater than the percentage increase or decrease in the value of the underlying common stock. Warrants may relate to the purchase of equity or debt securities. Debt obligations with warrants attached to purchase equity securities have many characteristics of convertible securities and their prices may, to some degree, reflect the performance of the underlying stock. Debt obligations also may be issued with warrants attached to purchase additional debt securities at the same coupon rate. A decline in interest rates would permit a Fund to sell such warrants at a profit. If interest rates rise, these warrants would generally expire with no value.
(j) Statement of Cash Flows
U.S. GAAP requires entities providing financial statements that report both financial position
| | | | |
| 52 | | Annual Report | | | February 28, 2018 |
Notes to Financial Statements
AllianzGI Convertible & Income 2024 Target Term Fund/AllianzGI Convertible & Income Fund/AllianzGI Convertible & Income Fund II
February 28, 2018
1. Organization and Significant Accounting Policies (continued)
and results of operations to also provide a statement of cash flows for each period for which results of operations are provided, but exempts investment companies meeting certain conditions. One of the conditions is that the fund had little or no debt, based on the average debt outstanding during the period, in relation to average total assets. Convertible & Income 2024 Target Term indebtedness has been determined to be at a level requiring a statement of cash flows. The Statement of Cash Flows has been prepared using the indirect method which required net change in net assets resulting from operations to be adjusted to reconcile to net cash flows from operating activities. Convertible & Income and Convertible & Income II do not require a Statement of Cash Flows.
(k) Loan Interest Expense
Loan interest expense relates to the Convertible & Income 2024 Target Term’s participation in debt financing transactions (See Note 7). Interest expense is recorded as it is incurred.
(l) Repurchase Agreements
The Funds are parties to Master Repurchase Agreements (“Master Repo Agreements”) with select counterparties. The Master Repo Agreements include provisions for initiation of repurchase transactions, income payments, events of default, and maintenance of collateral.
The Funds enter into transactions, under the Master Repo Agreements, with their custodian bank or securities brokerage firms whereby they purchase securities under agreements (i.e., repurchase agreements) to resell such securities at an agreed upon price and date. The Funds, through their custodian, take possession of securities collateralizing the repurchase agreement. Such agreements are carried at the
contract amount in the financial statements, which is considered to represent fair value. The collateral that is pledged (i.e. the securities received by the Funds), which consists primarily of U.S. government obligations and asset-backed securities, is held by the custodian bank for the benefit of the Funds until maturity of the repurchase agreement. Provisions of the repurchase agreements and the procedures adopted by the Funds require that the market value of the collateral, including accrued interest thereon, be sufficient in the event of default by the counterparty. If the counterparty defaults under the Master Repo Agreements and the value of the collateral declines or if the counterparty enters an insolvency proceeding, realization of the collateral by the Funds may be delayed or limited. The gross values are included in the Funds’ Schedules of Investments. As of February 28, 2018, the value of the related collateral exceeded the value of the repurchase agreements for each Fund.
(m) Restricted Securities
The Funds are permitted to invest in securities that are subject to legal or contractual restrictions on resale. These securities generally may be resold in transactions exempt from registration or to the public if the securities are registered. Disposal of these securities may involve time-consuming negotiations and expenses, and prompt sale at an acceptable price may be difficult.
2. Principal Risks
In the normal course of business, the Funds trade financial instruments and enter into financial transactions where risk of potential loss exists due to, among other things, changes in the market (market risk) or failure of the other party to a transaction to perform (counterparty risk). The Funds are also exposed to other risks such as, but not limited to, interest rate, credit and leverage risks. Additionally,
| | | | | | |
| February 28, 2018 | | | Annual Report | | | 53 | |
Notes to Financial Statements
AllianzGI Convertible & Income 2024 Target Term Fund/AllianzGI Convertible & Income Fund/AllianzGI Convertible & Income Fund II
February 28, 2018
2. Principal Risks (continued)
Convertible & Income 2024 Target Term is exposed to limited term risk.
Interest rate risk is the risk that fixed income securities’ valuations will change because of changes in interest rates. During periods of rising nominal interest rates, the values of fixed income instruments are generally expected to decline. Conversely, during periods of declining nominal interest rates, the values of fixed income instruments are generally expected to rise. To the extent that a Fund effectively has short positions with respect to fixed income instruments, the values of such short positions would generally be expected to rise when nominal interest rates rise and to decline when nominal interest rates decline. A nominal interest rate can be described as the sum of a real interest rate and an expected inflation rate. Fixed income securities with longer durations tend to be more sensitive to changes in interest rates, usually making them more volatile than securities with shorter durations. Duration is used primarily as a measure of the sensitivity of a fixed income security’s market price to interest rate (i.e., yield) movements. Interest rate changes can be sudden and unpredictable, and the Funds may lose money as a result of movements in interest rates. The Funds may not be able to hedge against changes in interest rates or may choose not to do so for cost or other reasons. In addition, any hedges may not work as intended. The values of equity and other non-fixed income securities may also decline due to fluctuations in interest rates.
The Funds are exposed to credit risk, which is the risk of losing money if the issuer or guarantor of a fixed income security is unable or unwilling, or is perceived (whether by market participants, rating agencies, pricing services or otherwise) as unable or unwilling, to make timely principal and/or interest payments, or to otherwise honor its obligations. Securities are
subject to varying degrees of credit risk, which are often reflected in credit ratings.
The market values of securities may decline due to general market conditions (market risk) which are not specifically related to a particular company, such as real or perceived adverse economic conditions, changes in the general outlook for corporate earnings, changes in interest or currency rates, adverse changes to credit markets or adverse investor sentiment. They may also decline due to factors that affect a particular industry or industries, such as labor shortages or increased production costs and competitive conditions within an industry. Equity securities and equity-related investments generally have greater market price volatility than fixed income securities, although under certain market conditions fixed income securities may have comparable or greater price volatility. Credit ratings downgrades may also negatively affect securities held by the Funds. Even when markets perform well, there is no assurance that the investments held by the Funds will increase in value along with the broader market. In addition, market risk includes the risk that geopolitical events will disrupt the economy on a national or global level.
The Funds are exposed to counterparty risk, or the risk that an institution or other entity with which the Funds have unsettled or open transactions will default. The potential loss to the Funds could exceed the value of the financial assets recorded in the Funds’ financial statements. Financial assets, which potentially expose the Funds to counterparty risk, consist principally of cash due from counterparties and investments. The Investment Manager seeks to minimize the Funds’ counterparty risk by performing reviews of each counterparty and by minimizing concentration of counterparty risk by undertaking transactions with multiple customers and counterparties on recognized and reputable exchanges. Delivery of securities
| | | | |
| 54 | | Annual Report | | | February 28, 2018 |
Notes to Financial Statements
AllianzGI Convertible & Income 2024 Target Term Fund/AllianzGI Convertible & Income Fund/AllianzGI Convertible & Income Fund II
February 28, 2018
2. Principal Risks (continued)
sold is only made once the Funds have received payment. Payment is made on a purchase once the securities have been delivered by the counterparty. The trade will fail if either party fails to meet its obligation.
The Funds are exposed to risks associated with leverage. Leverage may cause the value of the Funds’ shares to be more volatile than if the Funds did not use leverage. This is because leverage tends to exaggerate the effect of any increase or decrease in the value of the Funds’ portfolio securities. The Funds may engage in transactions or purchase instruments that give rise to forms of leverage. In addition, to the extent the Funds employ leverage, dividend and interest costs on such leverage may not be recovered by any appreciation of the securities purchased with the leverage proceeds and could exceed the Funds’ investment returns, resulting in greater losses. As discussed further in Note 6, Convertible & Income and Convertible & Income II have auction-rate preferred shares outstanding. As discussed further in Note 7, Convertible & Income 2024 Target Term has entered into margin loan financing.
Convertible & Income 2024 Target Term is exposed to limited term risk. The Fund has a limited term feature, pursuant to which it intends, on or about September 1, 2024, to cease its investment operations, liquidate its portfolio (to the extent possible), retire or redeem any outstanding leverage facilities and distribute all its liquidated assets to its then record shareholders, unless the term is extended by the Fund’s Board of Trustees (for up to six months) and absent Trustee and shareholder approval to amend the limited term. Because the assets of the Fund will be liquidated in connection with its termination, the Fund may be required to sell portfolio securities when it otherwise would not, including at times when market conditions are not favorable, or at a time when a particular
security has entered into default or bankruptcy, or otherwise is in severe distress, which may cause the Fund to lose money. Although the Fund has an investment objective of returning the Original NAV to Common Shareholders on or about the Termination Date, this is not a guarantee and the Fund may not be successful in achieving this objective. There can be no assurance that the Fund will be able to return the Original NAV to Common Shareholders, and such return is not backed or otherwise guaranteed by the Fund, the Investment Manager or any other entity.
The Funds may hold defaulted securities that may involve special considerations including bankruptcy proceedings, other regulatory and legal restrictions affecting the Funds’ ability to trade, and the availability of prices from independent pricing services or dealer quotations. Defaulted securities are often illiquid and may not be actively traded. Sale of securities in bankrupt companies at an acceptable price may be difficult and differences compared to the value of the securities used by the Funds could be material. A Fund may incur additional expenses to the extent it is required to seek recovery upon a portfolio security’s default in the payment of principal or interest. In any bankruptcy proceeding relating to a defaulted investment, a Fund may lose its entire investment or may be required to accept cash or securities with a value substantially less than its original investment.
Investments in senior loans and repurchase agreements also involve special risks. Although typically secured, senior loans may not be backed by sufficient collateral to satisfy their issuers’ obligations in the event of bankruptcy or similar scenarios. Senior loans may also be illiquid. Similarly, repurchase agreements may result in losses if the collateral associated with such positions is insufficient in the event of a counterparty default or similar scenario. Repurchase agreement positions may also be illiquid.
| | | | | | |
| February 28, 2018 | | | Annual Report | | | 55 | |
Notes to Financial Statements
AllianzGI Convertible & Income 2024 Target Term Fund/AllianzGI Convertible & Income Fund/AllianzGI Convertible & Income Fund II
February 28, 2018
3. Investment Manager & Deferred Compensation
Investment Manager. Each Fund has an Investment Management Agreement (for the purpose of this section, each an “Agreement”) with the Investment Manager. Subject to the supervision of the Funds’ Board, the Investment Manager is responsible for managing, either directly or through others selected by it, the Funds’ investment activities, business affairs and administrative matters. Pursuant to its Agreement, Convertible & Income 2024 Target Term pays the Investment Manager an annual fee, payable monthly, at an annual rate of 0.75% of its average daily total managed assets. Pursuant to their Agreements, Convertible & Income and Convertible & Income II, pay the Investment Manager an annual fee, payable monthly, at an annual rate of 0.70% of each Fund’s average daily total managed assets. Total managed assets for Convertible & Income 2024 Target Term refer to the total assets of the Fund (including assets attributable to any borrowings, issued debt securities or preferred shares that may be outstanding, reverse repurchase agreements and dollar rolls) minus accrued liabilities (other than liabilities representing borrowings, issued debt securities, reverse repurchase agreements and dollar rolls). Total managed assets for Convertible & Income and Convertible & Income II refer to the
total assets of each Fund (including assets attributable to any Preferred Shares or other forms of leverage that may be outstanding) minus accrued liabilities (other than liabilities representing leverage).
Deferred Compensation. Trustees do not currently receive any pension or retirement benefits from the Funds. The Funds have adopted a deferred compensation plan (the “Plan”) for the Trustees, which permits the Trustees to defer their receipt of compensation from the Funds, at their election, in accordance with the terms of the Plan. Under the Plan, each Trustee may elect not to receive all or a portion of his or her fees from the Funds on a current basis but to receive in a subsequent period, chosen by the Trustee, an amount equal to the value of such compensation if such compensation had been invested in one or more series of Allianz Funds Multi-Strategy Trust or Allianz Funds selected by the Trustees from and after the normal payment dates for such compensation. The deferred compensation program is structured such that the Funds remain in substantially the same financial position whether Trustee fees are paid when earned or deferred.
4. Investments in Securities
For the period ended February 28, 2018, purchases and sales of investments, other than short-term securities were:
| | | | | | | | |
| | | Purchases | | | Sales | |
Convertible & Income 2024 Target Term | | $ | 378,546,063 | | | $ | 139,569,668 | |
Convertible & Income | | | 309,355,075 | | | | 334,735,948 | |
Convertible & Income II | | | 234,013,322 | | | | 253,153,399 | |
| | | | |
| 56 | | Annual Report | | | February 28, 2018 |
Notes to Financial Statements
AllianzGI Convertible & Income 2024 Target Term Fund/AllianzGI Convertible & Income Fund/AllianzGI Convertible & Income Fund II
February 28, 2018
5. Income Tax Information
The tax character of dividends and distributions paid was:
| | | | | | | | | | | | |
| | | Year ended
February 28, 2018 | | | Year ended
February 28, 2017 | |
| | | Ordinary Income | | | Return of Capital | | | Ordinary Income | |
Convertible & Income 2024 Target Term | | $ | 5,878,756 | | | | – | | | | – | |
Convertible & Income | | | 74,087,460 | | | $ | 959,598 | | | $ | 71,080,472 | |
Convertible & Income II | | | 50,200,759 | | | | 5,945,822 | | | | 53,154,432 | |
At February 28, 2018, the components of distributable earnings were:
| | | | | | | | | | | | | | | | |
| | | | Post-October Capital Loss (Gain)(2) | |
| | | Ordinary Income | | | Capital Loss
Carryforwards(1) | | | Short-Term | | | Long-
Term | |
Convertible & Income 2024 Target Term | | $ | 2,980,783 | | | | – | | | | – | | | | – | |
Convertible & Income | | | – | | | $ | 165,135,480 | | | $ | (1,121,246 | ) | | $ | 5,130,866 | |
Convertible & Income II | | | – | | | | 132,812,980 | | | | (864,927 | ) | | | 3,916,886 | |
| (1) | | Capital loss carryforwards available as a reduction, to the extent provided in the regulations, of any future net realized gains. To the extent that these losses are used to offset future realized capital gains, such gains will not be disbursed. | |
| (2) | | Net capital losses realized during the period November 1, 2017 through February 28, 2018 which the Funds elected to defer to the following taxable year pursuant to income tax regulations. | |
At February 28, 2018, capital loss carryforward amounts were:
| | | | | | | | |
| | | No Expiration(3) | |
| | | Short-Term | | | Long-Term | |
Convertible & Income | | $ | 76,140,628 | | | $ | 88,994,852 | |
Convertible & Income II | | | 58,036,114 | | | | 74,776,866 | |
| (3) | | Carryforward amounts are subject to the provision of the Regulated Investment Company Modernization Act of 2010. | |
For the year ended February 28, 2018, the Funds utilized the following amounts of capital loss carryforwards:
| | | | | | | | |
| | | Post-Enactment Utilized | |
| | | Short-Term | | | Long-Term | |
Convertible & Income | | $ | 412,958 | | | $ | 12,012,961 | |
Convertible & Income II | | | 405,447 | | | | 9,402,942 | |
For the year ended February 28, 2018, the Funds had capital loss carryforwards which expired and were written-off as follows:
| | | | |
| | | Expired | |
Convertible & Income | | $ | 257,419,376 | |
Convertible & Income II | | | 227,428,454 | |
| | | | | | |
| February 28, 2018 | | | Annual Report | | | 57 | |
Notes to Financial Statements
AllianzGI Convertible & Income 2024 Target Term Fund/AllianzGI Convertible & Income Fund/AllianzGI Convertible & Income Fund II
February 28, 2018
5. Income Tax Information (continued)
For the year ended February 28, 2018, permanent “book-tax” adjustments were:
| | | | | | | | | | | | |
| | | Undistributed
(Dividends in Excess
of) Net Investment
Income | | | Accumulated Net
Realized Gain (Loss) | | | Paid-in Capital In
Excess of Par | |
Convertible & Income 2024 Target Term(a)(b)(c)(d) | | $ | 116,059 | | | $ | (79,909 | ) | | $ | (36,150 | ) |
Convertible & Income(a)(b)(c)(d)(e) | | | 9,326,639 | | | | 248,052,304 | | | | (257,378,943 | ) |
Convertible & Income II(a)(b)(c)(e) | | | 8,734,102 | | | | 218,694,352 | | | | (227,428,454 | ) |
These permanent “book-tax” differences were primarily attributable to:
| (a) | | Treatment of bond premium amortization | |
| (b) | | Reclassification of contingent debt/convertible securities income/gains | |
| (c) | | Section 305 sales adjustment | |
| (d) | | Reclassification of non-deductible excise tax accrued | |
| (e) | | Expired Capital Loss Carryforwards | |
Net investment income, net realized gains or losses and net assets were not affected by these adjustments.
At February 28, 2018, the aggregate cost basis and net unrealized depreciation of investments for federal income tax purposes were:
| | | | | | | | | | | | | | | | |
| | | Federal Tax
Cost Basis(4) | | | Unrealized
Appreciation | | | Unrealized
Deprecation | | | Net
Unrealized
Depreciation | |
Convertible & Income 2024 Target Term | | $ | 248,970,440 | | | $ | 2,356,636 | | | $ | 4,891,239 | | | $ | (2,534,603 | ) |
Convertible & Income | | | 963,628,277 | | | | 60,961,085 | | | | 96,044,727 | | | | (35,083,642 | ) |
Convertible & Income II | | | 732,391,261 | | | | 47,117,872 | | | | 72,722,996 | | | | (25,605,124 | ) |
| (4) | | Differences between book and tax cost basis were attributable to wash sale loss deferrals, REITs, Section 305 adjustments and the differing treatment of bond premium amortization. | |
6. Auction-Rate Preferred Shares
Convertible & Income has 2,856 shares of Preferred Shares Series A, 2,856 shares of Preferred Shares Series B, 2,856 shares of Preferred Shares Series C, 2,856 shares of Preferred Shares Series D and 2,856 shares of Preferred Shares Series E outstanding, each with a liquidation preference of $25,000 per share plus any accumulated, unpaid dividends.
Convertible & Income II has 2,192 shares of Preferred Shares Series A, 2,192 shares of
Preferred Shares Series B, 2,192 shares of Preferred Shares Series C, 2,192 shares of Preferred Shares Series D and 2,192 shares of Preferred Shares Series E outstanding, each with a liquidation preference of $25,000 per share plus any accumulated, unpaid dividends.
Dividends are accumulated daily at an annual rate that is typically re-set every seven days. Distributions of net realized capital gains, if any, are paid annually.
| | | | |
| 58 | | Annual Report | | | February 28, 2018 |
Notes to Financial Statements
AllianzGI Convertible & Income 2024 Target Term Fund/AllianzGI Convertible & Income Fund/AllianzGI Convertible & Income Fund II
February 28, 2018
6. Auction-Rate Preferred Shares (continued)
For the year ended February 28, 2018, the annualized dividend rates paid with respect to the Preferred shares of Convertible & Income and Convertible & Income II ranged from:
| | | | | | | | | | | | |
| | | High | | | Low | | | At February 28, 2018 | |
Series A | | | 2.162% | | | | 0.992% | | | | 2.162% | |
| | | |
Series B | | | 2.177% | | | | 0.977% | | | | 2.162% | |
| | | |
Series C | | | 2.177% | | | | 0.872% | | | | 2.177% | |
| | | |
Series D | | | 2.162% | | | | 1.007% | | | | 2.162% | |
| | | |
Series E | | | 2.177% | | | | 0.992% | | | | 2.177% | |
Convertible & Income and Convertible & Income II are subject to certain limitations and restrictions while Preferred Shares are outstanding. Failure to comply with these limitations and restrictions could preclude the Funds from declaring or paying any dividends or distributions to common shareholders or repurchasing common shares and/or could trigger the mandatory redemption of Preferred Shares at their liquidation preference plus any accumulated, unpaid dividends.
Preferred shareholders, who are entitled to one vote per shares, generally vote together with the common shareholders but vote separately as a class to elect two Trustees and on certain matters adversely affecting the rights of the Preferred Shares.
Since mid-February 2008, holders of auction-rate preferred shares (“ARPS”) issued by the Funds have been directly impacted by a lack of liquidity, which has similarly affected ARPS holders in many of the nation’s closed-end funds. Since then, regularly scheduled auctions for the Preferred shares (which are ARPS) issued by the Funds have consistently “failed” because of insufficient demand (bids to buy shares) to meet the supply (shares offered for sale) at each auction.
In a failed auction, ARPS holders cannot sell all, and may not be able to sell any, of their shares
tendered for sale. While repeated auction failures have affected the liquidity for ARPS, they do not constitute a default or automatically alter the credit quality of the ARPS, and ARPS holders have continued to receive dividends at the defined “maximum rate”, which for the Funds is equal to the 7-day “AA” Composite Commercial Paper Rate multiplied by a minimum of 150%, depending on the credit rating of the ARPS. The maximum rate is a function of short-term interest rates and typically higher than the rate that would have otherwise been set through a successful auction.
On May 29, 2014, Moody’s Investors Service upgraded each Fund’s Preferred shares ratings to Aa3 from A1. As a result, the applicable multiplier for calculating the maximum rate decreased from 200% to 150% beginning on that date. If the Funds’ Preferred shares auctions continue to fail and the “maximum rate” payable on the Preferred shares rises as result of changes in short-term interest rates, returns for the Funds’ common shareholders could be adversely affected.
7. Margin Loan Financing
Convertible & Income 2024 Target Term has entered into a margin loan financing agreement with BNP Paribas Prime Brokerage International, Ltd. (“BNP”). The margin loan is offered at a daily rate equal to the U.S. 3-month LIBOR rate plus 0.90%. At February 28, 2018, the
| | | | | | |
| February 28, 2018 | | | Annual Report | | | 59 | |
Notes to Financial Statements
AllianzGI Convertible & Income 2024 Target Term Fund/AllianzGI Convertible & Income Fund/AllianzGI Convertible & Income Fund II
February 28, 2018
7. Margin Loan Financing (continued)
Fund had a borrowing outstanding under the margin agreement totaling $69,700,000. The interest rate charged at February 28, 2018, was 2.917%. During the period ended February 28, 2018, the weighted average daily balance outstanding was $68,490,558 the weighted average interest rate of 2.401%. In connection with the margin loan financing, loan interest expense of $1,064,542 is included in the Convertible & Income 2024 Target Term’s Statement of Operations.
The Fund is required to fully collateralize its outstanding loan balance as determined by BNP. Pledged assets are held in a segregated account and are denoted in the Schedule of Investments.
8. Related Party Transactions
The Investment Manager is a related party. Fees payable to this party are disclosed in Note 3 and
the accrued related party fee amounts are disclosed on the Statements of Assets and Liabilities.
The Funds are permitted to purchase or sell securities from or to certain related affiliated funds under specified conditions outlined in procedures adopted by the Board. The procedures have been designed to ensure that any purchase or sale of securities by the Funds from or to another fund or portfolio that are, or could be, considered an affiliate by virtue of having a common investment adviser (or affiliated investment advisers), common Trustees and/or common officers comply with Rule 17a-7 of the 1940 Act. Further, as defined under the procedures, each transaction is effected at the current market price.
During the period or year ended February 28, 2018, the following Funds engaged in sales of securities pursuant to Rule 17a-7 of the 1940 Act:
| | | | | | | | |
| | | Purchases | | | Sales | |
Convertible & Income 2024 Target Term | | $ | 12,200,084 | | | | – | |
Convertible & Income | | | – | | | $ | 2,802,416 | |
Convertible & Income II | | | – | | | | 2,112,527 | |
9. Common Shares Issued
During the fiscal period ended February 28, 2018, Convertible & Income 2024 Target Term issued 16,500,000 common shares in its initial public offering. An additional 1,746,796 shares were issued in connection with the exercise of the underwriters’ over-allotment option. These shares were all issued at $9.835 per share (public offering price of $10.00 per share less sales load of 1.65% of the offering price). Offering costs of $364,936 (representing $0.02 per share) were incurred by Convertible & Income 2024 Target Term for the shares issued in the initial offering and the exercise of the
underwriter’s over-allotment option and were charged to paid-in capital in excess of par. The Investment Manager agreed to pay all offering costs associated with the public offering (other than the sales load) exceeding $0.02 per share, which came to approximately $1,170,064.
10. Significant Account Holder
From time to time, a Fund may have a concentration of shareholders, which may include the Investment Manager or affiliates of the Investment Manager, holding a significant percentage of shares outstanding. Investment
| | | | |
| 60 | | Annual Report | | | February 28, 2018 |
Notes to Financial Statements
AllianzGI Convertible & Income 2024 Target Term Fund/AllianzGI Convertible & Income Fund/AllianzGI Convertible & Income Fund II
February 28, 2018
10. Significant Account Holder (continued)
activities of these shareholders could have a material impact on a Fund. At February 28, 2018, RiverNorth Capital Management, LLC., held 5% or more of shares of common stock of Convertible & Income 2024 Target Term.
11. Subsequent Events
In preparing these financial statements, the Funds’ management has evaluated events and transactions for potential recognition or disclosure through the date the financial statements were issued.
On March 1, 2018 the following monthly dividends were declared to common shareholders, payable April 2, 2018 to common shareholders of record on March 12, 2018:
| | |
| Convertible & Income 2024 Target Term | | $0.046 per share |
| Convertible & Income | | $0.065 per common share |
| Convertible & Income II | | $0.0575 per common share |
On April 2, 2018 the following monthly dividends were declared to common shareholders, payable May 1, 2018 to common shareholders of record on April 12, 2018:
| | |
| Convertible & Income 2024 Target Term | | $0.046 per share |
| Convertible & Income | | $0.065 per common share |
| Convertible & Income II | | $0.0575 per common share |
There were no other subsequent events identified that require recognition or disclosure.
| | | | | | |
| February 28, 2018 | | | Annual Report | | | 61 | |
Report of Independent Registered Public Accounting Firm
AllianzGI Convertible & Income 2024 Target Term Fund/AllianzGI Convertible & Income Fund/AllianzGI Convertible & Income Fund II
To the Board of Trustees and Shareholders of AllianzGI Convertible & Income 2024 Target Term Fund, AllianzGI Convertible & Income Fund and AllianzGI Convertible & Income Fund II
Opinions on the Financial Statements
We have audited the accompanying statements of assets and liabilities, including the schedules of investments, of AllianzGI Convertible & Income 2024 Target Term Fund, AllianzGI Convertible & Income Fund and AllianzGI Convertible & Income Fund II (hereafter collectively referred to as the “Funds”) as of February 28, 2018, for AllianzGI Convertible & Income 2024 Target Term Fund the related statements of operations, changes in net assets, and cash flows for the period June 30, 2017 (commencement of operations) through February 28, 2018, and for AllianzGI Convertible & Income Fund and AllianzGI Convertible & Income Fund II the related statements of operations for the year ended February 28, 2018 and the statements of changes in net assets applicable to common shareholders for each of the two years in the period ended February 28, 2018, including the Funds’ related notes, and each of the Funds’ financial highlights for each of the periods indicated therein (collectively referred to as the “financial statements”). In our opinion, the financial statements present fairly, in all material respects, the financial position of each of the Funds as of February 28, 2018, for AllianzGI Convertible & Income 2024 Target Term Fund the results of its operations, changes in its net assets and its cash flows for the period June 30, 2017 (commencement of operations) through February 28, 2018, and for AllianzGI Convertible & Income Fund and AllianzGI Convertible & Income Fund II the results of each of their operations for the year ended February 28, 2018 and the changes in each of their net assets applicable to common shareholders for each of the two years in the period ended February 28, 2018, and each of the Funds’ financial highlights for each of the periods indicated therein in conformity with accounting principles generally accepted in the United States of America.
Basis for Opinions
These financial statements are the responsibility of the Funds’ management. Our responsibility is to express an opinion on the Funds’ financial statements based on our audits. We are a public accounting firm registered with the Public Company Accounting Oversight Board (United States) (“PCAOB”) and are required to be independent with respect to the Funds in accordance with the U.S. federal securities laws and the applicable rules and regulations of the Securities and Exchange Commission and the PCAOB.
We conducted our audits of these financial statements in accordance with the standards of the PCAOB. Those standards require that we plan and perform the audit to obtain reasonable assurance about whether the financial statements are free of material misstatement, whether due to error or fraud.
Our audits included performing procedures to assess the risks of material misstatement of the financial statements, whether due to error or fraud, and performing procedures that respond to those risks. Such procedures included examining, on a test basis, evidence regarding the amounts and disclosures in the financial statements. Our audits also included evaluating the accounting principles used and significant estimates made by management, as well as evaluating the overall presentation of the financial statements. Our procedures included confirmation of securities owned as of February 28, 2018 by correspondence with the custodian, transfer agent and brokers; when replies were not received from brokers, we performed other auditing procedures. We believe that our audits provide a reasonable basis for our opinions.
PricewaterhouseCoopers LLP
New York, NY
April 20, 2018
We have served as the auditor of one or more of the investment companies in the Allianz Global Investors U.S. group of investment companies since at least 1995. We have not determined the specific year we began serving as auditor.
| | | | |
| 62 | | Annual Report | | | February 28, 2018 |
Tax Information (unaudited)
AllianzGI Convertible & Income 2024 Target Term Fund/AllianzGI Convertible & Income Fund/AllianzGI Convertible & Income Fund II
As required by the Internal Revenue Code, shareholders must be notified regarding certain tax attributes of distributions made by each Fund.
Under the Jobs and Growth Tax Relief Reconciliation Act of 2003, the following percentages of ordinary dividends paid during the fiscal year ended February 28, 2018, are designated as “qualified dividend income” (or the maximum amount allowable):
| | |
| Convertible & Income 2024 Target Term | | 0% |
| Convertible & Income | | 21.38% |
| Convertible & Income II | | 21.10% |
Corporate shareholders are generally entitled to take the dividend received deduction on the portion of a Fund’s dividend distribution that qualifies under tax law. The percentage of the following Funds’ ordinary income dividends paid during the fiscal year ended February 28, 2018, that qualify for the corporate deduction is set below (or the maximum amount allowable):
| | |
| Convertible & Income 2024 Target Term | | 0% |
| Convertible & Income | | 19.43% |
| Convertible & Income II | | 18.88% |
Since the Funds’ tax year is not the calendar year, another notification will be sent with respect to calendar year 2018. In January 2019, shareholders will be advised on IRS Form 1099 DIV as to the federal tax status of dividends and distributions received during calendar 2018. The amount that will be reported will be the amount to use on the shareholders’ 2018 federal income tax return and may differ from the amount which must be reported in connection with the Funds’ tax year ended February 28, 2018. Shareholders are advised to consult their tax advisers as to the federal, state and local tax status of the dividend income received from the Funds.
| | | | | | |
| February 28, 2018 | | | Annual Report | | | 63 | |
Annual Shareholder Meeting Results (unaudited)
AllianzGI Convertible & Income Fund/AllianzGI Convertible & Income Fund II
Convertible & Income and Convertible & Income II held their annual meetings of shareholders on July 13, 2017. Shareholders voted as indicated below:
| | | | | | | | |
| Convertible & Income: | | Affirmative | | | Withheld
Authority | |
Re-election of James A. Jacobson* — Class II to serve until the annual meeting for the 2020-2021 fiscal year | | | 9,895 | | | | 578 | |
| | |
Re-election of Bradford K. Gallagher — Class II to serve until the annual meeting for the 2020-2021 fiscal year | | | 73,785,803 | | | | 1,692,906 | |
| | |
Re-election of Davey S. Scoon — Class II to serve until the annual meeting for the 2020-2021 fiscal year | | | 73,769,344 | | | | 1,709,365 | |
The other members of the Board of Trustees at the time of the meeting, namely, Ms. Barbara R. Claussen**, Ms. Deborah A. DeCotis and Messrs. F. Ford Drummond, A. Douglas Eu†, Hans W. Kertess, James S. MacLeod, William B. Ogden, IV and Alan Rappaport continued to serve as Trustees of the Fund.
| * | | Mr. Jacobson was elected by preferred shareholders voting as a separate class. All other trustees of Convertible & Income were elected by common and preferred shareholders voting together as a single class. | |
| ** | | Effective December 12, 2017, Barbara R. Claussen resigned as a Trustee of the Fund and Erick R. Holt was appointed as a Class I Trustee of the Fund. Mr. Holt is an “interested person” of the Fund, as defined in Section 2(a) (19) of the 1940 Act, due to his positions with the Investment Manager and its affiliates. | |
| | | | | | | | |
| Convertible & Income II: | | Affirmative | | | Withheld
Authority | |
Re-election of James A. Jacobson* — Class II to serve until the annual meeting for the 2020-2021 fiscal year | | | 7,293 | | | | 745 | |
| | |
Re-election of Deborah A. DeCotis, IV — Class II to serve until the annual meeting for the 2020-2021 fiscal year | | | 62,784,656 | | | | 2,978,029 | |
| | |
Re-election of Bradford K. Gallagher — Class II to serve until the annual meeting for the 2020-2021 fiscal year | | | 62,923,561 | | | | 2,839,124 | |
| | |
Re-election of Davey S. Scoon — Class II to serve until the annual meeting for the 2020-2021 fiscal year | | | 62,932,560 | | | | 2,830,125 | |
The other members of the Board of Trustees at the time of the meeting, namely, Ms. Barbara R. Claussen** and Messrs. F. Ford Drummond, A. Douglas Eu†, Hans W. Kertess, James S. MacLeod, William B. Ogden, IV and Alan Rappaport continued to serve as Trustees of the Fund.
| * | | Mr. Jacobson was elected by preferred shareholders voting as a separate class. All other trustees of Convertible & Income II were elected by common and preferred shareholders voting together as a single class. | |
| ** | | Effective December 12, 2017, Barbara R. Claussen resigned as a Trustee of the Fund and Erick R. Holt was appointed as a Class I Trustee of the Fund. Mr. Holt is an “interested person” of the Fund, as defined in Section 2(a) (19) of the 1940 Act, due to his positions with the Investment Manager and its affiliates. | |
| | | | |
| 64 | | Annual Report | | | February 28, 2018 |
Changes to the Board of Trustees and Officers/Proxy Voting Policies & Procedures (unaudited)
AllianzGI Convertible & Income 2024 Target Term Fund/AllianzGI Convertible & Income Fund/AllianzGI Convertible & Income Fund II
Changes to the Board of Trustees and Officers:
Effective December 12, 2017, Barbara R. Claussen resigned as a Trustee of the Funds and Erick R. Holt was appointed as a Class I Trustee of Convertible & Income, as a Class I Trustee of Convertible & Income II, and as a Class III Trustee of Convertible & Income 2024 Target Term. Mr. Holt is an “interested person” of the Funds, as defined in the Section 2(a) (19) of the 1940 Act, due to his positions with the Investment Manager and its affiliates.
Effective December 12, 2017, Craig A. Ruckman was elected Assistant Secretary to the Funds.
Proxy Voting Policies & Procedures:
A description of the policies and procedures that the Funds have adopted to determine how to vote proxies relating to portfolio securities and information about how the Funds voted proxies relating to portfolio securities held during the most recent twelve month period ended June 30 is available (i) without charge, upon request, by calling the Funds’ shareholder servicing agent at (800) 254-5197; (ii) on the Funds’ website at us.allianzgi.com/en-us/products-solutions/closed-end-funds; and (iii) on the Securities and Exchange Commission website at www.sec.gov.
| | | | | | |
| February 28, 2018 | | | Annual Report | | | 65 | |
Privacy Policy (unaudited)
AllianzGI Convertible & Income 2024 Target Term Fund/AllianzGI Convertible & Income Fund/AllianzGI Convertible & Income Fund II
Privacy Policy
Please read this Policy carefully. It gives you important information about how Allianz Global Investors U.S. and its U.S. affiliates (“AllianzGI US,” “we” or “us”) handle non-public personal information (“Personal Information”) that we may receive about you. It applies to all of our past, present and future clients and shareholders of AllianzGI US and the funds and accounts it manages, advises, sub-advises, administers or distributes, and will continue to apply when you are no longer a client or shareholder. As used throughout this Policy, “AllianzGI US” means Allianz Global Investors U.S. LLC, Allianz Global Investors Distributors LLC, and the family of registered and unregistered funds managed by one or more of these firms. AllianzGI US is part of a global investment management group, and the privacy policies of other Allianz Global Investors entities outside of the United States may have provisions in their policies that differ from this Privacy Policy. Please refer to the website of the specific non-US Allianz Global Investors entity for its policy on privacy.
We Care about Your Privacy
We consider your privacy to be a fundamental aspect of our relationship with you, and we strive to maintain the confidentiality, integrity and security of your Personal Information. To ensure your privacy, we have developed policies that are designed to protect your Personal Information while allowing your needs to be served.
Information We May Collect
In the course of providing you with products and services, we may obtain Personal Information about you, which may come from sources such as account application and other forms, from other written, electronic, or verbal communications, from account transactions, from a brokerage or financial advisory firm, financial advisor or consultant, and/or from information you provide on our website.
You are not required to supply any of the Personal Information that we may request. However, failure to do so may result in us being unable to open and maintain your account, or to provide services to you.
How Your Information Is Shared
We do not disclose your Personal Information to anyone for marketing purposes. We disclose your Personal Information only to those service providers, affiliated and non-affiliated, who need the information for everyday business purposes, such as to respond to your inquiries, to perform services, and/or to service and maintain your account. This applies to all of the categories of Personal Information we collect about you. The affiliated and non-affiliated service providers who receive your Personal Information also may use it to process your transactions, provide you with materials (including preparing and mailing prospectuses and shareholder reports and gathering shareholder proxies), and provide you with account statements and other materials relating to your account. These service providers provide services at our direction, and under their agreements with us, are required to keep your Personal Information confidential and to use it only for providing the contractually required services. Our service providers may not use your Personal Information to market products and services to you except in conformance with applicable laws and regulations. We also may provide your Personal Information to your respective brokerage or financial advisory firm, custodian, and/or to your financial advisor or consultant.
In addition, we reserve the right to disclose or report Personal Information to non-affiliated third parties, in limited circumstances, where we believe in good faith that disclosure is required under law, to cooperate with regulators or law enforcement authorities or pursuant to other legal process, or to protect our rights or property, including to enforce our
| | | | |
| 66 | | Annual Report | | | February 28, 2018 |
Privacy Policy (unaudited) (continued)
AllianzGI Convertible & Income 2024 Target Term Fund/AllianzGI Convertible & Income Fund/AllianzGI Convertible & Income Fund II
Privacy Policy or other agreements with you. Personal Information collected by us may also be transferred as part of a corporate sale, restructuring, bankruptcy, or other transfer of assets.
Security of Your Information
We maintain your Personal Information for as long as necessary for legitimate business purposes or otherwise as required by law. In maintaining this information, we have implemented appropriate procedures that are designed to restrict access to your Personal Information only to those who need to know that information in order to provide products and/or services to you. In addition, we have implemented physical, electronic and procedural safeguards to help protect your Personal Information.
Privacy and the Internet
The Personal Information that you provide through our website, as applicable, is handled in the same way as the Personal Information that you provide by any other means, as described above. This section of the Policy gives you additional information about the way in which Personal Information that is obtained online is handled.
| ∎ | | Online Enrollment, Account Access and Transactions: When you visit our website, you can visit pages that are open to the general public, or, where available, log into protected pages to enroll online, access information about your account, or conduct certain transactions. Access to the secure pages of our website is permitted only after you have created a User ID and Password. The User ID and Password must be supplied each time you want to access your account information online. This information serves to verify your identity. When you enter Personal Information into our website to enroll or access your account online, you will |
| | | log into secure pages. By using our website, you consent to this Privacy Policy and to the use of your Personal Information in accordance with the practices described in this Policy. If you provide Personal Information to effect transactions, a record of the transactions you have performed while on the site is retained by us. For additional terms and conditions governing your use of our website, please refer to the Investor Mutual Fund Access – Disclaimer which is incorporated herein by reference and is available on our website. |
| ∎ | | Cookies and Similar Technologies: Cookies are small text files stored in your computer’s hard drive when you visit certain web pages. Clear GIFs (also known as Web Beacons) are typically transparent very small graphic images (usually 1 pixel x 1 pixel) that are placed on a website that may be included on our services provided via our website and typically work in conjunction with cookies to identify our users and user behavior. We may use cookies and automatically collected information to: (i) personalize our website and the services provided via our website, such as remembering your information so that you will not have to re-enter it during your use of, or the next time you use, our website and the services provided via our website; (ii) provide customized advertisements, content, and information; (iii) monitor and analyze the effectiveness of our website and the services provided via our website and third-party marketing activities; (iv) monitor aggregate site usage metrics such as total number of visitors and pages viewed; and (v) track your entries, submissions, and status in any promotions or other activities offered through our website and the services provided via our website. |
| | | | | | |
| February 28, 2018 | | | Annual Report | | | 67 | |
Privacy Policy (unaudited) (continued)
AllianzGI Convertible & Income 2024 Target Term Fund/AllianzGI Convertible & Income Fund/AllianzGI Convertible & Income Fund II
| | | Tracking technology also helps us manage and improve the usability of our website, (i) detecting whether there has been any contact between your computer and us in the past and (ii) to identify the most popular sections of our website. Because an industry-standard Do-Not-Track protocol is not yet established, our website will continue to operate as described in this Privacy Policy and will not be affected by any Do-Not-Track signals from any browser. |
| ∎ | | Use of Social Media Plugins Our website uses the following Social Media Plugins (“Plugins”): |
| | ∎ | | Facebook Share Button operated by Facebook Inc., 1601 S. California Ave, Palo Alto, CA 94304, USA |
| | ∎ | | Tweet Button operated by Twitter Inc., 795 Folsom St., Suite 600, San Francisco, CA 94107, USA |
| | ∎ | | LinkedIn Share Button operated by LinkedIn Corporation, 2029 Stierlin Court, Mountain View, CA 94043, USA |
All Plugins are marked with the brand of the respective operators Facebook, Twitter and LinkedIn (“Operators”). When you visit our website that contains a social plugin, your browser establishes a direct connection to the servers of the Operator. The Operator directly transfers the plugin content to your browser which embeds the latter into our website, enabling the Operator to receive information about you having accessed the respective page of our website. Thus, AllianzGI US has no influence on the data gathered by the plugin and we inform you according to our state of knowledge: The embedded plugins provide the Operator with the information that you have accessed the corresponding page of our website. If you do not wish to have such data transferred to the Operators, you need to log
out of your respective account before visiting our website. Please see the Operators’ data privacy statements in order to get further information about purpose and scope of the data collection and the processing and use:
| | ∎ | | Facebook: https://de-de.facebook.com/about/privacy/ |
| | ∎ | | Twitter: https://twitter.com/privacy |
| | ∎ | | Linked In: https://www.linkedin.com/legal/privacy-policy |
Changes to Our Privacy Policy
We may modify this Privacy Policy from time-to-time to reflect changes in related practices and procedures, or applicable laws and regulations. If we make changes, we will notify you on our website and the revised Policy will become effective immediately upon posting to our website. We also will provide account owners with a copy of our Privacy Policy annually if required. We encourage you to visit our website periodically to remain up to date on our Privacy Policy. You acknowledge that by using our website after we have posted changes to this Privacy Policy, you are agreeing to the terms of the Privacy Policy as modified.
Obtaining Additional Information
If you have any questions about this Privacy Policy or our privacy related practices in the United States, you may contact us via our dedicated email at PrivacyUS@allianzgi.com.
| | | | |
| 68 | | Annual Report | | | February 28, 2018 |
Dividend Reinvestment Plan (unaudited)
AllianzGI Convertible & Income 2024 Target Term Fund/AllianzGI Convertible & Income Fund/AllianzGI Convertible & Income Fund II
Each Fund has adopted a Dividend Reinvestment Plan (the “Plan”) which allows common shareholders to reinvest Fund distributions in additional common shares of the Fund. American Stock Transfer & Trust Company, LLC (the “Plan Agent”) serves as agent for common shareholders in administering the Plan. It is important to note that participation in the Plan and automatic reinvestment of Fund distributions does not ensure a profit, nor does it protect against losses in a declining market.
Automatic enrollment/voluntary participation. Under the Plan, common shareholders whose shares are registered with the Plan Agent (“registered shareholders”) are automatically enrolled as participants in the Plan and will have all Fund distributions of income, capital gains and returns of capital (together, “distributions”) reinvested by the Plan Agent in additional common shares of the Funds, unless the shareholder elects to receive cash. Registered shareholders who elect not to participate in the Plan will receive all distributions in cash paid by check and mailed directly to the shareholder of record (or if the shares are held in street or other nominee name, to the nominee) by the Plan Agent. Participation in the Plan is voluntary. Participants may terminate or resume their enrollment in the Plan at any time without penalty by notifying the Plan Agent online at www.amstock.com, by calling (800) 254-5197, by writing to the Plan Agent, American Stock Transfer & Trust Company, LLC, at P.O. Box 922, Wall Street Station, New York, NY 10269-0560, or, as applicable, by completing and returning the transaction form attached to the Plan statement. A proper notification will be effective immediately and apply to the Funds’ next distribution if received by the Plan Agent at least three (3) days prior to the record date for the distribution; otherwise, a notification will be effective shortly following the Funds’ next succeeding distribution thereafter. If you withdraw from the Plan and so request, the Plan Agent will arrange for the sale of your shares
and send you the proceeds, minus a transaction fee and brokerage commissions.
How shares are purchased under the Plan. For each Fund distribution, the Plan Agent will acquire common shares for participants either (i) through receipt of newly issued common shares from the Fund (“newly issued shares”) or (ii) by purchasing common shares of the Fund on the open market (“open market purchases”). If, on a distribution payment date, the net asset value per common share of the Funds (“NAV”) is equal to or less than the market price per common share plus estimated brokerage commissions (often referred to as a “market premium”), the Plan Agent will invest the distribution amount on behalf of participants in newly issued shares at a price equal to the greater of (i) NAV or (ii) 95% of the market price per common share on the payment date. If the NAV is greater than the market price per common share plus estimated brokerage commissions (often referred to as a “market discount”) on a distribution payment date, the Plan Agent will instead attempt to invest the distribution amount through open market purchases. If the Plan Agent is unable to invest the full distribution amount in open market purchases, or if the market discount shifts to a market premium during the purchase period, the Plan Agent will invest any un-invested portion of the distribution in newly issued shares at a price equal to the greater of (i) NAV or (ii) 95% of the market price per share as of the last business day immediately prior to the purchase date (which, in either case, may be a price greater or lesser than the NAV per common shares on the distribution payment date). No interest will be paid on distributions awaiting reinvestment. Under the Plan, the market price of common shares on a particular date is the last sales price on the exchange where the shares are listed on that date or, if there is no sale on the exchange on that date, the mean between the closing bid and asked
| | | | | | |
| February 28, 2018 | | | Annual Report | | | 69 | |
Dividend Reinvestment Plan (unaudited) (continued)
AllianzGI Convertible & Income 2024 Target Term Fund/AllianzGI Convertible & Income Fund/AllianzGI Convertible & Income Fund II
quotations for the shares on the exchange on that date. The NAV per common share on a particular date is the amount calculated on that date (normally at the close of regular trading on the New York Stock Exchange) in accordance with the Funds’ then current policies.
Fees and expenses. No brokerage charges are imposed on reinvestments in newly issued shares under the Plan. However, all participants will pay a pro rata share of brokerage commissions incurred by the Plan Agent when it makes open market purchases. There are currently no direct service charges imposed on participants in the Plan, although the Funds reserve the right to amend the Plan to include such charges. The Plan Agent imposes a transaction fee (in addition to brokerage commissions that are incurred) if it arranges for the sale of your common shares held under the Plan.
Shares held through nominees. In the case of a registered shareholder such as a broker, bank or other nominee (together, a “nominee”) that holds common shares for others who are the beneficial owners, the Plan Agent will administer the Plan on the basis of the number of common shares certified by the nominee/record stockholder as representing the total amount registered in such shareholder’s name and held for the account of beneficial owners who are to participate in the Plan. If your common shares are held through a nominee and are not registered with the Plan Agent, neither you nor the nominee will be participants in or have distributions reinvested under the Plan. If you are a beneficial owner of common shares and wish to participate in the Plan, and your nominee is unable or unwilling to become a registered shareholder and a Plan participant on your behalf, you may request that your nominee arrange to have all or a portion of your shares re-registered with the Plan Agent in your name so that you may be enrolled as a participant in the Plan. Please contact your nominee for details or for other possible
alternatives. Participants whose shares are registered with the Plan Agent in the name of one nominee firm may not be able to transfer the shares to another firm and continue to participate in the Plan.
Tax consequences. Automatically reinvested dividends and distributions are taxed in the same manner as cash dividends and distributions – i.e., automatic reinvestment in additional shares does not relieve stockholders of, or defer the need to pay, any income tax that may be payable (or that is required to be withheld) on Fund dividends and distributions. The Fund and the Plan Agent reserve the right to amend or terminate the Plan. Additional information about the Plan, as well as a copy of the full Plan itself, may be obtained from the Plan Agent, American Stock Transfer & Trust Company, LLC, at P.O. Box 922, Wall Street Station, New York, NY 10269-0560; telephone number: (800) 254-5197; website: www.amstock.com.
| | | | |
| 70 | | Annual Report | | | February 28, 2018 |
Board of Trustees (unaudited)
AllianzGI Convertible & Income 2024 Target Term Fund/AllianzGI Convertible & Income Fund/AllianzGI Convertible & Income Fund II
| | | | | | | | |
Name, Address**, Year of
Birth and Position(s)
Held with Funds | | Term of Office and Length of Time Served | | Principal Occupation(s) During Past 5 Years | | Number of Funds in Fund Complex Overseen by Trustee | | Other
Directorships
Held by Trustee
During the Past
5 Years |
| Independent Trustees (1) |
Davey S. Scoon 1946 Chairman of the Board of Trustees | | NCV & NCZ Since June 2015 CBH Since May 2017 | | Adjunct Professor, University of Wisconsin-Madison (since 2011). | | 66 | | Director, Albireo Pharma, Inc. (since 2016); and Director, AMAG Pharmaceuticals, Inc. (since 2006). Formerly, Director, Biodel Inc. (2013 - 2016); Director, Orthofix International N.V. (2011 -2015); and Chairman, Tufts Health Plan (1997 -2014). |
Deborah A. DeCotis 1952 | | NCV & NCZ Since March 2011 CBH Since May 2017 | | Advisory Director, Morgan Stanley & Co., Inc. (since 1996); Member, Circle Financial Group (since 2009); and Member, Council on Foreign Relations (since 2013). Trustee, Smith College (since 2017); and Director Watford Re (since 2017). Formerly, Co-Chair Special Projects Committee, Memorial Sloan Kettering (2005-2015); Trustee, Stanford University (2010-2015); Principal, LaLoop LLC, a retail accessories company (1999-2014); Trustee, Smith College (since 2017); and Director Watford Re (since 2017) | | 92† | | None. |
F. Ford Drummond 1962 | | NCV & NCZ Since June 2015 CBH Since May 2017 | | Owner/Operator, Drummond Ranch; and Chairman, Oklahoma Water Resources Board. Formerly, Director, The Cleveland Bank; and General Counsel, BMI-Health Plans (benefits administration). | | 66 | | Director, Bancfirst Corporation. |
| | | | | | |
| February 28, 2018 | | | Annual Report | | | 71 | |
Board of Trustees (unaudited) (continued)
AllianzGI Convertible & Income 2024 Target Term Fund/AllianzGI Convertible & Income Fund/AllianzGI Convertible & Income Fund II
| | | | | | | | |
Name, Address**, Year of
Birth and Position(s)
Held with Funds | | Term of Office and Length of Time Served | | Principal Occupation(s) During Past 5 Years | | Number of Funds in Fund Complex Overseen by Trustee | | Other
Directorships
Held by Trustee
During the Past
5 Years |
Bradford K. Gallagher 1944 | | NCV & NCZ Since September 2010 CBH Since May 2017 | | Retired. Founder, Spyglass Investments LLC, a private investment vehicle (since 2001). Formerly, Chairman and Trustee, The Common Fund (2005-2014); Partner, New Technology Ventures Capital Management LLC, a venture capital fund (2011-2013). | | 92† | | None. |
James A. Jacobson 1945 | | NCV & NCZ Since December 2009 CBH Since May 2017 | | Retired. Trustee (since 2002) and Chairman of Investment Committee (since 2007), Ronald McDonald House of New York; and Trustee, New Jersey City University (since 2014). | | 92† | | Formerly, Trustee, Alpine Mutual Funds Complex (consisting of 18 funds) (2009-2016). |
Hans W. Kertess 1939 | | NCV & NCZ Since February 2004 CBH Since May 2017 | | President, H. Kertess & Co., a financial advisory company; and Senior Adviser (formerly Managing Director), Royal Bank of Canada Capital Markets (since 2004). | | 92† | | Director, Street Contxt. |
James S. MacLeod 1947 | | NCV & NCZ Since June 2015 CBH Since May 2017 | | Executive Chairman of the Board, CoastalSouth Bancshares, Inc.; Chairman, CoastalStates Bank; Vice Chairman of the Board and Member of Executive Committee, University of Tampa; Trustee, MUSC Foundation and Director, Mortgage Bankers Association of America. Formerly, Executive Vice President, Mortgage Guaranty Insurance Corporation; and Chief Executive Officer, Homeowners Mortgage. | | 66 | | Non-Executive Chairman and Director, Sykes Enterprises, Inc. |
William B. Ogden, IV 1945 | | NCV & NCZ Since September 2006 CBH Since May 2017 | | Retired. Formerly, Asset Management Industry Consultant; and Managing Director, Investment Banking Division of Citigroup Global Markets Inc. | | 92† | | None. |
| | | | |
| 72 | | Annual Report | | | February 28, 2018 |
Board of Trustees (unaudited) (continued)
AllianzGI Convertible & Income 2024 Target Term Fund/AllianzGI Convertible & Income Fund/AllianzGI Convertible & Income Fund II
| | | | | | | | |
Name, Address**, Year of
Birth and Position(s)
Held with Funds | | Term of Office and Length of Time Served | | Principal Occupation(s) During Past 5 Years | | Number of Funds in Fund Complex Overseen by Trustee | | Other
Directorships
Held by Trustee
During the Past
5 Years |
Alan Rappaport 1953 | | NCV & NCZ Since June 2010 CBH Since May 2017 | | Advisory Director (formerly, Vice Chairman), Roundtable Investment Partners (since 2009); Adjunct Professor, New York University Stern School of Business (since 2011); Lecturer, Stanford University Graduate School of Business (since 2013); Member of Board of Overseers, NYU Langone Medical Center (since 2015); and Director, Victory Capital Holdings, Inc., an asset management firm (since 2013). Formerly, Trustee, American Museum of Natural History (2005-2015); and Trustee and Member of Board of Overseers, NYU Langone Medical Center (2007-2015). | | 92† | | None. |
| Interested Trustees (1) |
A. Douglas Eu (2) 1961 | | NCV & NCZ Since April 2016 CBH Since May 2017 | | Chief Executive Officer, Managing Director and Chairman of the Executive Committee of Allianz Global Investors U.S. Holdings LLC (since 2016); Member of the Global Executive Committee of Allianz Global Investors GmbH (since 2006). Formerly, Chief Executive Officer of Allianz Global Investors Asia Pacific GmbH (2006-2015). | | 66 | | Formerly, Director, Securities and Futures Commission Advisory Committee Hong Kong (2007-2013). |
Erick R. Holt (2) 1952 | | CBH, NCV & NCZ Since December 2017 | | Board Member, Global Chief Risk Officer, General Counsel and Chief Compliance Officer (since 2006) of Allianz Asset Management GmbH | | 66 | | None. |
| * | | Unless otherwise indicated, the business address of the persons listed above is c/o Allianz Global Investors U.S. LLC, 1633 Broadway, New York New York 10019. | |
| † | | Includes 26 PIMCO Funds that the Trustee currently presides over. | |
| (1) | | “Independent Trustees” are those Trustees who are not “Interested Persons” (as defined in section 2(a)(19) of the 1940 Act), and “Interested Trustees” are those Trustees who are “Interested Persons” of the Funds. | |
| (2) | | Messers. Eu and Holt are “Interested Persons” of the Funds as defined in Section 2(a)(19) of the 1940 Act, due to their affiliation with the Investment Manager and its affiliates. | |
| | | | | | |
| February 28, 2018 | | | Annual Report | | | 73 | |
Fund Officers (unaudited)
AllianzGI Convertible & Income 2024 Target Term Fund/AllianzGI Convertible & Income Fund/AllianzGI Convertible & Income Fund II
| | | | |
Name, Address*,
Year of Birth, Position(s) Held with Trust | | Term of Office and
Length of
Time Served | | Principal Occupation(s) During Past 5 Years |
Thomas J. Fuccillo President and Chief Executive Officer 1968 | | NCV & NCZ Since April 2016 CBH Since May 2017 | | Managing Director, Chief Regulatory Counsel and Head of Retail and Funds Legal of Allianz Global Investors U.S. Holdings LLC; Managing Director, Chief Legal Officer and Secretary of Allianz Global Investors Distributors LLC; Secretary and Chief Legal Officer of The Korea Fund, Inc. President and Chief Executive Officer of 66 funds in the Fund Complex; Formerly, Vice President, Secretary and Chief Legal Officer of numerous funds in the Fund Complex (2004-2016). |
Scott Whisten(1) Treasurer, Principal Financial and Accounting Officer 1971 | | CBH, NCV & NCZ Since April 2018 | | Director of Allianz Global Investors U.S. LLC; and Assistant Treasurer of 66 funds in the Fund Complex. |
Angela Borreggine Secretary and Chief Legal Officer 1964 | | NCV & NCZ Since April 2016 CBH Since May 2017 | | Director and Senior Counsel of Allianz Global Investors U.S. Holdings LLC; Secretary and Chief Legal Officer of 66 funds in the Fund Complex. Formerly, Assistant Secretary of numerous funds in the Fund Complex (2015-2016). |
Thomas L. Harter, CFA** Chief Compliance Officer 1975 | | NCV & NCZ Since June 2013 CBH Since May 2017 | | Director of Allianz Global Investors U.S. Holdings LLC; Director, Deputy Chief Compliance Officer of Allianz Global Investors U.S. LLC; Chief Compliance Officer of 66 funds in the Fund Complex and of The Korea Fund, Inc. |
Richard J. Cochran Assistant Treasurer 1961 | | NCV & NCZ Since May 2008 CBH Since May 2017 | | Vice President of Allianz Global Investors U.S. LLC; Assistant Treasurer of 66 funds in the Fund Complex and of The Korea Fund, Inc. |
Orhan Dzemaili Assistant Treasurer 1974 | | NCV & NCZ Since June 2012 CBH Since May 2017 | | Director of Allianz Global Investors U.S. LLC; and Assistant Treasurer of 66 funds in the Fund Complex and of The Korea Fund, Inc. |
Debra Rubano Assistant Secretary 1975 | | NCV & NCZ Since December 2015 CBH Since May 2017 | | Director and Senior Counsel of Allianz Global Investors U.S. Holdings LLC; and Assistant Secretary of 66 funds in the Fund Complex. |
Craig A. Ruckman Assistant Secretary 1977 | | CBH, NCV & NCZ Since December 2017 | | Director and Senior Counsel of Allianz Global Investors U.S. Holdings LLC; and Assistant Secretary of 66 funds in the Fund Complex. Formerly, Associate of K&L Gates LLP (2012-2016). |
Each of the Fund’s executive officers is an “interested person” of the Funds (as defined in section 2(a)(19) of the 1940 Act) as a result of this or her position(s) set forth in the table above.
| * | | Unless otherwise indicated, the business address of the persons listed above is c/o Allianz Global Investors U.S. LLC, 1633 Broadway, New York, New York 10019. | |
| ** | | The correspondence address for Thomas L. Harter is 600 West Broadway, San Diego, CA 92101. | |
| (1) | | Effective April 13, 2018, Scott Whisten, formerly Assistant Treasurer to each Fund was appointed Treasurer, Principal Financial and Accounting Officer. Prior to that date, Lawrence G. Altadonna served as Treasurer, Principal Financial and Accounting Officer to each Fund. | |
| | | | |
| 74 | | Annual Report | | | February 28, 2018 |
Trustees
Davey S. Scoon
Chairman of the Board of Trustees
Deborah A. DeCotis
F. Ford Drummond
A. Douglas Eu
Bradford K. Gallagher
Erick R. Holt
James A. Jacobson
Hans W. Kertess
James S. MacLeod
William B. Ogden, IV
Alan Rappaport
Fund Officers
Thomas J. Fuccillo
President and Chief Executive Officer
Scott Whisten
Treasurer, Principal Financial and Accounting Officer
Angela Borreggine
Chief Legal Officer and Secretary
Thomas L. Harter
Chief Compliance Officer
Richard J. Cochran
Assistant Treasurer
Orhan Dzemaili
Assistant Treasurer
Debra Rubano
Assistant Secretary
Craig A. Ruckman
Assistant Secretary
Investment Manager
Allianz Global Investors U.S. LLC
1633 Broadway
New York, NY 10019
Custodian & Accounting Agent*
State Street Bank & Trust Co.
801 Pennsylvania Avenue
Kansas City, MO 64105
Transfer Agent, Dividend Paying Agent and Registrar
American Stock Transfer & Trust Company, LLC
6201 15th Avenue
Brooklyn, NY 11219
Independent Registered Public Accounting Firm
PricewaterhouseCoopers LLP
300 Madison Avenue
New York, NY 10017
Legal Counsel
Ropes & Gray LLP
Prudential Tower
800 Boylston Street
Boston, MA 02199
| * | | Effective May 1, 2017, services related to custody and fund accounting for the AllianzGI Convertible & Income and AllianzGI Convertible & Income II Funds transitioned from Brown Brothers Harriman & Co. to State Street Bank & Trust Company. | |
This report, including the financial information herein, is transmitted to the shareholders of AllianzGI Convertible & Income 2024 Target Term, AllianzGI Convertible & Income and AllianzGI Convertible & Income II Funds for their information. It is not a prospectus, circular or representation intended for use in the purchase of shares of the Funds or any securities mentioned in this report.
Notice is hereby given in accordance with Section 23(c) of the Investment Company Act of 1940, as amended, that from time to time the Funds may purchase shares of their stock in the open market.
The Funds file their complete schedule of portfolio holdings with the Securities and Exchange Commission (“SEC”) for the first and third quarters of their fiscal year on Form N-Q. Each Fund’s Form N-Q is available on the SEC’s website at www.sec.gov and may be reviewed and copied at the SEC’s Public Reference Room in Washington D.C. Information on the operation of the Public Reference Room may be obtained by calling (800) SEC-0330. The information on Form N-Q is also available on the Funds’ website at us.allianzgi.com/en-us/products-solutions/closed-end-funds.
Information on the Funds is available at us.allianzgi.com/en-us/products-soloutions/closed-end-funds or by calling the Funds’ shareholder servicing agent at (800) 254-5197.
Receive this report electronically and eliminate paper mailings.
To enroll, visit us.allianzgi.com/edelivery.
| | |
| Allianz Global Investors Distributors LLC | | AZ603AR_022818 |
428483
| | (a) | As of the end of the period covered by this report, the registrant has adopted a code of ethics (the “Section 406 Standards for Investment Companies — Ethical Standards for Principal Executive and Financial Officers”) that applies to the registrant’s Principal Executive Officer and Principal Financial Officer; the registrant’s Principal Financial Officer also serves as the Principal Accounting Officer. The registrant undertakes to provide a copy of such code of ethics to any person upon request, without charge, by calling 1-800-254-5197. The code of ethics is included as an Exhibit 99.CODEETH hereto. |
| | (b) | During the period covered by this report, there were no amendments to a provision of the code of ethics adopted in 2(a) above. |
| | (c) | During the period covered by this report, there were no waivers or implicit waivers to a provision of the code of ethics adopted in 2(a) above. |
| ITEM 3. | AUDIT COMMITTEE FINANCIAL EXPERT |
The registrant’s Board has determined that Messrs. James A. Jacobson and Davey S. Scoon, each a member of the Board’s Audit Oversight Committee, is an “audit committee financial expert,” and each is “independent,” for purposes of this Item.
| ITEM 4. | PRINCIPAL ACCOUNTANT FEES AND SERVICES |
| | a) | Audit fees. The aggregate fees billed for each of the last two fiscal years (the “Reporting Periods”) for professional services rendered by the Registrant’s principal accountant (the “Auditor”) for the audit of the Registrant’s annual financial statements, or services that are normally provided by the Auditor in connection with the statutory and regulatory filings or engagements for the Reporting Periods were $69,963 in 2017 and $77,062 in 2018. |
| | b) | Audit-Related Fees. The aggregate fees billed in the Reporting Periods for assurance and related services by the principal accountant that are reasonably related to the performance of the audit registrant’s financial statements and are not reported under paragraph (e) of this Item were $17,222 in 2017 and $17,738 in 2018. These services consist of accounting consultations, agreed upon procedure reports (inclusive of annual review of basic maintenance testing associated with the Preferred Shares), attestation reports and comfort letters. |
| | c) | Tax Fees. The aggregate fees billed in the Reporting Periods for professional services rendered by the Auditor for tax compliance, tax service and tax planning (“Tax Services”) were $17,023 in 2017 and $17,534 in 2018. These services consisted of review or preparation of U.S. federal, state, local and excise tax returns and calculation of excise tax distributions. |
| | d) | All Other Fees. There were no other fees billed in the Reporting Periods for products and services provided by the Auditor to the Registrant. |
| | e) | 1. Audit Committee Pre-Approval Policies and Procedures. The Registrant’s Audit Committee has established policies and procedures for pre-approval of all audit and permissible non-audit services by the Auditor for the Registrant, as well as the Auditor’s engagements related directly to the operations and financial reporting of the Registrant. The Registrant’s policy is stated below. |
Audit Oversight Committee Policy:
Pre-Approval of Services Provided by Independent Accountants
Allianz Funds, Allianz Funds Multi-Strategy Trust, Premier Multi-Series VIT, AllianzGI Institutional Multi-Series Trust, The Korea Fund, Inc., and
Allianz Global Investors Sponsored Closed-End Funds1
The Funds are required to prepare and file audited financial statements.2 Audited financial statements must be examined by an “independent” accountant.3 Rule 2-01(b) of Regulation S-X provides that the U.S. Securities and Exchange Commission (“SEC”) will “not recognize an accountant as independent, with respect to an audit client, if the accountant is not capable of exercising objective and impartial judgment on all issues encompassed within the accountant’s engagement.” Rule 2-01(c) elaborates on this general standard by providing specific circumstances in which an accountant will not be considered independent. Recently adopted rules and amendments to existing rules operate by providing that an accountant will not be considered independent with respect to a client if the accountant and the client (including certain of the client’s affiliates) do not comply with the restrictions on prohibited services and the rules requiring audit committee pre-approval of services. Therefore, the Audit Oversight Committee (“Committee”) of each of the Funds has adopted the following policies and procedures in order to ensure that the Funds comply with the above requirements.
Each Fund’s Committee is charged with the oversight of the Fund’s financial reporting policies and practices and their internal controls. As part of this responsibility, a Fund’s Committee must pre-approve any engagement of the Fund’s independent accountant to render audit and/or permissible non-audit services to the Fund as well as to the Fund’s investment adviser4 or any entity controlling, controlled by or under common control with the investment adviser that provides ongoing services to the Fund (“Applicable Service Providers”), if the engagement relates directly to the operations and financial reporting of the Fund.5
| 1 | The listed entities which are open-end investment companies are known as the “Trusts” and the listed entities which are closed- end investment companies are known as the “Closed-End Funds.” The Trusts’ series and the Closed-End Funds are referred to as “Funds.” |
| 2 | See, e.g., Rule 3-18 of Regulation S-X. |
| 3 | See, e.g., Rule 1-02(d) of Regulation S-X. |
| 4 | For purposes of this requirement, the term “adviser” does not include sub-advisers that are not affiliated with a Fund’s investment adviser, are overseen by that investment adviser, and whose role is primarily portfolio management. |
| 5 | Rule 2-01(c)(7) of Regulation S-X |
In evaluating a proposed engagement by the independent accountants, the Committee will assess the effect that the engagement might reasonably be expected to have on the accountants’ independence. The Committee’s evaluation will be based on:
| | • | | a review of the nature of the professional services expected to be provided; |
| | • | | the fees to be charged in connection with the services expected to be provided; |
| | • | | a review of the safeguards put into place by the accounting firm to safeguard independence; and |
| | • | | periodic meetings with the accounting firm. |
The Committee need not evaluate all four factors each time they pre-approve a service; they may rely on previous evaluations to the extent they consider appropriate.
A Fund and its Applicable Service Providers are prohibited from engaging the Fund’s independent accountants to provide services except in accordance with these Procedures. Similarly, a Fund’s independent accountants are prohibited from providing services to a Fund, its Applicable Service Providers or other entities comprising the “client” for purposes of the engagement (see Section III below) except in accordance with these Procedures.
| II. | Policy for Pre-Approval of Audit and Non-Audit Services to be Provided to the Funds |
On an annual basis, a Fund’s Committee will review and, if the Committee so determines, pre-approve the scope of the audits of the Fund and proposed audit fees and permitted non-audit (including audit-related) services that are proposed to be performed by the Fund’s independent accountants for the Fund and its Applicable Service Providers (to the extent the services to be provided to the Applicable Service Providers relate directly to the operations and financial reporting of the Fund). The Committee may also pre- approve services at any other in-person or telephonic Committee meeting. At least annually, the Committee will receive a report of all audit and non-audit services that were rendered in the previous calendar year by the independent accountants for the Fund and its Applicable Service Providers.
In addition to the Committee’s pre-approval of services pursuant to this Policy, the engagement of the independent accounting firm for any permitted non-audit service provided to the Fund will also require the separate pre-approval of the President, Treasurer or Assistant Treasurer of the Fund, who may only grant such approval if he or she believes that the accounting firm’s engagement will not adversely affect the firm’s independence. All non-audit services performed by the independent accounting firm will be disclosed, to the extent required, in filings with the SEC.
The categories of audit services and related fees to be reviewed and pre-approved annually by the Committee in connection with the audit of the Fund are:
| | • | | Annual Fund financial statement audits |
| | • | | Seed audits (related to new product filings, as required) |
| | • | | SEC and regulatory filings and consents |
| | • | | Semiannual financial statement reviews |
Individual audit services that fall within one of these categories and are not presented to the Committee as part of the annual pre- approval process described above, may be pre-approved, if deemed consistent with the accounting firm’s independence, by the Committee at any regular or special meeting. Such services may also be pre-approved by the Committee Chair (or any other Committee member who is a disinterested trustee under the Investment Company Act to whom this responsibility has been delegated) so long as the estimated fee for the particular service for which pre-approval is sought does not exceed the limit assigned within Appendix A. Any pre-approval by a Committee member shall be reported to the full Committee at its next regularly scheduled meeting.
The following categories of audit-related services are generally considered to be consistent with the role of the Fund’s independent accountants and services falling under one of these categories will be pre-approved by the Committee on an annual basis if the Committee deems those services to be consistent with the accounting firm’s independence:
| | • | | Accounting consultations |
| | • | | Fund merger support services |
| | • | | Agreed upon procedure reports (inclusive of annual review of Basic Maintenance testing associated with issuance of Preferred Shares) |
| | • | | Other attestation reports |
| | • | | Other internal control reports |
Individual audit-related services that fall within one of these categories and are not presented to the Committee as part of the annual pre- approval process described above, may be pre-approved, if deemed consistent with the accounting firm’s independence, by the Committee at any regular or special meeting or by the Committee Chair (or any other Committee member who is a disinterested trustee under the Investment Company Act to whom this responsibility has been delegated) so long as the estimated fee for the particular service for which pre-approval is sought does not exceed the limit assigned within Appendix A. Any pre-approval by a Committee Member shall be reported to the full Committee at its next regularly scheduled meeting.
The following categories of tax services are generally considered to be consistent with the role of a Fund’s independent accountants and services falling under one of these categories will be pre-approved by the Committee on an annual basis if the Committee deems those services to be consistent with the accounting firm’s independence:
| | • | | Federal, state and local income tax compliance and sales and use tax compliance, including required filings and amendments |
| | • | | Timely RIC qualification reviews |
| | • | | Tax distribution analysis and planning |
| | • | | Tax authority examination services |
| | • | | Tax appeals support services |
| | • | | Accounting methods studies |
| | • | | Fund merger support services |
| | • | | Other tax consulting services and related projects |
Individual tax services that fall within one of these categories and are not presented to the Committee as part of the annual pre-approval process described above, may be pre-approved, if deemed consistent with the accounting firm’s independence, by the Committee at any regular or special meeting. Such services may also be pre-approved by the Committee Chair (or any other Committee member who is a disinterested trustee under the Investment Company Act to whom this responsibility has been delegated) so long as the estimated fee for the particular service for which pre-approval is sought does not exceed the limit assigned within Appendix A. Any pre-approval by a Committee Member shall be reported to the full Committee at its next regularly scheduled meeting.
Services that are proposed to be provided to a Fund which are not audit, audit-related or tax services may be pre-approved, if deemed consistent with the accounting firm’s independence, by the Committee at any regular or special meeting. Such services may also be pre- approved by the Committee Chair (or any other Committee member who is a disinterested trustee under the Investment Company Act to whom this responsibility has been delegated) so long as the estimated fee for the particular service for which pre-approval is sought does not exceed the limit assigned within Appendix A. Any pre-approval by a Committee member shall be reported to the full Committee at its next regularly scheduled meeting.
A Fund’s independent accountants will not render to the Funds or any “audit client”6 those services set forth in Rule 2-01(c)(4) of Regulation S-X. Those services consist of:
| | • | | Bookkeeping or other services related to the accounting records or financial statements of the audit client* |
| | • | | Financial information systems design and implementation* |
| | • | | Appraisal or valuation services, fairness opinions, or contribution-in-kind reports* |
| | • | | Internal audit outsourcing services* |
| | • | | Management functions or human resources |
| | • | | Broker or dealer, investment adviser or investment banking services |
| | • | | Legal services and expert services unrelated to the audit |
| | • | | Any other service that the Public Company Accounting Oversight Board determines, by regulation, is impermissible |
| * | Such services are not prohibited under Rule 2-01(c)(4) of Regulation S-X if it is reasonable to conclude that the results of these services will not be subject to audit procedures during the audit of the audit client’s financial statements. |
| 6 | For purposes of Rule 2-01, the “audit client” includes, with respect to Funds, all of the following entities: |
| | (i) | the Fund whose financial statements are being audited, reviewed or attested; |
| | (ii) | the Fund’s investment adviser (not including sub-advisers whose role is primarily portfolio management and who are subcontracted with or overseen by another investment adviser, although affiliated sub-advisers will be included through the operation of clause (iii) below) or sponsor (defined as an entity that establishes a unit investment trust); |
| | (iii) | any entity controlling, controlled by or under common control with the Fund’s adviser or sponsor if the entity (A) is an investment adviser or sponsor, or (B) is engaged in the business of providing administrative, custodian, underwriting or transfer agent services to any investment company, investment adviser, or sponsor; and |
| | (iv) | any fund or entity excluded from the definition of investment company by Section 3(c) of the Investment Company Act of 1940 that has an investment adviser or sponsor referred to in clauses (ii) or (iii) above. |
In addition, a Fund’s independent accountant may not provide any personal tax services to individuals who serve in a Financial Reporting Oversight Role with respect to the Funds.7 This restriction does not apply to a Director/Trustee of the Funds if he or she is in a Financial Reporting Oversight Role only because he or she serves as a Director/Trustee of the Funds.
| IV. | Pre-Approval of Non-Audit Services Provided to Other Entities within the Fund Complex |
Rule 2-01(c)(7) of Regulation S-X provides that an accountant is not independent of a Fund unless the Fund’s Committee approves any permitted non-audit services to be provided to a Fund’s Applicable Service Providers, provided, in each case, that the engagement relates directly to the operations and financial reporting of the Fund.
Services to be provided to Applicable Service Providers that are required to be pre-approved, may be pre-approved, if deemed consistent with the accounting firm’s independence, by the Committee at a regular or special meeting or by the Committee Chair (or any other Committee member who is a disinterested trustee under the Investment Company Act to whom this responsibility has been delegated) so long as the estimated fee does not exceed the limit assigned, per service, within Appendix A. If a service is approved by a Committee member, the full Committee is notified of such pre-approval at its next regularly scheduled meeting.
Although the Committee will not be required to pre-approve all services provided to Applicable Service Providers and their affiliates, the Committee will receive an annual report from the Fund’s independent accounting firm showing the aggregate fees for all services provided to Applicable Service Providers and their affiliates.
| V. | De Minimis Exception to Requirement of Pre-Approval of Non-Audit Services |
Rule 2-01(c)(7)(i)(c) of Regulation S-X provides a limited exception (sometimes referred to as the “de minimis” exception) to the pre- approval requirements. This exception is designed to prevent the disqualification of the Fund’s independent accountant due to a minor oversight and is to be used only rarely and only if each of the following conditions is satisfied:
| | • | | The aggregate fees and costs of all non-audit services that, but for the limited exception provided by this Section V, would require pre-approval by the Committee constitutes no more than five percent of the total fees and costs paid by the Fund and Applicable Service Providers to the independent accountant during the fiscal year during which such non-audit services are provided; |
| 7 | Financial Reporting Oversight Role means a role in which a person is in a position to or does exercise influence over the contents of the financial statements or anyone who prepares them, such as when the person is a member of the board of directors or similar management or governing body, chief executive officer, president, chief financial officer, chief operating officer, general counsel, chief accounting officer, controller, director of internal audit, director of financial reporting, treasurer, or any equivalent position. |
| | • | | At the time of the engagement for such services, the Fund did not recognize that the services were “non-audit services” that required preapproval; and |
| | • | | Each such service is brought promptly to the attention of the Committee and approved prior to the completion of the audit by the Committee, Committee Chair or any other Committee member who is a disinterested trustee under the Investment Company Act to whom this responsibility has been delegated. |
| VI. | Oversight and Monitoring |
A Fund’s CCO will be responsible for determining that a Fund’s Applicable Service Providers and independent accountants have adopted and implemented policies and procedures reasonably designed to prevent violations of these Procedures. If the CCO determines that the Applicable Service Providers’ or the independent accountant’s policies and procedures do not meet such standard, the CCO shall notify the Applicable Service Provider or the independent accountant of the deficiency and request that the Applicable Service Provider or the independent accountant indicate how it intends to address the deficiency. If the deficiency is not addressed to the CCO’s satisfaction within a reasonable time after such notification (as determined by the CCO), then the CCO shall promptly notify the Fund’s Board of Directors/Trustees of the deficiency and shall discuss with the Board possible responses.
The Fund shall maintain a written record of all decisions made pursuant to these procedures, together with appropriate supporting material.
In connection with the approval of any non-audit service pursuant to the de minimis exception provided in Section V of these procedures, a record shall be made indicating that each of the conditions for this exception has been satisfied.
A copy of these Procedures and of any amendments to these Procedures shall be maintained and preserved permanently in an easily accessible place. The written records referred to in paragraph 1 and 2 of this Section VII shall be maintained and preserved for six years from the end of the fiscal year in which the actions recorded were taken, for at least the first two years in an easily accessible location.
APPENDIX A
Estimated Fee Limits for Pre-Approval of Services
| | | | | | | | | | | | | | | | | | | | |
| | | Audit | | | Audit
Related | | | Tax | | | Other | | | Other | |
| | Services | | | Services | | | Services | | | Services | | | Entities | |
Allianz Funds | | $ | 500,000 | | | $ | 500,000 | | | $ | 500,000 | | | $ | 500,000 | | | $ | 500,000 | |
The Korea Fund, Inc. | | $ | 150,000 | | | $ | 150,000 | | | $ | 150,000 | | | $ | 150,000 | | | $ | 150,000 | |
Allianz Global Investors Sponsored Closed End Funds | | $ | 500,000 | | | $ | 500,000 | | | $ | 500,000 | | | $ | 500,000 | | | $ | 500,000 | |
Allianz Funds Multi-Strategy Trust | | $ | 500,000 | | | $ | 500,000 | | | $ | 500,000 | | | $ | 500,000 | | | $ | 500,000 | |
Premier Multi-Series VIT | | $ | 500,000 | | | $ | 500,000 | | | $ | 500,000 | | | $ | 500,000 | | | $ | 500,000 | |
AllianzGI Institutional Multi-Series Trust | | $ | 500,000 | | | $ | 500,000 | | | $ | 500,000 | | | $ | 500,000 | | | $ | 500,000 | |
| | e) | 2. No services were approved pursuant to the procedures contained in paragraph (C) (7) (i) (C) of Rule 2-01 of Registration S-X. |
| | g) | Non-audit fees. The aggregate non-audit fees billed by the Auditor for services rendered to the Registrant, and rendered to the Adviser, for the 2017 Reporting Period was $4,601,557 and for the 2018 Reporting Period was $3,768,240. |
| | h) | Auditor Independence. The Registrant’s Audit Oversight Committee has considered whether the provision of non-audit services that were rendered to the Adviser which were not pre-approved is compatible with maintaining the Auditor’s independence. |
| ITEM 5. | AUDIT COMMITTEE OF LISTED REGISTRANT |
The Fund has a separately designated standing audit committee established in accordance with Section 3(a)(58)(A) of the Securities Exchange Act of 1934. The audit committee of the Fund is comprised of Hans W. Kertess, Alan Rappaport, William B. Ogden, IV, James A. Jacobson, Bradford K. Gallagher, F. Ford Drummond, James S. MacLeod, Davey S. Scoon and Deborah A. DeCotis.
| (a) | Schedule of Investments is included as part of the report to shareholders filed under Item 1 of this form. |
| ITEM 7. | DISCLOSURE OF PROXY VOTING POLICIES AND PROCEDURES FOR CLOSED-END MANAGEMENT INVESTMENT COMPANIES |
ALLIANZGI CONVERTIBLE & INCOME 2024 TARGET TERM FUND (“CBH”)
ALLIANZGI CONVERTIBLE & INCOME FUND (NCV)
ALLIANZGI CONVERTIBLE & INCOME FUND II (NCZ)
(each a “TRUST”)
PROXY VOTING POLICY
| 1. | It is the policy of each Trust that proxies should be voted in the interest of its shareholders, as determined by those who are in the best position to make this determination. Each Trust believes that the firms and/or persons purchasing and selling securities for the Trust and analyzing the performance of the Trust’s securities are in the best position and have the information necessary to vote proxies in the best interests of the Trust and its shareholders, including in situations where conflicts of interest may arise between the interests of shareholders, on one hand, and the interests of the investment adviser, a sub-adviser and/or any other affiliated person of the Trust, on the other. Accordingly, each Trust’s policy shall be to delegate proxy voting responsibility to the entity with portfolio management responsibility for the Trust. |
| 2. | Each Trust delegates the responsibility for voting proxies to Allianz Global Investors U.S. LLC (“AllianzGI US”). A summary of the detailed proxy voting policy of AllianzGI US is attached as Appendix A hereto. Such summary may be revised from time to time to reflect changes to AllianzGI US’s detailed proxy voting policy. |
| 3. | The party voting the proxy (i.e., AllianzGI US) shall vote such proxies in accordance with such party’s proxy voting policy and, to the extent consistent with such policy, may rely on information and/or recommendations supplied by others. |
| 4. | AllianzGI US shall deliver a copy of its proxy voting policy and any material amendments thereto to the applicable Board of the Trust promptly after the adoption or amendment of any such policy. |
| 5. | The party voting the proxy shall: (i) maintain such records and provide such voting information as is required for the Trust’s regulatory filings including, without limitation, Form N-PX and the required disclosure of policy called for by Item 18 of Form N-2 and Item 7 of Form N-CSR; and (ii) shall provide such additional information as may be requested, from time to time, by the Board or the Trust’s Chief Compliance Officer. |
| 6. | This Proxy Voting Policy Statement, a summary of the detailed proxy voting policy of AllianzGI US, and how each Trust voted proxies relating to portfolio securities held during the most recent twelve month period ending June 30, shall be made available (i) without charge, upon request, by calling 1-800-254-5197; (ii) on the Trusts’ website at us.allianzgi.com; and (iii) on the U.S. Securities and Exchange Commission’s (“SEC’s”) website at www.sec.gov. In addition, to the extent required by applicable law or determined by the Trust’s Chief Compliance Officer or Board of Trustees, a summary of the detailed proxy voting policy of AllianzGI US shall also be included in the Trust’s Registration Statement or Form N-CSR filings. |
Appendix A
Allianz Global Investors U.S. LLC (“AllianzGI US”)
Description of Proxy Voting Policy and Procedures
AllianzGI US typically votes proxies as part of its discretionary authority to manage accounts, unless the client has explicitly reserved the authority for itself. When voting proxies, AllianzGI US seeks to make voting decisions solely in the best interests of its clients and to enhance the economic value of the underlying portfolio securities held in its clients’ accounts.
AllianzGI US has adopted the Allianz Global Investors Global Corporate Governance Guidelines and Proxy Voting Policy (the “Proxy Guidelines”) that are reasonably designed to ensure that the firm is voting in the best interest of its clients. The Proxy Guidelines set forth AllianzGI US’s policies and procedures with regards to proxy voting and reflect AllianzGI US’s general voting positions on specific corporate governance issues. For the purpose of voting proxies for all accounts of AllianzGI US, AllianzGI US uses the services of its affiliate, Allianz Global Investors GmbH (“AllianzGI GmbH”). The employees of AllianzGI GmbH who provide proxy voting services to AllianzGI US are considered “associated persons” as that term is defined in the Advisers Act. AllianzGI has retained an independent third party service provider (the “Proxy Provider”) to assist in the proxy voting process by implementing the votes in accordance with the Proxy Guidelines as well as assisting in the administrative process. The Proxy Provider offers a variety of proxy-related services to assist in AllianzGI US’s handling of proxy voting responsibilities.
The Proxy Guidelines also provide for oversight of the proxy voting process by a proxy committee comprised of senior representatives from various functions within the organization (“Proxy Committee”). The Proxy Guidelines summarize AllianzGI US’s position on various issues, including issues of corporate governance and corporate actions, and give general indication as to how AllianzGI US will vote shares on such issues. Under certain circumstances, AllianzGI US may not vote proxies in accordance with the standard positions denoted in to the Proxy Guidelines, for example if: (1) the Proxy Guidelines do not cover potential voting issues, (2) AllianzGI US determines there may be a potential material conflict between AllianzGI US’s interest and those of a client with respect to proxy voting and (3) the Proxy Committee has
determined that voting otherwise would be in the best interests of AllianzGI US’s clients . In evaluating issues, the Proxy Committee may consider information from many sources, including the portfolio management team, the analyst responsible for monitoring the stock of the company at issue, management of a company presenting a proposal, shareholder groups and independent proxy research services. In the event that either the analyst or portfolio manager wishes to override the Proxy Guidelines, the proposal will be presented to the Proxy Committee for a final decision. Any deviations from the Proxy Guidelines will be documented and maintained in accordance with Rule 204-2 under the Advisers Act.
In certain circumstances, a client may request in writing that AllianzGI US vote proxies for its account in accordance with a set of guidelines which differs from the Proxy Guidelines. For example, a client may wish to have proxies voted for its account in accordance with the Taft-Hartley proxy voting guidelines. In that case, AllianzGI US will vote the shares held by such client accounts in accordance with their direction, which may be different from the vote cast for shares held on behalf of other client accounts that vote in accordance with the Proxy Guidelines.
AllianzGI US will generally refrain from voting proxies on securities that are subject to share blocking restrictions. Certain countries require the freezing of shares for trading purposes at the custodian/sub-custodian bank level in order to vote proxies to ensure that shareholders voting at meetings continue to hold the shares through the actual shareholder meeting. However, because AllianzGI US cannot anticipate every proxy proposal that may arise (including a proxy proposal that an analyst and/or portfolio manager believes has the potential to significantly affect the economic value of the underlying security, such as proxies relating to mergers and acquisitions), AllianzGI US may, from time to time, instruct the Proxy Provider to cast a vote for a proxy proposal in a share blocked country. AllianzGI US will not be responsible for voting of proxies that AllianzGI US has not been notified on a timely basis by the client’s custodian.
In accordance with the Proxy Guidelines, AllianzGI US may review additional criteria associated with voting proxies and evaluate the expected benefit to its clients when making an overall determination on how or whether to vote a proxy. In addition, AllianzGI US may refrain from voting a proxy on behalf of its clients’ accounts due to de-minimis holdings, immaterial impact on the portfolio, items relating to non-U.S. issuers (such as those described below), non- discretionary holdings not covered by AllianzGI US, timing issues related to the opening/closing
of accounts, securities lending issues (see below), contractual arrangements with clients and/or their authorized delegate, the timing of receipt of information, or where circumstances beyond its control prevent it from voting. For example, AllianzGI US may refrain from voting a proxy of a non-U.S. issuer due to logistical considerations that may impair AllianzGI US’s ability to vote the proxy. These issues may include, but are not limited to: (i) proxy statements and ballots being written in a language other than English, (ii) untimely notice of a shareholder meeting, (iii) requirements to vote proxies in person, (iv) restrictions on non-U.S. person’s ability to exercise votes, (v) restrictions on the sale of securities for a period of time in proximity to the shareholder meeting, or (vi) requirements to provide local agents with power of attorney to facilitate the voting instructions. Such proxies are voted on a best-efforts basis.
AllianzGI US typically votes proxies as part of its discretionary authority to manage Wrap Program accounts, unless a client has indicated to the Sponsor that it has explicitly reserved the authority to vote proxies for itself. AllianzGI US will generally vote all proxies sent to it by the Sponsor on an aggregate basis. When AllianzGI US votes proxies on an aggregate basis, the proxy voting records are generally available only on an aggregate level and are not maintained on an individual account basis.
If a client has decided to participate in a securities lending program, AllianzGI US will defer to the client’s determination and not attempt to recall securities on loan solely for the purpose of voting routine proxies as this could impact the returns received from securities lending and make the client a less desirable lender in the marketplace. If the participating client requests, AllianzGI US will use reasonable efforts to notify the client of proxy measures that AllianzGI US deems material.
The ability to timely identify material events and recommend recall of shares for proxy voting purposes is not within the control of AllianzGI US and requires the cooperation of the client and its other service providers. Efforts to recall loaned securities are not always effective and there can be no guarantee that any such securities can be retrieved in a timely manner for purposes of voting the securities.
| ITEM 8. | PORTFOLIO MANAGERS OF CLOSED-END MANAGEMENT INVESTMENT COMPANIES |
(a)(1)
As of May 1, 2018, the following individuals have primary responsibility for the day-to-day implementation of the AllianzGI AllianzGI Convertible & Income Fund II (“NCZ”):
Douglas G. Forsyth, CFA
Managing Director, Chief Investment Officer, US Income & Growth Strategies
Mr. Forsyth, CFA, is a portfolio manager, a managing director and CIO US Income & Growth Strategies with Allianz Global Investors, which he joined in 1994. He is the head of the Income and Growth Strategies team. Mr. Forsyth has portfolio management, trading and research responsibilities, and oversees all aspects of the Income and Growth platform’s business, including product development and implementation. He has 26 years of investment-industry experience. Mr. Forsyth was previously an analyst at AEGON USA. He has a B.B.A. from The University of Iowa.
Justin Kass, CFA
Managing Director, Portfolio Manager
Mr. Kass, CFA, is a portfolio manager and managing director with Allianz Global Investors, which he joined in 2000. He has portfolio management and research responsibilities for the Income and Growth Strategies team. Mr. Kass has 20 years of investment-industry experience. He has a B.S. from the University of California, Davis, and an M.B.A. from the UCLA Anderson School of Management.
(a) (2) AllianzGI US
The following summarizes information regarding each of the accounts, excluding the Fund, that were managed by the Portfolio Managers as of February 28, 2018 including accounts managed by a team, committee, or other group that includes the Portfolio Managers.
| | | | | | | | | | | | | | | | | | | | | | | | |
| | | Other RICs | | | Other Accounts | | | Other Pooled | |
PM | | # | | | AUM ($million) | | | # | | | AUM ($million) | | | # | | | AUM ($million) | |
Douglas G. Forsyth, CFA | | | 9 | | | | 7,935 | | | | 10 | | | | 753 | * | | | 29 | | | | 33,418 | ** |
Justin Kass, CFA | | | 8 | | | | 6,750 | | | | 5 | | | | 343 | | | | 22 | | | | 30,256 | |
| * | Of the Other Accounts, one account totaling $58 million in assets pays an advisory fee that is based on the performance of the account. |
| ** | Of the Other Pooled Investment Vehicles, six accounts totaling $2,021 million pay an advisory fee that is based in part on the performance of the accounts. |
AllianzGI US
Potential Conflicts of Interest
Like other investment professionals with multiple clients, a portfolio manager for a Fund may face certain potential conflicts of interest in connection with managing both the Portfolio and other accounts at the same time. The paragraphs below describe some of these potential conflicts, which AllianzGI US believes are faced by investment professionals at most major financial firms.
AllianzGI US has adopted compliance policies and procedures that address certain of these potential conflicts. The management of accounts with different advisory fee rates and/or fee structures, including accounts that pay advisory fees based on account performance (“performance fee accounts”), may raise potential conflicts of interest by creating an incentive to favor higher- fee accounts. These potential conflicts may include, among others:
| | • | | The most attractive investments could be allocated to higher-fee accounts or performance fee accounts. |
| | • | | The trading of higher-fee accounts could be favored as to timing and/or execution price. For example, higher -fee accounts could be permitted to sell securities earlier than other accounts when a prompt sale is desirable or to buy securities at an earlier and more opportune time. |
| | • | | The investment management team could focus their time and efforts primarily on higher-fee accounts due to a personal stake in compensation. |
When AllianzGI US considers the purchase or sale of a security to be in the best interests of a Fund as well as other accounts, AllianzGI US’s trading desk may, to the extent permitted by applicable laws and regulations, aggregate the securities to be sold or purchased. Aggregation of trades may create the potential for unfairness to a Fund or another account if one account is favored over another in allocating the securities purchased or sold—for example, by allocating a disproportionate amount of a security that is likely to increase in value to a favored account. AllianzGI US considers many factors when allocating securities among accounts, including the account’s investment style, applicable investment restrictions, availability of securities, available cash and other current holdings. AllianzGI US attempts to allocate investment opportunities among accounts in a fair and equitable manner. However, accounts are not assured of participating equally or at all in particular investment allocations due to such factors as noted above.
“Cross trades,” in which one AllianzGI US account sells a particular security to another account (potentially saving transaction costs for both accounts), may also pose a potential conflict of interest when cross trades are effected in a manner perceived to favor one client over another. For example, AllianzGI US may cross a trade between performance fee account and a fixed fee account that results in a benefit to the performance fee account and a detriment to the fixed fee account. AllianzGI US has adopted compliance procedures that provide that all cross trades are to be made at an independent current market price, as required by law.
Another potential conflict of interest may arise from the different investment objectives and strategies of a Fund and other accounts. For example, another account may have a shorter-term investment horizon or different investment objectives, policies or restrictions than a Portfolio. Depending on another account’s objectives or other factors, a portfolio manager may give advice and make decisions that may differ from advice given, or the timing or nature of decisions made, with respect to a Fund. In addition, investment decisions are subject to suitability for the particular account involved. Thus, a particular security may not be bought or sold for certain accounts even though it was bought or sold for other accounts at the same time. More rarely, a particular security may be bought for one or more accounts managed by a portfolio manager when one or more other accounts are selling the security (including short sales). There may be circumstances when purchases or sales of portfolio securities for one or more accounts may have an adverse effect on other accounts. AllianzGI US maintains trading policies designed to provide portfolio managers an opportunity to minimize the effect that short sales in one portfolio may have on holdings in other portfolios.
A portfolio manager who is responsible for managing multiple funds and/or accounts may devote unequal time and attention to the management of those funds and/or accounts. As a result, the portfolio manager may not be able to formulate as complete a strategy or identify equally attractive investment opportunities for each of those accounts as might be the case if he or she were to devote substantially more attention to the management of a single fund. The effects of this potential conflict may be more pronounced where funds and/or accounts overseen by a particular portfolio manager have different investment strategies.
A Portfolio’s portfolio manager(s) may be able to select or influence the selection of the broker/dealers that are used to execute securities transactions for the Fund. In addition to executing trades, some brokers and dealers provide AllianzGI US with brokerage and research services (as those terms are defined in Section 28(e) of the Securities Exchange Act of 1934), which may result in the payment of higher brokerage fees than might have otherwise be available. These services may be more beneficial to certain funds or accounts than to others. In order to be assured of continuing to receive services considered of value to its clients, AllianzGI US has adopted a brokerage allocation policy embodying the concepts of Section 28(e) of the Securities Exchange Act of 1934. Although the payment of brokerage commissions is subject to the requirement that the portfolio manager determine in good faith that the commissions are reasonable in relation to the value of the brokerage and research services provided to the Fund and the Sub-Adviser’s other clients, a portfolio manager’s decision as to the selection of brokers and dealers could yield disproportionate costs and benefits among the funds and/or accounts that he or she manages.
A Fund’s portfolio manager(s) may also face other potential conflicts of interest in managing a Portfolio, and the description above is not a complete description of every conflict that could be deemed to exist in managing both the Portfolios and other accounts. In addition, a Fund’s portfolio manager may also manage other accounts (including their personal assets or the assets of family members) in their personal capacity.
AllianzGI US’s investment personnel, including each Fund’s portfolio manager, are subject to restrictions on engaging in personal securities transactions pursuant to AllianzGI US’s Code of Business Conduct and Code of Ethics (the “Code”), which contain provisions and requirements designed to identify and address conflicts of interest
between personal investment activities and the interests of the Fund. The Code is designed to ensure that the personal securities transactions, activities and interests of the employees of AllianzGI US will not interfere with (i) making decisions in the best interest of advisory clients (including the Portfolios) or (ii) implementing such decisions while, at the same time, allowing employees to invest for their own accounts.
(a) (3)
Compensation Structure for AllianzGI US
As of February 28, 2018 the following explains the compensation structure of each individual who shares primary responsibility for day-to-day portfolio management of the Fund:
The compensation system is designed to support the organization’s corporate values and culture. While acknowledging the importance of financial incentives and seeking to pay top quartile compensation for top quartile performance, AllianzGI US also believes that compensation is only one of a number of critically important elements that allow the emergence of a strong, winning culture that attracts, retains and motivates talented investors and teams. AllianzGI US’s compensation system supports its belief that investment professionals are a key element of the company’s success in meeting clients’ objectives. To the extent that there are regional experts located in other AllianzGI US-affiliated offices worldwide who are “associated persons” of AllianzGI US and who serve as portfolio managers for certain of the Funds, this compensation strategy is applied independently by the AllianzGI US-affiliated company that employs such a portfolio manager. In such cases, AllianzGI US compensates the employing company through an affiliated transfer pricing arrangement that takes into account the value placed by AllianzGI US on the shared service of the portfolio manager.
The primary components of compensation are the base salary and an annual variable compensation payment. Base salary typically reflects scope, responsibilities and experience required in a particular role, be it on the investment side or any other function in the company. Base compensation is regularly reviewed against peers with the help of compensation survey data. Base compensation is typically a greater percentage of total compensation for more junior positions, while for the most senior roles it is typically a comparatively small component, often capped and only adjusted every few years.
The variable compensation component typically comprises a cash bonus that pays out immediately after the performance year as well as a deferred component, for members of staff whose variable compensation exceeds a certain threshold. Except for certain specialist investment teams as noted below, variable compensation is determined on a discretionary basis and is primarily designed to reflect the achievements of an individual against set goals, over a certain time period. For an investment professional these goals will typically be 70% quantitative and 30% qualitative. The former will reflect a weighted average of investment performance over a three-year rolling time period (one-year (25%) and three year (75%) results) and the latter reflects contributions to broader team goals, contributions made to client review meetings, product development or product refinement initiatives. Portfolio managers have their performance metric aligned with the benchmarks of the client portfolios they manage.
Variable compensation for certain specialist investment teams including AllianzGI US Income & Growth and Structured Products is determined on a formulaic basis. These teams share a percentage of advisory fee revenue including performance fee revenue, if applicable, generated by the investment strategy.
After consultation and oversight from the firm’s compensation committee, the lead portfolio manager allocates the team’s share of the shared revenue to the individual team members. Allocation to individual team members is determined based on individual performance and contribution to the team and client success. All team members have agreed upon performance objectives to serve as a basis for performance evaluation during the year. These objectives are both quantitative and qualitative in nature. Quantitative objectives typically align to investment
performance and client-stated objectives. Qualitative objectives reflect contributions to broader team goals, such as idea sharing, contributions made to client review meetings, product development or product refinement initiatives, and the way behaviors reflect AllianzGI US’s core values of excellence, passion, integrity and respect. For all investment professionals, a 360 degree feedback evaluation forms part of the qualitative input. Achievement against these goals as measured by the lead portfolio manager and Chief Investment Officer serve to link performance to compensation. Notwithstanding the basis for determining variable compensation, all compensation principles, including the deferral rules and deferred instruments described below, apply.
As noted above, variable compensation includes a deferral component. The deferred component for most recipients would be a notional award of the Long Term Incentive Program (“LTIP”); for members of staff whose variable compensation exceeds an additional threshold, the deferred compensation is itself split 50%/50% between the LTIP and a Deferral into Funds program (“DIF”). Deferral rates increase in line with the overall variable compensation and can reach up to 42%. Overall awards, splits, components and deferral percentages are regularly reviewed to ensure they are competitive and, where applicable, comply with regulatory standards.
The LTIP element of the variable compensation cliff vests three years after each (typically annual) award. Its value is directly tied to the operating profit of Allianz Global Investors.
The DIF element of the variable compensation cliff vests three years after each (typically annual) award and enables qualifying members of staff to invest in a range of Allianz Global Investors’ funds. Investment professionals are encouraged to invest into their own funds or funds of a similar nature to those that they manage. The value of the DIF award is determined by the performance of the fund over the three-year period covering each award.
Assuming an annual deferral of 33% over a three year period, a typical member of staff will have roughly one year’s variable compensation (3x33%) as a deferred component ‘in the bank’. Three years after the first award, and for as long as deferred components were awarded without break, cash payments in each year will consist of the annual cash bonus for that current year’s performance as well as a payout from LTIP/DIF commensurate with the prior cumulative three-year performance.
In addition to competitive compensation, the firm’s approach to retention includes providing a challenging career path for each professional, a supportive culture to ensure each employee’s progress and a full benefits package.
(a)(4)
The following summarizes the dollar range of securities each portfolio manager for the Fund beneficially owned of the Fund that he managed as of February 28, 2018.
| | |
| AllianzGI Convertible & Income Fund II |
| | |
| | | PM Ownership |
Douglas G. Forsyth | | None |
Justin Kass | | None |
ITEM 9. PURCHASES OF EQUITY SECURITIES BY CLOSED-END MANAGEMENT INVESTMENT COMPANY AND AFFILIATED COMPANIES
None.
| ITEM 10. | SUBMISSION OF MATTERS TO A VOTE OF SECURITY HOLDERS |
There have been no material changes to the procedures by which shareholders may recommend nominees to the Fund’s Board of Trustees since the Fund last provided disclosure in response to this item.
| ITEM 11. | CONTROLS AND PROCEDURES |
| (a) | The registrant’s President and Chief Executive Officer and Treasurer, Principal Financial & Accounting Officer have concluded that the registrant’s disclosure controls and procedures (as defined in Rule 30a-3(c) under the Act (17 CFR 270.30a-3(c))), are effective based on their evaluation of these controls and procedures as of a date within 90 days of the filing date of this document. |
| (b) | There were no significant changes in the registrant’s internal control over financial reporting (as defined in Rule 30a-3(d) under the Act (17 CFR 270.30a-3(d))) that occurred during the second fiscal quarter of the period covered by this report that has materially affected, or is reasonably likely to materially affect, the registrant’s internal control over financial reporting. |
| | |
| |
| (a) (1) | | Exhibit 99.CODE ETH—Code of Ethics |
| |
| (a) (2) | | Exhibit 99_ Cert.—Certification pursuant to Section 302 of the Sarbanes-Oxley Act of 2002 |
| |
| (a) (3) | | Not applicable |
| |
| (b) | | Exhibit 99.906 Cert.—Certification pursuant to Section 906 of the Sarbanes-Oxley Act of 2002 |
Signatures
Pursuant to the requirements of the Securities Exchange Act of 1934 and the Investment Company Act of 1940, the registrant has duly caused this report to be signed on its behalf by the undersigned, thereunto duly authorized.
| | |
| Registrant: AllianzGI Convertible & Income Fund II |
| |
| By: | | /s/ Thomas J. Fuccillo |
| Thomas J. Fuccillo |
| President & Chief Executive Officer |
|
| Date: May 1, 2018 |
| |
| By: | | /s/ Scott Whisten |
| Scott Whisten |
| Treasurer, Principal Financial & Accounting Officer |
|
| Date: May 1, 2018 |
Pursuant to the requirements of the Securities Exchange Act of 1934 and the Investment Company Act of 1940, this report has been signed below by the following persons on behalf of the registrant and in the capacities and on the dates indicated.
| | |
| By: | | /s/ Thomas J. Fuccillo |
| Thomas J. Fuccillo |
| President & Chief Executive Officer |
|
| Date: May 1, 2018 |
| |
| By: | | /s/ Scott Whisten |
| Scott Whisten |
| Treasurer, Principal Financial & Accounting Officer |
|
| Date: May 1, 2018 |