Table of Contents
UNITED STATES
SECURITIES AND EXCHANGE COMMISSION
Washington, D.C. 20549
FORMN-CSR
CERTIFIED SHAREHOLDER REPORT OF REGISTERED
MANAGEMENT INVESTMENT COMPANIES
Investment Company Act file number:811-21338
AllianzGI Convertible & Income Fund II
(Exact name of registrant as specified in charter)
| 1633 Broadway, New York, NY | 10019 | |
| (Address of principal executive offices) | (Zip code) |
Scott Whisten – 1633 Broadway, New York, New York 10019
(Name and address of agent for service)
Registrant’s telephone number, including area code:212-739-3367
Date of fiscal year end: February 28
Date of reporting period: August 31, 2019
Table of Contents
Item 1. Report to Shareholders
AllianzGI Convertible & Income 2024 Target Term Fund
AllianzGI Convertible & Income Fund
AllianzGI Convertible & Income Fund II
Semi-Annual Report
August 31, 2019
Beginning on January 1, 2021, as permitted by regulations adopted by the U.S. Securities and Exchange Commission, paper copies of shareholder reports will no longer be sent by mail, unless you specifically request paper copies of the reports. Instead, the reports will be made available on the Funds’ website (us.allianzgi.com), and you will be notified by mail each time a report is posted and provided with a website link to access the report.
If you already elected to receive shareholder reports electronically, you will not be affected by this change and you need not take any action. You may elect to receive shareholder reports and other communications from a Fund electronically anytime by contacting your financial intermediary (such as a broker-dealer or bank) or, if you are a direct investor, by enrolling at us.allianzgi.com/edelivery.
If you prefer to receive paper copies of your shareholder reports after January 1, 2021, direct investors may inform a Fund at any time. If you invest through a financial intermediary, you should contact your financial intermediary directly. Paper copies are provided free of charge and your election to receive reports in paper will apply to all funds held with the fund complex if you invest directly with a Fund or all funds held in your account if you invest through your financial intermediary.


Table of Contents
Table of Contents

Thomas J. Fuccillo
President & Chief Executive Officer
Dear Shareholder:
The US economic expansion continued during the six-month fiscal reporting period ended August 31, 2019, although the pace moderated. Economic growth overseas also weakened. Over this period, global equities generated mixed results. Meanwhile, the overall US bond market rallied sharply during the period.
For the six month reporting period ended August 31, 2019
| ∎ | AllianzGI Convertible & Income 2024 Target Term Fund returned 3.30% on net asset value (“NAV”) and 7.25% on market price. |
| ∎ | AllianzGI Convertible & Income Fund returned 6.06% on NAV and -5.65% on market price. |
| ∎ | AllianzGI Convertible & Income Fund II returned 5.82% on NAV and -3.27% on market price. |
During the six-month period ended August 31, 2019, the Standard & Poor’s (“S&P”) 500 Index, an unmanaged index generally representative of the US stock market, returned 6.15% and the ICE BofA Merrill Lynch High Yield Master II Index, an unmanaged index generally representative of the high yield bond market, returned 4.51%. Convertible securities, which share characteristics of both stocks and bonds, generated more modest results. The ICE BofA Merrill Lynch All Convertibles-All Qualities Index, an unmanaged index generally representative of the convertible securities market, returned 4.32%.
Turning to the US economy, gross domestic product (“GDP”), the value of goods and services produced in the country, the broadest measure of economic activity and the principal indicator of economic performance, expanded at a 3.1% annual pace during the first quarter of 2019. The Commerce Department’s final reading showed that the economy expanded at a 2.0% annual pace in the second quarter of the year.
Before the reporting period, the US Federal Reserve (the “Fed”) raised rates four times in 2018, with the last hike pushing the federal funds rate to a range between 2.25% and 2.50%. However, at its January 2019 meeting, the Fed indicated that it expected to pause from tightening monetary policy as it monitored incoming economic data. Then, at its June 2019 meeting, the Federal Open Market Committee (the “Committee”) communicated that it “continues to view sustained expansion of economic activity, strong labor market conditions, and inflation near the Committee’s symmetric 2 percent objective as the most likely outcomes, but uncertainties about this outlook have increased.” As expected, at its meeting that concluded on July 31, 2019, the Fed lowered the federal funds rate
| 2 | Semi-Annual Report | | August 31, 2019 |
Table of Contents
to a range between 2.00% and 2.25%. This was the Fed’s first rate cut since 2008. Finally, on September 18, 2019, after the reporting period ended, the Fed lowered the federal funds rate to a range between 1.75% and 2.00%.
Outlook
After a strong start to 2019, the markets abruptly turned volatile in the second quarter. In our opinion, the global economy looks increasingly fragmented, and our outlook calls for more unease over trade tensions and politics.
Receive this report electronically and eliminate paper mailings.
To enroll, visit
us.allianzgi.com/edelivery.
The outcome of US-China trade negotiations still seems uncertain, even after the partial deal signed by both countries in October 2019. Without a complete deal, US tariffs could expand into consumer-oriented areas, potentially increasing the prices of imported goods. We expect that the Fed will watch inflation closely, especially if more trade tariffs are implemented. In our opinion, the Fed may be less inclined to keep rates low if inflation moves higher, which could undermine support for high stock prices. Still, while the US economy remains late-cycle, it isn’t yet facing a recession.
Support for mainstream pro-European parties held up in recent European Parliamentary elections, but we believe the legislative body will likely end up more fragmented and decision-making could slow. Meanwhile, in the UK, economic and corporate uncertainty is being prolonged by the extension of the Brexit deadline until October 31, 2019. The election of a new Prime Minister raises additional questions about the future path of Brexit and policymaking overall.
With political uncertainty high, investors might consider pivoting towards income-generating investments — but with low to negative yields on many bonds and cash, we believe that the biggest risk is still to take no risk. In our view, taking an active approach to investing will be important. This approach could involve watching out for high-priced assets and to take contrarian positions when attractive valuations can be found.
On behalf of Allianz Global Investors U.S. LLC, the Funds’ investment manager, thank you for investing with us. We encourage you to consult with your financial advisor and to visit our website, us.allianzgi.com/closedendfunds, for additional information. We remain dedicated to serving your investment needs.
Sincerely,
 |
| Thomas J. Fuccillo |
| President & Chief Executive Officer |
| August 31, 2019 | | Semi-Annual Report | 3 |
Table of Contents
AllianzGI Convertible & Income 2024 Target Term Fund / AllianzGI Convertible & Income Fund /AllianzGI Convertible & Income Fund II
August 31, 2019 (unaudited)
AllianzGI Convertible & Income 2024 Target Term Fund
For the period of March 1, 2019, through August 31, 2019, as provided by Douglas G. Forsyth, CFA, Managing Director, Portfolio Manager.
For the six-month period ended August 31, 2019, the AllianzGI Convertible & Income 2024 Target Term Fund (the “Fund”) returned 3.30% on net asset value (“NAV”) and 7.25% on market price.
Market Environment
The convertible, high-yield bond, and senior secured loan markets produced positive returns over the reporting period. Convertible bonds were positively impacted by underlying equity strength. High-yield securities were supported by a favorable technical backdrop, continuing to benefit from steady demand as yield-seeking investors faced fewer options with negative-yielding debt globally continuing to grow.
Globally, central banks announced stimulus measures or suggested future accommodation. The US Federal Reserve (the “Fed”) cut interest rates and ended quantitative tightening, citing global developments and muted inflation pressures. Coordinated easing efforts and dovish outlooks pressured global yields.
The second-quarter earnings season concluded and surpassed expectations on both the top- and bottom-lines. According to FactSet Research, 56% of companies beat revenue estimates and 75% of S&P 500 Index companies beat earnings per share estimates.
Economic reports indicated that the growth rate of activity moderated. While the labor market remained strong and consumer spending picked up, business investment was soft and overall inflation was muted.
In August 2019, geopolitical risks, including the reescalation of the US/Chinese trade conflict and the inversion of the US Treasury yield curve (2-10-year), caused investor angst.
Portfolio Specifics
The Fund benefited from exposure to convertibles, high-yield bonds, and senior secured loans. In addition to providing a positive total return, the Fund also provided a high level of income over the reporting period.
In the convertible sleeve of the Fund’s portfolio, sectors that contributed positively to performance included technology, financials, and consumer discretionary. On the other hand, healthcare, energy, and transportation pressured performance.
In the high yield sleeve of the Fund’s portfolio, industries that aided performance included financial services, cable & satellite television, and gaming. Only the energy industry detracted from performance.
In the senior secured loan sleeve of the Fund’s portfolio, the top-contributing industries included technology & electronics, gaming, and capital goods. The top-detracting industries included healthcare and energy.
Outlook
In our opinion, synchronized central bank easing and progress on trade could help to support economic and earnings growth.
| 4 | Semi-Annual Report | | August 31, 2019 |
Table of Contents
AllianzGI Convertible & Income Fund/ AllianzGI Convertible & Income Fund II
For the period of March 1, 2019 through August 31, 2019, as provided by Douglas G. Forsyth, CFA, Portfolio Manager.
For the six-month period ended August 31, 2019, the AllianzGI Convertible & Income Fund returned 6.06% on net asset value (“NAV”) and-5.65% on market price.
For the six-month period ended August 31, 2019, the AllianzGI Convertible & Income Fund II (the “Fund”) returned 5.82% on net asset value (“NAV”) and -3.27% on market price.
Market Environment
The convertible and high-yield bond markets produced positive returns over the reporting period. Convertible bonds were positively impacted by underlying equity strength. High-yield securities were supported by a favorable technical backdrop, continuing to benefit from steady demand as yield-seeking investors faced fewer options with negative-yielding debt globally continuing to grow.
Globally, central banks announced stimulus measures or suggested future accommodation. The US Federal Reserve (the “Fed”) cut interest rates and ended quantitative tightening, citing global developments and muted inflation pressures. Coordinated easing efforts and dovish outlooks pressured global yields.
The second-quarter earnings season concluded and surpassed expectations on both the top-
and bottom-lines. According to FactSet Research, 56% of companies beat revenue estimates and 75% of S&P 500 Index companies beat earnings per share estimates.
Economic reports indicated that the growth rate of activity moderated. While the labor market remained strong and consumer spending picked up, business investment was soft and overall inflation was muted.
In August 2019, geopolitical risks, including the reescalation of the US/Chinese trade conflict and the inversion of the US Treasury yield curve (2-10-year), caused investor angst.
Portfolio Specifics
The Funds benefited from exposure to convertibles and high-yield bonds. In addition to providing a positive total return, the Fund also delivered a high level of income over the reporting period.
In the convertible sleeve of each Fund’s portfolio, sectors that contributed positively to performance included financials, technology, and utilities. On the other hand, industrials, energy, and materials pressured performance.
In the high yield sleeve of each Fund’s portfolio, industries that aided performance included financial services, support-services, and healthcare. The energy and media industries detracted from performance.
Outlook
In our opinion, synchronized central bank easing and progress on trade could help to support economic and earnings growth.
| August 31, 2019 | | Semi-Annual Report | 5 |
Table of Contents
AllianzGI Convertible & Income 2024 Target Term Fund
August 31, 2019 (unaudited)
| Total Return(1): | Market Price | NAV | ||||||
Six Month | 7.25% | 3.30% | ||||||
1 Year | 6.94% | 3.74% | ||||||
Commencement of Operations (6/30/17) to 8/31/19 | 2.78% | 5.16% | ||||||
| Market Price/NAV Performance: | ||
Commencement of Operations (6/30/17) to 8/31/19
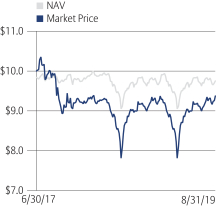
| Market Price/NAV: | ||||
Market Price | $9.37 | |||
NAV(2) | $9.75 | |||
Discount to NAV | -3.90% | |||
Market Price Yield(3) | 5.89% | |||
Leverage(4) | 28.14% | |||
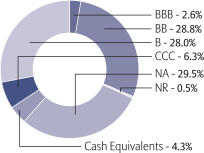
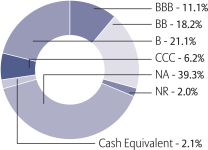
S&P Global Ratings*
(as a % of total investments)
See “Notes to Performance & Statistics” on page 9.
| 6 | Semi-Annual Report | | August 31, 2019 |
Table of Contents
Performance & Statistics
AllianzGI Convertible & Income Fund
August 31, 2019 (unaudited)
| Total Return(1): | Market Price | NAV | ||||||
Six Month | -5.65% | 6.06% | ||||||
1 Year | -11.82% | -0.40% | ||||||
5 Year | 0.44% | 2.29% | ||||||
10 Year | 9.00% | 9.57% | ||||||
Commencement of Operations (3/31/03) to 8/31/19 | 6.74% | 7.26% | ||||||
| Market Price/NAV Performance: | ||
Commencement of Operations (3/31/03) to 8/31/19
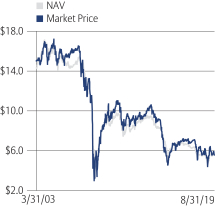
| Market Price/NAV: | ||||
Market Price | $5.56 | |||
NAV(2) | $5.61 | |||
Discount to NAV | -0.89% | |||
Market Price Yield(3) | 6.39% | |||
Leverage(5) | 41.11% | |||
S&P Global Ratings*
(as a % of total investments)

See “Notes to Performance & Statistics” on page 9.
| August 31, 2019 | | Semi-Annual Report | 7 |
Table of Contents
Performance & Statistics
AllianzGI Convertible & Income Fund II
August 31, 2019 (unaudited)
| Total Return(1): | Market Price | NAV | ||||||
Six Month | -3.27% | 5.82% | ||||||
1 Year | -9.32% | -0.89% | ||||||
5 Year | -0.77% | 2.25% | ||||||
10 Year | 8.77% | 9.60% | ||||||
Commencement of Operations (7/31/03) to 8/31/19 | 5.74% | 6.30% | ||||||
| Market Price/NAV Performance: | ||
Commencement of Operations (7/31/03) to 8/31/19
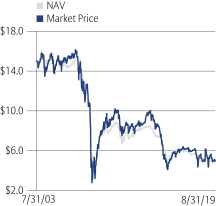
| Market Price/NAV: | ||||
Market Price | $4.98 | |||
NAV(2) | $5.03 | |||
Discount to NAV | -0.99% | |||
Market Price Yield(3) | 6.09% | |||
Leverage(5) | 41.56% | |||
S&P Global Ratings*
(as a % of total investments)
See “Notes to Performance & Statistics” on page 9.
| 8 | Semi-Annual Report | | August 31, 2019 |
Table of Contents
Performance and Statistics
AllianzGI Convertible & Income Funds
August 31, 2019 (unaudited)
Notes to Performance & Statistics:
* Credit ratings apply to the underlying holdings of the Funds and not the Funds themselves and are divided into categories ranging from highest to lowest credit quality, determined for purposes of presentations in this report by using ratings provided by S&P Global Ratings (“S&P”). Presentations of credit ratings information in this report use ratings provided by S&P for this purpose, among other reasons, because of the access to background information and other materials provided by S&P, as well as the Funds’ considerations of industry practice. Bonds not rated by S&P, or bonds that do not have a rating available from S&P, or bonds that had a rating withdrawn by S&P are designated as “NR” or “NA”, respectively. Credit quality ratings assigned by a rating agency are subjective opinions, not statements of fact, and are subject to change periodically, even as frequently as daily. Ratings assigned by S&P or another rating agency are not absolute standards of credit quality and do not evaluate market risk. Rating agencies may fail to make timely changes in credit ratings, and an issuer’s current financial condition may be better or worse than a rating indicates. In formulating investment decisions for the Funds, Allianz Global Investors U.S. LLC develops its own analysis of the credit quality and risks associated with individual debt instruments, rather than relying exclusively on rating agencies or third-party research.
(1)Past performance is no guarantee of future results. Total return is calculated by determining the percentage change in NAV or market price (as applicable) in the specified period. The calculation assumes that all dividends and distributions, if any, have been reinvested. Total return does not reflect broker commissions or sales charges in connection with the purchase or sale of Fund shares. Total return for a period of more than one year represents the average annual total return. Total return for a period of less than one year is not annualized.
Performance at market price will differ from results at NAV. Although market price returns tend to reflect investment results over time, during shorter periods returns at market price can also be influenced by factors such as changing views about the Funds, market conditions, supply and demand for each Fund’s shares, or changes in each Fund’s dividends.
An investment in each Fund involves risk, including the loss of principal. Total return, market price, market price yield and NAV will fluctuate with changes in market conditions. This data is provided for information purposes only and is not intended for trading purposes. Closed-end funds, unlike open-end funds, are not continuously offered. There is a one time public offering and once issued, shares of closed-end funds are traded in the open market through a stock exchange. NAV is equal to total assets attributable to common shareholders less total liabilities divided by the number of common shares outstanding. Holdings are subject to change daily.
(2) The NAV disclosed in the Funds’ financial statements may differ from this NAV due to accounting principles generally accepted in the United States of America.
(3) Market Price Yield is determined by dividing the annualized current monthly dividend per common share (comprised of net investment income) by the market price per common share at August 31, 2019.
(4) Represents amounts drawn under the SSB Facility (as defined herein) (“Leverage”) outstanding, as a percentage of total managed assets as of August 31, 2019. Total managed assets refer to total assets (including assets attributable to Leverage) minus liabilities (other than liabilities representing Leverage).
(5) Represents Preferred Shares and, as applicable, amounts drawn under the SSB Facility (as defined herein) (“Leverage”) outstanding, as a percentage of total managed assets as of August 31, 2019. Total managed assets refer to total assets (including assets attributable to Leverage) minus liabilities (other than liabilities representing Leverage).
| August 31, 2019 | | Semi-Annual Report | 9 |
Table of Contents
AllianzGI Convertible & Income 2024 Target Term Fund
August 31, 2019 (unaudited)
| Principal Amount (000s) | Value | |||||||||||
| Convertible Bonds & Notes – 51.8% | ||||||||||||
| Auto Components – 0.5% | ||||||||||||
| $1,000 | Meritor, Inc., 3.25%, 10/15/37 (j) | $954,344 | ||||||||||
| Auto Manufacturers – 0.6% | ||||||||||||
| 1,000 | Tesla, Inc., 2.00%, 5/15/24 | 979,876 | ||||||||||
| Biotechnology – 3.3% | ||||||||||||
| 2,000 | Insmed, Inc., 1.75%, 1/15/25 | 1,646,036 | ||||||||||
| 2,000 | Intercept Pharmaceuticals, Inc., 3.25%, 7/1/23 | 1,717,500 | ||||||||||
| 3,000 | Ligand Pharmaceuticals, Inc., 0.75%, 5/15/23 | 2,456,594 | ||||||||||
| 5,820,130 | ||||||||||||
| Building Materials – 1.4% | ||||||||||||
| 3,000 | Patrick Industries, Inc., 1.00%, 2/1/23 (g) | 2,559,493 | ||||||||||
| Commercial Services – 2.4% | ||||||||||||
| 1,500 | Cardtronics, Inc., 1.00%, 12/1/20 | 1,466,821 | ||||||||||
| 3,000 | Macquarie Infrastructure Corp., 2.00%, 10/1/23 (j) | 2,726,511 | ||||||||||
| 4,193,332 | ||||||||||||
| Computers – 3.4% | ||||||||||||
| 2,000 | Nutanix, Inc., zero coupon, 1/15/23 | 1,852,365 | ||||||||||
| 2,000 | Pure Storage, Inc., 0.125%, 4/15/23 (j) | 1,967,500 | ||||||||||
| 2,300 | Western Digital Corp., 1.50%, 2/1/24 (a)(c)(j) | 2,172,573 | ||||||||||
| 5,992,438 | ||||||||||||
| Diversified Financial Services – 1.7% | ||||||||||||
| 3,000 | PRA Group, Inc., 3.00%, 8/1/20 | 2,985,735 | ||||||||||
| Energy-Alternate Sources – 5.1% | ||||||||||||
| 3,000 | Pattern Energy Group, Inc., 4.00%, 7/15/20 | 3,134,368 | ||||||||||
| 3,215 | SunPower Corp., 4.00%, 1/15/23 (j) | 2,972,268 | ||||||||||
| 3,000 | Tesla Energy Operations, Inc., 1.625%, 11/1/19 (j) | 2,945,408 | ||||||||||
| 9,052,044 | ||||||||||||
| Engineering & Construction – 1.8% | ||||||||||||
| 1,000 | Dycom Industries, Inc., 0.75%, 9/15/21 (j) | 955,476 | ||||||||||
| 2,500 | Tutor Perini Corp., 2.875%, 6/15/21 (g) | 2,295,141 | ||||||||||
| 3,250,617 | ||||||||||||
| Equity Real Estate Investment Trusts (REITs) – 3.9% | ||||||||||||
| 1,000 | Blackstone Mortgage Trust, Inc., 4.375%, 5/5/22 (j) | 1,042,389 | ||||||||||
| 1,500 | PennyMac Corp., 5.375%, 5/1/20 | 1,522,639 | ||||||||||
| 2,750 | Two Harbors Investment Corp., 6.25%, 1/15/22 | 2,835,942 | ||||||||||
| 1,500 | Western Asset Mortgage Capital Corp., 6.75%, 10/1/22 | 1,506,563 | ||||||||||
| 6,907,533 | ||||||||||||
| Insurance – 1.3% | ||||||||||||
| 2,350 | HCI Group, Inc., 4.25%, 3/1/37 (a) | 2,319,704 | ||||||||||
| Internet – 4.5% | ||||||||||||
| 2,850 | Boingo Wireless, Inc., 1.00%, 10/1/23 (a)(c)(g) | 2,397,869 | ||||||||||
| 3,000 | FireEye, Inc., 1.625%, 6/1/35, Ser. B (j) | 2,843,073 | ||||||||||
| 3,000 | Zillow Group, Inc., 1.50%, 7/1/23 | 2,806,875 | ||||||||||
| 8,047,817 | ||||||||||||
| 10 | Semi-Annual Report | | August 31, 2019 | | See accompanying Notes to Financial Statements |
Table of Contents
Schedule of Investments
AllianzGI Convertible & Income 2024 Target Term Fund
August 31, 2019 (unaudited) (continued)
| Principal Amount (000s) | Value | |||||||||||
| Investment Companies – 1.7% | ||||||||||||
| $1,465 | Prospect Capital Corp., 6.375%, 3/1/25 | $1,550,494 | ||||||||||
| 1,500 | TPG Specialty Lending, Inc., 4.50%, 8/1/22 | 1,564,228 | ||||||||||
| 3,114,722 | ||||||||||||
| Media – 1.5% | ||||||||||||
| 3,000 | DISH Network Corp., 2.375%, 3/15/24 (j) | 2,628,126 | ||||||||||
| Oil, Gas & Consumable Fuels – 2.6% | ||||||||||||
| 1,500 | Ensco Jersey Finance Ltd., 3.00%, 1/31/24 (j) | 1,070,625 | ||||||||||
| 2,000 | Helix Energy Solutions Group, Inc., 4.25%, 5/1/22 | 1,931,250 | ||||||||||
| 2,000 | Oil States International, Inc., 1.50%, 2/15/23 (g) | 1,692,098 | ||||||||||
| 4,693,973 | ||||||||||||
| Pharmaceuticals – 0.7% | ||||||||||||
| 1,450 | Herbalife Nutrition Ltd., 2.625%, 3/15/24 (j) | 1,304,826 | ||||||||||
| Retail – 1.1% | ||||||||||||
| 2,000 | RH, zero coupon, 6/15/23 | 1,963,853 | ||||||||||
| Semiconductors – 2.0% | ||||||||||||
| 2,750 | Synaptics, Inc., 0.50%, 6/15/22 (j) | 2,495,477 | ||||||||||
| 1,300 | Veeco Instruments, Inc., 2.70%, 1/15/23 | 1,144,423 | ||||||||||
| 3,639,900 | ||||||||||||
| Software – 5.0% | ||||||||||||
| 2,500 | Avaya Holdings Corp., 2.25%, 6/15/23 | 2,343,056 | ||||||||||
| 2,500 | Benefitfocus, Inc., 1.25%, 12/15/23 (a)(c) | 2,234,793 | ||||||||||
| 2,000 | �� | Evolent Health, Inc., 2.00%, 12/1/21 | 1,751,567 | |||||||||
| 3,000 | Pluralsight, Inc., 0.375%, 3/1/24 (a)(c) | 2,561,700 | ||||||||||
| 8,891,116 | ||||||||||||
| Telecommunications – 1.5% | ||||||||||||
| 2,500 | Infinera Corp., 2.125%, 9/1/24 (j) | 2,152,792 | ||||||||||
| 500 | Vonage Holdings Corp., 1.75%, 6/1/24 (a)(c)(j) | 552,896 | ||||||||||
| 2,705,688 | ||||||||||||
| Transportation – 5.8% | ||||||||||||
| 3,065 | Air Transport Services Group, Inc., 1.125%, 10/15/24 | 2,871,594 | ||||||||||
| 2,000 | Atlas Air Worldwide Holdings, Inc., 2.25%, 6/1/22 (j) | 1,830,000 | ||||||||||
| 3,000 | Echo Global Logistics, Inc., 2.50%, 5/1/20 | 2,994,829 | ||||||||||
| 2,750 | Greenbrier Cos., Inc., 2.875%, 2/1/24 | 2,553,053 | ||||||||||
| 10,249,476 | ||||||||||||
| Total Convertible Bonds & Notes (cost-$94,417,387) | 92,254,743 | |||||||||||
| Corporate Bonds & Notes – 50.2% | ||||||||||||
| Aerospace & Defense – 1.2% | ||||||||||||
| 2,000 | TransDigm, Inc., 6.50%, 7/15/24 (j) | 2,072,500 | ||||||||||
| Auto Components – 0.7% | ||||||||||||
| 1,227 | American Axle & Manufacturing, Inc., 6.625%, 10/15/22 (j) | 1,240,804 | ||||||||||
| Building Materials – 0.8% | ||||||||||||
| 1,306 | Builders FirstSource, Inc., 5.625%, 9/1/24 (a)(c) | 1,364,770 | ||||||||||
| Chemicals – 0.9% | ||||||||||||
| 1,500 | Chemours Co., 6.625%, 5/15/23 (j) | 1,531,875 | ||||||||||
| Commercial Services – 1.2% | ||||||||||||
| 2,000 | Hertz Corp., 7.625%, 6/1/22 (a)(c)(j) | 2,085,100 | ||||||||||
| See accompanying Notes to Financial Statements | | August 31, 2019 | | Semi-Annual Report | 11 |
Table of Contents
Schedule of Investments
AllianzGI Convertible & Income 2024 Target Term Fund
August 31, 2019 (unaudited) (continued)
| Principal Amount (000s) | Value | |||||||||||
| Computers – 0.9% | ||||||||||||
| $1,500 | Dell International LLC, 7.125%, 6/15/24 (a)(c)(g)(j) | $1,581,338 | ||||||||||
| Diversified Financial Services – 4.3% | ||||||||||||
| 2,251 | CCF Holdings LLC, PIK 10.75%, 10.75%, 12/15/23 (a)(c)(e)(f) | 1,095,565 | ||||||||||
| 2,000 | Community Choice Financial Issuer LLC, 9.00%, 6/15/23 (cost $2,000,000; purchased 9/6/18) (a)(c)(h) | 2,002,500 | ||||||||||
| 2,000 | Navient Corp., 7.25%, 9/25/23 (j) | 2,227,500 | ||||||||||
| 2,000 | Springleaf Finance Corp., 8.25%, 10/1/23 | 2,350,000 | ||||||||||
| 7,675,565 | ||||||||||||
| Engineering & Construction – 0.9% | ||||||||||||
| 1,500 | AECOM, 5.875%, 10/15/24 | 1,625,625 | ||||||||||
| Entertainment – 3.0% | ||||||||||||
| 2,000 | Cedar Fair L.P., 5.375%, 6/1/24 (g) | 2,067,500 | ||||||||||
| 1,500 | International Game Technology PLC, 6.50%, 2/15/25 (a)(c)(j) | 1,653,750 | ||||||||||
| 1,500 | Lions Gate Capital Holdings LLC, 6.375%, 2/1/24 (a)(c)(j) | 1,588,035 | ||||||||||
| 5,309,285 | ||||||||||||
| Food & Beverage – 1.2% | ||||||||||||
| 2,070 | Albertsons Cos. LLC, 6.625%, 6/15/24 | 2,178,675 | ||||||||||
| Hand/Machine Tools – 0.9% | ||||||||||||
| 1,500 | Colfax Corp., 6.00%, 2/15/24 (a)(c) | 1,605,000 | ||||||||||
| Healthcare-Products – 0.6% | ||||||||||||
| 1,000 | Hill-Rom Holdings, Inc., 5.00%, 2/15/25 (a)(c)(j) | 1,032,500 | ||||||||||
| Healthcare-Services – 3.8% | ||||||||||||
| 1,500 | DaVita, Inc., 5.125%, 7/15/24 (j) | 1,529,565 | ||||||||||
| 1,385 | Encompass Health Corp., 5.75%, 11/1/24 | 1,407,506 | ||||||||||
| 1,500 | HCA, Inc., 7.50%, 2/15/22 | 1,683,465 | ||||||||||
| 2,000 | Tenet Healthcare Corp., 8.125%, 4/1/22 (j) | 2,162,300 | ||||||||||
| 6,782,836 | ||||||||||||
| Home Builders – 0.2% | ||||||||||||
| 350 | Lennar Corp., 5.875%, 11/15/24 | 391,563 | ||||||||||
| Lodging – 1.2% | ||||||||||||
| 2,000 | Wynn Las Vegas LLC, 5.50%, 3/1/25 (a)(c)(j) | 2,115,000 | ||||||||||
| Machinery-Construction & Mining – 1.1% | ||||||||||||
| 2,000 | Terex Corp., 5.625%, 2/1/25 (a)(c)(j) | 2,037,640 | ||||||||||
| Media – 5.6% | ||||||||||||
| 1,500 | CCO Holdings LLC, 5.75%, 1/15/24 (j) | 1,537,500 | ||||||||||
| 1,431 | Clear Channel Worldwide Holdings, Inc., 9.25%, 2/15/24 (a)(c)(j) | 1,572,311 | ||||||||||
| 1,500 | CSC Holdings LLC, 6.75%, 11/15/21 | 1,623,750 | ||||||||||
| DISH DBS Corp. (j), | ||||||||||||
| 2,000 | 5.875%, 7/15/22 | 2,077,500 | ||||||||||
| 1,000 | 6.75%, 6/1/21 | 1,055,800 | ||||||||||
| 2,000 | Nexstar Broadcasting, Inc., 5.625%, 8/1/24 (a)(c)(j) | 2,085,000 | ||||||||||
| 9,951,861 | ||||||||||||
| Mining – 4.7% | ||||||||||||
| 2,000 | Alcoa Nederland Holding BV, 6.75%, 9/30/24 (a)(c)(j) | 2,105,000 | ||||||||||
| 2,000 | Constellium SE, 6.625%, 3/1/25 (a)(c)(j) | 2,098,750 | ||||||||||
| 2,000 | Hudbay Minerals, Inc., 7.625%, 1/15/25 (a)(c)(j) | 2,039,960 | ||||||||||
| 2,000 | Joseph T. Ryerson & Son, Inc., 11.00%, 5/15/22 (a)(c)(j) | 2,100,625 | ||||||||||
| 8,344,335 | ||||||||||||
| 12 | Semi-Annual Report | | August 31, 2019 | | See accompanying Notes to Financial Statements |
Table of Contents
Schedule of Investments
AllianzGI Convertible & Income 2024 Target Term Fund
August 31, 2019 (unaudited) (continued)
| Principal Amount (000s) | Value | |||||||||||
| Miscellaneous Manufacturing – 0.8% | ||||||||||||
| $1,500 | Koppers, Inc., 6.00%, 2/15/25 (a)(c) | $1,466,250 | ||||||||||
| Oil, Gas & Consumable Fuels – 4.5% | ||||||||||||
| 2,000 | Callon Petroleum Co., 6.125%, 10/1/24 (j) | 1,950,000 | ||||||||||
| 1,500 | Carrizo Oil & Gas, Inc., 6.25%, 4/15/23 (j) | 1,442,250 | ||||||||||
| 1,500 | Chesapeake Energy Corp., 8.00%, 1/15/25 (j) | 1,143,750 | ||||||||||
| 2,035 | CVR Refining LLC, 6.50%, 11/1/22 (g) | 2,065,525 | ||||||||||
| 1,500 | Oasis Petroleum, Inc., 6.875%, 3/15/22 (j) | 1,402,500 | ||||||||||
| 8,004,025 | ||||||||||||
| Paper & Forest Products – 1.1% | ||||||||||||
| 2,000 | Mercer International, Inc., 7.375%, 1/15/25 | 2,065,000 | ||||||||||
| Real Estate – 0.9% | ||||||||||||
| 1,500 | Kennedy-Wilson, Inc., 5.875%, 4/1/24 | 1,543,125 | ||||||||||
| Retail – 1.1% | ||||||||||||
| 2,000 | Conn’s, Inc., 7.25%, 7/15/22 (j) | 2,000,000 | ||||||||||
| Software – 1.7% | ||||||||||||
| 2,000 | Camelot Finance S.A., 7.875%, 10/15/24 (a)(c) | 2,095,000 | ||||||||||
| 1,000 | Rackspace Hosting, Inc., 8.625%, 11/15/24 (a)(c)(j) | 922,500 | ||||||||||
| 3,017,500 | ||||||||||||
| Telecommunications – 6.3% | ||||||||||||
| 2,000 | CenturyLink, Inc., 7.50%, 4/1/24, Ser. Y (j) | 2,224,960 | ||||||||||
| 2,000 | Cincinnati Bell, Inc., 7.00%, 7/15/24 (a)(c)(j) | 1,835,000 | ||||||||||
| 2,000 | Consolidated Communications, Inc., 6.50%, 10/1/22 (j) | 1,880,000 | ||||||||||
| 1,500 | Hughes Satellite Systems Corp., 7.625%, 6/15/21 (j) | 1,623,750 | ||||||||||
| 1,500 | Intelsat Jackson Holdings S.A., 5.50%, 8/1/23 | 1,372,500 | ||||||||||
| 2,000 | Sprint Corp., 7.125%, 6/15/24 (j) | 2,215,920 | ||||||||||
| 11,152,130 | ||||||||||||
| Transportation – 0.6% | ||||||||||||
| 1,125 | XPO Logistics, Inc., 6.50%, 6/15/22 (a)(c) | 1,152,484 | ||||||||||
| Total Corporate Bonds & Notes (cost-$90,005,086) | 89,326,786 | |||||||||||
| Senior Loans(a)(b) - 31.9% | ||||||||||||
| Aerospace & Defense – 0.8% | ||||||||||||
| 1,489 | TransDigm, Inc., 3 mo. LIBOR + 2.500%, 4.830%, 6/9/23, 2018 Term Loan F | 1,480,714 | ||||||||||
| Airlines – 0.6% | ||||||||||||
| 997 | Allegiant Travel Company, 3 mo. LIBOR + 4.500%, 6.709%, 2/5/24, Term Loan B | 1,000,616 | ||||||||||
| Auto Components – 0.5% | ||||||||||||
| Adient US LLC, 5/6/24, Term Loan B | ||||||||||||
| 750 | 3 mo.LIBOR + 4.250%, 6.889% | 729,960 | ||||||||||
| 250 | 3 mo.LIBOR + 4.250%, 6.459% | 243,320 | ||||||||||
| 973,280 | ||||||||||||
| Automobiles – 0.5% | ||||||||||||
| 915 | Winnebago Industries, Inc., 3 mo. LIBOR + 3.500%, 5.953%, 11/8/23, 2017 Term Loan | 905,194 | ||||||||||
| Chemicals – 0.5% | ||||||||||||
| 839 | PQ Corporation, 3 mo. LIBOR + 2.500%, 4.756%, 2/8/25, 2018 Term Loan B | 839,667 | ||||||||||
| Commercial Services & Supplies – 0.5% | ||||||||||||
| 940 | Advanced Disposal Services, Inc., 1 Week LIBOR + 2.250%, 4.385%, 11/10/23, Term Loan B3 | 942,434 | ||||||||||
| See accompanying Notes to Financial Statements | | August 31, 2019 | | Semi-Annual Report | 13 |
Table of Contents
Schedule of Investments
AllianzGI Convertible & Income 2024 Target Term Fund
August 31, 2019 (unaudited) (continued)
| Principal Amount (000s) | Value | |||||||||||
| Construction & Engineering – 0.6% | ||||||||||||
| $1,000 | KBR, Inc., 1 mo. LIBOR + 3.750%, 5.862%, 4/25/25, Term Loan B | $1,006,250 | ||||||||||
| Distribution/Wholesale – 0.6% | ||||||||||||
| 1,000 | IAA, Inc., 3 mo. LIBOR + 2.750%, 6/28/26, Term Loan B (d) | 1,006,250 | ||||||||||
| Diversified Consumer Services – 0.1% | ||||||||||||
| 105 | ServiceMaster Company, 1 mo. LIBOR + 2.500%, 4.612%, 11/8/23, 2016 Term Loan B | 105,610 | ||||||||||
| Diversified Telecommunication Services – 1.9% | ||||||||||||
| 1,489 | CenturyLink, Inc., 1 mo. LIBOR + 2.750%, 4.862%, 1/31/25, 2017 Term Loan B | 1,469,826 | ||||||||||
| 1,000 | Intelsat Jackson Holdings S.A., 1 mo. LIBOR + 3.750%, 5.895%, 11/27/23, 2017 Term Loan B3 | 1,001,250 | ||||||||||
| 992 | Sprint Communications, Inc., 1 mo. LIBOR + 2.500%, 4.625%, 2/2/24, 1st Lien Term Loan B | 987,424 | ||||||||||
| 3,458,500 | ||||||||||||
| Entertainment – 1.9% | ||||||||||||
| 998 | AMC Entertainment Holdings, Inc., 6 mo. LIBOR + 3.000%, 5.230%, 4/22/26, 2019 Term Loan B | 1,002,074 | ||||||||||
| 1,500 | Delta 2 (LUX) S.a.r.l., 1 mo. LIBOR + 2.500%, 4.612%, 2/1/24, 2018 USD Term Loan | 1,473,517 | ||||||||||
| 892 | Stars Group Holdings B.V. (The), 3 mo. LIBOR + 3.500%, 5.830%, 7/10/25, 2018 USD Incremental Term Loan | 895,938 | ||||||||||
| 3,371,529 | ||||||||||||
| Food & Staples Retailing – 0.6% | ||||||||||||
| 980 | US Foods, Inc., 1 mo. LIBOR + 2.000%, 4.112%, 6/27/23, 2016 Term Loan B | 982,149 | ||||||||||
| Healthcare-Products – 1.5% | ||||||||||||
| 624 | Greatbatch Ltd., 1 mo. LIBOR + 3.000%, 5.220%, 10/27/22, 2017 1st Lien Term Loan B | 628,386 | ||||||||||
| 1,417 | Mallinckrodt International Finance S.A., 3 mo. LIBOR + 2.750%, 5.080%, 9/24/24, USD Term Loan B | 1,110,749 | ||||||||||
| 975 | Ortho-Clinical Diagnostics SA, 3 mo. LIBOR + 3.250%, 5.563%, 6/30/25, 2018 Term Loan B | 922,291 | ||||||||||
| 2,661,426 | ||||||||||||
| Holding Companies-Diversified – 0.5% | ||||||||||||
| 1,000 | Travelport Finance (Luxembourg) S.a.r.l., 3 mo. LIBOR + 5.000%, 7.541%, 5/29/26, 2019 Term Loan | 923,500 | ||||||||||
| Hotels, Restaurants & Leisure – 3.5% | ||||||||||||
| 984 | 1011778 B.C. Unlimited Liability Company, 1 mo. LIBOR + 2.250%, 4.362%, 2/16/24, Term Loan B3 | 984,456 | ||||||||||
| 846 | Boyd Gaming Corporation, 1 Week LIBOR + 2.250%, 4.387%, 9/15/23, Term Loan B3 | 847,746 | ||||||||||
| 965 | Golden Entertainment, Inc., 1 mo. LIBOR + 3.000%, 5.140%, 10/21/24, 2017 1st Lien Term Loan | 965,806 | ||||||||||
| 980 | Playa Resorts Holding B.V., 1 mo. LIBOR + 2.750%, 4.860%, 4/29/24, 2017 Term Loan B | 940,416 | ||||||||||
| Scientific Games International, Inc., 8/14/24, 2018 Term Loan B5 | ||||||||||||
| 791 | 2 mo. LIBOR + 2.750%, 4.896% | 783,300 | ||||||||||
| 194 | 1 mo. LIBOR + 2.750%, 4.862% | 191,674 | ||||||||||
| 1,491 | SeaWorld Parks & Entertainment, Inc., 1 mo. LIBOR + 3.000%, 5.112%, 3/31/24, Term Loan B5 | 1,492,743 | ||||||||||
| 6,206,141 | ||||||||||||
| 14 | Semi-Annual Report | | August 31, 2019 | | See accompanying Notes to Financial Statements |
Table of Contents
Schedule of Investments
AllianzGI Convertible & Income 2024 Target Term Fund
August 31, 2019 (unaudited) (continued)
| Principal Amount (000s) | Value | |||||||||||
| Internet – 1.2% | ||||||||||||
| $957 | Everi Payments, Inc., 1 mo. LIBOR + 3.000%, 5.112%, 5/9/24, Term Loan B | $957,987 | ||||||||||
| Go Daddy Operating Company, LLC, 2/15/24, 2017 Repriced Term Loan | ||||||||||||
| 747 | 1 mo. LIBOR + 2.000%, 4.112% | 162,587 | ||||||||||
| 500 | 3 mo. LIBOR + 6.000% (d) | 1,088,268 | ||||||||||
| 2,208,842 | ||||||||||||
| Internet Software & Services – 1.6% | ||||||||||||
| 747 | Blucora, Inc., 2 mo. LIBOR + 3.000%, 5.258%, 5/22/24, 2017 Term Loan B | 748,807 | ||||||||||
| EIG Investors Corp., 2/9/23, 2018 1st Lien Term Loan | ||||||||||||
| 1,106 | 3 mo. LIBOR + 3.750%, 5.882% | 1,089,709 | ||||||||||
| 6 | 3 mo. LIBOR + 3.750%, 5.895% | 5,950 | ||||||||||
| 1,000 | Match Group Inc., 2 mo. LIBOR + 2.500%, 4.659%, 11/16/22, 2017 Term Loan B | 1,005,000 | ||||||||||
| 2,849,466 | ||||||||||||
| IT Services – 0.5% | ||||||||||||
| 995 | Xerox Business Services LLC, 1 mo. LIBOR + 2.500%, 4.612%, 12/7/23, USD Term Loan B | 973,140 | ||||||||||
| Leisure Equipment & Products – 0.5% | ||||||||||||
| 937 | Callaway Golf Company, 1 mo. LIBOR + 4.500%, 6.713%, 1/2/26, Term Loan B | 951,305 | ||||||||||
| Lodging – 0.8% | ||||||||||||
| 1,492 | Caesars Resort Collection, LLC, 1 mo. LIBOR + 2.750%, 4.862%, 12/22/24, 2017 1st Lien Term Loan B | 1,472,747 | ||||||||||
| Machinery – 1.9% | ||||||||||||
| 1,626 | Gardner Denver, Inc., 1 mo. LIBOR + 2.750%, 4.862%, 7/30/24, 2017 USD Term Loan B | 1,632,264 | ||||||||||
| 192 | Harsco Corporation, 1 mo. LIBOR + 2.250%, 4.375%, 12/6/24, 2017 Term Loan B1 | 192,253 | ||||||||||
| 1,489 | Navistar International Corporation, 1 mo. LIBOR + 3.500%, 5.700%, 11/6/24, 2017 1st Lien Term Loan B | 1,486,812 | ||||||||||
| 3,311,329 | ||||||||||||
| Media – 4.5% | ||||||||||||
| 932 | Gray Television, Inc., 1 mo. LIBOR + 2.250%, 4.582%, 2/7/24, 2017 Term Loan B | 932,579 | ||||||||||
| 997 | Houghton Mifflin Harcourt Publishing Company, 1 mo. LIBOR + 3.000%, 5.112%, 5/31/21, 2015 Term Loan B | 973,964 | ||||||||||
| 884 | Lions Gate Capital Holdings LLC, 1 mo. LIBOR + 2.250%, 4.362%, 3/24/25, 2018 Term Loan B | 882,674 | ||||||||||
| 1,247 | Meredith Corporation, 1 mo. LIBOR + 2.750%, 4.862%, 1/31/25, 2018 Term Loan B | 1,250,568 | ||||||||||
| 1,000 | Nexstar Broadcasting, Inc., 3 mo. LIBOR + 2.750%, 6/19/26, 2019 Term Loan B1 (d) | 1,001,785 | ||||||||||
| 1,492 | Sinclair Television Group Inc., 1 mo. LIBOR + 2.250%, 4.370%, 1/3/24, Term Loan B2 | 1,491,620 | ||||||||||
| 1,490 | WideOpenWest Finance LLC, 3 mo. LIBOR + 3.250%, 5.395%, 8/18/23, 2017 Term Loan B | 1,435,884 | ||||||||||
| 7,969,074 | ||||||||||||
| Oil, Gas & Consumable Fuels – 0.5% | ||||||||||||
| 1,000 | McDermott Technology Americas Inc, 1 mo. LIBOR + 5.000%, 7.112%, 5/9/25, 2018 1st Lien Term Loan | 920,630 | ||||||||||
| Pharmaceuticals – 1.8% | ||||||||||||
| 1,486 | Endo Luxembourg Finance Company I S.a r.l., 1 mo. LIBOR + 4.250%, 6.375%, 4/29/24, 2017 Term Loan B | 1,361,328 | ||||||||||
| See accompanying Notes to Financial Statements | | August 31, 2019 | | Semi-Annual Report | 15 |
Table of Contents
Schedule of Investments
AllianzGI Convertible & Income 2024 Target Term Fund
August 31, 2019 (unaudited) (continued)
| Principal Amount (000s) | Value | |||||||||||
| Pharmaceuticals(continued) | ||||||||||||
| $993 | HLF Financing S.a r.l., 1 mo. LIBOR + 3.250%, 5.362%, 8/18/25, 2018 Term Loan B | $993,661 | ||||||||||
| 866 | Lannett Company, Inc., 1 mo. LIBOR + 5.375%, 7.487%, 11/25/22, Term Loan B | 831,839 | ||||||||||
| 3,186,828 | ||||||||||||
| Pipelines – 0.5% | ||||||||||||
| 916 | Summit Midstream Partners Holdings, LLC, 3 mo. LIBOR + 6.000%, 5/13/22, Term Loan B (d) | 900,450 | ||||||||||
| Road & Rail – 0.8% | ||||||||||||
| 1,354 | YRC Worldwide, Inc., 3 mo. LIBOR + 8.500%, 10.756%, 7/24/22, 2017 Term Loan | 1,337,479 | ||||||||||
| Semiconductors & Semiconductor Equipment – 0.5% | ||||||||||||
| 997 | Cohu, Inc., 6 mo. LIBOR + 3.000%, 5.200%, 10/1/25, 2018 Term Loan B | 967,982 | ||||||||||
| Software – 0.6% | ||||||||||||
| 1,000 | Upland Software, Inc., 1 mo. LIBOR + 3.750%, 5.862%, 8/6/26, 2019 Term Loan | 1,004,065 | ||||||||||
| Specialty Retail – 1.0% | ||||||||||||
| 987 | At Home Holding III Inc., 3 mo. LIBOR + 3.500%, 5.756%, 6/3/22, Term Loan | 888,402 | ||||||||||
| 861 | Burlington Coat Factory Warehouse Corporation, 1 mo. LIBOR + 2.000%, 4.200%, 11/17/24, 2017 Term Loan B5 | 864,615 | ||||||||||
| 1,753,017 | ||||||||||||
| Textiles, Apparel & Luxury Goods – 0.6% | ||||||||||||
| 1,129 | G-III Apparel Group, Ltd., 1 mo. LIBOR + 5.250%, 7.438%, 12/1/22, Term Loan B | 1,140,562 | ||||||||||
| Total Senior Loans (cost-$57,446,857) | 56,810,176 | |||||||||||
| Shares | ||||||||||||
| Common Stock(e)(f)(h)(i) – 0.0% | ||||||||||||
| Banks – 0.0% | ||||||||||||
| 6,549 | CCF Holdings LLC Class A (cost-$0; purchased 12/18/18) | – | † | |||||||||
| 7,142 | CCF Holdings LLC Class B (cost-$0; purchased 12/12/18) | 1 | ||||||||||
| Total Common Stock (cost-$0) | 1 | |||||||||||
| Principal Amount (000s) | ||||||||||||
| Repurchase Agreements – 6.0% | ||||||||||||
| $10,662 | State Street Bank and Trust Co., | |||||||||||
| dated 8/30/19, 0.42%, due 9/3/19, | ||||||||||||
| proceeds $10,662,498; collateralized by | ||||||||||||
| U.S. Treasury Notes, 2.375%, due 3/15/22, | ||||||||||||
| valued at $10,879,006 including accrued interest (cost-$10,662,000) | 10,662,000 | |||||||||||
| Total Investments (cost-$252,531,330) – 139.9% | 249,053,706 | |||||||||||
| Liabilities in excess of other assets – (39.9)% | (71,020,104 | ) | ||||||||||
| Net Assets – 100.0% | $178,033,602 | |||||||||||
| 16 | Semi-Annual Report | | August 31, 2019 | | See accompanying Notes to Financial Statements |
Table of Contents
Schedule of Investments
AllianzGI Convertible & Income 2024 Target Term Fund
August 31, 2019 (unaudited) (continued)
Notes to Schedule of Investments:
| † | Actual amount rounds to less than $1 |
| (a) | Private Placement–Restricted as to resale and may not have a readily available market. Securities with an aggregate value of $106,683,789, representing 59.9% of net assets. |
| (b) | These securities generally pay interest at rates which are periodicallypre-determined by reference to a base lending rate plus a premium. These base lending rates are generally either the lending rate offered by one or more major European banks, such as the “LIBOR” or the prime rate offered by one or more major United States banks, or the certificate of deposit rate. These securities are generally considered to be restricted as the Fund is ordinarily contractually obligated to receive approval from the Agent bank and/or borrower prior to disposition. Remaining maturities of senior loans may be less than the stated maturities shown as a result of contractual or optional payments by the borrower. Such prepayments cannot be predicted with certainty. The interest rate disclosed reflects the rate in effect on August 31, 2019. |
| (c) | 144A–Exempt from registration under Rule 144A of the Securities Act of 1933. These securities may be resold in transactions exempt from registration, typically only to qualified institutional buyers. Securities with an aggregate value of $47,553,909, representing 26.7% of net assets. |
| (d) | When-issued or delayed-delivery. To be settled/delivered after August 31, 2019. |
| (e) | Fair-Valued–Securities with an aggregate value of $1,095,566, representing 0.6% of net assets. See Note 1(a) and Note 1(b) in the Notes to Financial Statements. |
| (f) | Level 3 security. See Note 1(a) and Note 1(b) in the Notes to Financial Statements. |
| (g) | All or partial amount segregated for the benefit of the counterparty as collateral for long-term and short-term loan financing. |
| (h) | Restricted. The aggregate cost of such securities is $2,000,000. The aggregate value is $2,002,501, representing 1.1% of net assets. |
| (i) | Non-income producing. |
| (j) | All or a portion of this security is on loan pursuant to the SSB Facility (see Note 8). The aggregate value of securities on loan is $61,472,032. |
| (k) | Fair ValueMeasurements-See Note 1(b) in the Notes to Financial Statements. |
| Level 1 – Quoted Prices | Level 2 – Other Significant Observable Inputs | Level 3 – Significant Unobservable Inputs | Value at 8/31/19 | |||||||||||||
Investments in Securities – Assets |
| |||||||||||||||
Convertible Bonds & Notes | $ | – | $92,254,743 | $ – | $92,254,743 | |||||||||||
Corporate Bonds & Notes: |
| |||||||||||||||
Diversified Financial Services | – | 6,580,000 | 1,095,565 | 7,675,565 | ||||||||||||
All Other | – | 81,651,221 | – | 81,651,221 | ||||||||||||
Senior Loans | – | 56,810,176 | – | 56,810,176 | ||||||||||||
Common Stock | – | – | 1 | 1 | ||||||||||||
Repurchase Agreements | – | 10,662,000 | – | 10,662,000 | ||||||||||||
Totals | $ | – | $ | 247,958,140 | $ | 1,095,566 | $ | 249,053,706 | ||||||||
| See accompanying Notes to Financial Statements | | August 31, 2019 | | Semi-Annual Report | 17 |
Table of Contents
Schedule of Investments
AllianzGI Convertible & Income 2024 Target Term Fund
August 31, 2019 (unaudited) (continued)
A roll forward of fair value measurements using significant unobservable inputs (Level 3) for the six months ended August 31, 2019, was as follows:
| Beginning Balance 2/28/19 | Purchases | Sales | Accrued Discount (Premiums) | Net Realized Gain (Loss) | ||||||||||||||||
Investments in Securities – Assets |
| |||||||||||||||||||
Corporate Bonds & Notes: |
| |||||||||||||||||||
Diversified Financial Services | $1,040,092 | $117,230 | †† | $ – | $12,797 | $ – | ||||||||||||||
Common Stock: |
| |||||||||||||||||||
Banks | 1 | – | – | – | – | |||||||||||||||
Totals | $1,040,093 | $117,230 | $ – | $12,797 | $ – | |||||||||||||||
| Net Change in Unrealized Appreciation/ Depreciation | Transfers into Level 3 | Transfers out of Level 3 | Ending Balance 8/31/19 | |||||||||||||
Investments in Securities – Assets |
| |||||||||||||||
Corporate Bonds & Notes: |
| |||||||||||||||
Diversified Financial Services | $(74,554 | ) | $ – | $ – | $1,095,565 | |||||||||||
Common Stock: |
| |||||||||||||||
Banks | – | – | – | 1 | ||||||||||||
Totals | $(74,554 | ) | $ – | $ – | $1,095,566 | |||||||||||
| †† | Payment-in-Kind |
The table above may include Level 3 investments that are valued by brokers or independent pricing services. The inputs for these investments are not readily available or cannot be reasonably estimated and are generally those inputs described in Note 1(b).
The following table presents additional information about valuation techniques and inputs used for investments that are measured at fair value and categorized within Level 3 at August 31, 2019:
| Ending Balance at 8/31/19 | Valuation Technique Used | Unobservable Inputs | Input Values (Range) | |||||||||||||
Investments in Securities – Assets |
| |||||||||||||||
Corporate Bonds & Notes: | ||||||||||||||||
Diversified Financial Services | $1,095,565 | | Market and Company Comparables | | | EV Multiples Illiquidity Discount | | | 1.80x (0.38x – 5.71x) 20% | | ||||||
The net change in unrealized appreciation/depreciation of Level 3 investments held at August 31, 2019 was $(166,923). The net realized gain (loss) and net change in unrealized appreciation/depreciation are reflected on the Statements of Operations.
Glossary:
| LIBOR | - | London Inter-Bank Offered Rate | ||
| PIK | - | Payment-in-Kind | ||
| REIT | - | Real Estate Investment Trust |
| 18 | Semi-Annual Report | | August 31, 2019 | | See accompanying Notes to Financial Statements |
Table of Contents
Schedule of Investments
AllianzGI Convertible & Income Fund
August 31, 2019 (unaudited)
| Principal Amount (000s) | Value | |||||||||||
| Corporate Bonds & Notes – 36.9% | ||||||||||||
| Aerospace & Defense – 1.1% | ||||||||||||
| $6,975 | TransDigm, Inc., 6.50%, 5/15/25 (m) | $7,297,594 | ||||||||||
| 1,725 | Triumph Group, Inc., 7.75%, 8/15/25 | 1,733,625 | ||||||||||
| 9,031,219 | ||||||||||||
| Auto Components – 0.7% | ||||||||||||
| 1,655 | Adient U.S. LLC, 7.00%, 5/15/26 (a)(b) | 1,696,375 | ||||||||||
| 2,445 | Goodyear Tire & Rubber Co., 5.00%, 5/31/26 (m) | 2,429,719 | ||||||||||
| 2,315 | Panther BF Aggregator 2 L.P., 8.50%, 5/15/27 (a)(b) | 2,262,912 | ||||||||||
| 6,389,006 | ||||||||||||
| Auto Manufacturers – 1.1% | ||||||||||||
| 6,135 | Navistar International Corp., 6.625%, 11/1/25 (a)(b) | 6,242,363 | ||||||||||
| 3,245 | Tesla, Inc., 5.30%, 8/15/25 (a)(b)(m) | 2,908,331 | ||||||||||
| 9,150,694 | ||||||||||||
| Chemicals – 2.1% | ||||||||||||
| 6,370 | Chemours Co., 6.625%, 5/15/23 | 6,505,362 | ||||||||||
| 4,790 | Kraton Polymers LLC, 7.00%, 4/15/25 (a)(b)(m) | 4,987,587 | ||||||||||
| 1,690 | Olin Corp., 5.00%, 2/1/30 | 1,694,225 | ||||||||||
| 4,690 | Tronox, Inc., 6.50%, 4/15/26 (a)(b)(m) | 4,473,088 | ||||||||||
| 17,660,262 | ||||||||||||
| Commercial Services – 1.8% | ||||||||||||
| 8,050 | Cenveo Corp., 6.00%, 5/15/24 (cost-$9,971,710; purchased 3/22/12) (a)(b)(c)(d)(f)(j) | 442,750 | ||||||||||
| 2,170 | Herc Holdings, Inc., 5.50%, 7/15/27 (a)(b) | 2,243,237 | ||||||||||
| Hertz Corp. (a)(b), | ||||||||||||
| 3,165 | 7.125%, 8/1/26 | 3,235,849 | ||||||||||
| 1,395 | 7.625%, 6/1/22 | 1,454,357 | ||||||||||
| 3,465 | Laureate Education, Inc., 8.25%, 5/1/25 (a)(b) | 3,789,844 | ||||||||||
| United Rentals North America, Inc., | ||||||||||||
| 2,395 | 5.25%, 1/15/30 | 2,568,637 | ||||||||||
| 1,655 | 5.50%, 7/15/25 (g) | 1,731,544 | ||||||||||
| 15,466,218 | ||||||||||||
| Computers – 0.5% | ||||||||||||
| 5,050 | Harland Clarke Holdings Corp., 9.25%, 3/1/21 (a)(b)(m) | 4,747,000 | ||||||||||
| Containers & Packaging – 0.5% | ||||||||||||
| 2,195 | Berry Global, Inc., 5.625%, 7/15/27 (a)(b) | 2,310,238 | ||||||||||
| 2,160 | Trivium Packaging Finance BV, 8.50%, 8/15/27 (a)(b) | 2,327,400 | ||||||||||
| 4,637,638 | ||||||||||||
| Distribution/Wholesale – 0.7% | ||||||||||||
| 5,380 | H&E Equipment Services, Inc., 5.625%, 9/1/25 | 5,655,725 | ||||||||||
| Diversified Financial Services – 3.2% | ||||||||||||
| 19,469 | CCF Holdings LLC, PIK 10.75%, 10.75%, 12/15/23 (a)(b)(d)(f) | 9,475,635 | ||||||||||
| 6,000 | Community Choice Financial Issuer LLC, 9.00%, 6/15/23 (cost $6,000,000; purchased 9/6/18) (a)(b)(j) | 6,007,500 | ||||||||||
| Navient Corp., | ||||||||||||
| 2,365 | 6.75%, 6/15/26 | 2,536,463 | ||||||||||
| 1,175 | 7.25%, 9/25/23 | 1,308,656 | ||||||||||
| See accompanying Notes to Financial Statements | | August 31, 2019 | | Semi-Annual Report | 19 |
Table of Contents
Schedule of Investments
AllianzGI Convertible & Income Fund
August 31, 2019 (unaudited) (continued)
| Principal Amount (000s) | Value | |||||||||||
| Diversified Financial Services(continued) | ||||||||||||
| Springleaf Finance Corp., | ||||||||||||
| $2,165 | 6.625%, 1/15/28 | $2,381,500 | ||||||||||
| 4,935 | 8.25%, 10/1/23 | 5,798,625 | ||||||||||
| 27,508,379 | ||||||||||||
| Electronic Equipment, Instruments & Components – 0.3% | ||||||||||||
| 2,260 | Energizer Holdings, Inc., 7.75%, 1/15/27 (a)(b) | 2,477,525 | ||||||||||
| Engineering & Construction – 0.9% | ||||||||||||
| 2,835 | AECOM, 5.125%, 3/15/27 | 2,975,389 | ||||||||||
| 5,100 | Tutor Perini Corp., 6.875%, 5/1/25 (a)(b) | 4,762,176 | ||||||||||
| 7,737,565 | ||||||||||||
| Entertainment – 1.2% | ||||||||||||
| 4,990 | AMC Entertainment Holdings, Inc., 6.125%, 5/15/27 (m) | 4,628,225 | ||||||||||
| 2,365 | International Game Technology PLC, 6.25%, 1/15/27 (a)(b) | 2,604,456 | ||||||||||
| 2,540 | Stars Group Holdings BV, 7.00%, 7/15/26 (a)(b) | 2,701,925 | ||||||||||
| 9,934,606 | ||||||||||||
| Food & Beverage – 0.2% | ||||||||||||
| 1,525 | Albertsons Cos. LLC, 7.50%, 3/15/26 (a)(b) | 1,704,188 | ||||||||||
| Healthcare-Products – 0.4% | ||||||||||||
| 2,980 | Avantor, Inc., 9.00%, 10/1/25 (a)(b) | 3,359,950 | ||||||||||
| Healthcare-Services – 2.9% | ||||||||||||
| 2,460 | Centene Corp., 5.375%, 6/1/26 (a)(b) | 2,636,013 | ||||||||||
| 2,835 | CHS/Community Health Systems, Inc., 6.25%, 3/31/23 | 2,753,777 | ||||||||||
| 5,430 | DaVita, Inc., 5.125%, 7/15/24 | 5,537,025 | ||||||||||
| 1,586 | Encompass Health Corp., 5.75%, 11/1/24 | 1,611,773 | ||||||||||
| 3,550 | HCA, Inc., 7.50%, 2/15/22 | 3,984,200 | ||||||||||
| 2,270 | Select Medical Corp., 6.25%, 8/15/26 (a)(b) | 2,367,610 | ||||||||||
| Tenet Healthcare Corp., | ||||||||||||
| 2,170 | 6.25%, 2/1/27 (a)(b) | 2,254,088 | ||||||||||
| 3,500 | 7.00%, 8/1/25 | 3,548,125 | ||||||||||
| 24,692,611 | ||||||||||||
| Insurance – 0.6% | ||||||||||||
| 4,390 | Prudential Financial, Inc., 5.70%, 9/15/48 (converts to FRN on 9/15/28) | 4,801,416 | ||||||||||
| Internet – 0.6% | ||||||||||||
| 2,220 | Go Daddy Operating Co. LLC, 5.25%, 12/1/27 (a)(b) | 2,350,425 | ||||||||||
| 2,290 | Netflix, Inc., 5.375%, 11/15/29 (a)(b) | 2,496,100 | ||||||||||
| 4,846,525 | ||||||||||||
| Iron/Steel – 0.2% | ||||||||||||
| 1,745 | United States Steel Corp., 6.875%, 8/15/25 (m) | 1,664,817 | ||||||||||
| Lodging – 0.7% | ||||||||||||
| 1,720 | MGM Resorts International, 5.50%, 4/15/27 | 1,868,350 | ||||||||||
| 1,300 | Wyndham Hotels & Resorts, Inc., 5.375%, 4/15/26 (a)(b)(g) | 1,368,250 | ||||||||||
| 2,975 | Wynn Las Vegas LLC, 5.50%, 3/1/25 (a)(b) | 3,146,063 | ||||||||||
| 6,382,663 | ||||||||||||
| Machinery-Construction & Mining – 0.6% | ||||||||||||
| 4,695 | Terex Corp., 5.625%, 2/1/25 (a)(b) | 4,783,360 | ||||||||||
| 20 | Semi-Annual Report | | August 31, 2019 | | See accompanying Notes to Financial Statements |
Table of Contents
Schedule of Investments
AllianzGI Convertible & Income Fund
August 31, 2019 (unaudited) (continued)
| Principal Amount (000s) | Value | |||||||||||
| Media – 3.4% | ||||||||||||
| $7,370 | Cablevision Systems Corp., 8.00%, 4/15/20 | $7,600,312 | ||||||||||
| 1,360 | Clear Channel Worldwide Holdings, Inc., 9.25%, 2/15/24 (a)(b) | 1,494,300 | ||||||||||
| CSC Holdings LLC (a)(b), | ||||||||||||
| 2,230 | 7.50%, 4/1/28 | 2,519,900 | ||||||||||
| 3,035 | 7.75%, 7/15/25 | 3,266,419 | ||||||||||
| Diamond Sports Group LLC (a)(b), | ||||||||||||
| 795 | 5.375%, 8/15/26 | 836,738 | ||||||||||
| 2,190 | 6.625%, 8/15/27 | 2,299,500 | ||||||||||
| 3,740 | Gray Television, Inc., 5.875%, 7/15/26 (a)(b)(m) | 3,917,650 | ||||||||||
| 4,671 | LiveStyle, Inc., 9.625%, 2/1/19 (cost-$4,667,935; purchased5/7/14-2/26/15) (a)(b)(c)(d)(f)(j)(l) | 5 | ||||||||||
| 2,810 | Meredith Corp., 6.875%, 2/1/26 | 2,978,600 | ||||||||||
| 2,265 | Nexstar Escrow, Inc., 5.625%, 7/15/27 (a)(b) | 2,366,925 | ||||||||||
| 1,495 | Virgin Media Secured Finance PLC, 5.50%, 5/15/29 (a)(b) | 1,566,012 | ||||||||||
| 28,846,361 | ||||||||||||
| Metal Fabricate/Hardware – 0.4% | ||||||||||||
| 3,830 | Park-Ohio Industries, Inc., 6.625%, 4/15/27 | 3,695,950 | ||||||||||
| Mining – 1.3% | ||||||||||||
| 4,405 | Constellium SE, 6.625%, 3/1/25 (a)(b) | 4,622,497 | ||||||||||
| 1,990 | Hudbay Minerals, Inc., 7.625%, 1/15/25 (a)(b) | 2,029,760 | ||||||||||
| 3,950 | Joseph T. Ryerson & Son, Inc., 11.00%, 5/15/22 (a)(b) | 4,148,734 | ||||||||||
| 10,800,991 | ||||||||||||
| Miscellaneous Manufacturing – 0.2% | ||||||||||||
| 1,725 | Koppers, Inc., 6.00%, 2/15/25 (a)(b) | 1,686,188 | ||||||||||
| Oil, Gas & Consumable Fuels – 1.5% | ||||||||||||
| 1,900 | Carrizo Oil & Gas, Inc., 6.25%, 4/15/23 (m) | 1,826,850 | ||||||||||
| 1,790 | Chesapeake Energy Corp., 8.00%, 1/15/25 (m) | 1,364,875 | ||||||||||
| 4,895 | Oasis Petroleum, Inc., 6.875%, 3/15/22 | 4,576,825 | ||||||||||
| 3,220 | Transocean, Inc., 7.50%, 1/15/26 (a)(b) | 2,954,350 | ||||||||||
| 2,285 | USA Compression Partners L.P., 6.875%, 9/1/27 (a)(b) | 2,361,730 | ||||||||||
| 13,084,630 | ||||||||||||
| Paper & Forest Products – 0.3% | ||||||||||||
| 2,335 | Mercer International, Inc., 7.375%, 1/15/25 | 2,410,888 | ||||||||||
| Pharmaceuticals – 1.0% | ||||||||||||
| 1,610 | Bausch Health Americas, Inc., 8.50%, 1/31/27 (a)(b) | 1,791,093 | ||||||||||
| Bausch Health Cos., Inc. (a)(b), | ||||||||||||
| 1,565 | 6.125%, 4/15/25 | 1,615,862 | ||||||||||
| 1,665 | 7.25%, 5/30/29 | 1,764,900 | ||||||||||
| 2,080 | Endo Finance LLC, 5.375%, 1/15/23 (a)(b) | 1,424,800 | ||||||||||
| 2,235 | Horizon Pharma USA, Inc., 5.50%, 8/1/27 (a)(b) | 2,335,575 | ||||||||||
| 8,932,230 | ||||||||||||
| Pipelines – 0.8% | ||||||||||||
| 2,170 | DCP Midstream Operating L.P., 5.125%, 5/15/29 | 2,227,071 | ||||||||||
| 2,140 | NGL Energy Partners L.P., 7.50%, 4/15/26 (a)(b) | 2,172,100 | ||||||||||
| Targa Resources Partners L.P. (a)(b), | ||||||||||||
| 980 | 6.50%, 7/15/27 | 1,065,750 | ||||||||||
| 1,070 | 6.875%, 1/15/29 | 1,185,025 | ||||||||||
| 6,649,946 | ||||||||||||
| See accompanying Notes to Financial Statements | | August 31, 2019 | | Semi-Annual Report | 21 |
Table of Contents
Schedule of Investments
AllianzGI Convertible & Income Fund
August 31, 2019 (unaudited) (continued)
| Principal Amount (000s) | Value | |||||||||||
| Real Estate – 0.7% | ||||||||||||
| $5,505 | Kennedy-Wilson, Inc., 5.875%, 4/1/24 | $5,663,269 | ||||||||||
| Retail – 1.2% | ||||||||||||
| 6,480 | Conn’s, Inc., 7.25%, 7/15/22 | 6,480,000 | ||||||||||
| 1,530 | L Brands, Inc., 6.875%, 11/1/35 | 1,300,500 | ||||||||||
| 2,355 | Party City Holdings, Inc., 6.625%, 8/1/26 (a)(b)(m) | 2,249,025 | ||||||||||
| 10,029,525 | ||||||||||||
| Semiconductors – 0.4% | ||||||||||||
| 3,455 | Amkor Technology, Inc., 6.625%, 9/15/27 (a)(b) | 3,778,837 | ||||||||||
| Software – 1.3% | ||||||||||||
| 5,035 | Camelot Finance S.A., 7.875%, 10/15/24 (a)(b) | 5,274,162 | ||||||||||
| 2,330 | IQVIA, Inc., 5.00%, 5/15/27 (a)(b) | 2,466,888 | ||||||||||
| 895 | Rackspace Hosting, Inc., 8.625%, 11/15/24 (a)(b)(m) | 825,638 | ||||||||||
| 2,310 | SS&C Technologies, Inc., 5.50%, 9/30/27 (a)(b) | 2,429,831 | ||||||||||
| 10,996,519 | ||||||||||||
| Telecommunications – 3.8% | ||||||||||||
| 2,265 | CenturyLink, Inc., 7.50%, 4/1/24, Ser. Y (m) | 2,519,767 | ||||||||||
| 4,645 | Cincinnati Bell, Inc., 7.00%, 7/15/24 (a)(b) | 4,261,788 | ||||||||||
| 9,370 | Consolidated Communications, Inc., 6.50%, 10/1/22 | 8,807,800 | ||||||||||
| 845 | GTT Communications, Inc., 7.875%, 12/31/24 (a)(b)(m) | 540,800 | ||||||||||
| Hughes Satellite Systems Corp., | ||||||||||||
| 1,460 | 6.625%, 8/1/26 (m) | 1,576,800 | ||||||||||
| 4,250 | 7.625%, 6/15/21 | 4,600,625 | ||||||||||
| 7,205 | Sprint Communications, Inc., 11.50%, 11/15/21 | 8,483,887 | ||||||||||
| 1,865 | Sprint Corp., 7.625%, 3/1/26 | 2,100,456 | ||||||||||
| 32,891,923 | ||||||||||||
| Transportation – 0.3% | ||||||||||||
| 2,688 | XPO Logistics, Inc., 6.50%, 6/15/22 (a)(b) | 2,753,668 | ||||||||||
| Total Corporate Bonds & Notes (cost-$333,195,917) | 314,852,292 | |||||||||||
| Convertible Bonds & Notes – 34.5% | ||||||||||||
| Aerospace & Defense – 0.1% | ||||||||||||
| 855 | Arconic, Inc., 1.625%, 10/15/19 | 855,070 | ||||||||||
| Agriculture – 0.7% | ||||||||||||
| 5,665 | Vector Group Ltd., 3 mo. Cash Dividends on Common Stock + 1.75%, 1.75%, 4/15/20 (i) | 5,855,344 | ||||||||||
| Apparel & Textiles – 0.7% | ||||||||||||
| 14,740 | Iconix Brand Group, Inc., 5.75%, 8/15/23 | 6,264,500 | ||||||||||
| Biotechnology – 1.1% | ||||||||||||
| 9,625 | Intercept Pharmaceuticals, Inc., 3.25%, 7/1/23 | 8,265,469 | ||||||||||
| 1,785 | Verastem, Inc., 5.00%, 11/1/48 | 816,637 | ||||||||||
| 9,082,106 | ||||||||||||
| Building Materials – 1.4% | ||||||||||||
| 4,275 | Cemex S.A.B de C.V., 3.72%, 3/15/20 | 4,281,043 | ||||||||||
| 8,820 | Patrick Industries, Inc., 1.00%, 2/1/23 (g) | 7,524,909 | ||||||||||
| 11,805,952 | ||||||||||||
| 22 | Semi-Annual Report | | August 31, 2019 | | See accompanying Notes to Financial Statements |
Table of Contents
Schedule of Investments
AllianzGI Convertible & Income Fund
August 31, 2019 (unaudited) (continued)
| Principal Amount (000s) | Value | |||||||||||
| Commercial Services – 2.2% | ||||||||||||
| $10,530 | Huron Consulting Group, Inc., 1.25%, 10/1/19 | $10,496,274 | ||||||||||
| 8,825 | Macquarie Infrastructure Corp., 2.00%, 10/1/23 | 8,020,487 | ||||||||||
| 18,516,761 | ||||||||||||
| Computers – 1.5% | ||||||||||||
| 1,150 | Lumentum Holdings, Inc., 0.25%, 3/15/24 | 1,371,920 | ||||||||||
| 11,735 | Western Digital Corp., 1.50%, 2/1/24 (a)(b) | 11,084,846 | ||||||||||
| 12,456,766 | ||||||||||||
| Diversified Financial Services – 2.5% | ||||||||||||
| 9,320 | Encore Capital Group, Inc., 3.00%, 7/1/20 | 9,565,989 | ||||||||||
| 12,165 | PRA Group, Inc., 3.00%, 8/1/20 | 12,107,157 | ||||||||||
| 21,673,146 | ||||||||||||
| Electronics – 1.2% | ||||||||||||
| 5,565 | OSI Systems, Inc., 1.25%, 9/1/22 | 6,334,656 | ||||||||||
| 4,270 | Vishay Intertechnology, Inc., 2.25%, 6/15/25 | 3,974,569 | ||||||||||
| 10,309,225 | ||||||||||||
| Energy-Alternate Sources – 4.1% | ||||||||||||
| 6,840 | Pattern Energy Group, Inc., 4.00%, 7/15/20 | 7,146,360 | ||||||||||
| SunPower Corp., | ||||||||||||
| 3,135 | 0.875%, 6/1/21 | 2,931,225 | ||||||||||
| 9,405 | 4.00%, 1/15/23 | 8,694,922 | ||||||||||
| 16,800 | Tesla Energy Operations, Inc., 1.625%, 11/1/19 (m) | 16,494,287 | ||||||||||
| 35,266,794 | ||||||||||||
| Engineering & Construction – 0.6% | ||||||||||||
| 5,455 | Tutor Perini Corp., 2.875%, 6/15/21 | 5,007,997 | ||||||||||
| Equity Real Estate Investment Trusts (REITs) – 1.4% | ||||||||||||
| 3,975 | Two Harbors Investment Corp., 6.25%, 1/15/22 | 4,099,225 | ||||||||||
| 7,690 | Western Asset Mortgage Capital Corp., 6.75%, 10/1/22 | 7,723,644 | ||||||||||
| 11,822,869 | ||||||||||||
| Insurance – 2.6% | ||||||||||||
| 11,390 | AXA S.A., 7.25%, 5/15/21 (a)(b) | 11,653,824 | ||||||||||
| 7,945 | MGIC Investment Corp., 9.00%, 4/1/63 (a)(b) | 10,705,888 | ||||||||||
| 22,359,712 | ||||||||||||
| Internet – 0.2% | ||||||||||||
| 2,565 | Boingo Wireless, Inc., 1.00%, 10/1/23 (a)(b) | 2,158,082 | ||||||||||
| Investment Companies – 1.2% | ||||||||||||
| 9,525 | Prospect Capital Corp., 6.375%, 3/1/25 | 10,080,857 | ||||||||||
| Oil, Gas & Consumable Fuels – 2.0% | ||||||||||||
| 6,540 | Chesapeake Energy Corp., 5.50%, 9/15/26 | 4,139,194 | ||||||||||
| 2,670 | Ensco Jersey Finance Ltd., 3.00%, 1/31/24 (m) | 1,905,713 | ||||||||||
| 2,280 | Nabors Industries, Inc., 0.75%, 1/15/24 | 1,499,776 | ||||||||||
| 9,980 | Whiting Petroleum Corp., 1.25%, 4/1/20 | 9,834,561 | ||||||||||
| 17,379,244 | ||||||||||||
| Pharmaceuticals – 2.0% | ||||||||||||
| 12,190 | Dermira, Inc., 3.00%, 5/15/22 | 10,448,816 | ||||||||||
| 9,855 | Tilray, Inc., 5.00%, 10/1/23 (a)(b) | 6,515,916 | ||||||||||
| 16,964,732 | ||||||||||||
| See accompanying Notes to Financial Statements | | August 31, 2019 | | Semi-Annual Report | 23 |
Table of Contents
Schedule of Investments
AllianzGI Convertible & Income Fund
August 31, 2019 (unaudited) (continued)
| Principal Amount (000s) | Value | |||||||||||
| Pipelines – 2.2% | ||||||||||||
| $24,750 | Cheniere Energy, Inc., 4.25%, 3/15/45 | $19,243,125 | ||||||||||
| Semiconductors – 0.9% | ||||||||||||
| 680 | Advanced Micro Devices, Inc., 2.125%, 9/1/26 | 2,732,883 | ||||||||||
| 1,420 | Synaptics, Inc., 0.50%, 6/15/22 | 1,288,574 | ||||||||||
| 3,935 | Veeco Instruments, Inc., 2.70%, 1/15/23 | 3,464,079 | ||||||||||
| 7,485,536 | ||||||||||||
| Software – 3.2% | ||||||||||||
| 5,800 | Avaya Holdings Corp., 2.25%, 6/15/23 | 5,435,891 | ||||||||||
| 15,785 | Avid Technology, Inc., 2.00%, 6/15/20 | 15,508,763 | ||||||||||
| Evolent Health, Inc., | ||||||||||||
| 1,140 | 1.50%, 10/15/25 (a)(b) | 728,516 | ||||||||||
| 6,345 | 2.00%, 12/1/21 | 5,556,846 | ||||||||||
| 27,230,016 | ||||||||||||
| Telecommunications – 1.7% | ||||||||||||
| 7,715 | GDS Holdings Ltd., 2.00%, 6/1/25 | 8,019,627 | ||||||||||
| 7,915 | Infinera Corp., 2.125%, 9/1/24 | 6,815,741 | ||||||||||
| 14,835,368 | ||||||||||||
| Transportation – 1.0% | ||||||||||||
| 4,560 | Echo Global Logistics, Inc., 2.50%, 5/1/20 | 4,552,140 | ||||||||||
| 4,725 | Teekay Corp., 5.00%, 1/15/23 | 3,803,625 | ||||||||||
| 8,355,765 | ||||||||||||
| Total Convertible Bonds & Notes (cost-$300,407,310) | 295,008,967 | |||||||||||
| Shares | ||||||||||||
| Convertible Preferred Stock – 25.6% | ||||||||||||
| Banks – 5.0% | ||||||||||||
| 12,080 | Bank of America Corp., 7.25%, Ser. L (e) | 17,805,920 | ||||||||||
| 16,980 | Wells Fargo & Co., 7.50%, Ser. L (e) | 24,639,678 | ||||||||||
| 42,445,598 | ||||||||||||
| Chemicals – 0.7% | ||||||||||||
| 141,075 | International Flavors & Fragrances, Inc., 6.00%, 9/15/21 | 6,188,960 | ||||||||||
| Diversified Financial Services – 0.9% | ||||||||||||
| 154,835 | AMG Capital Trust II, 5.15%, 10/15/37 | 7,267,257 | ||||||||||
| Electric Utilities – 5.1% | ||||||||||||
| 110,160 | CenterPoint Energy, Inc., 7.00%, 9/1/21, Ser. B | 5,447,412 | ||||||||||
| 76,860 | Dominion Energy, Inc., 7.25%, 6/1/22, Ser. A | 7,835,877 | ||||||||||
| 147,670 | NextEra Energy, Inc., 6.123%, 9/1/19 | 10,208,427 | ||||||||||
| 160,380 | Sempra Energy, 6.00%, 1/15/21, Ser. A | 18,485,399 | ||||||||||
| 35,000 | Southern Co., 6.75%, 8/1/22, Ser. 2019 | 1,818,600 | ||||||||||
| 43,795,715 | ||||||||||||
| Electronics – 1.1% | ||||||||||||
| 10,110 | Fortive Corp., 5.00%, 7/1/21, Ser. A | 9,482,550 | ||||||||||
| Equity Real Estate Investment Trusts (REITs) – 5.2% | ||||||||||||
| 7,465 | Crown Castle International Corp., 6.875%, 8/1/20, Ser. A | 9,714,578 | ||||||||||
| 56,955 | QTS Realty Trust, Inc., 6.50%, Ser. B (e) | 6,713,855 | ||||||||||
| 24 | Semi-Annual Report | | August 31, 2019 | | See accompanying Notes to Financial Statements |
Table of Contents
Schedule of Investments
AllianzGI Convertible & Income Fund
August 31, 2019 (unaudited) (continued)
| Shares | Value | |||||||||||
| Equity Real Estate Investment Trusts (REITs) (continued) | ||||||||||||
| 410,065 | Ready Capital Corp., 7.00%, 8/15/23 | $10,965,138 | ||||||||||
| 631,070 | RLJ Lodging Trust, 1.95%, Ser. A (e) | 17,057,822 | ||||||||||
| 44,451,393 | ||||||||||||
| Hand/Machine Tools – 1.6% | ||||||||||||
| 24,170 | Colfax Corp., 5.75%, 1/15/22 | 2,982,336 | ||||||||||
| 113,405 | Stanley Black & Decker, Inc., 5.375%, 5/15/20 | 10,767,805 | ||||||||||
| 13,750,141 | ||||||||||||
| Healthcare-Products – 3.8% | ||||||||||||
| 84,600 | Avantor, Inc., 6.25%, 5/15/22, Ser. A | 5,196,132 | ||||||||||
| 283,925 | Becton Dickinson and Co., 6.125%, 5/1/20, Ser. A | 17,630,323 | ||||||||||
| 8,550 | Danaher Corp., 4.75%, 4/15/22, Ser. A | 9,755,293 | ||||||||||
| 32,581,748 | ||||||||||||
| Insurance – 2.1% | ||||||||||||
| 147,270 | Assurant, Inc., 6.50%, 3/15/21, Ser. D | 18,047,939 | ||||||||||
| Oil, Gas & Consumable Fuels – 0.1% | ||||||||||||
| 67,960 | Nabors Industries Ltd., 6.00%, 5/1/21, Ser. A | 1,026,196 | ||||||||||
| Total Convertible Preferred Stock (cost-$195,033,705) | 219,037,497 | |||||||||||
| Preferred Stock(a)(d)(f)(l) – 1.0% | ||||||||||||
| Media – 1.0% | ||||||||||||
| 3,554 | LiveStyle, Inc., Ser. A | 483,522 | ||||||||||
| 76,572 | LiveStyle, Inc., Ser. B (h)(k) | 7,657,200 | ||||||||||
| 6,750 | LiveStyle, Inc., Ser. B (k) | 67 | ||||||||||
| Total Preferred Stock (cost-$14,596,967) | 8,140,789 | |||||||||||
| Common Stock(d)(f)(k) – 0.0% | ||||||||||||
| Aerospace & Defense – 0.0% | ||||||||||||
| 8,295 | Erickson, Inc. (a) | 210,195 | ||||||||||
| Banks – 0.0% | ||||||||||||
| 56,642 | CCF Holdings LLC Class A (cost-$0; purchased 12/18/18) (h)(j) | 6 | ||||||||||
| 21,429 | CCF Holdings LLC Class B (cost-$0; purchased 12/12/18) (h)(j) | 2 | ||||||||||
| 8 | ||||||||||||
| Media – 0.0% | ||||||||||||
| 90,407 | LiveStyle, Inc. (a)(h)(l) | 9 | ||||||||||
| Total Common Stock (cost-$7,106,997) | 210,212 | |||||||||||
| Units | ||||||||||||
| Warrants(d)(f)(k) – 0.0% | ||||||||||||
| Advertising – 0.0% | ||||||||||||
| 15,602 | Affinion Group Holdings, Inc. , expires 4/1/24 | |||||||||||
| (cost-$3,080,312; purchased 4/10/19) (j) | 125,125 | |||||||||||
| Media – 0.0% | ||||||||||||
| 19,500 | LiveStyle, Inc., Ser. C , expires 11/30/21 (a)(l) | 2 | ||||||||||
| Total Warrants (cost-$3,080,312) | 125,127 | |||||||||||
| See accompanying Notes to Financial Statements | | August 31, 2019 | | Semi-Annual Report | 25 |
Table of Contents
Schedule of Investments
AllianzGI Convertible & Income Fund
August 31, 2019 (unaudited) (continued)
| Principal Amount (000s) | Value | |||||||||||
| Repurchase Agreements – 2.0% | ||||||||||||
| $17,180 | State Street Bank and Trust Co., | |||||||||||
| dated 8/30/19, 0.42%, due 9/3/19, | ||||||||||||
| proceeds $17,180,802; collateralized by | ||||||||||||
| U.S. Treasury Notes, 2.50%, due 1/15/22, | ||||||||||||
| valued at $17,525,925 including accrued interest (cost-$17,180,000) | $17,180,000 | |||||||||||
| Total Investments(cost-$870,601,208) – 100.0% | 854,554,884 | |||||||||||
| Liabilities in excess of other assets | (26,767,748 | ) | ||||||||||
| Preferred Shares | (323,275,000 | ) | ||||||||||
| Net Assets Applicable to Common Shareholders | $504,512,136 | |||||||||||
Notes to Schedule of Investments:
| (a) | Private Placement–Restricted as to resale and may not have a readily available market. Securities with an aggregate value of $222,821,112, representing 26.1% of total investments. |
| (b) | 144A–Exempt from registration under Rule 144A of the Securities Act of 1933. These securities may be resold in transactions exempt from registration, typically only to qualified institutional buyers. Securities with an aggregate value of $214,470,117, representing 25.1% of total investments. |
| (c) | In default. |
| (d) | Fair-Valued–Securities with an aggregate value of $18,394,518, representing 2.2% of total investments. See Note 1(a) and Note 1(b) in the Notes to Financial Statements. |
| (e) | Perpetual maturity. The date shown, if any, is the next call date. |
| (f) | Level 3 security. See Note 1(a) and Note 1(b) in the Notes to Financial Statements. |
| (g) | All or partial amount segregated for the benefit of the counterparty as collateral for the SSB Facility (see Note 8). |
| (h) | Affiliated security. |
| (i) | In addition to the coupon rate shown, the issuer is expected to pay additional interest based on the actual dividends paid on its common stock. |
| (j) | Restricted. The aggregate cost of such securities is $23,719,957. The aggregate value is $6,575,388, representing 0.8% of total investments. |
| (k) | Non-income producing. |
| (l) | A member of the Fund’s portfolio management team is a member of the board of directors of LiveStyle, Inc. The Fund’s aggregate value of investments in LiveStyle, Inc. represents 1.0% of total investments. |
| (m) | All or a portion of this security is on loan pursuant to the SSB Facility (see Note 8). The aggregate value of securities on loan is $25,023,588. |
| (n) | Fair ValueMeasurements-See Note 1(b) in the Notes to Financial Statements. |
| Level 1 – Quoted Prices | Level 2 – Other Significant Observable Inputs | Level 3 – Significant Unobservable Inputs | Value at 8/31/19 | |||||||||||||
Investments in Securities – Assets | ||||||||||||||||
Corporate Bonds & Notes: | ||||||||||||||||
Commercial Services | $ | – | $15,023,468 | $442,750 | $15,466,218 | |||||||||||
Diversified Financial Services | – | 18,032,744 | 9,475,635 | 27,508,379 | ||||||||||||
Media | – | 28,846,356 | 5 | 28,846,361 | ||||||||||||
All Other | – | 243,031,334 | – | 243,031,334 | ||||||||||||
Convertible Bonds & Notes | – | 295,008,967 | – | 295,008,967 | ||||||||||||
Convertible Preferred Stock: | ||||||||||||||||
Diversified Financial Services | – | 7,267,257 | – | 7,267,257 | ||||||||||||
Electronics | – | 9,482,550 | – | 9,482,550 | ||||||||||||
Equity Real Estate Investment Trusts (REITs) | 34,736,815 | 9,714,578 | – | 44,451,393 | ||||||||||||
Hand/Machine Tools | 2,982,336 | 10,767,805 | – | 13,750,141 | ||||||||||||
Healthcare-Products | 14,951,425 | 17,630,323 | – | 32,581,748 | ||||||||||||
All Other | 111,504,408 | – | – | 111,504,408 | ||||||||||||
| 26 | Semi-Annual Report | | August 31, 2019 | | See accompanying Notes to Financial Statements |
Table of Contents
Schedule of Investments
AllianzGI Convertible & Income Fund
August 31, 2019 (unaudited) (continued)
| Level 1 – Quoted Prices | Level 2 – Other Significant Observable Inputs | Level 3 – Significant Unobservable Inputs | Value at 8/31/19 | |||||||||||||
Preferred Stock | $ | – | $– | $8,140,789 | $8,140,789 | |||||||||||
Common Stock | – | – | 210,212 | 210,212 | ||||||||||||
Warrants | – | – | 125,127 | 125,127 | ||||||||||||
Repurchase Agreements | – | 17,180,000 | – | 17,180,000 | ||||||||||||
Totals | $ | 164,174,984 | $ | 671,985,382 | $ | 18,394,518 | $ | 854,554,884 | ||||||||
A roll forward of fair value measurements using significant unobservable inputs (Level 3) for the six months ended August 31, 2019,was as follows:
| Beginning Balance 2/28/19 | Purchases | Sales | Accrued Discount (Premiums) | Net Realized Gain (Loss) | ||||||||||||||||
Investments in Securities – Assets | ||||||||||||||||||||
Corporate Bonds & Notes: | ||||||||||||||||||||
Commercial Services | $442,750 | $ – | $ – | $ – | $ – | |||||||||||||||
Diversified Financial Services | 8,995,841 | 1,013,930 | †† | – | 54,895 | – | ||||||||||||||
Media | 5 | – | – | – | – | |||||||||||||||
Preferred Stock: | ||||||||||||||||||||
Media | 8,140,789 | – | – | – | – | |||||||||||||||
Common Stock: | ||||||||||||||||||||
Advertising | 913,767 | – | (3,080,312 | )† | – | – | ||||||||||||||
Aerospace & Defense | 214,509 | – | – | – | – | |||||||||||||||
Banks | 8 | – | – | – | – | |||||||||||||||
Media | 9 | – | – | – | – | |||||||||||||||
Warrants: | ||||||||||||||||||||
Advertising | – | 3,080,312 | † | – | – | – | ||||||||||||||
Media | 2 | – | – | – | – | |||||||||||||||
Totals | $18,707,680 | $4,094,242 | $(3,080,312 | ) | $54,895 | $ – | ||||||||||||||
| Net Change in Unrealized Appreciation/ Depreciation | Transfers into Level 3 | Transfers out of Level 3 | Ending Balance 8/31/19 | |||||||||||||
Investments in Securities – Assets | ||||||||||||||||
Corporate Bonds & Notes: | ||||||||||||||||
Commercial Services | $ – | $ – | $ – | $442,750 | ||||||||||||
Diversified Financial Services | (589,031 | ) | – | – | 9,475,635 | |||||||||||
Media | – | – | – | 5 | ||||||||||||
Preferred Stock: | ||||||||||||||||
Media | – | – | – | 8,140,789 | ||||||||||||
Common Stock: | ||||||||||||||||
Advertising | 2,166,545 | – | – | – | ||||||||||||
Aerospace & Defense | (4,314 | ) | – | – | 210,195 | |||||||||||
Banks | – | – | – | 8 | ||||||||||||
Media | – | – | – | 9 | ||||||||||||
Warrants: | ||||||||||||||||
Advertising | (2,955,187 | ) | – | – | 125,125 | |||||||||||
Media | – | – | – | 2 | ||||||||||||
Totals | $(1,381,987 | ) | $ – | $ – | $18,394,518 | |||||||||||
| † | Issued or removed via corporate action. |
| †† | Payment-in-Kind |
| See accompanying Notes to Financial Statements | | August 31, 2019 | | Semi-Annual Report | 27 |
Table of Contents
Schedule of Investments
AllianzGI Convertible & Income Fund
August 31, 2019 (unaudited) (continued)
The table above may include Level 3 investments that are valued by brokers or independent pricing services. The inputs for these investments are not readily available or cannot be reasonably estimated and are generally those inputs described in Note 1(b).
The following table presents additional information about valuation techniques and inputs used for investments that are measured at fair value and categorized within Level 3 at August 31, 2019:
| Ending Balance at 8/31/19 | Valuation Technique Used | Unobservable Inputs | Input Values (Range) | |||||||||||
Investments in Securities – Assets | ||||||||||||||
Corporate Bonds & Notes: |
| |||||||||||||
Diversified Financial Services | $9,475,635 | Market and Company Comparables | | EV Multiples Illiquidity Discount | | | 1.80x (0.38x – 5.71x) 20% | | ||||||
Preferred Stock | $8,140,722 | Market and Company Comparables | | EV Multiples Illiquidity Discount | | | 0.72x (0.21x – 1.45x) 25% | | ||||||
Common Stock | $210,195 | Market and Company Comparables | | EV Multiples M&A Transaction Multiples | | | 0.60x (0.37x – 0.82x) 0.87x (0.32x – 2.12x) 40% | | ||||||
Warrants: |
| |||||||||||||
Advertising | $125,125 | Market and Company Comparables
Black-Scholes Model |
| EV Multiples
Expected Volatility Implied Price |
| | 6.39x (1.26x – 19.85x) 6.44x (1.11x – 30.33x) 25.81% $52.44 | | ||||||
The table above does not include Level 3 investments that are valued by brokers or independent pricing services.
The net change in unrealized appreciation/depreciation of Level 3 investments held at August 31, 2019 was $(4,403,235). The net realized gain (loss) and net change in unrealized appreciation/depreciation are reflected on the Statements of Operations.
Glossary:
| FRN | - | Floating Rate Note | ||
| PIK | - | Payment-in-Kind | ||
| REIT | - | Real Estate Investment Trust |
| 28 | Semi-Annual Report | | August 31, 2019 | | See accompanying Notes to Financial Statements |
Table of Contents
Schedule of Investments
AllianzGI Convertible & Income Fund II
August 31, 2019 (unaudited)
| Principal Amount (000s) | Value | |||||||||||
| Corporate Bonds & Notes – 37.1% | ||||||||||||
| Aerospace & Defense – 1.1% | ||||||||||||
| $5,315 | TransDigm, Inc., 6.50%, 5/15/25 | $5,560,819 | ||||||||||
| 1,320 | Triumph Group, Inc., 7.75%, 8/15/25 | 1,326,600 | ||||||||||
| 6,887,419 | ||||||||||||
| Auto Components – 0.7% | ||||||||||||
| 1,270 | Adient U.S. LLC, 7.00%, 5/15/26 (a)(b) | 1,301,750 | ||||||||||
| 1,875 | Goodyear Tire & Rubber Co., 5.00%, 5/31/26 | 1,863,281 | ||||||||||
| 1,770 | Panther BF Aggregator 2 L.P., 8.50%, 5/15/27 (a)(b) | 1,730,175 | ||||||||||
| 4,895,206 | ||||||||||||
| Auto Manufacturers – 1.1% | ||||||||||||
| 4,685 | Navistar International Corp., 6.625%, 11/1/25 (a)(b) | 4,766,988 | ||||||||||
| 2,485 | Tesla, Inc., 5.30%, 8/15/25 (a)(b) | 2,227,181 | ||||||||||
| 6,994,169 | ||||||||||||
| Chemicals – 2.0% | ||||||||||||
| 4,630 | Chemours Co., 6.625%, 5/15/23 | 4,728,387 | ||||||||||
| 3,640 | Kraton Polymers LLC, 7.00%, 4/15/25 (a)(b) | 3,790,150 | ||||||||||
| 1,295 | Olin Corp., 5.00%, 2/1/30 | 1,298,238 | ||||||||||
| 3,550 | Tronox, Inc., 6.50%, 4/15/26 (a)(b) | 3,385,812 | ||||||||||
| 13,202,587 | ||||||||||||
| Commercial Services – 1.8% | ||||||||||||
| 5,974 | Cenveo Corp., 6.00%, 5/15/24 (cost-$7,400,123; purchased 3/22/12) (a)(b)(c)(d)(f)(i) | 328,570 | ||||||||||
| 1,665 | Herc Holdings, Inc., 5.50%, 7/15/27 (a)(b) | 1,721,194 | ||||||||||
| Hertz Corp. (a)(b), | ||||||||||||
| 2,430 | 7.125%, 8/1/26 | 2,484,396 | ||||||||||
| 1,070 | 7.625%, 6/1/22 | 1,115,529 | ||||||||||
| 2,475 | Laureate Education, Inc., 8.25%, 5/1/25 (a)(b) | 2,707,031 | ||||||||||
| United Rentals North America, Inc., | ||||||||||||
| 1,830 | 5.25%, 1/15/30 | 1,962,675 | ||||||||||
| 1,270 | 5.50%, 7/15/25 | 1,328,737 | ||||||||||
| 11,648,132 | ||||||||||||
| Computers – 0.5% | ||||||||||||
| 3,855 | Harland Clarke Holdings Corp., 9.25%, 3/1/21 (a)(b) | 3,623,700 | ||||||||||
| Containers & Packaging – 0.5% | ||||||||||||
| 1,685 | Berry Global, Inc., 5.625%, 7/15/27 (a)(b) | 1,773,463 | ||||||||||
| 1,655 | Trivium Packaging Finance BV, 8.50%, 8/15/27 (a)(b) | 1,783,262 | ||||||||||
| 3,556,725 | ||||||||||||
| Distribution/Wholesale – 0.7% | ||||||||||||
| 4,110 | H&E Equipment Services, Inc., 5.625%, 9/1/25 | 4,320,637 | ||||||||||
| Diversified Financial Services – 3.4% | ||||||||||||
| 14,516 | CCF Holdings LLC, 10.75%, 12/15/23, PIK 10.75%, (a)(b)(d)(f) | 7,065,101 | ||||||||||
| 6,000 | Community Choice Financial Issuer LLC, 9.00%, 6/15/23 (cost-$6,000,000; purchased 9/6/18) (a)(b)(i) | 6,007,500 | ||||||||||
| Navient Corp., | ||||||||||||
| 1,815 | 6.75%, 6/15/26 | 1,946,588 | ||||||||||
| 905 | 7.25%, 9/25/23 | 1,007,944 | ||||||||||
| See accompanying Notes to Financial Statements | | August 31, 2019 | | Semi-Annual Report | 29 |
Table of Contents
Schedule of Investments
AllianzGI Convertible & Income Fund II
August 31, 2019 (unaudited) (continued)
| Principal Amount (000s) | Value | |||||||||||
| Diversified Financial Services (continued) | ||||||||||||
| Springleaf Finance Corp., | ||||||||||||
| $1,660 | 6.625%, 1/15/28 | $1,826,000 | ||||||||||
| 3,865 | 8.25%, 10/1/23 | 4,541,375 | ||||||||||
| 22,394,508 | ||||||||||||
| Electronic Equipment, Instruments & Components – 0.3% | ||||||||||||
| 1,730 | Energizer Holdings, Inc., 7.75%, 1/15/27 (a)(b) | 1,896,513 | ||||||||||
| Engineering & Construction – 0.9% | ||||||||||||
| 2,165 | AECOM, 5.125%, 3/15/27 | 2,272,211 | ||||||||||
| 3,900 | Tutor Perini Corp., 6.875%, 5/1/25 (a)(b) | 3,641,664 | ||||||||||
| 5,913,875 | ||||||||||||
| Entertainment – 1.2% | ||||||||||||
| 3,810 | AMC Entertainment Holdings, Inc., 6.125%, 5/15/27 | 3,533,775 | ||||||||||
| 1,810 | International Game Technology PLC, 6.25%, 1/15/27 (a)(b) | 1,993,262 | ||||||||||
| 1,945 | Stars Group Holdings BV, 7.00%, 7/15/26 (a)(b) | 2,068,994 | ||||||||||
| 7,596,031 | ||||||||||||
| Food & Beverage – 0.2% | ||||||||||||
| 1,165 | Albertsons Cos. LLC, 7.50%, 3/15/26 (a)(b) | 1,301,888 | ||||||||||
| Healthcare-Products – 0.4% | ||||||||||||
| 2,295 | Avantor, Inc., 9.00%, 10/1/25 (a)(b) | 2,587,613 | ||||||||||
| Healthcare-Services – 2.9% | ||||||||||||
| 1,880 | Centene Corp., 5.375%, 6/1/26 (a)(b) | 2,014,514 | ||||||||||
| 2,165 | CHS/Community Health Systems, Inc., 6.25%, 3/31/23 | 2,102,973 | ||||||||||
| 4,125 | DaVita, Inc., 5.125%, 7/15/24 | 4,206,304 | ||||||||||
| 1,215 | Encompass Health Corp., 5.75%, 11/1/24 | 1,234,744 | ||||||||||
| 2,750 | HCA, Inc., 7.50%, 2/15/22 | 3,086,352 | ||||||||||
| 1,740 | Select Medical Corp., 6.25%, 8/15/26 (a)(b) | 1,814,820 | ||||||||||
| Tenet Healthcare Corp., | ||||||||||||
| 1,660 | 6.25%, 2/1/27 (a)(b) | 1,724,325 | ||||||||||
| 2,750 | 7.00%, 8/1/25 | 2,787,812 | ||||||||||
| 18,971,844 | ||||||||||||
| Insurance – 0.6% | ||||||||||||
| 3,320 | Prudential Financial, Inc., 5.70%, 9/15/48 (converts to FRN on 9/15/28) | 3,631,139 | ||||||||||
| Internet – 0.6% | ||||||||||||
| 1,700 | Go Daddy Operating Co. LLC, 5.25%, 12/1/27 (a)(b) | 1,799,875 | ||||||||||
| 1,755 | Netflix, Inc., 5.375%, 11/15/29 (a)(b) | 1,912,950 | ||||||||||
| 3,712,825 | ||||||||||||
| Iron/Steel – 0.2% | ||||||||||||
| 1,330 | United States Steel Corp., 6.875%, 8/15/25 | 1,268,887 | ||||||||||
| Lodging – 0.7% | ||||||||||||
| 1,325 | MGM Resorts International, 5.50%, 4/15/27 | 1,439,281 | ||||||||||
| 1,000 | Wyndham Hotels & Resorts, Inc., 5.375%, 4/15/26 (a)(b) | 1,052,500 | ||||||||||
| 2,280 | Wynn Las Vegas LLC, 5.50%, 3/1/25 (a)(b) | 2,411,100 | ||||||||||
| 4,902,881 | ||||||||||||
| Machinery-Construction & Mining – 0.6% | ||||||||||||
| 3,585 | Terex Corp., 5.625%, 2/1/25 (a)(b) | 3,652,470 | ||||||||||
| 30 | Semi-Annual Report | | August 31, 2019 | | See accompanying Notes to Financial Statements |
Table of Contents
Schedule of Investments
AllianzGI Convertible & Income Fund II
August 31, 2019 (unaudited) (continued)
| Principal Amount (000s) | Value | |||||||||||
| Media – 3.4% | ||||||||||||
| $5,630 | Cablevision Systems Corp., 8.00%, 4/15/20 | $5,805,937 | ||||||||||
| 1,050 | Clear Channel Worldwide Holdings, Inc., 9.25%, 2/15/24 (a)(b) | 1,153,688 | ||||||||||
| CSC Holdings LLC (a)(b), | ||||||||||||
| 1,705 | 7.50%, 4/1/28 | 1,926,650 | ||||||||||
| 2,325 | 7.75%, 7/15/25 | 2,502,281 | ||||||||||
| Diamond Sports Group LLC (a)(b), | ||||||||||||
| 610 | 5.375%, 8/15/26 | 642,025 | ||||||||||
| 1,680 | 6.625%, 8/15/27 | 1,764,000 | ||||||||||
| 2,850 | Gray Television, Inc., 5.875%, 7/15/26 (a)(b) | 2,985,375 | ||||||||||
| 3,589 | LiveStyle, Inc., 9.625%, 2/1/19 (cost-$3,586,663; purchased 5/7/14-2/26/15) (a)(b)(c)(d)(f)(i)(k) | 4 | ||||||||||
| 2,150 | Meredith Corp., 6.875%, 2/1/26 | 2,279,000 | ||||||||||
| 1,740 | Nexstar Escrow, Inc., 5.625%, 7/15/27 (a)(b) | 1,818,300 | ||||||||||
| 1,145 | Virgin Media Secured Finance PLC, 5.50%, 5/15/29 (a)(b) | 1,199,387 | ||||||||||
| 22,076,647 | ||||||||||||
| Metal Fabricate/Hardware – 0.4% | ||||||||||||
| 2,920 | Park-Ohio Industries, Inc., 6.625%, 4/15/27 | 2,817,800 | ||||||||||
| Mining – 1.3% | ||||||||||||
| 3,365 | Constellium SE, 6.625%, 3/1/25 (a)(b) | 3,531,147 | ||||||||||
| 1,535 | Hudbay Minerals, Inc., 7.625%, 1/15/25 (a)(b) | 1,565,669 | ||||||||||
| 3,050 | Joseph T. Ryerson & Son, Inc., 11.00%, 5/15/22 (a)(b) | 3,203,453 | ||||||||||
| 8,300,269 | ||||||||||||
| Miscellaneous Manufacturing – 0.2% | ||||||||||||
| 1,320 | Koppers, Inc., 6.00%, 2/15/25 (a)(b) | 1,290,300 | ||||||||||
| Oil, Gas & Consumable Fuels – 1.5% | ||||||||||||
| 1,420 | Carrizo Oil & Gas, Inc., 6.25%, 4/15/23 | 1,365,330 | ||||||||||
| 1,375 | Chesapeake Energy Corp., 8.00%, 1/15/25 | 1,048,437 | ||||||||||
| 3,745 | Oasis Petroleum, Inc., 6.875%, 3/15/22 | 3,501,575 | ||||||||||
| 2,430 | Transocean, Inc., 7.50%, 1/15/26 (a)(b) | 2,229,525 | ||||||||||
| 1,750 | USA Compression Partners L.P., 6.875%, 9/1/27 (a)(b) | 1,808,765 | ||||||||||
| 9,953,632 | ||||||||||||
| Paper & Forest Products – 0.3% | ||||||||||||
| 1,790 | Mercer International, Inc., 7.375%, 1/15/25 | 1,848,175 | ||||||||||
| Pharmaceuticals – 1.0% | ||||||||||||
| 1,235 | Bausch Health Americas, Inc., 8.50%, 1/31/27 (a)(b) | 1,373,913 | ||||||||||
| Bausch Health Cos., Inc. (a)(b), | ||||||||||||
| 1,200 | 6.125%, 4/15/25 | 1,239,000 | ||||||||||
| 1,280 | 7.25%, 5/30/29 | 1,356,800 | ||||||||||
| 1,595 | Endo Finance LLC, 5.375%, 1/15/23 (a)(b) | 1,092,575 | ||||||||||
| 1,710 | Horizon Pharma USA, Inc., 5.50%, 8/1/27 (a)(b) | 1,786,950 | ||||||||||
| 6,849,238 | ||||||||||||
| Pipelines – 0.8% | ||||||||||||
| 1,670 | DCP Midstream Operating L.P., 5.125%, 5/15/29 | 1,713,921 | ||||||||||
| 1,640 | NGL Energy Partners L.P., 7.50%, 4/15/26 (a)(b) | 1,664,600 | ||||||||||
| Targa Resources Partners L.P. (a)(b), | ||||||||||||
| 750 | 6.50%, 7/15/27 | 815,625 | ||||||||||
| See accompanying Notes to Financial Statements | | August 31, 2019 | | Semi-Annual Report | 31 |
Table of Contents
Schedule of Investments
AllianzGI Convertible & Income Fund II
August 31, 2019 (unaudited) (continued)
| Principal Amount (000s) | Value | |||||||||||
| Pipelines (continued) | ||||||||||||
| $815 | 6.875%, 1/15/29 | $902,612 | ||||||||||
| 5,096,758 | ||||||||||||
| Real Estate – 0.7% | ||||||||||||
| 4,205 | Kennedy-Wilson, Inc., 5.875%, 4/1/24 | 4,325,894 | ||||||||||
| Retail – 1.2% | ||||||||||||
| 4,820 | Conn’s, Inc., 7.25%, 7/15/22 | 4,820,000 | ||||||||||
| 1,170 | L Brands, Inc., 6.875%, 11/1/35 | 994,500 | ||||||||||
| 1,805 | Party City Holdings, Inc., 6.625%, 8/1/26 (a)(b) | 1,723,775 | ||||||||||
| 7,538,275 | ||||||||||||
| Semiconductors – 0.4% | ||||||||||||
| 2,650 | Amkor Technology, Inc., 6.625%, 9/15/27 (a)(b) | 2,898,384 | ||||||||||
| Software – 1.3% | ||||||||||||
| 3,850 | Camelot Finance S.A., 7.875%, 10/15/24 (a)(b) | 4,032,875 | ||||||||||
| 1,780 | IQVIA, Inc., 5.00%, 5/15/27 (a)(b) | 1,884,575 | ||||||||||
| 685 | Rackspace Hosting, Inc., 8.625%, 11/15/24 (a)(b) | 631,912 | ||||||||||
| 1,770 | SS&C Technologies, Inc., 5.50%, 9/30/27 (a)(b) | 1,861,819 | ||||||||||
| 8,411,181 | ||||||||||||
| Telecommunications – 3.9% | ||||||||||||
| 1,735 | CenturyLink, Inc., 7.50%, 4/1/24, Ser. Y | 1,930,153 | ||||||||||
| 3,560 | Cincinnati Bell, Inc., 7.00%, 7/15/24 (a)(b) | 3,266,300 | ||||||||||
| 7,130 | Consolidated Communications, Inc., 6.50%, 10/1/22 | 6,702,200 | ||||||||||
| 650 | GTT Communications, Inc., 7.875%, 12/31/24 (a)(b) | 416,000 | ||||||||||
| Hughes Satellite Systems Corp., | ||||||||||||
| 1,130 | 6.625%, 8/1/26 | 1,220,400 | ||||||||||
| 3,500 | 7.625%, 6/15/21 | 3,788,750 | ||||||||||
| 5,545 | Sprint Communications, Inc., 11.50%, 11/15/21 | 6,529,238 | ||||||||||
| 1,425 | Sprint Corp., 7.625%, 3/1/26 | 1,604,906 | ||||||||||
| 25,457,947 | ||||||||||||
| Transportation – 0.3% | ||||||||||||
| 2,060 | XPO Logistics, Inc., 6.50%, 6/15/22 (a)(b) | 2,110,326 | ||||||||||
| Total Corporate Bonds & Notes (cost-$255,356,142) | 241,933,875 | |||||||||||
| Convertible Bonds & Notes – 34.1% | ||||||||||||
| Aerospace & Defense – 0.1% | ||||||||||||
| 645 | Arconic, Inc., 1.625%, 10/15/19 | 645,053 | ||||||||||
| Agriculture – 0.7% | ||||||||||||
| 4,335 | Vector Group Ltd., 3 mo. Cash Dividends on Common Stock + 1.75%, 1.75%, 4/15/20 (h) | 4,480,656 | ||||||||||
| Apparel & Textiles – 0.7% | ||||||||||||
| 11,140 | Iconix Brand Group, Inc., 5.75%, 8/15/23 | 4,734,500 | ||||||||||
| Biotechnology – 1.1% | ||||||||||||
| 7,260 | Intercept Pharmaceuticals, Inc., 3.25%, 7/1/23 | 6,234,525 | ||||||||||
| 1,355 | Verastem, Inc., 5.00%, 11/1/48 | 619,912 | ||||||||||
| 6,854,437 | ||||||||||||
| Building Materials – 1.4% | ||||||||||||
| 3,225 | Cemex S.A.B de C.V., 3.72%, 3/15/20 | 3,229,559 | ||||||||||
| 6,680 | Patrick Industries, Inc., 1.00%, 2/1/23 | 5,699,137 | ||||||||||
| 8,928,696 | ||||||||||||
| 32 | Semi-Annual Report | | August 31, 2019 | | See accompanying Notes to Financial Statements |
Table of Contents
Schedule of Investments
AllianzGI Convertible & Income Fund II
August 31, 2019 (unaudited) (continued)
| Principal Amount (000s) | Value | |||||||||||
| Commercial Services – 2.1% | ||||||||||||
| $7,960 | Huron Consulting Group, Inc., 1.25%, 10/1/19 | $7,934,505 | ||||||||||
| 6,675 | Macquarie Infrastructure Corp., 2.00%, 10/1/23 | 6,066,488 | ||||||||||
| 14,000,993 | ||||||||||||
| Computers – 1.4% | ||||||||||||
| 850 | Lumentum Holdings, Inc., 0.25%, 3/15/24 | 1,014,028 | ||||||||||
| 8,865 | Western Digital Corp., 1.50%, 2/1/24 (a)(b) | 8,373,852 | ||||||||||
| 9,387,880 | ||||||||||||
| Diversified Financial Services – 2.5% | ||||||||||||
| 7,030 | Encore Capital Group, Inc., 3.00%, 7/1/20 | 7,215,548 | ||||||||||
| 9,160 | PRA Group, Inc., 3.00%, 8/1/20 | 9,116,445 | ||||||||||
| 16,331,993 | ||||||||||||
| Electronics – 1.2% | ||||||||||||
| 4,205 | OSI Systems, Inc., 1.25%, 9/1/22 | 4,786,564 | ||||||||||
| 3,230 | Vishay Intertechnology, Inc., 2.25%, 6/15/25 | 3,006,524 | ||||||||||
| 7,793,088 | ||||||||||||
| Energy-Alternate Sources – 4.1% | ||||||||||||
| 5,160 | Pattern Energy Group, Inc., 4.00%, 7/15/20 | 5,391,114 | ||||||||||
| SunPower Corp., | ||||||||||||
| 2,365 | 0.875%, 6/1/21 | 2,211,275 | ||||||||||
| 7,095 | 4.00%, 1/15/23 | 6,559,327 | ||||||||||
| 12,690 | Tesla Energy Operations, Inc., 1.625%, 11/1/19 | 12,459,077 | ||||||||||
| 26,620,793 | ||||||||||||
| Engineering & Construction – 0.6% | ||||||||||||
| 4,125 | Tutor Perini Corp., 2.875%, 6/15/21 | 3,786,982 | ||||||||||
| Equity Real Estate Investment Trusts (REITs) – 1.4% | ||||||||||||
| 3,025 | Two Harbors Investment Corp., 6.25%, 1/15/22 | 3,119,536 | ||||||||||
| 5,810 | Western Asset Mortgage Capital Corp., 6.75%, 10/1/22 | 5,835,419 | ||||||||||
| 8,954,955 | ||||||||||||
| Insurance – 2.6% | ||||||||||||
| 8,605 | AXA S.A., 7.25%, 5/15/21 (a)(b) | 8,804,316 | ||||||||||
| 6,005 | MGIC Investment Corp., 9.00%, 4/1/63 (a)(b) | 8,091,737 | ||||||||||
| 16,896,053 | ||||||||||||
| Internet – 0.2% | ||||||||||||
| 1,935 | Boingo Wireless, Inc., 1.00%, 10/1/23 (a)(b) | 1,628,027 | ||||||||||
| Investment Companies – 1.2% | ||||||||||||
| 7,205 | Prospect Capital Corp., 6.375%, 3/1/25 | 7,625,468 | ||||||||||
| Oil, Gas & Consumable Fuels – 2.0% | ||||||||||||
| 4,905 | Chesapeake Energy Corp., 5.50%, 9/15/26 | 3,104,395 | ||||||||||
| 2,030 | Ensco Jersey Finance Ltd., 3.00%, 1/31/24 | 1,448,913 | ||||||||||
| 1,720 | Nabors Industries, Inc., 0.75%, 1/15/24 | 1,131,410 | ||||||||||
| 7,525 | Whiting Petroleum Corp., 1.25%, 4/1/20 | 7,415,338 | ||||||||||
| 13,100,056 | ||||||||||||
| Pharmaceuticals – 2.0% | ||||||||||||
| 9,210 | Dermira, Inc., 3.00%, 5/15/22 | 7,894,471 | ||||||||||
| 7,445 | Tilray, Inc., 5.00%, 10/1/23 (a)(b) | 4,922,475 | ||||||||||
| 12,816,946 | ||||||||||||
| See accompanying Notes to Financial Statements | | August 31, 2019 | | Semi-Annual Report | 33 |
Table of Contents
Schedule of Investments
AllianzGI Convertible & Income Fund II
August 31, 2019 (unaudited) (continued)
| Principal Amount (000s) | Value | |||||||||||
| Pipelines – 2.2% | ||||||||||||
| $18,700 | Cheniere Energy, Inc., 4.25%, 3/15/45 | $14,539,250 | ||||||||||
| Semiconductors – 0.7% | ||||||||||||
| 320 | Advanced Micro Devices, Inc., 2.125%, 9/1/26 | 1,286,063 | ||||||||||
| 1,080 | Synaptics, Inc., 0.50%, 6/15/22 | 980,042 | ||||||||||
| 2,970 | Veeco Instruments, Inc., 2.70%, 1/15/23 | 2,614,565 | ||||||||||
| 4,880,670 | ||||||||||||
| Software – 3.2% | ||||||||||||
| 4,400 | Avaya Holdings Corp., 2.25%, 6/15/23 | 4,123,780 | ||||||||||
| 11,915 | Avid Technology, Inc., 2.00%, 6/15/20 | 11,706,488 | ||||||||||
| Evolent Health, Inc., | ||||||||||||
| 860 | 1.50%, 10/15/25 (a)(b) | 549,582 | ||||||||||
| 4,800 | 2.00%, 12/1/21 | 4,203,760 | ||||||||||
| 20,583,610 | ||||||||||||
| Telecommunications – 1.7% | ||||||||||||
| 5,735 | GDS Holdings Ltd., 2.00%, 6/1/25 | 5,961,447 | ||||||||||
| 5,985 | Infinera Corp., 2.125%, 9/1/24 | 5,153,785 | ||||||||||
| 11,115,232 | ||||||||||||
| Transportation – 1.0% | ||||||||||||
| 3,440 | Echo Global Logistics, Inc., 2.50%, 5/1/20 | 3,434,070 | ||||||||||
| 3,555 | Teekay Corp., 5.00%, 1/15/23 | 2,861,775 | ||||||||||
| 6,295,845 | ||||||||||||
| Total Convertible Bonds & Notes (cost-$226,119,455) | 222,001,183 | |||||||||||
| Shares | ||||||||||||
| Convertible Preferred Stock – 25.5% | ||||||||||||
| Banks – 4.9% | ||||||||||||
| 9,140 | Bank of America Corp., 7.25%, Ser. L (e) | 13,472,360 | ||||||||||
| 12,835 | Wells Fargo & Co., 7.50%, Ser. L (e) | 18,624,868 | ||||||||||
| 32,097,228 | ||||||||||||
| Chemicals – 0.7% | ||||||||||||
| 106,705 | International Flavors & Fragrances, Inc., 6.00%, 9/15/21 | 4,681,148 | ||||||||||
| Diversified Financial Services – 0.9% | ||||||||||||
| 124,400 | AMG Capital Trust II, 5.15%, 10/15/37 | 5,838,775 | ||||||||||
| Electric Utilities – 5.1% | ||||||||||||
| 83,335 | CenterPoint Energy, Inc., 7.00%, 9/1/21, Ser. B | 4,120,916 | ||||||||||
| 58,140 | Dominion Energy, Inc., 7.25%, 6/1/22, Ser. A | 5,927,373 | ||||||||||
| 111,635 | NextEra Energy, Inc., 6.123%, 9/1/19 | 7,717,327 | ||||||||||
| 121,195 | Sempra Energy, 6.00%, 1/15/21, Ser. A | 13,968,936 | ||||||||||
| 26,500 | Southern Co., 6.75%, 8/1/22, Ser. 2019 | 1,376,940 | ||||||||||
| 33,111,492 | ||||||||||||
| Electronics – 1.1% | ||||||||||||
| 7,625 | Fortive Corp., 5.00%, 7/1/21, Ser. A | 7,151,775 | ||||||||||
| Equity Real Estate Investment Trusts (REITs) – 5.2% | ||||||||||||
| 5,650 | Crown Castle International Corp., 6.875%, 8/1/20, Ser. A | 7,352,627 | ||||||||||
| 43,045 | QTS Realty Trust, Inc., 6.50%, Ser. B (e) | 5,074,145 | ||||||||||
| 309,935 | Ready Capital Corp., 7.00%, 8/15/23 | 8,287,662 | ||||||||||
| 476,235 | RLJ Lodging Trust, 1.95%, Ser. A (e) | 12,872,632 | ||||||||||
| 33,587,066 | ||||||||||||
| 34 | Semi-Annual Report | | August 31, 2019 | | See accompanying Notes to Financial Statements |
Table of Contents
Schedule of Investments
AllianzGI Convertible & Income Fund II
August 31, 2019 (unaudited) (continued)
| Shares | Value | |||||||||||
| Hand/Machine Tools – 1.6% | ||||||||||||
| 18,285 | Colfax Corp., 5.75%, 1/15/22 | $2,256,186 | ||||||||||
| 85,590 | Stanley Black & Decker, Inc., 5.375%, 5/15/20 | 8,126,771 | ||||||||||
| 10,382,957 | ||||||||||||
| Healthcare-Products – 3.8% | ||||||||||||
| 63,980 | Avantor, Inc., 6.25%, 5/15/22, Ser. A | 3,929,652 | ||||||||||
| 214,580 | Becton Dickinson and Co., 6.125%, 5/1/20, Ser. A | 13,324,345 | ||||||||||
| 6,470 | Danaher Corp., 4.75%, 4/15/22, Ser. A | 7,382,076 | ||||||||||
| 24,636,073 | ||||||||||||
| Insurance – 2.1% | ||||||||||||
| 111,400 | Assurant, Inc., 6.50%, 3/15/21, Ser. D | 13,652,070 | ||||||||||
| Oil, Gas & Consumable Fuels – 0.1% | ||||||||||||
| 51,395 | Nabors Industries Ltd., 6.00%, 5/1/21, Ser. A | 776,064 | ||||||||||
| Total Convertible Preferred Stock (cost-$146,919,201) | 165,914,648 | |||||||||||
| Preferred Stock(a)(d)(f)(k) – 1.2% | ||||||||||||
| Media – 1.2% | ||||||||||||
| 3,554 | LiveStyle, Inc., Ser. A | 483,522 | ||||||||||
| 76,572 | LiveStyle, Inc., Ser. B (g)(j) | 7,657,200 | ||||||||||
| 5,000 | LiveStyle, Inc., Ser. B (j) | 50 | ||||||||||
| Total Preferred Stock (cost-$12,855,447) | 8,140,772 | |||||||||||
| Common Stock(d)(f)(j) – 0.0% | ||||||||||||
| Aerospace & Defense – 0.0% | ||||||||||||
| 6,354 | Erickson, Inc. (a) | 161,011 | ||||||||||
| Banks – 0.0% | ||||||||||||
| 42,233 | CCF Holdings LLC Class A (cost-$0; purchased 12/18/18) (i) | 4 | ||||||||||
| 21,429 | CCF Holdings LLC Class B (cost-$0; purchased 12/12/18) (g)(i) | 2 | ||||||||||
| 6 | ||||||||||||
| Media – 0.0% | ||||||||||||
| 90,407 | LiveStyle, Inc. (a)(g)(k) | 9 | ||||||||||
| Total Common Stock (cost-$5,471,183) | 161,026 | |||||||||||
| Units | ||||||||||||
| Warrants(d)(f)(j) – 0.0% | ||||||||||||
| Advertising – 0.0% | ||||||||||||
| 12,009 | Affinion Group Holdings, Inc., expires 4/1/24 (cost-$2,371,020; purchased 4/10/19) (i) | 96,311 | ||||||||||
| Media – 0.0% | ||||||||||||
| 19,500 | LiveStyle, Inc., Ser. C, expires 11/30/21 (a)(k) | 2 | ||||||||||
| Total Warrants (cost-$2,371,020) | 96,313 | |||||||||||
| See accompanying Notes to Financial Statements | | August 31, 2019 | | Semi-Annual Report | 35 |
Table of Contents
Schedule of Investments
AllianzGI Convertible & Income Fund II
August 31, 2019 (unaudited) (continued)
| Principal Amount (000s) | Value | |||||||||||
| Repurchase Agreements – 2.1% | ||||||||||||
| $13,617 | State Street Bank and Trust Co., dated 8/30/19, 0.42%, due 9/3/19, proceeds $13,617,635; collateralized by U.S. Treasury Notes, 2.50%, due 1/15/22, valued at $13,893,502 including accrued interest (cost-$13,617,000) | $ 13,617,000 | ||||||||||
| Total Investments(cost-$662,709,448) – 100.0% | 651,864,817 | |||||||||||
| Other assets in excess of liabilities | 1,428,406 | |||||||||||
| Preferred Shares | (271,525,000 | ) | ||||||||||
| Net Assets – 100.0% | $381,768,223 | |||||||||||
Notes to Schedule of Investments:
| (a) | Private Placement–Restricted as to resale and may not have a readily available market. Securities with an aggregate value of $173,034,683, representing 26.5% of total investments. |
| (b) | 144A–Exempt from registration under Rule 144A of the Securities Act of 1933. These securities may be resold in transactions exempt from registration, typically only to qualified institutional buyers. Securities with an aggregate value of $164,732,889, representing 25.3% of total investments. |
| (c) | In default. |
| (d) | Fair-Valued–Securities with an aggregate value of $15,791,786, representing 2.4% of total investments. See Note 1(a) and Note 1(b) in the Notes to Financial Statements. |
| (e) | Perpetual maturity. The date shown, if any, is the next call date. |
| (f) | Level 3 security. See Note 1(a) and Note 1(b) in the Notes to Financial Statements. |
| (g) | Affiliated security. |
| (h) | In addition to the coupon rate shown, the issuer is expected to pay additional interest based on the actual dividends paid on its common stock. |
| (i) | Restricted. The aggregate cost of such securities is $19,357,806. The aggregate value is $6,432,391, representing 1.0% of total investments. |
| (j) | Non-income producing. |
| (k) | A member of the Fund’s portfolio management team is a member of the board of directors of LiveStyle, Inc. The Fund’s aggregate value of investments in LiveStyle, Inc. represents 1.2% of total investments. |
| (l) | Fair Value Measurements–See Note 1(b) in the Notes to Financial Statements. |
| Level 1 – Quoted Prices | Level 2 – Other Significant Observable Inputs | Level 3 – Significant Unobservable Inputs | Value at 8/31/19 | |||||||||||||
Investments in Securities – Assets |
| |||||||||||||||
Corporate Bonds & Notes: |
| |||||||||||||||
Commercial Services | $ | – | $11,319,562 | $328,570 | $11,648,132 | |||||||||||
Diversified Financial Services | – | 15,329,407 | 7,065,101 | 22,394,508 | ||||||||||||
Media | – | 22,076,643 | 4 | 22,076,647 | ||||||||||||
All Other | – | 185,814,588 | – | 185,814,588 | ||||||||||||
Convertible Bonds & Notes | – | 222,001,183 | – | 222,001,183 | ||||||||||||
Convertible Preferred Stock: |
| |||||||||||||||
Diversified Financial Services | – | 5,838,775 | – | 5,838,775 | ||||||||||||
Electronics | – | 7,151,775 | – | 7,151,775 | ||||||||||||
Equity Real Estate Investment Trusts (REITs) | 26,234,439 | 7,352,627 | – | 33,587,066 | ||||||||||||
Hand/Machine Tools | 2,256,186 | 8,126,771 | – | 10,382,957 | ||||||||||||
Healthcare-Products | 11,311,728 | 13,324,345 | – | 24,636,073 | ||||||||||||
All Other | 84,318,002 | – | – | 84,318,002 | ||||||||||||
| 36 | Semi-Annual Report | | August 31, 2019 | | See accompanying Notes to Financial Statements |
Table of Contents
Schedule of Investments
AllianzGI Convertible & Income Fund II
August 31, 2019 (unaudited) (continued)
| Level 1 – Quoted Prices | Level 2 – Other Significant Observable Inputs | Level 3 – Significant Unobservable Inputs | Value at 8/31/19 | |||||||||||||
Preferred Stock | $ | – | $– | $8,140,772 | $8,140,772 | |||||||||||
Common Stock | – | – | 161,026 | 161,026 | ||||||||||||
Warrants | – | – | 96,313 | 96,313 | ||||||||||||
Repurchase Agreements | – | 13,617,000 | – | 13,617,000 | ||||||||||||
Totals | $ | 124,120,355 | $ | 511,952,676 | $ | 15,791,786 | $ | 651,864,817 | ||||||||
A roll forward of fair value measurements using significant unobservable inputs (Level 3) for the six months ended August 31, 2019, was as follows:
| Beginning Balance 2/28/19 | Purchases | Sales | Accrued Discount (Premiums) | Net Realized Gain (Loss) | ||||||||||||||||
Investments in Securities – Assets |
| |||||||||||||||||||
Corporate Bonds & Notes: |
| |||||||||||||||||||
Commercial Services | $ 328,570 | $ – | $ – | $ – | $ – | |||||||||||||||
Diversified Financial Services | 6,707,363 | 755,993 | †† | – | 41,108 | – | ||||||||||||||
Media | 4 | – | – | – | – | |||||||||||||||
Preferred Stock: |
| |||||||||||||||||||
Media | 8,140,772 | – | – | – | – | |||||||||||||||
Common Stock: |
| |||||||||||||||||||
Advertising | 703,341 | – | (2,371,020 | )† | – | – | ||||||||||||||
Aerospace & Defense | 164,315 | – | – | – | – | |||||||||||||||
Banks | 6 | – | – | – | – | |||||||||||||||
Media | 9 | – | – | – | – | |||||||||||||||
Warrants: |
| |||||||||||||||||||
Advertising | – | 2,371,020 | † | – | – | – | ||||||||||||||
Media | 2 | – | – | – | – | |||||||||||||||
Totals | $16,044,382 | $3,127,013 | $(2,371,020 | ) | $41,108 | $ – | ||||||||||||||
| Net Change in Unrealized Appreciation/ Depreciation | Transfers into Level 3 | Transfers out of Level 3 | Ending Balance 8/31/19 | |||||||||||||
Investments in Securities – Assets |
| |||||||||||||||
Corporate Bonds & Notes: |
| |||||||||||||||
Commercial Services | $ – | $ – | $ – | $ 328,570 | ||||||||||||
Diversified Financial Services | (439,363 | ) | – | – | 7,065,101 | |||||||||||
Media | – | – | – | 4 | ||||||||||||
Preferred Stock: |
| |||||||||||||||
Media | – | – | – | 8,140,772 | ||||||||||||
Common Stock: |
| |||||||||||||||
Advertising | 1,667,679 | – | – | – | ||||||||||||
Aerospace & Defense | (3,304 | ) | – | – | 161,011 | |||||||||||
Banks | – | – | – | 6 | ||||||||||||
Media | – | – | – | 9 | ||||||||||||
Warrants: |
| |||||||||||||||
Advertising | (2,274,709 | ) | – | – | 96,311 | |||||||||||
Media | – | – | – | 2 | ||||||||||||
Totals | $(1,049,697 | ) | $ – | $ – | $15,791,786 | |||||||||||
| † | Issued or removed via corporate action. |
| †† | Payment-in-Kind |
| See accompanying Notes to Financial Statements | | August 31, 2019 | | Semi-Annual Report | 37 |
Table of Contents
Schedule of Investments
AllianzGI Convertible & Income Fund II
August 31, 2019 (unaudited) (continued)
The table above may include Level 3 investments that are valued by brokers or independent pricing services. The inputs for these investments are not readily available or cannot be reasonably estimated and are generally those inputs described in Note 1(b).
The following tables present additional information about valuation techniques and inputs used for investments that are measured at fair value and categorized within Level 3 at August 31, 2019:
| Ending Balance at 8/31/19 | Valuation Technique Used | Unobservable Inputs | Input Values (Range) | |||||||||||||
Investments in Securities – Assets |
| |||||||||||||||
Corporate Bonds & Notes: |
| |||||||||||||||
Diversified Financial Services | �� | $7,065,101 | | Market and Company Comparables | | | EV Multiples Illiquidity Discount | | | 1.80x (0.38x – 5.71x) 20% | | |||||
Preferred Stock | $8,140,722 | | Market and Company Comparables | | | EV Multiples Illiquidity Discount |
| | 0.72x (0.21x – 1.45x) 25% | | ||||||
Common Stock | $161,010 | | Market and Company Comparables | | | EV Multiples M&A Transaction Multiples Illiquidity Discount |
| | 0.60x (0.37x – 0.82x) 0.87x (0.32x – 2.12x) 40% | | ||||||
Warrants: | ||||||||||||||||
Advertising | $96,311 | | Market and Company Comparables | | EV Multiples | | 6.39x (1.26x – 19.85x) 6.44x (1.11x – 30.33x) |
| ||||||||
| Black-Scholes Model | Expected Volatility | 25.81% | ||||||||||||||
| Implied Price | $52.44 | |||||||||||||||
The table above does not include Level 3 investments that are valued by brokers or independent pricing services.
The net change in unrealized appreciation/depreciation of Level 3 investments held at August 31, 2019 was $(3,354,472). The net realized gain (loss) and net change in unrealized appreciation/depreciation are reflected on the Statements of Operations.
Glossary:
| FRN | - | Floating Rate Note | ||
| PIK | - | Payment-in-Kind | ||
| REIT | - | Real Estate Investment Trust |
| 38 | Semi-Annual Report | | August 31, 2019 | | See accompanying Notes to Financial Statements |
Table of Contents
Statements of Assets and Liabilities
AllianzGI Convertible & Income Funds
August 31, 2019 (unaudited)
| Convertible & Income 2024 Target Term | Convertible & Income | Convertible & Income II | ||||||||||||||||||||||
| Assets: | ||||||||||||||||||||||||
| Investments, at value, including securities on loan of $61,472,032, $25,023,588 and $0, respectively(cost-$252,531,330, $863,094,191 and $655,202,431, respectively) | $249,053,706 | $846,897,667 | $644,207,606 | |||||||||||||||||||||
| Investments in Affiliates, at value (cost- $0, $7,507,017 and $7,507,017, respectively) | – | 7,657,217 | 7,657,211 | |||||||||||||||||||||
| Cash | 53,380 | 139 | 783 | |||||||||||||||||||||
| Interest and dividends receivable | 2,350,469 | 10,066,352 | 7,647,794 | |||||||||||||||||||||
| Receivable for investments sold | 909,760 | – | – | |||||||||||||||||||||
| Receivable for principal paydowns | 27,250 | – | – | |||||||||||||||||||||
| Investments in Affiliated Funds – Trustees Deferred Compensation Plan (see Note 3) | 18,035 | 138,194 | 105,188 | |||||||||||||||||||||
| Prepaid expenses | 15,769 | 79,364 | 43,262 | |||||||||||||||||||||
Total Assets | 252,428,369 | 864,838,933 | 659,661,844 | |||||||||||||||||||||
| Liabilities: | ||||||||||||||||||||||||
| Loan payable (see Note 8) | 69,700,000 | 28,851,500 | – | |||||||||||||||||||||
| Payable for investments purchased | 3,372,734 | 1,399,154 | 1,069,017 | |||||||||||||||||||||
| Dividends payable to common and preferred shareholders | 839,823 | 5,932,886 | 4,664,537 | |||||||||||||||||||||
| Loan interest payable | 185,524 | 76,610 | – | |||||||||||||||||||||
| Investment management fees payable | 156,818 | 504,665 | 384,882 | |||||||||||||||||||||
| Trustees Deferred Compensation Plan payable (see Note 3) | 18,035 | 138,194 | 105,188 | |||||||||||||||||||||
| Accrued expenses | 121,833 | 148,788 | 144,997 | |||||||||||||||||||||
Total Liabilities | 74,394,767 | 37,051,797 | 6,368,621 | |||||||||||||||||||||
| Auction-Rate Preferred Shares ($25,000 liquidation preference per share applicable to an aggregate of 0, 8,931 and 6,501 shares issued and outstanding, respectively) | – | 223,275,000 | 162,525,000 | |||||||||||||||||||||
| Cumulative Preferred Shares ($25.00 liquidation preference per share applicable to an aggregate of 0, 4,000,000 and 4,360,000 shares issued and outstanding, respectively) | – | 100,000,000 | 109,000,000 | |||||||||||||||||||||
| Net Assets Applicable to Common Shareholders | $178,033,602 | $504,512,136 | $381,768,223 | |||||||||||||||||||||
| Composition of Net Assets Applicable to Common Shareholders: | ||||||||||||||||||||||||
| Common Shares: | ||||||||||||||||||||||||
Par value ($0.00001 per share) | $183 | $900 | $759 | |||||||||||||||||||||
Paid-in-capital in excess of par | 179,013,845 | 778,035,742 | 595,913,264 | |||||||||||||||||||||
| Total distributable earnings (loss) | (980,426) | (273,524,506) | (214,145,800) | |||||||||||||||||||||
| Net Assets Applicable to Common Shareholders | $178,033,602 | $504,512,136 | $381,768,223 | |||||||||||||||||||||
| Common Shares Issued and Outstanding | 18,257,012 | 90,009,324 | 75,927,490 | |||||||||||||||||||||
| Net Asset Value Per Common Share | $9.75 | $5.61 | $5.03 | |||||||||||||||||||||
| See accompanying Notes to Financial Statements | | August 31, 2019 | | Semi-Annual Report | 39 |
Table of Contents
AllianzGI Convertible & Income Funds
Six Months ended August 31, 2019 (unaudited)
| Convertible & Income 2024 Target Term | Convertible & Income | Convertible & Income II | ||||||||||||||||||||||
| Investment Income: | ||||||||||||||||||||||||
| Interest | $6,319,711 | $21,979,997 | $16,729,095 | |||||||||||||||||||||
| Dividends | – | 6,445,415 | 4,883,305 | |||||||||||||||||||||
| Miscellaneous | 20,333 | – | – | |||||||||||||||||||||
Total Investment Income | 6,340,044 | 28,425,412 | 21,612,400 | |||||||||||||||||||||
| Expenses: | ||||||||||||||||||||||||
| Investment management | 933,406 | 3,001,509 | 2,288,308 | |||||||||||||||||||||
| Loan interest | 1,083,564 | 448,635 | – | |||||||||||||||||||||
| Auction agent and commissions | – | 107,570 | 88,587 | |||||||||||||||||||||
| Line of credit commitment | – | 65,382 | 57,074 | |||||||||||||||||||||
| Custodian and accounting agent | 56,815 | 62,817 | 55,265 | |||||||||||||||||||||
| Audit and tax services | 43,071 | 55,186 | 54,655 | |||||||||||||||||||||
| Legal | 18,937 | 38,295 | 37,831 | |||||||||||||||||||||
| Transfer agent | 12,668 | 13,793 | 14,265 | |||||||||||||||||||||
| Shareholder communications | 12,124 | 48,698 | 37,845 | |||||||||||||||||||||
| Trustees | 6,828 | 19,553 | 14,895 | |||||||||||||||||||||
| Insurance | 4,720 | 9,252 | 7,657 | |||||||||||||||||||||
| New York Stock Exchange listing | 4,639 | 29,784 | 17,561 | |||||||||||||||||||||
| Miscellaneous | 3,675 | 25,393 | 31,326 | |||||||||||||||||||||
Total Expenses | 2,180,447 | 3,925,867 | 2,705,269 | |||||||||||||||||||||
| Net Investment Income | 4,159,597 | 24,499,545 | 18,907,131 | |||||||||||||||||||||
| Realized and Change in Unrealized Gain (Loss): | ||||||||||||||||||||||||
| Net realized gain (loss) on investments | 730,783 | (8,508,072) | (6,445,124) | |||||||||||||||||||||
Net change in unrealized appreciation/depreciation of: | ||||||||||||||||||||||||
Investments | 863,001 | 19,846,440 | 14,984,331 | |||||||||||||||||||||
| Investments in Affiliates | – | 150,200 | 150,194 | |||||||||||||||||||||
| Net realized and change in unrealized gain | 1,593,784 | 11,488,568 | 8,689,401 | |||||||||||||||||||||
| Net Increase in Net Assets Resulting from Investment Operations | 5,753,381 | 35,988,113 | 27,596,532 | |||||||||||||||||||||
| Dividends on Preferred Shares from Net Investment Income | – | (6,983,019) | (6,088,672) | |||||||||||||||||||||
| Net Increase in Net Assets Applicable to Common Shareholders Resulting from Investment Operations | $5,753,381 | $29,005,094 | $21,507,860 | |||||||||||||||||||||
| 40 | Semi-Annual Report | | August 31, 2019 | | See accompanying Notes to Financial Statements |
Table of Contents
Statements of Changes in Net Assets
AllianzGI Convertible & Income 2024 Target Term Fund
| Six Months ended August 31, 2019 (unaudited) | Year ended February 28, 2019 | |||||||||||||||
| Investment Operations: | ||||||||||||||||
| Net investment income | $4,159,597 | $8,759,386 | ||||||||||||||
| Net realized gain | 730,783 | 2,238,286 | ||||||||||||||
| Net change in unrealized appreciation/depreciation | 863,001 | (2,360,917) | ||||||||||||||
| Net increase in net assets resulting from investment operations | 5,753,381 | 8,636,755 | ||||||||||||||
| Distributions to Shareholders from: | ||||||||||||||||
| Distributable earnings | (5,038,935) | (10,077,871) | ||||||||||||||
| Total increase (decrease) in net assets | 714,446 | (1,441,116) | ||||||||||||||
| Net Assets: | ||||||||||||||||
| Beginning of period | 177,319,156 | 178,760,272 | ||||||||||||||
| End of period | $178,033,602 | $177,319,156 | ||||||||||||||
| Shares Activity: | ||||||||||||||||
| Shares outstanding, beginning of period | 18,257,012 | 18,257,012 | ||||||||||||||
| Shares outstanding, end of period | 18,257,012 | 18,257,012 | ||||||||||||||
| See accompanying Notes to Financial Statements | | August 31, 2019 | | Semi-Annual Report | 41 |
Table of Contents
Statements of Changes in Net Assets Applicable to Common Shareholders
AllianzGI Convertible & Income Fund
| Six Months ended August 31, 2019 (unaudited) | Year ended February 28, 2019 | |||||||||||||||
| Investment Operations: | ||||||||||||||||
| Net investment income | $24,499,545 | $49,731,750 | ||||||||||||||
| Net realized loss | (8,508,072) | (47,570,706) | ||||||||||||||
| Net change in unrealized appreciation/depreciation | 19,996,640 | (9,509,827) | ||||||||||||||
| Net increase (decrease) in net assets resulting from investment operations | 35,988,113 | (7,348,783) | ||||||||||||||
| Dividends on Preferred Shares from Net Investment Income | (6,983,019) | (10,585,245) | ||||||||||||||
| Net increase (decrease) in net assets applicable to common shareholders resulting from investment operations | 29,005,094 | (17,934,028) | ||||||||||||||
| Distributions to Common Shareholders from: | ||||||||||||||||
| Distributable earnings | (29,424,214) | (45,008,107) | ||||||||||||||
| Return of capital | – | (24,588,590) | ||||||||||||||
| Total distributions to common shareholders | (29,424,214) | (69,596,697) | ||||||||||||||
| Preferred Share Transactions: | ||||||||||||||||
| Net increase resulting from tender of Auction-Rate Preferred Shares (see Note 7) | – | 8,023,500 | ||||||||||||||
| Offering costs for cumulative preferred shares charged to paid-in capital (see Note 10) | – | (3,752,438) | ||||||||||||||
| Common Share Transactions: | ||||||||||||||||
| Reinvestment of distributions | 2,283,574 | 5,040,507 | ||||||||||||||
| Total increase (decrease) in net assets applicable to common shareholders | 1,864,454 | (78,219,156) | ||||||||||||||
| Net Assets Applicable to Common Shareholders: | ||||||||||||||||
| Beginning of period | 502,647,682 | 580,866,838 | ||||||||||||||
| End of period | $504,512,136 | $502,647,682 | ||||||||||||||
| Common Shares Activity: | ||||||||||||||||
| Common shares outstanding, beginning of period | 89,613,563 | 88,808,652 | ||||||||||||||
| Common shares issued in reinvestment of distributions | 395,761 | 804,911 | ||||||||||||||
| Common shares outstanding, end of period | 90,009,324 | 89,613,563 | ||||||||||||||
– May reflect actual amounts rounding to less than $1.
| 42 | Semi-Annual Report | | August 31, 2019 | | See accompanying Notes to Financial Statements |
Table of Contents
Statements of Changes in Net Assets Applicable to Common Shareholders
AllianzGI Convertible & Income Fund II
Six Months ended August 31, 2019 (unaudited) | Year ended February 28, 2019 | |||||||||||||||
| Investment Operations: | ||||||||||||||||
| Net investment income | $18,907,131 | $37,848,582 | ||||||||||||||
| Net realized loss | (6,445,124) | (36,496,320) | ||||||||||||||
| Net change in unrealized appreciation/depreciation | 15,134,525 | (7,065,306) | ||||||||||||||
| Net increase (decrease) in net assets resulting from investment operations | 27,596,532 | (5,713,044) | ||||||||||||||
| Dividends on Preferred Shares from Net Investment Income | (6,088,672) | (8,854,040) | ||||||||||||||
| Net increase (decrease) in net assets applicable to common shareholders resulting from investment operations | 21,507,860 | (14,567,084) | ||||||||||||||
| Distributions to Common Shareholders from: | ||||||||||||||||
| Distributable earnings | (21,409,393) | (33,756,734) | ||||||||||||||
| Return of capital | – | (18,171,046) | ||||||||||||||
| Total distributions to common shareholders | (21,409,393) | (51,927,780) | ||||||||||||||
| Preferred Share Transactions: | ||||||||||||||||
| Net increase resulting from tender of Auction-Rate Preferred Shares (see Note 7) | – | 6,688,500 | ||||||||||||||
| Offering costs for cumulative preferred shares charged to paid-in capital (see Note 10) | – | (4,028,159) | ||||||||||||||
| Common Share Transactions: | ||||||||||||||||
| Reinvestment of distributions | 1,769,242 | 3,629,251 | ||||||||||||||
| Total increase (decrease) in net assets applicable to common shareholders | 1,867,709 | (60,205,272) | ||||||||||||||
| Net Assets Applicable to Common Shareholders: | ||||||||||||||||
| Beginning of period | 379,900,514 | 440,105,786 | ||||||||||||||
| End of period | $381,768,223 | $379,900,514 | ||||||||||||||
| Common Shares Activity: | ||||||||||||||||
| Common shares outstanding, beginning of period | 75,583,392 | 74,921,851 | ||||||||||||||
| Common shares issued in reinvestment of distributions | 344,098 | 661,541 | ||||||||||||||
| Common shares outstanding, end of period | 75,927,490 | 75,583,392 | ||||||||||||||
| – | May reflect actual amounts rounding to less than $1. |
| See accompanying Notes to Financial Statements | | August 31, 2019 | | Semi-Annual Report | 43 |
Table of Contents
AllianzGI Convertible & Income 2024 Target Term Fund
Six Months ended August 31, 2019 (unaudited)
| Increase in Cash from: | ||||||||
| Cash Flows provided by Operating Activities: | ||||||||
Net increase in net assets resulting from investment operations | $5,753,381 | |||||||
| Adjustments to Reconcile Net Increase in Net Assets Resulting from Investment Operations to Net Cash provided by Operating Activities: | ||||||||
Purchases of long-term investments | (109,326,454) | |||||||
Proceeds from sales of long-term investments | 113,932,867 | |||||||
Purchases of short-term portfolio investments, net | (5,864,626) | |||||||
Net change in unrealized appreciation/depreciation | (863,001) | |||||||
Net amortization/accretion on investments | (371,449) | |||||||
Net realized gain | (730,783) | |||||||
Decrease in payable for investments purchased | (3,350,609) | |||||||
Increase in investments in Affiliated Funds – Trustees Deferred Compensation Plan | (718) | |||||||
Increase in Trustees Compensation Plan payable | 718 | |||||||
Decrease in receivable for investments sold | 5,887,658 | |||||||
Decrease in interest and dividends receivable | 82,635 | |||||||
Increase in receivable for principal paydown | (27,250) | |||||||
Increase in prepaid expenses | (12,171) | |||||||
Increase in investment management fees payable | 15,725 | |||||||
Decrease in accrued expenses and other liabilities | (163,088) | |||||||
Increase in loan interest payable | 9,724 | |||||||
| Net cash provided by operating activities | 4,972,559 | |||||||
| Cash Flows used for Financing Activities: | ||||||||
Cash dividends paid | (5,038,935) | |||||||
| Net cash used for financing activities | (5,038,935) | |||||||
| Net decrease in cash | (66,376) | |||||||
| Cash: | ||||||||
| Beginning of period | 119,756 | |||||||
| End of period | $53,380 | |||||||
| Supplemental Disclosure of Cash Flow Information: | ||||||||
Interest expense paid on loan | $1,073,840 | |||||||
* Statement of Cash Flows is not required for Convertible & Income and Convertible & Income II.
| 44 | Semi-Annual Report | | August 31, 2019 | | See accompanying Notes to Financial Statements |
Table of Contents
AllianzGI Convertible & Income 2024 Target Term Fund
For a common share of outstanding throughout each period^:
Six Months 8/31/19 | Year ended 2/28/19 | Period from through | ||||||||||||||||
| Net asset value, beginning of period | $9.71 | $9.79 | $9.84** | |||||||||||||||
| Investment Operations: | ||||||||||||||||||
| Net investment income | 0.23 | 0.48 | 0.35 | |||||||||||||||
| Net realized and change in unrealized gain (loss) | 0.09 | (0.01 | ) | (0.06 | ) | |||||||||||||
| Total from investment operations | 0.32 | 0.47 | 0.29 | |||||||||||||||
| Dividends and Distributions to Shareholders from: | ||||||||||||||||||
| Net investment income | (0.17 | ) | (0.50 | ) | (0.32 | ) | ||||||||||||
| Net realized gains | (0.11 | ) | (0.05 | ) | – | |||||||||||||
| Total dividends and distributions to shareholders | (0.28 | ) | (0.55 | ) | (0.32 | ) | ||||||||||||
| Share Transactions: | ||||||||||||||||||
| Capital charge resulting from issuance of common shares and related offering costs | – | – | (0.02 | ) | ||||||||||||||
| Net asset value, end of period | $9.75 | $9.71 | $9.79 | |||||||||||||||
| Market price, end of period | $9.37 | $9.00 | $9.22 | |||||||||||||||
| Total Investment Return (1) | 7.25 | % | 3.72 | % | (4.59 | )% | ||||||||||||
| RATIOS/SUPPLEMENTAL DATA: | ||||||||||||||||||
| Net assets, end of period (000s) | $178,034 | $177,319 | $178,760 | |||||||||||||||
| Ratio of expenses to average net assets, including interest expense (4)(5) | 2.44 | %(2) | 2.60 | % | 2.14 | %(2)(3) | ||||||||||||
| Ratio of expenses to average net assets, excluding interest expense (4)(5) | 1.23 | %(2) | 1.36 | % | 1.23 | %(2)(3) | ||||||||||||
| Ratio of net investment income to average net assets (5) | 4.65 | %(2) | 4.94 | % | 5.47 | %(2)(3) | ||||||||||||
| Portfolio turnover rate | 46 | % | 116 | % | 66 | % | ||||||||||||
| ^ | A “—” may reflect actual amounts rounding to less than $0.01 or 0.01%. |
| * | Commencement of operations. |
| ** | Initial public offering price of $10.00 per share less sales load of 1.65% of the offering price. |
| (1) | Total investment return is calculated assuming a purchase of a common share at the market price on the first day and a sale of a common share at the market price on the last day of each period reported. Dividends and distributions, if any, are assumed, for purposes of this calculation, to be reinvested at prices obtained under the Fund’s dividend reinvestment plan. Total investment return does not reflect brokerage commissions or sales charges in connection with the purchase or sale of Fund shares. Total investment return for a period of less than one year is not annualized. |
| (2) | Annualized, unless otherwise noted. |
| (3) | Certain expenses incurred by the Fund were not annualized. |
| (4) | Interest expense relates to participation in the debt financing (see Note 8). |
| (5) | Inclusive of excise tax expense of 0.08% and 0.02% (not annualized) for the year ended February 28, 2019 and the period ended February 28, 2018, respectively. |
| See accompanying Notes to Financial Statements | | August 31, 2019 | | Semi-Annual Report | 45 |
Table of Contents
AllianzGI Convertible & Income Fund
For a common share outstanding throughout each period^:
| Six Months ended 8/31/19 (unaudited) | Year ended | |||||||||||||||||||||||||||||||||||||||||||
| 2/28/19 | 2/28/18 | 2/28/17 | 2/29/16 | 2/28/15 | ||||||||||||||||||||||||||||||||||||||||
| Net asset value, beginning of period | $5.61 | $6.54 | $6.86 | $5.50 | $8.44 | $9.49 | ||||||||||||||||||||||||||||||||||||||
| Investment Operations: | ||||||||||||||||||||||||||||||||||||||||||||
| Net investment income | 0.28 | 0.56 | 0.69 | 0.73 | 0.83 | 0.87 | ||||||||||||||||||||||||||||||||||||||
| Net realized and change in unrealized gain (loss) | 0.13 | (0.64 | ) | (0.16 | ) | 1.44 | (2.83 | ) | (0.85 | ) | ||||||||||||||||||||||||||||||||||
| Total from investment operations | 0.41 | (0.08 | ) | 0.53 | 2.17 | (2.00 | ) | 0.02 | ||||||||||||||||||||||||||||||||||||
| Dividends on Preferred Shares from Net Investment Income: (1) | (0.08 | ) | (0.12 | ) | (0.07 | ) | (0.03 | ) | (0.01 | ) | – | |||||||||||||||||||||||||||||||||
| Net increase (decrease) in net assets applicable to common shareholders resulting from investment operations | 0.33 | (0.20 | ) | 0.46 | 2.14 | (2.01 | ) | 0.02 | ||||||||||||||||||||||||||||||||||||
| Dividends and distributions to Common Shareholders from: |
| |||||||||||||||||||||||||||||||||||||||||||
| Net investment income | (0.33 | ) | (0.50 | ) | (0.77 | ) | (0.78 | ) | (0.93 | ) | (1.08 | ) | ||||||||||||||||||||||||||||||||
| Return of capital | – | (0.28 | ) | (0.01 | ) | – | – | – | ||||||||||||||||||||||||||||||||||||
| Total dividends and distributions to common shareholders | (0.33 | ) | (0.78 | ) | (0.78 | ) | (0.78 | ) | (0.93 | ) | (1.08 | ) | ||||||||||||||||||||||||||||||||
| Preferred Share Transactions: |
| |||||||||||||||||||||||||||||||||||||||||||
| Accretion to net asset value, resulting from tender offer of Auction-Rate Preferred Shares | – | 0.09 | – | – | – | – | ||||||||||||||||||||||||||||||||||||||
| Capital Change resulting from issuance of Cumulative Preferred Shares and related offering costs | – | (0.04 | ) | – | – | – | – | |||||||||||||||||||||||||||||||||||||
| Common Share Transactions: |
| |||||||||||||||||||||||||||||||||||||||||||
| Accretion to net asset value, resulting from offerings | – | – | – | – | – | 0.01 | ||||||||||||||||||||||||||||||||||||||
| Capital charge resulting from issuance of common shares and related offering costs | – | – | – | – | – | – | ||||||||||||||||||||||||||||||||||||||
| Total common share transactions | – | – | – | – | – | 0.01 | ||||||||||||||||||||||||||||||||||||||
| Net asset value, end of period | $5.61 | $5.61 | $6.54 | $6.86 | $5.50 | $8.44 | (2) | |||||||||||||||||||||||||||||||||||||
| Market price, end of period | $5.56 | $6.24 | $6.93 | $6.93 | $4.92 | $9.12 | ||||||||||||||||||||||||||||||||||||||
| Total Investment Return (3) | (5.65 | )% | 2.00 | % | 12.22 | % | 59.15 | % | (38.23 | )% | 0.37 | % | ||||||||||||||||||||||||||||||||
| 46 | Semi-Annual Report | | August 31, 2019 | | See accompanying Notes to Financial Statements |
Table of Contents
AllianzGI Convertible & Income Fund
For a common share outstanding throughout each period^: (continued)
| Six Months ended 8/31/19 (unaudited) | Year ended | |||||||||||||||||||||||||||||||||||||||||||
| 2/28/19 | 2/28/18 | 2/28/17 | 2/29/16 | 2/28/15 | ||||||||||||||||||||||||||||||||||||||||
| RATIOS/SUPPLEMENTAL DATA: |
| |||||||||||||||||||||||||||||||||||||||||||
| Net assets, applicable to common shareholders, end of period (000s) | $504,512 | $502,648 | $580,867 | $605,194 | $484,512 | $739,983 | ||||||||||||||||||||||||||||||||||||||
| Ratio of expenses to average net assets, including interest expense (4)(5) | 1.56 | %(6) | 1.56 | %(7) | 1.28 | % | 1.36 | %(8) | 1.26 | %(8) | 1.23 | %(8) | ||||||||||||||||||||||||||||||||
| Ratio of expenses to average net assets, excluding interest expense (5)(4) | 1.38 | %(6) | 1.39 | %(7) | 1.28 | % | 1.36 | %(8) | 1.26 | %(8) | 1.23 | %(8) | ||||||||||||||||||||||||||||||||
| Ratio of net investment income to average net assets (5) | 9.73 | %(6) | 9.22 | %(7) | 10.32 | % | 11.33 | %(8) | 11.51 | %(8) | 9.73 | %(8) | ||||||||||||||||||||||||||||||||
| Auction-Rate Preferred shares asset coverage per share | $63,871 | (9) | $63,752 | (9) | $65,668 | $67,376 | $58,927 | $76,819 | ||||||||||||||||||||||||||||||||||||
| Cumulative Preferred shares asset coverage per share | $64 | (9) | $64 | (9) | $– | $– | $– | $– | ||||||||||||||||||||||||||||||||||||
| Cumulative Preferred shares average market value | $25.31 | (10) | $24.46 | (10) | $– | $– | $– | $– | ||||||||||||||||||||||||||||||||||||
| Portfolio turnover rate | 15 | % | 41 | % | 34 | % | 28 | % | 51 | % | 56 | % | ||||||||||||||||||||||||||||||||
| ^ | A “—” may reflect actual amounts rounding to less than $0.01 or 0.01%. |
| (1) | Calculated on average common shares outstanding. |
| (2) | Payment from affiliate increased the net asset value by less than $0.01. |
| (3) | Total investment return is calculated assuming a purchase of a common share at the market price on the first day and a sale of a common share at the market price on the last day of each period reported. Dividends and distributions, if any, are assumed, for purposes of this calculation, to be reinvested at prices obtained under the Fund’s dividend reinvestment plan. Total investment return does not reflect brokerage commissions or sales charges in connection with the purchase or sale of Fund shares. Total investment return for a period of less than one year is not annualized. |
| (4) | Interest expense relates to participation in the debt financing (see Note 8). |
| (5) | Calculated on the basis of income and expenses applicable to both common and preferred shares relative to average net assets of common shareholders. |
| (6) | Annualized, unless otherwise noted. |
| (7) | Inclusive of tender offer expenses of 0.03%. |
| (8) | Inclusive of excise tax expense of 0.03%, less than 0.005%, 0.05% and 0.04% for the years ended February 28, 2017, February 29, 2016 and February 28, 2015, respectively. |
| (9) | Asset coverage per share is calculated by combining all preferred shares. |
| (10) | Based on daily closing market prices. |
| See accompanying Notes to Financial Statements | | August 31, 2019 | | Semi-Annual Report | 47 |
Table of Contents
AllianzGI Convertible & Income Fund II
For a common share outstanding throughout each period^:
| Six Months ended 8/31/19 (unaudited) | Year ended | |||||||||||||||||||||||||||||||||||||||||||
2/28/19 | 2/28/18 | 2/28/17 | 2/29/16 | 2/28/15 | ||||||||||||||||||||||||||||||||||||||||
| Net asset value, beginning of period | $5.03 | $5.87 | $6.14 | $4.89 | $7.56 | $8.53 | ||||||||||||||||||||||||||||||||||||||
| Investment Operations: | ||||||||||||||||||||||||||||||||||||||||||||
| Net investment income | 0.25 | 0.50 | 0.62 | 0.66 | 0.75 | 0.80 | ||||||||||||||||||||||||||||||||||||||
| Net realized and change in unrealized gain (loss) | 0.11 | (0.57 | ) | (0.14 | ) | 1.30 | (2.55 | ) | (0.75 | ) | ||||||||||||||||||||||||||||||||||
| Total from investment operations | 0.36 | (0.07 | ) | 0.48 | 1.96 | (1.80 | ) | 0.05 | ||||||||||||||||||||||||||||||||||||
| Dividends on Preferred Shares from Net Investment Income (1) | (0.08 | ) | (0.12 | ) | (0.06 | ) | (0.02 | ) | (0.01 | ) | – | |||||||||||||||||||||||||||||||||
| Net increase (decrease) in net assets applicable to common shareholders resulting from investment operations | 0.28 | (0.19 | ) | 0.42 | 1.94 | (1.81 | ) | 0.05 | ||||||||||||||||||||||||||||||||||||
| Dividends and Distributions to Common Shareholders from: | ||||||||||||||||||||||||||||||||||||||||||||
| Net investment income | (0.28 | ) | (0.45 | ) | (0.61 | ) | (0.69 | ) | (0.86 | ) | (1.02 | ) | ||||||||||||||||||||||||||||||||
| Return of capital | – | (0.24 | ) | (0.08 | ) | – | – | – | ||||||||||||||||||||||||||||||||||||
| Total dividends and distributions to common shareholders | (0.28 | ) | (0.69 | ) | (0.69 | ) | (0.69 | ) | (0.86 | ) | (1.02 | ) | ||||||||||||||||||||||||||||||||
| Preferred Share Transactions: | ||||||||||||||||||||||||||||||||||||||||||||
| Accretion to net asset value, resulting from tender offer of Auction-Rate Preferred Shares | – | 0.09 | – | – | – | – | ||||||||||||||||||||||||||||||||||||||
| Capital Change resulting from issuance of Cumulative Preferred Shares and related offering costs | – | (0.05 | ) | – | – | – | – | |||||||||||||||||||||||||||||||||||||
| Net asset value, end of period | $5.03 | $5.03 | $5.87 | $6.14 | $4.89 | $7.56 | (2) | |||||||||||||||||||||||||||||||||||||
| Market price, end of period | $4.98 | $5.44 | $6.10 | $6.17 | $4.46 | $8.58 | ||||||||||||||||||||||||||||||||||||||
| Total Investment Return(3) | (3.27 | )% | 1.14 | % | 10.84 | % | 56.31 | % | (40.34 | )% | (0.81 | )% | ||||||||||||||||||||||||||||||||
| 48 | Semi-Annual Report | | August 31, 2019 | | See accompanying Notes to Financial Statements |
Table of Contents
AllianzGI Convertible & Income Fund II
For a common share outstanding throughout each period^: (continued)
| Six Months ended 8/31/19 (unaudited) | Year ended | |||||||||||||||||||||||||||||||||||||||||||
| 2/28/19 | 2/28/18 | 2/28/17 | 2/29/16 | 2/28/15 | ||||||||||||||||||||||||||||||||||||||||
| RATIOS/SUPPLEMENTAL DATA: | ||||||||||||||||||||||||||||||||||||||||||||
| Net assets, applicable to common shareholders, end of period (000s) | $381,768 | $379,901 | $440,106 | $456,985 | $363,991 | $559,342 | ||||||||||||||||||||||||||||||||||||||
| Ratio of expenses to average net assets, including interest expense (4)(5) | 1.42 | %(7) | 1.53 | %(6) | 1.32 | % | 1.37 | % | 1.28 | % | 1.19 | % | ||||||||||||||||||||||||||||||||
| Ratio of expenses to average net assets, excluding interest expense (4)(5) | 1.42 | %(7) | 1.44 | %(6) | 1.32 | % | 1.37 | % | 1.28 | % | 1.19 | % | ||||||||||||||||||||||||||||||||
| Ratio of net investment income to average net assets (4) | 9.93 | %(7) | 9.28 | %(6) | 10.31 | % | 11.46 | % | 11.58 | % | 9.87 | % | ||||||||||||||||||||||||||||||||
| Preferred shares asset coverage per share | $59,990 | $59,845 | (8) | $65,147 | $66,691 | $58,208 | $76,034 | |||||||||||||||||||||||||||||||||||||
| Cumulative Preferred shares asset coverage per share | $60 | (8) | $60 | (8) | $– | $– | $– | $– | ||||||||||||||||||||||||||||||||||||
| Cumulative Preferred shares average market value | $24.88 | $24.04 | (9) | $– | $– | $– | $– | |||||||||||||||||||||||||||||||||||||
| Portfolio turnover rate | 15 | % | 41 | % | 33 | % | 28 | % | 51 | % | 57 | % | ||||||||||||||||||||||||||||||||
| ^ | A “–” may reflect actual amounts rounding to less than $0.01 or 0.01%. |
| (1) | Calculated on average common shares outstanding. |
| (2) | Payment from affiliate increased the net asset value by less than $0.01. |
| (3) | Total investment return is calculated assuming a purchase of a common share at the market price on the first day and a sale of a common share at the market price on the last day of each year reported. Dividends and distributions, if any, are assumed, for purposes of this calculation, to be reinvested at prices obtained under the Fund’s dividend reinvestment plan. Total investment return does not reflect brokerage commissions or sales charges in connection with the purchase or sale of Fund shares. Total investment return for a period of less than one year is not annualized. |
| (4) | Calculated on the basis of income and expenses applicable to both common and preferred shares relative to average net assets of common shareholders. |
| (5) | Interest expense relates to participation in the debt financing (see Note 8). |
| (6) | Inclusive of tender offer expenses of 0.04%. |
| (7) | Annualized, unless otherwise noted. |
| (8) | Asset coverage per share is calculated by combining all preferred shares. |
| (9) | Based on daily closing market prices. |
| See accompanying Notes to Financial Statements | | August 31, 2019 | | Semi-Annual Report | 49 |
Table of Contents
AllianzGI Convertible & Income 2024 Target Term Fund/AllianzGI Convertible & Income Fund/AllianzGI Convertible & Income Fund II
August 31, 2019 (unaudited)
1. Organization and Significant Accounting Policies
AllianzGI Convertible & Income 2024 Target Term Fund (“Convertible & Income 2024 Target Term”), AllianzGI Convertible & Income Fund (“Convertible & Income”) and AllianzGI Convertible & Income Fund II (“Convertible & Income II”) (each, a “Fund” and, collectively, the “Funds”), were organized as Massachusetts business trusts on March 21, 2017, January 17, 2003 and April 22, 2003, respectively and accordingly follow the investment company accounting and reporting guidance of the Financial Accounting Standards Board Accounting Standards Codification Topic 946 Financial Services – Investment Companies. Convertible & Income 2024 Target Term, Convertible & Income and Convertible & Income II are each organized and registered as diversified,closed-end management investment companies under the Investment Company Act of 1940, as amended (the “1940 Act”), and the rules and regulations thereunder. Allianz Global Investors U.S. LLC (“AllianzGI U.S.” or the “Investment Manager”), serves as the Funds’ investment manager. AllianzGI U.S. is an indirect, wholly-owned subsidiary of Allianz Asset Management of America, L.P. (“AAM”). AAM is an indirect, wholly-owned subsidiary of Allianz SE, a publicly-traded European insurance and financial services company. Each Fund has authorized an unlimited amount of common shares with $0.00001 par value.
Convertible & Income 2024 Target Term’s investment objectives are to provide a high level of income and to return at least $9.835 per common share (the original net asset value per common share of beneficial interest before deducting offering costs of $0.02 per share) (the “Original NAV”) to holders of common shares on or about September 1, 2024 (the “Termination Date”). The objective to return Convertible & Income 2024 Target Term’s
Original NAV is not an express or implied guarantee obligation of Convertible & Income 2024 Target Term, the Investment Manager or any other entity, and an investor may receive less than the Original NAV upon termination of Convertible & Income 2024 Target Term. Convertible & Income 2024 Target Term attempts to achieve its investment objectives by investing in a diversified portfolio of high yield securities, convertible securities and other income-producing debt instruments, including senior secured loans, primarily of U.S. issuers. The Fund intends, on or about the Termination Date, to cease its investment operations, liquidate its portfolio (to the extent possible), retire or redeem any outstanding leverage facilities and distribute all its liquidated assets to the then-record holders of common shares, unless such term is extended by the Trustees and absent Trustee and shareholder approval to amend the limited term.
Convertible & Income and Convertible & Income II each have an investment objective to provide total return through a combination of capital appreciation and high current income. Convertible & Income and Convertible & Income II attempt to achieve this objective by investing in a portfolio of domestic convertible securities andnon-convertible income-producing securities.
There can be no assurance that the Funds will meet their stated objectives.
The preparation of the Funds’ financial statements in accordance with accounting principles generally accepted in the United States of America (“U.S. GAAP”) requires the Funds’ management to make estimates and assumptions that affect the reported amounts and disclosures in each Fund’s financial statements. Actual results could differ from those estimates.
| 50 | Semi-Annual Report | | August 31, 2019 |
Table of Contents
Notes to Financial Statements
AllianzGI Convertible & Income 2024 Target Term Fund/AllianzGI Convertible & Income Fund/AllianzGI Convertible & Income Fund II
August 31, 2019 (unaudited)
1. Organization and Significant Accounting Policies (continued)
Like many other companies, the Funds’ organizational documents provide that its officers (“Officers”) and the Board of Trustees of each Fund (together, the “Board”) are indemnified against certain liabilities arising out of the performance of their duties to the Funds. In addition, both in some of its principal service contracts and in the normal course of its business, the Funds enter into contracts that provide indemnifications to other parties for certain types of losses or liabilities. The Funds’ maximum exposure under these arrangements is unknown as this could involve future claims against the Funds.
The following is a summary of significant accounting policies consistently followed by the Funds:
(a) Valuation of Investments
Portfolio securities and other financial instruments for which market quotations are readily available are stated at market value. Market values for various types of the securities and other instruments are determined on the basis of closing prices or last sales prices on an exchange or other market, based on quotes or other market information obtained from quotation reporting systems, established market makers or independent pricing services. The Funds’ investments are valued daily using prices supplied by an independent pricing service or broker/dealer quotations, or by using the last sale or settlement price on the exchange that is the primary market for such securities, or the mean between the last bid and ask quotations. Independent pricing services use information provided by market makers or estimates of market values obtained from yield data relating to investments or securities with similar characteristics.
The Board has adopted procedures for valuing portfolio securities and other financial instruments in circumstances where market quotes are not readily available (including in cases where available market quotes are deemed to be unreliable), and has delegated the responsibility for applying the valuation methods to the Investment Manager. The Funds’ Valuation Committee (the “Valuation Committee”) was established by the Board to oversee the implementation of the Funds’ valuation methods and to make fair value determinations on behalf of the Board, as instructed. The Investment Manager monitors the continued appropriateness of methods applied and identifies circumstances and events that may require fair valuation. The Investment Manager determines if adjustments should be made in light of market changes, events affecting the issuer, or other factors. If the Investment Manager determines that a valuation method may no longer be appropriate, another valuation method previously approved by the Valuation Committee may be selected or the Valuation Committee will be convened to consider the matter and take any appropriate action in accordance with procedures set forth by the Board. The Board shall review the appropriateness of the valuation methods and these methods may be amended or supplemented from time to time by the Valuation Committee.
Short-term debt instruments having a remaining maturity of 60 days or less will be valued at amortized cost unless the Board of Trustees or Valuation Committee determines that particular circumstances dictate otherwise.
The prices used by the Funds to value investments may differ from the value that would be realized if the investments were sold, and these differences could be material to the Funds’ financial statements. Each Fund’s net asset value (“NAV”) is normally determined as of the close of regular trading (normally, 4:00 p.m. Eastern Time) on the New York Stock
| August 31, 2019 | | Semi-Annual Report | 51 |
Table of Contents
Notes to Financial Statements
AllianzGI Convertible & Income 2024 Target Term Fund/AllianzGI Convertible & Income Fund/AllianzGI Convertible & Income Fund II
August 31, 2019 (unaudited)
1. Organization and Significant Accounting Policies (continued)
Exchange (“NYSE”) on each day the NYSE is open for business. In unusual circumstances, the Board or the Valuation Committee may in good faith determine the NAV as of 4:00 p.m., Eastern Time, notwithstanding an earlier, unscheduled close or halt of trading on the NYSE.
(b) Fair Value Measurements
Fair value is defined as the price that would be received to sell an asset or paid to transfer a liability (i.e., the “exit price”) in an orderly transaction between market participants. The three levels of the fair value hierarchy are described below:
| ∎ | Level 1 – quoted prices in active markets for identical investments that the Funds have the ability to access |
| ∎ | Level 2 – valuations based on other significant observable inputs, which may include, but are not limited to, quoted prices for similar assets or liabilities, interest rates, yield curves, volatilities, prepayment speeds, loss severities, credit risks and default rates or other market corroborated inputs |
| ∎ | Level 3 – valuations based on significant unobservable inputs (including the Investment Manager’s or Valuation Committee’s own assumptions and securities whose price was determined by using a single broker’s quote) |
The valuation techniques used by the Funds to measure fair value during the six months ended August 31, 2019 were intended to maximize the use of observable inputs and to minimize the use of unobservable inputs.
An investment asset’s or liability’s level within the fair value hierarchy is based on the lowest level input, individually or in aggregate, that is
significant to the fair value measurement. The objective of fair value measurement remains the same even when there is a significant decrease in the volume and level of activity for an asset or liability and regardless of the valuation techniques used.
The inputs or methodology used for valuing securities are not necessarily an indication of the risk associated with investing in those securities. The following are certain inputs and techniques that the Funds generally use to evaluate how to classify each major category of assets and liabilities within Level 2 and Level 3, in accordance with U.S. GAAP.
An asset or liability for which market values cannot be measured using the methodologies described above is valued by methods deemed reasonable in good faith by the Valuation Committee, following the procedures established by the Board, to represent fair value. Under these procedures, the Funds generally use a market-based approach which may use related or comparable assets or liabilities, recent transactions, market multiples, book values and other relevant information. Fair value determinations involve the consideration of a number of subjective factors, an analysis of applicable facts and circumstances and the exercise of judgment. As a result, it is possible that the fair value for a security determined in good faith in accordance with the Funds’ valuation procedures may differ from valuations for the same security determined by other funds using their own valuation procedures. Although the Funds’ valuation procedures are designed to value a security at the price the Funds may reasonably expect to receive upon the security’s sale in an orderly transaction, there can be no assurance that any fair value determination thereunder would, in fact, approximate the amount that the Funds would actually realize upon the sale of the
| 52 | Semi-Annual Report | | August 31, 2019 |
Table of Contents
Notes to Financial Statements
AllianzGI Convertible & Income 2024 Target Term Fund/AllianzGI Convertible & Income Fund/AllianzGI Convertible & Income Fund II
August 31, 2019 (unaudited)
1. Organization and Significant Accounting Policies (continued)
security or the price at which the security would trade if a reliable market price were readily available.
Equity Securities (Common and Preferred Stock and Warrants) – Equity securities traded in inactive markets are valued using inputs which include broker-dealer quotes, recently executed transactions adjusted for changes in the benchmark index, or evaluated price quotes received from independent pricing services that take into account the integrity of the market sector and issuer, the individual characteristics of the security, and information received from broker-dealers and other market sources pertaining to the issuer or security. To the extent that these inputs are observable, the values of equity securities are categorized as Level 2. To the extent that these inputs are unobservable, the values are categorized as Level 3.
Convertible Bonds & Notes – Convertible bonds & notes are valued by independent pricing services based on various inputs and techniques, which include broker-dealer quotations from relevant market makers and recently executed transactions in securities of the issuer or comparable issuers. The broker-dealer quotations received are supported by credit analysis of the issuer that takes into consideration credit quality assessments, daily trading activity, and the activity of the underlying equities, listed bonds and sector-specific trends. To the extent that these inputs are observable, the values of convertible bonds & notes are categorized as Level 2. To the extent that these inputs are unobservable, the values are categorized as Level 3.
Corporate Bonds & Notes – Corporate bonds & notes are generally comprised of two main
categories: investment grade bonds and high yield bonds. Investment grade bonds are valued by independent pricing services using various inputs and techniques, which include broker-dealer quotations, live trading levels, recently executed transactions in securities of the issuer or comparable issuers, and option adjusted spread models that include base curve and spread curve inputs. Adjustments to individual bonds can be applied to recognize trading differences compared to other bonds issued by the same issuer. High yield bonds are valued by independent pricing services based primarily on broker-dealer quotations from relevant market makers and recently executed transactions in securities of the issuer or comparable issuers. The broker-dealer quotations received are supported by credit analysis of the issuer that takes into consideration credit quality assessments, daily trading activity, and the activity of the underlying equities, listed bonds and sector-specific trends. To the extent that these inputs are observable, the values of corporate bonds & notes are categorized as Level 2. To the extent that these inputs are unobservable, the values are categorized as Level 3.
Senior Loans – Senior Loans generally are valued by independent pricing services based on the average of quoted prices received from multiple dealers or valued relative to other benchmark securities when broker-dealer quotes are unavailable. These quoted prices are based on interest rates, yield curves, option adjusted spreads, credit spreads and/or other criteria. To the extent that these inputs are observable, the values of Senior Loans are categorized as Level 2. To the extent that these inputs are unobservable, the values are categorized as Level 3.
| August 31, 2019 | | Semi-Annual Report | 53 |
Table of Contents
Notes to Financial Statements
AllianzGI Convertible & Income 2024 Target Term Fund/AllianzGI Convertible & Income Fund/AllianzGI Convertible & Income Fund II
August 31, 2019 (unaudited)
1. Organization and Significant Accounting Policies (continued)
(c) Investment Transactions and Investment Income
Investment transactions are accounted for on the trade date. Realized gains and losses on investments are determined on an identified cost basis. Interest income adjusted for the accretion of discounts and amortization of premiums is recorded on an accrual basis. Discounts or premiums on debt securities purchased are accreted or amortized, respectively, to interest income. Conversion premium is not amortized. Dividend income is recorded on theex-dividend date, except for certain dividends from foreign securities where theex-dividend date may have passed, and then are recorded as soon after theex-dividend date as the Funds, using reasonable diligence, become aware of such dividends. Facility fees and other fees (such as origination fees) received on settlement date are amortized as income over the expected term of the senior loan. Consent fees relating to corporate actions and facility fees and other fees received after settlement date relating to senior loans and commitment fees received relating to unfunded purchase commitments are recorded as miscellaneous income upon receipt. Payments received from certain investments may be comprised of dividends, realized gains and return of capital. These payments may initially be recorded as dividend income and may subsequently be reclassified as realized gains and/or return of capital upon receipt of information from the issuer. Payments considered return of capital reduce the cost basis of the respective security. Distributions, if any, in excess of the cost basis of a security are recognized as capital gains. Expenses are recorded on an accrual basis.
(d) Federal Income Taxes
The Funds intend to distribute all of their taxable income and to comply with the other
requirements of Subchapter M of the U.S. Internal Revenue Code of 1986, as amended, applicable to regulated investment companies. Accordingly, no provision for U.S. federal income taxes is required. The Funds may be subject to excise tax based on distributions to shareholders.
Accounting for uncertainty in income taxes establishes for all entities, including pass-through entities such as the Funds, a minimum threshold for financial statement recognition of the benefit of positions taken in filing tax returns (including whether an entity is taxable in a particular jurisdiction), and requires certain expanded tax disclosures. In accordance with provisions set forth under U.S. GAAP, the Investment Manager has reviewed the Funds’ tax positions for all open tax years. As of August 31, 2019, the Funds have recorded no liability for net unrecognized tax benefits relating to uncertain income tax positions they have taken. The Funds’ U.S. federal income tax returns for the prior three years, as applicable, remain subject to examination by the Internal Revenue Service.
(e) Dividends and Distributions to Shareholders – Common Shares
The distributions by Convertible & Income 2024 Target Term may be comprised in varying portions of net investment income, capital gains, including short-term or long-term capital gains, and return of capital. Convertible & Income 2024 Target Term may distribute some or all net realized long-term capital gains not previously distributed, if any, at least annually.
The Funds declare dividends from net investment income to common shareholders monthly. The distributions by Convertible & Income and Convertible & Income II may be comprised in varying proportions of net investment income and return of capital. Convertible & Income and Convertible & Income II distribute net realized
| 54 | Semi-Annual Report | | August 31, 2019 |
Table of Contents
Notes to Financial Statements
AllianzGI Convertible & Income 2024 Target Term Fund/AllianzGI Convertible & Income Fund/AllianzGI Convertible & Income Fund II
August 31, 2019 (unaudited)
1. Organization and Significant Accounting Policies (continued)
capital gains, if any, at least annually. The Funds record dividends and distributions on theex-dividend date. The amount of dividends from net investment income and distributions from net realized capital gains or return of capital is determined in accordance with federal income tax regulations, which may differ from U.S. GAAP. These“book-tax” differences are considered either temporary or permanent in nature. To the extent these differences are permanent in nature, such amounts are reclassified within the capital accounts based on their federal income tax treatment. Temporary differences do not require reclassification. To the extent dividends and/or distributions exceed current and accumulated earnings and profits for federal income tax purposes, they are reported as dividends and/or distributions to shareholders from return of capital. As of August 31, 2019, it is anticipated that Convertible & Income and Convertible & Income II will have a return of capital at fiscal year-end.
(f) Convertible Securities
It is the Funds’ policy to invest a portion of their assets in convertible securities. Although convertible securities derive part of their value from that of the securities into which they are convertible, they are not considered derivative financial instruments. However, certain of the Funds’ investments in convertible securities include features which render them sensitive to price changes in their underlying securities. The value of structured/synthetic convertible securities can be affected by interest rate changes and credit risks of the issuer. Such securities may be structured in ways that limit their potential for capital appreciation and the entire value of the security may be at risk of loss depending on the performance of the underlying equity security. Consequently, the Funds are exposed to greater downside risk than traditional convertible securities, but typically still less than that of the underlying stock.
(g) Senior Loans
The Funds may purchase assignments of, and participations in, Senior Loans originated, negotiated and structured by a U.S. or foreign commercial bank, insurance company, finance company or other financial institution for a lending syndicate of financial institutions (the “Lender”). When purchasing an assignment, the Funds succeed to all the rights and obligations under the loan agreement with the same rights and obligations as the assigning Lender. Assignments may, however, be arranged through private negotiations between potential assignees and potential assignors, and the rights and obligations acquired by the purchaser of an assignment may differ from, and be more limited than, those held by the assigning Lender. The Funds may also enter into lending arrangements involving unfunded loan commitments, which are contractual obligations for future funding. Unfunded loan commitments may include revolving credit facilities, which may obligate the Funds to supply additional cash to the borrower on demand. Unfunded loan commitments represent a future obligation in full, even though a percentage of the principal amounts may never be utilized by the borrower.
The Funds may purchase the securities of distressed companies (including assignments or direct investments), including companies engaged in restructurings or bankruptcy proceedings. Investments in distressed companies may include senior obligations of an issuer issued in connection with a restructuring under Chapter 11 of the U.S. Bankruptcy Code (commonly known as“debtor-in-possession” or “DIP” financings).Debtor-in-possession financings generally allow the issuer to continue its operations while reorganizing. Such financings constitute senior liens on unencumbered collateral (i.e., collateral not subject to other creditors’ claims). There is risk that the issuer under adebtor-in-possession
| August 31, 2019 | | Semi-Annual Report | 55 |
Table of Contents
Notes to Financial Statements
AllianzGI Convertible & Income 2024 Target Term Fund/AllianzGI Convertible & Income Fund/AllianzGI Convertible & Income Fund II
August 31, 2019 (unaudited)
1. Organization and Significant Accounting Policies (continued)
financing will not emerge from Chapter 11 and be forced to liquidate its assets under Chapter 7 of the U.S. Bankruptcy Code. In the event of liquidation, the Funds’ only recourse would be against the collateral securing thedebtor-in-possession financing.
(h) PaymentIn-Kind Securities
The Funds may invest in paymentin-kind securities, which are debt or preferred stock securities that require or permit payment of interest in the form of additional securities. Paymentin-kind securities allow the issuer to avoid or delay the need to generate cash to meet current interest payments and, as a result, may involve greater risk than securities that pay interest currently or in cash.
(i) Warrants
The Funds may receive warrants. Warrants are securities that are usually issued together with a debt security or preferred stock and that give the holder the right to buy a proportionate amount of common stock at a specified price. Warrants may be freely transferable and are often traded on major exchanges. Warrants normally have a life that is measured in years and entitle the holder to buy common stock of a company at a price that is usually higher than the market price at the time the warrant is issued. Warrants may entail greater risks than certain other types of investments. Generally, warrants do not carry the right to receive dividends or exercise voting rights with respect to the underlying securities, and they do not represent any rights in the assets of the issuer. In addition, their value does not necessarily change with the value of the underlying securities, and they cease to have value if they are not exercised on or before their expiration date. If the market price of the underlying stock does not exceed the exercise price during the
life of the warrant, the warrant will expire worthless. Warrants may increase the potential profit or loss to be realized from the investment as compared with investing the same amount in the underlying securities. Similarly, the percentage increase or decrease in the value of an equity security warrant may be greater than the percentage increase or decrease in the value of the underlying common stock. Warrants may relate to the purchase of equity or debt securities. Debt obligations with warrants attached to purchase equity securities have many characteristics of convertible securities and their prices may, to some degree, reflect the performance of the underlying stock. Debt obligations also may be issued with warrants attached to purchase additional debt securities at the same coupon rate. A decline in interest rates would permit a Fund to sell such warrants at a profit. If interest rates rise, these warrants would generally expire with no value.
(j) Statement of Cash Flows
U.S. GAAP requires entities providing financial statements that report both financial position and results of operations to also provide a statement of cash flows for each period for which results of operations are provided, but exempts investment companies meeting certain conditions. One of the conditions is that the fund had little or no debt, based on the average debt outstanding during the period, in relation to average total assets. Convertible & Income 2024 Target Term’s indebtedness has been determined to be at a level requiring a statement of cash flows. The Statement of Cash Flows has been prepared using the indirect method which required net change in net assets resulting from operations to be adjusted to reconcile to net cash flows from operating activities. Convertible & Income and Convertible & Income II do not require a Statement of Cash Flows.
| 56 | Semi-Annual Report | | August 31, 2019 |
Table of Contents
Notes to Financial Statements
AllianzGI Convertible & Income 2024 Target Term Fund/AllianzGI Convertible & Income Fund/AllianzGI Convertible & Income Fund II
August 31, 2019 (unaudited)
1. Organization and Significant Accounting Policies (continued)
(k) Loan Interest Expense
Loan interest expense relates to amounts borrowed under each Fund’s respective SSB Facility (see Note 8). Loan interest expense is recorded as it is incurred.
(l) Repurchase Agreements
The Funds are parties to Master Repurchase Agreements (“Master Repo Agreements”) with select counterparties. The Master Repo Agreements include provisions for initiation of repurchase transactions, income payments, events of default, and maintenance of collateral.
The Funds enter into transactions, under the Master Repo Agreements, with their custodian bank or securities brokerage firms whereby they purchase securities under agreements (i.e., repurchase agreements) to resell such securities at an agreed upon price and date. The Funds, through their custodian, take possession of securities collateralizing the repurchase agreement. Such agreements are carried at the contract amount in the financial statements, which is considered to represent fair value. The collateral that is pledged (i.e. the securities received by the Funds), which consists primarily of U.S. government obligations and asset-backed securities, is held by the custodian bank for the benefit of the Funds until the maturity of the repurchase agreement. Provisions of the repurchase agreements and the procedures adopted by the Funds require that the market value of the collateral, including accrued interest thereon, be sufficient in the event of default by the counterparty. If the counterparty defaults under the Master Repo Agreements and the value of the collateral declines or if the counterparty enters an insolvency proceeding, realization of the collateral by the Funds may be delayed or limited. The gross values are included in the Funds’ Schedules of Investments. As of August 31, 2019,
the value of the related collateral exceeded the value of the repurchase agreements for each Fund.
(m) Restricted Securities
The Funds are permitted to invest in securities that are subject to legal or contractual restrictions on resale. These securities generally may be resold in transactions exempt from registration or to the public if the securities are registered. Disposal of these securities may involve time-consuming negotiations and expenses, and prompt sale at an acceptable price may be difficult.
2. Principal Risks
In the normal course of business, the Funds trade financial instruments and enter into financial transactions where risk of potential loss exists due to, among other things, changes in the market (market risk) or failure of the other party to a transaction to perform (counterparty risk). The Funds are also exposed to other risks such as, but not limited to, interest rate, credit and leverage risks. Additionally, Convertible & Income 2024 Target Term is exposed to limited term risk.
Interest rate risk is the risk that fixed income securities’ valuations will change because of changes in interest rates. During periods of rising nominal interest rates, the values of fixed income instruments are generally expected to decline. Conversely, during periods of declining nominal interest rates, the values of fixed income instruments are generally expected to rise. To the extent that a Fund effectively has short positions with respect to fixed income instruments, the values of such short positions would generally be expected to rise when nominal interest rates rise and to decline when nominal interest rates decline. A nominal interest rate can be described as the sum of a real interest rate and an expected inflation rate.
| August 31, 2019 | | Semi-Annual Report | 57 |
Table of Contents
Notes to Financial Statements
AllianzGI Convertible & Income 2024 Target Term Fund/AllianzGI Convertible & Income Fund/AllianzGI Convertible & Income Fund II
August 31, 2019 (unaudited)
2. Principal Risks (continued)
Fixed income securities with longer durations tend to be more sensitive to changes in interest rates, usually making them more volatile than securities with shorter durations. Duration is used primarily as a measure of the sensitivity of a fixed income security’s market price to interest rate (i.e., yield) movements. Interest rate changes can be sudden and unpredictable, and each of the Funds may lose money as a result of movements in interest rates. The Funds may not be able to hedge against changes in interest rates or may choose not to do so for cost or other reasons. In addition, any hedges may not work as intended. The values of equity and othernon-fixed income securities may also decline due to fluctuations in interest rates.
The Funds are exposed to credit risk, which is the risk of losing money if the issuer or guarantor of a fixed income security is unable or unwilling, or is perceived (whether by market participants, rating agencies, pricing services or otherwise) as unable or unwilling, to make timely principal and/or interest payments, or to otherwise honor its obligations. Securities are subject to varying degrees of credit risk, which are often reflected in credit ratings.
The market values of securities may decline due to general market conditions (market risk) which are not specifically related to a particular company, such as real or perceived adverse economic conditions, changes in the general outlook for corporate earnings, changes in interest or currency rates, adverse changes to credit markets or adverse investor sentiment. They may also decline due to factors that affect a particular industry or industries, such as labor shortages or increased production costs and competitive conditions within an industry. Equity securities and equity-related investments generally have greater market price volatility than fixed income securities, although under
certain market conditions fixed income securities may have comparable or greater price volatility. Credit ratings downgrades may also negatively affect securities held by the Funds. Even when markets perform well, there is no assurance that the investments held by the Funds will increase in value along with the broader market. In addition, market risk includes the risk that geopolitical events will disrupt the economy on a national or global level.
The Funds are exposed to counterparty risk, or the risk that an institution or other entity with which the Funds have unsettled or open transactions will default. The potential loss to the Funds could exceed the value of the financial assets recorded in the Funds’ financial statements. Financial assets, which potentially expose the Funds to counterparty risk, consist principally of cash due from counterparties and investments. The Investment Manager seeks to minimize the Funds’ counterparty risk by performing reviews of each counterparty and by minimizing concentration of counterparty risk by undertaking transactions with multiple customers and counterparties on recognized and reputable exchanges. Delivery of securities sold is only made once the Funds have received payment. Payment is made on a purchase once the securities have been delivered by the counterparty. The trade will fail if either party fails to meet its obligation.
The Funds are exposed to risks associated with leverage. Leverage may cause the value of the Funds’ shares to be more volatile than if the Funds did not use leverage. This is because leverage tends to exaggerate the effect of any increase or decrease in the value of the Funds’ portfolio securities. The Funds may engage in transactions or purchase instruments that give rise to forms of leverage. In addition, to the extent the Funds employ leverage, dividend and interest costs on such leverage may not be
| 58 | Semi-Annual Report | | August 31, 2019 |
Table of Contents
Notes to Financial Statements
AllianzGI Convertible & Income 2024 Target Term Fund/AllianzGI Convertible & Income Fund/AllianzGI Convertible & Income Fund II
August 31, 2019 (unaudited)
2. Principal Risks (continued)
recovered by any appreciation of the securities purchased with the leverage proceeds and could exceed the Funds’ investment returns, resulting in greater losses. As discussed further in Note 6 and Note 11, Convertible & Income and Convertible & Income II have auction-rate and cumulative preferred shares outstanding. As discussed further in Note 8, the Funds have entered into a liquidity facility.
Convertible & Income 2024 Target Term is exposed to limited term risk. The Fund has a limited term feature, pursuant to which it intends, on or about September 1, 2024, to cease its investment operations, liquidate its portfolio (to the extent possible), retire or redeem any outstanding leverage facilities and distribute all its liquidated assets to its then record shareholders, unless the term is extended by the Fund’s Board of Trustees (for up to six months) and absent Trustee and shareholder approval to amend the limited term. Because the assets of the Fund will be liquidated in connection with its termination, the Fund may be required to sell portfolio securities when it otherwise would not, including at times when market conditions are not favorable, or at a time when a particular security has entered into default or bankruptcy, or otherwise is in severe distress, which may cause the Fund to lose money. Although the Fund has an investment objective of returning the Original NAV to Common Shareholders on or about the Termination Date, this is not a guarantee and the Fund may not be successful in achieving this objective. There can be no assurance that the Fund will be able to return the Original NAV to Common Shareholders, and such return is not backed or otherwise guaranteed by the Fund, the Investment Manager or any other entity.
The Funds may hold defaulted securities that may involve special considerations including
bankruptcy proceedings, other regulatory and legal restrictions affecting the Funds’ ability to trade, and the availability of prices from independent pricing services or dealer quotations. Defaulted securities are often illiquid and may not be actively traded. Sale of securities in bankrupt companies at an acceptable price may be difficult and differences compared to the value of the securities used by the Funds could be material. A Fund may incur additional expenses to the extent it is required to seek recovery upon a portfolio security’s default in the payment of principal or interest. In any bankruptcy proceeding relating to a defaulted investment, a Fund may lose its entire investment or may be required to accept cash or securities with a value substantially less than its original investment.
Investments in senior loans and repurchase agreements also involve special risks. Although typically secured, senior loans may not be backed by sufficient collateral to satisfy their issuers’ obligations in the event of bankruptcy or similar scenarios. Senior loans may also be illiquid. Similarly, repurchase agreements may result in losses if the collateral associated with such positions is insufficient in the event of a counterparty default or similar scenario. Repurchase agreement positions may also be illiquid.
3. Investment Manager & Deferred Compensation
(a) Investment Manager. Each Fund has an Investment Management Agreement (for the purpose of this section, each an “Agreement”) with the Investment Manager. Subject to the supervision of the Funds’ Board, the Investment Manager is responsible for managing, either directly or through others selected by it, the Funds’ investment activities, business affairs and administrative matters. Pursuant to its Agreement, Convertible & Income 2024 Target
| August 31, 2019 | | Semi-Annual Report | 59 |
Table of Contents
Notes to Financial Statements
AllianzGI Convertible & Income 2024 Target Term Fund/AllianzGI Convertible & Income Fund/AllianzGI Convertible & Income Fund II
August 31, 2019 (unaudited)
3. Investment Manager & Deferred Compensation (continued)
Term pays the Investment Manager an annual fee, payable monthly, at an annual rate of 0.75% of its average daily total managed assets. Total managed assets for Convertible & Income 2024 Target Term refer to the total assets of the Fund (including assets attributable to any borrowings, issued debt securities or preferred shares that may be outstanding, reverse repurchase agreements and dollar rolls) minus accrued liabilities (other than liabilities representing borrowings, issued debt securities, reverse repurchase agreements and dollar rolls). Pursuant to their Agreements, Convertible & Income and Convertible & Income II, pay the Investment Manager an annual fee, payable monthly, at an annual rate of 0.70% of each Fund’s average daily total managed assets. Total managed assets for Convertible & Income and Convertible & Income II refer to the total assets of the Fund (including any assets attributable to any Preferred Shares or other forms of leverage of the Fund that may be outstanding) minus accrued liabilities (other than liabilities representing leverage).
(b) Deferred Compensation. The Trustees do not currently receive any pension or retirement
benefits from the Funds. In calendar year 2018 and certain prior periods, the Funds maintained a deferred compensation plan pursuant to which each Independent Trustee had the opportunity to elect not to receive all or a portion of his or her fees from the Fund on a current basis, but instead to receive in a subsequent period chosen by the Trustee an amount equal to the value of such compensation if such compensation had been invested in one or more series of Allianz Funds or Allianz Funds Multi-Strategy Trust selected by the Trustees from and after the normal payment dates for such compensation. The deferred compensation program was closed to new deferrals effective January 1, 2019, and all Trustee fees earned with respect to service in calendar year 2019 and beyond have been or will be paid in cash, on a current basis, unless the Board of Trustees of the Allianz-Sponsored Funds reopens the program to new deferrals. Allianz Funds and Allianz Funds Multi-Strategy Trust still have obligations with respect to Trustee fees deferred in 2018 and in prior periods, and will continue to have such obligations until all deferred Trustee fees are paid out pursuant to the terms of the deferred compensation plan.
4. Investments in Securities
For the six months ended August 31, 2019, purchases and sales of investments, other than short-term securities were:
| Purchases | Sales | |||||||
Convertible & Income 2024 Target Term | $ | 109,326,454 | $ | 113,932,867 | ||||
Convertible & Income | 127,762,101 | 144,498,315 | ||||||
Convertible & Income II | 97,083,392 | 109,475,461 | ||||||
| 60 | Semi-Annual Report | | August 31, 2019 |
Table of Contents
Notes to Financial Statements
AllianzGI Convertible & Income 2024 Target Term Fund/AllianzGI Convertible & Income Fund/AllianzGI Convertible & Income Fund II
August 31, 2019 (unaudited)
5. Income Tax Information
At August 31, 2019, the aggregate cost basis and net unrealized depreciation of investments for federal income tax purposes were:
| Federal Tax Cost Basis(1) | Unrealized Appreciation | Unrealized Depreciation | Net Unrealized Depreciation | |||||||||||||
Convertible & Income 2024 Target Term | $ | 253,979,855 | $ | 2,167,193 | $ | 7,093,342 | $ | (4,926,149 | ) | |||||||
Convertible & Income | 875,635,940 | 50,812,306 | 71,893,362 | (21,081,056 | ) | |||||||||||
Convertible & Income II | 666,638,001 | 39,401,051 | 54,174,235 | (14,773,184 | ) | |||||||||||
| (1) | Differences between book and tax cost basis were attributable to wash sale loss deferrals and the differing treatment of bond premium amortization. |
6. Auction-Rate Preferred Shares
Convertible & Income has 1,894 shares of Auction-Rate Preferred Shares Series A, 1,779 shares of Auction-Rate Preferred Shares Series B, 1,909 shares of Auction-Rate Preferred Shares Series C, 1,842 shares of Auction-Rate Preferred Shares Series D and 1,507 shares of Auction-Rate Preferred Shares Series E outstanding, each with a liquidation preference of $25,000 per share plus any accumulated, unpaid dividends.
Convertible & Income II has 1,296 shares of Auction-Rate Preferred Shares Series A, 1,512 shares of Auction-Rate Preferred Shares Series B, 1,239 shares of Auction-Rate Preferred Shares
Series C, 1,156 shares of Auction-Rate Preferred Shares Series D and 1,298 shares of Auction-Rate Preferred Shares Series E outstanding, each with a liquidation preference of $25,000 per share plus any accumulated, unpaid dividends.
Dividends are accumulated daily at an annual rate that is typicallyre-set every seven days. Distributions of net realized capital gains, if any, are paid annually.
For the six months ended August 31, 2019, the annualized dividend rates paid with respect to the Auction-Rate Preferred shares of Convertible & Income and Convertible & Income II ranged from:
| High | Low | At August 31, 2019 | ||||||||||
Series A | 3.738% | 3.107% | 3.242% | |||||||||
Series B | 3.738% | 3.107% | 3.107% | |||||||||
Series C | 3.723% | 3.107% | 3.107% | |||||||||
Series D | 3.738% | 3.107% | 3.107% | |||||||||
Series E | 3.738% | 3.122% | 3.287% | |||||||||
Convertible & Income and Convertible & Income II are subject to certain limitations and restrictions while Auction-Rate Preferred Shares are outstanding. Failure to comply with these limitations and restrictions could preclude the Funds from declaring or paying any dividends
or distributions to common shareholders or repurchasing common shares and/or could trigger the mandatory redemption of Auction-Rate Preferred Shares at their liquidation preference plus any accumulated, unpaid dividends.
| August 31, 2019 | | Semi-Annual Report | 61 |
Table of Contents
Notes to Financial Statements
AllianzGI Convertible & Income 2024 Target Term Fund/AllianzGI Convertible & Income Fund/AllianzGI Convertible & Income Fund II
August 31, 2019 (unaudited)
6. Auction-Rate Preferred Shares (continued)
Auction-Rate Preferred shareholders, who are entitled to one vote per share on most matters, generally vote together with the common shareholders but vote separately as a class to elect two Trustees and on certain matters adversely affecting the rights of the Auction-Rate Preferred Shares.
Sincemid-February 2008, holders of auction-rate preferred shares (“ARPS”) issued by the Funds have been directly impacted by a lack of liquidity, which has similarly affected ARPS holders in many of the nation’sclosed-end funds. Since then, regularly scheduled auctions for the Preferred shares (which are ARPS) issued by the Funds have consistently “failed” because of insufficient demand (bids to buy shares) to meet the supply (shares offered for sale) at each auction.
In a failed auction, ARPS holders cannot sell all, and may not be able to sell any, of their shares tendered for sale. While repeated auction failures have affected the liquidity for ARPS, they do not constitute a default or automatically alter the credit quality of the ARPS, and ARPS holders have continued to receive dividends at the defined “maximum rate”, which for the Funds is equal to the7-day “AA” Composite Commercial Paper Rate multiplied by a minimum of 150%, depending on the credit rating of the ARPS. The maximum rate is a function of short-term interest rates and typically higher than the rate that would have otherwise been set through a successful auction.
On May 29, 2014, Moody’s Investors Service upgraded each Fund’s ARPS ratings to Aa3 from A1. As a result, the applicable multiplier for calculating the maximum rate decreased from
200% to 150% beginning on that date. If the Funds’ ARPS continue to fail and the “maximum rate” payable on the ARPS rises as result of changes in short-term interest rates, returns for the Funds’ common shareholders could be adversely affected.
7. Tender Offers
On June 20, 2018, the Board announced a tender offer to purchase for cash up to 100% of the outstanding ARPS of each of Convertible & Income and Convertible & Income II at a price equal to 94% of the ARPS’ liquidation preference of $25,000 per share (or $23,500 per share) plus any unpaid dividends accrued through the expiration date of each tender offer, or such later date to which such tender offer may be extended (each a “Tender Offer” and, together, the “Tender Offers”).
On June 28, 2018, Convertible & Income and Convertible & Income II each commenced its respective Tender Offer. The tables below include the per share liquidation preference and tender offer price per share for the ARPS of each of Convertible & Income and Convertible & Income II.
On July 31, 2018, the Tender Offers expired and Convertible & Income and Convertible & Income II announced the results of the Tender Offers. With respect to Convertible & Income, 5,349 ARPS were tendered, representing approximately 37% of the outstanding ARPS. With respect to Convertible & Income II, 4,459 ARPS were tendered, representing approximately 41% of the outstanding ARPS. The Tender Offers resulted in accretion to the NAVs of common shareholders of $0.09 per common share for both Convertible & Income and Convertible & Income II. The ARPS of Convertible & Income and Convertible & Income II that were not tendered remain outstanding.
| 62 | Semi-Annual Report | | August 31, 2019 |
Table of Contents
Notes to Financial Statements
AllianzGI Convertible & Income 2024 Target Term Fund/AllianzGI Convertible & Income Fund/AllianzGI Convertible & Income Fund II
August 31, 2019 (unaudited)
7. Tender Offers (continued)
Details of the ARPS tendered and not withdrawn per series for the year ended February 28, 2019 are provided in the tables below:
| Convertible & Income | Liquidation Preference Per share | Tender Offer Price Per Share | Price Percentage | Cash Exchanged for ARPS Tendered Including Accrued Dividends | ARPS Outstanding as of 2/28/2018 | ARPS Tendered | ARPS Outstanding after Tender Offer as of 2/28/2019 | |||||||||||||||||||||
Series A | $ | 25,000 | $ | 23,500 | 94% | $ | 22,608,878 | 2,856 | 962 | 1,894 | ||||||||||||||||||
Series B | 25,000 | 23,500 | 94% | 25,309,500 | 2,856 | 1,077 | 1,779 | |||||||||||||||||||||
Series C | 25,000 | 23,500 | 94% | 22,265,661 | 2,856 | 947 | 1,909 | |||||||||||||||||||||
Series D | 25,000 | 23,500 | 94% | 23,838,959 | 2,856 | 1,014 | 1,842 | |||||||||||||||||||||
Series E | 25,000 | 23,500 | 94% | 31,706,769 | 2,856 | 1,349 | 1,507 | |||||||||||||||||||||
|
|
|
|
|
|
|
| |||||||||||||||||||||
| $ | 125,729,767 | 14,280 | 5,349 | 8,931 | ||||||||||||||||||||||||
|
|
|
|
|
|
|
| |||||||||||||||||||||
| Convertible & Income II | Liquidation Preference Per share | Tender Offer Price Per Share | Price Percentage | Cash Exchanged for ARPS Tendered Including Accrued Dividends | ARPS Outstanding as of 2/28/2018 | ARPS Tendered | ARPS Outstanding after Tender Offer as of 2/28/2019 | |||||||||||||||||||||
Series A | $ | 25,000 | $ | 23,500 | 94% | $ | 21,057,750 | 2,192 | 896 | 1,296 | ||||||||||||||||||
Series B | 25,000 | 23,500 | 94% | 15,980,000 | 2,192 | 680 | 1,512 | |||||||||||||||||||||
Series C | 25,000 | 23,500 | 94% | 22,406,732 | 2,192 | 953 | 1,239 | |||||||||||||||||||||
Series D | 25,000 | 23,500 | 94% | 24,356,175 | 2,192 | 1,036 | 1,156 | |||||||||||||||||||||
Series E | 25,000 | 23,500 | 94% | 21,012,491 | 2,192 | 894 | 1,298 | |||||||||||||||||||||
|
|
|
|
|
|
|
| |||||||||||||||||||||
| $ | 104,813,148 | 10,960 | 4,459 | 6,501 | ||||||||||||||||||||||||
|
|
|
|
|
|
|
| |||||||||||||||||||||
8. Liquidity Facility
Each of Convertible & Income 2024 Target Term, Convertible & Income and Convertible & Income II has entered into a liquidity facility (each an “SSB Facility” and, together, the “SSB Facilities”) with State Street Bank & Trust Company (“State Street”). The Funds pledge their assets as collateral to secure obligations under the SSB Facilities. The Funds retain the
risks and rewards of the ownership of assets pledged to secure obligations under the SSB Facilities. As part of the SSB Facilities, the Funds make assets available for securities lending transactions with State Street acting as the Funds’ authorized agent for these transactions. All transactions initiated through State Street are required to be secured with cash collateral
| August 31, 2019 | | Semi-Annual Report | 63 |
Table of Contents
Notes to Financial Statements
AllianzGI Convertible & Income 2024 Target Term Fund/AllianzGI Convertible & Income Fund/AllianzGI Convertible & Income Fund II
August 31, 2019 (unaudited)
8. Liquidity Facility (continued)
received from the securities borrower (the “Borrower”). Securities lending transactions will be secured with cash collateral in amounts no less than 100% of the market value of the securities utilized in these transactions. Cash received by State Street from securities lending is credited against borrowings under the SSB Facilities. Upon return of securities by the Borrower, State Street will return the cash collateral to the Borrower, as applicable, which will eliminate the credit against the borrowings and will cause the draw-downs under the SSB Facilities to increase by the amounts returned. Borrowing fees on the loaned securities are retained by State Street.
State Street indemnifies the Funds for certain losses that may arise if the Borrower fails to return securities when due. With respect to securities lending transactions, upon a default of the securities borrower, State Street uses the collateral received from the Borrower to purchase replacement securities of the same issue, type, class and series. If such collateral is insufficient, the purchase of replacement securities is made at State Street’s sole cost and expense. Although the risk of the loss of the securities is mitigated by receiving collateral from the Borrower and through State Street indemnification, the Funds could experience a delay in recovering securities or could experience a lower than expected return if the Borrower fails to return the securities on a timely basis.
State Street may fund drawdowns under a State Street Facility through reverse repurchase agreements in a manner and on terms that are substantially similar to the securities loans described above. None of the Funds’ borrowings during the reporting period were funded though reverse repurchase agreements. The maximum capital commitment amounts under the respective SSB Facilities until May 5, 2019 were
$71,000,000, $265,000,000 and $210,000,000, and from May 6, 2019 the amounts were $71,000,000, $34,000,000 and $0, respectively for Convertible & Income 2024 Target Term, Convertible & Income and Convertible & Income II. Interest on amounts drawn under each SSB Facility is charged at a daily rate equal to the U.S.3-month LIBOR rate plus 0.55%, with a commitment fee of 0.15% payable on the maximum capital commitment amount less the amount drawn in any month when the amount drawn is less than 85% of the commitment amount on any day. At August 31, 2019, the Convertible & Income 2024 Target Term and Convertible & Income had borrowings outstanding under the SSB Facilities totaling $69,700,000, and $28,851,500, respectively, which are shown in the Statements of Assets and Liabilities as Loan Payable. Convertible & Income II did not have borrowings outstanding at August 31, 2019. The interest rate charged at August 31, 2019, was 2.69%. During the six-month period ended August 31, 2019 when the Funds had outstanding borrowings, the weighted average daily balances outstanding for Convertible & Income 2024 Target Term and Convertible & Income were $69,700,000 and $28,851,500 respectively, at the weighted average interest rate of 2.98%. Loan interest expense of $1,083,564 and $448,635, respectively, are included in the Funds’ Statements of Operations.
During the six-month period ended August 31, 2019, Convertible & Income 2024 Term and Convertible & Income used approximately $62,743,933 and $25,512,278, respectively, of the cash collateral received from the SSB Facility to credit against borrowings under the SSB Facilities, representing 25.3% and 3.0% of managed assets, respectively. Cash and securities purchased with cash received through the SSB Facility are included in cash and investment line items per the Statements of
| 64 | Semi-Annual Report | | August 31, 2019 |
Table of Contents
Notes to Financial Statements
AllianzGI Convertible & Income 2024 Target Term Fund/AllianzGI Convertible & Income Fund/AllianzGI Convertible & Income Fund II
August 31, 2019 (unaudited)
8. Liquidity Facility (continued)
Assets and Liabilities. As of August 31, 2019, $61,472,032 and $25,023,588 of securities were on loan, respectively, under the SSB Facilities for Convertible & Income 2024 Target Term and Convertible & Income. These amounts are reflected on the Statements of Assets and Liabilities in Investments, at value. Each Fund may terminate its SSB Facility with 60 days’ notice. If certain asset coverage and collateral requirements, or other covenants are not met, an SSB Facility could be deemed in default and result in termination. Absent a default or facility termination event, State Street is required to provide a Fund with 360 days’ notice prior to terminating such Fund’s SSB Facility.
9. Related Party Transactions
The Investment Manager is a related party. Fees payable to this party are disclosed in Note 3 and the accrued related party fee amounts are disclosed on the Statements of Assets and Liabilities.
The Funds are permitted to purchase or sell securities from or to certain related affiliated funds under specified conditions outlined in procedures adopted by the Board. The procedures have been designed to ensure that any purchase or sale of securities by the Funds from or to another fund or portfolio that are, or could be, considered an affiliate by virtue of having a common investment adviser (or affiliated investment advisers), common Trustees and/or common officers comply with Rule17a-7 of the 1940 Act. Further, as defined under the procedures, each transaction is effected at the current market price. During the six months ended August 31, 2019, the Funds did not engage in Rule17a-7 of the 1940 Act transactions.
An affiliated issuer includes any company in which a Fund held 5% or more of a company’s outstanding voting shares at any point during the fiscal year. The tables below represent transactions in and earnings from these affiliated issuers during the six months ended August 31, 2019:
Convertible & Income 2024 Target Term:
| Market Value 2/28/2019 | Purchases at Cost | Proceeds from Sales | Change in Unrealized Appreciation/ Depreciation | Market Value 8/31/2019 | Dividend Income | Shares as of 8/31/2019 | Net Realized Gain (Loss) | |||||||||||||||||||||||||
CCF Holdings LLC Class B†† | $ | 1 | $ | — | $ | — | $ | — | $ | 1 | $ | — | 7,142 | $ | — | |||||||||||||||||
Convertible & Income:
| Market Value 2/28/2019 | Purchases at Cost | Proceeds from Sales | Change in Unrealized Appreciation/ Depreciation* | Market Value 8/31/2019 | Dividend Income | Shares as of 8/31/2019 | Net Realized Gain (Loss) | |||||||||||||||||||||||||
CCF Holdings LLC Class A† | $ | 6 | $ | — | $ | — | $ | — | $ | 6 | $ | — | 56,642 | $ | — | |||||||||||||||||
CCF Holdings LLC Class B | 2 | — | — | — | 2 | — | 21,429 | — | ||||||||||||||||||||||||
LiveStyle, Inc., Ser. B† | 7,657,200 | — | — | — | 7,657,200 | — | 76,572 | — | ||||||||||||||||||||||||
LiveStyle, Inc.† | 9 | — | — | — | 9 | — | 90,407 | — | ||||||||||||||||||||||||
|
|
|
|
|
|
|
|
|
|
|
|
|
|
|
| |||||||||||||||||
Totals | $ | 7,657,217 | $ | — | $ | — | $ | — | $ | 7,657,217 | $ | — | 245,050 | $ | — | |||||||||||||||||
|
|
|
|
|
|
|
|
|
|
|
|
|
|
|
| |||||||||||||||||
| August 31, 2019 | | Semi-Annual Report | 65 |
Table of Contents
Notes to Financial Statements
AllianzGI Convertible & Income 2024 Target Term Fund/AllianzGI Convertible & Income Fund/AllianzGI Convertible & Income Fund II
August 31, 2019 (unaudited)
9. Related Party Transactions (continued)
Convertible & Income II:
| Market Value 2/28/2019 | Purchases at Cost | Proceeds from Sales | Change in Unrealized Appreciation/ Depreciation* | Market Value 8/31/2019 | Dividend Income | Shares as of 8/31/2019 | Net Realized Gain (Loss) | |||||||||||||||||||||||||
CCF Holdings LLC, Class B† | $ | 2 | $ | — | $ | — | $ | — | $ | 2 | $ | — | 21,429 | $ | — | |||||||||||||||||
LiveStyle, Inc., Ser. B † | 7,657,200 | — | — | — | 7,657,200 | — | 76,572 | — | ||||||||||||||||||||||||
LiveStyle, Inc.† | 9 | — | — | — | 9 | — | 90,407 | — | ||||||||||||||||||||||||
|
|
|
|
|
|
|
|
|
|
|
|
|
|
|
| |||||||||||||||||
Totals | $ | 7,657,211 | $ | — | $ | — | $ | — | $ | 7,657,211 | $ | — | 188,408 | $ | — | |||||||||||||||||
|
|
|
|
|
|
|
|
|
|
|
|
|
|
|
| |||||||||||||||||
| † | Not affiliated at February 28, 2019. |
| †† | Not affiliated at August 31, 2019. |
| * | Does not tie to Net change in unrealized appreciation/depreciation on the Statements of Operations as a result of previously unaffiliated securities moving to affiliated. |
10. Cumulative Preferred Shares
On September 11, 2018, Convertible & Income II issued 4,360,000 shares of 5.50% Series A Cumulative Preferred Shares with an aggregate liquidation value of $109,000,000 (“NCZ Series A Preferred Shares”). The shares are perpetual,non-callable for a period of five years and have a liquidation preference of $25.00 per share. Commencing September 11, 2023, and thereafter, to the extent permitted by the 1940 Act, and Massachusetts law, Convertible & Income II may at any time, upon notice of redemption, redeem the NCZ Series A Preferred Shares in whole or in part at the liquidation preference per share plus accumulated unpaid dividends through the date of redemption. Dividends are paid at an annual rate of 5.50% on a quarterly basis, and commenced on October 1, 2018, with the first such paymentpro-rated from the date of issuance. The Series A Cumulative Preferred Shares of Convertible & Income II received a long-term rating of “AAA” from Fitch Ratings Inc. (“Fitch Ratings”).
The net proceeds of the issuance were used to repay the full amount outstanding under the SSB Facility.
On September 20, 2018, Convertible & Income issued 4,000,000 shares of 5.625% Series A Cumulative Preferred Shares with an aggregate liquidation value of $100,000,000 (“NCV Series A Preferred Shares”). The shares are perpetual,
non-callable for a period of five years and have a liquidation preference of $25.00 per share. Commencing September 20, 2023, and thereafter, to the extent permitted by the 1940 Act, and Massachusetts law, Convertible & Income may at any time, upon notice of redemption, redeem the NCV Series A Preferred Shares in whole or in part at the liquidation preference per share plus accumulated unpaid dividends through the date of redemption. Dividends are paid at an annual rate of 5.625% on a quarterly basis, and commenced on October 1, 2018, with the first such paymentpro-rated from the date of issuance. The Series A Cumulative Preferred Shares of Convertible & Income received a long-term rating of “AAA” from Fitch Ratings. The net proceeds of the issuance were used to repay a portion of the amount outstanding under the SSB Facility.
11. Significant Account Holder
From time to time, a Fund may have a concentration of shareholders, which may include
| 66 | Semi-Annual Report | | August 31, 2019 |
Table of Contents
Notes to Financial Statements
AllianzGI Convertible & Income 2024 Target Term Fund/AllianzGI Convertible & Income Fund/AllianzGI Convertible & Income Fund II
August 31, 2019 (unaudited)
11. Significant Account Holder (continued)
the Investment Manager or affiliates of the Investment Manager, holding a significant percentage of shares outstanding. Investment activities of these shareholders could have a material impact on a Fund.
At August 31, 2019, Punch & Associates Investment Management, Inc. held 5% or more of shares of common stock of Convertible & Income 2024 Target Term. At August 31, 2019, RiverNorth Capital Management, LLC, Louisiana Workers Co., FGL Holdings and Conning Inc. each held 5% or
more of cumulative preferred shares of Convertible & Income. At August 31, 2019, FGL Holdings held 5% or more of cumulative preferred shares of Convertible & Income II.
12. Subsequent Events
In preparing these financial statements, the Funds’ management has evaluated events and transactions for potential recognition or disclosure through the date the financial statements were issued.
On September 3, 2019 the following quarterly dividends were declared to cumulative preferred shareholders, payable September 30, 2019 to shareholders of record on September 13, 2019:
Convertible & Income | $0.3515625 per share | |
Convertible & Income II | $0.34375 per share |
On September 3, 2019 the following monthly dividends were declared to common shareholders, payable October 1, 2019 to common shareholders of record on September 13, 2019:
Convertible & Income 2024 Target Term | $0.046 per common share | |
Convertible & Income | $0.525 per common share | |
Convertible & Income II | $0.045 per common share |
On October 1, 2019 the following monthly dividends were declared to common shareholders, payable November 1, 2019 to common shareholders of record on October 11, 2019:
Convertible & Income 2024 Target Term | $0.046 per common share | |
Convertible & Income | $0.525 per common share | |
Convertible & Income II | $0.045 per common share |
There were no other subsequent events identified that require recognition or disclosure.
| August 31, 2019 | | Semi-Annual Report | 67 |
Table of Contents
Annual Shareholder Meeting Results/Proxy Voting Policies & Procedures(unaudited)
AllianzGI Convertible & Income 2024 Target Term Fund/AllianzGI Convertible & Income Fund/AllianzGI Convertible & Income Fund II
Convertible & Income 2024 Target Term, Convertible & Income and Convertible & Income II held their meeting of shareholders on July 11, 2019. Shareholders voted as indicated below:
| Convertible & Income 2024 Target Term: | Affirmative | Withheld Authority | ||||||
Election of F. Ford Drummond — Class II to serve until the | 16,406,093 | 332,912 | ||||||
Election of James A. Jacobson — Class II to serve until the | 16,169,017 | 569,988 | ||||||
Election of James S. MacLeod — Class II to serve until the | 16,163,149 | 575,856 | ||||||
Election of Sarah E. Cogan — Class III to serve until the | 16,682,969 | 56,107 | ||||||
Election of Thomas J. Fuccillo† — Class II to serve until the | 16,628,517 | 110,559 | ||||||
The other members of the Board of Trustees at the time of the meeting, namely, Ms. Deborah A. DeCotis and Messrs. Bradford K. Gallagher, Erick R. Holt†, Alan Rappaport, Hans W. Kertess, William B. Ogden, IV and Davey S. Scoon continued to serve as Trustees of the Fund.
| † | Interested Trustee |
| Convertible & Income: | Affirmative | Withheld Authority | ||||||
Re-election of Hans W. Kertess — Class I to serve until the | 80,405,336 | 6,116,373 | ||||||
Re-election of William B. Ogden, IV — Class I to serve until the | 80,285,804 | 6,235,904 | ||||||
Election of Sarah E. Cogan — Class II to serve until the | 80,999,524 | 5,522,185 | ||||||
Election of Thomas J. Fuccillo† — Class III to serve until the | 80,749,938 | 5,771,769 | ||||||
Re-election of Erick R. Holt† — Class I to serve until the | 80,921,961 | 5,599,745 | ||||||
Re-election of Alan Rappaport* — Class I to serve until the | 3,196,156 | 8,422,501 | ||||||
The other members of the Board of Trustees at the time of the meeting, namely, Ms. Deborah A. DeCotis and Messrs. F. Ford Drummond, Bradford K. Gallagher, James A. Jacobson, James S. MacLeod, IV and Davey S. Scoon continued to serve as Trustees of the Fund.
| * | Mr. Alan Rappaport was re-elected by preferred shareholders voting as a separate class. All other Trustees of the Convertible & Income II were elected by common and preferred shareholders voting together as a single class. |
| † | Interested Trustee |
| 68 | Semi-Annual Report | | August 31, 2019 |
Table of Contents
Annual Shareholder Meeting Results/Proxy Voting Policies & Procedures(unaudited) (continued)
AllianzGI Convertible & Income 2024 Target Term Fund/AllianzGI Convertible & Income Fund/AllianzGI Convertible & Income Fund II
| Convertible & Income II: | Affirmative | Withheld Authority | ||||||
Re-election of William B. Ogden, IV — Class I to serve until the | 70,909,449 | 4,904,552 | ||||||
Election of Sarah E. Cogan — Class I to serve until the | 70,974,134 | 4,839,868 | ||||||
Election of Thomas J. Fuccillo† — Class III to serve until the | 71,062,653 | 4,751,349 | ||||||
Re-election of Erick R. Holt† — Class I to serve until the | 70,948,181 | 4,865,818 | ||||||
Re-election of Alan Rappaport* — Class I to serve until the | 2,999,341 | 6,079,102 | ||||||
The other members of the Board of Trustees at the time of the meeting, namely, Ms. Deborah A. DeCotis and Messrs., F. Ford Drummond, Bradford K. Gallagher, James A. Jacobson, Hans W. Kertess, James S. MacLeod, and Davey S. Scoon continued to serve as Trustees of the Fund.
| * | Mr. Alan Rappaport was re-elected by preferred shareholders voting as a separate class. All other Trustees of the Convertible & Income II were elected by common and preferred shareholders voting together as a single class. |
| † | Interested Trustee |
Proxy Voting Policies & Procedures:
A description of the policies and procedures that the Funds have adopted to determine how to vote proxies relating to portfolio securities and information about how the Funds voted proxies relating to portfolio securities held during the most recent twelve month period ended June 30 is available (i) without charge, upon request, by calling the Funds’ shareholder servicing agent at (800)254-5197; (ii) on the Funds’ website at us.allianzgi.com/closedendfunds; and (iii) on the Securities and Exchange Commission website at www.sec.gov.
| August 31, 2019 | | Semi-Annual Report | 69 |
Table of Contents
Matters Relating to the Trustees’ Consideration of the Investment Management Agreements(unaudited)
AllianzGI Convertible & Income 2024 Target Term Fund/AllianzGI Convertible & Income Fund/AllianzGI Convertible & Income Fund II
The Investment Company Act of 1940, as amended (the “1940 Act”), requires that both the full Board of Trustees (the “Board” or the “Trustees”) and a majority of the Trustees who are not interested persons of AllianzGI Convertible & Income 2024 Target Term Fund (“CBH”), AllianzGI Convertible & Income Fund (“NCV”), or AllianzGI Convertible & Income Fund II (“NCZ”) (each a “Fund” and together, the “Funds”) (the “Independent Trustees”), voting separately, annually approve the continuation of each Fund’s Investment Management Agreement (the “Agreements” and, with respect to each Fund, the “Agreement”) with Allianz Global Investors U.S. LLC (the “Investment Manager”). Throughout the process, the Independent Trustees received separate legal advice from independent legal counsel that is experienced in 1940 Act matters and that is independent of the Investment Manager (“Independent Counsel”), and with whom they met separately from the Investment Manager during the contract review meetings.
The Trustees met in person on June 19, 2019 for the specific purpose of considering whether to approve the continuation of the Agreements for an additional year. The Contracts Committee of the Board of Trustees, which is comprised of all of the Independent Trustees, held a conference call on June 5, 2019 and metin-person on June 19, 2019 (the “contract review meetings”) with Independent Counsel to discuss the materials provided by the Investment Manager in response to the Independent Trustees’ written request for information regarding the annual renewal. Representatives from fund management attended portions of those meetings to, among other topics, review the comparative fee and expense information and comparative performance information prepared and provided by Broadridge Financial Solutions, Inc. (“Broadridge”), an independent third party, for each Fund using its respective Broadridge peer groups for performance and expense comparisons.
At their meeting held on June 19, 2019, the Board and the Independent Trustees unanimously approved the continuation of each Agreement for an additionalone-year period from July 1, 2019 through June 30, 2020. The material factors and conclusions that formed the basis of this approval for each Fund are discussed below.
In connection with their deliberations regarding the approval of each Agreement, the Board, including the Independent Trustees, considered such information and factors as they believed, in light of the legal advice furnished to them and their own business judgment, to be relevant. As described below, the Trustees considered the nature, quality and extent of the various investment management, administrative, and other services to be performed by the Investment Manager under the Agreements.
In evaluating the Agreement with respect to each Fund, the Trustees reviewed extensive materials provided by the Investment Manager in response to questions submitted by the Independent Trustees and Independent Counsel, and met with senior representatives of the Investment Manager regarding its personnel, operations, and financial condition as they relate to the Funds. The Board also considered the broad range of information relevant to the annual contract review that is provided to the Board (including its various standing committees) at meetings throughout the year, including reports on investment performance based on net asset value and common share market price and distribution yield, use of leverage, information regarding share price premiums and/or discounts, portfolio risk, and other portfolio information for each Fund, including the use of derivatives if used as part of the Fund’s strategy, as well as periodic reports on, among other matters, pricing and valuation; quality and cost of portfolio trade execution; compliance; and
| 70 | Semi-Annual Report | | August 31, 2019 |
Table of Contents
Matters Relating to the Trustees’ Consideration of the Investment Management Agreements(unaudited) (continued)
AllianzGI Convertible & Income 2024 Target Term Fund/AllianzGI Convertible & Income Fund/AllianzGI Convertible & Income Fund II
shareholder and other services provided by the Investment Manager and its affiliates. To assist with their review, the Board reviewed fact cards for each Fund including, among other information, performance based on net asset value and market value (both absolute and comparisons between the Funds and their Broadridge Performance Universe (as defined below)), investment objective, total net assets, outstanding leverage, share price premium and/or discount information, annual fund operating expenses, portfolio managers, total expense ratio and management fee comparisons between each Fund and its Broadridge Expense Group (as defined below), and trends in the Investment Manager’s profitability from its advisory relationship with each Fund. They also considered summaries assigning a quadrant placement to each Fund based on an average of certain measures of performance (including in relation to risk) and fees/expenses versus peer group medians. The Board also considered the risk profiles of the Funds.
The Trustees’ conclusions as to the approval of each Agreement were based on a comprehensive consideration of all information provided to the Trustees and were not the result of any single factor. Individual Trustees (those Trustees who are “interested persons” of the Funds, as defined in Section 2(a)(19) of the 1940 Act) may have evaluated the information presented differently from one another, attributing different weights to various factors. The Trustees recognized that the fee arrangements for the Funds are the result of review and discussion in the prior years between the Trustees and the Investment Manager, that certain aspects of such arrangements may receive greater scrutiny in some years than in others, and that the Trustees’ conclusions may be based, in part, on their consideration of these same arrangements during the course of the year and in prior years. The Trustees evaluated information available to them on aFund-by-Fund basis, and their determinations were made separately in respect of each Fund.
Performance Information
With respect to investment performance, the Trustees considered information regarding each Fund’s short-, intermediate-, and long-term performance based on net asset value and market value, as applicable, net of the Fund’s fees and expenses, both on an absolute basis and relative to an appropriate benchmark index that does not deduct the fees or expenses of investing, and compared to the performance of the Broadridge Performance Universe (as defined below). The Trustees considered information provided by Broadridge for the Funds regarding the investment performance of a group of funds with investment classifications and/or objectives comparable to those of the Funds identified by Broadridge (the “Broadridge Performance Universe”). The Trustees also reviewed performance in relation to certain measures of the degree of investment risk undertaken by the portfolio managers, related share price premium and/or discount information, and each Fund’s relative distribution yield as of March 31, 2019.
For Funds that underperformed, the Board considered the magnitude of that underperformance relative to the Broadridge Performance Universe and/or the benchmark (e.g., the amount by which a Fund underperformed, including, for example, whether the Fund slightly underperformed or significantly underperformed). In the case of those Funds that the Trustees identified as having underperformed their benchmark indices and/or Broadridge Performance Universes to an extent, or over a period of time, that the Trustees felt warranted additional inquiry, the Trustees discussed with the Investment Manager each such Fund’s performance, potential reasons for the underperformance, and, if necessary, steps that the Investment Manager had taken, or intended to take, to improve performance. The Trustees also met with the portfolio managers of certain Funds during the 12 months prior to voting on
| August 31, 2019 | | Semi-Annual Report | 71 |
Table of Contents
Matters Relating to the Trustees’ Consideration of the Investment Management Agreements(unaudited) (continued)
AllianzGI Convertible & Income 2024 Target Term Fund/AllianzGI Convertible & Income Fund/AllianzGI Convertible & Income Fund II
the contract renewal and had the opportunity to discuss the Funds’ performance, distribution levels, and use of leverage with the portfolio managers. The Trustees considered the Investment Manager’s responsiveness with respect to the Funds that experienced lagging performance. The Trustees noted that performance, especially short-term performance is only one of the factors that they deem relevant to their consideration of each Agreement and that, after considering all relevant factors, it may be appropriate to approve the continuation of the Agreement notwithstanding a Fund’s underperformance.
Nature, Extent, and Quality of Services
As part of their review, the Trustees received and considered descriptions of various functions performed by the Investment Manager for the Funds, such as portfolio management, compliance monitoring, portfolio trading practices and oversight of third party service providers. They also considered information regarding the overall organization and business functions of the Investment Manager, including, without limitation, information regarding senior management, portfolio managers and other personnel providing or proposed to provide investment management, administrative and other services, and corporate ownership and business operations unrelated to the Funds. The Trustees examined the ability of the Investment Manager to provide high-quality investment management and other services to the Funds. Among other information, the Trustees considered the investment philosophy and research and decision-making processes of the Investment Manager, as well as the Investment Manager’s broker selection process and trading operations; the experience of key advisory personnel of the Investment Manager and its affiliates, as applicable, responsible for portfolio management of the Funds; information regarding the Funds’ use of leverage; the ability of the Investment Manager to attract and retain
capable personnel; employee compensation; and the operational infrastructure, including technology and systems, of the Investment Manager. In addition, the Board noted that the Investment Manager actively monitors any discount from net asset value per share at which each Fund’s common stock trades and evaluates potential ways to reduce the discount and potential impacts on the discount, including the level of distributions that a Fund pays.
In addition, the Trustees noted the extensive range of services that the Investment Manager provides to the Funds beyond the investment management services. In this regard, the Trustees reviewed the extent and quality of the Investment Manager’s services with respect to regulatory compliance and ability to comply with the investment policies of the Funds; the compliance programs and risk controls of the Investment Manager; the specific contractual obligations of the Investment Manager pursuant to the Agreements; the nature, extent and quality of certain administrative services the Investment Manager is responsible for providing to the Funds; the Investment Manager’s risk management function; and conditions that might affect the ability of the Investment Manager to provide high quality services to the Funds in the future under the Agreements, including, but not limited to, the organization’s financial condition and operational stability. The Trustees also considered that the Investment Manager assumes significant ongoing risks with respect to all Funds, including entrepreneurial and business risks the Investment Manager has undertaken in serving as Investment Manager and sponsor of the Funds, for which it is entitled to reasonable compensation. Specifically, its responsibilities include continual management of investment, operational, enterprise, legal, regulatory, and compliance risks as they relate to the Funds. The Trustees also noted the Investment Manager’s activities under its contractual obligation to oversee the Funds’ various outside service providers, including its
| 72 | Semi-Annual Report | | August 31, 2019 |
Table of Contents
Matters Relating to the Trustees’ Consideration of the Investment Management Agreements(unaudited) (continued)
AllianzGI Convertible & Income 2024 Target Term Fund/AllianzGI Convertible & Income Fund/AllianzGI Convertible & Income Fund II
negotiation of certain service providers’ fees and its evaluation of service providers’ infrastructure, cybersecurity programs, compliance programs, and business continuity programs, among other matters. It also considered the Investment Manager’s ongoing development of its own infrastructure and information technology to support the Funds through, among other things, cybersecurity, business continuity planning, and risk management.
In addition, the Trustees considered that the Investment Manager has developed a leverage structure for the Funds tailored to its investment strategy and needs, has monitored the Fund’s ongoing compliance with legal and other restrictions associated with leverage, and has recommended changes in and/or amendments to the amount or structure of its leverage over time.
The Trustees considered that the Investment Manager provides the Funds with office space, administrative services and personnel to serve as Fund officers, and that the Investment Manager and its affiliates pay all of the compensation of the Funds’ interested Trustees and officers (in their capacities as employees of the Investment Manager or such affiliates). Based on the foregoing, the Trustees concluded that the Investment Manager’s investment processes, research capabilities and philosophy were well-suited to each Fund given its investment objective and policies, that the Investment Manager would be able to continue to meet any reasonably foreseeable obligations under the Agreement, and that the Investment Manager would otherwise be able to provide services to the Funds of sufficient extent and quality.
Fee and Expense Information and Comparisons
In assessing the reasonableness of the Funds’ fees and expenses under the Agreement, the
Trustees considered, among other information, each Fund’s management fee and the Fund’s total expense ratio as a percentage of average daily net assets attributable to common shares and as a percentage of average managed assets (including assets attributable to common shares and leverage outstanding combined) and information regarding the management fees and other expenses of comparable funds identified by Broadridge (the “Broadridge Expense Group”). Where a Fund’s management fees or total expense ratios were higher than the Broadridge Expense Group median, the Trustees considered whether specific portfolio management, administration, or oversight needs contributed to the Fund’s management fees or total expense ratios. The Trustees also considered, among other items, current Fund asset levels as compared to prior years.
The Trustees noted that while the Funds are not charged a separate administration fee (recognizing that their management fee includes a component for administrative services), it was not clear in all cases whether the peer funds in the Broadridge categories were separately charged such a fee by their investment managers, so that the total expense ratio (rather than any individual expense component) represented the most relevant comparison. For each Fund, the Board also considered that only leveragedclosed-end funds were considered for inclusion in the Fund’s peer group for comparison. The Board considered each Fund’s contractual management fee on net assets attributable to common shares and on managed assets (generally consisting of net assets plus leverage proceeds), as well as the actual management fee on managed assets as a percentage of assets attributable to common shareholders as compared to each Fund’s peer group. The Board was aware of the additional expenses borne by common shareholders as a result of
| August 31, 2019 | | Semi-Annual Report | 73 |
Table of Contents
Matters Relating to the Trustees’ Consideration of the Investment Management Agreements(unaudited) (continued)
AllianzGI Convertible & Income 2024 Target Term Fund/AllianzGI Convertible & Income Fund/AllianzGI Convertible & Income Fund II
each Fund’s leveraged structure. The Trustees took into account that NCV and NCZ have preferred shares outstanding and CBH and NCV have short-term loans outstanding to provide leverage, which increase the amount of management fees payable by the Funds under the Agreements (because each Fund’s fees are calculated based on average daily managed assets, including assets attributed to preferred shares or other forms of leverage outstanding). The Board took into account that the Investment Manager has a financial incentive for each Fund to continue to use leverage, which may create a conflict of interest. It also considered the Investment Manager’s representation that the use of leverage continues to be appropriate and in the best interests of each Fund under current market conditions. The Trustees also considered the Investment Manager’s representation that it will use leverage for each Fund solely as it determines to be in the best interests of each Fund from an investment perspective and without regard to the level of compensation the Investment Manager receives.
To the extent applicable, the Trustees considered information regarding the investment performance and fees for other funds and/or separately managed accounts, including institutional accounts, managed by the Investment Manager or its affiliates with similar investment objective(s) and policies to those of the Funds, if any (“similar accounts”). Specifically, the Trustees reviewed information showing the contractual management fees charged by the Investment Manager to the similar accounts. In comparing these fees, the Trustees considered information provided by the Investment Manager as to the generally broader and more extensive services provided to the Funds in comparison to institutional or separate accounts; the greater entrepreneurial risk in managingclosed-end funds; and the impact on the Investment Manager and expenses associated with the more extensive
regulatory regime to which the Funds are subject in comparison to institutional or separate accounts. The Board considered that, in comparison to certain other products managed by the Investment Manager, includingopen-end funds, there are additional portfolio management challenges in managingclosed-end funds such as the Funds, including those associated with less liquid holdings and/or the use of leverage.
Economies of Scale and“Fall-Out” Benefits
The Trustees considered the extent to which the Investment Manager may realize economies of scale or other efficiencies in managing and supporting the Funds and noted that there is little expectation thatclosed-end funds will show significant economies of scale. The Trustees considered that, asclosed-end investment companies, the Funds do not continually offer new shares to raise additional assets (as does a typicalopen-end investment company), but may experience asset growth through investment performance and/or the increased use of leverage. Accordingly, the Trustees did not consider potential economies of scale as a principal factor in assessing the fee rates payable under the Agreements. Additionally, the Trustees consideredso-called“fall-out benefits” to the Investment Manager and its affiliates, such as reputational value derived from serving as Investment Manager to the Funds and research.
Profitability
The Trustees considered the overall estimated profitability to the Investment Manager on aFund-by-Fund basis for the twelve months ended December 31, 2018. They also reviewed the Investment Manager’s aggregate profitability with respect to the Fund complex and the Investment Manager’s overall profitability with respect to all products globally. As part of its considerations, the Board considered the cost allocation methodology that the Investment Manager used in developing its estimated
| 74 | Semi-Annual Report | | August 31, 2019 |
Table of Contents
Matters Relating to the Trustees’ Consideration of the Investment Management Agreements(unaudited) (continued)
AllianzGI Convertible & Income 2024 Target Term Fund/AllianzGI Convertible & Income Fund/AllianzGI Convertible & Income Fund II
profitability figures. In this connection, the Trustees considered that for certain Funds’ profitability had increased as a result of higher revenues from increased assets, although certain Funds’ assets had declined over the last year. The Trustees recognized that it is difficult to make comparisons of profitability from mutual fund advisory and administration contracts because comparative information is not generally available and is affected by numerous factors, including the structure of the particular adviser, the types of funds it manages, its business mix, numerous assumptions about allocations and the adviser’s capital structure and cost of capital. The Trustees recognized that the Investment Manager and its affiliates should be entitled to earn a reasonable level of profits for services they provide to each Fund and, based on their review, concluded thatpre-tax profitability for advisory services was not unreasonable, nor did it appear to be excessive.
Fund-by-Fund Analysis
With regard to the investment performance of each Fund and the fees charged to each Fund, the Trustees considered the following information. The comparative performance, fee, and expense information was prepared and provided by Broadridge and was not independently verified by the Trustees.
With respect to all Funds, the Trustees reviewed, among other information, comparative information showing the Funds’ performance against their respective Broadridge Performance Universes for theone-year, three-year, five-year andten-year periods (to the extent each such Fund had been in existence), each ended March 31, 2019. Fund performance relative to the median for each Fund’s Broadridge Performance Universe is described below, and for those Funds with performance that ranked below the median for their respective Broadridge Performance Universes, the specific quintile rankings are also noted below with respect to the relevant periods of
underperformance. With respect to performance quintile rankings for a Fund compared to its Broadridge Performance Universe, the first quintile represents the highest (best) performance and the fifth quintile represents the lowest performance.
The Trustees reviewed, among other information, information provided by Broadridge comparing each Fund’s management fee and ratios of total expenses to net assets to the Funds’ respective Broadridge Expense Groups for the most recently reported fiscal year. The Trustees noted that the Broadridge data takes into account any fee reductions or expense limitations that were in effect during a Fund’s last fiscal year. The information provided to the Trustees by Broadridge compared each Fund’s fees and expenses to the Fund’s respective Broadridge Expense Group median; such comparison is noted below. For the purposes of Broadridge Expense Group quintile rankings, higher fees and expenses result in a lower quintile ranking, with the first quintile corresponding to low fees and expenses the fifth quintile corresponding to high fees and expenses.
| ∎ | AllianzGI Convertible & Income Fund (NCV): As compared to its Broadridge Performance Universe (based on net asset value), the Fund’s performance was below the median for theone-, three-, and five-year periods (in the fifth quintile) and above the median for theten-year period (in the first quintile). As compared to its Broadridge Expense Group, the Fund’s management fees and total expense ratios based on common share and leveraged assets combined were both below the median (on a net basis). As compared to its Broadridge Expense Group, the Fund’s management fees based on common share assets were above the median and total expense ratios based on common share assets were below the median (on a net basis). |
| August 31, 2019 | | Semi-Annual Report | 75 |
Table of Contents
Matters Relating to the Trustees’ Consideration of the Investment Management Agreements(unaudited) (continued)
AllianzGI Convertible & Income 2024 Target Term Fund/AllianzGI Convertible & Income Fund/AllianzGI Convertible & Income Fund II
| ∎ | AllianzGI Convertible & Income Fund II (NCZ): As compared to its Broadridge Performance Universe (based on net asset value), the Fund’s performance was below the median for theone-, three-, and five-year periods (in the fifth quintile for theone-year period and the fourth quintile for the three- and five-year periods) and above the median for theten-year period (in the first quintile). As compared to its Broadridge Expense Group, the Fund’s management fees and total expense ratios based on common share and leveraged assets combined were both below the median (on a net basis). As compared to its Broadridge Expense Group, the Fund’s management fees based on common share assets were above the median and total expense ratios based on common share assets were below the median (on a net basis). |
| ∎ | AllianzGI Convertible & Income 2024 Target Term Fund (CBH): As compared to its Broadridge Performance Universe (based on net asset value), the Fund’s performance was below the median for theone-year period (in the fourth quintile). The Fund’s inception date was June 28, 2017, and does not accordingly have three-, five- andten-year performance periods reflected. As compared to its Broadridge Expense Group, the Fund’s management fees based on common share and leveraged assets combined were below the median and the Fund’s total expense ratios based on |
common share and leveraged assets combined were above the median (on a net basis). As compared to its Broadridge Expense Group, the Fund’s management fees based on common share assets were below the median and the Fund’s total expense ratios based on common share assets were above the median (on a net basis). |
Conclusions
After reviewing these and other factors described herein, the Trustees concluded, with respect to each Fund, within the context of their overall conclusions regarding the Agreement and in their business judgment, that they were satisfied with the Investment Manager’s responses andon-going efforts relating to the investment performance of the Funds, including efforts to improve performance for underperforming Funds. The Trustees also concluded that the fees payable under the Agreement represent reasonable compensation in light of the nature, extent and quality of services provided by the Investment Manager and should be continued. Based on their evaluation of factors that they deemed to be material, including, but not limited to, those factors described above, the Trustees unanimously concluded that the continuation of the Agreement with respect to the Funds was in the interests of the applicable Funds and their shareholders, and determined to approve the continuance of the Agreement.
| 76 | Semi-Annual Report | | August 31, 2019 |
Table of Contents
AllianzGI Convertible & Income 2024 Target Term Fund/AllianzGI Convertible & Income Fund/AllianzGI Convertible & Income Fund II
Please read this Policy carefully. It gives you important information about how Allianz Global Investors U.S. and its U.S. affiliates (“AllianzGI US,” “we” or “us”) handlenon-public personal information (“Personal Information”) that we may receive about you. It applies to all of our past, present and future clients and shareholders of AllianzGI US and the funds and accounts it manages, advises, administers or distributes, and will continue to apply when you are no longer a client or shareholder. As used throughout this Policy, “AllianzGI US” means Allianz Global Investors U.S. LLC, Allianz Global Investors Distributors LLC, and the family of registered and unregistered funds managed by one or more of these firms. AllianzGI US is part of a global investment management group, and the privacy policies of other Allianz Global Investors entities outside of the United States may have provisions in their policies that differ from this Privacy Policy. Please refer to the website of the specificnon-US Allianz Global Investors entity for its policy on privacy.
We Care about Your Privacy
We consider your privacy to be a fundamental aspect of our relationship with you, and we strive to maintain the confidentiality, integrity and security of your Personal Information. To ensure your privacy, we have developed policies that are designed to protect your Personal Information while allowing your needs to be served.
Information We May Collect
In the course of providing you with products and services, we may obtain Personal Information about you, which may come from sources such as account application and other forms, from other written, electronic, or verbal communications, from account transactions, from a brokerage or financial advisory firm, financial advisor or consultant, and/or from information you provide on our website.
You are not required to supply any of the Personal Information that we may request.
However, failure to do so may result in us being unable to open and maintain your account, or to provide services to you.
How Your Information Is Shared
We do not disclose your Personal Information to anyone for marketing purposes. We disclose your Personal Information only to those service providers, affiliated andnon-affiliated, who need the information for everyday business purposes, such as to respond to your inquiries, to perform services, and/or to service and maintain your account. This applies to all of the categories of Personal Information we collect about you. The affiliated andnon-affiliated service providers who receive your Personal Information also may use it to process your transactions, provide you with materials (including preparing and mailing prospectuses and shareholder reports and gathering shareholder proxies), and provide you with account statements and other materials relating to your account. These service providers provide services at our direction, and under their agreements with us, are required to keep your Personal Information confidential and to use it only for providing the contractually required services. Our service providers may not use your Personal Information to market products and services to you except in conformance with applicable laws and regulations. We also may provide your Personal Information to your respective brokerage or financial advisory firm, custodian, and/or to your financial advisor or consultant.
In addition, we reserve the right to disclose or report Personal Information tonon-affiliated third parties, in limited circumstances, where we believe in good faith that disclosure is required under law, to cooperate with regulators or law enforcement authorities or pursuant to other legal process, or to protect our rights or property, including to enforce our Privacy Policy or other agreements with you. Personal Information collected by us may also be transferred as part of a corporate sale, restructuring, bankruptcy, or other transfer of assets.
| August 31, 2019 | | Semi-Annual Report | 77 |
Table of Contents
Privacy Policy(unaudited)(continued)
AllianzGI Convertible & Income 2024 Target Term Fund/AllianzGI Convertible & Income Fund/AllianzGI Convertible & Income Fund II
Security of Your Information
We maintain your Personal Information for as long as necessary for legitimate business purposes or otherwise as required by law. In maintaining this information, we have implemented appropriate procedures that are designed to restrict access to your Personal Information only to those who need to know that information in order to provide products and/or services to you. In addition, we have implemented physical, electronic and procedural safeguards to help protect your Personal Information.
Privacy and the Internet
The Personal Information that you provide through our website, as applicable, is handled in the same way as the Personal Information that you provide by any other means, as described above. This section of the Policy gives you additional information about the way in which Personal Information that is obtained online is handled.
| ∎ | Online Enrollment, Account Access and Transactions: When you visit our website, you can visit pages that are open to the general public, or, where available, log into protected pages to enroll online, access information about your account, or conduct certain transactions. Access to the secure pages of our website is permitted only after you have created a User ID and Password. The User ID and Password must be supplied each time you want to access your account information online. This information serves to verify your identity. When you enter Personal Information into our website to enroll or access your account online, you will log into secure pages. By using our website, you consent to this Privacy Policy and to the use of your Personal Information in accordance with the practices described in this Policy. If you provide Personal Information to effect transactions, a record of the transactions you have performed while on the site is retained |
by us. For additional terms and conditions governing your use of our website, please refer to the Investor Mutual Fund Access – Disclaimer which is incorporated herein by reference and is available on our website. |
| ∎ | Cookies and Similar Technologies: Cookies are small text files stored in your computer’s hard drive when you visit certain web pages. Clear GIFs (also known as Web Beacons) are typically transparent very small graphic images (usually 1 pixel x 1 pixel) that are placed on a website that may be included on our services provided via our website and typically work in conjunction with cookies to identify our users and user behavior. We may use cookies and automatically collected information to: (i) personalize our website and the services provided via our website, such as remembering your information so that you will not have tore-enter it during your use of, or the next time you use, our website and the services provided via our website; (ii) provide customized advertisements, content, and information; (iii) monitor and analyze the effectiveness of our website and the services provided via our website and third-party marketing activities; (iv) monitor aggregate site usage metrics such as total number of visitors and pages viewed; and (v) track your entries, submissions, and status in any promotions or other activities offered through our website and the services provided via our website. Tracking technology also helps us manage and improve the usability of our website, (i) detecting whether there has been any contact between your computer and us in the past and (ii) to identify the most popular sections of our website. Because an industry-standardDo-Not-Track protocol is not yet established, our website will continue to operate as described in this Privacy Policy and will not be affected by anyDo-Not-Track signals from any browser. |
| 78 | Semi-Annual Report | | August 31, 2019 |
Table of Contents
Privacy Policy(unaudited)(continued)
AllianzGI Convertible & Income 2024 Target Term Fund/AllianzGI Convertible & Income Fund/AllianzGI Convertible & Income Fund II
| ∎ | Use of Social Media Plugins Our website uses the following Social Media Plugins (“Plugins”): |
| ∎ | Facebook Share Button operated by Facebook Inc., 1601 S. California Ave, Palo Alto, CA 94304, USA |
| ∎ | Tweet Button operated by Twitter Inc., 795 Folsom St., Suite 600, San Francisco, CA 94107, USA |
| ∎ | LinkedIn Share Button operated by LinkedIn Corporation, 2029 Stierlin Court, Mountain View, CA 94043, USA |
All Plugins are marked with the brand of the respective operators Facebook, Twitter and LinkedIn (“Operators”). When you visit our website that contains a social plugin, your browser establishes a direct connection to the servers of the Operator. The Operator directly transfers the plugin content to your browser which embeds the latter into our website, enabling the Operator to receive information about you having accessed the respective page of our website. Thus, AllianzGI US has no influence on the data gathered by the plugin and we inform you according to our state of knowledge: The embedded plugins provide the Operator with the information that you have accessed the corresponding page of our website. If you do not wish to have such data transferred to the Operators, you need to log out of your respective account before visiting
our website. Please see the Operators’ data privacy statements in order to get further information about purpose and scope of the data collection and the processing and use:
| ∎ | Facebook: https://de-de.facebook.com/about/privacy |
| ∎ | Twitter: https://twitter.com/privacy |
| ∎ | Linked In: https://www.linkedin.com/legal/privacy-policy |
Changes to Our Privacy Policy
We may modify this Privacy Policy fromtime-to-time to reflect changes in related practices and procedures, or applicable laws and regulations. If we make changes, we will notify you on our website and the revised Policy will become effective immediately upon posting to our website. We also will provide account owners with a copy of our Privacy Policy, annually if required. We encourage you to visit our website periodically to remain up to date on our Privacy Policy. You acknowledge that by using our website after we have posted changes to this Privacy Policy, you are agreeing to the terms of the Privacy Policy as modified.
Obtaining Additional Information
If you have any questions about this Privacy Policy or our privacy related practices in the United States, you may contact us via our dedicated email at PrivacyUS@allianzgi.com.
| August 31, 2019 | | Semi-Annual Report | 79 |
Table of Contents
Trustees
Alan Rappaport
Chairman of the Board of Trustees
Sarah E. Cogan
Deborah A. DeCotis
F. Ford Drummond
Thomas J. Fuccillo
Bradford K. Gallagher
Erick R. Holt
James A. Jacobson
Hans W. Kertess
James S. MacLeod
William B. Ogden, IV
Davey S. Scoon
Fund Officers
Thomas J. Fuccillo
President and Chief Executive Officer
Scott Whisten
Treasurer, Principal Financial & Accounting Officer
Angela Borreggine
Chief Legal Officer & Secretary
Thomas L. Harter
Chief Compliance Officer
Richard J. Cochran
Assistant Treasurer
Orhan Dzemaili
Assistant Treasurer
Debra Rubano
Assistant Secretary
Craig A. Ruckman
Assistant Secretary
Investment Manager
Allianz Global Investors U.S. LLC
1633 Broadway
New York, NY 10019
Custodian & Accounting Agent
State Street Bank and Trust Co.
801 Pennsylvania Avenue
Kansas City, MO 64105
Transfer Agent, Dividend Paying Agent and Registrar
American Stock Transfer & Trust Company, LLC
6201 15th Avenue
Brooklyn, NY 11219
Independent Registered Public Accounting Firm
PricewaterhouseCoopers LLP
300 Madison Avenue
New York, NY 10017
Legal Counsel
Ropes & Gray LLP
Prudential Tower
800 Boylston Street
Boston, MA 02199
This report, including the financial information herein, is transmitted to the shareholders of AllianzGI Convertible & Income 2024 Target Term, AllianzGI Convertible & Income and AllianzGI Convertible & Income II, for their information. It is not a prospectus, circular or representation intended for use in the purchase of shares of the Funds or any securities mentioned in this report.
The financial information included herein is taken from the records of the Funds without examination by an independent registered public accounting firm, who did not express an opinion herein.
Notice is hereby given in accordance with Section 23(c) of the Investment Company Act of 1940, as amended, that from time to time the Funds may purchase shares of their stock in the open market.
The Funds file their complete schedule of portfolio holdings with the Securities and Exchange Commission (“SEC”) for the first and third quarters of their fiscal year on FormN-PORT. Each Fund’s FormN-PORT is available on the SEC’s website at www.sec.gov. The information on FormN-PORT is also available on the Funds’ website at us.allianzgi.com/closedendfunds.
Information on the Funds is available at us.allianzgi.com/closedendfunds or by calling the Funds’ shareholder servicing agent at (800)254-5197.
Table of Contents
Receive this report electronically and eliminate paper mailings.
To enroll, visit us.allianzgi.com/edelivery.
| Allianz Global Investors Distributors LLC | AZ603SA_083119 |
937223
Table of Contents
Item 2. Code of Ethics.
Not required in this filing.
Item 3. Audit Committee Financial Expert.
Not required in this filing.
Item 4. Principal Accountant Fees and Services.
Not required in this filing
Item 5. Audit Committee of Listed Registrants
Not required in this filing
Item 6. Investments.
(a) The registrant’s Schedule of Investments is included as part of the report to shareholders filed under Item 1 of this form.
(b) Not applicable.
Item 7. Disclosure of Proxy Voting Policies and Procedures forClosed-End Management Investment Purchasers.
Not required in this filing
Item 8. Portfolio Managers ofClosed-End Management Investment Companies.
Not required in this filing
Item 9. Purchases of Equity Securities byClosed-End Management Investment Company and Affiliated Purchasers.
None
Item 10. Submission of Matters to a Vote of Security Holders.
There have been no material changes to the procedures by which shareholders may recommend nominees to the Fund’s Board of Trustees since the Fund last provided disclosure in response to this item.
Item 11. Controls and Procedures.
(a) The registrant’s President and Chief Executive Officer and Treasurer, Principal Financial & Accounting Officer have concluded that the registrant’s disclosure controls and procedures (as defined in Rule30a-3(c) under the Act (17 CFR270.30a-3(c))) are effective based on their evaluation of these controls and procedures as of a date within 90 days of the filing date of this document.
(b) There were no changes in the registrant’s internal control over financial reporting (as defined in Rule30a-3(d) under the 1940 Act (17 CFR270.30a-3(d))) that occurred during the most recent semi-annual period covered by this report that has materially affected, or is reasonably likely to materially affect, the registrant’s internal control over financial reporting.
ITEM 12. Disclosure of Securities Lending Activities forClosed-End Management Investment Companies.
The registrant does not maintain a securities lending program and does not receive income, fees or other compensation that would be reportable under this Item. However, the registrant maintains a liquidity facility with State Street Bank and Trust Company (“State Street”) that permits draw-downs to be funded through securities lending and reverse repurchase transactions administered by State Street. The registrant believes that this arrangement permits State Street to provide financing on more favorable economic terms than would otherwise apply.
Item 13. Exhibits.
(a) (1) Not required in this filing.
(a) (2) Exhibit 99_ Cert. — Certification pursuant to Section 302 of the Sarbanes-Oxley Act of 2002.
(a) (3) Not applicable.
(a) (4) Not applicable.
(b) Exhibit 99.906 Cert. — Certification pursuant to Section 906 of the Sarbanes-Oxley Act of 2002.
Table of Contents
Signature
Pursuant to the requirements of the Securities Exchange Act of 1934 and the Investment Company Act of 1940, the registrant has duly caused this report to be signed on its behalf by the undersigned, thereunto duly authorized.
| Registrant: AllianzGI Convertible & Income Fund II | ||
| By: | /s/ Thomas J. Fuccillo | |
| Thomas J. Fuccillo | ||
| President & Chief Executive Officer | ||
| Date: October 31, 2019 | ||
| By: | /s/ Scott Whisten | |
| Scott Whisten | ||
| Treasurer, Principal Financial & Accounting Officer | ||
| Date: October 31, 2019 | ||
Pursuant to the requirements of the Securities Exchange Act of 1934 and the Investment Company Act of 1940, this report has been signed below by the following persons on behalf of the registrant and in the capacities and on the dates indicated.
| By: | /s/ Thomas J. Fuccillo | |
| Thomas J. Fuccillo | ||
| President & Chief Executive Officer | ||
| Date: October 31, 2019 | ||
| By: | /s/ Scott Whisten | |
| Scott Whisten | ||
| Treasurer, Principal Financial & Accounting Officer | ||
| Date: October 31, 2019 | ||