UNITED STATES
SECURITIES AND EXCHANGE COMMISSION
Washington, D.C. 20549
FORM N-CSR
CERTIFIED SHAREHOLDER REPORT OF REGISTERED
MANAGEMENT INVESTMENT COMPANIES
Investment Company Act file number 811-21343
Western Asset Emerging Markets Debt Fund Inc.
(Exact name of registrant as specified in charter)
620 Eighth Avenue, 49th Floor, New York, NY 10018
(Address of principal executive offices) (Zip code)
Robert I. Frenkel, Esq.
Legg Mason & Co., LLC
100 First Stamford Place
Stamford, CT 06902
(Name and address of agent for service)
Registrant’s telephone number, including area code: (888) 777-0102
Date of fiscal year end: December 31
Date of reporting period: June 30, 2020
| ITEM 1. | REPORT TO STOCKHOLDERS. |
The Semi-Annual Report to Stockholders is filed herewith.

| | |
| Semi-Annual Report | | June 30, 2020 |
WESTERN ASSET
EMERGING MARKETS
DEBT FUND INC. (EMD)
Beginning in January 2021, as permitted by regulations adopted by the Securities and Exchange Commission, the Fund intends to no longer mail paper copies of the Fund’s shareholder reports like this one, unless you specifically request paper copies of the reports from the Fund or from your financial intermediary (such as a broker-dealer or bank). Instead, the reports will be made available on a website, and you will be notified by mail each time a report is posted and provided with a website link to access the report.
If you invest through a financial intermediary and you already elected to receive shareholder reports electronically (“e-delivery”), you will not be affected by this change and you need not take any action. If you have not already elected e-delivery, you may elect to receive shareholder reports and other communications from the Fund electronically by contacting your financial intermediary.
You may elect to receive all future reports in paper free of charge. If you invest through a financial intermediary, you can contact your financial intermediary to request that you continue to receive paper copies of your shareholder reports. That election will apply to all Legg Mason Funds held in your account at that financial intermediary. If you are a direct shareholder with the Fund, you can call the Fund at 1-888-888-0151, or write to the Fund by regular mail at P.O. Box 505000, Louisville, KY 40233 or by overnight delivery to Computershare, 462 South 4th Street, Suite 1600, Louisville, KY 40202 to let the Fund know you wish to continue receiving paper copies of your shareholder reports. That election will apply to all Legg Mason Funds held in your account held directly with the fund complex.

|
| INVESTMENT PRODUCTS: NOT FDIC INSURED • NO BANK GUARANTEE • MAY LOSE VALUE |
Fund objectives
The Fund’s primary investment objective is to seek high current income. As a secondary objective, the Fund seeks capital appreciation.
The Fund invests primarily in U.S. dollar and non-U.S. dollar denominated debt securities of issuers in emerging market countries.
Letter from the chairman

Dear Shareholder,
We are pleased to provide the semi-annual report of Western Asset Emerging Markets Debt Fund Inc. for the six-month reporting period ended June 30, 2020. Please read on for Fund performance information during the Fund’s reporting period.
Special shareholder notice
On July 31, 2020, Franklin Resources, Inc. (“Franklin Resources”) acquired Legg Mason, Inc. in an all-cash transaction. As a result of the transaction, Legg Mason Partners Fund Advisor, LLC (“LMPFA”), Western Asset Management Company, LLC, Western Asset Management Company Limited and Western Asset Management Company Pte. Ltd. became indirect, wholly-owned subsidiaries of Franklin Resources. Under the Investment Company Act of 1940, consummation of the transaction automatically terminated the management and subadvisory agreements that were in place for the Fund prior to the transaction. The Fund’s manager and subadvisers continue to provide uninterrupted services with respect to the Fund pursuant to new management and subadvisory agreements that were approved by Fund stockholders.
Franklin Resources, whose principal executive offices are at One Franklin Parkway, San Mateo, California 94403, is a global investment management organization operating, together with its subsidiaries, as Franklin Templeton. As of June 30, 2020, after giving effect to the transaction described above, Franklin Templeton’s asset management operations had aggregate assets under management of approximately $1.4 trillion.
| | |
| II | | Western Asset Emerging Markets Debt Fund Inc. |
As always, we remain committed to providing you with excellent service and a full spectrum of investment choices. We also remain committed to supplementing the support you receive from your financial advisor. One way we accomplish this is through our website, www.lmcef.com. Here you can gain immediate access to market and investment information, including:
| • | | Fund prices and performance, |
| • | | Market insights and commentaries from our portfolio managers, and |
| • | | A host of educational resources. |
We look forward to helping you meet your financial goals.
Sincerely,

Jane Trust, CFA
Chairman, President and Chief Executive Officer
July 31, 2020
| | |
| Western Asset Emerging Markets Debt Fund Inc. | | III |
Performance review
For the six months ended June 30, 2020, Western Asset Emerging Markets Debt Fund Inc. returned -5.17% based on its net asset value (“NAV”)i and - 9.41% based on its New York Stock Exchange (“NYSE”) market price per share. The Fund’s unmanaged benchmark, the JPMorgan Emerging Markets Bond Index Global Diversified (EMBI Global Diversified)ii, returned -2.76% for the same period. The Lipper Emerging Markets Hard Currency Debt Closed-End Funds Category Averageiii returned -10.71% over the same time frame. Please note that Lipper performance returns are based on each fund’s NAV.
During this six-month period, the Fund made distributions to shareholders totaling $0.60 per share. As of June 30, 2020, the Fund estimates that 51% of the distributions were sourced from net investment income and 49% constituted a return of capital.* The performance table shows the Fund’s six-month total return based on its NAV and market price as of June 30, 2020. Past performance is no guarantee of future results.
| | | | |
Performance Snapshot as of June 30, 2020
(unaudited) | |
| Price Per Share | | 6-Month
Total Return** | |
| $14.32 (NAV) | | | -5.17 | %† |
| $12.32 (Market Price) | | | -9.41 | %‡ |
All figures represent past performance and are not a guarantee of future results. Performance figures for periods shorter than one year represent cumulative figures and are not annualized.
** Total returns are based on changes in NAV or market price, respectively. Returns reflect the deduction of all Fund expenses, including management fees, operating expenses, and other Fund expenses. Returns do not reflect the deduction of brokerage commissions or taxes that investors may pay on distributions or the sale of shares.
† Total return assumes the reinvestment of all distributions, including returns of capital, if any, at NAV.
‡ Total return assumes the reinvestment of all distributions, including returns of capital, if any, in additional shares in accordance with the Fund’s Dividend Reinvestment Plan.
Looking for additional information?
The Fund is traded under the symbol “EMD” and its closing market price is available in most newspapers under the NYSE listings. The daily NAV is available online under the symbol “XEMDX” on most financial websites. Barron’s and The Wall Street Journal’s Monday edition both carry closed-end fund tables that provide additional information. In addition, the Fund issues a quarterly press release that can be found on most major financial websites as well as www.lmcef.com (click on the name of the Fund).
| * | These estimates are not for tax purposes. The Fund will issue a Form 1099 with final composition of the distributions for tax purposes after year-end. A return of capital is not taxable and results in a reduction in the tax basis of a shareholder’s investment. For more information about a distribution’s composition, please refer to the Fund’s distribution press release or, if applicable, the Section 19 notice located in the press release section of our website, www.lmcef.com (click on the name of the Fund). |
| | |
| IV | | Western Asset Emerging Markets Debt Fund Inc. |
In a continuing effort to provide information concerning the Fund, shareholders may call 1-888-777-0102 (toll free), Monday through Friday from 8:00 a.m. to 5:30 p.m. Eastern Time, for the Fund’s current NAV, market price and other information.
Thank you for your investment in Western Asset Emerging Markets Debt Fund Inc. As always, we appreciate that you have chosen us to manage your assets and we remain focused on achieving the Fund’s investment goals.
Sincerely,
Jane Trust, CFA
Chairman, President and Chief Executive Officer
July 31, 2020
RISKS: The Fund is a non-diversified, closed-end management investment company designed primarily as a long-term investment and not as a trading vehicle. The Fund is not intended to be a complete investment program and, due to the uncertainty inherent in all investments, there can be no assurance that the Fund will achieve its investment objective. The Fund’s common stock is traded on the New York Stock Exchange. Similar to stocks, the Fund’s share price will fluctuate with market conditions and, at the time of sale, may be worth more or less than the original investment. Shares of closed-end funds often trade at a discount to their net asset value. Because the Fund is non-diversified, it may be more susceptible to economic, political, or regulatory events than a diversified fund. The Fund’s investments are subject to a number of risks, including credit risk, inflation risk and interest rate risk. As interest rates rise, bond prices fall, reducing the value of the Fund’s fixed income holdings. Investing in foreign securities is subject to certain risks not associated with domestic investing, such as currency fluctuations, and social, political, and economic uncertainties which could result in significant volatility. These risks are magnified in emerging or developing markets. Emerging market countries tend to have economic, political, and legal systems that are less developed and are less stable than those of more developed countries. High-yield bonds (commonly known as “junk bonds”) involve greater credit and liquidity risks than investment grade bonds. The Fund may make significant investments in derivative instruments, such as options and futures, which can be illiquid, may disproportionately increase losses, and have a potentially large impact on Fund performance. Leverage may result in greater volatility of NAV and the market price of common shares and increases a shareholder’s risk of loss. The Fund may also invest in money market funds, including funds affiliated with the Fund’s manager and subadvisers.
All investments are subject to risk including the possible loss of principal. Past performance is no guarantee of future results. All index performance reflects no deduction for fees, expenses, or taxes. Please note that an investor cannot invest directly in an index.
| | |
| Western Asset Emerging Markets Debt Fund Inc. | | V |
Performance review (cont’d)
| i | Net asset value (“NAV”) is calculated by subtracting total liabilities, including liabilities associated with financial leverage (if any), from the closing value of all securities held by the Fund (plus all other assets) and dividing the result (total net assets) by the total number of the common shares outstanding. The NAV fluctuates with changes in the market prices of securities in which the Fund has invested. However, the price at which an investor may buy or sell shares of the Fund is the Fund’s market price as determined by supply of and demand for the Fund’s shares. |
| ii | The JPMorgan Emerging Markets Bond Index Global Diversified (“EMBI Global Diversified”) is an unmanaged, market-capitalization weighted, total-return index tracking the traded market for U.S.-dollar-denominated Brady bonds, Eurobonds, traded loans, and local market debt instruments issued by sovereign and quasi-sovereign entities. |
| iii | Lipper, Inc., a wholly-owned subsidiary of Reuters, provides independent insight on global collective investments. Returns are based on the six-month period ended June 30, 2020, including the reinvestment of all distributions, including returns of capital, if any, calculated among the 7 funds in the Fund’s Lipper category. |
| | |
| VI | | Western Asset Emerging Markets Debt Fund Inc. |
Fund at a glance† (unaudited)
Investment breakdown (%) as a percent of total investments
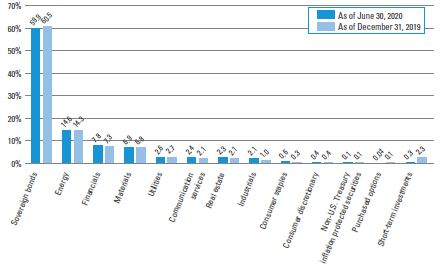
| † | The bar graph above represents the composition of the Fund’s investments as of June 30, 2020 and December 31, 2019 and does not include derivatives such as written options, futures contracts, forward foreign currency contracts and swap contracts. The Fund is actively managed. As a result, the composition of the Fund’s investments is subject to change at anytime. |
| ‡ | Amount represents less than 0.1%. |
| | |
| Western Asset Emerging Markets Debt Fund Inc. 2020 Semi-Annual Report | | 1 |
Schedule of investments (unaudited)
June 30, 2020
Western Asset Emerging Markets Debt Fund Inc.
| | | | | | | | | | | | | | | | |
| Security | | Rate | | | Maturity
Date | | | Face
Amount† | | | Value | |
| Sovereign Bonds — 83.7% | | | | | | | | | | | | | | | | |
Angola — 1.0% | | | | | | | | | | | | | | | | |
Angolan Government International Bond, Senior Notes | | | 8.250 | % | | | 5/9/28 | | | | 4,650,000 | | | $ | 3,849,256 | (a) |
Angolan Government International Bond, Senior Notes | | | 9.125 | % | | | 11/26/49 | | | | 6,000,000 | | | | 4,890,000 | (a) |
Total Angola | | | | | | | | | | | | | | | 8,739,256 | |
Argentina — 3.0% | | | | | | | | | | | | | | | | |
Argentina Bonar Bonds (Argentina BADLAR Private Deposit Rate + 2.000%) | | | 26.415 | % | | | 4/3/22 | | | | 18,500,000 | ARS | | | 166,733 | (b)(c) |
Argentine Bonos del Tesoro, Bonds | | | 18.200 | % | | | 10/3/21 | | | | 3,040,000 | ARS | | | 21,991 | (b) |
Argentine Bonos del Tesoro, Bonds | | | 16.000 | % | | | 10/17/23 | | | | 160,000,000 | ARS | | | 815,574 | (b) |
Argentine Bonos del Tesoro, Bonds | | | 15.500 | % | | | 10/17/26 | | | | 157,160,000 | ARS | | | 570,386 | (b) |
Argentine Republic Government International Bond, Senior Notes | | | 4.625 | % | | | 1/11/23 | | | | 22,810,000 | | | | 9,549,521 | *(d)(e) |
Argentine Republic Government International Bond, Senior Notes | | | 5.875 | % | | | 1/11/28 | | | | 9,600,000 | | | | 3,845,376 | *(d)(e) |
Provincia de Buenos Aires, Senior Notes | | | 10.875 | % | | | 1/26/21 | | | | 490,098 | | | | 235,252 | *(a)(d) |
Provincia de Buenos Aires, Senior Notes | | | 9.950 | % | | | 6/9/21 | | | | 3,400,000 | | | | 1,436,534 | *(a)(d) |
Provincia de Buenos Aires, Senior Notes | | | 6.500 | % | | | 2/15/23 | | | | 3,920,000 | | | | 1,666,039 | *(d)(f) |
Provincia de Buenos Aires, Senior Notes | | | 9.125 | % | | | 3/16/24 | | | | 3,500,000 | | | | 1,478,785 | *(d)(f) |
Provincia de Buenos Aires, Senior Notes | | | 9.125 | % | | | 3/16/24 | | | | 3,350,000 | | | | 1,415,409 | *(a)(d) |
Provincia de Cordoba, Senior Notes | | | 7.125 | % | | | 6/10/21 | | | | 500,000 | | | | 312,505 | (f) |
Provincia de Cordoba, Senior Notes | | | 7.450 | % | | | 9/1/24 | | | | 8,250,000 | | | | 4,908,750 | (e)(f) |
Total Argentina | | | | | | | | | | | | | | | 26,422,855 | |
Armenia — 0.9% | | | | | | | | | | | | | | | | |
Republic of Armenia International Bond, Senior Notes | | | 3.950 | % | | | 9/26/29 | | | | 7,700,000 | | | | 7,468,461 | (f) |
Bahrain — 1.5% | | | | | | | | | | | | | | | | |
Bahrain Government International Bond, Senior Notes | | | 6.750 | % | | | 9/20/29 | | | | 4,100,000 | | | | 4,502,005 | (a) |
Bahrain Government International Bond, Senior Notes | | | 6.000 | % | | | 9/19/44 | | | | 8,400,000 | | | | 8,334,270 | (f) |
Total Bahrain | | | | | | | | | | | | | | | 12,836,275 | |
See Notes to Financial Statements.
| | |
| 2 | | Western Asset Emerging Markets Debt Fund Inc. 2020 Semi-Annual Report |
Western Asset Emerging Markets Debt Fund Inc.
| | | | | | | | | | | | | | | | |
| Security | | Rate | | | Maturity
Date | | | Face
Amount† | | | Value | |
Belarus — 0.2% | | | | | | | | | | | | | | | | |
Republic of Belarus Ministry of Finance, Senior Notes | | | 5.875 | % | | | 2/24/26 | | | | 2,200,000 | | | $ | 2,137,630 | (f) |
Brazil — 2.0% | | | | | | | | | | | | | | | | |
Brazil Letras do Tesouro Nacional | | | 0.000 | % | | | 1/1/24 | | | | 10,173,000 | BRL | | | 1,572,754 | |
Brazil Notas do Tesouro Nacional Serie F, Notes | | | 10.000 | % | | | 1/1/23 | | | | 59,682,000 | BRL | | | 12,473,019 | |
Brazilian Government International Bond, Senior Notes | | | 2.875 | % | | | 6/6/25 | | | | 3,600,000 | | | | 3,559,500 | |
Total Brazil | | | | | | | | | | | | | | | 17,605,273 | |
Colombia — 2.9% | | | | | | | | | | | | | | | | |
Colombia Government International Bond, Senior Notes | | | 7.375 | % | | | 9/18/37 | | | | 16,567,000 | | | | 22,779,625 | (e) |
Colombia Government International Bond, Senior Notes | | | 6.125 | % | | | 1/18/41 | | | | 2,080,000 | | | | 2,607,280 | (e) |
Total Colombia | | | | | | | | | | | | | | | 25,386,905 | |
Costa Rica — 0.8% | | | | | | | | | | | | | | | | |
Banco Nacional de Costa Rica | | | 6.250 | % | | | 11/1/23 | | | | 2,220,000 | | | | 2,183,714 | (f) |
Costa Rica Government International Bond, Senior Notes | | | 6.125 | % | | | 2/19/31 | | | | 1,950,000 | | | | 1,691,138 | (f) |
Costa Rica Government International Bond, Senior Notes | | | 7.158 | % | | | 3/12/45 | | | | 4,200,000 | | | | 3,522,750 | (e)(f) |
Total Costa Rica | | | | | | | | | | | | | | | 7,397,602 | |
Croatia — 0.7% | | | | | | | | | | | | | | | | |
Croatia Government International Bond, Senior Notes | | | 5.500 | % | | | 4/4/23 | | | | 5,640,000 | | | | 6,222,104 | (a) |
Dominican Republic — 2.7% | | | | | | | | | | | | | | | | |
Dominican Republic International Bond, Senior Notes | | | 5.500 | % | | | 1/27/25 | | | | 8,210,000 | | | | 8,334,340 | (e)(f) |
Dominican Republic International Bond, Senior Notes | | | 6.000 | % | | | 7/19/28 | | | | 7,300,000 | | | | 7,369,788 | (f) |
Dominican Republic International Bond, Senior Notes | | | 6.850 | % | | | 1/27/45 | | | | 4,200,000 | | | | 4,046,700 | (e)(f) |
Dominican Republic International Bond, Senior Notes | | | 5.875 | % | | | 1/30/60 | | | | 3,950,000 | | | | 3,410,825 | (f) |
Total Dominican Republic | | | | | | | | | | | | | | | 23,161,653 | |
Ecuador — 1.1% | | | | | | | | | | | | | | | | |
Ecuador Government International Bond, Senior Notes | | | 7.875 | % | | | 3/27/25 | | | | 2,400,000 | | | | 1,074,000 | *(d)(f) |
See Notes to Financial Statements.
| | |
| Western Asset Emerging Markets Debt Fund Inc. 2020 Semi-Annual Report | | 3 |
Schedule of investments (unaudited) (cont’d)
June 30, 2020
Western Asset Emerging Markets Debt Fund Inc.
| | | | | | | | | | | | | | | | |
| Security | | Rate | | | Maturity
Date | | | Face
Amount† | | | Value | |
Ecuador — continued | | | | | | | | | | | | | | | | |
Ecuador Government International Bond, Senior Notes | | | 9.650 | % | | | 12/13/26 | | | | 2,540,000 | | | $ | 1,101,725 | *(a)(d) |
Ecuador Government International Bond, Senior Notes | | | 7.775 | % | | | 1/23/28 | | | | 17,520,000 | | | | 7,270,975 | *(d)(f) |
Total Ecuador | | | | | | | | | | | | | | | 9,446,700 | |
Egypt — 3.6% | | | | | | | | | | | | | | | | |
Egypt Government International Bond, Senior Notes | | | 6.125 | % | | | 1/31/22 | | | | 3,430,000 | | | | 3,525,028 | (f) |
Egypt Government International Bond, Senior Notes | | | 7.625 | % | | | 5/29/32 | | | | 5,800,000 | | | | 5,675,822 | (f) |
Egypt Government International Bond, Senior Notes | | | 8.500 | % | | | 1/31/47 | | | | 1,100,000 | | | | 1,079,513 | (f) |
Egypt Government International Bond, Senior Notes | | | 8.700 | % | | | 3/1/49 | | | | 14,270,000 | | | | 14,047,602 | (f) |
Egypt Government International Bond, Senior Notes | | | 8.875 | % | | | 5/29/50 | | | | 6,700,000 | | | | 6,638,561 | (f) |
Total Egypt | | | | | | | | | | | | | | | 30,966,526 | |
El Salvador — 0.9% | | | | | | | | | | | | | | | | |
El Salvador Government International Bond, Senior Notes | | | 6.375 | % | | | 1/18/27 | | | | 6,380,000 | | | | 5,502,814 | (e)(f) |
El Salvador Government International Bond, Senior Notes | | | 7.125 | % | | | 1/20/50 | | | | 3,200,000 | | | | 2,619,200 | (f) |
Total El Salvador | | | | | | | | | | | | | | | 8,122,014 | |
Ethiopia — 0.3% | | | | | | | | | | | | | | | | |
Ethiopia International Bond, Senior Notes | | | 6.625 | % | | | 12/11/24 | | | | 2,500,000 | | | | 2,511,193 | (a) |
Georgia — 0.3% | | | | | | | | | | | | | | | | |
Georgia Government International Bond | | | 6.875 | % | | | 4/12/21 | | | | 2,360,000 | | | | 2,414,322 | (a) |
Ghana — 2.3% | | | | | | | | | | | | | | | | |
Ghana Government International Bond | | | 10.750 | % | | | 10/14/30 | | | | 9,400,000 | | | | 11,330,666 | (e)(f) |
Ghana Government International Bond, Senior Notes | | | 7.875 | % | | | 8/7/23 | | | | 2,323,700 | | | | 2,445,513 | (a) |
Ghana Government International Bond, Senior Notes | | | 8.125 | % | | | 1/18/26 | | | | 1,620,000 | | | | 1,648,512 | (e)(f) |
Ghana Government International Bond, Senior Notes | | | 7.875 | % | | | 2/11/35 | | | | 5,000,000 | | | | 4,550,000 | (f) |
Total Ghana | | | | | | | | | | | | | | | 19,974,691 | |
See Notes to Financial Statements.
| | |
| 4 | | Western Asset Emerging Markets Debt Fund Inc. 2020 Semi-Annual Report |
Western Asset Emerging Markets Debt Fund Inc.
| | | | | | | | | | | | | | | | |
| Security | | Rate | | | Maturity
Date | | | Face Amount† | | | Value | |
Guatemala — 1.1% | | | | | | | | | | | | | | | | |
Guatemala Government Bond, Senior Notes | | | 5.375 | % | | | 4/24/32 | | | | 8,450,000 | | | $ | 9,358,375 | (f) |
Honduras — 0.5% | | | | | | | | | | | | | | | | |
Honduras Government International Bond, Senior Notes | | | 7.500 | % | | | 3/15/24 | | | | 960,000 | | | | 1,040,789 | (a) |
Honduras Government International Bond, Senior Notes | | | 6.250 | % | | | 1/19/27 | | | | 3,500,000 | | | | 3,743,250 | (f) |
Total Honduras | | | | | | | | | | | | | | | 4,784,039 | |
Hungary — 1.6% | | | | | | | | | | | | | | | | |
Hungary Government International Bond, Senior Notes | | | 5.750 | % | | | 11/22/23 | | | | 12,608,000 | | | | 14,355,595 | |
Indonesia — 6.9% | | | | | | | | | | | | | | | | |
Indonesia Government International Bond, Senior Notes | | | 5.875 | % | | | 1/15/24 | | | | 7,049,000 | | | | 8,010,005 | (e)(f) |
Indonesia Government International Bond, Senior Notes | | | 6.625 | % | | | 2/17/37 | | | | 3,210,000 | | | | 4,403,052 | (a)(e) |
Indonesia Government International Bond, Senior Notes | | | 5.250 | % | | | 1/17/42 | | | | 20,750,000 | | | | 25,735,790 | (e)(f)(g) |
Indonesia Government International Bond, Senior Notes | | | 4.750 | % | | | 7/18/47 | | | | 1,920,000 | | | | 2,262,127 | (e)(f) |
Indonesia Treasury Bond, Senior Notes | | | 8.375 | % | | | 9/15/26 | | | | 131,422,000,000 | IDR | | | 9,940,600 | |
Indonesia Treasury Bond, Senior Notes | | | 8.375 | % | | | 3/15/34 | | | | 126,438,000,000 | IDR | | | 9,338,798 | |
Total Indonesia | | | | | | | | | | | | | | | 59,690,372 | |
Israel — 0.5% | | | | | | | | | | | | | | | | |
Israel Government International Bond, Senior Notes | | | 3.875 | % | | | 7/3/50 | | | | 3,500,000 | | | | 4,169,760 | |
Ivory Coast — 0.9% | | | | | | | | | | | | | | | | |
Ivory Coast Government International Bond, Senior Notes | | | 5.375 | % | | | 7/23/24 | | | | 1,350,000 | | | | 1,359,600 | (f) |
Ivory Coast Government International Bond, Senior Notes | | | 6.375 | % | | | 3/3/28 | | | | 2,680,000 | | | | 2,747,643 | (e)(f) |
Ivory Coast Government International Bond, Senior Notes | | | 6.125 | % | | | 6/15/33 | | | | 3,540,000 | | | | 3,541,628 | (f) |
Total Ivory Coast | | | | | | | | | | | | | | | 7,648,871 | |
Jamaica — 1.3% | | | | | | | | | | | | | | | | |
Jamaica Government International Bond, Senior Notes | | | 6.750 | % | | | 4/28/28 | | | | 3,390,000 | | | | 3,820,767 | (e) |
See Notes to Financial Statements.
| | |
| Western Asset Emerging Markets Debt Fund Inc. 2020 Semi-Annual Report | | 5 |
Schedule of investments (unaudited) (cont’d)
June 30, 2020
Western Asset Emerging Markets Debt Fund Inc.
| | | | | | | | | | | | | | | | |
| Security | | Rate | | | Maturity
Date | | | Face
Amount† | | | Value | |
Jamaica — continued | | | | | | | | | | | | | | | | |
Jamaica Government International Bond, Senior Notes | | | 8.000 | % | | | 3/15/39 | | | | 1,760,000 | | | $ | 2,178,880 | (e) |
Jamaica Government International Bond, Senior Notes | | | 7.875 | % | | | 7/28/45 | | | | 4,700,000 | | | | 5,764,550 | |
Total Jamaica | | | | | | | | | | | | | | | 11,764,197 | |
Jordan — 0.9% | | | | | | | | | | | | | | | | |
Jordan Government International Bond, Senior Notes | | | 6.125 | % | | | 1/29/26 | | | | 440,000 | | | | 464,781 | (f) |
Jordan Government International Bond, Senior Notes | | | 7.375 | % | | | 10/10/47 | | | | 2,000,000 | | | | 2,061,700 | (a) |
Jordan Government International Bond, Senior Notes | | | 7.375 | % | | | 10/10/47 | | | | 5,020,000 | | | | 5,174,867 | (f) |
Total Jordan | | | | | | | | | | | | | | | 7,701,348 | |
Kazakhstan — 1.2% | | | | | | | | | | | | | | | | |
Kazakhstan Government International Bond, Senior Notes | | | 3.875 | % | | | 10/14/24 | | | | 9,890,000 | | | | 10,803,777 | (a) |
Kenya — 1.2% | | | | | | | | | | | | | | | | |
Kenya Government International Bond, Senior Notes | | | 6.875 | % | | | 6/24/24 | | | | 200,000 | | | | 203,735 | (e)(f) |
Kenya Government International Bond, Senior Notes | | | 7.000 | % | | | 5/22/27 | | | | 2,310,000 | | | | 2,286,900 | (f) |
Kenya Government International Bond, Senior Notes | | | 7.250 | % | | | 2/28/28 | | | | 5,300,000 | | | | 5,255,162 | (e)(f) |
Kenya Government International Bond, Senior Notes | | | 8.000 | % | | | 5/22/32 | | | | 2,380,000 | | | | 2,356,962 | (f) |
Total Kenya | | | | | | | | | | | | | | | 10,102,759 | |
Mexico — 1.7% | | | | | | | | | | | | | | | | |
Mexican Bonos, Bonds | | | 6.500 | % | | | 6/9/22 | | | | 199,640,000 | MXN | | | 8,983,729 | |
Mexican Bonos, Senior Notes | | | 7.750 | % | | | 11/23/34 | | | | 84,080,000 | MXN | | | 4,156,572 | |
Mexico Government International Bond, Senior Notes | | | 6.050 | % | | | 1/11/40 | | | | 1,132,000 | | | | 1,385,121 | (e) |
Total Mexico | | | | | | | | | | | | | | | 14,525,422 | |
Nigeria — 2.1% | | | | | | | | | | | | | | | | |
Nigeria Government International Bond, Senior Notes | | | 7.625 | % | | | 11/21/25 | | | | 3,000,000 | | | | 3,071,070 | (e)(f) |
Nigeria Government International Bond, Senior Notes | | | 7.143 | % | | | 2/23/30 | | | | 2,000,000 | | | | 1,874,900 | (f) |
Nigeria Government International Bond, Senior Notes | | | 7.875 | % | | | 2/16/32 | | | | 4,120,000 | | | | 3,898,632 | (e)(f) |
See Notes to Financial Statements.
| | |
| 6 | | Western Asset Emerging Markets Debt Fund Inc. 2020 Semi-Annual Report |
Western Asset Emerging Markets Debt Fund Inc.
| | | | | | | | | | | | | | | | |
| Security | | Rate | | | Maturity
Date | | | Face
Amount† | | | Value | |
Nigeria — continued | | | | | | | | | | | | | | | | |
Nigeria Government International Bond, Senior Notes | | | 7.696 | % | | | 2/23/38 | | | | 2,960,000 | | | $ | 2,713,432 | (f) |
Nigeria Government International Bond, Senior Notes | | | 9.248 | % | | | 1/21/49 | | | | 6,200,000 | | | | 6,295,790 | (e)(f) |
Total Nigeria | | | | | | | | | | | | | | | 17,853,824 | |
Oman — 2.8% | | | | | | | | | | | | | | | | |
Oman Government International Bond, Senior Notes | | | 4.750 | % | | | 6/15/26 | | | | 5,270,000 | | | | 4,891,245 | (f) |
Oman Government International Bond, Senior Notes | | | 5.625 | % | | | 1/17/28 | | | | 9,000,000 | | | | 8,428,050 | (e)(f) |
Oman Government International Bond, Senior Notes | | | 6.000 | % | | | 8/1/29 | | | | 6,000,000 | | | | 5,610,000 | (f) |
Oman Government International Bond, Senior Notes | | | 6.750 | % | | | 1/17/48 | | | | 6,500,000 | | | | 5,650,125 | (a) |
Total Oman | | | | | | | | | | | | | | | 24,579,420 | |
Panama — 0.8% | | | | | | | | | | | | | | | | |
Panama Government International Bond, Senior Notes | | | 9.375 | % | | | 4/1/29 | | | | 910,000 | | | | 1,384,164 | (e) |
Panama Government International Bond, Senior Notes | | | 6.700 | % | | | 1/26/36 | | | | 159,000 | | | | 229,446 | (e) |
Panama Government International Bond, Senior Notes | | | 4.500 | % | | | 4/1/56 | | | | 4,200,000 | | | | 5,170,242 | |
Total Panama | | | | | | | | | | | | | | | 6,783,852 | |
Paraguay — 1.0% | | | | | | | | | | | | | | | | |
Paraguay Government International Bond, Senior Notes | | | 5.000 | % | | | 4/15/26 | | | | 2,110,000 | | | | 2,340,117 | (e)(f) |
Paraguay Government International Bond, Senior Notes | | | 4.950 | % | | | 4/28/31 | | | | 3,950,000 | | | | 4,419,063 | (f) |
Paraguay Government International Bond, Senior Notes | | | 5.400 | % | | | 3/30/50 | | | | 1,910,000 | | | | 2,219,028 | (e)(f) |
Total Paraguay | | | | | | | | | | | | | | | 8,978,208 | |
Peru — 6.1% | | | | | | | | | | | | | | | | |
Peruvian Government International Bond, Senior Notes | | | 7.350 | % | | | 7/21/25 | | | | 10,300,000 | | | | 13,144,293 | (g) |
Peruvian Government International Bond, Senior Notes | | | 2.783 | % | | | 1/23/31 | | | | 6,070,000 | | | | 6,485,795 | |
Peruvian Government International Bond, Senior Notes | | | 8.750 | % | | | 11/21/33 | | | | 19,998,000 | | | | 33,440,656 | (g) |
Total Peru | | | | | | | | | | | | | | | 53,070,744 | |
See Notes to Financial Statements.
| | |
| Western Asset Emerging Markets Debt Fund Inc. 2020 Semi-Annual Report | | 7 |
Schedule of investments (unaudited) (cont’d)
June 30, 2020
Western Asset Emerging Markets Debt Fund Inc.
| | | | | | | | | | | | | | | | |
| Security | | Rate | | | Maturity
Date | | | Face
Amount† | | | Value | |
Philippines — 0.6% | | | | | | | | | | | | | | | | |
Philippine Government International Bond, Senior Notes | | | 3.950 | % | | | 1/20/40 | | | | 4,600,000 | | | $ | 5,355,535 | (e) |
Poland — 1.8% | | | | | | | | | | | | | | | | |
Republic of Poland Government International Bond, Senior Notes | | | 5.000 | % | | | 3/23/22 | | | | 14,784,000 | | | | 15,884,964 | (e) |
Qatar — 3.8% | | | | | | | | | | | | | | | | |
Qatar Government International Bond, Senior Notes | | | 5.103 | % | | | 4/23/48 | | | | 7,920,000 | | | | 10,793,629 | (f) |
Qatar Government International Bond, Senior Notes | | | 4.817 | % | | | 3/14/49 | | | | 14,100,000 | | | | 18,592,472 | (f)(g) |
Qatar Government International Bond, Senior Notes | | | 4.400 | % | | | 4/16/50 | | | | 2,900,000 | | | | 3,596,525 | (f) |
Total Qatar | | | | | | | | | | | | | | | 32,982,626 | |
Romania — 0.2% | | | | | | | | | | | | | | | | |
Romanian Government International Bond, Senior Notes | | | 4.875 | % | | | 1/22/24 | | | | 1,570,000 | | | | 1,711,991 | (e)(f) |
Russia — 7.6% | | | | | | | | | | | | | | | | |
Russian Federal Bond — OFZ | | | 7.000 | % | | | 1/25/23 | | | | 964,000,000 | RUB | | | 14,326,949 | |
Russian Federal Bond — OFZ | | | 8.150 | % | | | 2/3/27 | | | | 289,580,000 | RUB | | | 4,694,661 | |
Russian Federal Bond — OFZ | | | 7.050 | % | | | 1/19/28 | | | | 83,026,000 | RUB | | | 1,274,139 | |
Russian Federal Bond — OFZ | | | 7.700 | % | | | 3/16/39 | | | | 1,007,670,000 | RUB | | | 16,582,750 | |
Russian Foreign Bond — Eurobond, Senior Notes | | | 12.750 | % | | | 6/24/28 | | | | 790,000 | | | | 1,361,269 | (a) |
Russian Foreign Bond — Eurobond, Senior Notes | | | 7.500 | % | | | 3/31/30 | | | | 15,858,315 | | | | 18,292,693 | (a) |
Russian Foreign Bond — Eurobond, Senior Notes | | | 5.625 | % | | | 4/4/42 | | | | 3,400,000 | | | | 4,623,286 | (e)(f) |
Russian Foreign Bond — Eurobond, Senior Notes | | | 5.875 | % | | | 9/16/43 | | | | 3,400,000 | | | | 4,790,855 | (e)(f) |
Total Russia | | | | | | | | | | | | | | | 65,946,602 | |
Senegal — 1.9% | | | | | | | | | | | | | | | | |
Senegal Government International Bond, Senior Notes | | | 6.250 | % | | | 7/30/24 | | | | 2,170,000 | | | | 2,285,565 | (a) |
Senegal Government International Bond, Senior Notes | | | 4.750 | % | | | 3/13/28 | | | | 4,800,000 | EUR | | | 5,228,859 | (f) |
Senegal Government International Bond, Senior Notes | | | 6.250 | % | | | 5/23/33 | | | | 6,600,000 | | | | 6,741,082 | (f) |
Senegal Government International Bond, Senior Notes | | | 6.750 | % | | | 3/13/48 | | | | 2,650,000 | | | | 2,568,844 | (f) |
Total Senegal | | | | | | | | | | | | | | | 16,824,350 | |
See Notes to Financial Statements.
| | |
| 8 | | Western Asset Emerging Markets Debt Fund Inc. 2020 Semi-Annual Report |
Western Asset Emerging Markets Debt Fund Inc.
| | | | | | | | | | | | | | | | |
| Security | | Rate | | | Maturity
Date | | | Face Amount† | | | Value | |
South Africa — 0.5% | | | | | | | | | | | | | | | | |
Republic of South Africa Government International Bond, Senior Notes | | | 5.375 | % | | | 7/24/44 | | | | 5,000,000 | | | $ | 4,374,580 | (e) |
Sri Lanka — 1.9% | | | | | | | | | | | | | | | | |
Sri Lanka Government International Bond, Senior Notes | | | 6.250 | % | | | 10/4/20 | | | | 3,500,000 | | | | 3,346,875 | (a)(e) |
Sri Lanka Government International Bond, Senior Notes | | | 5.875 | % | | | 7/25/22 | | | | 3,460,000 | | | | 2,698,800 | (a)(e) |
Sri Lanka Government International Bond, Senior Notes | | | 6.125 | % | | | 6/3/25 | | | | 8,680,000 | | | | 5,859,169 | (a)(e) |
Sri Lanka Government International Bond, Senior Notes | | | 6.200 | % | | | 5/11/27 | | | | 4,000,000 | | | | 2,630,212 | (a)(e) |
Sri Lanka Government International Bond, Senior Notes | | | 7.550 | % | | | 3/28/30 | | | | 2,500,000 | | | | 1,643,941 | (f) |
Total Sri Lanka | | | | | | | | | | | | | | | 16,178,997 | |
Supranational — 1.1% | | | | | | | | | | | | | | | | |
European Bank for Reconstruction & Development, Senior Notes | | | 6.450 | % | | | 12/13/22 | | | | 134,803,200,000 | IDR | | | 9,291,321 | |
Turkey — 2.2% | | | | | | | | | | | | | | | | |
Export Credit Bank of Turkey, Senior Notes | | | 4.250 | % | | | 9/18/22 | | | | 2,000,000 | | | | 1,928,466 | (f) |
Turkey Government International Bond, Senior Notes | | | 3.250 | % | | | 3/23/23 | | | | 850,000 | | | | 804,814 | (e) |
Turkey Government International Bond, Senior Notes | | | 5.750 | % | | | 3/22/24 | | | | 450,000 | | | | 447,895 | (e) |
Turkey Government International Bond, Senior Notes | | | 6.350 | % | | | 8/10/24 | | | | 5,000,000 | | | | 5,068,750 | (e) |
Turkey Government International Bond, Senior Notes | | | 4.250 | % | | | 4/14/26 | | | | 5,400,000 | | | | 4,938,397 | (e) |
Turkey Government International Bond, Senior Notes | | | 6.125 | % | | | 10/24/28 | | | | 1,000,000 | | | | 973,430 | (e) |
Turkey Government International Bond, Senior Notes | | | 4.875 | % | | | 4/16/43 | | | | 6,160,000 | | | | 4,772,460 | (e) |
Total Turkey | | | | | | | | | | | | | | | 18,934,212 | |
Ukraine — 3.3% | | | | | | | | | | | | | | | | |
Ukraine Government International Bond, Senior Notes | | | 7.750 | % | | | 9/1/20 | | | | 3,240,000 | | | | 3,254,548 | (e)(f) |
Ukraine Government International Bond, Senior Notes | | | 7.750 | % | | | 9/1/24 | | | | 5,640,000 | | | | 5,900,568 | (e)(f) |
See Notes to Financial Statements.
| | |
| Western Asset Emerging Markets Debt Fund Inc. 2020 Semi-Annual Report | | 9 |
Schedule of investments (unaudited) (cont’d)
June 30, 2020
Western Asset Emerging Markets Debt Fund Inc.
| | | | | | | | | | | | | | | | |
| Security | | Rate | | | Maturity
Date | | | Face
Amount† | | | Value | |
Ukraine — continued | | | | | | | | | | | | | | | | |
Ukraine Government International Bond, Senior Notes | | | 9.750 | % | | | 11/1/28 | | | | 15,080,000 | | | $ | 17,230,076 | (a) |
Ukraine Government International Bond, Senior Notes | | | 4.375 | % | | | 1/27/30 | | | | 2,000,000 | EUR | | | 1,937,166 | (f) |
Total Ukraine | | | | | | | | | | | | | | | 28,322,358 | |
United Arab Emirates — 1.5% | | | | | | | | | | | | | | | | |
Abu Dhabi Government International Bond, Senior Notes | | | 2.500 | % | | | 4/16/25 | | | | 5,800,000 | | | | 6,123,698 | (f) |
Abu Dhabi Government International Bond, Senior Notes | | | 4.125 | % | | | 10/11/47 | | | | 5,400,000 | | | | 6,599,853 | (f) |
Total United Arab Emirates | | | | | | | | | | | | | | | 12,723,551 | |
Uruguay — 1.2% | | | | | | | | | | | | | | | | |
Uruguay Government International Bond, Senior Notes | | | 4.375 | % | | | 10/27/27 | | | | 2,943,154 | | | | 3,373,060 | (e) |
Uruguay Government International Bond, Senior Notes | | | 5.100 | % | | | 6/18/50 | | | | 4,341,000 | | | | 5,618,578 | (e) |
Uruguay Government International Bond, Senior Notes | | | 4.975 | % | | | 4/20/55 | | | | 1,180,000 | | | | 1,516,660 | (e) |
Total Uruguay | | | | | | | | | | | | | | | 10,508,298 | |
Venezuela — 0.2% | | | | | | | | | | | | | | | | |
Venezuela Government International Bond, Senior Notes | | | 7.750 | % | | | 10/13/19 | | | | 22,130,000 | | | | 1,438,450 | *(a)(h) |
Venezuela Government International Bond, Senior Notes | | | 8.250 | % | | | 10/13/24 | | | | 7,000,000 | | | | 437,500 | *(a)(d) |
Venezuela Government International Bond, Senior Notes | | | 9.250 | % | | | 9/15/27 | | | | 4,205,000 | | | | 262,813 | *(d) |
Total Venezuela | | | | | | | | | | | | | | | 2,138,763 | |
Vietnam — 1.1% | | | | | | | | | | | | | | | | |
Vietnam Government International Bond, Senior Notes | | | 4.800 | % | | | 11/19/24 | | | | 8,700,000 | | | | 9,548,102 | (e)(f) |
Total Sovereign Bonds (Cost — $732,612,012) | | | | | | | | | | | | 727,710,273 | |
| Corporate Bonds & Notes — 54.1% | | | | | | | | | | | | | | | | |
| Communication Services — 3.3% | | | | | | | | | | | | | | | | |
Diversified Telecommunication Services — 0.9% | | | | | | | | | | | | | |
Ooredoo International Finance Ltd., Senior Notes | | | 4.750 | % | | | 2/16/21 | | | | 2,710,000 | | | | 2,770,975 | (e)(f) |
Turk Telekomunikasyon AS, Senior Notes | | | 6.875 | % | | | 2/28/25 | | | | 4,680,000 | | | | 4,945,599 | (e)(f) |
Total Diversified Telecommunication Services | | | | | | | | | | | | 7,716,574 | |
See Notes to Financial Statements.
| | |
| 10 | | Western Asset Emerging Markets Debt Fund Inc. 2020 Semi-Annual Report |
Western Asset Emerging Markets Debt Fund Inc.
| | | | | | | | | | | | | | | | |
| Security | | Rate | | | Maturity
Date | | | Face
Amount† | | | Value | |
Media — 1.2% | | | | | | | | | | | | | | | | |
Cable Onda SA, Senior Notes | | | 4.500 | % | | | 1/30/30 | | | | 3,290,000 | | | $ | 3,351,901 | (f) |
Grupo Televisa SAB, Senior Notes | | | 6.625 | % | | | 1/15/40 | | | | 1,480,000 | | | | 1,923,248 | (e) |
Prosus NV, Senior Notes | | | 5.500 | % | | | 7/21/25 | | | | 2,750,000 | | | | 3,118,500 | (e)(f) |
Prosus NV, Senior Notes | | | 4.850 | % | | | 7/6/27 | | | | 2,250,000 | | | | 2,527,898 | (e)(f) |
Total Media | | | | | | | | | | | | | | | 10,921,547 | |
Wireless Telecommunication Services — 1.2% | | | | | | | | | | | | | |
Millicom International Cellular SA, Senior Notes | | | 5.125 | % | | | 1/15/28 | | | | 2,650,000 | | | | 2,673,214 | (e)(f) |
Millicom International Cellular SA, Senior Notes | | | 6.250 | % | | | 3/25/29 | | | | 4,710,000 | | | | 5,038,829 | (e)(f) |
Vimpel Communications Via VIP Finance Ireland Ltd. OJSC, Senior Notes | | | 7.748 | % | | | 2/2/21 | | | | 440,000 | | | | 456,412 | (e)(f) |
VTR Comunicaciones SpA, Senior Secured Notes | | | 5.125 | % | | | 1/15/28 | | | | 2,110,000 | | | | 2,163,805 | (f)(i) |
Total Wireless Telecommunication Services | | | | | | | | | | | | 10,332,260 | |
Total Communication Services | | | | | | | | | | | | | | | 28,970,381 | |
| Consumer Discretionary — 0.6% | | | | | | | | | | | | | | | | |
Hotels, Restaurants & Leisure — 0.6% | | | | | | | | | | | | | | | | |
Gohl Capital Ltd., Senior Notes | | | 4.250 | % | | | 1/24/27 | | | | 3,130,000 | | | | 3,172,365 | (a) |
Sands China Ltd., Senior Notes | | | 5.125 | % | | | 8/8/25 | | | | 1,700,000 | | | | 1,847,824 | (e) |
Total Consumer Discretionary | | | | | | | | | | | | | | | 5,020,189 | |
| Consumer Staples — 0.8% | | | | | | | | | | | | | | | | |
Beverages — 0.7% | | | | | | | | | | | | | | | | |
Fomento Economico Mexicano SAB de CV, Senior Notes | | | 3.500 | % | | | 1/16/50 | | | | 6,300,000 | | | | 6,522,518 | |
Household Products — 0.1% | | | | | | | | | | | | | | | | |
Kimberly-Clark de Mexico SAB de CV, Senior Notes | | | 2.431 | % | | | 7/1/31 | | | | 600,000 | | | | 608,700 | (f)(i) |
Total Consumer Staples | | | | | | | | | | | | | | | 7,131,218 | |
| Energy — 20.2% | | | | | | | | | | | | | | | | |
Oil, Gas & Consumable Fuels — 20.2% | | | | | | | | | | | | | | | | |
CNOOC Curtis Funding No 1 Pty Ltd., Senior Notes | | | 4.500 | % | | | 10/3/23 | | | | 2,750,000 | | | | 3,023,177 | (a)(e) |
Ecopetrol SA, Senior Notes | | | 5.875 | % | | | 9/18/23 | | | | 3,010,000 | | | | 3,231,671 | (e) |
Ecopetrol SA, Senior Notes | | | 5.875 | % | | | 5/28/45 | | | | 7,160,000 | | | | 7,555,912 | (e) |
GNL Quintero SA, Senior Notes | | | 4.634 | % | | | 7/31/29 | | | | 1,877,000 | | | | 2,017,700 | (e)(f) |
KazMunayGas National Co. JSC, Senior Notes | | | 4.400 | % | | | 4/30/23 | | | | 4,000,000 | | | | 4,170,000 | (a) |
See Notes to Financial Statements.
| | |
| Western Asset Emerging Markets Debt Fund Inc. 2020 Semi-Annual Report | | 11 |
Schedule of investments (unaudited) (cont’d)
June 30, 2020
Western Asset Emerging Markets Debt Fund Inc.
| | | | | | | | | | | | | | | | |
| Security | | Rate | | | Maturity Date | | | Face Amount† | | | Value | |
Oil, Gas & Consumable Fuels — continued | | | | | | | | | | | | | | | | |
KazMunayGas National Co. JSC, Senior Notes | | | 4.750 | % | | | 4/19/27 | | | | 5,160,000 | | | $ | 5,610,984 | (e)(f) |
KazMunayGas National Co. JSC, Senior Notes | | | 5.750 | % | | | 4/19/47 | | | | 4,970,000 | | | | 5,810,944 | (e)(f) |
KazMunayGas National Co. JSC, Senior Notes | | | 6.375 | % | | | 10/24/48 | | | | 5,300,000 | | | | 6,701,797 | (e)(f) |
KazTransGas JSC, Senior Notes | | | 4.375 | % | | | 9/26/27 | | | | 5,900,000 | | | | 6,373,770 | (e)(f) |
Lukoil International Finance BV, Senior Notes | | | 6.656 | % | | | 6/7/22 | | | | 3,524,000 | | | | 3,847,158 | (a) |
Lukoil International Finance BV, Senior Notes | | | 4.750 | % | | | 11/2/26 | | | | 3,500,000 | | | | 3,895,080 | (e)(f) |
Pertamina Persero PT, Senior Notes | | | 4.875 | % | | | 5/3/22 | | | | 2,540,000 | | | | 2,666,993 | (e)(f) |
Petrobras Global Finance BV, Senior Notes | | | 5.375 | % | | | 1/27/21 | | | | 16,220,000 | | | | 16,483,170 | (e) |
Petrobras Global Finance BV, Senior Notes | | | 8.375 | % | | | 5/23/21 | | | | 1,000,000 | | | | 1,052,125 | (e) |
Petrobras Global Finance BV, Senior Notes | | | 7.375 | % | | | 1/17/27 | | | | 5,600,000 | | | | 6,250,132 | (e) |
Petrobras Global Finance BV, Senior Notes | | | 5.750 | % | | | 2/1/29 | | | | 6,000,000 | | | | 6,170,310 | |
Petrobras Global Finance BV, Senior Notes | | | 6.850 | % | | | 6/5/2115 | | | | 13,800,000 | | | | 13,726,860 | (e) |
Petroleos de Venezuela SA, Senior Notes | | | 9.000 | % | | | 11/17/21 | | | | 16,630,000 | | | | 482,270 | *(a)(d) |
Petroleos de Venezuela SA, Senior Notes | | | 6.000 | % | | | 5/16/24 | | | | 8,145,000 | | | | 236,205 | *(a)(d) |
Petroleos del Peru SA, Senior Notes | | | 4.750 | % | | | 6/19/32 | | | | 10,800,000 | | | | 12,026,448 | (e)(f) |
Petroleos Mexicanos, Senior Notes | | | 4.500 | % | | | 1/23/26 | | | | 6,000,000 | | | | 5,246,160 | (e) |
Petroleos Mexicanos, Senior Notes | | | 6.875 | % | | | 8/4/26 | | | | 2,561,000 | | | | 2,420,388 | (e) |
Petroleos Mexicanos, Senior Notes | | | 6.625 | % | | | 6/15/35 | | | | 9,060,000 | | | | 7,398,079 | (e) |
Petroleos Mexicanos, Senior Notes | | | 6.350 | % | | | 2/12/48 | | | | 3,400,000 | | | | 2,529,073 | (e) |
Petroleos Mexicanos, Senior Notes | | | 7.690 | % | | | 1/23/50 | | | | 4,930,000 | | | | 4,123,723 | (f) |
Petronas Capital Ltd., Senior Notes | | | 4.800 | % | | | 4/21/60 | | | | 7,000,000 | | | | 9,650,194 | (f) |
Reliance Holding USA Inc., Senior Notes | | | 4.500 | % | | | 10/19/20 | | | | 6,610,000 | | | | 6,662,979 | (e)(f) |
Sinopec Group Overseas Development 2017 Ltd., Senior Notes | | | 4.000 | % | | | 9/13/47 | | | | 10,060,000 | | | | 11,919,052 | (a)(e) |
Transportadora de Gas del Peru SA, Senior Notes | | | 4.250 | % | | | 4/30/28 | | | | 1,080,000 | | | | 1,166,206 | (a)(e) |
See Notes to Financial Statements.
| | |
| 12 | | Western Asset Emerging Markets Debt Fund Inc. 2020 Semi-Annual Report |
Western Asset Emerging Markets Debt Fund Inc.
| | | | | | | | | | | | | | | | |
| Security | | Rate | | | Maturity Date | | | Face Amount† | | | Value | |
Oil, Gas & Consumable Fuels — continued | | | | | | | | | | | | | |
Transportadora de Gas del Peru SA, Senior Notes | | | 4.250 | % | | | 4/30/28 | | | | 5,420,000 | | | $ | 5,852,624 | (e)(f) |
Transportadora de Gas Internacional SA ESP, Senior Notes | | | 5.550 | % | | | 11/1/28 | | | | 2,300,000 | | | | 2,515,878 | (e)(f) |
Ultrapar International SA, Senior Notes | | | 5.250 | % | | | 10/6/26 | | | | 3,190,000 | | | | 3,305,063 | (e)(f) |
YPF SA, Senior Notes | | | 16.500 | % | | | 5/9/22 | | | | 78,563,600 | ARS | | | 497,029 | (b)(f) |
YPF SA, Senior Notes | | | 16.500 | % | | | 5/9/22 | | | | 39,570,000 | ARS | | | 250,338 | (a)(b) |
YPF SA, Senior Notes (Argentina BADLAR Private Deposit Rate + 4.000%) | | | 32.229 | % | | | 7/7/20 | | | | 3,000,000 | | | | 541,850 | (a)(c)(e) |
Total Energy | | | | | | | | | | | | | | | 175,411,342 | |
| Financials — 10.8% | | | | | | | | | | | | | | | | |
Banks — 8.1% | | | | | | | | | | | | | | | | |
Banco Bilbao Vizcaya Argentaria Colombia SA, Subordinated Notes | | | 4.875 | % | | | 4/21/25 | | | | 2,450,000 | | | | 2,581,430 | (e)(f) |
Banco de Credito del Peru, Subordinated Notes (3.125% to 7/1/25 then 5 year Treasury Constant Maturity Rate + 3.000%) | | | 3.125 | % | | | 7/1/30 | | | | 3,310,000 | | | | 3,294,278 | (c)(f)(i) |
Banco del Estado de Chile, Senior Notes | | | 4.125 | % | | | 10/7/20 | | | | 1,110,000 | | | | 1,116,344 | (e)(f) |
Banco Mercantil del Norte SA, Junior Subordinated Notes (7.625% to 1/6/28 then 10 year Treasury Constant Maturity Rate + 5.353%) | | | 7.625 | % | | | 1/10/28 | | | | 5,900,000 | | | | 5,638,276 | (c)(e)(f)(j) |
Bancolombia SA, Senior Notes | | | 3.000 | % | | | 1/29/25 | | | | 4,920,000 | | | | 4,820,124 | |
Bank Leumi Le-Israel BM, Subordinated Notes (3.275% to 1/29/26 then 5 year Treasury Constant Maturity Rate + 1.631%) | | | 3.275 | % | | | 1/29/31 | | | | 4,760,000 | | | | 4,643,231 | (a)(c) |
BBVA Banco Continental SA, Subordinated Notes (5.250% to 9/22/24 then 5 year Treasury Constant Maturity Rate + 2.750%) | | | 5.250 | % | | | 9/22/29 | | | | 980,000 | | | | 1,049,639 | (c)(e)(f) |
BBVA Bancomer SA, Subordinated Notes (5.350% to 11/12/24 then 5 year Treasury Constant Maturity Rate + 3.000%) | | | 5.350 | % | | | 11/12/29 | | | | 1,350,000 | | | | 1,323,000 | (c)(e)(f) |
See Notes to Financial Statements.
| | |
| Western Asset Emerging Markets Debt Fund Inc. 2020 Semi-Annual Report | | 13 |
Schedule of investments (unaudited) (cont’d)
June 30, 2020
Western Asset Emerging Markets Debt Fund Inc.
| | | | | | | | | | | | | | | | |
| Security | | Rate | | | Maturity Date | | | Face Amount† | | | Value | |
Banks — continued | | | | | | | | | | | | | | | | |
Itau Unibanco Holding SA, Junior Subordinated Notes (6.500% to 3/19/23 then 5 year Treasury Constant Maturity Rate + 3.863%) | | | 6.500 | % | | | 3/19/23 | | | | 6,970,000 | | | $ | 6,525,070 | (c)(e)(f)(j) |
Russian Agricultural Bank OJSC Via RSHB Capital SA, Subordinated Notes | | | 8.500 | % | | | 10/16/23 | | | | 16,770,000 | | | | 18,918,572 | (a) |
Shinhan Bank Co. Ltd., Subordinated Notes | | | 3.875 | % | | | 3/24/26 | | | | 1,260,000 | | | | 1,372,686 | (e)(f) |
TC Ziraat Bankasi AS, Senior Notes | | | 5.125 | % | | | 9/29/23 | | | | 10,810,000 | | | | 10,328,955 | (e)(f) |
UniCredit SpA, Subordinated Notes (7.296% to 4/2/29 then USD 5 year ICE Swap Rate + 4.914%) | | | 7.296 | % | | | 4/2/34 | | | | 3,410,000 | | | | 3,876,572 | (c)(e)(f) |
United Overseas Bank Ltd., Subordinated Notes (3.750% to 4/15/24 then 5 year Treasury Constant Maturity Rate + 1.500%) | | | 3.750 | % | | | 4/15/29 | | | | 4,600,000 | | | | 4,868,340 | (c)(f) |
Total Banks | | | | | | | | | | | | | | | 70,356,517 | |
Capital Markets — 0.3% | | | | | | | | | | | | | | | | |
UBS Group AG, Junior Subordinated Notes (7.000% to 1/31/24 then USD 5 year ICE Swap Rate + 4.344%) | | | 7.000 | % | | | 1/31/24 | | | | 2,340,000 | | | | 2,432,301 | (c)(e)(f)(j) |
Consumer Finance — 1.2% | | | | | | | | | | | | | | | | |
African Export-Import Bank, Senior Notes | | | 3.994 | % | | | 9/21/29 | | | | 5,900,000 | | | | 5,836,841 | (f) |
International Finance Corp., Senior Notes | | | 15.500 | % | | | 1/29/21 | | | | 127,000,000 | UAH | | | 4,947,063 | |
Total Consumer Finance | | | | | | | | | | | | | | | 10,783,904 | |
Diversified Financial Services — 1.2% | | | | | | | | | | | | | | | | |
DAE Funding LLC, Senior Notes | | | 4.500 | % | | | 8/1/22 | | | | 4,700,000 | | | | 4,491,390 | (e)(f) |
DAE Funding LLC, Senior Notes | | | 5.000 | % | | | 8/1/24 | | | | 2,880,000 | | | | 2,708,971 | (e)(f) |
Park Aerospace Holdings Ltd., Senior Notes | | | 5.250 | % | | | 8/15/22 | | | | 1,000,000 | | | | 939,131 | (e)(f) |
Park Aerospace Holdings Ltd., Senior Notes | | | 5.500 | % | | | 2/15/24 | | | | 1,980,000 | | | | 1,812,825 | (e)(f) |
Total Diversified Financial Services | | | | | | | | | | | | | | | 9,952,317 | |
Total Financials | | | | | | | | | | | | | | | 93,525,039 | |
| Industrials — 2.1% | | | | | | | | | | | | | | | | |
Industrial Conglomerates — 0.8% | | | | | | | | | | | | | | | | |
Alfa SAB de CV, Senior Notes | | | 6.875 | % | | | 3/25/44 | | | | 1,000,000 | | | | 1,170,555 | (e)(f) |
See Notes to Financial Statements.
| | |
| 14 | | Western Asset Emerging Markets Debt Fund Inc. 2020 Semi-Annual Report |
Western Asset Emerging Markets Debt Fund Inc.
| | | | | | | | | | | | | | | | |
| Security | | Rate | | | Maturity Date | | | Face Amount† | | | Value | |
Industrial Conglomerates — continued | | | | | | | | | | | | | | | | |
General Electric Co., Senior Notes | | | 3.450 | % | | | 5/1/27 | | | | 810,000 | | | $ | 829,784 | |
Sinochem Overseas Capital Co. Ltd., Senior Notes | | | 4.500 | % | | | 11/12/20 | | | | 5,220,000 | | | | 5,282,916 | (e)(f) |
Total Industrial Conglomerates | | | | | | | | | | | | | | | 7,283,255 | |
Road & Rail — 0.9% | | | | | | | | | | | | | | | | |
Empresa de Transporte de Pasajeros Metro SA, Senior Notes | | | 5.000 | % | | | 1/25/47 | | | | 2,560,000 | | | | 2,997,005 | (e)(f) |
Empresa de Transporte de Pasajeros Metro SA, Senior Notes | | | 4.700 | % | | | 5/7/50 | | | | 4,000,000 | | | | 4,595,100 | (f) |
Total Road & Rail | | | | | | | | | | | | | | | 7,592,105 | |
Transportation Infrastructure — 0.4% | | | | | | | | | | | | | | | | |
DP World PLC, Senior Notes | | | 5.625 | % | | | 9/25/48 | | | | 3,400,000 | | | | 3,724,676 | (e)(f) |
Total Industrials | | | | | | | | | | | | | | | 18,600,036 | |
| Materials — 9.6% | | | | | | | | | | | | | | | | |
Chemicals — 5.6% | | | | | | | | | | | | | | | | |
Braskem America Finance Co., Senior Notes | | | 7.125 | % | | | 7/22/41 | | | | 210,000 | | | | 215,817 | (a)(e) |
Braskem Finance Ltd., Senior Notes | | | 6.450 | % | | | 2/3/24 | | | | 2,350,000 | | | | 2,580,594 | (e) |
CNAC HK Finbridge Co. Ltd., Senior Notes | | | 4.625 | % | | | 3/14/23 | | | | 10,700,000 | | | | 11,372,501 | (a) |
CNAC HK Finbridge Co. Ltd., Senior Notes | | | 4.125 | % | | | 7/19/27 | | | | 3,950,000 | | | | 4,307,728 | (a) |
Equate Petrochemical BV, Senior Notes | | | 3.000 | % | | | 3/3/22 | | | | 492,000 | | | | 498,470 | (a) |
Equate Petrochemical BV, Senior Notes | | | 4.250 | % | | | 11/3/26 | | | | 1,300,000 | | | | 1,376,493 | (e)(f) |
Equate Petrochemical BV, Senior Notes | | | 4.250 | % | | | 11/3/26 | | | | 200,000 | | | | 211,768 | (a) |
MEGlobal Canada ULC, Senior Notes | | | 5.875 | % | | | 5/18/30 | | | | 4,100,000 | | | | 4,648,047 | (f) |
Mexichem SAB de CV, Senior Notes | | | 4.875 | % | | | 9/19/22 | | | | 2,101,000 | | | | 2,202,930 | (e)(f) |
Mexichem SAB de CV, Senior Notes | | | 5.875 | % | | | 9/17/44 | | | | 4,960,000 | | | | 5,477,353 | (e)(f) |
OCP SA, Senior Notes | | | 5.625 | % | | | 4/25/24 | | | | 4,900,000 | | | | 5,295,969 | (e)(f) |
OCP SA, Senior Notes | | | 4.500 | % | | | 10/22/25 | | | | 5,590,000 | | | | 5,840,846 | (e)(f) |
Phosagro OAO Via Phosagro Bond Funding DAC, Senior Notes | | | 3.950 | % | | | 11/3/21 | | | | 2,779,000 | | | | 2,857,962 | (e)(f) |
Sociedad Quimica y Minera de Chile SA, Senior Notes | | | 4.250 | % | | | 1/22/50 | | | | 2,100,000 | | | | 2,078,874 | (f) |
Total Chemicals | | | | | | | | | | | | | | | 48,965,352 | |
See Notes to Financial Statements.
| | |
| Western Asset Emerging Markets Debt Fund Inc. 2020 Semi-Annual Report | | 15 |
Schedule of investments (unaudited) (cont’d)
June 30, 2020
Western Asset Emerging Markets Debt Fund Inc.
| | | | | | | | | | | | | | | | |
| Security | | Rate | | | Maturity Date | | | Face Amount† | | | Value | |
Construction Materials — 0.3% | | | | | | | | | | | | | | | | |
Cemex SAB de CV, Senior Secured Notes | | | 6.125 | % | | | 5/5/25 | | | | 2,920,000 | | | $ | 2,843,657 | (e)(f) |
Metals & Mining — 2.2% | | | | | | | | | | | | | | | | |
Indonesia Asahan Aluminium Persero PT, Senior Notes | | | 5.710 | % | | | 11/15/23 | | | | 10,120,000 | | | | 11,005,091 | (e)(f) |
Southern Copper Corp., Senior Notes | | | 7.500 | % | | | 7/27/35 | | | | 310,000 | | | | 435,059 | (e) |
Southern Copper Corp., Senior Notes | | | 6.750 | % | | | 4/16/40 | | | | 5,490,000 | | | | 7,458,872 | (e) |
Total Metals & Mining | | | | | | | | | | | | | | | 18,899,022 | |
Paper & Forest Products — 1.5% | | | | | | | | | | | | | | | | |
Inversiones CMPC SA, Senior Notes | | | 4.500 | % | | | 4/25/22 | | | | 2,350,000 | | | | 2,472,215 | (e)(f) |
Inversiones CMPC SA, Senior Notes | | | 4.375 | % | | | 5/15/23 | | | | 2,070,000 | | | | 2,167,427 | (e)(f) |
Suzano Austria GmbH, Senior Notes | | | 5.750 | % | | | 7/14/26 | | | | 3,450,000 | | | | 3,781,407 | (e)(f) |
Suzano Austria GmbH, Senior Notes | | | 6.000 | % | | | 1/15/29 | | | | 3,940,000 | | | | 4,264,341 | (e) |
Total Paper & Forest Products | | | | | | | | | | | | | | | 12,685,390 | |
Total Materials | | | | | | | | | | | | | | | 83,393,421 | |
| Real Estate — 3.1% | | | | | | | | | | | | | | | | |
Real Estate Management & Development — 3.1% | | | | | | | | | | | | | |
China Aoyuan Group Ltd., Senior Secured Notes | | | 7.950 | % | | | 9/7/21 | | | | 4,000,000 | | | | 4,089,947 | (a) |
China Overseas Finance Cayman III Ltd., Senior Notes | | | 5.375 | % | | | 10/29/23 | | | | 2,460,000 | | | | 2,738,689 | (a) |
China Overseas Finance Cayman VII Ltd., Senior Notes | | | 4.250 | % | | | 4/26/23 | | | | 6,000,000 | | | | 6,393,989 | (a) |
Country Garden Holdings Co. Ltd., Senior Secured Notes | | | 4.750 | % | | | 7/25/22 | | | | 10,000,000 | | | | 10,174,602 | (a) |
Radiant Access Ltd., Senior Notes | | | 4.600 | % | | | 11/18/20 | | | | 2,000,000 | | | | 1,986,130 | (a)(j) |
Yuzhou Properties Co. Ltd., Senior Secured Notes | | | 6.000 | % | | | 10/25/23 | | | | 2,000,000 | | | | 1,932,329 | (a) |
Total Real Estate | | | | | | | | | | | | | | | 27,315,686 | |
| Utilities — 3.6% | | | | | | | | | | | | | | | | |
Electric Utilities — 3.2% | | | | | | | | | | | | | | | | |
Abu Dhabi National Energy Co. PJSC, Senior Notes | | | 4.875 | % | | | 4/23/30 | | | | 5,100,000 | | | | 6,132,750 | (f) |
Enel Chile SA, Senior Notes | | | 4.875 | % | | | 6/12/28 | | | | 5,150,000 | | | | 5,760,584 | (e) |
Eskom Holdings SOC Ltd. | | | 6.350 | % | | | 8/10/28 | | | | 6,340,000 | | | | 6,371,700 | (a) |
Kallpa Generacion SA, Senior Notes | | | 4.875 | % | | | 5/24/26 | | | | 2,270,000 | | | | 2,405,792 | (a)(e) |
Perusahaan Listrik Negara PT, Senior Notes | | | 5.250 | % | | | 5/15/47 | | | | 5,810,000 | | | | 6,561,204 | (a)(e) |
Total Electric Utilities | | | | | | | | | | | | | | | 27,232,030 | |
See Notes to Financial Statements.
| | |
| 16 | | Western Asset Emerging Markets Debt Fund Inc. 2020 Semi-Annual Report |
Western Asset Emerging Markets Debt Fund Inc.
| | | | | | | | | | | | | | | | | | | | |
| Security | | | | | Rate | | | Maturity
Date | | | Face
Amount† | | | Value | |
Independent Power and Renewable Electricity Producers — 0.4% | | | | | | | | | |
Enel Generacion Chile SA, Senior Notes | | | | 4.250% | | | | 4/15/24 | | | | 500,000 | | | $ | 535,371 | (e) |
Minejesa Capital BV, Senior Secured Notes | | | | 5.625% | | | | 8/10/37 | | | | 3,100,000 | | | | 3,190,814 | (e)(f) |
Total Independent Power and Renewable Electricity Producers | | | | | | | | 3,726,185 | |
Total Utilities | | | | | | | | | | | | | | | | | | | 30,958,215 | |
Total Corporate Bonds & Notes (Cost — $458,100,595) | | | | | | | | 470,325,527 | |
| Non-U.S. Treasury Inflation Protected Securities — 0.0%†† | | | | | | | | | |
Argentina — 0.0%†† | | | | | | | | | | | | | | | | | | | | |
Argentina Treasury Bond (Cost — $472,496) | | | | 1.000% | | | | 8/5/21 | | | | 59,359,454 | ARS | | | 540,300 | (b) |
| | | | | |
| | | Counterparty | | | Expiration Date | | | Contracts | | | Notional Amount† | | | | |
| Purchased Options — 0.0%†† | | | | | | | | | | | | | | | | | |
| OTC Purchased Options — 0.0%†† | | | | | | | | | | | | | | | | | |
U.S. Dollar/ Indonesian Rupiah, Put @ 14,000.00IDR | |
| JPMorgan
Chase & Co. |
| | | 9/11/20 | | | | 13,200,000 | | | | 13,200,000 | | | | 31,989 | |
U.S. Dollar/Russian Ruble, Put @ 67.00RUB | |
| Goldman Sachs
Group Inc. |
| | | 9/14/20 | | | | 13,200,000 | | | | 13,200,000 | | | | 45,133 | |
Total Purchased Options (Cost — $207,240) | | | | | | | | | | | | 77,122 | |
Total Investments before Short-Term Investments (Cost — $1,191,392,343) | | | | 1,198,653,222 | |
| | | | | |
| | | | | | Rate | | | | | | Shares | | | | |
| Short-Term Investments — 0.5% | | | | | | | | | | | | | | | | | |
Dreyfus Government Cash Management, Institutional Shares
(Cost — $4,138,264) | | | | 0.085% | | | | | | | | 4,138,264 | | | | 4,138,264 | |
Total Investments — 138.3% (Cost — $1,195,530,607) | | | | | | | | 1,202,791,486 | |
Liabilities in Excess of Other Assets — (38.3)% | | | | | | | | | | | | (333,048,468 | ) |
Total Net Assets — 100.0% | | | | | | | | | | | | | | | $ | 869,743,018 | |
See Notes to Financial Statements.
| | |
| Western Asset Emerging Markets Debt Fund Inc. 2020 Semi-Annual Report | | 17 |
Schedule of investments (unaudited) (cont’d)
June 30, 2020
Western Asset Emerging Markets Debt Fund Inc.
| † | Face amount/notional amount denominated in U.S. dollars, unless otherwise noted. |
| †† | Represents less than 0.1%. |
| * | Non-income producing security. |
| (a) | Security is exempt from registration under Regulation S of the Securities Act of 1933. Regulation S applies to securities offerings that are made outside of the United States and do not involve direct selling efforts in the United States. This security has been deemed liquid pursuant to guidelines approved by the Board of Directors. |
| (b) | Security is valued in good faith in accordance with procedures approved by the Board of Directors (Note 1). |
| (c) | Variable rate security. Interest rate disclosed is as of the most recent information available. Certain variable rate securities are not based on a published reference rate and spread but are determined by the issuer or agent and are based on current market conditions. These securities do not indicate a reference rate and spread in their description above. |
| (d) | The coupon payment on these securities is currently in default as of June 30, 2020. |
| (e) | All or a portion of this security is pledged as collateral pursuant to the loan agreement (Note 5). |
| (f) | Security is exempt from registration under Rule 144A of the Securities Act of 1933. This security may be resold in transactions that are exempt from registration, normally to qualified institutional buyers. This security has been deemed liquid pursuant to guidelines approved by the Board of Directors. |
| (g) | All or a portion of this security is held by the counterparty as collateral for open reverse repurchase agreements. |
| (h) | The maturity principal is currently in default as of June 30, 2020. |
| (i) | Securities traded on a when-issued or delayed delivery basis. |
| (j) | Security has no maturity date. The date shown represents the next call date. |
| | |
Abbreviation(s) used in this schedule: |
| |
| ARS | | — Argentine Peso |
| |
| BRL | | — Brazilian Real |
| |
| EUR | | — Euro |
| |
| ICE | | — Intercontinental Exchange |
| |
| IDR | | — Indonesian Rupiah |
| |
| JSC | | — Joint Stock Company |
| |
| MXN | | — Mexican Peso |
| |
| OFZ | | — Obligatsyi Federal’novo Zaima (Russian Federal Loan Obligation) |
| |
| OJSC | | — Open Joint Stock Company |
| |
| PJSC | | — Private Joint Stock Company |
| |
| RUB | | — Russian Ruble |
| |
| UAH | | — Ukrainian Hryvnia |
| |
| USD | | — United States Dollar |
See Notes to Financial Statements.
| | |
| 18 | | Western Asset Emerging Markets Debt Fund Inc. 2020 Semi-Annual Report |
Western Asset Emerging Markets Debt Fund Inc.
At June 30, 2020, the Fund had the following open reverse repurchase agreements:
| | | | | | | | | | | | | | | | | | | | | | |
Counterparty | | Rate | | | Effective Date | | | Maturity Date | | Face Amount of Reverse Repurchase Agreements | | | Asset Class of Collateral* | | | Collateral Value | |
| JPMorgan Chase & Co. | | | 0.700 | % | | | 6/12/2020 | | | TBD** | | $ | 2,219,622 | | | | Sovereign Bonds | | | $ | 2,505,369 | |
| | | | | | | | | | | | | | | | | | Cash | | | | 15,527 | |
| JPMorgan Chase & Co. | | | 1.550 | % | | | 3/5/2020 | | | TBD** | | | 31,042,342 | | | | Sovereign Bonds | | | | 35,217,333 | |
| | | | | | | | | | | | | | | | | | Cash | | | | 217,156 | |
| JPMorgan Chase & Co. | | | 1.600 | % | | | 5/28/2020 | | | TBD** | | | 20,916,021 | | | | Sovereign Bonds | | | | 24,805,581 | |
| | | | | | | | | | | | | | | | | | Cash | | | | 146,317 | |
| | | | | | | | | | | | | $ | 54,177,985 | | | | | | | $ | 62,907,283 | |
| * | Refer to the Schedule of Investments for positions held at the counterparty as collateral for reverse repurchase agreements. |
| ** | TBD — To Be Determined; These reverse repurchase agreements have no maturity dates because they are renewed daily and can be terminated by either the Fund or the counterparty in accordance with the terms of the agreements. The rates for these agreements are variable. The rate disclosed is the rate as of June 30, 2020. |
| | | | | | | | | | | | | | | | | | | | | | |
| Schedule of Written Options | |
| OTC Written Options | |
| Security | | Counterparty | | Expiration Date | | | Strike Price | | | Contracts | | | Notional Amount† | | | Value | |
| U.S. Dollar/Indonesian Rupiah, Call | | JPMorgan
Chase & Co. | | | 9/11/20 | | | | 15,500.00 | IDR | | | 13,200,000 | | | | 13,200,000 | | | $ | (90,852 | ) |
| U.S. Dollar/Russian Ruble, Call | | Goldman Sachs
Group Inc. | | | 9/14/20 | | | | 75.00 | RUB | | | 13,200,000 | | | | 13,200,000 | | | | (160,033 | ) |
| Total OTC Written Options (Premiums received — $241,296) | | | | | | | | | | | $ | (250,885 | ) |
| † | Notional amount denominated in U.S. dollars, unless otherwise noted. |
| | |
Abbreviation(s) used in this schedule: |
| |
| IDR | | — Indonesian Rupiah |
| |
| RUB | | — Russian Ruble |
At June 30, 2020, the Fund had the following open futures contracts:
| | | | | | | | | | | | | | | | | | | | |
| | | Number of Contracts | | | Expiration Date | | | Notional Amount | | | Market Value | | | Unrealized Depreciation | |
| Contracts to Sell: | | | | | | | | | | | | | | | | | | | | |
| U.S. Treasury 10-Year Notes | | | 663 | | | | 9/20 | | | $ | 91,985,617 | | | $ | 92,270,957 | | | $ | (285,340 | ) |
| U.S. Treasury Long-Term Bonds | | | 180 | | | | 9/20 | | | | 32,093,806 | | | | 32,141,250 | | | | (47,444 | ) |
| Net unrealized depreciation on open futures contracts | | | | | | | | | | | $ | (332,784 | ) |
See Notes to Financial Statements.
| | |
| Western Asset Emerging Markets Debt Fund Inc. 2020 Semi-Annual Report | | 19 |
Schedule of investments (unaudited) (cont’d)
June 30, 2020
Western Asset Emerging Markets Debt Fund Inc.
At June 30, 2020, the Fund had the following open forward foreign currency contracts:
| | | | | | | | | | | | | | | | | | | | |
Currency Purchased | | | Currency Sold | | | Counterparty | | Settlement Date | | | Unrealized Appreciation (Depreciation) | |
| USD | | | 12,923,319 | | | RUB | | | 997,202,093 | | | Bank of America N.A. | | | 7/15/20 | | | $ | (1,063,737) | |
| ZAR | | | 5,291,000 | | | USD | | | 302,963 | | | Bank of America N.A. | | | 7/15/20 | | | | 1,432 | |
| IDR | | | 121,256,093,000 | | | USD | | | 8,169,795 | | | Barclays Bank PLC | | | 7/15/20 | | �� | | 303,826 | |
| IDR | | | 202,817,509,000 | | | USD | | | 13,611,913 | | | Barclays Bank PLC | | | 7/15/20 | | | | 561,383 | |
| INR | | | 153,552,000 | | | USD | | | 2,031,111 | | | Barclays Bank PLC | | | 7/15/20 | | | | (347) | |
| INR | | | 1,378,658,300 | | | USD | | | 17,611,884 | | | Barclays Bank PLC | | | 7/15/20 | | | | 621,221 | |
| USD | | | 22,031,472 | | | IDR | | | 374,424,858,494 | | | Barclays Bank PLC | | | 7/15/20 | | | | (4,134,092) | |
| USD | | | 20,730,662 | | | INR | | | 1,570,762,290 | | | Barclays Bank PLC | | | 7/15/20 | | | | (43,067) | |
| USD | | | 2,418,153 | | | ZAR | | | 45,691,000 | | | Barclays Bank PLC | | | 7/15/20 | | | | (210,481) | |
| MXN | | | 298,890,000 | | | USD | | | 12,933,922 | | | Citibank N.A. | | | 7/15/20 | | | | 43,804 | |
| USD | | | 5,690,068 | | | MXN | | | 130,436,267 | | | Citibank N.A. | | | 7/15/20 | | | | 26,559 | |
| BRL | | | 9,119,000 | | | USD | | | 1,666,332 | | | JPMorgan Chase & Co. | | | 7/15/20 | | | | 9,313 | |
| MXN | | | 82,695,000 | | | USD | | | 3,421,390 | | | JPMorgan Chase & Co. | | | 7/15/20 | | | | 169,205 | |
| USD | | | 1,638,202 | | | BRL | | | 9,400,000 | | | JPMorgan Chase & Co. | | | 7/15/20 | | | | (89,078) | |
| USD | | | 14,678,075 | | | BRL | | | 77,199,337 | | | JPMorgan Chase & Co. | | | 7/15/20 | | | | 492,453 | |
| USD | | | 26,075,445 | | | MXN | | | 636,293,000 | | | JPMorgan Chase & Co. | | | 7/15/20 | | | | (1,552,231) | |
| EUR | | | 1,320,000 | | | USD | | | 1,480,776 | | | BNP Paribas SA | | | 7/16/20 | | | | 2,762 | |
| EUR | | | 1,340,000 | | | USD | | | 1,505,356 | | | BNP Paribas SA | | | 7/16/20 | | | | 660 | |
| USD | | | 6,497,541 | | | EUR | | | 6,002,815 | | | JPMorgan Chase & Co. | | | 7/16/20 | | | | (248,977) | |
| USD | | | 38,065,803 | | | SAR | | | 143,116,000 | | | Bank of America N.A. | | | 8/13/20 | | | | (65,400) | |
| USD | | | 5,256,637 | | | RUB | | | 368,726,815 | | | Goldman Sachs Group Inc. | | | 9/15/20 | | | | 120,987 | |
| USD | | | 1,177,878 | | | SAR | | | 4,430,000 | | | Goldman Sachs Group Inc. | | | 9/15/20 | | | | (2,181) | |
| USD | | | 5,070,000 | | | IDR | | | 73,991,580,000 | | | JPMorgan Chase & Co. | | | 9/15/20 | | | | (65,808) | |
| USD | | | 1,483,835 | | | EUR | | | 1,320,000 | | | BNP Paribas SA | | | 10/16/20 | | | | (2,845) | |
| USD | | | 1,508,458 | | | EUR | | | 1,340,000 | | | BNP Paribas SA | | | 10/16/20 | | | | (747) | |
| Total | | | | | | | | | | | | | | | | | | $ | (5,125,386) | |
| | |
Abbreviation(s) used in this table: |
| |
| BRL | | — Brazilian Real |
| |
| EUR | | — Euro |
| |
| IDR | | — Indonesian Rupiah |
| |
| INR | | — Indian Rupee |
| |
| MXN | | — Mexican Peso |
| |
| RUB | | — Russian Ruble |
| |
| SAR | | — Saudi Arabian Riyal |
| |
| USD | | — United States Dollar |
| |
| ZAR | | — South African Rand |
See Notes to Financial Statements.
| | |
| 20 | | Western Asset Emerging Markets Debt Fund Inc. 2020 Semi-Annual Report |
Western Asset Emerging Markets Debt Fund Inc.
At June 30, 2020, the Fund had the following open swap contracts:
| | | | | | | | | | | | | | | | | | | | | | | | | | |
| CENTRALLY CLEARED CREDIT DEFAULT SWAPS ON SOVEREIGN ISSUES — BUY PROTECTION1 | |
| Reference Entity | | Notional Amount2 | | | Termination Date | | | Implied Credit Spread at June 30, 20203 | | Periodic Payments Made by the Fund† | | | Market Value | | | Upfront Premiums Paid (Received) | | | Unrealized Depreciation | |
| Republic of Chile, 3.875%, due 8/5/20 | | $ | 19,700,000 | | | | 12/20/24 | | | 0.768% | | | 1.000% quarterly | | | $ | (202,496) | | | $ | 582,870 | | | $ | (785,366) | |
| State of Qatar, 9.750%, due 6/15/30 | | | 19,700,000 | | | | 12/20/24 | | | 0.676% | | | 1.000% quarterly | | | | (283,586) | | | | 599,148 | | | | (882,734) | |
| Total | | $ | 39,400,000 | | | | | | | | | | | | | $ | (486,082) | | | $ | 1,182,018 | | | $ | (1,668,100) | |
| 1 | If the Fund is a buyer of protection and a credit event occurs, as defined under the terms of that particular swap agreement, the Fund will either (i) receive from the seller of protection an amount equal to the notional amount of the swap and deliver the referenced obligation or the underlying securities comprising the referenced index or (ii) receive a net settlement amount in the form of cash or securities equal to the notional amount of the swap less the recovery value of the referenced obligation or the underlying securities comprising the referenced index. |
| 2 | The maximum potential amount the Fund could be required to pay as a seller of credit protection or receive as a buyer of credit protection if a credit event occurs as defined under the terms of that particular swap agreement. |
| 3 | Implied credit spreads, utilized in determining the market value of credit default swap agreements on corporate or sovereign issues as of period end, serve as an indicator of the current status of the payment/performance risk and represent the likelihood or risk of default for the credit derivative. The implied credit spread of a particular referenced entity reflects the cost of buying/selling protection and may include upfront payments required to be made to enter into the agreement. Wider credit spreads represent a deterioration of the referenced entity’s credit soundness and a greater likelihood or risk of default or other credit event occurring as defined under the terms of the agreement. A credit spread identified as “Defaulted” indicates a credit event has occurred for the referenced entity or obligation. |
| † | Percentage shown is an annual percentage rate. |
| | | | |
| Summary of Investments by Country* | | | |
| Russia | | | 8.0 | % |
| Peru | | | 7.2 | |
| Indonesia | | | 6.9 | |
| Brazil | | | 6.8 | |
| China | | | 5.6 | |
| Mexico | | | 5.3 | |
| Colombia | | | 4.5 | |
| Kazakhstan | | | 3.3 | |
| Qatar | | | 3.0 | |
| Turkey | | | 2.8 | |
| Egypt | | | 2.6 | |
See Notes to Financial Statements.
| | |
| Western Asset Emerging Markets Debt Fund Inc. 2020 Semi-Annual Report | | 21 |
Schedule of investments (unaudited) (cont’d)
June 30, 2020
Western Asset Emerging Markets Debt Fund Inc.
| | | | |
| Summary of Investments by Country* (cont’d) | |
| United Arab Emirates | | | 2.5 | % |
| Ukraine | | | 2.4 | |
| Argentina | | | 2.4 | |
| Chile | | | 2.2 | |
| Oman | | | 2.0 | |
| Dominican Republic | | | 1.9 | |
| Supranational | | | 1.7 | |
| Ghana | | | 1.7 | |
| Nigeria | | | 1.5 | |
| Senegal | | | 1.4 | |
| Sri Lanka | | | 1.3 | |
| Poland | | | 1.3 | |
| Hungary | | | 1.2 | |
| Bahrain | | | 1.1 | |
| Malaysia | | | 1.1 | |
| Jamaica | | | 1.0 | |
| Morocco | | | 0.9 | |
| South Africa | | | 0.9 | |
| Uruguay | | | 0.9 | |
| Panama | | | 0.8 | |
| Kenya | | | 0.8 | |
| Vietnam | | | 0.8 | |
| Ecuador | | | 0.8 | |
| Guatemala | | | 0.8 | |
| Paraguay | | | 0.7 | |
| Israel | | | 0.7 | |
| Angola | | | 0.7 | |
| El Salvador | | | 0.7 | |
| Jordan | | | 0.6 | |
| Ivory Coast | | | 0.6 | |
| Armenia | | | 0.6 | |
| Costa Rica | | | 0.6 | |
| Kuwait | | | 0.6 | |
| India | | | 0.6 | |
| Croatia | | | 0.5 | |
| Philippines | | | 0.4 | |
| Singapore | | | 0.4 | |
| Honduras | | | 0.4 | |
| Italy | | | 0.3 | |
| Venezuela | | | 0.2 | |
| Ireland | | | 0.2 | |
See Notes to Financial Statements.
| | |
| 22 | | Western Asset Emerging Markets Debt Fund Inc. 2020 Semi-Annual Report |
Western Asset Emerging Markets Debt Fund Inc.
| | | | |
| Summary of Investments by Country* (cont’d) | |
| Ethiopia | | | 0.2 | % |
| Switzerland | | | 0.2 | |
| Georgia | | | 0.2 | |
| Belarus | | | 0.2 | |
| Hong Kong | | | 0.2 | |
| Macau | | | 0.2 | |
| Romania | | | 0.1 | |
| South Korea | | | 0.1 | |
| United States | | | 0.1 | |
| Purchased Options | | | 0.0 | ‡ |
| Short-Term Investments | | | 0.3 | |
| | | | 100.0 | % |
| * | As a percentage of total investments. Please note that the Fund holdings are as of June 30, 2020 and are subject to change. |
| ‡ | Represents less than 0.1%. |
See Notes to Financial Statements.
| | |
| Western Asset Emerging Markets Debt Fund Inc. 2020 Semi-Annual Report | | 23 |
Statement of assets and liabilities (unaudited)
June 30, 2020
| | | | |
| |
| Assets: | | | | |
Investments, at value (Cost — $1,195,530,607) | | $ | 1,202,791,486 | |
Foreign currency, at value (Cost — $598,772) | | | 576,259 | |
Cash | | | 70,000 | |
Interest receivable | | | 19,129,998 | |
Receivable for securities sold | | | 11,013,808 | |
Deposits with brokers for OTC derivatives | | | 3,990,000 | |
Unrealized appreciation on forward foreign currency contracts | | | 2,353,605 | |
Deposits with brokers for open futures contracts | | | 2,260,017 | |
Deposits with brokers for centrally cleared swap contracts | | | 819,000 | |
Deposits with brokers for open reverse repurchase agreements | | | 379,000 | |
Receivable from broker — net variation margin on open futures contracts | | | 187,969 | |
Security litigation proceeds receivable | | | 67,233 | |
Prepaid expenses | | | 22,887 | |
Total Assets | | | 1,243,661,262 | |
| |
| Liabilities: | | | | |
Loan payable (Note 5) | | | 295,000,000 | |
Payable for open reverse repurchase agreements (Note 3) | | | 54,177,985 | |
Payable for securities purchased | | | 9,325,307 | |
Unrealized depreciation on forward foreign currency contracts | | | 7,478,991 | |
Distributions payable | | | 6,074,601 | |
Investment management fee payable | | | 845,135 | |
Interest expense payable | | | 264,687 | |
Written options, at value (premiums received — $241,296) | | | 250,885 | |
Accrued foreign capital gains tax | | | 243,807 | |
Payable to broker — net variation margin on centrally cleared swap contracts | | | 44,582 | |
Directors’ fees payable | | | 25,269 | |
Accrued expenses | | | 186,995 | |
Total Liabilities | | | 373,918,244 | |
| Total Net Assets | | $ | 869,743,018 | |
| |
| Net Assets: | | | | |
Par value ($0.001 par value; 60,746,012 shares issued and outstanding; 100,000,000 shares authorized) | | $ | 60,746 | |
Paid-in capital in excess of par value | | | 1,099,968,768 | |
Total distributable earnings (loss) | | | (230,286,496) | |
| Total Net Assets | | $ | 869,743,018 | |
| |
| Shares Outstanding | | | 60,746,012 | |
| |
| Net Asset Value | | | $14.32 | |
See Notes to Financial Statements.
| | |
| 24 | | Western Asset Emerging Markets Debt Fund Inc. 2020 Semi-Annual Report |
Statement of operations (unaudited)
For the Six Months Ended June 30, 2020
| | | | |
|
| Investment Income: | |
Interest | | $ | 39,707,291 | |
Less: Foreign taxes withheld | | | (213,867) | |
Total Investment Income | | | 39,493,424 | |
|
| Expenses: | |
Investment management fee (Note 2) | | | 5,213,272 | |
Interest expense (Notes 3 and 5) | | | 2,916,284 | |
Directors’ fees | | | 162,911 | |
Transfer agent fees | | | 133,821 | |
Legal fees | | | 96,172 | |
Custody fees | | | 69,585 | |
Fund accounting fees | | | 38,411 | |
Audit and tax fees | | | 35,941 | |
Shareholder reports | | | 16,643 | |
Stock exchange listing fees | | | 15,489 | |
Insurance | | | 6,476 | |
Miscellaneous expenses | | | 8,482 | |
Total Expenses | | | 8,713,487 | |
Less: Fee waivers and/or expense reimbursements (Note 2) | | | (29,113) | |
Net Expenses | | | 8,684,374 | |
| Net Investment Income | | | 30,809,050 | |
| |
| Realized and Unrealized Gain (Loss) on Investments, Futures Contracts, Written Options, Swap Contracts, Forward Foreign Currency Contracts and Foreign Currency Transactions (Notes 1, 3 and 4): | | | | |
Net Realized Gain (Loss) From: | | | | |
Investment transactions | | | (21,871,357) | † |
Futures contracts | | | (9,803,543) | |
Written options | | | 2,549,337 | |
Swap contracts | | | (190,654) | |
Forward foreign currency contracts | | | 959,459 | |
Foreign currency transactions | | | 1,418,304 | |
Net Realized Loss | | | (26,938,454) | |
Change in Net Unrealized Appreciation (Depreciation) From: | | | | |
Investments | | | (48,979,802) | ‡ |
Futures contracts | | | (1,486,881) | |
Written options | | | (1,088,543) | |
Swap contracts | | | (1,668,100) | |
Forward foreign currency contracts | | | (2,982,914) | |
Foreign currencies | | | 248,408 | |
Change in Net Unrealized Appreciation (Depreciation) | | | (55,957,832) | |
| Net Loss on Investments, Futures Contracts, Written Options, Swap Contracts, Forward Foreign Currency Contracts and Foreign Currency Transactions | | | (82,896,286) | |
| Decrease in Net Assets From Operations | | $ | (52,087,236) | |
| † | Net of foreign capital gains tax of $219,021. |
| ‡ | Net of change in accrued foreign capital gains tax of $91,668. |
See Notes to Financial Statements.
| | |
| Western Asset Emerging Markets Debt Fund Inc. 2020 Semi-Annual Report | | 25 |
Statements of changes in net assets
| | | | | | | | |
For the Six Months Ended June 30, 2020 (unaudited) and the Year Ended December 31, 2019 | | 2020 | | | 2019 | |
| | |
| Operations: | | | | | | | | |
Net investment income | | $ | 30,809,050 | | | $ | 70,248,355 | |
Net realized loss | | | (26,938,454) | | | | (53,056,233) | |
Change in net unrealized appreciation (depreciation) | | | (55,957,832) | | | | 120,669,437 | |
Increase (Decrease) in Net Assets From Operations | | | (52,087,236) | | | | 137,861,559 | |
| | |
| Distributions to Shareholders From (Note 1): | | | | | | | | |
Total distributable earnings | | | (36,447,607) | | | | (62,098,963) | |
Return of capital | | | — | | | | (10,796,252) | |
Decrease in Net Assets From Distributions to Shareholders | | | (36,447,607) | | | | (72,895,215) | |
Increase (Decrease) in Net Assets | | | (88,534,843) | | | | 64,966,344 | |
| | |
| Net Assets: | | | | | | | | |
Beginning of period | | | 958,277,861 | | | | 893,311,517 | |
End of period | | $ | 869,743,018 | | | $ | 958,277,861 | |
See Notes to Financial Statements.
| | |
| 26 | | Western Asset Emerging Markets Debt Fund Inc. 2020 Semi-Annual Report |
Statement of cash flows (unaudited)
For the Six Months Ended June 30, 2020
| | | | |
| |
| Increase (Decrease) in Cash: | | | | |
| Cash Flows from Operating Activities: | | | | |
Net decrease in net assets resulting from operations | | $ | (52,087,236) | |
Adjustments to reconcile net decrease in net assets resulting from operations to net cash provided (used) by operating activities: | | | | |
Purchases of portfolio securities | | | (456,262,583) | |
Sales of portfolio securities | | | 479,890,035 | |
Net purchases, sales and maturities of short-term investments | | | 27,224,070 | |
Net inflation adjustment | | | (257,944) | |
Net amortization of premium (accretion of discount) | | | (5,107,565) | |
Increase in receivable for securities sold | | | (11,013,808) | |
Increase in security litigation proceeds receivable | | | (67,233) | |
Decrease in interest receivable | | | 2,557,067 | |
Increase in prepaid expenses | | | (9,167) | |
Increase in receivable from broker — net variation margin on open futures contracts | | | (77,177) | |
Increase in payable to broker — net variation margin on centrally cleared swap contracts | | | 44,582 | |
Decrease in deposits from brokers for reverse repurchase agreements | | | (965,000) | |
Increase in payable for securities purchased | | | 8,883,602 | |
Decrease in investment management fee payable | | | (112,060) | |
Decrease in Directors’ fees payable | | | (9,465) | |
Decrease in interest expense payable | | | (224,139) | |
Decrease in accrued expenses | | | (20,697) | |
Decrease in premiums received from written options | | | (1,117,060) | |
Net realized loss on investments | | | 21,871,357 | |
Change in net unrealized appreciation (depreciation) of investments, written options and forward foreign currency contracts | | | 53,051,259 | |
Net Cash Provided in Operating Activities* | | | 66,190,838 | |
| |
| Cash Flows from Financing Activities: | | | | |
Distributions paid on common stock (net of distributions payable) | | | (30,373,006) | |
Decrease in payable for reverse repurchase agreements | | | (32,242,428) | |
Net Cash Used by Financing Activities | | | (62,615,434) | |
| Net Increase in Cash and Restricted Cash | | | 3,575,404 | |
| Cash and restricted cash at beginning of period | | | 4,518,872 | |
| Cash and restricted cash at end of period | | $ | 8,094,276 | |
| * | Included in operating expenses is cash of $3,140,423 paid for interest on borrowings. |
See Notes to Financial Statements.
| | |
| Western Asset Emerging Markets Debt Fund Inc. 2020 Semi-Annual Report | | 27 |
Statement of cash flows (unaudited) (cont’d)
For the Six Months Ended June 30, 2020
The following table provides a reconciliation of cash (including foreign currency) and restricted cash reported within the Statement of Assets and Liabilities that sums to the total of such amounts shown on the Statement of Cash Flows.
| | | | |
| | | June 30, 2020 | |
| Cash | | $ | 646,259 | |
| Restricted cash | | | 7,448,017 | |
| Total cash and restricted cash shown in the Statement of Cash Flows | | $ | 8,094,276 | |
Restricted cash consists of cash that has been segregated to cover the Fund’s collateral or margin obligations under derivative contracts and for reverse repurchase agreements. It is separately reported on the Statement of Assets and Liabilities as Deposits with brokers.
See Notes to Financial Statements.
| | |
| 28 | | Western Asset Emerging Markets Debt Fund Inc. 2020 Semi-Annual Report |
Financial highlights
| | | | | | | | | | | | | | | | | | | | | | | | |
For a share of capital stock outstanding throughout each year ended December 31,
unless otherwise noted: | |
| | | 20201,2 | | | 20191 | | | 20181 | | | 20171 | | | 20161 | | | 20151 | |
| | | | | | |
| Net asset value, beginning of period | | | $15.78 | | | | $14.71 | | | | $17.59 | | | | $17.10 | | | | $16.37 | | | | $18.16 | |
| | | | | | |
| Income (loss) from operations: | | | | | | | | | | | | | | | | | | | | | | | | |
Net investment income | | | 0.51 | | | | 1.16 | | | | 1.06 | | | | 1.17 | | | | 1.01 | | | | 1.05 | |
Net realized and unrealized gain (loss) | | | (1.37) | | | | 1.11 | | | | (2.74) | | | | 0.53 | | | | 0.98 | | | | (1.53) | |
Total income (loss) from operations | | | (0.86) | | | | 2.27 | | | | (1.68) | | | | 1.70 | | | | 1.99 | | | | (0.48) | |
| | | | | | |
| Less distributions from: | | | | | | | | | | | | | | | | | | | | | | | | |
Net investment income | | | (0.60) | 3 | | | (1.02) | | | | (1.07) | | | | (1.13) | | | | (0.98) | | | | (1.15) | |
Return of capital | | | — | | | | (0.18) | | | | (0.13) | | | | (0.08) | | | | (0.28) | | | | (0.16) | |
Total distributions | | | (0.60) | | | | (1.20) | | | | (1.20) | | | | (1.21) | | | | (1.26) | | | | (1.31) | |
| | | | | | |
| Net asset value, end of period | | | $14.32 | | | | $15.78 | | | | $14.71 | | | | $17.59 | | | | $17.10 | | | | $16.37 | |
| | | | | | |
| Market price, end of period | | | $12.32 | | | | $14.27 | | | | $12.29 | | | | $15.55 | | | | $14.71 | | | | $13.73 | |
Total return, based on NAV4,5 | | | (5.17) | % | | | 15.76 | % | | | (9.78) | % | | | 10.17 | % | | | 12.44 | % | | | (2.83) | % |
Total return, based on Market Price6 | | | (9.41) | % | | | 26.49 | % | | | (13.68) | % | | | 14.22 | % | | | 16.56 | % | | | (4.89) | % |
| | | | | | |
| Net assets, end of period (millions) | | | $870 | | | | $958 | | | | $893 | | | | $1,068 | | | | $1,039 | | | | $504 | |
| | | | | | |
| Ratios to average net assets: | | | | | | | | | | | | | | | | | | | | | | | | |
Gross expenses | | | 2.02 | %7 | | | 2.49 | % | | | 2.39 | % | | | 1.83 | %8 | | | 1.60 | %8 | | | 1.33 | % |
Net expenses | | | 2.01 | 7,9 | | | 2.49 | | | | 2.35 | 9 | | | 1.79 | 8,9 | | | 1.59 | 8,9 | | | 1.33 | |
Net investment income | | | 7.13 | 7 | | | 7.41 | | | | 6.66 | | | | 6.66 | | | | 5.92 | | | | 5.97 | |
| | | | | | |
| Portfolio turnover rate | | | 38 | % | | | 29 | % | | | 42 | % | | | 33 | % | | | 30 | % | | | 37 | % |
| | | | | | |
| Supplemental data: | | | | | | | | | | | | | | | | | | | | | | | | |
Loan Outstanding, End of Period (000s) | | | $295,000 | | | | $295,000 | | | | $295,000 | | | | $295,000 | | | | $295,000 | | | | $101,780 | |
Asset Coverage Ratio for Loan Outstanding10 | | | 395 | % | | | 425 | % | | | 403 | % | | | 462 | % | | | 452 | % | | | 595 | % |
Asset Coverage, per $1,000 Principal Amount of Loan Outstanding10 | | | $3,948 | | | | $4,248 | | | | $4,028 | | | | $4,622 | | | | $4,521 | | | | $5,953 | |
Weighted Average Loan (000s) | | | $295,000 | | | | $295,000 | | | | $295,000 | | | | $295,000 | | | | $135,366 | | | | $98,076 | |
Weighted Average Interest Rate on Loan | | | 1.56 | % | | | 2.96 | % | | | 2.82 | % | | | 1.89 | % | | | 1.29 | % | | | 0.96 | % |
See Notes to Financial Statements.
| | |
| Western Asset Emerging Markets Debt Fund Inc. 2020 Semi-Annual Report | | 29 |
Financial highlights (cont’d)
| 1 | Per share amounts have been calculated using the average shares method. |
| 2 | For the six months ended June 30, 2020 (unaudited). |
| 3 | The actual source of the Fund’s current fiscal year distributions may be from net investment income, return of capital or a combination of both. Shareholders will be informed of the tax characteristics of the distributions after the close of the fiscal year. |
| 4 | Performance figures may reflect compensating balance arrangements, fee waivers and/or expense reimbursements. In the absence of compensating balance arrangements, fee waivers and/or expense reimbursements, the total return would have been lower. Past performance is no guarantee of future results. Total returns for periods of less than one year are not annualized. |
| 5 | The total return calculation assumes that distributions are reinvested at NAV. Past performance is no guarantee of future results. Total returns for periods of less than one year are not annualized. |
| 6 | The total return calculation assumes that distributions are reinvested in accordance with the Fund’s dividend reinvestment plan. Past performance is no guarantee of future results. Total returns for periods of less than one year are not annualized. |
| 8 | Included in the expense ratios are certain non-recurring reorganization fees that were incurred by the Fund during the period. Without these fees, the gross and net expense ratios would have been 1.82% and 1.78%, respectively, for the year ended December 31, 2017 and would both have been 1.52% for the year ended December 31, 2016. |
| 9 | Reflects fee waivers and/or expense reimbursements. |
| 10 | Represents value of net assets plus the loan outstanding at the end of the period divided by the loan outstanding at the end of the period. |
See Notes to Financial Statements.
| | |
| 30 | | Western Asset Emerging Markets Debt Fund Inc. 2020 Semi-Annual Report |
Notes to financial statements (unaudited)
1. Organization and significant accounting policies
Western Asset Emerging Markets Debt Fund Inc. (the “Fund”) was incorporated in Maryland on April 16, 2003 and is registered as a non-diversified, closed-end management investment company under the Investment Company Act of 1940, as amended (the “1940 Act”). The Board of Directors authorized 100 million shares of $0.001 par value common stock. The Fund’s primary investment objective is to seek high current income and the Fund’s secondary objective is to seek capital appreciation. On April 1, 2020, the Board of Directors of the Fund approved amendments to the Fund’s bylaws. The amended and restated bylaws were subsequently filed on Form 8-K and are available on the Securities and Exchange Commission’s website at www.sec.gov.
The following are significant accounting policies consistently followed by the Fund and are in conformity with U.S. generally accepted accounting principles (“GAAP”). Estimates and assumptions are required to be made regarding assets, liabilities and changes in net assets resulting from operations when financial statements are prepared. Changes in the economic environment, financial markets and any other parameters used in determining these estimates could cause actual results to differ. Subsequent events have been evaluated through the date the financial statements were issued.
(a) Investment valuation. The valuations for fixed income securities (which may include, but are not limited to, corporate, government, municipal, mortgage-backed, collateralized mortgage obligations and asset-backed securities) and certain derivative instruments are typically the prices supplied by independent third party pricing services, which may use market prices or broker/dealer quotations or a variety of valuation techniques and methodologies. The independent third party pricing services use inputs that are observable such as issuer details, interest rates, yield curves, prepayment speeds, credit risks/spreads, default rates and quoted prices for similar securities. Investments in open-end funds are valued at the closing net asset value per share of each fund on the day of valuation. Futures contracts are valued daily at the settlement price established by the board of trade or exchange on which they are traded. Equity securities for which market quotations are available are valued at the last reported sales price or official closing price on the primary market or exchange on which they trade. When the Fund holds securities or other assets that are denominated in a foreign currency, the Fund will normally use the currency exchange rates as of 4:00 p.m. (Eastern Time). If independent third party pricing services are unable to supply prices for a portfolio investment, or if the prices supplied are deemed by the manager to be unreliable, the market price may be determined by the manager using quotations from one or more broker/dealers or at the transaction price if the security has recently been purchased and no value has yet been obtained from a pricing service or pricing broker. When reliable prices are not readily available, such as when the value of a security has been significantly affected by events after the close of the exchange or market on which the security is principally traded, but before the Fund calculates its net asset value, the Fund values these securities as determined in accordance with procedures approved by the Fund’s Board of Directors.
| | |
| Western Asset Emerging Markets Debt Fund Inc. 2020 Semi-Annual Report | | 31 |
Notes to financial statements (unaudited) (cont’d)
The Board of Directors is responsible for the valuation process and has delegated the supervision of the daily valuation process to the Legg Mason North Atlantic Fund Valuation Committee (the “Valuation Committee”). The Valuation Committee, pursuant to the policies adopted by the Board of Directors, is responsible for making fair value determinations, evaluating the effectiveness of the Fund’s pricing policies, and reporting to the Board of Directors. When determining the reliability of third party pricing information for investments owned by the Fund, the Valuation Committee, among other things, conducts due diligence reviews of pricing vendors, monitors the daily change in prices and reviews transactions among market participants.
The Valuation Committee will consider pricing methodologies it deems relevant and appropriate when making fair value determinations. Examples of possible methodologies include, but are not limited to, multiple of earnings; discount from market of a similar freely traded security; discounted cash-flow analysis; book value or a multiple thereof; risk premium/yield analysis; yield to maturity; and/or fundamental investment analysis. The Valuation Committee will also consider factors it deems relevant and appropriate in light of the facts and circumstances. Examples of possible factors include, but are not limited to, the type of security; the issuer’s financial statements; the purchase price of the security; the discount from market value of unrestricted securities of the same class at the time of purchase; analysts’ research and observations from financial institutions; information regarding any transactions or offers with respect to the security; the existence of merger proposals or tender offers affecting the security; the price and extent of public trading in similar securities of the issuer or comparable companies; and the existence of a shelf registration for restricted securities.
For each portfolio security that has been fair valued pursuant to the policies adopted by the Board of Directors, the fair value price is compared against the last available and next available market quotations. The Valuation Committee reviews the results of such back testing monthly and fair valuation occurrences are reported to the Board of Directors quarterly.
The Fund uses valuation techniques to measure fair value that are consistent with the market approach and/or income approach, depending on the type of security and the particular circumstance. The market approach uses prices and other relevant information generated by market transactions involving identical or comparable securities. The income approach uses valuation techniques to discount estimated future cash flows to present value.
| | |
| 32 | | Western Asset Emerging Markets Debt Fund Inc. 2020 Semi-Annual Report |
GAAP establishes a disclosure hierarchy that categorizes the inputs to valuation techniques used to value assets and liabilities at measurement date. These inputs are summarized in the three broad levels listed below:
| • | | Level 1 — quoted prices in active markets for identical investments |
| • | | Level 2 — other significant observable inputs (including quoted prices for similar investments, interest rates, prepayment speeds, credit risk, etc.) |
| • | | Level 3 — significant unobservable inputs (including the Fund’s own assumptions in determining the fair value of investments) |
The inputs or methodologies used to value securities are not necessarily an indication of the risk associated with investing in those securities.
The following is a summary of the inputs used in valuing the Fund’s assets and liabilities carried at fair value:
| | | | | | | | | | | | | | | | |
| ASSETS | |
| Description | | Quoted Prices (Level 1) | | | Other Significant Observable Inputs (Level 2) | | | Significant Unobservable Inputs (Level 3) | | | Total | |
| Long-Term Investments†: | | | | | | | | | | | | | | | | |
Sovereign Bonds | | | — | | | $ | 727,710,273 | | | | — | | | $ | 727,710,273 | |
Corporate Bonds & Notes | | | — | | | | 470,325,527 | | | | — | | | | 470,325,527 | |
Non-U.S. Treasury Inflation Protected Securities | | | — | | | | 540,300 | | | | — | | | | 540,300 | |
Purchased Options | | | — | | | | 77,122 | | | | — | | | | 77,122 | |
| Total Long-Term Investments | | | — | | | | 1,198,653,222 | | | | — | | | | 1,198,653,222 | |
| Short-Term Investments† | | $ | 4,138,264 | | | | — | | | | — | | | | 4,138,264 | |
| Total Investments | | $ | 4,138,264 | | | $ | 1,198,653,222 | | | | — | | | $ | 1,202,791,486 | |
| Other Financial Instruments: | | | | | | | | | | | | | | | | |
Forward Foreign Currency Contracts | | | — | | | $ | 2,353,605 | | | | — | | | $ | 2,353,605 | |
| Total | | $ | 4,138,264 | | | $ | 1,201,006,827 | | | | — | | | $ | 1,205,145,091 | |
| | |
| Western Asset Emerging Markets Debt Fund Inc. 2020 Semi-Annual Report | | 33 |
Notes to financial statements (unaudited) (cont’d)
| | | | | | | | | | | | | | | | |
| LIABILITIES | |
| Description | | Quoted Prices (Level 1) | | | Other Significant Observable Inputs (Level 2) | | | Significant Unobservable Inputs (Level 3) | | | Total | |
| Other Financial Instruments: | | | | | | | | | | | | | | | | |
Written Options | | | — | | | $ | 250,885 | | | | — | | | $ | 250,885 | |
Futures Contracts | | $ | 332,784 | | | | — | | | | — | | | | 332,784 | |
Forward Foreign Currency Contracts | | | — | | | | 7,478,991 | | | | — | | | | 7,478,991 | |
Centrally Cleared Credit Default Swaps on Sovereign Issues — Buy Protection | | | — | | | | 1,668,100 | | | | — | | | | 1,668,100 | |
| Total | | $ | 332,784 | | | $ | 9,397,976 | | | | — | | | $ | 9,730,760 | |
| † | See Schedule of Investments for additional detailed categorizations. |
(b) Purchased options. When the Fund purchases an option, an amount equal to the premium paid by the Fund is recorded as an investment on the Statement of Assets and Liabilities, the value of which is marked-to-market to reflect the current market value of the option purchased. If the purchased option expires, the Fund realizes a loss equal to the amount of premium paid. When an instrument is purchased or sold through the exercise of an option, the related premium paid is added to the basis of the instrument acquired or deducted from the proceeds of the instrument sold. The risk associated with purchasing put and call options is limited to the premium paid.
(c) Written options. When the Fund writes an option, an amount equal to the premium received by the Fund is recorded as a liability, the value of which is marked-to-market daily to reflect the current market value of the option written. If the option expires, the premium received is recorded as a realized gain. When a written call option is exercised, the difference between the premium received plus the option exercise price and the Fund’s basis in the underlying security (in the case of a covered written call option), or the cost to purchase the underlying security (in the case of an uncovered written call option), including brokerage commission, is recognized as a realized gain or loss. When a written put option is exercised, the amount of the premium received is subtracted from the cost of the security purchased by the Fund from the exercise of the written put option to form the Fund’s basis in the underlying security purchased. The writer or buyer of an option traded on an exchange can liquidate the position before the exercise of the option by entering into a closing transaction. The cost of a closing transaction is deducted from the original premium received resulting in a realized gain or loss to the Fund.
The risk in writing a covered call option is that the Fund may forego the opportunity of profit if the market price of the underlying security increases and the option is exercised. The risk in writing a put option is that the Fund may incur a loss if the market price of the underlying
| | |
| 34 | | Western Asset Emerging Markets Debt Fund Inc. 2020 Semi-Annual Report |
security decreases and the option is exercised. The risk in writing an uncovered call option is that the Fund is exposed to the risk of loss if the market price of the underlying security increases. In addition, there is the risk that the Fund may not be able to enter into a closing transaction because of an illiquid secondary market.
(d) Futures contracts. The Fund uses futures contracts generally to gain exposure to, or hedge against, changes in interest rates or gain exposure to, or hedge against, changes in certain asset classes. A futures contract represents a commitment for the future purchase or sale of an asset at a specified price on a specified date.
Upon entering into a futures contract, the Fund is required to deposit cash or securities with a broker in an amount equal to a certain percentage of the contract amount. This is known as the ‘‘initial margin’’ and subsequent payments (‘‘variation margin’’) are made or received by the Fund each day, depending on the daily fluctuation in the value of the contract. For certain futures, including foreign denominated futures, variation margin is not settled daily, but is recorded as a net variation margin payable or receivable. The daily changes in contract value are recorded as unrealized gains or losses in the Statement of Operations and the Fund recognizes a realized gain or loss when the contract is closed.
Futures contracts involve, to varying degrees, risk of loss in excess of the amounts reflected in the financial statements. In addition, there is the risk that the Fund may not be able to enter into a closing transaction because of an illiquid secondary market.
(e) Forward foreign currency contracts. The Fund enters into a forward foreign currency contract to hedge against foreign currency exchange rate risk on its non-U.S. dollar denominated securities or to facilitate settlement of a foreign currency denominated portfolio transaction. A forward foreign currency contract is an agreement between two parties to buy and sell a currency at a set price with delivery and settlement at a future date. The contract is marked-to-market daily and the change in value is recorded by the Fund as an unrealized gain or loss. When a forward foreign currency contract is closed, through either delivery or offset by entering into another forward foreign currency contract, the Fund recognizes a realized gain or loss equal to the difference between the value of the contract at the time it was opened and the value of the contract at the time it is closed.
Non-deliverable forward foreign currency exchange contracts are settled with the counterparty in cash without the delivery of foreign currency.
Forward foreign currency contracts involve elements of market risk in excess of the amounts reflected on the Statement of Assets and Liabilities. The Fund bears the risk of an unfavorable change in the foreign exchange rate underlying the forward foreign currency contract. Risks may also arise upon entering into these contracts from the potential inability of the counterparties to meet the terms of their contracts.
| | |
| Western Asset Emerging Markets Debt Fund Inc. 2020 Semi-Annual Report | | 35 |
Notes to financial statements (unaudited) (cont’d)
(f) Swap agreements. The Fund invests in swaps for the purpose of managing its exposure to interest rate, credit or market risk, or for other purposes. The use of swaps involves risks that are different from those associated with other portfolio transactions. Swap agreements are privately negotiated in the over-the-counter market and may be entered into as a bilateral contract (“OTC Swaps”) or centrally cleared (“Centrally Cleared Swaps”). Unlike Centrally Cleared Swaps, the Fund has credit exposure to the counterparties of OTC Swaps.
In a Centrally Cleared Swap, immediately following execution of the swap, the swap agreement is submitted to a clearinghouse or central counterparty (the “CCP”) and the CCP becomes the ultimate counterparty of the swap agreement. The Fund is required to interface with the CCP through a broker, acting in an agency capacity. All payments are settled with the CCP through the broker. Upon entering into a Centrally Cleared Swap, the Fund is required to deposit initial margin with the broker in the form of cash or securities.
Swap contracts are marked-to-market daily and changes in value are recorded as unrealized appreciation (depreciation). The daily change in valuation of Centrally Cleared Swaps, if any, is recorded as a net receivable or payable for variation margin on the Statement of Assets and Liabilities. Gains or losses are realized upon termination of the swap agreement. Collateral, in the form of restricted cash or securities, may be required to be held in segregated accounts with the Fund’s custodian in compliance with the terms of the swap contracts. Securities posted as collateral for swap contracts are identified in the Schedule of Investments and restricted cash, if any, is identified on the Statement of Assets and Liabilities. Risks may exceed amounts recorded in the Statement of Assets and Liabilities. These risks include changes in the returns of the underlying instruments, failure of the counterparties to perform under the contracts’ terms, and the possible lack of liquidity with respect to the swap agreements.
OTC swap payments received or made at the beginning of the measurement period are reflected as a premium or deposit, respectively, on the Statement of Assets and Liabilities. These upfront payments are amortized over the life of the swap and are recognized as realized gain or loss in the Statement of Operations. Net periodic payments received or paid by the Fund are recognized as a realized gain or loss in the Statement of Operations.
The Fund’s maximum exposure in the event of a defined credit event on a credit default swap to sell protection is the notional amount. As of June 30, 2020, the Fund did not hold any credit default swaps to sell protection.
For average notional amounts of swaps held during the six months ended June 30, 2020, see Note 4.
Credit default swaps
The Fund enters into credit default swap (“CDS”) contracts for investment purposes, to manage its credit risk or to add leverage. CDS agreements involve one party making a
| | |
| 36 | | Western Asset Emerging Markets Debt Fund Inc. 2020 Semi-Annual Report |
stream of payments to another party in exchange for the right to receive a specified return in the event of a default by a third party, typically corporate or sovereign issuers, on a specified obligation, or in the event of a write-down, principal shortfall, interest shortfall or default of all or part of the referenced entities comprising a credit index. The Fund may use a CDS to provide protection against defaults of the issuers (i.e., to reduce risk where the Fund has exposure to an issuer) or to take an active long or short position with respect to the likelihood of a particular issuer’s default. As a seller of protection, the Fund generally receives an upfront payment or a stream of payments throughout the term of the swap provided that there is no credit event. If the Fund is a seller of protection and a credit event occurs, as defined under the terms of that particular swap agreement, the maximum potential amount of future payments (undiscounted) that the Fund could be required to make under a credit default swap agreement would be an amount equal to the notional amount of the agreement. These amounts of potential payments will be partially offset by any recovery of values from the respective referenced obligations. As a seller of protection, the Fund effectively adds leverage to its portfolio because, in addition to its total net assets, the Fund is subject to investment exposure on the notional amount of the swap. As a buyer of protection, the Fund generally receives an amount up to the notional value of the swap if a credit event occurs.
Implied spreads are the theoretical prices a lender receives for credit default protection. When spreads rise, market perceived credit risk rises and when spreads fall, market perceived credit risk falls. The implied credit spread of a particular referenced entity reflects the cost of buying/selling protection and may include upfront payments required to enter into the agreement. Wider credit spreads and decreasing market values, when compared to the notional amount of the swap, represent a deterioration of the referenced entity’s credit soundness and a greater likelihood or risk of default or other credit event occurring as defined under the terms of the agreement. Credit spreads utilized in determining the period end market value of credit default swap agreements on corporate or sovereign issues are disclosed in the Schedule of Investments and serve as an indicator of the current status of the payment/performance risk and represent the likelihood or risk of default for credit derivatives. For credit default swap agreements on asset-backed securities and credit indices, the quoted market prices and resulting values, particularly in relation to the notional amount of the contract as well as the annual payment rate, serve as an indication of the current status of the payment/performance risk.
The Fund’s maximum risk of loss from counterparty risk, as the protection buyer, is the fair value of the contract (this risk is mitigated by the posting of collateral by the counterparty to the Fund to cover the Fund’s exposure to the counterparty). As the protection seller, the Fund’s maximum risk is the notional amount of the contract. Credit default swaps are considered to have credit risk-related contingent features since they require payment by the protection seller to the protection buyer upon the occurrence of a defined credit event.
| | |
| Western Asset Emerging Markets Debt Fund Inc. 2020 Semi-Annual Report | | 37 |
Notes to financial statements (unaudited) (cont’d)
Entering into a CDS agreement involves, to varying degrees, elements of credit, market and documentation risk in excess of the related amounts recognized on the Statement of Assets and Liabilities. Such risks involve the possibility that there will be no liquid market for these agreements, that the counterparty to the agreement may default on its obligation to perform or disagree as to the meaning of the contractual terms in the agreement, and that there will be unfavorable changes in net interest rates.
(g) Repurchase agreements. The Fund may enter into repurchase agreements with institutions that its subadviser has determined are creditworthy. Each repurchase agreement is recorded at cost. Under the terms of a typical repurchase agreement, the Fund acquires a debt security subject to an obligation of the seller to repurchase, and of the Fund to resell, the security at an agreed-upon price and time, thereby determining the yield during the Fund’s holding period. When entering into repurchase agreements, it is the Fund’s policy that its custodian or a third party custodian, acting on the Fund’s behalf, take possession of the underlying collateral securities, the market value of which, at all times, at least equals the principal amount of the repurchase transaction, including accrued interest. To the extent that any repurchase transaction maturity exceeds one business day, the value of the collateral is marked-to-market and measured against the value of the agreement in an effort to ensure the adequacy of the collateral. If the counterparty defaults, the Fund generally has the right to use the collateral to satisfy the terms of the repurchase transaction. However, if the market value of the collateral declines during the period in which the Fund seeks to assert its rights or if bankruptcy proceedings are commenced with respect to the seller of the security, realization of the collateral by the Fund may be delayed or limited.
(h) Reverse repurchase agreements. The Fund may enter into reverse repurchase agreements. Under the terms of a typical reverse repurchase agreement, a fund sells a security subject to an obligation to repurchase the security from the buyer at an agreed upon time and price. In the event the buyer of securities under a reverse repurchase agreement files for bankruptcy or becomes insolvent, the Fund’s use of the proceeds of the agreement may be restricted pending a determination by the counterparty, or its trustee or receiver, whether to enforce the Fund’s obligation to repurchase the securities. In entering into reverse repurchase agreements, the Fund will maintain cash, U.S. government securities or other liquid debt obligations at least equal in value to its obligations with respect to reverse repurchase agreements or will take other actions permitted by law to cover its obligations. If the market value of the collateral declines during the period, the Fund may be required to post additional collateral to cover its obligation. Cash collateral that has been pledged to cover obligations of the Fund under reverse repurchase agreements, if any, will be reported separately in the Statement of Assets and Liabilities. Securities pledged as collateral are noted in the Schedule of Investments. Interest payments made on reverse repurchase agreements are recognized as a component of “Interest expense” on the Statement of Operations. In periods of increased demand for the security, the Fund may receive a fee for use of the security by the counterparty, which may result in interest income to the Fund.
| | |
| 38 | | Western Asset Emerging Markets Debt Fund Inc. 2020 Semi-Annual Report |
(i) Securities traded on a when-issued and delayed delivery basis. The Fund may trade securities on a when-issued or delayed delivery basis. In when-issued and delayed delivery transactions, the securities are purchased or sold by the Fund with payment and delivery taking place in the future in order to secure what is considered to be an advantageous price and yield to the Fund at the time of entering into the transaction.
Purchasing such securities involves risk of loss if the value of the securities declines prior to settlement. These securities are subject to market fluctuations and their current value is determined in the same manner as for other securities.
(j) Inflation-indexed bonds. Inflation-indexed bonds are fixed income securities whose principal value or interest rate is periodically adjusted according to the rate of inflation. As the index measuring inflation changes, the principal value or interest rate of inflation-indexed bonds will be adjusted accordingly. Inflation adjustments to the principal amount of inflation-indexed bonds are reflected as an increase or decrease to investment income on the Statement of Operations. Repayment of the original bond principal upon maturity (as adjusted for inflation) is guaranteed in the case of U.S. Treasury inflation-indexed bonds. For bonds that do not provide a similar guarantee, the adjusted principal value of the bond repaid at maturity may be less than the original principal.
(k) Cash flow information. The Fund invests in securities and distributes dividends from net investment income and net realized gains, which are paid in cash and may be reinvested at the discretion of shareholders. These activities are reported in the Statement of Changes in Net Assets and additional information on cash receipts and cash payments are presented in the Statement of Cash Flows.
(l) Foreign currency translation. Investment securities and other assets and liabilities denominated in foreign currencies are translated into U.S. dollar amounts based upon prevailing exchange rates on the date of valuation. Purchases and sales of investment securities and income and expense items denominated in foreign currencies are translated into U.S. dollar amounts based upon prevailing exchange rates on the respective dates of such transactions.
The Fund does not isolate that portion of the results of operations resulting from fluctuations in foreign exchange rates on investments from the fluctuations arising from changes in market prices of securities held. Such fluctuations are included with the net realized and unrealized gain or loss on investments.
Net realized foreign exchange gains or losses arise from sales of foreign currencies, including gains and losses on forward foreign currency contracts, currency gains or losses realized between the trade and settlement dates on securities transactions, and the
| | |
| Western Asset Emerging Markets Debt Fund Inc. 2020 Semi-Annual Report | | 39 |
Notes to financial statements (unaudited) (cont’d)
difference between the amounts of dividends, interest, and foreign withholding taxes recorded on the Fund’s books and the U.S. dollar equivalent of the amounts actually received or paid. Net unrealized foreign exchange gains and losses arise from changes in the values of assets and liabilities, other than investments in securities, on the date of valuation, resulting from changes in exchange rates.
Foreign security and currency transactions may involve certain considerations and risks not typically associated with those of U.S. dollar denominated transactions as a result of, among other factors, the possibility of lower levels of governmental supervision and regulation of foreign securities markets and the possibility of political or economic instability.
(m) Credit and market risk. The Fund invests in high-yield and emerging market instruments that are subject to certain credit and market risks. The yields of high-yield and emerging market debt obligations reflect, among other things, perceived credit and market risks. The Fund’s investments in securities rated below investment grade typically involve risks not associated with higher rated securities including, among others, greater risk related to timely and ultimate payment of interest and principal, greater market price volatility and less liquid secondary market trading. The consequences of political, social, economic or diplomatic changes may have disruptive effects on the market prices of investments held by the Fund. The Fund’s investments in non-U.S. dollar denominated securities may also result in foreign currency losses caused by devaluations and exchange rate fluctuations.
(n) Foreign investment risks. The Fund’s investments in foreign securities may involve risks not present in domestic investments. Since securities may be denominated in foreign currencies, may require settlement in foreign currencies or pay interest or dividends in foreign currencies, changes in the relationship of these foreign currencies to the U.S. dollar can significantly affect the value of the investments and earnings of the Fund. Foreign investments may also subject the Fund to foreign government exchange restrictions, expropriation, taxation or other political, social or economic developments, all of which affect the market and/or credit risk of the investments.
(o) Other risks. Consistent with its objective to seek high current income, the Fund may invest in instruments whose values and interest rates are linked to foreign currencies, interest rates, indices or some other financial indicator. The value at maturity or interest rates for these instruments will increase or decrease according to the change in the indicator to which they are indexed, amongst other factors. These securities are generally more volatile in nature, and the risk of loss of principal may be greater.
(p) Counterparty risk and credit-risk-related contingent features of derivative instruments. The Fund may invest in certain securities or engage in other transactions, where the Fund is exposed to counterparty credit risk in addition to broader market risks.
| | |
| 40 | | Western Asset Emerging Markets Debt Fund Inc. 2020 Semi-Annual Report |
The Fund may invest in securities of issuers, which may also be considered counterparties as trading partners in other transactions. This may increase the risk of loss in the event of default or bankruptcy by the counterparty or if the counterparty otherwise fails to meet its contractual obligations. The Fund’s subadviser attempts to mitigate counterparty risk by (i) periodically assessing the creditworthiness of its trading partners, (ii) monitoring and/or limiting the amount of its net exposure to each individual counterparty based on its assessment and (iii) requiring collateral from the counterparty for certain transactions. Market events and changes in overall economic conditions may impact the assessment of such counterparty risk by the subadviser. In addition, declines in the values of underlying collateral received may expose the Fund to increased risk of loss.
With exchange traded and centrally cleared derivatives, there is less counterparty risk to the Fund since the exchange or clearinghouse, as counterparty to such instruments, guarantees against a possible default. The clearinghouse stands between the buyer and the seller of the contract; therefore, the credit risk is limited to failure of the clearinghouse. While offset rights may exist under applicable law, the Fund does not have a contractual right of offset against a clearing broker or clearinghouse in the event of a default of the clearing broker or clearinghouse.
The Fund has entered into master agreements, such as an International Swaps and Derivatives Association, Inc. Master Agreement (“ISDA Master Agreement”) or similar agreement, with certain of its derivative counterparties that govern over-the-counter derivatives and provide for general obligations, representations, agreements, collateral posting terms, netting provisions in the event of default or termination and credit related contingent features. The credit related contingent features include, but are not limited to, a percentage decrease in the Fund’s net assets or NAV over a specified period of time. If these credit related contingent features were triggered, the derivatives counterparty could terminate the positions and demand payment or require additional collateral.
Under an ISDA Master Agreement, the Fund may, under certain circumstances, offset with the counterparty certain derivative financial instruments’ payables and/or receivables with collateral held and/or posted and create one single net payment. However, absent an event of default by the counterparty or a termination of the agreement, the terms of the ISDA Master Agreements do not result in an offset of reported amounts of financial assets and financial liabilities in the Statement of Assets and Liabilities across transactions between the Fund and the applicable counterparty. The enforceability of the right to offset may vary by jurisdiction.
Collateral requirements differ by type of derivative. Collateral or margin requirements are set by the broker or exchange clearinghouse for exchange traded derivatives while collateral terms are contract specific for over-the-counter traded derivatives. Cash collateral that has been pledged to cover obligations of the Fund under derivative contracts, if any, will be reported separately in the Statement of Assets and Liabilities. Securities pledged as collateral, if any, for the same purpose are noted in the Schedule of Investments.
| | |
| Western Asset Emerging Markets Debt Fund Inc. 2020 Semi-Annual Report | | 41 |
Notes to financial statements (unaudited) (cont’d)
As of June 30, 2020, the Fund held forward foreign currency contracts and OTC written options with credit related contingent features which had a liability position of $7,729,876. If a contingent feature in the master agreements would have been triggered, the Fund would have been required to pay this amount to its derivatives counterparties. As of June 30, 2020, the Fund had posted with its counterparties cash and/or securities as collateral to cover the net liability of these derivatives amounting to $3,990,000, which could be used to reduce the required payment.
At June 30, 2020, the Fund held non-cash collateral from JPMorgan Chase & Co. in the amount of $410,655. This amount could be used to reduce the Fund’s exposure to the counterparty in the event of default.
(q) Security transactions and investment income. Security transactions are accounted for on a trade date basis. Interest income (including interest income from payment-in-kind securities), adjusted for amortization of premium and accretion of discount, is recorded on the accrual basis. Dividend income is recorded on the ex-dividend date for dividends received in cash and/or securities. Foreign dividend income is recorded on the ex-dividend date or as soon as practicable after the Fund determines the existence of a dividend declaration after exercising reasonable due diligence. The cost of investments sold is determined by use of the specific identification method. To the extent any issuer defaults or a credit event occurs that impacts the issuer, the Fund may halt any additional interest income accruals and consider the realizability of interest accrued up to the date of default or credit event.
(r) Distributions to shareholders. Distributions from net investment income of the Fund, if any, are declared quarterly and paid on a monthly basis. Distributions of net realized gains, if any, are declared at least annually. Pursuant to its Managed Distribution Policy, the Fund intends to make regular monthly distributions to shareholders at a fixed rate per common share, which rate may be adjusted from time to time by the Fund’s Board of Directors. Under the Fund’s Managed Distribution Policy, if, for any monthly distribution, the value of the Fund’s net investment income and net realized capital gain is less than the amount of the distribution, the difference will be distributed from the Fund’s net assets (and may constitute a “return of capital”). The actual source of the Fund’s monthly distributions may be from net investment income, return of capital or a combination of both. Shareholders will be informed of the tax characteristics of the distributions after the close of the 2020 fiscal year. The Board of Directors may modify, terminate or suspend the Managed Distribution Policy at any time, including when certain events would make part of the return of capital taxable to shareholders. Any such modification, termination or suspension could have an adverse effect on the market price of the Fund’s shares. Distributions to shareholders of the Fund are recorded on the ex-dividend date and are determined in accordance with income tax regulations, which may differ from GAAP.
| | |
| 42 | | Western Asset Emerging Markets Debt Fund Inc. 2020 Semi-Annual Report |
(s) Compensating balance arrangements. The Fund has an arrangement with its custodian bank whereby a portion of the custodian’s fees is paid indirectly by credits earned on the Fund’s cash on deposit with the bank.
(t) Federal and other taxes. It is the Fund’s policy to comply with the federal income and excise tax requirements of the Internal Revenue Code of 1986 (the “Code”), as amended, applicable to regulated investment companies. Accordingly, the Fund intends to distribute its taxable income and net realized gains, if any, to shareholders in accordance with timing requirements imposed by the Code. Therefore, no federal or state income tax provision is required in the Fund’s financial statements.
Management has analyzed the Fund’s tax positions taken on income tax returns for all open tax years and has concluded that as of December 31, 2019, no provision for income tax is required in the Fund’s financial statements. The Fund’s federal and state income and federal excise tax returns for tax years for which the applicable statutes of limitations have not expired are subject to examination by the Internal Revenue Service and state departments of revenue.
Under the applicable foreign tax laws, a withholding tax may be imposed on interest, dividends and capital gains at various rates. Realized gains upon disposition of securities issued in or by certain foreign countries are subject to capital gains tax imposed by those countries. As of June 30, 2020, there were $243,807 of capital gains tax liabilities accrued on unrealized gains.
(u) Reclassification. GAAP requires that certain components of net assets be reclassified to reflect permanent differences between financial and tax reporting. These reclassifications have no effect on net assets or net asset value per share.
2. Investment management agreement and other transactions with affiliates
Legg Mason Partners Fund Advisor, LLC (“LMPFA”) is the Fund’s investment manager. Western Asset Management Company, LLC (“Western Asset”), Western Asset Management Company Limited (“Western Asset Limited”) and Western Asset Management Company Pte. Ltd. (“Western Asset Singapore”) are the Fund’s subadvisers. LMPFA, Western Asset, Western Asset Limited and Western Asset Singapore are wholly-owned subsidiaries of Legg Mason, Inc. (“Legg Mason”). As of July 31, 2020, LMPFA, Western Asset, Western Asset Limited and Western Asset Singapore are indirect, wholly-owned subsidiaries of Franklin Resources, Inc. (“Franklin Resources”).
Under the investment management agreement, the Fund pays an investment management fee, calculated daily and paid monthly, at an annual rate of 0.85% of the Fund’s average daily net assets plus the proceeds of any outstanding borrowings used for leverage and any proceeds from the issuance of preferred stock.
| | |
| Western Asset Emerging Markets Debt Fund Inc. 2020 Semi-Annual Report | | 43 |
Notes to financial statements (unaudited) (cont’d)
LMPFA provides administrative and certain oversight services to the Fund. LMPFA delegates to Western Asset the day-to-day portfolio management of the Fund. Western Asset Limited and Western Asset Singapore provide certain subadvisory services to the Fund relating to currency transactions and investments in non-U.S. dollar denominated debt securities. Western Asset Limited and Western Asset Singapore do not receive any compensation from the Fund and are compensated by Western Asset for their services to the Fund. For its services, LMPFA pays Western Asset a fee monthly, at an annual rate equal to 70% of the net management fee it receives from the Fund. In turn, Western Asset pays Western Asset Limited and Western Asset Singapore a monthly subadvisory fee in an amount equal to 100% of the management fee paid to Western Asset on the assets that Western Asset allocates to each such non-U.S. subadviser to manage.
During periods in which the Fund utilizes financial leverage, the fees paid to LMPFA will be higher than if the Fund did not utilize leverage because the fees are calculated as a percentage of the Fund’s assets, including those investments purchased with leverage.
During the six months ended June 30, 2020, fees waived and/or expenses reimbursed amounted to $29,113.
All officers and one Director of the Fund are employees of Legg Mason or its affiliates and do not receive compensation from the Fund.
3. Investments
During the six months ended June 30, 2020, the aggregate cost of purchases and proceeds from sales of investments (excluding short-term investments) were as follows:
| | | | |
| Purchases | | $ | 456,262,583 | |
| Sales | | | 479,890,035 | |
At June 30, 2020, the aggregate cost of investments and the aggregate gross unrealized appreciation and depreciation of investments for federal income tax purposes were substantially as follows:
| | | | | | | | | | | | | | | | |
| | | Cost/Premiums Paid (Received) | | | Gross Unrealized Appreciation | | | Gross Unrealized Depreciation | | | Net Unrealized Appreciation (Depreciation) | |
| Securities | | $ | 1,195,530,607 | | | $ | 102,655,778 | | | $ | (95,394,899) | | | $ | 7,260,879 | |
| Swap contracts | | | 1,182,018 | | | | — | | | | (1,668,100) | | | | (1,668,100) | |
| Written options | | | (241,296) | | | | 14,220 | | | | (23,809) | | | | (9,589) | |
| Futures contracts | | | — | | | | — | | | | (332,784) | | | | (332,784) | |
| Forward foreign currency contracts | | | — | | | | 2,353,605 | | | | (7,478,991) | | | | (5,125,386) | |
| | |
| 44 | | Western Asset Emerging Markets Debt Fund Inc. 2020 Semi-Annual Report |
Transactions in reverse repurchase agreements for the Fund during the six months ended June 30, 2020 were as follows:
| | | | |
Average Daily Balance* | | Weighted Average Interest Rate* | | Maximum Amount Outstanding |
| $68,269,544 | | 1.84% | | $126,773,037 |
| * | Averages based on the number of days that the Fund had reverse repurchase agreements outstanding. |
Interest rates on reverse repurchase agreements ranged from 0.70% to 2.40% during the six months ended June 30, 2020. Interest expense incurred on reverse repurchase agreements totaled $625,114.
4. Derivative instruments and hedging activities
Below is a table, grouped by derivative type, that provides information about the fair value and the location of derivatives within the Statement of Assets and Liabilities at June 30, 2020.
| | | | |
| ASSET DERIVATIVES1 | |
| | | Foreign Exchange Risk | |
| Purchased options2 | | $ | 77,122 | |
| Forward foreign currency contracts | | | 2,353,605 | |
| Total | | $ | 2,430,727 | |
| | | | | | | | | | | | | | | | |
| LIABILITY DERIVATIVES1 | |
| | | Interest Rate Risk | | | Foreign Exchange Risk | | | Credit Risk | | | Total | |
| Written options | | | — | | | $ | 250,885 | | | | — | | | $ | 250,885 | |
| Futures contracts3 | | $ | 332,784 | | | | — | | | | — | | | | 332,784 | |
| Centrally cleared swap contracts4 | | | — | | | | — | | | $ | 1,668,100 | | | | 1,668,100 | |
| Forward foreign currency contracts | | | — | | | | 7,478,991 | | | | — | | | | 7,478,991 | |
| Total | | $ | 332,784 | | | $ | 7,729,876 | | | $ | 1,668,100 | | | $ | 9,730,760 | |
| 1 | Generally, the balance sheet location for asset derivatives is receivables/net unrealized appreciation and for liability derivatives is payables/net unrealized depreciation. |
| 2 | Market value of purchased options is reported in Investments at value in the Statement of Assets and Liabilities. |
| 3 | Includes cumulative appreciation (depreciation) of futures contracts as reported in the Schedule of Investments. Only variation margin is reported within the receivables and/or payables on the Statement of Assets and Liabilities. |
| 4 | Includes cumulative appreciation (depreciation) of centrally cleared swap contracts as reported in the Schedule of Investments. Only variation margin is reported within the receivables and/or payables on the Statement of Assets and Liabilities. |
| | |
| Western Asset Emerging Markets Debt Fund Inc. 2020 Semi-Annual Report | | 45 |
Notes to financial statements (unaudited) (cont’d)
The following tables provide information about the effect of derivatives and hedging activities on the Fund’s Statement of Operations for the six months ended June 30, 2020. The first table provides additional detail about the amounts and sources of gains (losses) realized on derivatives during the period. The second table provides additional information about the change in unrealized appreciation (depreciation) resulting from the Fund’s derivatives and hedging activities during the period.
| | | | | | | | | | | | | | | | |
| AMOUNT OF REALIZED GAIN (LOSS) ON DERIVATIVES RECOGNIZED | |
| | | Interest Rate Risk | | | Foreign Exchange Risk | | | Credit Risk | | | Total | |
| Purchased options1 | | | — | | | $ | (2,471,273) | | | | — | | | $ | (2,471,273) | |
| Written options | | | — | | | | 2,549,337 | | | | — | | | | 2,549,337 | |
| Futures contracts | | $ | (9,803,543) | | | | — | | | | — | | | | (9,803,543) | |
| Swap contracts | | | — | | | | — | | | $ | (190,654) | | | | (190,654) | |
| Forward foreign currency contracts | | | — | | | | 959,459 | | | | — | | | | 959,459 | |
| Total | | $ | (9,803,543) | | | $ | 1,037,523 | | | $ | (190,654) | | | $ | (8,956,674) | |
| 1 | Net realized gain (loss) from purchased options is reported in Net Realized Gain (Loss) From Investment transactions in the Statement of Operations. |
| | | | | | | | | | | | | | | | |
| CHANGE IN UNREALIZED APPRECIATION (DEPRECIATION) ON DERIVATIVES RECOGNIZED | |
| | | Interest Rate Risk | | | Foreign Exchange Risk | | | Credit Risk | | | Total | |
| Purchased options1 | | | — | | | $ | 663,685 | | | | — | | | $ | 663,685 | |
| Written options | | | — | | | | (1,088,543) | | | | — | | | | (1,088,543) | |
| Futures contracts | | $ | (1,486,881) | | | | — | | | | — | | | | (1,486,881) | |
| Swap contracts | | | — | | | | — | | | $ | (1,668,100) | | | | (1,668,100) | |
| Forward foreign currency contracts | | | — | | | | (2,982,914) | | | | — | | | | (2,982,914) | |
| Total | | $ | (1,486,881) | | | $ | (3,407,772) | | | $ | (1,668,100) | | | $ | (6,562,753) | |
| 1 | The change in unrealized appreciation (depreciation) from purchased options is reported in the Change in Net Unrealized Appreciation (Depreciation) From Investments in the Statement of Operations. |
During the six months ended June 30, 2020, the volume of derivative activity for the Fund was as follows:
| | | | |
| | | Average Market
Value | |
| Purchased options | | $ | 894,876 | |
| Written options | | | 2,658,915 | |
| Futures contracts (to buy)† | | | 25,580 | |
| Futures contracts (to sell) | | | 130,040,345 | |
| Forward foreign currency contracts (to buy) | | | 56,481,530 | |
| Forward foreign currency contracts (to sell) | | | 158,773,869 | |
| Credit default swap contracts (to buy protection) | | | 22,514,286 | |
| † | At June 30, 2020, there were no open positions held in this derivative. |
| | |
| 46 | | Western Asset Emerging Markets Debt Fund Inc. 2020 Semi-Annual Report |
The following table presents the Fund’s OTC derivative assets and liabilities by counterparty net of amounts available for offset under an ISDA Master Agreement and net of the related collateral pledged (received) by the Fund as of June 30, 2020.
| | | | | | | | | | | | | | | | | | |
| Counterparty | | Gross Assets Subject to Master Agreements1 | | | Gross Liabilities Subject to Master Agreements1 | | | Net Assets (Liabilities) Subject to Master Agreements | | Collateral Pledged (Received)2,3 | | | Net Amount4,5 | |
| Bank of America N.A. | | $ | 1,432 | | | $ | (1,129,137) | | | $ (1,127,705) | | $ | 1,129,137 | | | $ | 1,432 | |
| Barclays Bank PLC | | | 1,486,430 | | | | (4,387,987) | | | (2,901,557) | | | 2,720,000 | | | | (181,557) | |
| BNP Paribas SA | | | 3,422 | | | | (3,592) | | | (170) | | | — | | | | (170) | |
| Citibank N.A. | | | 70,363 | | | | — | | | 70,363 | | | — | | | | 70,363 | |
| Goldman Sachs Group Inc. | | | 166,120 | | | | (162,214) | | | 3,906 | | | — | | | | 3,906 | |
| JPMorgan Chase & Co. | | | 702,960 | | | | (2,046,946) | | | (1,343,986) | | | (410,655) | | | | (1,754,641) | |
| Total | | $ | 2,430,727 | | | $ | (7,729,876) | | | $(5,299,149) | | $ | 3,438,482 | | | $ | (1,860,667) | |
| 1 | Absent an event of default or early termination, derivative assets and liabilities are presented gross and not offset in the Statement of Assets and Liabilities. |
| 2 | Gross amounts are not offset in the Statement of Assets and Liabilities. |
| 3 | In some instances, the actual collateral received and/or pledged may be more than the amount shown here due to overcollateralization. |
| 4 | Net amount may also include forward foreign currency exchange contracts that are not required to be collateralized. |
| 5 | Represents the net amount receivable (payable) from (to) the counterparty in the event of default. |
5. Loan
The Fund has a revolving credit agreement with Pershing LLC, which permits the Fund to borrow up to $395,000,000, subject to approval by Pershing LLC, and renews daily for a 180-day term unless notice to the contrary is given to the Fund. The interest on the loan outstanding, if any, is calculated at a variable rate based on the one-month LIBOR plus any applicable margin. To the extent of the borrowing outstanding, the Fund is required to maintain collateral in a special custody account at the Fund’s custodian on behalf of Pershing LLC. The Fund’s credit agreement contains customary covenants that, among other things, may limit the Fund’s ability to pay distributions in certain circumstances, incur additional debt, change its fundamental investment policies and engage in certain transactions, including mergers and consolidations, and require asset coverage ratios in addition to those required by the 1940 Act. In addition, the credit agreement may be subject to early termination under certain conditions and may contain other provisions that could limit the Fund’s ability to utilize borrowing under the agreement. Interest expense related to the loan for the six months ended June 30, 2020 was $2,289,109. For the six months ended
| | |
| Western Asset Emerging Markets Debt Fund Inc. 2020 Semi-Annual Report | | 47 |
Notes to financial statements (unaudited) (cont’d)
June 30, 2020, the Fund did not incur any commitment fee. At June 30, 2020, the Fund had $295,000,000 of borrowings outstanding per this credit agreement. For the six months ended June 30, 2020, the average daily loan balance was $295,000,000 and weighted average interest rate was 1.56%.
6. Distributions subsequent to June 30, 2020
The following distributions have been declared by the Fund’s Board of Directors and are payable subsequent to the period end of this report:
| | | | | | | | |
| Record Date | | Payable Date | | | Amount | |
| 6/23/2020 | | | 7/1/2020 | | | $ | 0.1000 | |
| 7/24/2020 | | | 8/3/2020 | | | $ | 0.1000 | |
| 8/24/2020 | | | 9/1/2020 | | | $ | 0.1000 | |
| 9/23/2020 | | | 10/1/2020 | | | $ | 0.0950 | |
| 10/23/2020 | | | 11/2/2020 | | | $ | 0.0950 | |
| 11/20/2020 | | | 12/1/2020 | | | $ | 0.0950 | |
7. Stock repurchase program
On November 16, 2015, the Fund announced that the Fund’s Board of Directors (the “Board”) had authorized the Fund to repurchase in the open market up to approximately 10% of the Fund’s outstanding common stock when the Fund’s shares are trading at a discount to net asset value. The Board has directed management of the Fund to repurchase shares of common stock at such times and in such amounts as management reasonably believes may enhance stockholder value. The Fund is under no obligation to purchase shares at any specific discount levels or in any specific amounts. During the six months ended June 30, 2020, the Fund did not repurchase any shares.
8. Deferred capital losses
As of December 31, 2019, the Fund had deferred capital losses of $178,526,173, which have no expiration date, that will be available to offset future taxable capital gains.
9. Other matters
The outbreak of the respiratory illness COVID-19 (commonly referred to as “coronavirus”) has continued to rapidly spread around the world, causing considerable uncertainty for the global economy and financial markets. The ultimate economic fallout from the pandemic, and the long-term impact on economies, markets, industries and individual issuers, are not known. The COVID-19 pandemic could adversely affect the value and liquidity of the Fund’s investments and negatively impact the Fund’s performance. In addition, the outbreak of COVID-19, and measures taken to mitigate its effects, could result in disruptions to the services provided to the Fund by its service providers.
* * *
| | |
| 48 | | Western Asset Emerging Markets Debt Fund Inc. 2020 Semi-Annual Report |
The Fund’s investments, payment obligations, and financing terms may be based on floating rates, such as the London Interbank Offered Rate, or “LIBOR,” which is the offered rate for short-term Eurodollar deposits between major international banks. Plans are underway to phase out the use of LIBOR by the end of 2021. There remains uncertainty regarding the nature of any replacement rate and the impact of the transition from LIBOR on the Fund’s transactions and the financial markets generally. As such, the potential effect of a transition away from LIBOR on the Fund or the Fund’s investments cannot yet be determined.
10. Subsequent event
On July 22, 2020, the Fund announced that, effective as of the date of the announcement, the Fund will seek to maintain an average portfolio duration between 20% above and 20% below the average duration of the JPMorgan Emerging Markets Bond Index Global Diversified, the Fund’s benchmark. The Fund’s prior duration policy was to maintain an average portfolio duration within one to nine years, based on management’s forecast for interest rates. Fund management believes this policy change provides appropriate flexibility when managing portfolio duration.
* * *
On August 14, 2020, the Fund announced that it has elected, by resolution unanimously adopted by the Fund’s Board of Directors, to be subject to the Maryland Control Share Acquisition Act (the “MCSAA”), effective immediately. The MCSAA protects the interests of all stockholders of a Maryland corporation by providing that any holder of “control shares” acquired in a “control share acquisition” will not be entitled to vote its shares unless the other stockholders of the corporation reinstate those voting rights at a meeting of stockholders by a vote of two-thirds of the votes entitled to be cast on the matter, excluding the “acquiring person” (i.e., the holder or group of holders acting in concert that acquires, or proposes to acquire, “control shares”) and any other holders of “interested shares” as defined in the MCSAA. Generally, “control shares” are shares that, when aggregated with shares already owned by an acquiring person, would entitle the acquiring person to exercise 10% or more, 33 1/3% or more, or a majority of the total voting power of shares entitled to vote in the election of directors.
Application of the MCSAA seeks to limit the ability of an acquiring person to achieve a short-term gain at the expense of the Fund’s ability to pursue its investment objective and policies and seek long-term value for the rest of the Fund’s stockholders. The above description of the MCSAA is only a high-level summary and does not purport to be complete. Investors should refer to the actual provisions of the MCSAA and the Fund’s bylaws for more information, including definitions of key terms, various exclusions and exemptions from the statute’s scope, and the procedures by which stockholders may approve the reinstatement of voting rights to holders of “control shares.”
| | |
| Western Asset Emerging Markets Debt Fund Inc. 2020 Semi-Annual Report | | 49 |
Board approval of new management and
new subadvisory agreements (unaudited)
Background
On March 9, 2020, during a telephonic meeting of the Boards of Directors (each, a “Board” and each Board member, a “Director” or a “Board Member”) of the closed-end funds under the Board’s purview (each, a “Fund” and together, the “Funds”), Board Members discussed with management of Legg Mason, Inc. (“Legg Mason”) and certain representatives of Franklin Resources, Inc. and its subsidiaries (together, “Franklin Templeton”) the acquisition of Legg Mason by Franklin Templeton (the “Transaction”) and Franklin Templeton’s plans and intentions regarding the Funds and Legg Mason’s asset management business, including the preservation and continued investment autonomy of the investment advisory businesses conducted by Legg Mason’s separate investment advisory subsidiaries and the combination of Legg Mason’s and Franklin Templeton’s distribution resources. The Board of each Fund was advised that the Transaction, if completed, would constitute a change of control under the Investment Company Act of 1940, as amended (the “1940 Act”), that would result in the termination of the current management agreement between each Fund and Legg Mason Partners Fund Advisor, LLC (the “Manager”) (the “Current Management Agreements”) and the current subadvisory agreements with each Fund’s subadviser or subadvisers (each, a “Subadviser” and together, the “Subadvisers”) (the “Current Subadvisory Agreements”).
At meetings held on April 1, 2020 the Board of each Fund, including a majority of the Board Members who are not “interested persons” of the Fund or the Manager as defined in the 1940 Act (the “Independent Board Members”), approved the new management agreement between each Fund and the Manager (each, a “New Management Agreement”) and each new subadvisory agreement between each Fund’s Manager and its Subadviser or Subadvisers relating to the Fund (each, a “New Subadvisory Agreement”).1 (The New Management Agreement for a Fund and the New Subadvisory Agreement or Agreements for the Fund are referred to, collectively, as the “New Agreements,” the Current Management Agreement for a Fund and the Current Subadvisory Agreement or Agreements for the Fund are referred to, collectively, as the “Current Agreements,” and the Manager and the Subadviser or Subadvisers for a Fund are referred to, collectively, as the “Advisers.”)
At these meetings, which included meetings of the full Board of each Fund and separate meetings of the Independent Board Members, the Board considered, among other things, whether it would be in the best interests of each Fund and its respective shareholders to approve the New Agreements, and the anticipated impacts of the Transaction on the Funds
| 1 | This meeting was held telephonically in reliance on an exemptive order issued by the Securities and Exchange Commission on March 13, 2020. Reliance on the exemptive order is necessary and appropriate due to circumstances related to current or potential effects of COVID-19. All Board Members participating in the telephonic meeting were able to hear each other simultaneously during the meeting. Reliance on the exemptive order requires Board Members, including a majority of the Independent Board Members, to ratify actions taken pursuant to the exemptive order by vote cast at the next in-person meeting. |
| | |
| 50 | | Western Asset Emerging Markets Debt Fund Inc. |
and their shareholders. To assist the Board of each Fund in its consideration of the New Agreements, Franklin Templeton provided materials and information about Franklin Templeton, including its financial condition and asset management capabilities and organization, Legg Mason provided materials and information about Legg Mason, including performance and expense comparison data and profitability information by Fund and with respect to the Legg Mason fund complex as a whole, and Franklin Templeton and Legg Mason provided materials and information about the proposed Transaction between Legg Mason and Franklin Templeton.
Before and during the April 1, 2020 meetings, the Board of each Fund sought certain information as it deemed necessary and appropriate. In connection with their consideration of the New Agreements, the Independent Board Members worked with their independent legal counsel to prepare requests for additional information that were submitted to Franklin Templeton and Legg Mason. The requests for information of the Board of each Fund sought information relevant to the Board’s consideration of the New Agreements and other anticipated impacts of the Transaction on the Funds and their shareholders. Franklin Templeton and Legg Mason provided documents and information in response to these requests for information. Following their review of this information, the Independent Board Members requested additional information from Franklin Templeton and Legg Mason. Franklin Templeton and Legg Mason provided further information in response to these requests, which the Board of each Fund reviewed. Senior management representatives from Franklin Templeton and Legg Mason participated in a portion of each of these meetings and addressed various questions raised by the Board of each Fund.
At the April 1, 2020 meeting of the Board of each Fund, representatives of Legg Mason and Franklin Templeton made presentations to, and responded to questions from, the Board. After the presentations and after reviewing the written materials provided, the Independent Board Members met in executive session with their counsel to consider the New Agreements.
Board Approval of New Management Agreements and New Subadvisory Agreements
Each Fund’s Board’s evaluation of the New Agreements reflected the information provided specifically in connection with their review of the New Agreements, as well as, where relevant, information that was previously furnished to the Board in connection with the most recent renewal of the Current Agreements at in-person meetings held on November 14, 2019 and at other Board meetings throughout the prior year.
Among other things, the Board Members considered:
| (i) | the reputation, experience, financial strength and resources of Franklin Templeton and its investment advisory subsidiaries; |
| | |
| Western Asset Emerging Markets Debt Fund Inc. | | 51 |
Board approval of new management and
new subadvisory agreements (unaudited) (cont’d)
| (ii) | that Franklin Templeton has informed the Board of each Fund that it intends to maintain the investment autonomy of the Legg Mason investment advisory subsidiaries; |
| (iii) | that Franklin Templeton and Legg Mason have informed the Board of each Fund that, following the Transaction, there is not expected to be any diminution in the nature, quality and extent of services provided to the Funds and their shareholders by the Advisers, including compliance and other non-advisory services, and have represented that there are not expected to be any changes in the portfolio management personnel managing the Funds as a result of the Transaction; |
| (iv) | that Franklin Templeton and Legg Mason have informed the Board of each Fund regarding transition plans, including Legg Mason’s provision of retention incentives for certain Legg Mason corporate personnel until the Transaction closes, and Franklin Templeton’s provision of long-term retention mechanisms for certain personnel following the closing; |
| (v) | that there are not expected to be any changes to any Fund’s custodian or other service providers as a result of the Transaction; |
| (vi) | that Franklin Templeton has informed the Board of each Fund that it has no present intention to alter currently effective expense waivers and reimbursements after their expiration, and, while it reserves the right to do so in the future, it would consult with the applicable Fund’s Board before making any changes; |
| (vii) | that Franklin Templeton does not expect to propose any changes to the investment objective(s) of any Fund or any changes to the principal investment strategies of any Fund as a result of the Transaction; |
| (viii) | the potential benefits to Fund shareholders from being part of a combined fund family with Franklin Templeton-sponsored funds and access to a broader array of investment opportunities; |
| (ix) | that Franklin Templeton and Legg Mason will each derive benefits from the Transaction and that, as a result, they have a financial interest in the matters that were being considered; |
| (x) | the fact that each Fund’s contractual management fee rates will remain the same and will not increase by virtue of the New Agreements; |
| (xi) | the terms and conditions of the New Agreements, including that each New Agreement is identical to its corresponding Current Agreement except for their respective dates of execution, effectiveness and termination; |
| | |
| 52 | | Western Asset Emerging Markets Debt Fund Inc. |
| (xii) | the support expressed by the current senior management team at Legg Mason for the Transaction and Legg Mason’s recommendation that the Board of each Fund approve the New Agreements; |
| (xiii) | that the Current Agreements, except in the case of newer Funds, are the product of multiple years of review and negotiation and information received and considered by the applicable Fund’s Board in the exercise of their business judgment during those years, and that within the past six-months the Board of each Fund had performed a full review of and approved the Current Agreements as required by the 1940 Act and had determined in the exercise of the Board Members’ business judgment that each applicable Adviser had the capabilities, resources and personnel necessary to provide the services provided to each Fund, and that the management and subadvisory fees paid by or in respect of the Fund, taking into account any applicable agreed-upon fee reductions, represented reasonable compensation to the applicable Adviser in light of the services provided, the costs to the Adviser of providing those services, the fees and other expenses paid by similar funds, and such other matters as the Board Members considered relevant in the exercise of their business judgment, and represented an appropriate sharing between Fund shareholders and the Advisers of any economies of scale in the management of the Fund at current and anticipated asset levels; |
| (xiv) | that the Current Agreements were considered and approved as recently as November 2019, except in the case of one Fund, which is currently in the initial term of its agreement; |
| (xv) | that the Funds will not bear the costs of obtaining shareholder approval of the New Agreements, including proxy solicitation costs, legal fees and the costs of printing and mailing the proxy statement, regardless of whether the Transaction is consummated; and |
| (xvi) | that under the a definitive agreement between Legg Mason and Franklin Templeton (the “Transaction Agreement”), Franklin Templeton has acknowledged that Legg Mason had entered into the Transaction Agreement in reliance upon the benefits and protections provided by Section 15(f) of the 1940 Act, and that, in furtherance of the foregoing, Franklin Templeton agreed to use reasonable best efforts to conduct its business so that (a) for a period of not less than three years after the closing of the Transaction no more than 25% of the members of the Board of any Fund shall be “interested persons” (as defined in the 1940 Act) of any investment adviser for a Fund, and (b) for a period of not less than two years after the closing, neither Franklin Templeton nor any of its affiliates shall impose an “unfair burden” (within the meaning of the 1940 Act, including any interpretations or no-action letters of the Securities and Exchange Commission) on any Fund as a result of the transactions contemplated by the Transaction Agreement or any express or implied terms, conditions or understandings applicable thereto. |
| | |
| Western Asset Emerging Markets Debt Fund Inc. | | 53 |
Board approval of new management and
new subadvisory agreements (unaudited) (cont’d)
Certain of these considerations are discussed in more detail below.
In their deliberations, the Board Members considered information received in connection with the most recent approval or continuation of each Current Agreement in addition to information provided by Franklin Templeton and Legg Mason in connection with their evaluation of the terms and conditions of the New Agreements. In connection with the most recent approval or continuation of each Current Agreement, and in connection with their review of each New Agreement, the Board Members did not identify any particular information that was all-important or controlling, and each Board Member may have attributed different weights to the various factors. The Board Members evaluated all information available to them on a Fund-by-Fund basis with respect to their consideration of the Current Agreements and the New Agreements, and their determinations were made separately in respect of each Fund.
The information provided and presentations made to the Board of each Fund encompassed each Fund and all other Funds for which the Board has responsibility. The discussion below covers both the advisory and the administrative functions rendered by the Manager for each Fund, both of which functions are encompassed by the New Management Agreement for the Fund, as well as the advisory functions rendered by the Subadviser(s) pursuant to the New Subadvisory Agreement(s) for the Fund. The Independent Board Members of each Fund considered the New Management Agreement and the New Subadvisory Agreement(s) separately in the course of their review. In doing so, they considered the respective roles and compensation of the Manager and the Subadviser(s) in providing services to the Fund.
The Independent Board Members were advised by separate independent legal counsel throughout the process. Prior to voting, the Independent Board Members of each Fund received a memorandum from their independent legal counsel discussing the legal standards for their consideration of the New Agreements for the Fund. The Independent Board Members of each Fund, including Western Asset Emerging Markets Debt Fund Inc. (the “Western Asset Fund”), reviewed the proposed approval of the New Agreements for the Fund on multiple occasions with their independent legal counsel in private sessions at which no representatives of Franklin Templeton, Legg Mason, or the Manager or Subadviser(s) for the Fund were present.
Nature, Extent and Quality of the Services under the New Agreements
The Board of each Fund received and considered information regarding the nature, extent and quality of services provided to the Fund by the Manager and the Subadviser(s) under the Current Agreements. In evaluating the nature, quality and extent of the services to be provided by the Advisers under the New Agreements, the Board Members considered,
| | |
| 54 | | Western Asset Emerging Markets Debt Fund Inc. |
among other things, the expected impact, if any, of the Transaction on the operations, facilities, organization and personnel of each Adviser, and that Franklin Templeton and Legg Mason have advised the Board of each Fund that, following the Transaction, there is not expected to be any diminution in the nature, quality and extent of services provided to the Funds and their shareholders by the Advisers, including compliance and other non-advisory services, and that there are not expected to be any changes in portfolio management personnel as a result of the Transaction. In this regard, the Board of each Fund took into account that Franklin Templeton and Legg Mason have informed the Board regarding Legg Mason’s provision of retention incentives for certain Legg Mason corporate personnel until the Transaction closes, and Franklin Templeton’s provision of long-term retention mechanisms for certain personnel following the closing. The Board of each Fund has received information at regular meetings throughout the past year related to the services rendered by the Manager in its management of the Fund’s affairs and the Manager’s role in coordinating the activities of the Fund’s other service providers. Each Fund’s Board’s evaluation of the services provided by the Manager and the Subadviser(s) took into account the Board Members’ knowledge gained as Board Members of other Funds in the Legg Mason fund complex, including knowledge gained regarding the scope and quality of the investment management and other capabilities of the Manager and the Subadviser(s), and the quality of the Manager’s administrative and other services. The Board of each Fund observed that the scope of services provided by the Manager and the Subadviser(s), and the undertakings required of the Manager and Subadviser(s) in connection with those services, including maintaining and monitoring their own and the Fund’s compliance programs, liquidity management programs and cybersecurity programs, had expanded over time as a result of regulatory, market and other developments. The Board of each Fund has received and reviewed on a regular basis information from the Manager and the Subadviser(s) regarding the Fund’s compliance policies and procedures established pursuant to Rule 38a-1 under the 1940 Act, and took that information into account in its evaluation of the New Agreements. The Board of each Fund also considered the risks associated with the Fund borne by the Advisers and their affiliates (such as entrepreneurial, operational, reputational, litigation and regulatory risk), as well as the risk management processes of the Manager and Subadviser(s).
The Board of each Fund considered information provided by Franklin Templeton regarding its business and operating structure, scale of operation, leadership and reputation, distribution capabilities, and financial condition (pre-and post-closing).
The Board of each Fund also reviewed the qualifications, backgrounds and responsibilities of the senior personnel of the Manager and the Subadviser(s) and the team of investment professionals primarily responsible for the day-to-day portfolio management of the Fund. The Board of each Fund noted in particular that following the Transaction, Franklin Templeton is expected to have resources that will provide it with substantial capacity to
| | |
| Western Asset Emerging Markets Debt Fund Inc. | | 55 |
Board approval of new management and
new subadvisory agreements (unaudited) (cont’d)
invest across the business. The Board of each Fund also considered the financial resources of Legg Mason and Franklin Templeton and the importance of having a Fund manager with, or with access to, significant organizational and financial resources.
The Board also considered the benefits to each Fund of being part of a larger combined organization with greater financial resources following the Transaction, particularly during periods of market disruptions and volatility. In addition, the Board also considered Franklin Templeton’s significant experience in dealing with issues unique to the management of closed-end funds.
The Board of each Fund also considered the policies and practices of the Manager and the Subadvisers regarding the selection of brokers and dealers and the execution of portfolio transactions for the Fund.
The Board of each Fund received performance information for the Fund, as well as for a group of funds (the “Performance Universe”) selected by Broadridge Financial Solutions, Inc. (“Broadridge”), an independent provider of investment company data, based on classifications provided by Thomson Reuters Lipper (“Lipper”). The Board of each Fund was provided with a description of the methodology used to determine the similarity of the Fund with the funds included in the Performance Universe. It was noted that while the Board of each Fund has found the Broadridge data generally useful they recognized its limitations, including that the data may vary depending on the end date selected and that the results of the performance comparisons may vary depending on the selection of the peer group and its composition over time. It was also noted that the Board of each Fund has received and discussed with management information throughout the year at periodic intervals comparing the Fund’s performance against its benchmark and against the Fund’s peers. In addition, the Board of each Fund considered the Fund’s performance in light of overall financial market conditions. Where a Fund’s performance was below the median during one or more specified periods, the Fund’s Board noted the explanations from the Advisers concerning the Fund’s relative performance versus the peer group for the various periods
Based on their review of the materials provided and the assurances they had received from Franklin Templeton and Legg Mason, the Board Members of each Fund determined that the Transaction was not expected to affect adversely the nature, extent and quality of services provided by each Adviser and that the Transaction was not expected to have an adverse effect on the ability of the Advisers to provide those services, and the Board of each Fund, including the Western Asset Fund, concluded that, overall, the nature, extent and quality of services expected to be provided, including performance, under the New Agreements for the Fund were sufficient for approval.
| | |
| 56 | | Western Asset Emerging Markets Debt Fund Inc. |
Management Fees and Expense Ratios
The Board of each Fund considered that it had reviewed the Fund’s management fee and total expense ratio at the November 2019 contract renewal meeting. The Board of each Fund considered that the New Management Agreement does not change any Fund’s management fee rate or the computation method for calculating such fees, and that there is no present intention to alter expense waiver and reimbursement arrangements that are currently in effect. The Board of each Fund noted that by their terms none of the current expense waiver and reimbursement arrangements would expire before December 2020 and that Franklin Templeton had indicated that it would consult with the applicable Fund’s Board before making any changes to the Fund’s current expense waiver and reimbursement arrangements.
The Board of each Fund reviewed and considered the contractual management fee and the actual management fees paid by the Fund to the Manager in light of the nature, extent and quality of the management and subadvisory services to be provided by the Manager and the Subadviser(s). The Board of each Fund also noted that the compensation paid to the Subadviser(s) is the responsibility and expense of the Manager, or in some cases another Subadviser, and not the Fund. In addition, the Board of each Fund received and considered information provided by Broadridge comparing the contractual management fee and the actual management fee for the Fund, as well as the total actual expenses for the Fund, with those of funds in both the relevant expense group and a broader group of funds, each selected by Broadridge based on classifications provided by Lipper. It was noted that, while the Board of each Fund has found the Broadridge data generally useful, it recognized its limitations, including that the data may vary depending on the selection of the peer group. The Board of each Fund also considered the overall management fee, the fees of each Subadviser and the portion of the management fee retained by the Manager after payment of the subadvisory fees, in each case in light of the services rendered for those amounts. The Board of each Fund also received an analysis of Legg Mason complex-wide management fees for Funds with a similar strategy provided by the Manager, which, among other things, set out a framework of fees based on asset classes.
The Board of each Fund reviewed information regarding fees charged by the Manager and/or the Subadviser(s) to other U.S. clients investing primarily in an asset class similar to that of the Fund, including, where applicable, separate accounts. The Manager reviewed with the Board of each Fund the differences in services provided to these different types of accounts, including that the Fund is provided with certain administrative services, office facilities, and Fund officers (including the Fund’s chief executive, chief financial and chief compliance officers), and that the Manager coordinates and oversees the provision of services to the Fund by other Fund service providers. The Board of each Fund considered the fee comparisons in light of the differences in management of these different types of accounts and the differences in associated risks borne by the Advisers.
| | |
| Western Asset Emerging Markets Debt Fund Inc. | | 57 |
Board approval of new management and
new subadvisory agreements (unaudited) (cont’d)
In evaluating the costs of the services to be provided by the Advisers under the New Agreements, the Board Members considered, among other things, whether management fees or other expenses would change as a result of the Transaction. Based on their review of the materials provided and the assurances they had received from Franklin Templeton and Legg Mason, the Board Members determined that the Transaction would not increase the total fees payable by any Fund for management services.
Taking all of the above into consideration, as well as the factors identified below, the Board of each Fund, including the Western Asset Fund, determined that the management fee and the subadvisory fees for the Fund were reasonable in light of the nature, extent and quality of the services to be provided to the Fund under the New Agreements.
Profitability and Economies of Scale
The Board of each Fund received and considered an analysis of the profitability of the Manager and its affiliates in providing services to the Fund. The Board of each Fund also received profitability information with respect to the Legg Mason fund complex as a whole. In addition, the Board of each Fund received information with respect to the Manager’s allocation methodologies used in preparing this profitability data. It was noted that the allocation methodologies had been previously reviewed by an outside consultant. The profitability of the Manager and its affiliates was considered by each Fund’s Board not to be excessive in light of the nature, extent and quality of the services provided to the Fund, including the Western Asset Fund.
The Board of each Fund received and considered information concerning whether the Advisers realize economies of scale as the Fund’s assets grow. In conjunction with their most recent or prior deliberations concerning the Current Agreements, the Board Members have noted that advisory or management fee reductions had been implemented for certain Funds, as well as expense limitations, and that after taking those reductions and expense limitations into account, the Board Members had determined that the total fees for management services, and administrative services for the applicable Funds, were reasonable in light of the services provided to the Funds, including the Western Asset Fund, and that any economies of scale were being shared appropriately.
The Board Members noted that Franklin Templeton and Legg Mason expected to realize cost savings from the Transaction based on synergies of operations, primarily at the holding company distribution level, as well as to benefit from possible growth of the Funds resulting from enhanced distribution capabilities. The Board of each Fund took into account that cost synergies were not the primary driver of the Transaction. However, they noted that other factors could also affect profitability and potential economies of scale, and that it was not possible to predict with any degree of certainty how the Transaction would affect the Advisers’ profitability from their relationship with the Funds, nor to quantify at this time any possible future economies of scale. The Board Members noted they will have the opportunity to periodically re-examine such profitability and any economies of scale going forward.
| | |
| 58 | | Western Asset Emerging Markets Debt Fund Inc. |
Other Benefits to the Advisers
The Board of each Fund considered other benefits received by the Manager, the Subadviser(s) and their affiliates as a result of their relationship with the Fund, including the opportunity to offer additional products and services to Fund shareholders. In light of the costs of providing investment management and other services to the Funds and the ongoing commitment of the Manager and the Subadviser(s) to the Funds, the Board of each Fund considered that the ancillary benefits that the Manager, the Subadviser(s) and their affiliates received as a result of their relationship with the Fund, including the Western Asset Fund, were reasonable. In evaluating the fall-out benefits to be received by the Advisers under the New Agreements, the Board Members considered whether the Transaction would have an impact on the fall-out benefits received by virtue of the Current Agreements.
The Board of each Fund considered that Franklin Templeton may derive reputational and other benefits from its ability to use the Legg Mason investment affiliates’ names in connection with operating and marketing the Funds. The Board of each Fund considered that the Transaction, if completed, would significantly increase Franklin Templeton’s assets under management and expand Franklin Templeton’s investment capabilities.
Conclusion
After consideration of the factors described above as well as other factors, and in the exercise of their business judgment, the Board Members, including the Independent Board Members, concluded that the New Agreements, including the fees payable thereunder, were fair and reasonable to each Fund and that entering into the New Agreements for each Fund, including the Western Asset Fund, was in the best interests of the Fund’s shareholders, and they voted to approve the New Agreements for each Fund and to recommend that the Fund’s shareholders approve the New Agreements.
| | |
| Western Asset Emerging Markets Debt Fund Inc. | | 59 |
Additional shareholder information (unaudited)
Results of special meeting of shareholders
A Special Meeting of Shareholders of Western Asset Emerging Markets Debt Fund Inc. was held on June 5, 2020 for the purpose of considering and voting upon the proposals presented at the Meeting. The following provides information concerning the matters voted upon at the Meeting:
A Proposal to Approve a New Management Agreement with Legg Mason Partners Fund Advisor, LLC.
A proposal to approve a new management agreement with Legg Mason Partners Fund Advisor, LLC
| | | | | | | | | | | | |
| For | | Against | | | Abstain | | | Broker Non-Votes | |
| 31,821,732 | | | 664,523 | | | | 540,585 | | | | — | |
A Proposal to Approve a New Subadvisory Agreement with Western Asset Management Company, LLC.
A proposal to approve a new subadvisory agreement with Western Asset Management Company, LLC.
| | | | | | | | | | | | |
| For | | Against | | | Abstain | | | Broker Non-Votes | |
| 31,784,274 | | | 673,635 | | | | 568,931 | | | | — | |
A Proposal to Approve a New Subadvisory Agreement with Western Asset Management Company Limited.
A proposal to approve a new subadvisory agreement with Western Asset Management Company Limited.
| | | | | | | | | | | | |
| For | | Against | | | Abstain | | | Broker Non-Votes | |
| 31,778,790 | | | 677,173 | | | | 570,877 | | | | — | |
A Proposal to Approve a New Subadvisory Agreement with Western Asset Management Company Pte. Ltd.
A proposal to approve a new subadvisory agreement with Western Asset Management Company Pte. Ltd.
| | | | | | | | | | | | |
| For | | Against | | | Abstain | | | Broker Non-Votes | |
| 31,765,351 | | | 667,382 | | | | 594,107 | | | | — | |
| | |
| 60 | | Western Asset Emerging Markets Debt Fund Inc. |
Dividend reinvestment plan (unaudited)
Unless you elect to receive distributions in cash (i.e., opt-out), all dividends, including any capital gain dividends and return of capital distributions, on your Common Stock will be automatically reinvested by Computershare Trust Company, N.A., as agent for the stockholders (the “Plan Agent”), in additional shares of Common Stock under the Fund’s Dividend Reinvestment Plan (the “Plan”). You may elect not to participate in the Plan by contacting the Plan Agent. If you do not participate, you will receive all cash distributions paid by check mailed directly to you by Computershare Trust Company, N.A., as dividend paying agent.
If you participate in the Plan, the number of shares of Common Stock you will receive will be determined as follows:
(1) If the market price of the Common Stock (plus $0.03 per share commission) on the payment date (or, if the payment date is not a NYSE trading day, the immediately preceding trading day) is equal to or exceeds the net asset value per share of the Common Stock at the close of trading on the NYSE on the payment date, the Fund will issue new Common Stock at a price equal to the greater of (a) the net asset value per share at the close of trading on the NYSE on the payment date or (b) 95% of the market price per share of the Common Stock on the payment date.
(2) If the net asset value per share of the Common Stock exceeds the market price of the Common Stock (plus $0.03 per share commission) at the close of trading on the NYSE on the payment date, the Plan Agent will receive the dividend or distribution in cash and will buy Common Stock in the open market, on the NYSE or elsewhere, for your account as soon as practicable commencing on the trading day following the payment date and terminating no later than the earlier of (a) 30 days after the dividend or distribution payment date, or (b) the payment date for the next succeeding dividend or distribution to be made to the stockholders; except when necessary to comply with applicable provisions of the federal securities laws. If during this period: (i) the market price (plus $0.03 per share commission) rises so that it equals or exceeds the net asset value per share of the Common Stock at the close of trading on the NYSE on the payment date before the Plan Agent has completed the open market purchases or (ii) if the Plan Agent is unable to invest the full amount eligible to be reinvested in open market purchases, the Plan Agent will cease purchasing Common Stock in the open market and the Fund shall issue the remaining Common Stock at a price per share equal to the greater of (a) the net asset value per share at the close of trading on the NYSE on the day prior to the issuance of shares for reinvestment or (b) 95% of the then current market price per share.
Common Stock in your account will be held by the Plan Agent in non-certificated form. Any proxy you receive will include all shares of Common Stock you have received under the Plan. You may withdraw from the Plan (i.e., opt-out) by notifying the Plan Agent in writing at 462 South 4th Street, Suite 1600, Louisville, KY 40202 or by calling the Plan Agent at 1-888-888-0151. Such withdrawal will be effective immediately if notice is received by the Plan Agent not less than ten business days prior to any dividend or distribution record date; otherwise such withdrawal will be effective as soon as practicable after the Plan Agent’s investment of the most recently declared dividend or distribution on the Common Stock.
| | |
| Western Asset Emerging Markets Debt Fund Inc. | | 61 |
Dividend reinvestment plan (unaudited) (cont’d)
Plan participants who sell their shares will be charged a service charge (currently $5.00 per transaction) and the Plan Agent is authorized to deduct brokerage charges actually incurred from the proceeds (currently $0.05 per share commission). There is no service charge for reinvestment of your dividends or distributions in Common Stock. However, all participants will pay a pro rata share of brokerage commissions incurred by the Plan Agent when it makes open market purchases. Because all dividends and distributions will be automatically reinvested in additional shares of Common Stock, this allows you to add to your investment through dollar cost averaging, which may lower the average cost of your Common Stock over time. Dollar cost averaging is a technique for lowering the average cost per share over time if the Fund’s net asset value declines. While dollar cost averaging has definite advantages, it cannot assure profit or protect against loss in declining markets.
Automatically reinvesting dividends and distributions does not mean that you do not have to pay income taxes due upon receiving dividends and distributions. Investors will be subject to income tax on amounts reinvested under the Plan.
The Fund reserves the right to amend or terminate the Plan if, in the judgment of the Board of Directors, the change is warranted. The Plan may be terminated, amended or supplemented by the Fund upon notice in writing mailed to stockholders at least 30 days prior to the record date for the payment of any dividend or distribution by the Fund for which the termination or amendment is to be effective. Upon any termination, you will be sent cash for any fractional share of Common Stock in your account. You may elect to notify the Plan Agent in advance of such termination to have the Plan Agent sell part or all of your Common Stock on your behalf. Additional information about the Plan and your account may be obtained from the Plan Agent at 462 South 4th Street, Suite 1600, Louisville, KY 40202 or by calling the Plan Agent at 1-888-888-0151.
| | |
| 62 | | Western Asset Emerging Markets Debt Fund Inc. |
Western Asset
Emerging Markets Debt Fund Inc.
Directors
Robert D. Agdern
Carol L. Colman
Daniel P. Cronin
Paolo M. Cucchi
William R. Hutchinson
Eileen A. Kamerick
Nisha Kumar
Jane Trust
Chairman
Officers
Jane Trust
President and Chief Executive Officer
Christopher Berarducci
Treasurer and Principal Financial Officer
Fred Jensen*
Chief Compliance Officer
Jenna Bailey
Identity Theft Prevention Officer
Robert I. Frenkel
Secretary and Chief Legal Officer
Thomas C. Mandia
Assistant Secretary
Jeanne M. Kelly
Senior Vice President
Western Asset Emerging Markets Debt Fund Inc.
620 Eighth Avenue
49th Floor
New York, NY 10018
Investment manager
Legg Mason Partners Fund Advisor, LLC
Subadvisers
Western Asset Management Company, LLC
Western Asset Management Company Limited
Western Asset Management Company Pte. Ltd.
Custodian
The Bank of New York Mellon
Transfer agent
Computershare Inc.
462 South 4th Street, Suite 1600
Louisville, KY 40202
Independent registered public accounting firm
PricewaterhouseCoopers LLP
Baltimore, MD
Legal counsel
Simpson Thacher & Bartlett LLP
425 Lexington Avenue
New York, NY 10017
New York Stock Exchange Symbol
EMD
| * | Effective April 17, 2020, Mr. Jensen became Chief Compliance Officer. |
Legg Mason Funds Privacy and Security Notice
Your Privacy and the Security of Your Personal Information is Very Important to the Legg Mason Funds
This Privacy and Security Notice (the “Privacy Notice”) addresses the Legg Mason Funds’ privacy and data protection practices with respect to nonpublic personal information the Funds receive. The Legg Mason Funds include any funds sold by the Funds’ distributor, Legg Mason Investor Services, LLC, as well as Legg Mason-sponsored closed-end funds. The provisions of this Privacy Notice apply to your information both while you are a shareholder and after you are no longer invested with the Funds.
The Type of Nonpublic Personal Information the Funds Collect About You
The Funds collect and maintain nonpublic personal information about you in connection with your shareholder account. Such information may include, but is not limited to:
| • | | Personal information included on applications or other forms; |
| • | | Account balances, transactions, and mutual fund holdings and positions; |
| • | | Bank account information, legal documents, and identity verification documentation; |
| • | | Online account access user IDs, passwords, security challenge question responses; and |
| • | | Information received from consumer reporting agencies regarding credit history and creditworthiness (such as the amount of an individual’s total debt, payment history, etc.). |
How the Funds Use Nonpublic Personal Information About You
The Funds do not sell or share your nonpublic personal information with third parties or with affiliates for their marketing purposes, or with other financial institutions or affiliates for joint marketing purposes, unless you have authorized the Funds to do so. The Funds do not disclose any nonpublic personal information about you except as may be required to perform transactions or services you have authorized or as permitted or required by law. The Funds may disclose information about you to:
| • | | Employees, agents, and affiliates on a “need to know” basis to enable the Funds to conduct ordinary business or to comply with obligations to government regulators; |
| • | | Service providers, including the Funds’ affiliates, who assist the Funds as part of the ordinary course of business (such as printing, mailing services, or processing or servicing your account with us) or otherwise perform services on the Funds’ behalf, including companies that may perform statistical analysis, market research and marketing services solely for the Funds; |
| • | | Permit access to transfer, whether in the United States or countries outside of the United States to such Funds’ employees, agents and affiliates and service providers as required to enable the Funds to conduct ordinary business, or to comply with obligations to government regulators; |
| • | | The Funds’ representatives such as legal counsel, accountants and auditors to enable the Funds to conduct ordinary business, or to comply with obligations to government regulators; |
| • | | Fiduciaries or representatives acting on your behalf, such as an IRA custodian or trustee of a grantor trust. |
|
| NOT PART OF THE SEMI-ANNUAL REPORT |
Legg Mason Funds Privacy and Security Notice (cont’d)
Except as otherwise permitted by applicable law, companies acting on the Funds’ behalf, including those outside the United States, are contractually obligated to keep nonpublic personal information the Funds provide to them confidential and to use the information the Funds share only to provide the services the Funds ask them to perform.
The Funds may disclose nonpublic personal information about you when necessary to enforce their rights or protect against fraud, or as permitted or required by applicable law, such as in connection with a law enforcement or regulatory request, subpoena, or similar legal process. In the event of a corporate action or in the event a Fund service provider changes, the Funds may be required to disclose your nonpublic personal information to third parties. While it is the Funds’ practice to obtain protections for disclosed information in these types of transactions, the Funds cannot guarantee their privacy policy will remain unchanged.
Keeping You Informed of the Funds’ Privacy and Security Practices
The Funds will notify you annually of their privacy policy as required by federal law. While the Funds reserve the right to modify this policy at any time they will notify you promptly if this privacy policy changes.
The Funds’ Security Practices
The Funds maintain appropriate physical, electronic and procedural safeguards designed to guard your nonpublic personal information. The Funds’ internal data security policies restrict access to your nonpublic personal information to authorized employees, who may use your nonpublic personal information for Fund business purposes only.
Although the Funds strive to protect your nonpublic personal information, they cannot ensure or warrant the security of any information you provide or transmit to them, and you do so at your own risk. In the event of a breach of the confidentiality or security of your nonpublic personal information, the Funds will attempt to notify you as necessary so you can take appropriate protective steps. If you have consented to the Funds using electronic communications or electronic delivery of statements, they may notify you under such circumstances using the most current email address you have on record with them.
In order for the Funds to provide effective service to you, keeping your account information accurate is very important. If you believe that your account information is incomplete, not accurate or not current, if you have questions about the Funds’ privacy practices, or our use of your nonpublic personal information, write the Funds using the contact information on your account statements, email the Funds by clicking on the Contact Us section of the Funds’ website at www.leggmason.com, or contact the Funds at 1-888-777-0102.
Revised April 2018
|
| NOT PART OF THE SEMI-ANNUAL REPORT |
Western Asset Emerging Markets Debt Fund Inc.
Western Asset Emerging Markets Debt Fund Inc.
620 Eighth Avenue
49th Floor
New York, NY 10018
Notice is hereby given in accordance with Section 23(c) of the Investment Company Act of 1940, as amended, that from time to time the Fund may purchase, at market prices, shares of its stock.
The Fund files its complete schedule of portfolio holdings with the Securities and Exchange Commission (“SEC”) for the first and third quarters of each fiscal year as an exhibit to its reports on Form N-PORT. The Fund’s Forms N-PORT are available on the SEC’s website at www.sec.gov. To obtain information on Form N-PORT, shareholders can call the Fund at 1-888-777-0102.
Information on how the Fund voted proxies relating to portfolio securities during the prior 12-month period ended June 30th of each year and a description of the policies and procedures that the Fund uses to determine how to vote proxies related to portfolio transactions are available (1) without charge, upon request, by calling 1-888-777-0102, (2) at www.lmcef.com and (3) on the SEC’s website at www.sec.gov.
This report is transmitted to the shareholders of Western Asset Emerging Markets Debt Fund Inc. for their information. This is not a prospectus, circular or representation intended for use in the purchase of shares of the Fund or any securities mentioned in this report.
Computershare Inc.
462 South 4th Street, Suite 1600
Louisville, KY 40202
WAS04052 8/20 SR20-3960
Not applicable.
| ITEM 3. | AUDIT COMMITTEE FINANCIAL EXPERT. |
Not applicable.
| ITEM 4. | PRINCIPAL ACCOUNTANT FEES AND SERVICES. |
Not applicable.
| ITEM 5. | AUDIT COMMITTEE OF LISTED REGISTRANTS. |
Not applicable.
| ITEM 6. | SCHEDULE OF INVESTMENTS. |
Included herein under Item 1.
| ITEM 7. | DISCLOSURE OF PROXY VOTING POLICIES AND PROCEDURES FOR CLOSED-END MANAGEMENT INVESTMENT COMPANIES. |
Not applicable.
| ITEM 8. | INVESTMENT PROFESSIONALS OF CLOSED-END MANAGEMENT INVESTMENT COMPANIES. |
Not applicable.
| ITEM 9. | PURCHASES OF EQUITY SECURITIES BY CLOSED-END MANAGEMENT INVESTMENT COMPANY AND AFFILIATED PURCHASERS. |
Not applicable.
| ITEM 10. | SUBMISSION OF MATTERS TO A VOTE OF SECURITY HOLDERS. |
Not applicable.
| ITEM 11. | CONTROLS AND PROCEDURES. |
| | (a) | The registrant’s principal executive officer and principal financial officer have concluded that the registrant’s disclosure controls and procedures (as defined in Rule 30a- 3(c) under the Investment Company Act of 1940, as amended (the “1940 Act”)) are effective as of a date within 90 days of the filing date of this report that includes the disclosure required by this paragraph, based on their evaluation of the disclosure controls and procedures required by Rule 30a-3(b) under the 1940 Act and 15d-15(b) under the Securities Exchange Act of 1934. |
| | (b) | There were no changes in the registrant’s internal control over financial reporting (as defined in Rule 30a-3(d) under the 1940 Act) that occurred during the second fiscal quarter of the period covered by this report that have materially affected, or are likely to materially affect the registrant’s internal control over financial reporting. |
| ITEM 12. | DISCLOSURE OF SECURITIES LENDING ACTIVITIES FOR CLOSED-END MANAGEMENT INVESTMENT COMPANIES. |
Not applicable
(a) (1) Not applicable.
Exhibit 99.CODE ETH
(a) (2) Certifications pursuant to section 302 of the Sarbanes-Oxley Act of 2002 attached hereto.
Exhibit 99.CERT
(b) Certifications pursuant to Section 906 of the Sarbanes-Oxley Act of 2002 attached hereto.
Exhibit 99.906CERT
SIGNATURES
Pursuant to the requirements of the Securities Exchange Act of 1934 and the Investment Company Act of 1940, the registrant has duly caused this Report to be signed on its behalf by the undersigned, there unto duly authorized.
| | |
| Western Asset Emerging Markets Debt Fund Inc. |
| |
| By: | | /s/ Jane Trust |
| | Jane Trust |
| | Chief Executive Officer |
| |
| Date: | | August 26, 2020 |
Pursuant to the requirements of the Securities Exchange Act of 1934 and the Investment Company Act of 1940, this report has been signed below by the following persons on behalf of the registrant and in the capacities and on the dates indicated.
| | |
| By: | | /s/ Jane Trust |
| | Jane Trust |
| | Chief Executive Officer |
| |
| Date: | | August 26, 2020 |
| |
| By: | | /s/ Christopher Berarducci |
| | Christopher Berarducci |
| | Principal Financial Officer |
| |
| Date: | | August 26, 2020 |