Table of Contents
UNITED STATES
SECURITIES AND EXCHANGE COMMISSION
Washington, D.C. 20549
FORMN-CSR
CERTIFIED SHAREHOLDER REPORT OF REGISTERED
MANAGEMENT INVESTMENT COMPANIES
Investment Company Act file number811-21337
Western Asset Global High Income Fund Inc.
(Exact name of registrant as specified in charter)
620 Eighth Avenue, 49th Floor, New York, NY 10018
(Address of principal executive offices) (Zip code)
Robert I. Frenkel, Esq.
Legg Mason & Co., LLC
100 First Stamford Place
Stamford, CT 06902
(Name and address of agent for service)
Registrant’s telephone number, including area code: (888)777-0102
Date of fiscal year end: May 31
Date of reporting period: November 30, 2019
Table of Contents
ITEM 1. REPORT TO STOCKHOLDERS.
TheSemi-Annual Report to Stockholders is filed herewith.
Table of Contents

| Semi-Annual Report | November 30, 2019 |
WESTERN ASSET
GLOBAL HIGH INCOME FUND INC. (EHI)
Beginning in January 2021, as permitted by regulations adopted by the Securities and Exchange Commission, the Fund intends to no longer mail paper copies of the Fund’s shareholder reports like this one, unless you specifically request paper copies of the reports from the Fund or from your financial intermediary (such as a broker-dealer or bank). Instead, the reports will be made available on a website, and you will be notified by mail each time a report is posted and provided with a website link to access the report.
If you invest through a financial intermediary and you already elected to receive shareholder reports electronically(“e-delivery”), you will not be affected by this change and you need not take any action. If you have not already electede-delivery, you may elect to receive shareholder reports and other communications from the Fund electronically by contacting your financial intermediary.
You may elect to receive all future reports in paper free of charge. If you invest through a financial intermediary, you can contact your financial intermediary to request that you continue to receive paper copies of your shareholder reports. That election will apply to all Legg Mason Funds held in your account at that financial intermediary. If you are a direct shareholder with the Fund, you can call the Fund at1-888-888-0151, or write to the Fund by regular mail at P.O. Box 505000, Louisville, KY 40233 or by overnight delivery to Computershare, 462 South 4th Street, Suite 1600, Louisville, KY 40202 to let the Fund know you wish to continue receiving paper copies of your shareholder reports. That election will apply to all Legg Mason Funds held in your account held directly with the fund complex.

| INVESTMENT PRODUCTS: NOT FDIC INSURED • NO BANK GUARANTEE • MAY LOSE VALUE |
Table of Contents
Fund objectives
The Fund’s primary investment objective is high current income. The Fund’s secondary investment objective is total return.
Under normal market conditions, the Fund invests in a global portfolio of securities consisting of below investment grade fixed-income securities, emerging market fixed-income securities and investment grade fixed-income securities.

Dear Shareholder,
We are pleased to provide the semi-annual report of Western Asset Global High Income Fund Inc. for thesix-month reporting period ended November 30, 2019. Please read on for Fund performance information during the Fund’s reporting period.
As always, we remain committed to providing you with excellent service and a full spectrum of investment choices. We also remain committed to supplementing the support you receive from your financial advisor. One way we accomplish this is through our website, www.lmcef.com. Here you can gain immediate access to market and investment information, including:
| • | Fund prices and performance, |
| • | Market insights and commentaries from our portfolio managers, and |
| • | A host of educational resources. |
We look forward to helping you meet your financial goals.
Sincerely,

Jane Trust, CFA
Chairman, President and Chief Executive Officer
December 31, 2019
| II | Western Asset Global High Income Fund Inc. |
Table of Contents
Performance review
For the six months ended November 30, 2019, Western Asset Global High Income Fund Inc. returned 4.76% based on its net asset value (“NAV”)i and 4.89% based on its New York Stock Exchange (“NYSE”) market price per share. The Fund’s unmanaged benchmarks, the Bloomberg Barclays U.S. Aggregate Indexii, the Bloomberg Barclays U.S. Corporate High Yield — 2% Issuer Cap Indexiii and the JPMorgan Emerging Markets Bond Index Global (“EMBI Global”)iv, returned 3.81%, 4.27% and 4.64%, respectively, over the same time frame. The Lipper High Yield (Leveraged)Closed-End Funds Category Averagev returned 3.41% for the same period. Please note that Lipper performance returns are based on each fund’s NAV.
During thissix-month period, the Fund made distributions to shareholders totaling $0.38 per share. As of November 30, 2019, the Fund estimates that 97% of the distributions were sourced from net investment income and 3% constituted a return of capital.* The performance table shows the Fund’ssix-month total return based on its NAV and market price as of November 30, 2019.Past performance is no guarantee of future results.
| Performance Snapshot as of November 30, 2019 (unaudited) | ||
| Price Per Share | 6-Month Total Return** | |
| $ 10.66 (NAV) | 4.76%† | |
| $ 9.68 (Market Price) | 4.89%‡ | |
All figures represent past performance and are not a guarantee of future results. Performance figures for periods shorter than one year represent cumulative figures and are not annualized.
** Total returns are based on changes in NAV or market price, respectively. Returns reflect the deduction of all Fund expenses, including management fees, operating expenses, and other Fund expenses. Returns do not reflect the deduction of brokerage commissions or taxes that investors may pay on distributions or the sale of shares.
† Total return assumes the reinvestment of all distributions, including returns of capital, if any, at NAV.
‡ Total return assumes the reinvestment of all distributions, including returns of capital, if any, in additional shares in accordance with the Fund’s Dividend Reinvestment Plan.
| * | These estimates are not for tax purposes. The Fund will issue a Form 1099 with final composition of the distributions for tax purposes afteryear-end. A return of capital is not taxable and results in a reduction in the tax basis of a shareholder’s investment. For more information about a distribution’s composition, please refer to the Fund’s distribution press release or, if applicable, the Section 19 notice located in the press release section of our website, www.lmcef.com (click on the name of the Fund). |
Western Asset Global High Income Fund Inc. | III |
Table of Contents
Looking for additional information?
The Fund is traded under the symbol “EHI” and its closing market price is available in most newspapers under the NYSE listings. The daily NAV is availableon-line under the symbol “XEHIX” on most financial websites.Barron’sand theWall Street Journal’sMonday edition both carryclosed-end fund tables that provide additional information. In addition, the Fund issues a quarterly press release that can be found on most major financial websites as well as www.lmcef.com (click on the name of the Fund).
In a continuing effort to provide information concerning the Fund, shareholders may call1-888-777-0102 (toll free), Monday through Friday from 8:00 a.m. to 5:30 p.m. Eastern Time, for the Fund’s current NAV, market price and other information.
Thank you for your investment in Western Asset Global High Income Fund Inc. As always, we appreciate that you have chosen us to manage your assets and we remain focused on achieving the Fund’s investment goals.
Sincerely,
Jane Trust, CFA
Chairman, President and Chief Executive Officer
December 31, 2019
RISKS:Fund is anon-diversified,closed-end management investment company designed primarily as a long-term investment and not as a trading vehicle. The Fund is not intended to be a complete investment program and, due to the uncertainty inherent in all investments, there can be no assurance that the Fund will achieve its investment objective. The Fund’s common stock is traded on the New York Stock Exchange. Similar to stocks, the Fund’s share price will fluctuate with market conditions and, at the time of sale, may be worth more or less than the original investment. Shares ofclosed-end funds often trade at a discount to their net asset value. Because the Fund isnon-diversified, it may be more susceptible to economic, political or regulatory events than a diversified fund. The Fund’s investments are subject to a number of risks, including credit risk, inflation risk, call risk and interest rate risk. An investment in the Fund is subject to investment risk, including the possible loss of the entire principal amount that you invest. As interest rates rise, bond prices fall, reducing the value of the Fund’s holdings. The Fund may use derivatives, such as options, futures contracts, swap agreements and credit default swaps, which can be illiquid, may disproportionately increase losses and have a potentially large impact on Fund performance. Investing in foreign securities is subject to certain risks not associated with domestic investing, such as currency fluctuations, and changes in political, social and economic conditions. These risks are magnified in emerging or developing markets. High yield bonds, also known as “junk bonds”, involve greater credit risk (risk of default) and
| IV | Western Asset Global High Income Fund Inc. |
Table of Contents
liquidity risk than investment grade bonds. Leverage may result in greater volatility of NAV and the market price of common shares and increases shareholder’s risk of loss.
All investments are subject to risk including the possible loss of principal. Past performance is no guarantee of future results. All index performance reflects no deduction for fees, expenses or taxes. Please note that an investor cannot invest directly in an index.
| i | Net asset value (“NAV”) is calculated by subtracting total liabilities, including liabilities associated with financial leverage (if any, from the closing value of all securities held by the Fund (plus all other assets) and dividing the result (total net assets) by the total number of the common shares outstanding. The NAV fluctuates with changes in the market prices of securities in which the Fund has invested. However, the price at which an investor may buy or sell shares of the Fund is the Fund’s market price as determined by supply of and demand for the Fund’s shares. |
| ii | The Bloomberg Barclays U.S. Aggregate Index is a broad-based bond index comprised of government, corporate, mortgage- and asset-backed issues, rated investment grade or higher, and having at least one year to maturity. |
| iii | The Bloomberg Barclays U.S. Corporate High Yield — 2% Issuer Cap Index is an index of the 2% Issuer Cap component of the Bloomberg Barclays U.S. Corporate High Yield Index, which covers the U.S. dollar-denominated,non-investment grade, fixed-rate, taxable corporate bond market. |
| iv | The JPMorgan Emerging Markets Bond Index Global (“EMBI Global”) tracks total returns for U.S. dollar-denominated debt instruments issued by emerging market sovereign and quasi-sovereign entities: Brady bonds, loans, Eurobonds and local market instruments. |
| v | Lipper, Inc., a wholly-owned subsidiary of Reuters, provides independent insight on global collective investments. Returns are based on thesix-month period ended November 30, 2019, including the reinvestment of all distributions, including returns of capital, if any, calculated among the 40 funds in the Fund’s Lipper category. |
| Western Asset Global High Income Fund Inc. | V |
Table of Contents
(This page intentionally left blank.)
Table of Contents
Investment breakdown(%) as a percent of total investments
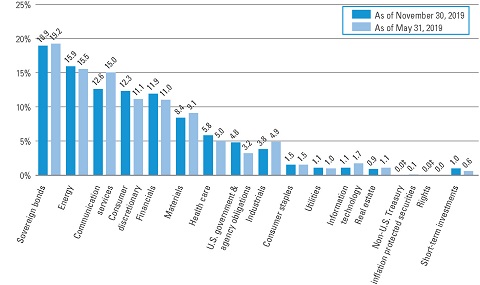
| † | The bar graph above represents the composition of the Fund’s investments as of November 30, 2019 and May 31, 2019 and does not include derivatives such as forward foreign currency contracts. The Fund is actively managed. As a result, the composition of the Fund’s investments is subject to change at any time. |
| ‡ | Represents less than 0.1%. |
| Western Asset Global High Income Fund Inc. 2019 Semi-Annual Report | 1 |
Table of Contents
Schedule of investments(unaudited)
November 30, 2019
Western Asset Global High Income Fund Inc.
| Security‡ | Rate | Maturity Date | Face Amount† | Value | ||||||||||||
| Corporate Bonds & Notes — 96.7% | ||||||||||||||||
| Communication Services — 15.8% | ||||||||||||||||
Diversified Telecommunication Services — 2.2% | ||||||||||||||||
British Telecommunications PLC, Senior Notes | 9.625 | % | 12/15/30 | 60,000 | $ | 91,790 | ||||||||||
Cogent Communications Group Inc., Senior Secured Notes | 5.375 | % | 3/1/22 | 820,000 | 857,156 | (a) | ||||||||||
Intelsat Jackson Holdings SA, Senior Secured Notes | 8.000 | % | 2/15/24 | 740,000 | 756,643 | (a) | ||||||||||
Telecom Italia Capital SA, Senior Notes | 6.000 | % | 9/30/34 | 780,000 | 836,299 | |||||||||||
Telecom Italia SpA, Senior Notes | 5.303 | % | 5/30/24 | 450,000 | 484,992 | (a) | ||||||||||
Telefonica Emisiones SA, Senior Notes | 5.134 | % | 4/27/20 | 3,000,000 | 3,037,189 | |||||||||||
Turk Telekomunikasyon AS, Senior Notes | 6.875 | % | 2/28/25 | 500,000 | 534,060 | (a) | ||||||||||
UPCB Finance IV Ltd., Senior Secured Notes | 5.375 | % | 1/15/25 | 2,035,000 | 2,096,050 | (a) | ||||||||||
Windstream Services LLC/Wind-stream Finance Corp., Secured Notes | 10.500 | % | 6/30/24 | 3,160,000 | 1,273,211 | *(a)(b) | ||||||||||
Windstream Services LLC/Wind- stream Finance Corp., Secured Notes | 9.000 | % | 6/30/25 | 890,000 | 340,794 | *(a)(b) | ||||||||||
Total Diversified Telecommunication Services |
| 10,308,184 | ||||||||||||||
Entertainment — 0.6% | ||||||||||||||||
Netflix Inc., Senior Notes | 5.875 | % | 11/15/28 | 1,040,000 | 1,138,826 | |||||||||||
Netflix Inc., Senior Notes | 6.375 | % | 5/15/29 | 1,250,000 | 1,401,341 | |||||||||||
Total Entertainment | 2,540,167 | |||||||||||||||
Interactive Media & Services — 0.2% | ||||||||||||||||
Match Group Inc., Senior Notes | 6.375 | % | 6/1/24 | 880,000 | 927,665 | |||||||||||
Match Group Inc., Senior Notes | 5.000 | % | 12/15/27 | 70,000 | 71,950 | (a) | ||||||||||
Total Interactive Media & Services | 999,615 | |||||||||||||||
Media — 8.4% | ||||||||||||||||
Altice France SA, Senior Secured Notes | 7.375 | % | 5/1/26 | 3,140,000 | 3,359,878 | (a) | ||||||||||
Altice France SA, Senior Secured Notes | 8.125 | % | 2/1/27 | 6,940,000 | 7,703,573 | (a) | ||||||||||
Altice Luxembourg SA, Senior Secured Notes | 10.500 | % | 5/15/27 | 1,260,000 | 1,432,022 | (a) | ||||||||||
Cable Onda SA, Senior Notes | 4.500 | % | 1/30/30 | 1,480,000 | 1,512,560 | (a) | ||||||||||
See Notes to Financial Statements.
| 2 | Western Asset Global High Income Fund Inc. 2019 Semi-Annual Report |
Table of Contents
Western Asset Global High Income Fund Inc.
| Security‡ | Rate | Maturity Date | Face Amount† | Value | ||||||||||||
Media — continued | ||||||||||||||||
CCO Holdings LLC/CCO Holdings Capital Corp., Senior Notes | 5.125 | % | 5/1/27 | 3,140,000 | $ | 3,336,329 | (a) | |||||||||
CCO Holdings LLC/CCO Holdings Capital Corp., Senior Notes | 5.000 | % | 2/1/28 | 5,300,000 | 5,591,632 | (a) | ||||||||||
DISH DBS Corp., Senior Notes | 5.875 | % | 11/15/24 | 2,996,000 | 2,999,745 | |||||||||||
DISH DBS Corp., Senior Notes | 7.750 | % | 7/1/26 | 9,167,000 | 9,516,377 | |||||||||||
UPC Holding BV, Senior Secured Notes | 5.500 | % | 1/15/28 | 995,000 | 1,007,261 | (a) | ||||||||||
Virgin Media Finance PLC, Senior Notes | 6.000 | % | 10/15/24 | 1,520,000 | 1,568,131 | (a) | ||||||||||
Virgin Media Secured Finance PLC, Senior Secured Notes | 5.500 | % | 8/15/26 | 1,350,000 | 1,422,296 | (a) | ||||||||||
Total Media | 39,449,804 | |||||||||||||||
Wireless Telecommunication Services — 4.4% | ||||||||||||||||
CSC Holdings LLC, Senior Notes | 6.625 | % | 10/15/25 | 1,210,000 | 1,290,332 | (a) | ||||||||||
CSC Holdings LLC, Senior Notes | 10.875 | % | 10/15/25 | 2,017,000 | 2,272,907 | (a) | ||||||||||
CSC Holdings LLC, Senior Notes | 5.375 | % | 2/1/28 | 500,000 | 529,911 | (a) | ||||||||||
CSC Holdings LLC, Senior Notes | 6.500 | % | 2/1/29 | 1,460,000 | 1,631,236 | (a) | ||||||||||
Sprint Capital Corp., Senior Notes | 6.875 | % | 11/15/28 | 560,000 | 598,525 | |||||||||||
Sprint Capital Corp., Senior Notes | 8.750 | % | 3/15/32 | 1,160,000 | 1,386,229 | |||||||||||
Sprint Communications Inc., Senior Notes | 7.000 | % | 8/15/20 | 1,650,000 | 1,692,079 | |||||||||||
Sprint Communications Inc., Senior Notes | 11.500 | % | 11/15/21 | 3,455,000 | 3,998,299 | |||||||||||
Sprint Corp., Senior Notes | 7.250 | % | 9/15/21 | 1,440,000 | 1,530,360 | |||||||||||
Sprint Corp., Senior Notes | 7.875 | % | 9/15/23 | 2,960,000 | 3,261,550 | |||||||||||
VEON Holdings BV, Senior Notes | 7.504 | % | 3/1/22 | 1,050,000 | 1,159,727 | (c) | ||||||||||
VEON Holdings BV, Senior Notes | 7.504 | % | 3/1/22 | 450,000 | 497,026 | (a) | ||||||||||
Vimpel Communications Via VIP Finance Ireland Ltd. OJSC, Senior Notes | 7.748 | % | 2/2/21 | 820,000 | 874,702 | (a) | ||||||||||
Total Wireless Telecommunication Services | 20,722,883 | |||||||||||||||
Total Communication Services | 74,020,653 | |||||||||||||||
| Consumer Discretionary — 10.4% | ||||||||||||||||
Auto Components — 2.0% | ||||||||||||||||
Adient Global Holdings Ltd., Senior Notes | 4.875 | % | 8/15/26 | 3,830,000 | 3,274,746 | (a) | ||||||||||
Adient US LLC, Senior Secured Notes | 7.000 | % | 5/15/26 | 970,000 | 1,038,798 | (a) | ||||||||||
See Notes to Financial Statements.
| Western Asset Global High Income Fund Inc. 2019 Semi-Annual Report | 3 |
Table of Contents
Schedule of investments(unaudited) (cont’d)
November 30, 2019
Western Asset Global High Income Fund Inc.
| Security‡ | Rate | Maturity Date | Face Amount† | Value | ||||||||||||
Auto Components — continued | ||||||||||||||||
American Axle & Manufacturing Inc., Senior Notes | 6.250 | % | 4/1/25 | 40,000 | $ | 40,750 | ||||||||||
American Axle & Manufacturing Inc., Senior Notes | 6.250 | % | 3/15/26 | 1,250,000 | 1,251,997 | |||||||||||
American Axle & Manufacturing Inc., Senior Notes | 6.500 | % | 4/1/27 | 940,000 | 947,074 | |||||||||||
JB Poindexter & Co. Inc., Senior Notes | 7.125 | % | 4/15/26 | 2,810,000 | 2,938,831 | (a) | ||||||||||
Total Auto Components | 9,492,196 | |||||||||||||||
Diversified Consumer Services — 1.9% | ||||||||||||||||
Carriage Services Inc., Senior Notes | 6.625 | % | 6/1/26 | 2,140,000 | 2,247,744 | (a) | ||||||||||
Prime Security Services Borrower LLC/Prime Finance Inc., Secured Notes | 9.250 | % | 5/15/23 | 2,214,000 | 2,331,619 | (a) | ||||||||||
Prime Security Services Borrower LLC/Prime Finance Inc., Senior Secured Notes | 5.750 | % | 4/15/26 | 2,450,000 | 2,563,665 | (a) | ||||||||||
Service Corp. International, Senior Notes | 7.500 | % | 4/1/27 | 770,000 | 941,592 | |||||||||||
Weight Watchers International Inc., Senior Notes | 8.625 | % | 12/1/25 | 510,000 | 533,162 | (a) | ||||||||||
Total Diversified Consumer Services | 8,617,782 | |||||||||||||||
Hotels, Restaurants & Leisure — 3.0% | ||||||||||||||||
1011778 BC ULC/New Red Finance Inc., Senior Secured Notes | 4.250 | % | 5/15/24 | 2,210,000 | 2,265,250 | (a) | ||||||||||
Melco Resorts Finance Ltd., Senior Notes | 5.375 | % | 12/4/29 | 1,850,000 | 1,894,087 | (a)(d) | ||||||||||
MGM China Holdings Ltd., Senior Notes | 5.875 | % | 5/15/26 | 1,090,000 | 1,160,168 | (a) | ||||||||||
Saga PLC, Senior Notes | 3.375 | % | 5/12/24 | 2,960,000 | GBP | 3,248,498 | (c) | |||||||||
Silversea Cruise Finance Ltd., Senior Secured Notes | 7.250 | % | 2/1/25 | 1,335,000 | 1,420,327 | (a) | ||||||||||
Viking Cruises Ltd., Senior Notes | 6.250 | % | 5/15/25 | 1,740,000 | 1,819,022 | (a) | ||||||||||
Viking Cruises Ltd., Senior Notes | 5.875 | % | 9/15/27 | 450,000 | 482,545 | (a) | ||||||||||
VOC Escrow Ltd., Senior Secured Notes | 5.000 | % | 2/15/28 | 1,680,000 | 1,766,507 | (a) | ||||||||||
Total Hotels, Restaurants & Leisure | 14,056,404 | |||||||||||||||
Household Durables — 0.4% | ||||||||||||||||
Lennar Corp., Senior Notes | 5.000 | % | 6/15/27 | 1,860,000 | 2,016,422 | |||||||||||
See Notes to Financial Statements.
| 4 | Western Asset Global High Income Fund Inc. 2019 Semi-Annual Report |
Table of Contents
Western Asset Global High Income Fund Inc.
Security‡ | Rate | Maturity Date | Face Amount† | Value | ||||||||||||
Specialty Retail — 2.6% | ||||||||||||||||
Maxeda DIY Holding BV, Senior Secured Notes | 6.125 | % | 7/15/22 | 1,917,000 | EUR | $ | 2,040,824 | (c) | ||||||||
Party City Holdings Inc., Senior Notes | 6.125 | % | 8/15/23 | 800,000 | 614,332 | (a) | ||||||||||
Party City Holdings Inc., Senior Notes | 6.625 | % | 8/1/26 | 2,450,000 | 1,475,690 | (a) | ||||||||||
PetSmart Inc., Senior Secured Notes | 5.875 | % | 6/1/25 | 4,520,000 | 4,440,900 | (a) | ||||||||||
Sally Holdings LLC/Sally Capital Inc., Senior Notes | 5.625 | % | 12/1/25 | 3,460,000 | 3,594,075 | |||||||||||
Total Specialty Retail | 12,165,821 | |||||||||||||||
Textiles, Apparel & Luxury Goods — 0.5% | ||||||||||||||||
CBR Fashion Finance BV, Senior Secured Notes | 5.125 | % | 10/1/22 | 750,000 | EUR | 849,874 | (c) | |||||||||
Hanesbrands Inc., Senior Notes | 4.875 | % | 5/15/26 | 1,350,000 | 1,439,252 | (a) | ||||||||||
Total Textiles, Apparel & Luxury Goods |
| 2,289,126 | ||||||||||||||
Total Consumer Discretionary | 48,637,751 | |||||||||||||||
| Consumer Staples — 2.1% | ||||||||||||||||
Beverages — 0.3% | ||||||||||||||||
Anheuser-Busch InBev World-wide Inc., Senior Notes | 4.150 | % | 1/23/25 | 1,500,000 | 1,634,153 | |||||||||||
Food Products — 1.1% | ||||||||||||||||
Lamb Weston Holdings Inc., Senior Notes | 4.875 | % | 11/1/26 | 800,000 | 847,858 | (a) | ||||||||||
Pilgrim’s Pride Corp., Senior Notes | 5.750 | % | 3/15/25 | 305,000 | 317,197 | (a) | ||||||||||
Pilgrim’s Pride Corp., Senior Notes | 5.875 | % | 9/30/27 | 3,510,000 | 3,798,952 | (a) | ||||||||||
Total Food Products | 4,964,007 | |||||||||||||||
Household Products — 0.4% | ||||||||||||||||
Central Garden & Pet Co., Senior Notes | 6.125 | % | 11/15/23 | 280,000 | 289,916 | |||||||||||
Spectrum Brands Inc., Senior Notes | 6.125 | % | 12/15/24 | 380,000 | 393,458 | |||||||||||
Spectrum Brands Inc., Senior Notes | 5.750 | % | 7/15/25 | 1,340,000 | 1,406,558 | |||||||||||
Total Household Products | 2,089,932 | |||||||||||||||
Tobacco — 0.3% | ||||||||||||||||
Altria Group Inc., Senior Notes | 5.950 | % | 2/14/49 | 1,110,000 | 1,339,190 | |||||||||||
Total Consumer Staples | 10,027,282 | |||||||||||||||
| Energy — 22.6% | ||||||||||||||||
Energy Equipment & Services — 0.0% | ||||||||||||||||
Transocean Inc., Senior Notes | 9.000 | % | 7/15/23 | 278,000 | 284,338 | (a) | ||||||||||
See Notes to Financial Statements.
| Western Asset Global High Income Fund Inc. 2019 Semi-Annual Report | 5 |
Table of Contents
Schedule of investments(unaudited) (cont’d)
November 30, 2019
Western Asset Global High Income Fund Inc.
| Security‡ | Rate | Maturity Date | Face Amount† | Value | ||||||||||||
Oil, Gas & Consumable Fuels — 22.6% | ||||||||||||||||
Andeavor Logistics LP/Tesoro Logistics Finance Corp., Senior Notes | 6.375 | % | 5/1/24 | 610,000 | $ | 629,980 | ||||||||||
Andeavor Logistics LP/Tesoro Logistics Finance Corp., Senior Notes | 5.250 | % | 1/15/25 | 1,400,000 | 1,463,344 | |||||||||||
Berry Petroleum Co. LLC, Senior Notes | 7.000 | % | 2/15/26 | 1,475,000 | 1,279,050 | (a) | ||||||||||
Blue Racer Midstream LLC/Blue Racer Finance Corp., Senior Notes | 6.125 | % | 11/15/22 | 1,600,000 | 1,447,510 | (a) | ||||||||||
Blue Racer Midstream LLC/Blue Racer Finance Corp., Senior Notes | 6.625 | % | 7/15/26 | 3,015,000 | 2,616,560 | (a) | ||||||||||
Chesapeake Energy Corp., Senior Notes | 6.875 | % | 11/15/20 | 2,720,000 | 2,401,454 | |||||||||||
Chesapeake Energy Corp., Senior Notes | 4.875 | % | 4/15/22 | 2,000,000 | 1,405,624 | |||||||||||
Chesapeake Energy Corp., Senior Notes | 5.750 | % | 3/15/23 | 560,000 | 341,600 | |||||||||||
Continental Resources Inc., Senior Notes | 4.500 | % | 4/15/23 | 1,000,000 | 1,043,084 | |||||||||||
Continental Resources Inc., Senior Notes | 4.900 | % | 6/1/44 | 1,440,000 | 1,465,746 | |||||||||||
Ecopetrol SA, Senior Notes | 5.875 | % | 9/18/23 | 262,000 | 289,291 | |||||||||||
Ecopetrol SA, Senior Notes | 4.125 | % | 1/16/25 | 1,030,000 | 1,076,777 | |||||||||||
Ecopetrol SA, Senior Notes | 5.375 | % | 6/26/26 | 4,500,000 | 4,981,489 | |||||||||||
Ecopetrol SA, Senior Notes | 5.875 | % | 5/28/45 | 1,820,000 | 2,090,152 | |||||||||||
El Paso Natural Gas Co. LLC, Senior Notes | 8.375 | % | 6/15/32 | 70,000 | 96,873 | |||||||||||
Energy Transfer Operating LP, Senior Notes | 7.500 | % | 10/15/20 | 130,000 | 135,731 | |||||||||||
Extraction Oil & Gas Inc., Senior Notes | 5.625 | % | 2/1/26 | 290,000 | 134,226 | (a) | ||||||||||
Gazprom OAO Via Gaz Capital SA, Senior Notes | 6.510 | % | 3/7/22 | 1,920,000 | 2,089,123 | (a) | ||||||||||
KazMunayGas National Co. JSC, Senior Notes | 4.750 | % | 4/19/27 | 2,000,000 | 2,186,820 | (a) | ||||||||||
Kinder Morgan Inc., Senior Notes | 7.750 | % | 1/15/32 | 1,390,000 | 1,899,450 | |||||||||||
Lukoil International Finance BV, Senior Notes | 6.656 | % | 6/7/22 | 496,000 | 546,870 | (c) | ||||||||||
Lukoil International Finance BV, Senior Notes | 4.563 | % | 4/24/23 | 740,000 | 787,030 | (a) | ||||||||||
See Notes to Financial Statements.
| 6 | Western Asset Global High Income Fund Inc. 2019 Semi-Annual Report |
Table of Contents
Western Asset Global High Income Fund Inc.
| Security‡ | Rate | Maturity Date | Face Amount† | Value | ||||||||||||
Oil, Gas & Consumable Fuels — continued | ||||||||||||||||
Lukoil International Finance BV, Senior Notes | 4.750 | % | 11/2/26 | 3,040,000 | $ | 3,352,111 | (a) | |||||||||
MEG Energy Corp., Senior Notes | 7.000 | % | 3/31/24 | 4,600,000 | 4,522,375 | (a) | ||||||||||
NGPL PipeCo LLC, Senior Notes | 7.768 | % | 12/15/37 | 1,430,000 | 1,831,925 | (a) | ||||||||||
Oasis Petroleum Inc., Senior Notes | 6.500 | % | 11/1/21 | 1,930,000 | 1,888,987 | |||||||||||
Oasis Petroleum Inc., Senior Notes | 6.875 | % | 3/15/22 | 1,160,000 | 1,086,775 | |||||||||||
Oasis Petroleum Inc., Senior Notes | 6.875 | % | 1/15/23 | 2,520,000 | 2,318,400 | |||||||||||
Occidental Petroleum Corp., Senior Notes | 6.950 | % | 7/1/24 | 920,000 | 1,074,588 | |||||||||||
Occidental Petroleum Corp., Senior Notes | 6.450 | % | 9/15/36 | 50,000 | 60,878 | |||||||||||
Pertamina Persero PT, Senior Notes | 5.250 | % | 5/23/21 | 1,610,000 | 1,677,701 | (a) | ||||||||||
Petrobras Global Finance BV, Senior Notes | 4.375 | % | 5/20/23 | 1,632,000 | 1,697,280 | |||||||||||
Petrobras Global Finance BV, Senior Notes | 5.999 | % | 1/27/28 | 2,760,000 | 3,080,608 | |||||||||||
Petrobras Global Finance BV, Senior Notes | 5.750 | % | 2/1/29 | 5,760,000 | 6,339,168 | |||||||||||
Petrobras Global Finance BV, Senior Notes | 6.875 | % | 1/20/40 | 2,190,000 | 2,520,548 | |||||||||||
Petrobras Global Finance BV, Senior Notes | 6.750 | % | 1/27/41 | 3,910,000 | 4,456,559 | |||||||||||
Petroleos de Venezuela SA, Senior Notes | 6.000 | % | 5/16/24 | 1,235,000 | 95,713 | *(b)(c) | ||||||||||
Petroleos Mexicanos, Senior Notes | 6.500 | % | 6/2/41 | 4,882,000 | 4,787,021 | |||||||||||
Range Resources Corp., Senior Notes | 5.000 | % | 3/15/23 | 6,130,000 | 5,340,701 | |||||||||||
Range Resources Corp., Senior Notes | 4.875 | % | 5/15/25 | 3,110,000 | 2,542,425 | |||||||||||
Rockies Express Pipeline LLC, Senior Notes | 7.500 | % | 7/15/38 | 1,020,000 | 1,073,550 | (a) | ||||||||||
Rockies Express Pipeline LLC, Senior Notes | 6.875 | % | 4/15/40 | 1,070,000 | 1,114,442 | (a) | ||||||||||
Sabine Pass Liquefaction LLC, Senior Secured Notes | 5.000 | % | 3/15/27 | 290,000 | 317,708 | |||||||||||
Targa Resources Partners LP/Targa Resources Partners Finance Corp., Senior Notes | 5.875 | % | 4/15/26 | 350,000 | 368,926 | |||||||||||
Targa Resources Partners LP/Targa Resources Partners Finance Corp., Senior Notes | 6.500 | % | 7/15/27 | 1,220,000 | 1,304,287 | (a) | ||||||||||
See Notes to Financial Statements.
| Western Asset Global High Income Fund Inc. 2019 Semi-Annual Report | 7 |
Table of Contents
Schedule of investments(unaudited) (cont’d)
November 30, 2019
Western Asset Global High Income Fund Inc.
| Security‡ | Rate | Maturity Date | Face Amount† | Value | ||||||||||||
Oil, Gas & Consumable Fuels — continued | ||||||||||||||||
Targa Resources Partners LP/Targa Resources Partners Finance Corp., Senior Notes | 5.000 | % | 1/15/28 | 450,000 | $ | 447,688 | ||||||||||
Targa Resources Partners LP/Targa Resources Partners Finance Corp., Senior Notes | 6.875 | % | 1/15/29 | 2,830,000 | 3,062,973 | (a) | ||||||||||
Transcontinental Gas Pipe Line Co. LLC, Senior Notes | 7.850 | % | 2/1/26 | 1,500,000 | 1,904,534 | |||||||||||
Transportadora de Gas del Peru SA, Senior Notes | 4.250 | % | 4/30/28 | 500,000 | 531,724 | (a) | ||||||||||
Transportadora de Gas del Sur SA, Senior Notes | 6.750 | % | 5/2/25 | 3,690,000 | 3,065,467 | (a) | ||||||||||
Western Midstream Operating LP, Senior Notes | 5.450 | % | 4/1/44 | 2,000,000 | 1,694,680 | |||||||||||
Western Midstream Operating LP, Senior Notes | 5.500 | % | 8/15/48 | 2,810,000 | 2,393,115 | |||||||||||
Williams Cos. Inc., Senior Notes | 3.700 | % | 1/15/23 | 740,000 | 764,400 | |||||||||||
Williams Cos. Inc., Senior Notes | 4.550 | % | 6/24/24 | 680,000 | 728,364 | |||||||||||
Williams Cos. Inc., Senior Notes | 7.500 | % | 1/15/31 | 340,000 | 436,497 | |||||||||||
Williams Cos. Inc., Senior Notes | 8.750 | % | 3/15/32 | 486,000 | 679,082 | |||||||||||
Williams Cos. Inc., Senior Notes | 5.750 | % | 6/24/44 | 1,510,000 | 1,733,047 | |||||||||||
WPX Energy Inc., Senior Notes | 8.250 | % | 8/1/23 | 180,000 | 202,629 | |||||||||||
YPF SA, Senior Notes | 8.750 | % | 4/4/24 | 950,000 | 845,704 | (a) | ||||||||||
YPF SA, Senior Notes | 8.500 | % | 7/28/25 | 5,310,000 | 4,382,954 | (a) | ||||||||||
Total Oil, Gas & Consumable Fuels | 106,133,318 | |||||||||||||||
Total Energy | 106,417,656 | |||||||||||||||
| Financials — 16.7% | ||||||||||||||||
Banks — 12.0% | ||||||||||||||||
Banco Bilbao Vizcaya Argentaria Colombia SA, Subordinated Notes | 4.875 | % | 4/21/25 | 540,000 | 568,574 | (a) | ||||||||||
Bank of America Corp., Junior Subordinated Notes (6.500% to 10/23/24 then 3 mo. USD LIBOR + 4.174%) | 6.500 | % | 10/23/24 | 1,200,000 | 1,359,858 | (e)(f) | ||||||||||
Bank of America Corp., Subordinated Notes | 4.250 | % | 10/22/26 | 1,000,000 | 1,094,162 | |||||||||||
Barclays Bank PLC, Subordinated Notes | 10.179 | % | 6/12/21 | 2,520,000 | 2,810,258 | (a) | ||||||||||
Barclays Bank PLC, Subordinated Notes | 7.625 | % | 11/21/22 | 3,430,000 | 3,849,197 | |||||||||||
See Notes to Financial Statements.
| 8 | Western Asset Global High Income Fund Inc. 2019 Semi-Annual Report |
Table of Contents
Western Asset Global High Income Fund Inc.
| Security‡ | Rate | Maturity Date | Face Amount† | Value | ||||||||||||
Banks — continued | ||||||||||||||||
Barclays PLC, Junior Subordinated Notes (8.000% to 6/15/24 then 5 year Treasury Constant Maturity Rate + 5.672%) | 8.000 | % | 6/15/24 | 1,620,000 | $ | 1,791,258 | (e)(f) | |||||||||
Barclays PLC, Subordinated Notes | 5.200 | % | 5/12/26 | 500,000 | 544,593 | |||||||||||
Barclays PLC, Subordinated Notes (5.088% to 6/20/29 then 3 mo. USD LIBOR + 3.054%) | 5.088 | % | 6/20/30 | 1,200,000 | 1,310,336 | (f) | ||||||||||
BBVA Banco Continental SA, Subordinated Notes (5.250% to 9/22/24 then 5 year Treasury Constant Maturity Rate + 2.750%) | 5.250 | % | 9/22/29 | 240,000 | 260,186 | (a)(f) | ||||||||||
BBVA Bancomer SA, Subordinated Notes (5.125% to 1/17/28 then 5 year Treasury Constant Maturity Rate + 2.650%) | 5.125 | % | 1/18/33 | 2,050,000 | 2,024,426 | (a)(f) | ||||||||||
BNP Paribas SA, Junior Subordinated Notes (7.375% to 8/19/25 then USD 5 year ICE Swap Rate + 5.150%) | 7.375 | % | 8/19/25 | 1,360,000 | 1,554,963 | (a)(e)(f) | ||||||||||
CIT Group Inc., Senior Notes | 5.000 | % | 8/15/22 | 470,000 | 501,393 | |||||||||||
CIT Group Inc., Senior Notes | 5.000 | % | 8/1/23 | 1,560,000 | 1,682,834 | |||||||||||
Citigroup Inc., Junior Subordinated Notes (5.950% to 5/15/25 then 3 mo. USD LIBOR + 3.905%) | 5.950 | % | 5/15/25 | 2,040,000 | 2,222,284 | (e)(f) | ||||||||||
Citigroup Inc., Junior Subordinated Notes (6.300% to 5/15/24 then 3 mo. USD LIBOR + 3.423%) | 6.300 | % | 5/15/24 | 3,180,000 | 3,420,774 | (e)(f) | ||||||||||
Citigroup Inc., Subordinated Notes | 4.125 | % | 7/25/28 | 500,000 | 543,906 | |||||||||||
Credit Agricole SA, Junior Subordinated Notes (8.125% to 12/23/25 then USD 5 year ICE Swap Rate + 6.185%) | 8.125 | % | 12/23/25 | 2,160,000 | 2,612,250 | (a)(e)(f) | ||||||||||
HSBC Holdings PLC, Junior Subordinated Notes (6.000% to 5/22/27 then USD 5 year ICE Swap Rate + 3.746%) | 6.000 | % | 5/22/27 | 1,230,000 | 1,302,595 | (e)(f) | ||||||||||
HSBC Holdings PLC, Junior Subordinated Notes (6.500% to 3/23/28 then USD 5 year ICE Swap Rate + 3.606%) | 6.500 | % | 3/23/28 | 3,810,000 | 4,133,469 | (e)(f) | ||||||||||
See Notes to Financial Statements.
| Western Asset Global High Income Fund Inc. 2019 Semi-Annual Report | 9 |
Table of Contents
Schedule of investments(unaudited) (cont’d)
November 30, 2019
Western Asset Global High Income Fund Inc.
| Security‡ | Rate | Maturity Date | Face Amount† | Value | ||||||||||||
Banks — continued | ||||||||||||||||
Intesa Sanpaolo SpA, Subordinated Notes | 5.017 | % | 6/26/24 | 4,380,000 | $ | 4,559,680 | (a) | |||||||||
Intesa Sanpaolo SpA, Subordinated Notes | 5.710 | % | 1/15/26 | 5,090,000 | 5,436,586 | (a) | ||||||||||
JPMorgan Chase & Co., Junior Subordinated Notes (6.000% to 8/1/23 then 3 mo. USD LIBOR + 3.300%) | 6.000 | % | 8/1/23 | 1,630,000 | 1,748,721 | (e)(f) | ||||||||||
Lloyds Banking Group PLC, Subordinated Notes | 4.650 | % | 3/24/26 | 840,000 | 909,212 | |||||||||||
NatWest Markets NV, Subordinated Notes | 7.750 | % | 5/15/23 | 490,000 | 555,162 | |||||||||||
Royal Bank of Scotland Group PLC, Junior Subordinated Notes (7.648% to 9/30/31 then 3 mo. USD LIBOR + 2.500%) | 7.648 | % | 9/30/31 | 660,000 | 946,341 | (e)(f) | ||||||||||
Royal Bank of Scotland Group PLC, Junior Subordinated Notes (8.625% to 8/15/21 then USD 5 year ICE Swap Rate + 7.598%) | 8.625 | % | 8/15/21 | 760,000 | 822,305 | (e)(f) | ||||||||||
Royal Bank of Scotland Group PLC, Subordinated Notes | 5.125 | % | 5/28/24 | 760,000 | 818,970 | |||||||||||
Santander UK Group Holdings PLC, Junior Subordinated Notes (7.375% to 6/24/22 then GBP 5 year Swap Rate + 5.543%) | 7.375 | % | 6/24/22 | 1,240,000 | GBP | 1,737,069 | (c)(e)(f) | |||||||||
TC Ziraat Bankasi AS, Senior Notes | 5.125 | % | 9/29/23 | 1,890,000 | 1,830,937 | (a) | ||||||||||
UniCredit SpA, Subordinated Notes (7.296% to 4/2/29 then USD 5 year ICE Swap Rate + 4.914%) | 7.296 | % | 4/2/34 | 2,170,000 | 2,499,301 | (a)(f) | ||||||||||
Wells Fargo & Co., Subordinated Notes | 4.300 | % | 7/22/27 | 1,000,000 | 1,097,720 | |||||||||||
Total Banks | 56,549,320 | |||||||||||||||
Capital Markets — 2.0% | ||||||||||||||||
Credit Suisse Group AG, Junior Subordinated Notes (7.250% to 9/12/25 then USD 5 year ICE Swap Rate + 4.332%) | 7.250 | % | 9/12/25 | 1,270,000 | 1,407,611 | (a)(e)(f) | ||||||||||
Donnelley Financial Solutions Inc., Senior Notes | 8.250 | % | 10/15/24 | 1,330,000 | 1,355,489 | |||||||||||
See Notes to Financial Statements.
| 10 | Western Asset Global High Income Fund Inc. 2019 Semi-Annual Report |
Table of Contents
Western Asset Global High Income Fund Inc.
| Security‡ | Rate | Maturity Date | Face Amount† | Value | ||||||||||||
Capital Markets — continued | ||||||||||||||||
Goldman Sachs Group Inc., Subordinated Notes | 6.750 | % | 10/1/37 | 2,800,000 | $ | 3,856,777 | ||||||||||
UBS Group AG, Junior Subordinated Notes (7.000% to 1/31/24 then USD 5 year ICE Swap Rate + 4.344%) | 7.000 | % | 1/31/24 | 2,490,000 | 2,701,650 | (a)(e)(f) | ||||||||||
Total Capital Markets | 9,321,527 | |||||||||||||||
Consumer Finance — 0.2% | ||||||||||||||||
Ally Financial Inc., Senior Notes | 8.000 | % | 3/15/20 | 129,000 | 130,705 | |||||||||||
Navient Corp., Senior Notes | 5.875 | % | 10/25/24 | 480,000 | 512,395 | |||||||||||
Navient Corp., Senior Notes | 6.750 | % | 6/15/26 | 410,000 | 439,768 | |||||||||||
Total Consumer Finance | 1,082,868 | |||||||||||||||
Diversified Financial Services — 2.5% | ||||||||||||||||
AerCap Ireland Capital DAC/ AerCap Global Aviation Trust, Senior Notes | 4.625 | % | 10/30/20 | 180,000 | 184,020 | |||||||||||
AerCap Ireland Capital DAC/ AerCap Global Aviation Trust, Senior Notes | 4.625 | % | 7/1/22 | 640,000 | 676,420 | |||||||||||
Allied Universal Holdco LLC/Allied Universal Finance Corp., Senior Secured Notes | 6.625 | % | 7/15/26 | 1,290,000 | 1,366,592 | (a) | ||||||||||
Banco Nacional de Comercio Exterior SNC, Senior Notes | 4.375 | % | 10/14/25 | 1,340,000 | 1,419,281 | (a) | ||||||||||
DAE Funding LLC, Senior Notes | 5.750 | % | 11/15/23 | 1,080,000 | 1,139,848 | (a) | ||||||||||
GE Capital International Funding Co. Unlimited Co., Senior Notes | 3.373 | % | 11/15/25 | 1,000,000 | 1,034,474 | |||||||||||
Global Aircraft Leasing Co. Ltd., Senior Notes (6.500% Cash or 7.250% PIK) | 6.500 | % | 9/15/24 | 2,300,000 | 2,358,190 | (a)(g) | ||||||||||
International Lease Finance Corp., Senior Notes | 8.250 | % | 12/15/20 | 2,620,000 | 2,781,847 | |||||||||||
International Lease Finance Corp., Senior Notes | 5.875 | % | 8/15/22 | 580,000 | 633,098 | |||||||||||
Total Diversified Financial Services | 11,593,770 | |||||||||||||||
Total Financials | 78,547,485 | |||||||||||||||
| Health Care — 7.9% | ||||||||||||||||
Health Care Equipment & Supplies — 0.2% |
| |||||||||||||||
Becton Dickinson and Co., Senior Notes | 3.700 | % | 6/6/27 | 1,109,000 | 1,188,123 | |||||||||||
See Notes to Financial Statements.
| Western Asset Global High Income Fund Inc. 2019 Semi-Annual Report | 11 |
Table of Contents
Schedule of investments(unaudited) (cont’d)
November 30, 2019
Western Asset Global High Income Fund Inc.
| Security‡ | Rate | Maturity Date | Face Amount† | Value | ||||||||||||
Health Care Providers & Services — 3.5% | ||||||||||||||||
Air Medical Group Holdings Inc., Senior Notes | 6.375 | % | 5/15/23 | 1,030,000 | $ | 899,102 | (a) | |||||||||
Aveanna Healthcare LLC | 9.750 | % | 12/15/26 | 630,000 | 658,350 | (a)(d) | ||||||||||
Centene Corp., Senior Notes | 6.125 | % | 2/15/24 | 630,000 | 655,594 | |||||||||||
Centene Corp., Senior Notes | 4.750 | % | 1/15/25 | 1,600,000 | 1,666,192 | |||||||||||
Centene Corp., Senior Notes | 4.250 | % | 12/15/27 | 370,000 | 381,563 | (a)(d) | ||||||||||
Centene Corp., Senior Notes | 4.625 | % | 12/15/29 | 990,000 | 1,040,738 | (a)(d) | ||||||||||
CHS/Community Health Systems Inc., Senior Secured Notes | 8.000 | % | 3/15/26 | 1,670,000 | 1,671,042 | (a) | ||||||||||
DaVita Inc., Senior Notes | 5.125 | % | 7/15/24 | 840,000 | 864,142 | |||||||||||
DaVita Inc., Senior Notes | 5.000 | % | 5/1/25 | 990,000 | 1,023,838 | |||||||||||
HCA Inc., Senior Notes | 5.625 | % | 9/1/28 | 2,190,000 | 2,480,230 | |||||||||||
HCA Inc., Senior Secured Notes | 5.250 | % | 6/15/26 | 820,000 | 917,414 | |||||||||||
HCA Inc., Senior Secured Notes | 4.125 | % | 6/15/29 | 1,000,000 | 1,055,534 | |||||||||||
Magellan Health Inc., Senior Notes | 4.900 | % | 9/22/24 | 3,020,000 | 3,059,003 | |||||||||||
Total Health Care Providers & Services |
| 16,372,742 | ||||||||||||||
Pharmaceuticals — 4.2% | ||||||||||||||||
Bausch Health Americas Inc., Senior Notes | 8.500 | % | 1/31/27 | 1,110,000 | 1,259,878 | (a) | ||||||||||
Bausch Health Cos. Inc., Senior Notes | 5.875 | % | 5/15/23 | 700,000 | 710,493 | (a) | ||||||||||
Bausch Health Cos. Inc., Senior Notes | 6.125 | % | 4/15/25 | 3,370,000 | 3,513,124 | (a) | ||||||||||
Bausch Health Cos. Inc., Senior Secured Notes | 7.000 | % | 3/15/24 | 700,000 | 734,118 | (a) | ||||||||||
Teva Pharmaceutical Finance Co. BV, Senior Notes | 3.650 | % | 11/10/21 | 1,960,000 | 1,926,778 | |||||||||||
Teva Pharmaceutical Finance Co. BV, Senior Notes | 2.950 | % | 12/18/22 | 5,490,000 | 5,229,225 | |||||||||||
Teva Pharmaceutical Finance IV BV, Senior Notes | 3.650 | % | 11/10/21 | 2,670,000 | 2,621,432 | |||||||||||
Teva Pharmaceutical Finance Netherlands III BV, Senior Notes | 2.200 | % | 7/21/21 | 400,000 | 387,600 | |||||||||||
Teva Pharmaceutical Finance Netherlands III BV, Senior Notes | 2.800 | % | 7/21/23 | 3,760,000 | 3,402,800 | |||||||||||
Total Pharmaceuticals | 19,785,448 | |||||||||||||||
Total Health Care | 37,346,313 | |||||||||||||||
See Notes to Financial Statements.
| 12 | Western Asset Global High Income Fund Inc. 2019 Semi-Annual Report |
Table of Contents
Western Asset Global High Income Fund Inc.
| Security‡ | Rate | Maturity Date | Face Amount† | Value | ||||||||||||
| Industrials — 4.7% | ||||||||||||||||
Airlines — 0.0% | ||||||||||||||||
Delta Air Lines Pass-Through Certificates Trust | 8.021 | % | 8/10/22 | 151,058 | $ | 166,223 | ||||||||||
Building Products — 1.0% | ||||||||||||||||
Standard Industries Inc., Senior Notes | 5.000 | % | 2/15/27 | 2,760,000 | 2,869,910 | (a) | ||||||||||
Standard Industries Inc., Senior Notes | 4.750 | % | 1/15/28 | 1,820,000 | 1,883,377 | (a) | ||||||||||
Total Building Products | 4,753,287 | |||||||||||||||
Commercial Services & Supplies — 2.0% | ||||||||||||||||
GFL Environmental Inc., Senior Notes | 8.500 | % | 5/1/27 | 1,390,000 | 1,482,612 | (a) | ||||||||||
United Rentals North America Inc., Senior Notes | 5.500 | % | 7/15/25 | 450,000 | 469,683 | |||||||||||
United Rentals North America Inc., Senior Notes | 6.500 | % | 12/15/26 | 4,280,000 | 4,682,010 | |||||||||||
United Rentals North America Inc., Senior Notes | 5.500 | % | 5/15/27 | 260,000 | 278,206 | |||||||||||
United Rentals North America Inc., Senior Notes | 4.875 | % | 1/15/28 | 2,170,000 | 2,269,614 | |||||||||||
Total Commercial Services & Supplies | 9,182,125 | |||||||||||||||
Industrial Conglomerates — 0.2% | ||||||||||||||||
Alfa SAB de CV, Senior Notes | 6.875 | % | 3/25/44 | 400,000 | 472,374 | (a) | ||||||||||
General Electric Co., Junior Subor dinated Notes (5.000% to 1/21/21 then 3 mo. USD LIBOR + 3.330%) | 5.000 | % | 1/21/21 | 400,000 | 391,892 | (e)(f) | ||||||||||
Total Industrial Conglomerates | 864,266 | |||||||||||||||
Machinery — 0.4% | ||||||||||||||||
Allison Transmission Inc., Senior Notes | 5.000 | % | 10/1/24 | 440,000 | 451,546 | (a) | ||||||||||
Allison Transmission Inc., Senior Notes | 4.750 | % | 10/1/27 | 1,434,000 | 1,477,518 | (a) | ||||||||||
Total Machinery | 1,929,064 | |||||||||||||||
Marine — 0.2% | ||||||||||||||||
Navios Maritime Acquisition Corp./ Navios Acquisition Finance U.S. Inc., Senior Secured Notes | 8.125 | % | 11/15/21 | 1,430,000 | 1,140,068 | (a) | ||||||||||
See Notes to Financial Statements.
| Western Asset Global High Income Fund Inc. 2019 Semi-Annual Report | 13 |
Table of Contents
Schedule of investments(unaudited) (cont’d)
November 30, 2019
Western Asset Global High Income Fund Inc.
| Security‡ | Rate | Maturity Date | Face Amount† | Value | ||||||||||||
Trading Companies & Distributors — 0.9% | ||||||||||||||||
Ashtead Capital Inc., Secured Notes | 4.125 | % | 8/15/25 | 2,180,000 | $ | 2,239,492 | (a) | |||||||||
Beacon Roofing Supply Inc., Senior Notes | 4.875 | % | 11/1/25 | 2,025,000 | 1,971,844 | (a) | ||||||||||
Total Trading Companies & Distributors |
| 4,211,336 | ||||||||||||||
Total Industrials | 22,246,369 | |||||||||||||||
| Information Technology — 1.5% | ||||||||||||||||
Communications Equipment — 0.4% | ||||||||||||||||
CommScope Inc., Senior Notes | 8.250 | % | 3/1/27 | 1,920,000 | 1,934,352 | (a) | ||||||||||
CommScope Technologies LLC, Senior Notes | 6.000 | % | 6/15/25 | 40,000 | 38,700 | (a) | ||||||||||
Total Communications Equipment | 1,973,052 | |||||||||||||||
Software — 0.1% | ||||||||||||||||
j2 Cloud Services LLC/j2 GlobalCo-Obligor Inc., Senior Notes | 6.000 | % | 7/15/25 | 490,000 | 519,395 | (a) | ||||||||||
Technology Hardware, Storage & Peripherals — 1.0% |
| |||||||||||||||
Dell International LLC/EMC Corp., Senior Notes | 7.125 | % | 6/15/24 | 690,000 | 730,538 | (a) | ||||||||||
Seagate HDD Cayman, Senior Notes | 4.750 | % | 6/1/23 | 410,000 | 431,146 | |||||||||||
Seagate HDD Cayman, Senior Notes | 4.750 | % | 1/1/25 | 1,330,000 | 1,400,033 | |||||||||||
Seagate HDD Cayman, Senior Notes | 4.875 | % | 6/1/27 | 630,000 | 666,229 | |||||||||||
Western Digital Corp., Senior Notes | 4.750 | % | 2/15/26 | 1,390,000 | 1,434,306 | |||||||||||
Total Technology Hardware, Storage & Peripherals |
| 4,662,252 | ||||||||||||||
Total Information Technology | 7,154,699 | |||||||||||||||
| Materials — 12.1% | ||||||||||||||||
Chemicals — 1.5% | ||||||||||||||||
Braskem America Finance Co., Senior Notes | 7.125 | % | 7/22/41 | 1,060,000 | 1,194,816 | (c) | ||||||||||
Mexichem SAB de CV, Senior Notes | 5.875 | % | 9/17/44 | 2,000,000 | 2,081,870 | (a) | ||||||||||
OCP SA, Senior Notes | 5.625 | % | 4/25/24 | 1,250,000 | 1,377,313 | (a) | ||||||||||
OCP SA, Senior Notes | 4.500 | % | 10/22/25 | 1,070,000 | 1,136,328 | (a) | ||||||||||
Valvoline Inc., Senior Notes | 4.375 | % | 8/15/25 | 1,250,000 | 1,281,769 | |||||||||||
Total Chemicals | 7,072,096 | |||||||||||||||
See Notes to Financial Statements.
| 14 | Western Asset Global High Income Fund Inc. 2019 Semi-Annual Report |
Table of Contents
Western Asset Global High Income Fund Inc.
| Security‡ | Rate | Maturity Date | Face Amount† | Value | ||||||||||||
Containers & Packaging — 3.2% | ||||||||||||||||
ARD Finance SA, Senior Secured Notes (6.500% Cash or 7.250% PIK) | 6.500 | % | 6/30/27 | 2,850,000 | $ | 2,847,007 | (a)(g) | |||||||||
Ardagh Packaging Finance PLC/ Ardagh Holdings USA Inc., Senior Notes | 6.000 | % | 2/15/25 | 3,890,000 | 4,094,225 | (a) | ||||||||||
Greif Inc., Senior Notes | 6.500 | % | 3/1/27 | 2,180,000 | 2,332,213 | (a) | ||||||||||
Pactiv LLC, Senior Notes | 7.950 | % | 12/15/25 | 2,220,000 | 2,451,246 | |||||||||||
Pactiv LLC, Senior Notes | 8.375 | % | 4/15/27 | 510,000 | 559,902 | |||||||||||
Suzano Trading Ltd., Senior Notes | 5.875 | % | 1/23/21 | 160,000 | 165,864 | (c) | ||||||||||
Trivium Packaging Finance BV, Senior Notes | 8.500 | % | 8/15/27 | 950,000 | 1,035,524 | (a) | ||||||||||
Trivium Packaging Finance BV, Senior Secured Notes | 5.500 | % | 8/15/26 | 1,310,000 | 1,377,975 | (a) | ||||||||||
Total Containers & Packaging | 14,863,956 | |||||||||||||||
Metals & Mining — 5.8% | ||||||||||||||||
Alcoa Nederland Holding BV, Senior Notes | 6.750 | % | 9/30/24 | 890,000 | 938,941 | (a) | ||||||||||
Alcoa Nederland Holding BV, Senior Notes | 7.000 | % | 9/30/26 | 1,870,000 | 2,037,968 | (a) | ||||||||||
Alcoa Nederland Holding BV, Senior Notes | 6.125 | % | 5/15/28 | 1,290,000 | 1,392,971 | (a) | ||||||||||
Anglo American Capital PLC, Senior Notes | 4.125 | % | 4/15/21 | 520,000 | 531,647 | (a) | ||||||||||
Anglo American Capital PLC, Senior Notes | 4.875 | % | 5/14/25 | 1,470,000 | 1,600,183 | (a) | ||||||||||
ArcelorMittal, Senior Notes | 7.000 | % | 10/15/39 | 1,140,000 | 1,380,624 | |||||||||||
First Quantum Minerals Ltd., Senior Notes | 7.000 | % | 2/15/21 | 854,000 | 858,804 | (a) | ||||||||||
First Quantum Minerals Ltd., Senior Notes | 7.250 | % | 5/15/22 | 2,490,000 | 2,520,361 | (a) | ||||||||||
Freeport-McMoRan Inc., Senior Notes | 4.000 | % | 11/14/21 | 830,000 | 846,932 | |||||||||||
Freeport-McMoRan Inc., Senior Notes | 3.875 | % | 3/15/23 | 680,000 | 695,572 | |||||||||||
Freeport-McMoRan Inc., Senior Notes | 4.550 | % | 11/14/24 | 2,080,000 | 2,191,197 | |||||||||||
Freeport-McMoRan Inc., Senior Notes | 5.400 | % | 11/14/34 | 2,530,000 | 2,516,901 | |||||||||||
Freeport-McMoRan Inc., Senior Notes | 5.450 | % | 3/15/43 | 960,000 | 924,096 | |||||||||||
See Notes to Financial Statements.
| Western Asset Global High Income Fund Inc. 2019 Semi-Annual Report | 15 |
Table of Contents
Schedule of investments(unaudited) (cont’d)
November 30, 2019
Western Asset Global High Income Fund Inc.
| Security‡ | Rate | Maturity Date | Face Amount† | Value | ||||||||||||
Metals & Mining — continued | ||||||||||||||||
Southern Copper Corp., Senior Notes | 6.750 | % | 4/16/40 | 730,000 | $ | 954,107 | ||||||||||
Southern Copper Corp., Senior Notes | 5.250 | % | 11/8/42 | 2,380,000 | 2,688,084 | |||||||||||
Teck Resources Ltd., Senior Notes | 6.250 | % | 7/15/41 | 460,000 | 518,930 | |||||||||||
Vale Overseas Ltd., Senior Notes | 4.375 | % | 1/11/22 | 4,660,000 | 4,836,204 | |||||||||||
Total Metals & Mining | 27,433,522 | |||||||||||||||
Paper & Forest Products — 1.6% | ||||||||||||||||
Inversiones CMPC SA, Senior Notes | 4.500 | % | 4/25/22 | 500,000 | 516,506 | (a) | ||||||||||
Inversiones CMPC SA, Senior Notes | 4.375 | % | 5/15/23 | 460,000 | 475,340 | (a) | ||||||||||
Mercer International Inc., Senior Notes | 7.375 | % | 1/15/25 | 2,640,000 | 2,812,168 | |||||||||||
Suzano Austria GmbH, Senior Notes | 5.750 | % | 7/14/26 | 3,400,000 | 3,783,681 | (a) | ||||||||||
Total Paper & Forest Products | 7,587,695 | |||||||||||||||
Total Materials | 56,957,269 | |||||||||||||||
| Real Estate — 1.4% | ||||||||||||||||
Equity Real Estate Investment Trusts (REITs) — 1.4% |
| |||||||||||||||
CoreCivic Inc., Senior Notes | 4.125 | % | 4/1/20 | 110,000 | 110,406 | |||||||||||
CoreCivic Inc., Senior Notes | 5.000 | % | 10/15/22 | 570,000 | 570,890 | |||||||||||
CoreCivic Inc., Senior Notes | 4.625 | % | 5/1/23 | 360,000 | 352,350 | |||||||||||
CoreCivic Inc., Senior Notes | 4.750 | % | 10/15/27 | 1,490,000 | 1,206,937 | |||||||||||
MPT Operating Partnership LP/MPT Finance Corp., Senior Notes | 6.375 | % | 3/1/24 | 780,000 | 816,801 | |||||||||||
MPT Operating Partnership LP/MPT Finance Corp., Senior Notes | 5.250 | % | 8/1/26 | 2,070,000 | 2,204,617 | |||||||||||
MPT Operating Partnership LP/MPT Finance Corp., Senior Notes | 5.000 | % | 10/15/27 | 1,070,000 | 1,126,202 | |||||||||||
Total Real Estate | 6,388,203 | |||||||||||||||
| Utilities — 1.5% | ||||||||||||||||
Electric Utilities — 0.4% | ||||||||||||||||
FirstEnergy Corp., Senior Notes | 7.375 | % | 11/15/31 | 330,000 | 462,745 | |||||||||||
Pampa Energia SA, Senior Notes | 7.375 | % | 7/21/23 | 1,540,000 | 1,325,039 | (c) | ||||||||||
Total Electric Utilities | 1,787,784 | |||||||||||||||
Gas Utilities — 0.7% | ||||||||||||||||
Suburban Propane Partners LP/ Suburban Energy Finance Corp., Senior Notes | 5.875 | % | 3/1/27 | 3,100,000 | 3,187,877 | |||||||||||
See Notes to Financial Statements.
| 16 | Western Asset Global High Income Fund Inc. 2019 Semi-Annual Report |
Table of Contents
Western Asset Global High Income Fund Inc.
| Security‡ | Rate | Maturity Date | Face Amount† | Value | ||||||||||||
Independent Power and Renewable Electricity Producers — 0.4% |
| |||||||||||||||
Minejesa Capital BV, Senior Secured Notes | 5.625 | % | 8/10/37 | 1,780,000 | $ | 1,923,342 | (a) | |||||||||
Total Utilities | 6,899,003 | |||||||||||||||
Total Corporate Bonds & Notes (Cost — $411,225,160) |
| 454,642,683 | ||||||||||||||
| Sovereign Bonds — 27.2% | ||||||||||||||||
Argentina — 1.7% | ||||||||||||||||
Argentina POM Politica Monetaria, Bonds (Argentina Central Bank 7 Day Repo Reference Rate) | 70.941 | % | 6/21/20 | 42,670,000 | ARS | 185,312 | (f)(h) | |||||||||
Argentine Republic Government International Bond, Senior Notes | 6.875 | % | 4/22/21 | 2,680,000 | 1,211,119 | |||||||||||
Argentine Republic Government International Bond, Senior Notes | 5.625 | % | 1/26/22 | 5,780,000 | 2,521,883 | |||||||||||
Argentine Republic Government International Bond, Senior Notes | 4.625 | % | 1/11/23 | 5,570,000 | 2,274,872 | |||||||||||
Provincia de Buenos Aires, Senior Notes | 9.950 | % | 6/9/21 | 4,780,000 | 1,935,900 | (a) | ||||||||||
Total Argentina | 8,129,086 | |||||||||||||||
Armenia — 0.2% | ||||||||||||||||
Republic of Armenia International Bond, Senior Notes | 3.950 | % | 9/26/29 | 800,000 | 792,275 | (a) | ||||||||||
Brazil — 1.6% | ||||||||||||||||
Brazil Notas do Tesouro Nacional Serie F, Notes | 10.000 | % | 1/1/21 | 2,826,000 | BRL | 702,904 | ||||||||||
Brazil Notas do Tesouro Nacional Serie F, Notes | 10.000 | % | 1/1/23 | 18,677,000 | BRL | 4,892,470 | ||||||||||
Brazilian Government International Bond, Senior Notes | 4.625 | % | 1/13/28 | 1,750,000 | 1,865,063 | |||||||||||
Total Brazil | 7,460,437 | |||||||||||||||
Colombia — 1.4% | ||||||||||||||||
Colombia Government International Bond, Senior Notes | 7.375 | % | 9/18/37 | 4,542,000 | 6,385,757 | |||||||||||
Costa Rica — 0.5% | ||||||||||||||||
Costa Rica Government International Bond, Senior Notes | 6.125 | % | 2/19/31 | 1,980,000 | 2,005,740 | (a) | ||||||||||
Costa Rica Government International Bond, Senior Notes | 7.158 | % | 3/12/45 | 500,000 | 506,092 | (a) | ||||||||||
Total Costa Rica | 2,511,832 | |||||||||||||||
See Notes to Financial Statements.
| Western Asset Global High Income Fund Inc. 2019 Semi-Annual Report | 17 |
Table of Contents
Schedule of investments(unaudited) (cont’d)
November 30, 2019
Western Asset Global High Income Fund Inc.
| Security‡ | Rate | Maturity Date | Face Amount† | Value | ||||||||||||
Croatia — 0.3% | ||||||||||||||||
Croatia Government International Bond, Senior Notes | 6.625 | % | 7/14/20 | 630,000 | $ | 647,377 | (a) | |||||||||
Croatia Government International Bond, Senior Notes | 5.500 | % | 4/4/23 | 450,000 | 497,009 | (c) | ||||||||||
Croatia Government International Bond, Senior Notes | 5.500 | % | 4/4/23 | 410,000 | 452,830 | (a) | ||||||||||
Total Croatia | 1,597,216 | |||||||||||||||
Dominican Republic — 0.9% | ||||||||||||||||
Dominican Republic International Bond, Senior Notes | 5.500 | % | 1/27/25 | 4,120,000 | 4,389,098 | (a) | ||||||||||
Ecuador — 1.0% | ||||||||||||||||
Ecuador Government International Bond, Senior Notes | 10.500 | % | 3/24/20 | 2,100,000 | 2,077,828 | (a) | ||||||||||
Ecuador Government International Bond, Senior Notes | 10.750 | % | 3/28/22 | 200,000 | 176,562 | (c) | ||||||||||
Ecuador Government International Bond, Senior Notes | 10.750 | % | 3/28/22 | 2,820,000 | 2,489,530 | (a) | ||||||||||
Total Ecuador | 4,743,920 | |||||||||||||||
Egypt — 0.5% | ||||||||||||||||
Egypt Government International Bond, Senior Notes | 7.600 | % | 3/1/29 | 1,950,000 | 2,073,318 | (a) | ||||||||||
Ghana — 0.5% | ||||||||||||||||
Ghana Government International Bond, Senior Notes | 8.125 | % | 1/18/26 | 270,000 | 284,850 | (a) | ||||||||||
Ghana Government International Bond, Senior Notes | 10.750 | % | 10/14/30 | 920,000 | 1,152,705 | (a) | ||||||||||
Ghana Government International Bond, Senior Notes | 8.125 | % | 3/26/32 | 900,000 | 889,481 | (a) | ||||||||||
Total Ghana | 2,327,036 | |||||||||||||||
Guatemala — 0.4% | ||||||||||||||||
Guatemala Government Bond, Senior Notes | 4.375 | % | 6/5/27 | 1,970,000 | 2,012,547 | (a) | ||||||||||
Honduras — 0.4% | ||||||||||||||||
Honduras Government International Bond, Senior Notes | 7.500 | % | 3/15/24 | 400,000 | 442,666 | (c) | ||||||||||
Honduras Government International Bond, Senior Notes | 6.250 | % | 1/19/27 | 1,200,000 | 1,290,417 | (a) | ||||||||||
Total Honduras | 1,733,083 | |||||||||||||||
See Notes to Financial Statements.
| 18 | Western Asset Global High Income Fund Inc. 2019 Semi-Annual Report |
Table of Contents
Western Asset Global High Income Fund Inc.
| Security‡ | Rate | Maturity Date | Face Amount† | Value | ||||||||||||
Hungary — 0.3% | ||||||||||||||||
Hungary Government International Bond, Senior Notes | 5.750 | % | 11/22/23 | 942,000 | $ | 1,062,963 | ||||||||||
Hungary Government International Bond, Senior Notes | 5.375 | % | 3/25/24 | 300,000 | 338,213 | |||||||||||
Total Hungary | 1,401,176 | |||||||||||||||
Indonesia — 5.5% | ||||||||||||||||
Indonesia Government International Bond, Senior Notes | 5.875 | % | 1/15/24 | 2,369,000 | 2,677,915 | (a) | ||||||||||
Indonesia Government International Bond, Senior Notes | 4.125 | % | 1/15/25 | 1,110,000 | 1,187,327 | (a) | ||||||||||
Indonesia Government International Bond, Senior Notes | 3.850 | % | 7/18/27 | 7,140,000 | 7,576,983 | (a) | ||||||||||
Indonesia Government International Bond, Senior Notes | 3.500 | % | 1/11/28 | 4,370,000 | 4,542,290 | |||||||||||
Indonesia Government International Bond, Senior Notes | 6.625 | % | 2/17/37 | 4,635,000 | 6,246,720 | (c) | ||||||||||
Indonesia Treasury Bond, Senior Notes | 8.250 | % | 7/15/21 | 7,604,000,000 | IDR | 558,755 | ||||||||||
Indonesia Treasury Bond, Senior Notes | 7.000 | % | 5/15/22 | 40,240,000,000 | IDR | 2,912,372 | ||||||||||
Indonesia Treasury Bond, Senior Notes | 8.375 | % | 3/15/34 | 209,000,000 | IDR | 15,968 | ||||||||||
Total Indonesia | 25,718,330 | |||||||||||||||
Ivory Coast — 0.3% | ||||||||||||||||
Ivory Coast Government International Bond, Senior Notes | 5.750 | % | 12/31/32 | 1,320,000 | 1,299,725 | (a) | ||||||||||
Jamaica — 0.1% | ||||||||||||||||
Jamaica Government International Bond, Senior Notes | 8.000 | % | 3/15/39 | 500,000 | 661,718 | |||||||||||
Kenya — 0.1% | ||||||||||||||||
Kenya Government International Bond, Senior Notes | 7.250 | % | 2/28/28 | 600,000 | 629,228 | (a) | ||||||||||
Mexico — 1.3% | ||||||||||||||||
Mexican Bonos, Bonds | 6.500 | % | 6/9/22 | 23,000,000 | MXN | 1,167,872 | ||||||||||
Mexico Government International Bond, Senior Notes | 3.600 | % | 1/30/25 | 2,200,000 | 2,301,156 | |||||||||||
Mexico Government International Bond, Senior Notes | 3.750 | % | 1/11/28 | 2,400,000 | 2,490,600 | |||||||||||
Total Mexico | 5,959,628 | |||||||||||||||
See Notes to Financial Statements.
| Western Asset Global High Income Fund Inc. 2019 Semi-Annual Report | 19 |
Table of Contents
Schedule of investments(unaudited) (cont’d)
November 30, 2019
Western Asset Global High Income Fund Inc.
| Security‡ | Rate | Maturity Date | Face Amount† | Value | ||||||||||||
Nigeria — 0.5% | ||||||||||||||||
Nigeria Government International Bond, Senior Notes | 7.143 | % | 2/23/30 | 2,200,000 | $ | 2,190,925 | (a) | |||||||||
Panama — 0.1% | ||||||||||||||||
Panama Government International Bond, Senior Notes | 6.700 | % | 1/26/36 | 460,000 | 648,460 | |||||||||||
Paraguay — 0.2% | ||||||||||||||||
Paraguay Government International Bond, Senior Notes | 5.000 | % | 4/15/26 | 730,000 | 803,984 | (a) | ||||||||||
Peru — 1.1% | ||||||||||||||||
Peruvian Government International Bond, Senior Notes | 7.350 | % | 7/21/25 | 750,000 | 948,686 | |||||||||||
Peruvian Government International Bond, Senior Notes | 8.750 | % | 11/21/33 | 2,604,000 | 4,290,995 | |||||||||||
Total Peru | 5,239,681 | |||||||||||||||
Poland — 0.3% | ||||||||||||||||
Republic of Poland Government International Bond, Senior Notes | 5.125 | % | 4/21/21 | 1,390,000 | 1,451,930 | |||||||||||
Russia — 2.9% | ||||||||||||||||
Russian Federal Bond — OFZ | 7.000 | % | 1/25/23 | 74,770,000 | RUB | 1,198,261 | ||||||||||
Russian Federal Bond — OFZ | 7.750 | % | 9/16/26 | 375,770,000 | RUB | 6,339,206 | ||||||||||
Russian Foreign Bond — Eurobond, Senior Notes | 12.750 | % | 6/24/28 | 42,000 | 72,218 | (c) | ||||||||||
Russian Foreign Bond — Eurobond, Senior Notes | 5.875 | % | 9/16/43 | 4,400,000 | 5,752,384 | (a) | ||||||||||
Total Russia | 13,362,069 | |||||||||||||||
Senegal — 0.1% | ||||||||||||||||
Senegal Government International Bond, Senior Notes | 6.250 | % | 7/30/24 | 450,000 | 493,527 | (c) | ||||||||||
Sri Lanka — 0.6% | ||||||||||||||||
Sri Lanka Government International Bond, Senior Notes | 6.250 | % | 7/27/21 | 2,700,000 | 2,713,500 | (c) | ||||||||||
Turkey — 1.5% | ||||||||||||||||
Turkey Government International Bond, Senior Notes | 4.250 | % | 4/14/26 | 5,000,000 | 4,603,725 | |||||||||||
Turkey Government International Bond, Senior Notes | 4.875 | % | 10/9/26 | 2,800,000 | 2,640,532 | |||||||||||
Total Turkey | 7,244,257 | |||||||||||||||
See Notes to Financial Statements.
| 20 | Western Asset Global High Income Fund Inc. 2019 Semi-Annual Report |
Table of Contents
Western Asset Global High Income Fund Inc.
| Security‡ | Rate | Maturity Date | Face Amount† | Value | ||||||||||||
Ukraine — 1.1% | ||||||||||||||||
Ukraine Government International Bond, Senior Notes | 7.750 | % | 9/1/20 | 1,810,000 | $ | 1,862,716 | (a) | |||||||||
Ukraine Government International Bond, Senior Notes | 7.375 | % | 9/25/32 | 3,300,000 | 3,367,096 | (a) | ||||||||||
Total Ukraine | 5,229,812 | |||||||||||||||
United Arab Emirates — 1.3% | ||||||||||||||||
Abu Dhabi Government International Bond, Senior Notes | 2.125 | % | 9/30/24 | 6,150,000 | 6,128,290 | (a) | ||||||||||
Uruguay — 0.4% | ||||||||||||||||
Uruguay Government International Bond, Senior Notes | 9.875 | % | 6/20/22 | 62,870,000 | UYU | 1,632,522 | (c) | |||||||||
Uruguay Government International Bond, Senior Notes | 8.500 | % | 3/15/28 | 16,630,000 | UYU | 378,456 | (c) | |||||||||
Total Uruguay | 2,010,978 | |||||||||||||||
Venezuela — 0.1% | ||||||||||||||||
Venezuela Government International Bond, Senior Notes | 8.250 | % | 10/13/24 | 3,460,000 | 406,550 | (c) | ||||||||||
Total Sovereign Bonds (Cost — $121,074,923) |
| 127,749,373 | ||||||||||||||
| Senior Loans — 10.7% | ||||||||||||||||
| Communication Services — 1.7% | ||||||||||||||||
Media — 1.7% | ||||||||||||||||
Charter Communications Operating LLC, Term Loan B1 (3 mo. USD LIBOR + 1.750%) | 3.450 | % | 4/30/25 | 4,024,218 | 4,045,059 | (f)(i)(j) | ||||||||||
iHeartCommunications Inc., Term Loan (1 mo. USD LIBOR + 4.000%) | 5.781 | % | 5/1/26 | 1,112,428 | 1,121,327 | (f)(i)(j)(k) | ||||||||||
Lamar Media Corp., Term Loan B (1 mo. USD LIBOR + 1.750%) | 3.500 | % | 3/14/25 | 2,659,500 | 2,677,784 | (f)(i)(j) | ||||||||||
Total Communication Services | 7,844,170 | |||||||||||||||
| Consumer Discretionary — 7.3% | ||||||||||||||||
Auto Components — 0.2% | ||||||||||||||||
American Axle & Manufacturing Inc., Term Loan B | 3.960-4.190 | % | 4/6/24 | 1,040,000 | 1,023,966 | (f)(i)(j) | ||||||||||
Diversified Consumer Services — 1.0% |
| |||||||||||||||
Prime Security Services Borrower LLC, 2019 Refinancing Term Loan B1 (1 mo. USD LIBOR + 3.250%) | 5.035 | % | 9/23/26 | 4,870,000 | 4,821,909 | (f)(i)(j)(k) | ||||||||||
See Notes to Financial Statements.
| Western Asset Global High Income Fund Inc. 2019 Semi-Annual Report | 21 |
Table of Contents
Schedule of investments(unaudited) (cont’d)
November 30, 2019
Western Asset Global High Income Fund Inc.
| Security‡ | Rate | Maturity Date | Face Amount† | Value | ||||||||||||
Hotels, Restaurants & Leisure — 4.7% | ||||||||||||||||
1011778 BC Unlimited Liability Co., Term Loan B4 (1 mo. USD LIBOR + 1.750%) | 3.452 | % | 11/19/26 | 2,828,008 | $ | 2,830,129 | (f)(i)(j) | |||||||||
Aramark Services Inc., Term Loan B3 (1 mo. USD LIBOR + 1.750%) | 3.452 | % | 3/11/25 | 6,392,877 | 6,410,425 | (f)(i)(j) | ||||||||||
Caesars Resort Collection LLC, Term Loan B (1 mo. USD LIBOR + 2.750%) | 4.452 | % | 12/23/24 | 1,293,418 | 1,286,142 | (f)(i)(j) | ||||||||||
Four Seasons Hotels Ltd., Restated Term Loan (1 mo. USD LIBOR + 2.000%) | 3.702 | % | 11/30/23 | 748,077 | 752,618 | (f)(i)(j) | ||||||||||
Hilton Worldwide Finance LLC, Term Loan B2 (1 mo. USD LIBOR + 1.750%) | 3.458 | % | 6/22/26 | 8,324,194 | 8,374,664 | (f)(i)(j) | ||||||||||
Wyndham Hotels & Resorts Inc., Term Loan B (1 mo. USD LIBOR + 1.750%) | 3.452 | % | 5/30/25 | 2,197,800 | 2,210,851 | (f)(i)(j) | ||||||||||
Total Hotels, Restaurants & Leisure | 21,864,829 | |||||||||||||||
Specialty Retail — 1.4% | ||||||||||||||||
Party City Holdings Inc., 2018 Replacement Term Loan | — | 8/19/22 | 2,130,000 | 1,909,013 | (k) | |||||||||||
PetSmart Inc., Term Loan B2 (1 mo. USD LIBOR + 4.000%) | 5.770 | % | 3/11/22 | 4,918,413 | 4,792,378 | (f)(i)(j) | ||||||||||
Total Specialty Retail | 6,701,391 | |||||||||||||||
Total Consumer Discretionary | 34,412,095 | |||||||||||||||
| Financials — 0.4% | ||||||||||||||||
Diversified Financial Services — 0.4% | ||||||||||||||||
Trans Union LLC, Term Loan B5 (1 mo. USD LIBOR + 1.750%) | 3.452 | % | 11/16/26 | 2,040,963 | 2,045,811 | (f)(i)(j) | ||||||||||
| Health Care — 0.5% | ||||||||||||||||
Health Care Providers & Services — 0.5% | ||||||||||||||||
Option Care Health Inc., First Lien Term Loan B (1 mo. USD LIBOR + 4.500%) | 6.202 | % | 8/6/26 | 1,350,000 | 1,329,329 | (f)(i)(j) | ||||||||||
U.S. Renal Care Inc., First Lien Term Loan B (1 mo. USD LIBOR + 5.000%) | 6.750 | % | 6/12/26 | 930,000 | 886,987 | (f)(i)(j) | ||||||||||
Total Health Care | 2,216,316 | |||||||||||||||
See Notes to Financial Statements.
| 22 | Western Asset Global High Income Fund Inc. 2019 Semi-Annual Report |
Table of Contents
Western Asset Global High Income Fund Inc.
| Security‡ | Rate | Maturity Date | Face Amount† | Value | ||||||||||||
| Industrials — 0.7% | ||||||||||||||||
Air Freight & Logistics — 0.5% | ||||||||||||||||
Avolon TLB Borrower 1 (US) LLC, Term Loan B3 (1 mo. USD LIBOR + 1.750%) | 3.474 | % | 1/15/25 | 2,406,476 | $ | 2,420,200 | (f)(i)(j) | |||||||||
Trading Companies & Distributors — 0.2% | ||||||||||||||||
Delos Finance SARL, 2018 Term Loan (3 mo. USD LIBOR + 1.750%) | 3.854 | % | 10/6/23 | 833,333 | 837,396 | (f)(i)(j) | ||||||||||
Total Industrials | 3,257,596 | |||||||||||||||
| Utilities — 0.1% | ||||||||||||||||
Electric Utilities — 0.1% | ||||||||||||||||
Panda Temple Power LLC, Second Lien Term Loan (1 mo. USD LIBOR + 8.000% PIK) | 9.702 | % | 2/7/23 | 345,234 | 346,745 | (f)(g)(i)(j) | ||||||||||
Total Senior Loans (Cost — $49,404,688) |
| 50,122,733 | ||||||||||||||
| U.S. Government & Agency Obligations — 6.9% |
| |||||||||||||||
U.S. Government Obligations — 6.9% | ||||||||||||||||
U.S. Treasury Notes | 2.250 | % | 4/30/21 | 3,000,000 | 3,023,906 | (l) | ||||||||||
U.S. Treasury Notes | 1.500 | % | 8/31/21 | 2,100,000 | 2,094,381 | |||||||||||
U.S. Treasury Notes | 1.750 | % | 11/30/21 | 1,000,000 | 1,002,481 | |||||||||||
U.S. Treasury Notes | 1.750 | % | 7/15/22 | 2,250,000 | 2,258,394 | |||||||||||
U.S. Treasury Notes | 1.625 | % | 5/31/23 | 2,500,000 | 2,501,758 | (l) | ||||||||||
U.S. Treasury Notes | 2.750 | % | 8/31/23 | 4,250,000 | 4,424,399 | (l) | ||||||||||
U.S. Treasury Notes | 2.875 | % | 9/30/23 | 2,700,000 | 2,825,561 | (l) | ||||||||||
U.S. Treasury Notes | 2.125 | % | 11/30/23 | 4,750,000 | 4,843,237 | (l) | ||||||||||
U.S. Treasury Notes | 2.125 | % | 3/31/24 | 3,900,000 | 3,980,818 | (l) | ||||||||||
U.S. Treasury Notes | 2.000 | % | 6/30/24 | 3,250,000 | 3,302,749 | (l) | ||||||||||
U.S. Treasury Notes | 1.625 | % | 8/15/29 | 2,350,000 | 2,315,576 | |||||||||||
Total U.S. Government & Agency Obligations (Cost — $31,736,588) |
| 32,573,260 | ||||||||||||||
| Convertible Bonds & Notes — 0.9% | ||||||||||||||||
| Communication Services — 0.8% | ||||||||||||||||
Media — 0.8% | ||||||||||||||||
DISH Network Corp., Senior Notes | 2.375 | % | 3/15/24 | 4,030,000 | 3,653,457 | |||||||||||
| Energy — 0.1% | ||||||||||||||||
Oil, Gas & Consumable Fuels — 0.1% | ||||||||||||||||
Chesapeake Energy Corp., Senior Notes | 5.500 | % | 9/15/26 | 1,870,000 | 826,768 | |||||||||||
Total Convertible Bonds & Notes (Cost — $4,902,121) |
| 4,480,225 | ||||||||||||||
See Notes to Financial Statements.
| Western Asset Global High Income Fund Inc. 2019 Semi-Annual Report | 23 |
Table of Contents
Schedule of investments(unaudited) (cont’d)
November 30, 2019
Western Asset Global High Income Fund Inc.
| Security‡ | Rate | Maturity Date | Face Amount† | Value | ||||||||||||
| Non-U.S. Treasury Inflation Protected Securities — 0.1% | ||||||||||||||||
Argentina — 0.1% | ||||||||||||||||
Bonos de la Nacion Argentina con Ajuste por CER, Bonds (Cost — $1,951,915) | 4.000 | % | 3/6/20 | 61,819,189 | ARS | $ | 266,220 | (h) | ||||||||
| Shares | ||||||||||||||||
| Common Stocks — 0.0% | ||||||||||||||||
| Consumer Discretionary — 0.0% | ||||||||||||||||
Hotels, Restaurants & Leisure — 0.0% | ||||||||||||||||
Bossier Escrow Shares | 65,403 | 15,173 | *(h)(m) | |||||||||||||
| Energy — 0.0% | ||||||||||||||||
Energy Equipment & Services — 0.0% | ||||||||||||||||
Hercules Offshore Inc. (Escrow) | 37,071 | 21,606 | *(h)(m) | |||||||||||||
KCAD Holdings I Ltd. | 77,972,021 | 0 | *(h)(m)(n) | |||||||||||||
Total Energy Equipment & Services | 21,606 | |||||||||||||||
Oil, Gas & Consumable Fuels — 0.0% | ||||||||||||||||
MWO Holdings LLC | 417 | 31,888 | *(h)(m) | |||||||||||||
Total Energy | 53,494 | |||||||||||||||
Total Common Stocks (Cost — $2,345,934) |
| 68,667 | ||||||||||||||
| Expiration Date | Rights | |||||||||||||||
| Rights — 0.0% | ||||||||||||||||
DISH Network Corp. (Cost — $0) | 12/10/19 | 2,653 | 1,804 | * | ||||||||||||
Total Investments before Short-Term Investments (Cost — $622,641,329) |
| 669,904,965 | ||||||||||||||
| Rate | Shares | |||||||||||||||
| Short-Term Investments — 1.5% | ||||||||||||||||
Dreyfus Government Cash Management, Institutional Shares (Cost — $6,808,167) | 1.556 | % | 6,808,167 | 6,808,167 | ||||||||||||
Total Investments — 144.0% (Cost — $629,449,496) |
| 676,713,132 | ||||||||||||||
Liabilities in Excess of Other Assets — (44.0)% |
| (206,617,714 | ) | |||||||||||||
Total Net Assets — 100.0% | $ | 470,095,418 | ||||||||||||||
See Notes to Financial Statements.
| 24 | Western Asset Global High Income Fund Inc. 2019 Semi-Annual Report |
Table of Contents
Western Asset Global High Income Fund Inc.
| † | Face amount denominated in U.S. dollars, unless otherwise noted. |
| ‡ | Securities held by the Fund are subject to a lien, granted to the lender, to the extent of the borrowing outstanding and any additional expenses. |
| * | Non-income producing security. |
| (a) | Security is exempt from registration under Rule 144A of the Securities Act of 1933. This security may be resold in transactions that are exempt from registration, normally to qualified institutional buyers. This security has been deemed liquid pursuant to guidelines approved by the Board of Directors. |
| (b) | The coupon payment on these securities is currently in default as of November 30, 2019. |
| (c) | Security is exempt from registration under Regulation S of the Securities Act of 1933. Regulation S applies to securities offerings that are made outside of the United States and do not involve direct selling efforts in the United States. This security has been deemed liquid pursuant to guidelines approved by the Board of Directors. |
| (d) | Securities traded on a when-issued or delayed delivery basis. |
| (e) | Security has no maturity date. The date shown represents the next call date. |
| (f) | Variable rate security. Interest rate disclosed is as of the most recent information available. Certain variable rate securities are not based on a published reference rate and spread but are determined by the issuer or agent and are based on current market conditions. These securities do not indicate a reference rate and spread in their description above. |
| (g) | Payment-in-kind security for which the issuer has the option at each interest payment date of making interest payments in cash or additional securities. |
| (h) | Security is valued in good faith in accordance with procedures approved by the Board of Directors (Note 1). |
| (i) | Interest rates disclosed represent the effective rates on senior loans. Ranges in interest rates are attributable to multiple contracts under the same loan. |
| (j) | Senior loans may be considered restricted in that the Fund ordinarily is contractually obligated to receive approval from the agent bank and/or borrower prior to the disposition of a senior loan. |
| (k) | All or a portion of this loan is unfunded as of November 30, 2019. The interest rate for fully unfunded term loans is to be determined. |
| (l) | All or a portion of this security is held by the counterparty as collateral for open reverse repurchase agreements. |
| (m) | Security is valued using significant unobservable inputs (Note 1). |
| (n) | Value is less than $1. |
Abbreviations used in this schedule: | ||||
| ARS | — | Argentine Peso | ||
| BRL | — | Brazilian Real | ||
| CER | — | Coeficente de Establilzacion de Referencia | ||
| EUR | — | Euro | ||
| GBP | — | British Pound | ||
| ICE | — | Intercontinental Exchange | ||
| IDR | — | Indonesian Rupiah | ||
| JSC | — | Joint Stock Company | ||
| LIBOR | — | London Interbank Offered Rate | ||
| MXN | — | Mexican Peso | ||
| OJSC | — | Open Joint Stock Company | ||
| PIK | — | Payment-In-Kind | ||
| RUB | — | Russian Ruble | ||
| USD | — | United States Dollar | ||
| UYU | — | Uruguayan Peso | ||
See Notes to Financial Statements.
| Western Asset Global High Income Fund Inc. 2019 Semi-Annual Report | 25 |
Table of Contents
Schedule of investments(unaudited) (cont’d)
November 30, 2019
Western Asset Global High Income Fund Inc.
| Summary of Investments by Country** | ||||
| United States | 48.1 | % | ||
| Brazil | 5.3 | |||
| United Kingdom | 4.4 | |||
| Indonesia | 4.3 | |||
| Russia | 3.1 | |||
| Argentina | 2.7 | |||
| Mexico | 2.5 | |||
| Colombia | 2.3 | |||
| France | 2.3 | |||
| Italy | 2.0 | |||
| Israel | 2.0 | |||
| Canada | 1.8 | |||
| Netherlands | 1.4 | |||
| Peru | 1.4 | |||
| Turkey | 1.4 | |||
| Ireland | 1.2 | |||
| United Arab Emirates | 1.1 | |||
| Luxembourg | 1.0 | |||
| Ukraine | 0.8 | |||
| Ecuador | 0.7 | |||
| Dominican Republic | 0.7 | |||
| Cayman Islands | 0.6 | |||
| Switzerland | 0.6 | |||
| Germany | 0.5 | |||
| Zambia | 0.5 | |||
| Spain | 0.5 | |||
| Sri Lanka | 0.4 | |||
| Morocco | 0.4 | |||
| Costa Rica | 0.4 | |||
| Ghana | 0.3 | |||
| Nigeria | 0.3 | |||
| Kazakhstan | 0.3 | |||
| Panama | 0.3 | |||
| South Africa | 0.3 | |||
| Egypt | 0.3 | |||
| Guatemala | 0.3 | |||
| Uruguay | 0.3 | |||
| Honduras | 0.3 | |||
| Belgium | 0.2 | |||
| Croatia | 0.2 | |||
| Poland | 0.2 | |||
See Notes to Financial Statements.
| 26 | Western Asset Global High Income Fund Inc. 2019 Semi-Annual Report |
Table of Contents
Western Asset Global High Income Fund Inc.
| Summary of Investments by Country** (cont’d) | ||||
| Hungary | 0.2 | % | ||
| Ivory Coast | 0.2 | |||
| Macau | 0.2 | |||
| Chile | 0.1 | |||
| Paraguay | 0.1 | |||
| Armenia | 0.1 | |||
| Jamaica | 0.1 | |||
| Kenya | 0.1 | |||
| Venezuela | 0.1 | |||
| Senegal | 0.1 | |||
| Short-Term Investments | 1.0 | |||
| 100.0 | % | |||
| ** | As a percentage of total investments. Please note that the Fund holdings are as of November 30, 2019 and are subject to change. |
At November 30, 2019, the Fund had the following open reverse repurchase agreements:
| Counterparty | Rate | Effective Date | Maturity Date | Face Amount of Reverse | Asset Class of Collateral* | Collateral Value | ||||||||||||||||
| Deutsche Bank AG | 1.800 | % | 11/21/2019 | 12/13/2019 | $ | 3,308,906 | U.S. Government & Agency Obligations | $ | 3,302,749 | |||||||||||||
| Deutsche Bank AG | 1.990 | % | 10/8/2019 | 12/13/2019 | 20,783,250 | U.S. Government & Agency Obligations | 20,681,029 | |||||||||||||||
| $ | 24,092,156 | $ | 23,983,778 | |||||||||||||||||||
| * | Refer to the Schedule of Investments for positions held at the counterparty as collateral for reverse repurchase agreements. |
At November 30, 2019, the Fund had the following open forward foreign currency contracts:
| Currency Purchased | Currency Sold | Counterparty | Settlement Date | Unrealized Appreciation (Depreciation) | ||||||||||||||||
| MXN | 1,511,611 | USD | 75,372 | Barclays Bank PLC | 1/17/20 | $ | 1,399 | |||||||||||||
| USD | 3,123,765 | EUR | 2,820,000 | Barclays Bank PLC | 1/17/20 | 5,474 | ||||||||||||||
| USD | 1,500,257 | EUR | 1,357,472 | BNP Paribas SA | 1/17/20 | (804) | ||||||||||||||
| USD | 3,277,425 | EUR | 2,970,000 | Citibank N.A. | 1/17/20 | (6,732) | ||||||||||||||
| USD | 2,111,302 | GBP | 1,721,215 | Citibank N.A. | 1/17/20 | (119,196) | ||||||||||||||
| EUR | 160,000 | USD | 177,584 | JPMorgan Chase & Co. | 1/17/20 | (660) | ||||||||||||||
| Total | $ | (120,519) | ||||||||||||||||||
See Notes to Financial Statements.
| Western Asset Global High Income Fund Inc. 2019 Semi-Annual Report | 27 |
Table of Contents
Schedule of investments(unaudited) (cont’d)
November 30, 2019
Western Asset Global High Income Fund Inc.
Abbreviations used in this table: | ||
| EUR | — Euro | |
| GBP | — British Pound | |
| MXN | — Mexican Peso | |
| USD | — United States Dollar | |
See Notes to Financial Statements.
| 28 | Western Asset Global High Income Fund Inc. 2019 Semi-Annual Report |
Table of Contents
Statement of assets and liabilities(unaudited)
November 30, 2019
| Assets: | ||||
Investments, at value (Cost — $629,449,496) | $ | 676,713,132 | ||
Foreign currency, at value (Cost — $779,831) | 731,195 | |||
Cash | 1,530,594 | |||
Interest receivable | 9,432,520 | |||
Receivable for securities sold | 452,389 | |||
Unrealized appreciation on forward foreign currency contracts | 6,873 | |||
Other receivables | 3,708 | |||
Prepaid expenses | 10,923 | |||
Total Assets | 688,881,334 | |||
| Liabilities: | ||||
Loan payable (Note 5) | 180,000,000 | |||
Payable for open reverse repurchase agreements (Note 3) | 24,092,156 | |||
Payable for securities purchased | 8,269,544 | |||
Distributions payable | 2,800,776 | |||
Interest payable | 2,325,692 | |||
Investment management fee payable | 454,986 | |||
Unrealized depreciation on forward foreign currency contracts | 127,392 | |||
Directors’ fees payable | 5,186 | |||
Accrued expenses | 710,184 | |||
Total Liabilities | 218,785,916 | |||
| Total Net Assets | $ | 470,095,418 | ||
| Net Assets: | ||||
Par value ($0.001 par value; 44,106,706 shares issued and outstanding; 100,000,000 shares authorized) | $ | 44,107 | ||
Paid-in capital in excess of par value | 539,034,394 | |||
Total distributable earnings (loss) | (68,983,083) | |||
| Total Net Assets | $ | 470,095,418 | ||
| Shares Outstanding | 44,106,706 | |||
| Net Asset Value | $ | 10.66 | ||
See Notes to Financial Statements.
| Western Asset Global High Income Fund Inc. 2019 Semi-Annual Report | 29 |
Table of Contents
Statement of operations(unaudited)
For the Six Months Ended November 30, 2019
| Investment Income: | ||||
Interest | $ | 23,191,904 | ||
Dividends | 18,865 | |||
Total Investment Income | 23,210,769 | |||
| Expenses: | ||||
Interest expense (Notes 3 and 5) | 2,922,475 | |||
Investment management fee (Note 2) | 2,872,292 | |||
Transfer agent fees | 880,619 | |||
Legal fees | 129,294 | |||
Directors’ fees | 61,877 | |||
Audit and tax fees | 37,997 | |||
Custody fees | 15,104 | |||
Shareholder reports | 13,257 | |||
Stock exchange listing fees | 11,341 | |||
Fund accounting fees | 4,047 | |||
Insurance | 3,539 | |||
Miscellaneous expenses | 183,765 | |||
Total Expenses | 7,135,607 | |||
Less: Fee waivers and/or expense reimbursements (Note 2) | (84,479) | |||
Net Expenses | 7,051,128 | |||
| Net Investment Income | 16,159,641 | |||
| Realized and Unrealized Gain (Loss) on Investments, Futures Contracts, Forward Foreign Currency Contracts and Foreign Currency Transactions (Notes 1, 3 and 4): | ||||
Net Realized Gain (Loss) From: | ||||
Investment transactions | (11,856,798) | |||
Futures contracts | 483,403 | |||
Forward foreign currency contracts | 389,444 | |||
Foreign currency transactions | (21,435) | |||
Net Realized Loss | (11,005,386) | |||
Change in Net Unrealized Appreciation (Depreciation) From: | ||||
Investments | 17,192,391 | |||
Forward foreign currency contracts | (315,202) | |||
Foreign currencies | (80,350) | |||
Change in Net Unrealized Appreciation (Depreciation) | 16,796,839 | |||
| Net Gain on Investments, Futures Contracts, Forward Foreign Currency Contracts and Foreign Currency Transactions | 5,791,453 | |||
| Increase in Net Assets From Operations | $ | 21,951,094 | ||
See Notes to Financial Statements.
| 30 | Western Asset Global High Income Fund Inc. 2019 Semi-Annual Report |
Table of Contents
Statements of changes in net assets
For the Six Months Ended November 30, 2019 (unaudited) and the Year Ended May 31, 2019 | November 30 | May 31 | ||||||
| Operations: | ||||||||
Net investment income | $ | 16,159,641 | $ | 32,149,912 | ||||
Net realized loss | (11,005,386) | (18,544,844) | ||||||
Change in net unrealized appreciation (depreciation) | 16,796,839 | 15,793,374 | ||||||
Increase in Net Assets From Operations | 21,951,094 | 29,398,442 | ||||||
| Distributions to Shareholders From (Note 1): | ||||||||
Total distributable earnings | (16,738,495) | (30,963,056) | ||||||
Return of capital | — | (1,693,954) | ||||||
Decrease in Net Assets From Distributions to Shareholders | (16,738,495) | (32,657,010) | ||||||
| Fund Share Transactions: | ||||||||
Cost of shares repurchased (0 and 816,259 shares repurchased, respectively) | — | (7,135,435) | ||||||
Decrease in Net Assets From Fund Share Transactions | — | (7,135,435) | ||||||
Increase (Decrease) in Net Assets | 5,212,599 | (10,394,003) | ||||||
| Net Assets: | ||||||||
Beginning of period | 464,882,819 | 475,276,822 | ||||||
End of period | $ | 470,095,418 | $ | 464,882,819 | ||||
See Notes to Financial Statements.
| Western Asset Global High Income Fund Inc. 2019 Semi-Annual Report | 31 |
Table of Contents
Statement of cash flows(unaudited)
For the Six Months Ended November 30, 2019
| Increase (Decrease) in Cash: | ||||
| Cash Provided (Used) by Operating Activities: | ||||
Net increase in net assets resulting from operations | $ | 21,951,094 | ||
Adjustments to reconcile net increase in net assets resulting from operations to net cash provided (used) by operating activities: | ||||
Purchases of portfolio securities | (165,045,306) | |||
Sales of portfolio securities | 158,497,052 | |||
Net purchases, sales and maturities of short-term investments | (3,274,327) | |||
Payment-in-kind | (108,390) | |||
Net amortization of premium (accretion of discount) | (3,559,431) | |||
Decrease in receivable for securities sold | 4,073,745 | |||
Decrease in interest receivable | 479,406 | |||
Decrease in prepaid expenses | 7,827 | |||
Decrease in payable for securities purchased | (316,760) | |||
Decrease in investment management fee payable | (10,500) | |||
Decrease in Directors’ fees payable | (6,984) | |||
Increase in interest payable | 2,252,289 | |||
Increase in accrued expenses | 614,474 | |||
Net realized loss on investments | 11,856,798 | |||
Change in net unrealized appreciation (depreciation) of investments and forward foreign currency contracts | (16,877,189) | |||
Net Cash Provided by Operating Activities* | 10,533,798 | |||
| Cash Flows From Financing Activities: | ||||
Distributions paid on common stock | (16,672,335) | |||
Increase in payable for reverse repurchase agreements | 7,182,656 | |||
Net Cash Used in Financing Activities | (9,489,679) | |||
| Net Increase in Cash and Restricted Cash | 1,044,119 | |||
| Cash and restricted cash at beginning of period | 1,217,670 | |||
| Cash and restricted cash at end of period | $ | 2,261,789 | ||
* Included in operating expenses is cash of $670,186 paid for interest and commitment fees on borrowings.
The following table provides a reconciliation of cash and restricted cash reported within the Statement of Assets and Liabilities that sums to the total of such amounts shown on the Statement of Cash Flows.
|
| |||
| November 30, 2019 | ||||
| Cash | $ | 2,261,789 | ||
| Restricted cash | — | |||
| Total cash and restricted cash shown in the Statement of Cash Flows | $ | 2,261,789 | ||
See Notes to Financial Statements.
| 32 | Western Asset Global High Income Fund Inc. 2019 Semi-Annual Report |
Table of Contents
| For a share of capital stock outstanding throughout each year ended May 31, unless otherwise noted: | ||||||||||||||||||||||||
| 20191,2 | 20191 | 20181 | 20171 | 20161 | 20151 | |||||||||||||||||||
| Net asset value, beginning of period | $10.54 | $10.58 | $11.31 | $10.55 | $12.33 | $13.59 | ||||||||||||||||||
| Income (loss) from operations: | ||||||||||||||||||||||||
Net investment income | 0.37 | 0.72 | 0.73 | 0.82 | 0.97 | 0.99 | ||||||||||||||||||
Net realized and unrealized gain (loss) | 0.13 | (0.05) | (0.69) | 0.98 | (1.59) | (1.09) | ||||||||||||||||||
Total income (loss) from operations | 0.50 | 0.67 | 0.04 | 1.80 | (0.62) | (0.10) | ||||||||||||||||||
| Less distributions from: | ||||||||||||||||||||||||
Net investment income | (0.38) | 3 | (0.70) | (0.75) | (0.93) | (1.16) | (1.16) | |||||||||||||||||
Return of capital | — | (0.04) | (0.03) | (0.11) | — | — | ||||||||||||||||||
Total distributions | (0.38) | (0.74) | (0.78) | (1.04) | (1.16) | (1.16) | ||||||||||||||||||
Anti-dilutive impact of repurchase plan | — | 0.03 | 4 | 0.01 | 4 | — | — | — | ||||||||||||||||
| Net asset value, end of period | $10.66 | $10.54 | $10.58 | $11.31 | $10.55 | $12.33 | ||||||||||||||||||
| Market price, end of period | $9.68 | $9.59 | $9.18 | $10.23 | $9.52 | $10.91 | ||||||||||||||||||
Total return, based on NAV5,6 | 4.76 | % | 6.90 | % | 0.29 | % | 17.82 | % | (4.66) | % | (0.66) | % | ||||||||||||
Total return, based on Market Price7 | 4.89 | % | 13.17 | % | (2.99) | % | 19.21 | % | (1.08) | % | (6.76) | % | ||||||||||||
| Net assets, end of period (millions) | $470 | $465 | $475 | $512 | $327 | $383 | ||||||||||||||||||
| Ratios to average net assets: | ||||||||||||||||||||||||
Gross expenses | 3.00 | %8 | 2.54 | % | 2.06 | %9 | 1.89 | %9 | 1.79 | %9 | 1.55 | % | ||||||||||||
Net expenses10 | 2.96 | 8 | 2.52 | 2.02 | 9 | 1.82 | 9 | 1.72 | 9 | 1.48 | ||||||||||||||
Net investment income | 6.79 | 8 | 6.93 | 6.58 | 7.41 | 8.99 | 7.74 | |||||||||||||||||
| Portfolio turnover rate | 24 | % | 89 | % | 97 | % | 78 | % | 71 | % | 40 | % | ||||||||||||
| Supplemental data: | ||||||||||||||||||||||||
Loan Outstanding, End of Period (000s) | $180,000 | $180,000 | $168,000 | $171,000 | $120,000 | $125,000 | ||||||||||||||||||
Asset Coverage Ratio for Loan Outstanding11 | 361 | % | 358 | % | 383 | % | 399 | % | 373 | % | 406 | % | ||||||||||||
Asset Coverage, per $1,000 Principal Amount of Loan Outstanding11 | $3,612 | $3,583 | $3,829 | $3,992 | $3,729 | $4,062 | ||||||||||||||||||
Weighted Average Loan (000s) | $180,000 | $177,490 | $170,507 | $156,400 | $120,027 | $102,205 | ||||||||||||||||||
Weighted Average Interest Rate on Loan | 2.98 | % | 3.06 | % | 2.36 | % | 1.72 | % | 1.18 | % | 0.97 | % | ||||||||||||
See Notes to Financial Statements.
| Western Asset Global High Income Fund Inc. 2019 Semi-Annual Report | 33 |
Table of Contents
Financial highlights (cont’d)
| 1 | Per share amounts have been calculated using the average shares method. |
| 2 | For the six months ended November 30, 2019 (unaudited). |
| 3 | The actual source of the Fund’s current fiscal year distributions may be from net investment income, return of capital or a combination of both. Shareholders will be informed of the tax characteristics of the distributions after the close of the fiscal year. |
| 4 | The repurchase plan was completed at an average repurchase price of $8.74 for 816,259 shares and $7,135,435 for the year ended May 31, 2019 and $9.50 for 319,205 shares and $3,031,002 for the year ended May 31, 2018. |
| 5 | Performance figures may reflect compensating balance arrangements, fee waivers and/or expense reimbursements. In the absence of compensating balance arrangements, fee waivers and/or expense reimbursements, the total return would have been lower. Past performance is no guarantee of future results. Total returns for periods of less than one year are not annualized. |
| 6 | The total return calculation assumes that distributions are reinvested at NAV. Past performance is no guarantee of future results. Total returns for periods of less than one year are not annualized. |
| 7 | The total return calculation assumes that distributions are reinvested in accordance with the Fund’s dividend reinvestment plan. Past performance is no guarantee of future results. Total returns for periods of less than one year are not annualized. |
| 8 | Annualized. |
| 9 | Included in the expense ratios are certainnon-recurring reorganization fees that were incurred by the Fund during the period. Without these fees, the gross and net expense ratios would not have changed for the year ended May 31, 2018, would have been 1.87% and 1.80%, respectively, for the year ended May 31, 2017 and 1.76% and 1.69%, respectively, for the year ended May 31, 2016. |
| 10 | Reflects fee waivers and/or expense reimbursements. |
| 11 | Represents value of net assets plus the loan outstanding at the end of the period divided by the loan outstanding at the end of the period. |
See Notes to Financial Statements.
| 34 | Western Asset Global High Income Fund Inc. 2019 Semi-Annual Report |
Table of Contents
Notes to financial statements(unaudited)
1. Organization and significant accounting policies
Western Asset Global High Income Fund Inc. (the “Fund”) was incorporated in Maryland and is registered as anon-diversified,closed-end management investment company under the Investment Company Act of 1940, as amended (the “1940 Act”). The Board of Directors authorized 100 million shares of $0.001 par value common stock. The Fund’s primary investment objective is high current income. The Fund’s secondary objective is total return. Under normal market conditions, the Fund invests in a global portfolio of securities consisting of below investment grade fixed income securities, emerging market fixed income securities and investment grade fixed income securities. On October 31, 2019, the Board of Directors of the Fund approved amendments to the Fund’s bylaws. The amended and restated bylaws were subsequently filed on Form8-K and are available on the SEC’s website at www.sec.gov.
The following are significant accounting policies consistently followed by the Fund and are in conformity with U.S. generally accepted accounting principles (“GAAP”). Estimates and assumptions are required to be made regarding assets, liabilities and changes in net assets resulting from operations when financial statements are prepared. Changes in the economic environment, financial markets and any other parameters used in determining these estimates could cause actual results to differ. Subsequent events have been evaluated through the date the financial statements were issued.
(a) Investment valuation.The valuations for fixed income securities (which may include, but are not limited to, corporate, government, municipal, mortgage-backed, collateralized mortgage obligations and asset-backed securities) and certain derivative instruments are typically the prices supplied by independent third party pricing services, which may use market prices or broker/dealer quotations or a variety of valuation techniques and methodologies. The independent third party pricing services use inputs that are observable such as issuer details, interest rates, yield curves, prepayment speeds, credit risks/spreads, default rates and quoted prices for similar securities. Investments inopen-end funds are valued at the closing net asset value per share of each fund on the day of valuation. Futures contracts are valued daily at the settlement price established by the board of trade or exchange on which they are traded. Equity securities for which market quotations are available are valued at the last reported sales price or official closing price on the primary market or exchange on which they trade. When the Fund holds securities or other assets that are denominated in a foreign currency, the Fund will normally use the currency exchange rates as of 4:00 p.m. (Eastern Time). If independent third party pricing services are unable to supply prices for a portfolio investment, or if the prices supplied are deemed by the manager to be unreliable, the market price may be determined by the manager using quotations from one or more broker/dealers or at the transaction price if the security has recently been purchased and no value has yet been obtained from a pricing service or pricing broker. When reliable prices are not readily available, such as when the value of a security has been significantly affected by events after the close of the exchange or market on which the security
| Western Asset Global High Income Fund Inc. 2019 Semi-Annual Report | 35 |
Table of Contents
Notes to financial statements(unaudited) (cont’d)
is principally traded, but before the Fund calculates its net asset value, the Fund values these securities as determined in accordance with procedures approved by the Fund’s Board of Directors.
The Board of Directors is responsible for the valuation process and has delegated the supervision of the daily valuation process to the Legg Mason North Atlantic Fund Valuation Committee (the “Valuation Committee”). The Valuation Committee, pursuant to the policies adopted by the Board of Directors, is responsible for making fair value determinations, evaluating the effectiveness of the Fund’s pricing policies, and reporting to the Board of Directors. When determining the reliability of third party pricing information for investments owned by the Fund, the Valuation Committee, among other things, conducts due diligence reviews of pricing vendors, monitors the daily change in prices and reviews transactions among market participants.
The Valuation Committee will consider pricing methodologies it deems relevant and appropriate when making fair value determinations. Examples of possible methodologies include, but are not limited to, multiple of earnings; discount from market of a similar freely traded security; discounted cash-flow analysis; book value or a multiple thereof; risk premium/yield analysis; yield to maturity; and/or fundamental investment analysis. The Valuation Committee will also consider factors it deems relevant and appropriate in light of the facts and circumstances. Examples of possible factors include, but are not limited to, the type of security; the issuer’s financial statements; the purchase price of the security; the discount from market value of unrestricted securities of the same class at the time of purchase; analysts’ research and observations from financial institutions; information regarding any transactions or offers with respect to the security; the existence of merger proposals or tender offers affecting the security; the price and extent of public trading in similar securities of the issuer or comparable companies; and the existence of a shelf registration for restricted securities.
For each portfolio security that has been fair valued pursuant to the policies adopted by the Board of Directors, the fair value price is compared against the last available and next available market quotations. The Valuation Committee reviews the results of such back testing monthly and fair valuation occurrences are reported to the Board of Directors quarterly.
The Fund uses valuation techniques to measure fair value that are consistent with the market approach and/or income approach, depending on the type of security and the particular circumstance. The market approach uses prices and other relevant information generated by market transactions involving identical or comparable securities. The income approach uses valuation techniques to discount estimated future cash flows to present value.
| 36 | Western Asset Global High Income Fund Inc. 2019 Semi-Annual Report |
Table of Contents
GAAP establishes a disclosure hierarchy that categorizes the inputs to valuation techniques used to value assets and liabilities at measurement date. These inputs are summarized in the three broad levels listed below:
| • | Level 1 — quoted prices in active markets for identical investments |
| • | Level 2 — other significant observable inputs (including quoted prices for similar investments, interest rates, prepayment speeds, credit risk, etc.) |
| • | Level 3 — significant unobservable inputs (including the Fund’s own assumptions in determining the fair value of investments) |
The inputs or methodologies used to value securities are not necessarily an indication of the risk associated with investing in those securities.
The following is a summary of the inputs used in valuing the Fund’s assets and liabilities carried at fair value:
| ASSETS | ||||||||||||||||
| Description | Quoted Prices (Level 1) | Other Significant Observable Inputs (Level 2) | Significant Unobservable Inputs (Level 3) | Total | ||||||||||||
| Long-Term Investments†: | ||||||||||||||||
Corporate Bonds & Notes | — | $ | 454,642,683 | — | $ | 454,642,683 | ||||||||||
Sovereign Bonds | — | 127,749,373 | — | 127,749,373 | ||||||||||||
Senior Loans | — | 50,122,733 | — | 50,122,733 | ||||||||||||
U.S. Government & Agency Obligations | — | 32,573,260 | — | 32,573,260 | ||||||||||||
Convertible Bonds & Notes | — | 4,480,225 | — | 4,480,225 | ||||||||||||
Non-U.S. Treasury Inflation Protected Securities | — | 266,220 | — | 266,220 | ||||||||||||
Common Stocks: | ||||||||||||||||
Consumer Discretionary | — | — | $ | 15,173 | 15,173 | |||||||||||
Energy | — | — | 53,494 | 53,494 | ||||||||||||
Rights | $ | 1,804 | — | — | 1,804 | |||||||||||
| Total Long-Term Investments | 1,804 | 669,834,494 | 68,667 | 669,904,965 | ||||||||||||
| Short-Term Investments† | 6,808,167 | — | — | 6,808,167 | ||||||||||||
| Total Investments | $ | 6,809,971 | $ | 669,834,494 | $ | 68,667 | $ | 676,713,132 | ||||||||
| Other Financial Instruments: | ||||||||||||||||
Forward Foreign Currency Contracts | — | $ | 6,873 | — | $ | 6,873 | ||||||||||
| Total | $ | 6,809,971 | $ | 669,841,367 | $ | 68,667 | $ | 676,720,005 | ||||||||
| Western Asset Global High Income Fund Inc. 2019 Semi-Annual Report | 37 |
Table of Contents
Notes to financial statements(unaudited) (cont’d)
| LIABILITIES | ||||||||||||||||
| Description | Quoted Prices (Level 1) | Other Significant (Level 2) | Significant Unobservable Inputs (Level 3) | Total | ||||||||||||
| Other Financial Instruments: | ||||||||||||||||
Forward Foreign Currency Contracts | — | $ | 127,392 | — | $ | 127,392 | ||||||||||
| † | See Schedule of Investments for additional detailed categorizations. |
(b) Futures contracts.The Fund uses futures contracts generally to gain exposure to, or hedge against, changes in interest rates or gain exposure to, or hedge against, changes in certain asset classes. A futures contract represents a commitment for the future purchase or sale of an asset at a specified price on a specified date.
Upon entering into a futures contract, the Fund is required to deposit cash or securities with a broker in an amount equal to a certain percentage of the contract amount. This is known as the ‘‘initial margin’’ and subsequent payments (‘‘variation margin’’) are made or received by the Fund each day, depending on the daily fluctuation in the value of the contract. For certain futures, including foreign denominated futures, variation margin is not settled daily, but is recorded as a net variation margin payable or receivable. The daily changes in contract value are recorded as unrealized gains or losses in the Statement of Operations and the Fund recognizes a realized gain or loss when the contract is closed.
Futures contracts involve, to varying degrees, risk of loss in excess of the amounts reflected in the financial statements. In addition, there is the risk that the Fund may not be able to enter into a closing transaction because of an illiquid secondary market.
(c) Forward foreign currency contracts.The Fund enters into a forward foreign currency contract to hedge against foreign currency exchange rate risk on itsnon-U.S. dollar denominated securities or to facilitate settlement of a foreign currency denominated portfolio transaction. A forward foreign currency contract is an agreement between two parties to buy and sell a currency at a set price with delivery and settlement at a future date. The contract ismarked-to-market daily and the change in value is recorded by the Fund as an unrealized gain or loss. When a forward foreign currency contract is closed, through either delivery or offset by entering into another forward foreign currency contract, the Fund recognizes a realized gain or loss equal to the difference between the value of the contract at the time it was opened and the value of the contract at the time it is closed.
Non-deliverable forward foreign currency exchange contracts are settled with the counterparty in cash without the delivery of foreign currency.
Forward foreign currency contracts involve elements of market risk in excess of the amounts reflected on the Statement of Assets and Liabilities. The Fund bears the risk of an unfavorable change in the foreign exchange rate underlying the forward foreign currency contract.
| 38 | Western Asset Global High Income Fund Inc. 2019 Semi-Annual Report |
Table of Contents
Risks may also arise upon entering into these contracts from the potential inability of the counterparties to meet the terms of their contracts.
(d) Loan participations.The Fund may invest in loans arranged through private negotiation between one or more financial institutions. The Fund’s investment in any such loan may be in the form of a participation in or an assignment of the loan. In connection with purchasing participations, the Fund generally will have no right to enforce compliance by the borrower with the terms of the loan agreement related to the loan, or any rights ofoff-set against the borrower and the Fund may not benefit directly from any collateral supporting the loan in which it has purchased the participation.
The Fund assumes the credit risk of the borrower, the lender that is selling the participation and any other persons interpositioned between the Fund and the borrower. In the event of the insolvency of the lender selling the participation, the Fund may be treated as a general creditor of the lender and may not benefit from anyoff-set between the lender and the borrower.
(e) Unfunded loan commitments.The Fund may enter into certain credit agreements where all or a portion of the total amount committed may be unfunded. The Fund is obligated to fund these commitments at the borrower’s discretion. The commitments are disclosed in the accompanying Schedule of Investments. At November 30, 2019, the Fund had sufficient cash and/or securities to cover these commitments.
(f) Reverse repurchase agreements.The Fund may enter into reverse repurchase agreements. Under the terms of a typical reverse repurchase agreement, a fund sells a security subject to an obligation to repurchase the security from the buyer at an agreed upon time and price. In the event the buyer of securities under a reverse repurchase agreement files for bankruptcy or becomes insolvent, the Fund’s use of the proceeds of the agreement may be restricted pending a determination by the counterparty, or its trustee or receiver, whether to enforce the Fund’s obligation to repurchase the securities. In entering into reverse repurchase agreements, the Fund will maintain cash, U.S. government securities or other liquid debt obligations at least equal in value to its obligations with respect to reverse repurchase agreements or will take other actions permitted by law to cover its obligations. If the market value of the collateral declines during the period, the Fund may be required to post additional collateral to cover its obligation. Cash collateral that has been pledged to cover obligations of the Fund under reverse repurchase agreements, if any, will be reported separately in the Statement of Assets and Liabilities. Securities pledged as collateral are noted in the Schedule of Investments. Interest payments made on reverse repurchase agreements are recognized as a component of “Interest expense” on the Statement of Operations. In periods of increased demand for the security, the Fund may receive a fee for use of the security by the counterparty, which may result in interest income to the Fund.
| Western Asset Global High Income Fund Inc. 2019 Semi-Annual Report | 39 |
Table of Contents
Notes to financial statements(unaudited) (cont’d)
(g) Securities traded on a when-issued and delayed delivery basis.The Fund may trade securities on a when-issued or delayed delivery basis. In when-issued and delayed delivery transactions, the securities are purchased or sold by the Fund with payment and delivery taking place in the future in order to secure what is considered to be an advantageous price and yield to the Fund at the time of entering into the transaction.
Purchasing such securities involves risk of loss if the value of the securities declines prior to settlement. These securities are subject to market fluctuations and their current value is determined in the same manner as for other securities.
(h) Inflation-indexed bonds.Inflation-indexed bonds are fixed income securities whose principal value or interest rate is periodically adjusted according to the rate of inflation. As the index measuring inflation changes, the principal value or interest rate of inflation-indexed bonds will be adjusted accordingly. Inflation adjustments to the principal amount of inflation-indexed bonds are reflected as an increase or decrease to investment income on the Statement of Operations. Repayment of the original bond principal upon maturity (as adjusted for inflation) is guaranteed in the case of U.S. Treasury inflation-indexed bonds. For bonds that do not provide a similar guarantee, the adjusted principal value of the bond repaid at maturity may be less than the original principal.
(i) Cash flow information.The Fund invests in securities and distributes dividends from net investment income and net realized gains, which are paid in cash and may be reinvested at the discretion of shareholders. These activities are reported in the Statements of Changes in Net Assets and additional information on cash receipts and cash payments are presented in the Statement of Cash Flows.
(j) Foreign currency translation.Investment securities and other assets and liabilities denominated in foreign currencies are translated into U.S. dollar amounts based upon prevailing exchange rates on the date of valuation. Purchases and sales of investment securities and income and expense items denominated in foreign currencies are translated into U.S. dollar amounts based upon prevailing exchange rates on the respective dates of such transactions.
The Fund does not isolate that portion of the results of operations resulting from fluctuations in foreign exchange rates on investments from the fluctuations arising from changes in market prices of securities held. Such fluctuations are included with the net realized and unrealized gain or loss on investments.
Net realized foreign exchange gains or losses arise from sales of foreign currencies, including gains and losses on forward foreign currency contracts, currency gains or losses realized between the trade and settlement dates on securities transactions, and the difference between the amounts of dividends, interest, and foreign withholding taxes recorded on the Fund’s books and the U.S. dollar equivalent of the amounts actually received or paid. Net unrealized foreign exchange gains and losses arise from changes in the values of assets
| 40 | Western Asset Global High Income Fund Inc. 2019 Semi-Annual Report |
Table of Contents
and liabilities, other than investments in securities, on the date of valuation, resulting from changes in exchange rates.
Foreign security and currency transactions may involve certain considerations and risks not typically associated with those of U.S. dollar denominated transactions as a result of, among other factors, the possibility of lower levels of governmental supervision and regulation of foreign securities markets and the possibility of political or economic instability.
(k) Credit and market risk.The Fund invests in high-yield and emerging market instruments that are subject to certain credit and market risks. The yields of high-yield and emerging market debt obligations reflect, among other things, perceived credit and market risks. The Fund’s investments in securities rated below investment grade typically involve risks not associated with higher rated securities including, among others, greater risk related to timely and ultimate payment of interest and principal, greater market price volatility and less liquid secondary market trading. The consequences of political, social, economic or diplomatic changes may have disruptive effects on the market prices of investments held by the Fund. The Fund’s investments innon-U.S. dollar denominated securities may also result in foreign currency losses caused by devaluations and exchange rate fluctuations.
(l) Foreign investment risks.The Fund’s investments in foreign securities may involve risks not present in domestic investments. Since securities may be denominated in foreign currencies, may require settlement in foreign currencies or pay interest or dividends in foreign currencies, changes in the relationship of these foreign currencies to the U.S. dollar can significantly affect the value of the investments and earnings of the Fund. Foreign investments may also subject the Fund to foreign government exchange restrictions, expropriation, taxation or other political, social or economic developments, all of which affect the market and/or credit risk of the investments.
(m) Counterparty risk and credit-risk-related contingent features of derivative instruments.The Fund may invest in certain securities or engage in other transactions, where the Fund is exposed to counterparty credit risk in addition to broader market risks. The Fund may invest in securities of issuers, which may also be considered counterparties as trading partners in other transactions. This may increase the risk of loss in the event of default or bankruptcy by the counterparty or if the counterparty otherwise fails to meet its contractual obligations. The Fund’s subadviser attempts to mitigate counterparty risk by (i) periodically assessing the creditworthiness of its trading partners, (ii) monitoring and/or limiting the amount of its net exposure to each individual counterparty based on its assessment and (iii) requiring collateral from the counterparty for certain transactions. Market events and changes in overall economic conditions may impact the assessment of such counterparty risk by the subadviser. In addition, declines in the values of underlying collateral received may expose the Fund to increased risk of loss.
| Western Asset Global High Income Fund Inc. 2019 Semi-Annual Report | 41 |
Table of Contents
Notes to financial statements(unaudited) (cont’d)
With exchange traded and centrally cleared derivatives, there is less counterparty risk to the Fund since the exchange or clearinghouse, as counterparty to such instruments, guarantees against a possible default. The clearinghouse stands between the buyer and the seller of the contract; therefore, the credit risk is limited to failure of the clearinghouse. While offset rights may exist under applicable law, the Fund does not have a contractual right of offset against a clearing broker or clearinghouse in the event of a default of the clearing broker or clearinghouse.
The Fund has entered into master agreements, such as an International Swaps and Derivatives Association, Inc. Master Agreement (“ISDA Master Agreement”) or similar agreement, with certain of its derivative counterparties that governover-the-counter derivatives and provide for general obligations, representations, agreements, collateral posting terms, netting provisions in the event of default or termination and credit related contingent features. The credit related contingent features include, but are not limited to, a percentage decrease in the Fund’s net assets or NAV over a specified period of time. If these credit related contingent features were triggered, the derivatives counterparty could terminate the positions and demand payment or require additional collateral.
Under an ISDA Master Agreement, the Fund may, under certain circumstances, offset with the counterparty certain derivative financial instruments’ payables and/or receivables with collateral held and/or posted and create one single net payment. However, absent an event of default by the counterparty or a termination of the agreement, the terms of the ISDA Master Agreements do not result in an offset of reported amounts of financial assets and financial liabilities in the Statement of Assets and Liabilities across transactions between the Fund and the applicable counterparty. The enforceability of the right to offset may vary by jurisdiction.
Collateral requirements differ by type of derivative. Collateral or margin requirements are set by the broker or exchange clearinghouse for exchange traded derivatives while collateral terms are contract specific forover-the-counter traded derivatives. Cash collateral that has been pledged to cover obligations of the Fund under derivative contracts, if any, will be reported separately in the Statement of Assets and Liabilities. Securities pledged as collateral, if any, for the same purpose are noted in the Schedule of Investments.
As of November 30, 2019, the Fund held forward foreign currency contracts with credit related contingent features which had a liability position of $127,392. If a contingent feature in the master agreements would have been triggered, the Fund would have been required to pay this amount to its derivatives counterparties.
(n) Security transactions and investment income.Security transactions are accounted for on a trade date basis. Interest income (including interest income frompayment-in-kind securities), adjusted for amortization of premium and accretion of discount, is recorded on the accrual basis. Paydown gains and losses on mortgage- and asset-backed securities are
| 42 | Western Asset Global High Income Fund Inc. 2019 Semi-Annual Report |
Table of Contents
recorded as adjustments to interest income. Dividend income is recorded on theex-dividend date for dividends received in cash and/or securities. Foreign dividend income is recorded on theex-dividend date or as soon as practicable after the Fund determines the existence of a dividend declaration after exercising reasonable due diligence. The cost of investments sold is determined by use of the specific identification method. To the extent any issuer defaults or a credit event occurs that impacts the issuer, the Fund may halt any additional interest income accruals and consider the realizability of interest accrued up to the date of default or credit event.
(o) Distributions to shareholders.Distributions from net investment income of the Fund, if any, are declared quarterly and paid on a monthly basis. The actual source of the Fund’s monthly distributions may be from net investment income, return of capital or a combination of both. Shareholders will be informed of the tax characteristics of the distributions after the close of the fiscal year. Distributions of net realized gains, if any, are declared at least annually. Distributions to shareholders of the Fund are recorded on theex-dividend date and are determined in accordance with income tax regulations, which may differ from GAAP.
(p) Compensating balance arrangements.The Fund has an arrangement with its custodian bank whereby a portion of the custodian’s fees is paid indirectly by credits earned on the Fund’s cash on deposit with the bank.
(q) Federal and other taxes.It is the Fund’s policy to comply with the federal income and excise tax requirements of the Internal Revenue Code of 1986 (the “Code”), as amended, applicable to regulated investment companies. Accordingly, the Fund intends to distribute its taxable income and net realized gains, if any, to shareholders in accordance with timing requirements imposed by the Code. Therefore, no federal or state income tax provision is required in the Fund’s financial statements.
Management has analyzed the Fund’s tax positions taken on income tax returns for all open tax years and has concluded that as of May 31, 2019, no provision for income tax is required in the Fund’s financial statements. The Fund’s federal and state income and federal excise tax returns for tax years for which the applicable statutes of limitations have not expired are subject to examination by the Internal Revenue Service and state departments of revenue.
Under the applicable foreign tax laws, a withholding tax may be imposed on interest, dividends and capital gains at various rates.
(r) Reclassification.GAAP requires that certain components of net assets be reclassified to reflect permanent differences between financial and tax reporting. These reclassifications have no effect on net assets or net asset value per share.
| Western Asset Global High Income Fund Inc. 2019 Semi-Annual Report | 43 |
Table of Contents
Notes to financial statements(unaudited) (cont’d)
2. Investment management agreement and other transactions with affiliates
Legg Mason Partners Fund Advisor, LLC (“LMPFA”) is the Fund’s investment manager. Western Asset Management Company, LLC (“Western Asset”), Western Asset Management Company Limited (“Western Asset Limited”) and Western Asset Management Company Pte. Ltd. (“Western Asset Singapore”) are the Fund’s subadvisers. LMPFA, Western Asset, Western Asset Limited and Western Asset Singapore are wholly-owned subsidiaries of Legg Mason, Inc. (“Legg Mason”).
LMPFA provides administrative and certain oversight services to the Fund. The Fund pays LMPFA an investment management fee, calculated daily and paid monthly, at an annual rate of 0.85% of the Fund’s average daily net assets plus the proceeds of any outstanding borrowings.
LMPFA delegates to Western Asset theday-to-day portfolio management of the Fund. Western Asset Limited and Western Asset Singapore provide certain subadvisory services to the Fund relating to currency transactions and investment innon-U.S. dollar denominated securities. Western Asset Limited and Western Asset Singapore do not receive any compensation from the Fund and are compensated by Western Asset for its services to the Fund. For its services, LMPFA pays Western Asset monthly 70% of the net management fee it receives from the Fund. Western Asset pays Western Asset Limited and Western Asset Singapore a monthly subadvisory fee in an amount equal to 100% of the management fee paid to Western Asset on the assets that Western Asset allocates to each suchnon-U.S. subadviser to manage.
During the periods in which the Fund utilizes financial leverage, the fees paid to LMPFA will be higher than if the Fund did not utilize leverage because the fees are calculated as a percentage of the Fund’s assets, including those investments purchased with leverage.
Effective December 1, 2018, LMPFA implemented a voluntary investment management fee waiver of 0.025% that continues through November 30, 2019.
During the six months ended November 30, 2019, fees waived and/or expenses reimbursed amounted to $84,479.
All officers and one Director of the Fund are employees of Legg Mason or its affiliates and do not receive compensation from the Fund.
| 44 | Western Asset Global High Income Fund Inc. 2019 Semi-Annual Report |
Table of Contents
3. Investments
During the six months ended November 30, 2019, the aggregate cost of purchases and proceeds from sales of investments (excluding short-term investments) and U.S. Government & Agency Obligations were as follows:
| Investments | U.S. Government & Agency Obligations | |||||||
| Purchases | $ | 144,046,735 | $ | 20,998,571 | ||||
| Sales | 148,608,174 | 9,888,878 | ||||||
At November 30, 2019, the aggregate cost of investments and the aggregate gross unrealized appreciation and depreciation of investments for federal income tax purposes were substantially as follows:
| Cost | Gross Unrealized Appreciation | Gross Unrealized Depreciation | Net Unrealized Appreciation (Depreciation) | |||||||||||||
| Securities | $ | 629,449,496 | $ | 63,593,480 | $ | (16,329,844) | $ | 47,263,636 | ||||||||
| Forward foreign currency contracts | — | 6,873 | (127,392) | (120,519) | ||||||||||||
Transactions in reverse repurchase agreements for the Fund during the six months ended November 30, 2019 were as follows:
Average Daily Balance* | Weighted Average Interest Rate* | Maximum Amount Outstanding | ||
| $19,987,159 | 2.36% | $24,092,156 |
| * | Averages based on the number of days that the Fund had reverse repurchase agreements outstanding. |
Interest rates on reverse repurchase agreements ranged from 1.51% to 2.70% during the six months ended November 30, 2019. Interest expense incurred on reverse repurchase agreements totaled $236,298.
4. Derivative instruments and hedging activities
Below is a table, grouped by derivative type, that provides information about the fair value and the location of derivatives within the Statement of Assets and Liabilities at November 30, 2019.
| ASSET DERIVATIVES1 | ||||
| Foreign Exchange Risk | ||||
| Forward foreign currency contracts | $ | 6,873 | ||
| LIABILITY DERIVATIVES1 | ||||
| Foreign Exchange Risk | ||||
| Forward foreign currency contracts | $ | 127,392 | ||
| Western Asset Global High Income Fund Inc. 2019 Semi-Annual Report | 45 |
Table of Contents
Notes to financial statements(unaudited) (cont’d)
| 1 | Generally, the balance sheet location for asset derivatives is receivables/net unrealized appreciation (depreciation) and for liability derivatives is payables/net unrealized appreciation (depreciation). |
The following tables provide information about the effect of derivatives and hedging activities on the Fund’s Statement of Operations for the six months ended November 30, 2019. The first table provides additional detail about the amounts and sources of gains (losses) realized on derivatives during the period. The second table provides additional information about the change in unrealized appreciation (depreciation) resulting from the Fund’s derivatives and hedging activities during the period.
| AMOUNT OF REALIZED GAIN (LOSS) ON DERIVATIVES RECOGNIZED | ||||||||||||
| Interest Rate Risk | Foreign Exchange Risk | Total | ||||||||||
| Futures contracts | $ | 483,403 | — | $ | 483,403 | |||||||
| Forward foreign currency contracts | — | $ | 389,444 | 389,444 | ||||||||
| Total | $ | 483,403 | $389,444 | $ | 872,847 | |||||||
| CHANGE IN UNREALIZED APPRECIATION (DEPRECIATION) ON DERIVATIVES RECOGNIZED | ||||
| Foreign Exchange Risk | ||||
| Forward foreign currency contracts | $ | (315,202) | ||
During the six months ended November 30, 2019, the volume of derivative activity for the Fund was as follows:
| Average Market Value | ||||
| Futures contracts (to sell)† | $ | 1,978,055 | ||
| Forward foreign currency contracts (to buy) | 975,713 | |||
| Forward foreign currency contracts (to sell) | 8,859,977 | |||
| † | At November 30, 2019, there were no open positions held in this derivative. |
The following table presents the Fund’s OTC derivative assets and liabilities by counterparty net of amounts available for offset under an ISDA Master Agreement and net of the related collateral pledged (received) by the Fund as of November 30, 2019.
| Counterparty | Gross Assets Subject to Master Agreements1 | Gross Liabilities Subject to Master Agreements1 | Net Assets (Liabilities) Subject to Master Agreements | Collateral Pledged (Received) | Net Amount2 | |||||||||||||||
| Barclays Bank PLC | $ | 6,873 | — | $ | 6,873 | — | $ | 6,873 | ||||||||||||
| BNP Paribas SA | — | $ | (804) | (804) | — | (804) | ||||||||||||||
| Citibank N.A. | — | (125,928) | (125,928) | — | (125,928) | |||||||||||||||
| JPMorgan Chase & Co. | — | (660) | (660) | — | (660) | |||||||||||||||
| Total | $ | 6,873 | $ | (127,392) | $ | (120,519) | — | $ | (120,519) | |||||||||||
| 46 | Western Asset Global High Income Fund Inc. 2019 Semi-Annual Report |
Table of Contents
| 1 | Absent an event of default or early termination, derivative assets and liabilities are presented gross and notoff-set in the Statement of Assets and Liabilities. |
| 2 | Represents the net amount receivable (payable) from (to) the counterparty in the event of default. |
5. Loan
The Fund has a revolving credit agreement with The Bank of Nova Scotia (“Credit Agreement”), which allows the Fund to borrow up to an aggregate amount of $180,000,000 and renews daily for a179-day term, unless notice to the contrary is given to the Fund. The Fund pays a commitment fee on the unutilized portion of the loan commitment amount at an annual rate of 0.25%, except that the commitment fee is 0.15% in the event that the aggregate outstanding principal balance of the loan is equal to or greater than 75% of $180,000,000. The interest on the loan is calculated at a variable rate based on LIBOR plus any applicable margin. Securities held by the Fund are subject to a lien, granted to The Bank of Nova Scotia, to the extent of the borrowing outstanding and any additional expenses. The Fund’s Credit Agreement contains customary covenants that, among other things, may limit the Fund’s ability to pay distributions in certain circumstances, incur additional debt, change its fundamental investment policies and engage in certain transactions, including mergers and consolidations and require asset coverage ratios in addition to those required by the 1940 Act. In addition, the Credit Agreement may be subject to early termination under certain conditions and may contain other provisions that could limit the Fund’s ability to utilize borrowing under the agreement. Interest expense related to this loan for the six month ended November 30, 2019 was $2,685,900. For the six months ended November 30, 2019, the Fund incurred no commitment fees. For the six months ended November 30, 2019, based on the number of days during the reporting period that the Fund had an outstanding balance under the Credit Agreement, the Fund had an average daily loan balance outstanding of $180,000,000 and the weighted average interest rate was 2.98%. At November 30, 2019 the Fund had $180,000,000 of borrowings outstanding per the Credit Agreement.
6. Distributions subsequent to November 30, 2019
The following distributions have been declared by the Fund’s Board of Directors and are payable subsequent to the period end of this report:
| Record Date | Payable Date | Amount | ||||||
| 11/22/2019 | 12/2/2019 | $ | 0.0635 | |||||
| 12/20/2019 | 12/31/2019 | $ | 0.0660 | |||||
| 1/24/2020 | 2/3/2020 | $ | 0.0660 | |||||
| 2/21/2020 | 3/2/2020 | $ | 0.0660 | |||||
7. Stock repurchase program
On November 16, 2015, the Fund announced that the Fund’s Board of Directors (the “Board”) had authorized the Fund to repurchase in the open market up to approximately 10% of the Fund’s outstanding common stock when the Fund’s shares are trading at a discount to net
| Western Asset Global High Income Fund Inc. 2019 Semi-Annual Report | 47 |
Table of Contents
Notes to financial statements(unaudited) (cont’d)
asset value. The Board has directed management of the Fund to repurchase shares of common stock at such times and in such amounts as management reasonably believes may enhance stockholder value. The Fund is under no obligation to purchase shares at any specific discount levels or in any specific amounts. During the six months ended November 30, 2019, the Fund did not repurchase any shares.
Since the commencement of the stock repurchase program through November 30, 2019, the Fund repurchased 1,135,464 shares or 2.51% of its common shares outstanding for a total amount of $10,166,437.
8. Deferred capital losses
As of May 31, 2019, the Fund had deferred capital losses of $95,889,259, which have no expiration date, that will be available to offset future taxable capital gains.
| 48 | Western Asset Global High Income Fund Inc. 2019 Semi-Annual Report |
Table of Contents
Board approval of management and subadvisory agreements(unaudited)
Background
The Investment Company Act of 1940, as amended (the “1940 Act”), requires that the Board of Directors (the “Board”) of Western Asset Global High Income Fund Inc. (the “Fund”), including a majority of its members who are not considered to be “interested persons” under the 1940 Act (the “Independent Directors”) voting separately, approve on an annual basis the continuation of the investment management contract (the “Management Agreement”) with the Fund’s manager, Legg Mason Partners Fund Advisor, LLC (the “Manager”), and thesub-advisory agreements (individually, a“Sub-Advisory Agreement,” and collectively, the“Sub-Advisory Agreements”) with the Manager’s affiliates, Western Asset Management Company, LLC (“Western Asset”), Western Asset Management Company Pte. Ltd. in Singapore (“Western Asset Singapore”) and Western Asset Management Company Limited in London (“Western Asset London”). Western Asset, Western Asset Singapore, and Western Asset London collectively are hereinafter referred to as the“Sub-Advisers,” and Western Asset Singapore and Western Asset London together are hereinafter referred to as the“Non-U.S.Sub-Advisers.” At a meeting (the “Contract Renewal Meeting”) heldin-person on November 13 and 14, 2019, the Board, including the Independent Directors, considered and approved the continuation of each of the Management Agreement and theSub-Advisory Agreements for an additionalone-year period. To assist in its consideration of the renewal of each of the Management Agreement and theSub-Advisory Agreements, the Board received and considered a variety of information (together with the information provided at the Contract Renewal Meeting, the “Contract Renewal Information”) about the Manager and theSub-Advisers, as well as the management andsub-advisory arrangements for the Fund and the otherclosed-end funds in the same complex under the Board’s purview (the “Legg MasonClosed-end Funds”), certain portions of which are discussed below. A presentation made by the Manager and Western Asset to the Board at the Contract Renewal Meeting in connection with the Board’s evaluation of each of the Management Agreement and theSub-Advisory Agreements encompassed the Fund and other Legg MasonClosed-end Funds. In addition to the Contract Renewal Information, the Board received performance and other information throughout the year related to the respective services rendered by the Manager and theSub-Advisers to the Fund. The Board’s evaluation took into account the information received throughout the year and also reflected the knowledge and familiarity gained as members of the Boards of the Fund and other Legg MasonClosed-end Funds with respect to the services provided to the Fund by the Manager and theSub-Advisers.
At a meeting held by conference call on October 10, 2019, the Independent Directors in preparation for the Contract Renewal Meeting met in a private session with their independent legal counsel to review the Contract Renewal Information concerning the Legg Mason
| Western Asset Global High Income Fund Inc. | 49 |
Table of Contents
Board approval of management and subadvisory agreements(unaudited) (cont’d)
Closed-end Funds, including the Fund, received to date. No representatives of the Manager or theSub-Adviser participated in this meeting. The discussion below reflects all of these reviews.
The Manager provides the Fund with investment advisory and administrative services pursuant to the Management Agreement and theSub-Advisers together provide, or in the case of theNon-U.S.Sub-Advisers help to provide, the Fund with certain investmentsub-advisory services pursuant to theSub-Advisory Agreements. The discussion below covers both the advisory and administrative functions being rendered by the Manager, each such function being encompassed by the Management Agreement, and the investmentsub-advisory functions being rendered by theSub-Advisers.
Board Approval of Management Agreement andSub-Advisory Agreements
In its deliberations regarding the renewal of each of the Management Agreement and theSub-Advisory Agreements, the Board, including the Independent Directors, considered various factors, including those described below.
Nature, Extent and Quality of the Services under the Management Agreement andSub-Advisory Agreements
The Board received and considered Contract Renewal Information regarding the nature, extent, and quality of services provided to the Fund by the Manager and theSub-Advisers under the Management Agreement and theSub-Advisory Agreements, respectively, during the past year. The Board also reviewed Contract Renewal Information regarding the Fund’s compliance policies and procedures established pursuant to the 1940 Act.
The Board reviewed the qualifications, backgrounds, and responsibilities of the Fund’s senior personnel and the portfolio management team primarily responsible for theday-to-day portfolio management of the Fund. The Board also considered, based on its knowledge of the Manager and its affiliates, the Contract Renewal Information and the Board’s discussions with the Manager and Western Asset at the Contract Renewal Meeting, the general reputation and investment performance records of the Manager, Western Asset and their affiliates and the financial resources available to the corporate parent of the Manager and theSub-Advisers, Legg Mason, Inc. (“Legg Mason”), to support their activities in respect of the Fund and the other Legg MasonClosed-end Funds.
The Board considered the responsibilities of the Manager and theSub-Advisers under the Management Agreement and theSub-Advisory Agreements, respectively, including the Manager’s coordination and oversight of the services provided to the Fund by theSub-Advisers and other fund service providers and Western Asset’s coordination and oversight of the services provided to the Fund by theNon-U.S.Sub-Advisers. The Management Agreement permits the Manager to delegate certain of its responsibilities, including its
| 50 | Western Asset Global High Income Fund Inc. |
Table of Contents
investment advisory duties thereunder, provided that the Manager, in each case, will supervise the activities of the delegee. Pursuant to this provision of the Management Agreement, the Manager does not provideday-to-day portfolio management services to the Fund. Rather, portfolio management services for the Fund are provided by Western Asset pursuant to theSub-Advisory Agreement (the “Western AssetSub-Advisory Agreement”) between the Manager and Western Asset. The Western AssetSub-Advisory Agreement permits Western Asset to delegate certain of its responsibilities, including its investmentsub-advisory duties thereunder, provided that Western Asset, in each case, will supervise the activities of the delegee. Pursuant to this provision of the Western AssetSub-Advisory Agreement, eachNon-U.S.Sub-Adviser helps to provide certain investmentsub-advisory services to the Fund pursuant to a separateSub-Advisory Agreement with Western Asset.
In reaching its determinations regarding continuation of the Management Agreement and theSub-Advisory Agreements, the Board took into account that Fund stockholders, in pursuing their investment goals and objectives, likely purchased their shares of the Fund based upon the reputation and the investment style, philosophy and strategy of the Manager and Western Asset, as well as the resources available to the Manager and theSub-Advisers.
The Board concluded that, overall, the nature, extent, and quality of the management and other services provided to the Fund under the Management Agreement and theSub-Advisory Agreements have been satisfactory under the circumstances.
Fund Performance
The Board received and considered information regarding Fund performance, including information and analyses (the “Broadridge Performance Information”) for the Fund, as well as for a group of comparable funds (the “Performance Universe”) selected by Broadridge Financial Solutions, Inc. (“Broadridge”), an independent provider of investment company data. The Board was provided with a description of the methodology Broadridge used to determine the similarity of the Fund with the funds included in the Performance Universe. The Performance Universe included the Fund and all leveraged high yieldclosed-end funds, as classified by Broadridge, regardless of asset size. The Performance Universe ranged in size from a low oftwenty-six funds, including the Fund, for the5-year period ended June 30, 2019 to a high of thirty-four funds, including the Fund, for the1-year period ended on such date. The Board noted that it had received and discussed with the Manager and Western Asset information throughout the year at periodic intervals comparing the Fund’s performance against its benchmark and its peer funds as selected by Broadridge.
The Broadridge Performance Information comparing the Fund’s performance to that of the Performance Universe based on net asset value per share showed, among other things, that among the funds in the Performance Universe, the Fund’s performance was ranked second for the 1 — year period ended June 30, 2019, ranked sixteenth for the3-year period ended on
| Western Asset Global High Income Fund Inc. | 51 |
Table of Contents
Board approval of management and subadvisory agreements(unaudited) (cont’d)
such date and ranked fifteenth for the5-year period ended on such date. The Fund’s performance was above the median performance of the Performance Universe for the1-year period, at the Performance Universe median for the3-year period and was below the median of the Performance Universe for the5-year period. According to the Manager, the objectives and strategies of the Fund were materially different from those of other funds in the Performance Universe. The Manager noted that an investment objective of the Fund is to provide high levels of current income through investments in investment-grade, emerging markets and below investment grade fixed-income securities globally. In addition to the Fund’s performance relative to the Performance Universe, the Board considered the Fund’s performance relative to its benchmark. On a net asset value basis, the Fund outperformed its benchmark for each of the1-,3- and5-year periods ended June 30, 2019.
Based on the reviews and discussions of Fund performance and considering other relevant factors, including those noted above, the Board concluded, under the circumstances, that continuation of the Management Agreement and theSub-Advisory Agreements for an additionalone-year period would be consistent with the interests of the Fund and its stockholders.
Management andSub-Advisory Fees and Expense Ratios
The Board reviewed and considered the management fee (the “Management Fee”) payable by the Fund to the Manager under the Management Agreement and thesub-advisory fees (the“Sub-Advisory Fees”) payable by the Manager and Western Asset, as applicable, to theSub-Advisers under theSub-Advisory Agreements in view of the nature, extent and overall quality of the management, investment advisory and other services provided by the Manager and theSub-Advisers. The Board noted that theSub-Advisory Fees payable to Western Asset under the Western AssetSub-Advisory Agreement are paid by the Manager, not the Fund, and, accordingly, that the retention of Western Asset does not increase the fees or expenses otherwise incurred by the Fund’s shareholders. Similarly, the Board noted that theSub-Advisory Fees payable to each of theNon-U.S.Sub-Advisers under itsSub-Advisory Agreement with Western Asset are paid by Western Asset, not the Fund, and, accordingly, that the retention of suchNon-U.S.Sub-Adviser does not increase the fees or expenses otherwise incurred by the Fund’s stockholders.
Additionally, the Board received and considered information and analyses prepared by Broadridge (the “Broadridge Expense Information”) comparing the Management Fee and the Fund’s overall expenses with those of funds in an expense group (the “Expense Group”) selected and provided by Broadridge. The comparison was based upon the constituent funds’ latest fiscal years. The Expense Group consisted of the Fund and eleven other leveraged high yieldclosed-end funds, as classified by Broadridge. The twelve funds in the
| 52 | Western Asset Global High Income Fund Inc. |
Table of Contents
Expense Group had average net common share assets ranging from $252.5 million to $880.4 million. Four of the other Expense Group funds were larger than the Fund and seven were smaller.
The Broadridge Expense Information, comparing the Management Fee as well as the Fund’s actual total expenses to the Fund’s Expense Group, showed, among other things, that the Management Fee on a contractual basis was ranked fifth (first being lowest and, therefore, best in these expense component rankings) among the funds in the Expense Group. Among the funds in the Expense Group, the Fund’s actual Management Fee (i.e., giving effect to any voluntary fee waivers implemented by the Manager with respect to the Fund and by the managers of the other Expense Group funds) was ranked seventh whether compared on the basis of common share assets only or on the basis of common share and leveraged assets. The Broadridge Expense Information further showed that the Fund’s actual total expenses ranked fifth among the Expense Group funds when compared on the basis of common share assets only and was ranked sixth when compared on the basis of common share and leveraged assets. The Fund’s Management fee on a contractual basis and its actual total expenses whether compared on the basis of common share assets only or on the basis of common share and leveraged assets were below the Expense Group median for that expense component, while the Fund’s actual Management Fee whether compared on the basis of common share assets only or on the basis of common share and leveraged assets was above the Expense Group median. The Board noted that the small number of funds in the Expense Group made meaningful expense comparisons difficult.
The Board also reviewed Contract Renewal Information regarding fees charged by the Manager to other U.S. clients investing primarily in an asset class similar to that of the Fund, including, where applicable, institutional and separate accounts. The Board was advised that the fees paid by such institutional, separate account and other clients (collectively, “institutional clients”) generally are lower, and may be significantly lower, than the Management Fee. The Contract Renewal Information generally attributed the fee differential to differences in the scope of services provided to the Fund and to institutional clients. Among other things, institutional clients have fewer compliance, administration and other needs than the Fund and the Fund is subject not only to heightened regulatory requirements relative to institutional clients but also to requirements for listing on the New York Stock Exchange. The Contract Renewal Information noted further that the Fund is provided with administrative services, office facilities, Fund officers (including the Fund’s chief executive, chief financial and chief compliance officers), and that the Manager coordinates and oversees the provision of services to the Fund by other fund service providers. The Contract Renewal Information included information regarding management fees paid byopen-end mutual funds in the same complex (the “Legg MasonOpen-end Funds”) and such information indicated that the management fees paid by the Legg MasonClosed-end Funds generally were higher than those paid by the Legg MasonOpen-end Funds. The Contract Renewal
| Western Asset Global High Income Fund Inc. | 53 |
Table of Contents
Board approval of management and subadvisory agreements(unaudited) (cont’d)
Information noted that the Legg MasonClosed-end Funds typically incur expenses that usually are not incurred by the Legg MasonOpen-end Funds such as those related to the annual stockholder meeting, compliance with securities exchange listing requirements and the management and monitoring of leverage. The Board considered the fee comparisons in view of the different services provided in managing these other types of clients and funds.
Taking all of the above, including the changes in the Fund’s portfolio management team, into consideration and subject to concerns discussed below regarding the profitability to the Manager in providing services to the Fund, the Board determined that the Management Fee and theSub-Advisory Fees reflected the nature, extent and overall quality of the management, investment advisory and other services provided by the Manager and theSub-Advisers to the Fund under the Management Agreement and theSub-Advisory Agreements, respectively.
Manager Profitability
The Board, as part of the Contract Renewal Information, received an analysis of the profitability to the Manager and its affiliates in providing services to the Fund for the Manager’s fiscal years ended March 31, 2018 and March 31, 2019. The Board also received profitability information with respect to the Legg Mason fund complex as a whole. In addition, the Board received Contract Renewal Information with respect to the Manager’s revenue and cost allocation methodologies used in preparing such profitability data. The profitability to each of theSub-Advisers was not considered to be a material factor in the Board’s considerations since Western Asset’sSub-Advisory Fee is paid by the Manager, not the Fund, and theSub-Advisory Fees for theNon-U.S.Sub-Advisers are paid by Western Asset, not the Fund. The profitability analysis presented to the Board as part of the Contract Renewal Information indicated that thepre-tax profitability of the Fund to the Manager had decreased in fiscal year 2019 from the level in fiscal year 2018 and remained at a level that the Board did not consider to be excessive in view of judicial guidance and the nature, extent and overall quality of the investment advisory and other services provided to the Fund but merited monetary.
Economies of Scale
The Board received and discussed Contract Renewal Information concerning whether the Manager realizes economies of scale if the Fund’s assets grow. The Board noted that because the Fund is aclosed-end fund with no current plans to seek additional assets beyond maintaining its dividend reinvestment plan, any significant growth in its assets generally will occur through appreciation in the value of the Fund’s investment portfolio, rather than sales of additional shares in the Fund. The Board determined that the Management Fee structure, which incorporates no breakpoints reducing the Management Fee at specified increased asset levels, was appropriate under the circumstances.
| 54 | Western Asset Global High Income Fund Inc. |
Table of Contents
Other Benefits to the Manager and theSub-Advisers
The Board considered other benefits received by the Manager, theSub-Advisers and their affiliates as a result of their relationship with the Fund and did not regard such benefits as excessive.
* * * * * *
In light of all of the foregoing and other relevant factors, the Board determined, under the circumstances, that continuation of the Management Agreement and theSub-Advisory Agreements would be consistent with the interests of the Fund and its stockholders and unanimously voted to continue each Agreement for an additionalone-year period. No single factor reviewed by the Board was identified by the Board as the principal factor in determining whether to approve continuation of the Management Agreement and theSub-Advisory Agreements, and each Board member may have attributed different weights to the various factors. The Independent Directors were advised by separate independent legal counsel throughout the process. Prior to the Contract Renewal Meeting, the Board received a memorandum prepared by the Manager discussing its responsibilities in connection with its consideration of the continuation of the Management Agreement and theSub-Advisory Agreements as part of the Contract Renewal Information and the Independent Directors separately received a memorandum discussing such responsibilities from their independent legal counsel. Prior to voting, the Independent Directors also discussed the proposed continuation of the Management Agreement and theSub-Advisory Agreements in private sessions with their independent legal counsel at which no representatives of the Manager or anySub-Adviser were present.
| Western Asset Global High Income Fund Inc. | 55 |
Table of Contents
Additional shareholder information(unaudited)
Results of annual meeting of shareholders
The Annual Meeting of Shareholders of Western Asset Global High Income Fund Inc. was held on October 25, 2019, for the purpose of considering and voting upon the proposals presented at the Meeting. The following table provides information concerning the matters voted upon at the Meeting:
Election of directors
| Nominees | Votes For | Votes Withheld | ||||||
| Robert D. Agdern* | 15,551,998 | 785,860 | ||||||
| Eileen A. Kamerick* | 15,516,032 | 821,826 | ||||||
| David Basile** | 11,577,221 | 309,579 | ||||||
| Frederic Gabriel** | 11,577,143 | 309,657 | ||||||
| * | Board of Directors nominee |
| ** | Saba Capital Management L.P. nominee |
At October 31, 2019, in addition to Robert D. Agdern and Eileen A. Kamerick, the other Directors were as follows:
Carol L. Colman
Daniel P. Cronin
Paolo M. Cucchi
William R. Hutchinson
Nisha Kumar
Jane Trust
Non-Binding Proposal to Declassify Board of Directors
Anon-binding proposal put forth by Saba Capital Management, L.P. requesting that the Board of Directors take all necessary steps in its power to declassify the Board of Directors.
| For | Against | Abstain | ||
| 18,358,086 | 9,149,832 | 716,727 |
| 56 | Western Asset Global High Income Fund Inc. |
Table of Contents
Dividend reinvestment plan(unaudited)
Unless you elect to receive distributions in cash (i.e.,opt-out), all dividends, including any capital gain dividends and return of capital distributions, on your Common Stock will be automatically reinvested by Computershare Trust Company, N.A., as agent for the stockholders (the “Plan Agent”), in additional shares of Common Stock under the Fund’s Dividend Reinvestment Plan (the “Plan”). You may elect not to participate in the Plan by contacting the Plan Agent. If you do not participate, you will receive all cash distributions paid by check mailed directly to you by Computershare Trust Company, N.A., as dividend paying agent.
If you participate in the Plan, the number of shares of Common Stock you will receive will be determined as follows:
(1) If the market price of the Common Stock (plus $0.03 per share commission) on the payment date (or, if the payment date is not a NYSE trading day, the immediately preceding trading day) is equal to or exceeds the net asset value per share of the Common Stock at the close of trading on the NYSE on the payment date, the Fund will issue new Common Stock at a price equal to the greater of (a) the net asset value per share at the close of trading on the NYSE on the payment date or (b) 95% of the market price per share of the Common Stock on the payment date.
(2) If the net asset value per share of the Common Stock exceeds the market price of the Common Stock (plus $0.03 per share commission) at the close of trading on the NYSE on the payment date, the Plan Agent will receive the dividend or distribution in cash and will buy Common Stock in the open market, on the NYSE or elsewhere, for your account as soon as practicable commencing on the trading day following the payment date and terminating no later than the earlier of (a) 30 days after the dividend or distribution payment date, or (b) the payment date for the next succeeding dividend or distribution to be made to the stockholders; except when necessary to comply with applicable provisions of the federal securities laws. If during this period: (i) the market price (plus $0.03 per share commission) rises so that it equals or exceeds the net asset value per share of the Common Stock at the close of trading on the NYSE on the payment date before the Plan Agent has completed the open market purchases or (ii) if the Plan Agent is unable to invest the full amount eligible to be reinvested in open market purchases, the Plan Agent will cease purchasing Common Stock in the open market and the Fund shall issue the remaining Common Stock at a price per share equal to the greater of (a) the net asset value per share at the close of trading on the NYSE on the day prior to the issuance of shares for reinvestment or (b) 95% of the then current market price per share.
Common Stock in your account will be held by the Plan Agent innon-certificated form. Any proxy you receive will include all shares of Common Stock you have received under the Plan. You may withdraw from the Plan (i.e.,opt-out) by notifying the Plan Agent in writing at 462 South 4th Street, Suite 1600, Louisville, KY 40202 or by calling the Plan Agent at
1-888-888-0151. Such withdrawal will be effective immediately if notice is received by the Plan Agent not less than ten business days prior to any dividend or distribution record date;
| Western Asset Global High Income Fund Inc. | 57 |
Table of Contents
Dividend reinvestment plan(unaudited) (cont’d)
otherwise such withdrawal will be effective as soon as practicable after the Plan Agent’s investment of the most recently declared dividend or distribution on the Common Stock.
Plan participants who sell their shares will be charged a service charge (currently $5.00 per transaction) and the Plan Agent is authorized to deduct brokerage charges actually incurred from the proceeds (currently $0.05 per share commission). There is no service charge for reinvestment of your dividends or distributions in Common Stock. However, all participants will pay a pro rata share of brokerage commissions incurred by the Plan Agent when it makes open market purchases. Because all dividends and distributions will be automatically reinvested in additional shares of Common Stock, this allows you to add to your investment through dollar cost averaging, which may lower the average cost of your Common Stock over time. Dollar cost averaging is a technique for lowering the average cost per share over time if the Fund’s net asset value declines. While dollar cost averaging has definite advantages, it cannot assure profit or protect against loss in declining markets.
Automatically reinvesting dividends and distributions does not mean that you do not have to pay income taxes due upon receiving dividends and distributions. Investors will be subject to income tax on amounts reinvested under the Plan.
The Fund reserves the right to amend or terminate the Plan if, in the judgment of the Board of Directors, the change is warranted. The Plan may be terminated, amended or supplemented by the Fund upon notice in writing mailed to stockholders at least 30 days prior to the record date for the payment of any dividend or distribution by the Fund for which the termination or amendment is to be effective. Upon any termination, you will be sent cash for any fractional share of Common Stock in your account. You may elect to notify the Plan Agent in advance of such termination to have the Plan Agent sell part or all of your Common Stock on your behalf. Additional information about the Plan and your account may be obtained from the Plan Agent at 462 South 4th Street, Suite 1600, Louisville, KY 40202 or by calling the Plan Agent at1-888-888-0151.
| 58 | Western Asset Global High Income Fund Inc. |
Table of Contents
(This page intentionally left blank.)
Table of Contents
(This page intentionally left blank.)
Table of Contents
(This page intentionally left blank.)
Table of Contents
(This page intentionally left blank.)
Table of Contents
Western Asset
Global High Income Fund Inc. (EHI)
Directors
Robert D. Agdern
Carol L. Colman
Daniel P. Cronin
Paolo M. Cucchi
William R. Hutchinson
Eileen A. Kamerick
Nisha Kumar
Jane Trust
Chairman
Officers
Jane Trust
President and Chief Executive Officer
Christopher Berarducci*
Treasurer and Principal Financial Officer
Todd F. Kuehl
Chief Compliance Officer
Jenna Bailey
Identity Theft Prevention Officer
Robert I. Frenkel
Secretary and Chief Legal Officer
Thomas C. Mandia
Assistant Secretary
Jeanne M. Kelly
Senior Vice President
| * | Effective September 27, 2019, Mr. Berarducci became Treasurer and Principal Financial Officer. |
Western Asset Global High Income Fund Inc.
620 Eighth Avenue
49th Floor
New York, NY 10018
Investment manager
Legg Mason Partners Fund Advisor, LLC
Subadvisers
Western Asset Management Company, LLC
Western Asset Management Company Limited
Western Asset Management Company Pte. Ltd
Custodian
The Bank of New York Mellon
Transfer agent
Computershare Inc.
462 South 4th Street, Suite 1600
Louisville, KY 40202
Independent registered public accounting firm
PricewaterhouseCoopers LLP
Baltimore, MD
Legal counsel
Simpson Thacher & Bartlett LLP
425 Lexington Avenue
New York, NY 10017
New York Stock Exchange Symbol
EHI
Table of Contents
Legg Mason Funds Privacy and Security Notice
Your Privacy and the Security of Your Personal Information is Very Important to the Legg Mason Funds
This Privacy and Security Notice (the “Privacy Notice”) addresses the Legg Mason Funds’ privacy and data protection practices with respect to nonpublic personal information the Funds receive. The Legg Mason Funds include any funds sold by the Funds’ distributor, Legg Mason Investor Services, LLC, as well as Legg Mason-sponsoredclosed-end funds. The provisions of this Privacy Notice apply to your information both while you are a shareholder and after you are no longer invested with the Funds.
The Type of Nonpublic Personal Information the Funds Collect About You
The Funds collect and maintain nonpublic personal information about you in connection with your shareholder account. Such information may include, but is not limited to:
| • | Personal information included on applications or other forms; |
| • | Account balances, transactions, and mutual fund holdings and positions; |
| • | Bank account information, legal documents, and identity verification documentation; |
| • | Online account access user IDs, passwords, security challenge question responses; and |
| • | Information received from consumer reporting agencies regarding credit history and creditworthiness (such as the amount of an individual’s total debt, payment history, etc.). |
How the Funds Use Nonpublic Personal Information About You
The Funds do not sell or share your nonpublic personal information with third parties or with affiliates for their marketing purposes, or with other financial institutions or affiliates for joint marketing purposes, unless you have authorized the Funds to do so. The Funds do not disclose any nonpublic personal information about you except as may be required to perform transactions or services you have authorized or as permitted or required by law. The Funds may disclose information about you to:
| • | Employees, agents, and affiliates on a “need to know” basis to enable the Funds to conduct ordinary business or to comply with obligations to government regulators; |
| • | Service providers, including the Funds’ affiliates, who assist the Funds as part of the ordinary course of business (such as printing, mailing services, or processing or servicing your account with us) or otherwise perform services on the Funds’ behalf, including companies that may perform statistical analysis, market research and marketing services solely for the Funds; |
| • | Permit access to transfer, whether in the United States or countries outside of the United States to such Funds’ employees, agents and affiliates and service providers as required to enable the Funds to conduct ordinary business, or to comply with obligations to government regulators; |
| • | The Funds’ representatives such as legal counsel, accountants and auditors to enable the Funds to conduct ordinary business, or to comply with obligations to government regulators; |
| • | Fiduciaries or representatives acting on your behalf, such as an IRA custodian or trustee of a grantor trust. |
| NOT PART OF THE SEMI-ANNUAL REPORT |
Table of Contents
Legg Mason Funds Privacy and Security Notice (cont’d)
Except as otherwise permitted by applicable law, companies acting on the Funds’ behalf, including those outside the United States, are contractually obligated to keep nonpublic personal information the Funds provide to them confidential and to use the information the Funds share only to provide the services the Funds ask them to perform.
The Funds may disclose nonpublic personal information about you when necessary to enforce their rights or protect against fraud, or as permitted or required by applicable law, such as in connection with a law enforcement or regulatory request, subpoena, or similar legal process. In the event of a corporate action or in the event a Fund service provider changes, the Funds may be required to disclose your nonpublic personal information to third parties. While it is the Funds’ practice to obtain protections for disclosed information in these types of transactions, the Funds cannot guarantee their privacy policy will remain unchanged.
Keeping You Informed of the Funds’ Privacy and Security Practices
The Funds will notify you annually of their privacy policy as required by federal law. While the Funds reserve the right to modify this policy at any time they will notify you promptly if this privacy policy changes.
The Funds’ Security Practices
The Funds maintain appropriate physical, electronic and procedural safeguards designed to guard your nonpublic personal information. The Funds’ internal data security policies restrict access to your nonpublic personal information to authorized employees, who may use your nonpublic personal information for Fund business purposes only.
Although the Funds strive to protect your nonpublic personal information, they cannot ensure or warrant the security of any information you provide or transmit to them, and you do so at your own risk. In the event of a breach of the confidentiality or security of your nonpublic personal information, the Funds will attempt to notify you as necessary so you can take appropriate protective steps. If you have consented to the Funds using electronic communications or electronic delivery of statements, they may notify you under such circumstances using the most current email address you have on record with them.
In order for the Funds to provide effective service to you, keeping your account information accurate is very important. If you believe that your account information is incomplete, not accurate or not current, if you have questions about the Funds’ privacy practices, or our use of your nonpublic personal information, write the Funds using the contact information on your account statements, email the Funds by clicking on the Contact Us section of the Funds’ website at www.leggmason.com, or contact the Funds at1-888-777-0102.
Revised April 2018
| NOT PART OF THE SEMI-ANNUAL REPORT |
Table of Contents
Western Asset Global High Income Fund Inc.
Western Asset Global High Income Fund Inc.
620 Eighth Avenue
49th Floor
New York, NY 10018
Notice is hereby given in accordance with Section 23(c) of the Investment Company Act of 1940, as amended, that from time to time the Fund may purchase, at market prices, shares of its stock.
The Fund files its complete schedule of portfolio holdings with the Securities and Exchange Commission (“SEC”) for the first and third quarters of each fiscal year as an exhibit to its reports on FormN-PORT. The Fund’s FormsN-PORT are available on the SEC’s website at www.sec.gov. To obtain information on FormN-PORT, shareholders can call the Fund at1-888-777-0102.
Information on how the Fund voted proxies relating to portfolio securities during the prior12-month period ended June 30th of each year and a description of the policies and procedures that the Fund uses to determine how to vote proxies related to portfolio transactions are available (1) without charge, upon request, by calling1-888-777-0102, (2) at www.lmcef.com and (3) on the SEC’s website at www.sec.gov.
This report is transmitted to the shareholders of Western Asset Global High Income Fund Inc. for their information. This is not a prospectus, circular or representation intended for use in the purchase of shares of the Fund or any securities mentioned in this report.
Computershare Inc.
462 South 4th Street, Suite 1600
Louisville, KY 40202
WASX010654 1/20 SR19-3798
Table of Contents
ITEM 2. CODE OF ETHICS.
Not applicable.
ITEM 3. AUDIT COMMITTEE FINANCIAL EXPERT.
Not applicable.
ITEM 4. PRINCIPAL ACCOUNTANT FEES AND SERVICES.
Not applicable.
ITEM 5. AUDIT COMMITTEE OF LISTED REGISTRANTS.
Not applicable.
ITEM 6. SCHEDULE OF INVESTMENTS.
Included herein under Item 1.
ITEM 7. DISCLOSURE OF PROXY VOTING POLICIES AND PROCEDURES FORCLOSED-END MANAGEMENT INVESTMENT COMPANIES.
Not applicable.
ITEM 8. INVESTMENT PROFESSIONALS OFCLOSED-END MANAGEMENT INVESTMENT COMPANIES.
Not applicable.
ITEM 9. PURCHASES OF EQUITY SECURITIES BYCLOSED-END MANAGEMENT INVESTMENT COMPANY AND AFFILIATED PURCHASERS.
Not applicable.
ITEM 10. SUBMISSION OF MATTERS TO A VOTE OF SECURITY HOLDERS.
Not applicable.
ITEM 11. CONTROLS AND PROCEDURES.
| (a) | The registrant’s principal executive officer and principal financial officer have concluded that the registrant’s disclosure controls and procedures (as defined in Rule30a- 3(c) under the Investment Company Act of 1940, as amended (the “1940 Act”)) are effective as of a date within 90 days of the filing date of this report that includes the disclosure required by this paragraph, based on their evaluation of the disclosure controls and procedures required by Rule30a-3(b) under the 1940 Act and15d-15(b) under the Securities Exchange Act of 1934. |
| (b) | There were no changes in the registrant’s internal control over financial reporting (as defined in Rule30a-3(d) under the 1940 Act) that occurred during the second fiscal quarter of the period covered by this report that have materially affected, or are likely to materially affect the registrant’s internal control over financial reporting. |
Table of Contents
| ITEM 12. | DISCLOSURE OF SECURITIES LENDING ACTIVITIES FORCLOSED-END MANAGEMENT INVESTMENT COMPANIES. | |
| Not applicable. | ||
| ITEM 13. | EXHIBITS. | |
| (a) (1) Not applicable. | ||
| Exhibit 99.CODE ETH | ||
| (a) (2) Certifications pursuant to section 302 of the Sarbanes-Oxley Act of 2002 attached hereto. | ||
| Exhibit 99.CERT | ||
| (b) Certifications pursuant to Section 906 of the Sarbanes-Oxley Act of 2002 attached hereto. | ||
| Exhibit 99.906CERT | ||
Table of Contents
SIGNATURES
Pursuant to the requirements of the Securities Exchange Act of 1934 and the Investment Company Act of 1940, the registrant has duly caused this Report to be signed on its behalf by the undersigned, there unto duly authorized.
Western Asset Global High Income Fund Inc.
| By: | /s/ Jane Trust | |
| Jane Trust | ||
| Chief Executive Officer | ||
| Date: | January 27, 2020 | |
Pursuant to the requirements of the Securities Exchange Act of 1934 and the Investment Company Act of 1940, this report has been signed below by the following persons on behalf of the registrant and in the capacities and on the dates indicated.
| By: | /s/ Jane Trust | |
| Jane Trust | ||
| Chief Executive Officer | ||
| Date: | January 27, 2020 | |
| By: | /s/ Christopher Berarducci | |
| Christopher Berarducci | ||
| Principal Financial Officer | ||
| Date: | January 27, 2020 | |