UNITED STATES
SECURITIES AND EXCHANGE COMMISSION
Washington, D.C. 20549
FORM 10-K
ý Annual report pursuant to Section 13 or 15(d) of the Securities Exchange Act of 1934.
For the fiscal year ended September 30, 2005
OR
o Transition report pursuant to Section 13 or 15(d) of the Securities Exchange Act of 1934.
COMMISSION FILE NUMBER 0001229899
LITTLE SIOUX CORN PROCESSORS, L.L.C.
(Exact name of small business issuer as specified in its charter)
Iowa | | 42-1510421 |
(State or other jurisdiction of
incorporation or organization) | | (I.R.S. Employer
Identification No.) |
| | |
4808 F Avenue, Marcus, Iowa 51035 |
(Address of principal executive offices) |
| | |
(712) 376-2800 |
(Issuer’s telephone number, including area code) |
| | |
Securities registered pursuant to Section 12(b) of the Exchange Act: |
None |
| | |
Securities registered pursuant to Section 12(g) of the Exchange Act: |
Membership Units |
Indicate by check mark if the registrant is a well-known seasoned issuer, as defined in Rule 405 of the Securities Act.
o Yes ý No
Indicate by check mark if the registrant is not required to file reports pursuant to Section 13 or Section 15(d) of the Act.
o Yes ý No
Indicate by check mark whether the registrant (1) has filed all reports required to be filed by Section 13 or 15(d) of the Exchange Act of 1934 during the preceding 12 months (or for such shorter period that the registrant was required to file such reports), and (2) has been subject to such filing requirements for the past 90 days. ý Yes o No
Indicate by check mark if disclosure of delinquent filers pursuant to Item 405 of Regulation S-K (§229.405 of this chapter) is not contained in this form, and no disclosure will be contained, to the best of registrant’s knowledge, in definitive proxy or information statements incorporated by reference in Part III of this Form 10-K or any amendment to this Form 10-K. ý
Indicate by check mark whether the registrant is an accelerated filer (as defined in Rule 12b-2 of the Act).
o Yes ý No
Indicate by check mark whether the registrant is a shell company (as defined in Rule 12b-2 of the Act).
o Yes ý No
The aggregate market value of the registrant’s membership units held by non-affiliates of the registrant was $32,823,000 computed by reference to the price at which membership units were last sold.
As of the date of this filing, there are 10,941 membership units of the registrant outstanding.
DOCUMENTS INCORPORATED BY REFERENCE
The registrant has incorporated by reference into Part III of this Annual Report on Form 10-K portions of its definitive proxy statement to be filed with the Securities and Exchange Commission within 120 days after the close of the fiscal year covered by this Annual Report.
CAUTIONARY STATEMENTS REGARDING FORWARD-LOOKING STATEMENTS
This annual report contains historical information, as well as forward-looking statements that involve known and unknown risks and relate to future events, our future financial performance, or our expected future operations and actions. In some cases, you can identify forward-looking statements by terminology such as “may,” “will,” “should,” “expect,” “plan,” “anticipate,” “believe,” “estimate,” “future,” “intend,” “could,” “hope,” “predict,” “target,” “potential,” or “continue” or the negative of these terms or other similar expressions. These forward-looking statements are only our predictions based upon current information and involve numerous assumptions, risks and uncertainties. Our actual results or actions may differ materially from these forward-looking statements for many reasons, including the reasons described in this report. While it is impossible to identify all such factors, factors that could cause actual results to differ materially from those estimated by us include:
• Overcapacity within the ethanol industry;
• Actual ethanol, distillers grains and corn oil production varying from expectations;
• Availability and costs of products and raw materials, particularly corn and natural gas;
• Changes in the price and market for ethanol, distillers grains and corn oil;
• Our ability to market and our reliance on third parties to market our products;
• Changes in or elimination of governmental laws, tariffs, trade or other controls or enforcement practices such as:
– national, state or local energy policy;
– federal ethanol tax incentives;
– legislation establishing a renewable fuel standard or other legislation mandating the use of ethanol or other oxygenate additives;
– state and federal regulation restricting or banning the use of MTBE; or
– environmental laws and regulations that apply to our plant operations and their enforcement;
• Changes in the weather or general economic conditions impacting the availability and price of corn and natural gas;
• Total U.S. consumption of gasoline;
• Fluctuations in petroleum prices;
• Changes in plant production capacity or technical difficulties in operating the plant;
• Costs of construction and equipment;
• Changes in our business strategy, capital improvements or development plans;
• Results of our hedging strategies;
• Changes in interest rates or the availability of credit;
• Our ability to generate free cash flow to invest in our business and service our debt;
• Our liability resulting from litigation;
• Our ability to retain key employees and maintain labor relations;
• Changes and advances in ethanol production technology;
• Competition from alternative fuels and alternative fuel additives.
• Other factors described elsewhere in this report.
3
The cautionary statements referred to in this section also should be considered in connection with any subsequent written or oral forward-looking statements that may be issued by us or persons acting on our behalf. We undertake no duty to update these forward-looking statements, even though our situation may change in the future. Furthermore, we cannot guarantee future results, events, levels of activity, performance, or achievements. We caution you not to put undue reliance on any forward-looking statements, which speak only as of the date of this report. You should read this report and the documents that we reference in this report and have filed as exhibits, completely and with the understanding that our actual future results may be materially different from what we currently expect. We qualify all of our forward-looking statements by these cautionary statements.
AVAILABLE INFORMATION
Information about us is also available at our website at www.littlesiouxcornprocessors.com, under “SEC Compliance,” which includes links to reports we have filed with the Securities and Exchange Commission. The contents of our website are not incorporated by reference in this Annual Report on Form 10-K.
PART I.
ITEM 1. BUSINESS.
Overview
Little Sioux Corn Processors, L.L.C. (the “Company”) is an Iowa limited liability company that owns the sole general partnership interest of LSCP, LLLP, (the “Partnership”) an Iowa limited liability limited partnership. As general partner, we manage the business and day-to-day operations of the Partnership’s 52 million gallon per year ethanol plant which produces ethanol, distillers grains and corn oil. The Company and its subsidiary, LSCP, LLLP, are collectively referred to in this report as “LSCP,” “we,” or “us.”
Since April 2003, we have been engaged in the production of ethanol and distillers grains at our ethanol plant. During fiscal year 2005, we completed the expansion of our plant from an ethanol production capacity of 40 million gallons per year to 52 million gallons per year and installed additional drier controls and maintenance system software. Subsequent to our fiscal year end on September 30, 2005, we installed a corn oil segregation unit.
Fuel grade ethanol is our primary product accounting for the majority of our revenue. We also sell distillers grains, a principal co-product of the ethanol production process, which may be sold as distillers dried grains and distillers modified wet grains. In 2005, we processed approximately 17.6 million bushels of corn into approximately 49 million gallons of ethanol. We also processed approximately 247,000 tons of distillers grains in 2005. In addition in October 2005, we began selling corn oil. In 2006, we anticipate producing approximately 52 million gallons of ethanol, 248,000 tons of distillers grains, and 12 million pounds of corn oil from approximately 18.3 million bushels of corn. However, there is no assurance that we will be able to operate at these anticipated levels.
General Development of Business since October 1, 2004
We were formed as an Iowa limited liability company on September 28, 2000. On March 6, 2002, we purchased the sole general partnership interest in an Iowa limited partnership, LSCP, LP. On June 26, 2003, LSCP, LP elected to become a limited liability limited partnership and is referred to as LSCP, LLLP.
Our general partnership interest in the Partnership represents substantially all of our assets. The Partnership owns and operates a 52 million-gallon per year ethanol plant near Marcus, Iowa. The plant commenced operations in April 2003. In July 2005, the Partnership completed an expansion, from a 40 million gallon per year plant to a 52 million gallon per year plant.
The Partnership consists of the Company, which is the sole general partner, and various limited partners, which own the limited partnership interests. There are six classes of limited partnership interests of which only three classes are currently outstanding. Limited partnership interests are designated in units. The following diagram illustrates the relationship between the Company and the Partnership:
4
DIAGRAM OF THE REGISTRANT’S RELATIONSHIP TO LSCP, LLLP
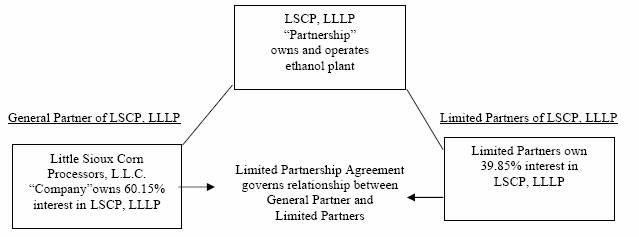
As general partner of LSCP, LLLP, we have the complete and exclusive power to manage and control the affairs of the Partnership including the day-to-day business and operations of the ethanol plant. As general partner of a limited liability limited partnership, we have limited liability for the payment of debts and liabilities of the Partnership. Under the limited partnership agreement, we can only be removed as general partner if a court has determined that we have been grossly negligent in performing our duties as general partner and the holders of at least 66 2/3% of the outstanding limited partnership units vote to remove us.
The limited partnership agreement allows each class of limited partnership interests the right to appoint one director to our board of directors. This means that the three classes of limited partnership interests can elect three of the thirteen directors on our board. Our board of directors is divided into two classes known as Class A and Class B. Class A directors are elected by the Company’s members. Class B directors are elected by the limited partners of the limited partnership. Both Class A and Class B directors can take action with respect to any matters relating to the ownership and operation of the ethanol plant. However, only Class A directors can take action with respect to any matters relating to the Company and not also directly relating to the ethanol plant. For example, Class B directors may not vote on a motion regarding any distributions we may make to our members. No limited partner or class of limited partnership interests has the right to appoint a majority of the Company’s directors or control the business of the limited partnership.
Our power to manage LSCP, LLLP is restricted in three cases. First, we cannot dispose of or encumber substantially all of the assets of the limited partnership without first obtaining the consent of the holders of a majority of the limited partnership interests. Second, we cannot remove or appoint a general manager responsible for managing the limited partnership’s business without first obtaining the consent of the holders of a majority of the limited partnership interests and our primary lending institution. Finally, we cannot admit additional general or limited partners without first obtaining the approval of the holders of at least 75% of the limited partnership units.
Under the limited partnership agreement, distributions of the limited partnership’s revenues (as defined below) are made to the general and limited partners in proportion to the units held, however, distributions are also limited by loan covenants contained in our loan agreements executed with our lenders. For example, our loan agreements require us to maintain various financial ratios and make additional loan payments based on excess cash flow, including payments received from the USDA’s Commodity Credit Corporation Bioenergy Program, as discussed below in “Item 7 – Management’s Discussion and Analysis of Financial Condition and Results of Operations - Liquidity and Capital Resources.”
The Partnership’s revenues are defined by the limited partnership agreement as “net cash flow” meaning the gross cash proceeds of the limited partnership less the amount of proceeds used for expenses, debt payments, capital improvements, replacements, contingencies and reserves, all as reasonably determined by the Company, as
5
general partner. Distributions are made in proportion to the units held by the general and limited partners, which means that a partner’s distribution is calculated based on the number of units such partner owns in proportion to the number of total units outstanding. For example, the Company currently owns 2,189 limited partnership units of the 3,639 limited partnership units outstanding. Therefore, the Company is entitled to distributions equaling 60.15% of the limited partnership’s net cash flow (2,189 units divided by 3,639 units). No partner is entitled to a minimum distribution amount. However, the limited partnership agreement provides that the Company, as general partner, will endeavor to provide for cash distributions at the times and amounts necessary to allow the partners to make timely payment of income taxes. Distributions are not prioritized among the partners.
After giving effect to certain special allocations, such as adjustments for partners who bear the risk of economic loss for certain partnership debts, profits and losses are generally allocated in the same manner as distributions of the limited partnership’s net cash flow. Therefore, the Company, as general partner, is generally allocated 60.15% of the limited partnership’s profits and losses and the limited partners are generally allocated 39.85% of the limited partnership’s profits and losses.
The limited partnership agreement can only be amended if the amendment is approved by our board of directors and is approved by holders of a majority of the limited partnership interests.
Financial Information
The financial statements of the Partnership have been consolidated with the Company since the Partnership was formed on October 16, 2001. The Partnership did not have any assets until the partners of the Partnership contributed assets in March 2002. The net assets contributed by the Company were less than the proportional limited partnership interest received in return as compared to the net assets contributed by the other partners in the Partnership. The other limited partners contributed a total of $7,750,000 in return for 1,550 units in the limited partnership ($5,000 per unit). The Company contributed all of its net assets, approximately $10,198,000, in return for 2,189 units in the limited partnership ($4,658 per unit). Due to the Company’s previous efforts to begin the ethanol plant, the Company was given credit for value in addition to the net assets transferred. Please refer to “Item 7 – Management’s Discussion and Analysis of Financial Condition and Results of Operations” for information about our revenues, profit and loss measurements and total assets and “Item 8 - Financial Statements and Supplementary Data” for our consolidated financial statements.
Principal Products and Their Markets
The principal products we produce at our plant are fuel grade ethanol and distillers grains. Subsequent to our fiscal year end on September 30, 2005, we began producing corn oil at our plant.
Ethanol
Ethanol is ethyl alcohol, a fuel component made primarily from corn and various other grains. According to the Renewable Fuels Association, approximately 85 percent of ethanol in the United States today is produced from corn, and approximately 90 percent of ethanol is produced from a corn and other input mix. Corn produces large quantities of carbohydrates, which convert into glucose more easily than most other kinds of biomass. The Renewable Fuels Association estimates current domestic ethanol production at approximately 4.28 billion gallons as of December 2005.
An ethanol plant is essentially a fermentation plant. Ground corn and water are mixed with enzymes and yeast to produce a substance called “beer,” which contains about 10% alcohol and 90% water. The “beer” is boiled to separate the water, resulting in ethyl alcohol, which is then dehydrated to increase the alcohol content. This product is then mixed with a certified denaturant to make the product unfit for human consumption and commercially saleable.
Ethanol can be used as: (i) an octane enhancer in fuels; (ii) an oxygenated fuel additive for the purpose of reducing ozone and carbon monoxide vehicle emissions; and (iii) a non-petroleum-based gasoline substitute. Approximately 95% of all ethanol is used in its primary form for blending with unleaded gasoline and other fuel products. The implementation of the Federal Clean Air act has made ethanol fuels an important domestic renewable
6
fuel additive. Used as a fuel oxygenate, ethanol provides a means to control carbon monoxide emissions in large metropolitan areas. The principal purchasers of ethanol are generally the wholesale gasoline marketer or blender. The principal markets for our ethanol are petroleum terminals in the continental United States.
For our fiscal year ended September 30, 2005, revenues from sales of ethanol were approximately 86.1% of total revenues. For our fiscal year ended September 30, 2004, revenues from sales of ethanol were approximately 85.7% of total revenues. For our fiscal year ended September 30, 2003, revenues from sales of ethanol were approximately 82.7% of total revenues. We began operations in April 2003.
Distillers Grains
A principal co-product of the ethanol production process is distillers grains, a high protein, high-energy animal feed supplement primarily marketed to the dairy and beef industry. Distillers grains contain by-pass protein that is superior to other protein supplements such as cottonseed meal and soybean meal. By-pass proteins are more digestible to the animal, thus generating greater lactation in milk cows and greater weight gain in beef cattle. Dry mill ethanol processing creates three forms of distiller grains: Distillers Wet Grains (“DWS”), Modified Wet Distillers Grains with Solubles (“MWDGS”) and Distillers Dried Grains with Solubles (“DDGS”). DWS is processed corn mash that contains approximately 70% moisture. DWS has a shelf life of approximately three days and can be sold only to farms within the immediate vicinity of an ethanol plant. DMWS is DWS that has been dried to approximately 50% moisture. DMWS have a slightly longer shelf life of approximately ten days and are often sold to nearby markets. DDGS is DWS that has been dried to 10% to 12% moisture. DDGS has an almost indefinite shelf life and may be sold and shipped to any market regardless of its vicinity to an ethanol plant. At our plant, the composition of the distillers grains we produce is approximately 31.1% DDGS and 68.9% MWDGS.
For our fiscal year ended September 30, 2005, revenues from sales of distillers grains were approximately 12.0% of total revenues. For our fiscal year ended September 30, 2004, revenues from sales of distillers grains were approximately 14.1% of total revenues. For our fiscal year ended September 30, 2003, revenues from sales of distillers grains were approximately 17.2% of total revenues. We began operations in April 2003.
New Product of the Company - Corn Oil
Corn oil can be produced as a co-product of ethanol production by installing equipment to separate the oil from the distillers grains during the production process. On March 15, 2005, the Board of Directors approved a $1,850,000 capital expenditure to install a corn oil segregation unit. In October 2005, installation of the equipment was completed and we began producing corn oil. Prior to installation of the corn oil segregation unit, the corn oil had been sold as an energy component of our distillers grains. We project this investment will increase our revenues by approximately $1,200,000 million annually, but the actual impact on our revenues could vary due to a variety of factors such as production problems, decline in the demand and price for corn oil.
Corn oil in its raw form can be used as livestock feed, as a fuel under certain operating conditions, refined into bio-diesel fuel, or refined for human consumption. We intend to initially market the unrefined corn oil to the animal feed and bio-diesel markets to assure that quality specifications can be maintained. In the long term, the corn oil co-product could be marketed for human consumption. Specific details regarding market penetration into human food are unknown at this time since corn oil extraction in a dry mill situation such as ours has not yet been proven, nor has its suitability for human consumption been determined.
Distribution of Principal Products
Our ethanol plant is located near Marcus, Iowa in Cherokee County, in the northwestern section of Iowa. We selected the Marcus site because of its location to existing grain production, accessibility to road and rail transportation and its proximity to major population centers. It is also served by the Canadian National Railroad Company. It is in close proximity to major highways that connect to major population centers such as Minneapolis, Minnesota; Omaha, Nebraska; and Chicago, Illinois.
7
Ethanol Distribution
As general partner of the Partnership, we entered into a marketing agreement with Minnesota Corn Processors, L.L.C., (“MCP”) in 2003 for the purposes of marketing and distributing all of the ethanol we produce at the plant. This marketing agreement was subsequently assigned by MCP to Archer Daniels Midland Company (“ADM”) following ADM’s acquisition of MCP. Pursuant to our ethanol marketing agreement with ADM, the price ADM pays us for our ethanol is calculated by averaging the price ADM receives for all the ethanol it sells originating from (i) our plant, (ii) ADM’s plant in Marshall, Minnesota and (iii) ADM’s plant in Columbus, Nebraska. In exchange for ADM’s marketing, sales, storage and transportation services, we pay ADM a fixed price per gallon of ethanol sold. The initial term of the marketing agreement with ADM expires in 2007 but the agreement is automatically renewed for successive one-year periods at the end of the initial term unless the parties agree otherwise.
Distillers Grains Distribution
As general partner of the Partnership, we entered into a marketing agreement with Commodity Specialist Company (“CSC”), a Delaware corporation, in 2003 for the purpose of marketing and selling all the distillers grains we produce, except distillers grains we produce and sell directly to local farmers. Approximately, 15% of the distillers grains produced at the plant are marketed and sold by CSC all over the continental United States. For our distillers grains, we receive a percentage of the selling price actually received by CSC in marketing the distillers grains to its customers. The balance of our distillers grains are locally marketed primarily to nearby livestock producers. As additional ethanol plants begin production excess capacity could result in the local markets. If excess capacity in the local markets occurs, we may be forced to dry more of our distillers grains for marketing by CSC rather than directly selling in the local markets. As a result, our natural gas costs will likely increase due to increased drying and our profits may decrease.
Corn Oil Marketing and Distribution
As general partner of the Partnership, we entered into a marketing agreement with United Bio Energy, LLC in October 2005 for the purpose of marketing and selling all the corn oil we produce. In exchange for United Bio Energy’s marketing services, we pay United Bio Energy a fixed price per pound of corn oil sold. Either party may terminate the agreement at any time with one month written notice.
Seasonal Factors in Business
In an effort to improve air quality in regions where carbon monoxide and ozone are a problem, the Federal Oxygen Program of the Clean Air Act requires the sale of oxygenated motor fuels during the winter months in certain major metropolitan areas to reduce carbon monoxide pollution. Gasoline that is blended with ethanol has a higher oxygen content than gasoline that does not contain ethanol. As a result, we expect fairly light seasonality with respect to our gross profit margins on our ethanol allowing us to, potentially, be able to sell our ethanol at a slight premium during the mandated oxygenate period. Conversely, we expect our average sales price for fuel grade ethanol during the summer, when fuel grade ethanol is primarily used as an octane enhancer or a fuel supply extender, to be a little lower.
Sources and Availability of Raw Materials
Corn Feedstock Supply
The major raw material required for our ethanol plant to produce ethanol, distiller’s grain and corn oil is corn. To operate at a name-plate capacity of 52 million gallons, the plant requires a supply of approximately 18 to 19 million bushels million bushels of corn annually. The plant’s location in Marcus, Iowa in Cherokee County currently provides an ample supply of corn to meet and exceed the name-plate production capacity of the plant. Iowa’s calendar year 2004 final corn for grain production was estimated in January 2005 at 2.24 billion bushels. The 2004 corn crop was the largest corn crop on record with national production at approximately 11.8 billion bushels and Iowa production at approximately 2.4 billion bushels. The 2005 national corn crop is projected to be the second largest on record exceeded only the 2004 crop which is the largest ever recorded.
8
We have obtained a grain dealers license and have established our own grain sourcing staff to acquire the corn we need. We have also identified a number of grain dealers as potential sources of grain in northwestern Iowa for additional corn delivery. The grain required for operation of the ethanol plant is readily available through our own grain sourcing staff, which purchases the corn directly from local producers or from secondary markets. During the fiscal year ending September 30, 2005, we purchased approximately $4,416,000 in corn from some of the Company’s members who are local grain producers.
Natural Gas
Natural gas is also an important input to our manufacturing process. We estimate that our natural gas usage is approximately 110,000 million British thermal units (“MMBTU”) per month. We use natural gas to dry our distillers grains products to moisture contents at which they can be stored for long periods and transported greater distances, so that we can market them to broader livestock markets, including poultry and swine markets in the continental United States. We contract with various natural gas vendors to supply the natural gas necessary to operate the plant. U.S. Energy Services, Inc. assists us with sourcing natural gas through various vendors. We determined that sourcing our natural gas from a variety of vendors may prove more cost-efficient than using an exclusive supplier.
Federal Ethanol Supports
The ethanol industry is heavily dependent on several economic incentives to produce ethanol, including federal ethanol supports. The most recent ethanol supports are contained in the Energy Policy Act of 2005. Most notably, the Act creates a 7.5 billion gallon Renewable Fuels Standard (RFS). The RFS requires refiners to use 4 billion gallons of renewable fuels in 2006, increasing to 7.5 billion gallons by 2012.
Historically, ethanol sales have also been favorably affected by the Clean Air Act amendments of 1990, particularly the Federal Oxygen Program which became effective November 1, 1992. The Federal Oxygen Program requires the sale of oxygenated motor fuels during the winter months in certain major metropolitan areas to reduce carbon monoxide pollution. Ethanol use has increased due to a second Clean Air Act program, the Reformulated Gasoline Program. This program became effective January 1, 1995, and requires the sale of reformulated gasoline in nine major urban areas to reduce pollutants, including those that contribute to ground level ozone, better known as smog. The two major oxygenates added to reformulated gasoline pursuant to these programs are MTBE and ethanol, however MTBE has caused groundwater contamination and has been banned from use by many states. Although the Energy Policy Act of 2005 did not impose a national ban of MTBE, its failure to include liability protection for manufacturers of MTBE is expected to result in refiners and blenders using ethanol as an oxygenate rather than MTBE to satisfy the reformulated gasoline oxygenate requirement. While this may create increased demand in the short-term, we do not expect this to have a long term impact on the demand for ethanol as the Act repeals the Clean Air Act’s 2% oxygenate requirement for reformulated gasoline immediately in California and 270 days after enactment elsewhere. However, the Act did not repeal the 2.7% oxygenate requirement for carbon monoxide non-attainment areas which are required to use oxygenated fuels in the winter months. While we expect ethanol to be the oxygenate of choice in these areas, there is no assurance that ethanol will in fact be used.
The use of ethanol as an alternative fuel source has been aided by federal tax policy. On October 22, 2004, President Bush signed H.R. 4520, which contained the Volumetric Ethanol Excise Tax Credit (“VEETC”) and amended the federal excise tax structure effective as of January 1, 2005. Prior to VEETC, ethanol-blended fuel was taxed at a lower rate than regular gasoline (13.2 cents on a 10% blend). Under VEETC, the ethanol excise tax exemption has been eliminated, thereby allowing the full federal excise tax of 18.4 cents per gallon of gasoline to be collected on all gasoline and allocated to the highway trust fund. This is expected to add approximately $1.4 billion to the highway trust fund revenue annually. In place of the exemption, the bill creates a new volumetric ethanol excise tax credit of 5.1 cents per gallon of ethanol blended at 10%. Refiners and gasoline blenders apply for this credit on the same tax form as before only it is a credit from general revenue, not the highway trust fund. Based on volume, the VEETC is expected to allow much greater refinery flexibility in blending ethanol since it makes the tax credit available on all ethanol blended with all gasoline, diesel and ethyl tertiary butyl ether (“ETBE”), including ethanol in E-85 and the E-20 in Minnesota. The VEETC is scheduled to expire on December 31, 2010.
The Energy Policy Act of 2005 expands who qualifies for the small ethanol producer tax credit. Historically, small ethanol producers were allowed a 10-cents-per-gallon production income tax credit on up to 15
9
million gallons of production annually. The size of the plant eligible for the tax credit was limited to 30 million gallons. Under the Energy Policy Act of 2005 the size limitation on the production capacity for small ethanol producers increases from 30 million to 60 million gallons. The credit can be taken on the first 15 million gallons of production. The tax credit is capped at $1.5 million per year per producer. The credit is effective for taxable years ending after the date of enactment.
In addition, the Energy Policy Act of 2005 creates a new tax credit that permits taxpayers to claim a 30% credit (up to $30,000) for the cost of installing clean-fuel vehicle refueling equipment, such as an E85 fuel pump, to be used in a trade or business of the taxpayer or installed at the principal residence of the taxpayer. Under the provision, clean fuels are any fuel of at least 85% of the volume of which consists of ethanol, natural gas, compressed natural gas, liquefied natural gas, liquefied petroleum gas, and hydrogen and any mixture of diesel fuel and biodiesel containing at least 20% biodiesel. The provision is effective for equipment placed in service December 31, 2005 and before January 1, 2010. While it is unclear how this credit will affect the demand for ethanol in the short term, we expect it will help raise consumer awareness of alternative sources of fuel and could positively impact future demand for ethanol.
Additionally, Congress provides an ethanol production incentive to ethanol producers through the United States Department of Agriculture Commodity Credit Corporation’s Bioenergy Program. Under the program, incentive payments are allocated to ethanol producers based primarily on an increase in gallons of ethanol produced compared to the prior year’s production. These payments are based upon increases in ethanol production relative to previous years. Since we increased our production capacity through our plant expansion from 40 to 52 million gallons per year, we will be eligible to receive additional Bioenergy Program payments. However, due to the size of the expansion, any program payments we receive in the future will be significantly less than our original payments. The receipt of these additional program payments is subject to the continued availability of program funds, which may be reduced as a result of increased participation in the program by new and expanding plants as well as decreased federal funding. The Bioenergy Program is scheduled to expire at the end of the federal government’s 2006 fiscal year.
The ethanol industry and our business depend upon continuation of the federal ethanol supports discussed above. These incentives have supported a market for ethanol that might disappear without the incentives. Alternatively, the incentives may be continued at lower levels than at which they currently exist. The elimination or reduction of such federal ethanol supports would make it more costly for us to sell our ethanol and would likely reduce our net income.
Our Competition
We will be in direct competition with numerous other ethanol producers, many of whom have greater resources than we do. We also expect that additional ethanol producers will enter the market if the demand for ethanol continues to increase. Ethanol is a commodity product, like corn, which means our ethanol plant competes with other ethanol producers on the basis of price and, to a lesser extent, delivery service. We believe we compete favorably with other ethanol producers due to our proximity to ample grain supplies and multiple modes of transportation. In addition, we believe our plant’s location offers an advantage over other ethanol producers in that it has ready access by rail to growing ethanol markets, which reduces our cost of sales.
The ethanol industry has grown to over 90 production facilities in the United States. There are also numerous other producer and privately owned ethanol plants planned and operating throughout the Midwest and elsewhere in the United States. The largest ethanol producers include Abengoa Bioenergy Corp., ADM, Aventine Renewable Energy, Inc., Cargill, Inc., New Energy Corp. and VeraSun Energy Corporation, all of which are each capable of producing more ethanol than we expect to produce. ADM, one of our limited partners and our sole ethanol marketer, recently announced its plan to add approximately 500 million gallons per year of additional ethanol production capacity in the United States. ADM is currently the largest ethanol producer in the U.S. and controls a significant portion of the ethanol market. ADM’s plan to produce an additional 500 million gallons of ethanol per year will strengthen its position in the ethanol industry and cause a significant increase in domestic ethanol supply.
10
Excluding our facility, Iowa currently has 27 ethanol plants in various stages of development or operation. Plants near Galva and Sioux Center produce or will produce approximately 26 million gallons per year per facility. A plant near Steamboat Rock produces 20 million gallons per year per year. A Plant near Fort Dodge produces 100 million gallons per year and plants near Fairbank and Albert City will each produce 100 million gallons per year when they become operational. Plants near Lakota and Iowa Falls currently produce approximately 50 million gallons per year and have begun construction on a 50 million gallon expansion for total capacity of 100 million gallons per year each. The remaining plants will produce or are producing approximately 50 million gallons per year. Total annual ethanol production capacity in Iowa currently exceeds 1 billion gallons. In addition, a nearby plant in Hudson, South Dakota, produces approximately 45 million gallons per year and a 40 million gallons per year plant is being developed near South Sioux City, Nebraska. If organizational efforts are successful, this plant would add an additional 40 million gallons per year of production in close proximity to our facility.
The following table identifies most of the ethanol producers in the United States along with their production capacities.
U.S. FUEL ETHANOL PRODUCTION CAPACITY
million gallons per year (mmgy)
Company | | Location | | Feedstock | | Current Capacity | | Under Construction/
Expansions | |
| | | | | | (mmgy) | | (mmgy) | |
Abingdon Bioenergy Corp. | | York, NE | | Corn/milo | | 55 | | | |
| | Colwich, KS | | | | 25 | | | |
| | Portales, NM | | | | 30 | | | |
| | Ravenna, NE | | | | | | 88 | |
ACE Ethanol, LLC | | Stanley, WI | | Corn | | 39 | | | |
Adkins Energy, LLC* | | Lena, IL | | Corn | | 40 | | | |
Advanced Bioenergy | | Fairmont, NE | | Corn | | | | 100 | |
AGP* | | Hastings, NE | | Corn | | 52 | | | |
Agra Resources Coop. d.b.a. EXOL* | | Albert Lea, MN | �� | Corn | | 40 | | 8 | |
Agri-Energy, LLC* | | Luverne, MN | | Corn | | 21 | | | |
Alchem Ltd. LLLP | | Grafton, ND | | Corn | | 10.5 | | | |
Al-Corn Clean Fuel* | | Claremont, MN | | Corn | | 35 | | | |
Amaizing Energy, LLC* | | Denison, IA | | Corn | | 40 | | | |
Archer Daniels Midland | | Decatur, IL | | Corn | | 1,070 | | | |
| | Cedar Rapids, IA | | Corn | | | | | |
| | Clinton, IA | | Corn | | | | | |
| | Columbus, NE | | Corn | | | | | |
| | Marshall, MN | | Corn | | | | | |
| | Peoria, IL | | Corn | | | | | |
| | Wallhalla, ND | | Corn/barley | | | | | |
Aventine Renewable Energy, LLC | | Pekin, IL | | Corn | | 100 | | 57 | |
| | Aurora, NE | | Corn | | 50 | | | |
Badger State Ethanol, LLC* | | Monroe, WI | | Corn | | 48 | | | |
Big River Resources, LLC* | | West Burlington, IA | | Corn | | 40 | | | |
11
Broin Enterprises, Inc. | | Scotland, SD | | Corn | | 9 | | | |
Bushmills Ethanol, Inc.* | | Atwater, MN | | Corn | | | | 40 | |
Cargill, Inc. | | Blair, NE | | Corn | | 85 | | | |
| | Eddyville, IA | | Corn | | 35 | | | |
Central Indiana Ethanol, LLC | | Marion, IN | | Corn | | | | 40 | |
Central MN Ethanol Coop* | | Little Falls, MN | | Corn | | 21.5 | | | |
Central Wisconsin Alcohol | | Plover, WI | | Seed corn | | 4 | | | |
Chief Ethanol | | Hastings, NE | | Corn | | 62 | | | |
Chippewa Valley Ethanol Co.* | | Benson, MN | | Corn | | 45 | | | |
Commonwealth Agri-Energy, LLC* | | Hopkinsville, KY | | Corn | | 24 | | 9 | |
Corn, LP* | | Goldfield, IA | | Corn | | | | 50 | |
Cornhusker Energy Lexington, LLC | | Lexington, NE | | Corn | | | | 40 | |
Corn Plus, LLP* | | Winnebago, MN | | Corn | | 44 | | | |
Dakota Ethanol, LLC* | | Wentworth, SD | | Corn | | 50 | | | |
DENCO, LLC* | | Morris, MN | | Corn | | 21.5 | | | |
E3 Biofuels | | Mead, NE | | Corn | | | | 24 | |
East Kansas Agri-Energy, LLC* | | Garnett, KS | | Corn | | 35 | | | |
ESE Alcohol Inc. | | Leoti, KS | | Seed corn | | 1.5 | | | |
Ethanol2000, LLP* | | Bingham Lake, MN | | Corn | | 32 | | | |
Frontier Ethanol, LLC | | Gowrie, IA | | Corn | | | | 60 | |
Front Range Energy, LLC | | Windsor, CO | | Corn | | | | 40 | |
Glacial Lakes Energy, LLC* | | Watertown, SD | | Corn | | 50 | | | |
Golden Cheese Company of California* | | Corona, CA | | Cheese whey | | 5 | | | |
Golden Grain Energy, LLC* | | Mason City, IA | | Corn | | 40 | | | |
Golden Triangle Energy, LLC* | | Craig, MO | | Corn | | 20 | | | |
Grain Processing Corp. | | Muscatine, IA | | Corn | | 20 | | | |
Granite Falls Energy, LLC | | Granite Falls, MN | | Corn | | 45 | | | |
Great Plains Ethanol, LLC* | | Chancellor, SD | | Corn | | 50 | | | |
Green Plains Renewable Energy | | Shenandoah, IA | | Corn | | | | 50 | |
Hawkeye Renewables, LLC | | Iowa Falls, IA | | Corn | | 50 | | 50 | |
| | Fairbank, IA | | Corn | | | | 100 | |
Heartland Corn Products* | | Winthrop, MN | | Corn | | 36 | | | |
Heartland Grain Fuels, LP* | | Aberdeen, SD | | Corn | | 9 | | | |
| | Huron, SD | | Corn | | 12 | | 18 | |
Heron Lake BioEnergy, LLC | | Heron Lake, MN | | Corn | | | | 50 | |
Horizon Ethanol, LLC | | Jewell, IA | | Corn | | | | 60 | |
Husker Ag, LLC* | | Plainview, NE | | Corn | | 26.5 | | | |
Illinois River Energy, LLC | | Rochelle, IL | | Corn | | | | 50 | |
Iowa Ethanol, LLC* | | Hanlontown, IA | | Corn | | 50 | | | |
Iroquois Bio-Energy Company, LLC | | Rensselaer, IN | | Corn | | | | 40 | |
James Valley Ethanol, LLC | | Groton, SD | | Corn | | 50 | | | |
12
KAAPA Ethanol, LLC* | | Minden, NE | | Corn | | 40 | | | |
Land O’ Lakes* | | Melrose, MN | | Cheese whey | | 2.6 | | | |
Lincolnland Agri-Energy, LLC* | | Palestine, IL | | Corn | | 48 | | | |
Lincolnway Energy, LLC* | | Nevada, IA | | Corn | | | | 50 | |
Liquid Resources of Ohio | | Medina, OH | | Waste Beverage | | 3 | | | |
Little Sioux Corn Processors, LP* | | Marcus, IA | | Corn | | 52 | | | |
Merrick/Coors | | Golden, CO | | Waste beer | | 1.5 | | 1.5 | |
MGP Ingredients, Inc. | | Pekin, IL | | Corn/wheat starch | | 78 | | | |
| | Atchison, KS | | | | | | | |
Michigan Ethanol, LLC | | Caro, MI | | Corn | | 50 | | | |
Mid-Missouri Energy, Inc.* | | Malta Bend, MO | | Corn | | 45 | | | |
Midwest Grain Processors* | | Lakota, IA | | Corn | | 50 | | 45 | |
| | Riga, MI | | Corn | | | | 57 | |
Midwest Renewable Energy, LLC | | Sutherland, NE | | Corn | | 17.5 | | 4.5 | |
Minnesota Energy* | | Buffalo Lake, MN | | Corn | | 18 | | | |
Missouri Ethanol | | Laddonia, MO | | Corn | | | | 45 | |
New Energy Corp. | | South Bend, IN | | Corn | | 102 | | | |
North Country Ethanol, LLC* | | Rosholt, SD | | Corn | | 20 | | | |
Northeast Missouri Grain, LLC* | | Macon, MO | | Corn | | 45 | | | |
Northern Lights Ethanol, LLC* | | Big Stone City, SD | | Corn | | 50 | | | |
Northstar Ethanol, LLC | | Lake Crystal, MN | | Corn | | 52 | | | |
Otter Creek Ethanol, LLC* | | Ashton, IA | | Corn | | 55 | | | |
Panhandle Energies of Dumas, LP | | Dumas, TX | | Corn/Grain Sorghum | | | | 30 | |
Parallel Products | | Louisville, KY | | Beverage waste | | 5.4 | | | |
| | R. Cucamonga, CA | | | | | | | |
Permeate Refining | | Hopkinton, IA | | Sugars & starches | | 1.5 | | | |
Phoenix Biofuels | | Goshen, CA | | Corn | | 25 | | | |
Pine Lake Corn Processors, LLC* | | Steamboat Rock, IA | | Corn | | 20 | | | |
Platte Valley Fuel Ethanol, LLC | | Central City, NE | | Corn | | 40 | | | |
Prairie Ethanol, LLC | | Loomis, SD | | Corn | | | | 60 | |
Prairie Horizon Agri-Energy, LLC | | Phillipsburg, KS | | Corn | | | | 40 | |
Pro-Corn, LLC* | | Preston, MN | | Corn | | 42 | | | |
Quad-County Corn Processors* | | Galva, IA | | Corn | | 27 | | | |
Red Trail Energy, LLC | | Richardton, ND | | Corn | | | | 50 | |
Redfield Energy, LLC | | Redfield, SD | | Corn | | | | 50 | |
Reeve Agri-Energy | | Garden City, KS | | Corn/milo | | 12 | | | |
Siouxland Energy & Livestock Coop* | | Sioux Center, IA | | Corn | | 25 | | | |
13
Siouxland Ethanol, LLC | | Jackson, NE | | Corn | | | | 50 | |
Sioux River Ethanol, LLC* | | Hudson, SD | | Corn | | 55 | | | |
Sterling Ethanol, LLC | | Sterling, CO | | Corn | | 42 | | | |
Tall Corn Ethanol, LLC* | | Coon Rapids, IA | | Corn | | 49 | | | |
Tate & Lyle | | Loudon, TN | | Corn | | 67 | | | |
The Andersons Albion Ethanol LLC | | Albion, MI | | Corn | | | | 55 | |
Trenton Agri Products, LLC | | Trenton, NE | | Corn | | 35 | | 10 | |
United WI Grain Producers, LLC* | | Friesland, WI | | Corn | | 49 | | | |
US BioEnergy Corp. | | Albert City, IA | | Corn | | | | 100 | |
| | Lake Odessa, MI | | Corn | | | | 45 | |
U.S. Energy Partners, LLC | | Russell, KS | | Milo/wheat starch | | 48 | | | |
Utica Energy, LLC | | Oshkosh, WI | | Corn | | 48 | | | |
Val-E Ethanol, LLC | | Ord, NE | | Corn | | | | 45 | |
VeraSun Energy Corporation | | Aurora, SD | | Corn | | 230 | | | |
| | Ft. Dodge, IA | | Corn | | | | | |
Voyager Ethanol, LLC* | | Emmetsburg, IA | | Corn | | 52 | | | |
Western Plains Energy, LLC* | | Campus, KS | | Corn | | 45 | | | |
Western Wisconsin Renewable Energy, LLC* | | Boyceville, WI | | Corn | | | | 40 | |
Wind Gap Farms | | Baconton, GA | | Brewery waste | | 0.4 | | | |
Wyoming Ethanol | | Torrington, WY | | Corn | | 5 | | | |
Xethanol BioFuels, LLC | | Blairstown, IA | | Corn | | 5 | | | |
Total Current Capacity | | | | | | 4286.4 | | | |
Total Under Construction/Expansions | | | | | | | | 1752 | |
Total Capacity | | | | | | 6038.4 | | | |
* farmer-owned | | | | Source: Renewable Fuels Association
Last Updated: December 2005 |
Competition from Alternative Fuels
Our ethanol plant also competes with producers of other gasoline additives having similar octane and oxygenate values as ethanol, such as producers of MTBE, a petrochemical derived from methanol that costs less to produce than ethanol. Although currently the subject of several state bans, many major oil companies can produce MTBE and because it is petroleum-based, its use is strongly supported by major oil companies.
Alternative fuels, gasoline oxygenates and alternative ethanol production methods are also continually under development by ethanol and oil companies with far greater resources. The major oil companies have significantly greater resources than we have to develop alternative products and to influence legislation and public perception of MTBE and ethanol. New ethanol products or methods of ethanol production developed by larger and better-financed competitors could provide them competitive advantages and harm our business.
Distillers Grains Competition
Our plant primarily competes with other ethanol producers in the production and sales of distillers grains. According to the University of Minnesota’s DDGS—General Information website (November 28, 2005)
14
approximately 3,200,000 to 3,500,000 tons of distillers grains are produced annually in North America, approximately 98% of which are produced by ethanol plants. The remaining 1 to 2% of DDGS is produced by the alcohol beverage industry. Ethanol plants in South Dakota and Minnesota produce about 25% of this amount. The amount of distillers grains produced is expected to increase significantly as the number of ethanol plants increase. In addition, our distillers grains compete with other livestock feed products such as soybean meal, corn gluten feed, dry brewers grain and mill feeds.
General Ethanol Demand and Supply
Ethanol has important applications, primarily as a high-quality octane enhancer and an oxygenate capable of reducing air pollution and improving automobile performance. Ethanol contains 35% oxygen by weight. When combined with gasoline, ethanol acts as an oxygenate. As a result, the gasoline burns cleaner, and releases less carbon monoxide and other exhaust emissions into the atmosphere.
According to the Renewable Fuels Association, demand for fuel ethanol in the United States reached a new high in 2004 of 3.57 billion gallons per year. In its report titled, “Ethanol Industry Outlook 2005,” the Renewable Fuels Association anticipates demand for ethanol to remain strong. The passage of the Volumetric Ethanol Excise Tax Credit (“VEETC”), is expected to provide the flexibility necessary to expand ethanol blending into higher blends of ethanol such as E85, E diesel and fuel cell markets. In addition, the recent implementation of a Renewable Fuels Standard contained in the Energy Policy Act of 2005, which was signed into law on August 8, 2005 is expected to favorably impact the ethanol industry by enhancing both the production and use of ethanol.
The provision of the Energy Policy Act of 2005 likely to have the greatest impact on the ethanol industry is the creation of a 7.5 billion gallon Renewable Fuels Standard (RFS). The RFS will begin at 4 billion gallons in 2006, increasing to 7.5 billion gallons by 2012. The RFS is a national flexible program that does not require that any renewable fuels be used in any particular area or state, allowing refiners to use renewable fuel blends in those areas where it is most cost-effective. According to the Renewable Fuels Association, the bill is expected to lead to about $6 billion in new investment in ethanol plants across the country. An increase in the number of new plants will bring an increase in the supply of ethanol. Thus, while this bill may cause ethanol prices to increase in the short term due to additional demand, future supply could outweigh the demand for ethanol in the future. This would have a negative impact on our earnings. Alternatively, since the RFS begins at 4 billion gallons in 2006 and national production is expected to exceed this amount, there could be a short-term oversupply until the RFS requirements exceed national production. This would have an immediate adverse effect on our earnings.
In addition, demand for ethanol may also increase as a result of increased consumption of E85 fuel. E85 fuel is a blend of 70% to 85% ethanol and gasoline. According to the Energy Information Administration, E85 consumption is projected to increase from a national total of 11 million gallons in 2003 to 47 million gallons in 2025. E85 is used as an aviation fuel and as a hydrogen source for fuel cells. According to the National Ethanol Vehicle Coalition, there are currently about 4.5 million flexible fuel vehicles capable of operating on E85 in the U.S. and 400 retail stations supplying it. Automakers have indicated plans to produce an estimated 2 million more flexible fuel vehicles per year.
The supply of domestically produced ethanol is at an all-time high. In 2004, 81 ethanol plants located in 20 states produce a record 3.41 billion gallons, a 21% increase from 2003 and 109% increase from 2000. At the end of 2004, 16 plants and 2 major expansions were under construction, representing an additional 750 million gallons of production capacity. The following table shows 2005 U.S. ethanol production capacity by state as of December 2005:
15
Ethanol Production Capacity Ranked by State
(Largest to Smallest Production Capacity as of December 2005)
Rank | | State | | Ethanol Production Capacity | |
| | | | (Million Gallons Per Year) | |
| | | | | |
1 | | Iowa | | 1,699.5 | |
2 | | Illinois | | 881.0 | |
3 | | Nebraska | | 771.5 | |
4 | | South Dakota | | 603.0 | |
5 | | Minnesota | | 593.6 | |
6 | | Wisconsin | | 228.0 | |
7 | | Kansas | | 212.5 | |
8 | | Michigan | | 207.0 | |
9 | | Indiana | | 182.0 | |
10 | | Missouri | | 155.0 | |
11 | | Colorado | | 85.0 | |
11 | | North Dakota | | 83.5 | |
12 | | Tennessee | | 67.0 | |
13 | | Kentucky | | 35.4 | |
14 | | California | | 33.0 | |
15 | | New Mexico | | 30.0 | |
15 | | Texas | | 30.0 | |
16 | | Wyoming | | 5.0 | |
17 | | Ohio | | 3.0 | |
18 | | Georgia | | 0.4 | |
| | United States Total | | 5,905.4 | |
Sources: Renewable Fuels Association, Washington, DC.
Nebraska Energy Office, Lincoln, NE
Ethanol supply is also affected by ethanol produced or processed in certain countries in Central America and the Caribbean region. Ethanol produced in these countries is eligible for tariff reduction or elimination upon importation to the United States under a program known as the Caribbean Basin Initiative (“CBI”). Large ethanol producers, such as Cargill, have expressed interest in building dehydration plants in participating Caribbean Basin countries, such as El Salvador, which would convert ethanol into fuel-grade ethanol for shipment to the United States. Ethanol imported from Caribbean Basin countries may be a less expensive alternative to domestically produced ethanol. The International Trade Commission recently announced the 2005 CBI import quota of 240.4 million gallons of ethanol. Last year, legislation was introduced in the Senate that would limit the transshipment of ethanol through the CBI. No similar legislation has been introduced this year, however, there is no assurance or guarantee that such legislation will be introduced or that it will be successfully passed during 2006.
Research and Development
We do not conduct any research and development activities associated with the development of new technologies for use in producing ethanol and distillers grains.
Dependence on One or a Few Major Customers
As discussed above, we have entered into marketing agreements with ADM and CSC for the purposes of marketing and distributing our principal products, ethanol and distillers grains, respectively. We rely on ADM and CSC for the sale and distribution of almost all of our products, except for those distillers grains that we market locally. Therefore, we are highly dependent on ADM and CSC for the successful marketing of our products. As a large ethanol producer, ADM is also a source of competition. Any loss of ADM or CSC as our marketing agent for our ethanol and distillers grains could have a significant negative impact on our revenues.
16
Costs and Effects of Compliance with Environmental Laws
We are subject to extensive air, water and other environmental regulations and we have been required to obtain a number of environmental permits to construct and operate the plant. We have obtained all of the necessary permits to operate the plant including, air pollution construction permits, a pollutant discharge elimination system general permit, storm water discharge permits, a water withdrawal permit, and an alcohol fuel producer’s permit. In addition, we have completed a spill prevention control and countermeasures plan. Although we have been successful in obtaining all of the permits currently required, any retroactive change in environmental regulations, either at the federal or state level, could require us to obtain additional or new permits or spend considerable resources on complying with such regulations.
We are subject to ongoing environmental regulations and testing. The plant passed emissions testing in December 2003 and we received renewed operating permits in April 2004. The operating permits allow us to operate in excess of 40 million gallons per year. Subsequent to installation of the regenerative thermal oxidizer, we retested critical emissions points in November 2004 to further enhance our ability to operate at peak efficiencies. We are pleased with the results of these tests, and final permitting was granted by the regulatory agency in November 2005. Our capacity to operate at lower temperatures while maintaining compliance is expected to increase efficiency and may reduce costs of operations. We are required by federal regulations to conduct a Relative Accuracy Test Audit (RATA) once per 12-month period. We passed the RATA testing in February 2005. By installing hard surfacing on the plant road, we expect to reduce our dust emissions, which should aid our continued compliance with environmental standards.
On August 9, 2005, the Board of Directors approved plans to proceed with a 40 million gallon per year expansion to our plant. However, before we can begin expansion of our plant, we must obtain numerous regulatory approvals and permits. While we anticipate receiving these approvals and permits, there is no assurance that these requirements can be satisfied in a timely manner or at all. In addition, as a condition of receiving the permits and approvals, we may be required to make significant capital expenditures to install additional pollution control equipment, which could have a material adverse effect on our results of operations and financial condition.
We are subject to oversight activities by the EPA. There is always a risk that the EPA may enforce certain rules and regulations differently than Iowa’s environmental administrators. Iowa or EPA rules are subject to change, and any such changes could result in greater regulatory burdens on plant operations. We could also be subject to environmental or nuisance claims from adjacent property owners or residents in the area arising from possible foul smells or other air or water discharges from the plant. Such claims may result in an adverse result in court if we are deemed to engage in a nuisance that substantially impairs the fair use and enjoyment of real estate.
The government’s regulation of the environment changes constantly. It is possible that more stringent federal or state environmental rules or regulations could be adopted, which could increase our operating costs and expenses. It also is possible that federal or state environmental rules or regulations could be adopted that could have an adverse effect on the use of ethanol. For example, changes in the environmental regulations regarding the required oxygen content of automobile emissions could have an adverse effect on the ethanol industry. Furthermore, plant operations likely will be governed by the Occupational Safety and Health Administration (“OSHA”). OSHA regulations may change such that the costs of the operation of the plant may increase. Any of these regulatory factors may result in higher costs or other materially adverse conditions effecting our operations, cash flows and financial performance.
Employees
As of September 30, 2005, we had a total of 36 full-time employees. We have 29 full-time employees in ethanol production operations and 7 full-time employees in general management and administration. At the current plant size of 52 MGY, we do not expect to hire a significant number of employees in the next 12 months. However, significant expansion of the plant may require us to hire several new employees.
17
ITEM 1A. RISK FACTORS.
You should carefully read and consider the risks and uncertainties below and the other information contained in this report. The risks and uncertainties described below are not the only ones we may face. The following risks, together with additional risks and uncertainties not currently known to us or that we currently deem immaterial could impair our financial condition and results of operation.
Risks Relating to Our Business
We have a limited operating history and our business may not be as successful as we anticipate. We began our business in 2000 and commenced production of ethanol at our plant in April 2003. Accordingly, we have a limited operating history from which you can evaluate our business and prospects. Our operating results could fluctuate significantly in the future as a result of a variety of factors, including those discussed through out these risk factors. Many of these factors are outside our control. As a result of these factors, our operating results may not be indicative of future operating results and you should not rely on them as indications of our future performance. In addition, our prospects must be considered in light of the risks and uncertainties encountered by an early-stage company and in rapidly growing industries, such as the ethanol industry, where supply and demand may change substantially in a short amount of time.
Our business is not diversified. Our success depends largely upon our ability to profitably operate our ethanol plant. We do not have any other lines of business or other sources of revenue if we are unable to operate our ethanol plant and manufacture ethanol, distillers grains and corn oil. If economic or political factors adversely affect the market for ethanol, the Company has no other line of business to fall back on if the ethanol business declines. Our business would also be significantly harmed if its ethanol plant could not operate at full capacity for any extended period of time.
Our financial performance is significantly dependent on corn and natural gas prices and generally we cannot pass on increases in input prices to our customers. Our results of operations and financial condition are significantly affected by the cost and supply of corn and natural gas. Changes in the price and supply of corn and natural gas are subject to and determined by market forces over which we have no control
Ethanol production requires substantial amounts of corn. Corn, as with most other crops, is affected by weather, disease and other environmental conditions. The price of corn is also influenced by general economic, market and government factors. These factors include weather conditions, farmer planting decisions, domestic and foreign government farm programs and policies, global demand and supply and quality. Changes in the price of corn can significantly affect our business. Generally, higher corn prices will produce lower profit margins and, therefore, represent unfavorable market conditions. This is especially true if market conditions do not allow us to pass along increased corn costs to our customers. The price of corn has fluctuated significantly in the past and may fluctuate significantly in the future. If a period of high corn prices were to be sustained for some time, such pricing may reduce our ability to generate revenues because of the higher cost of operating and may make ethanol uneconomical to use in fuel markets. We cannot offer any assurance that we will be able to offset any increase in the price of corn by increasing the price of our products. If we cannot offset increases in the price of corn, our financial performance may be materially and adversely affected.
Natural gas has recently been available only at prices exceeding historical averages. These prices are increasing our costs of production. The prices for and availability of natural gas are subject to volatile market conditions. These market conditions often are affected by factors beyond our control such as higher prices as a result of colder than average weather conditions, overall economic conditions and foreign and domestic governmental regulations and relations. Significant disruptions in the supply of natural gas could impair our ability to manufacture ethanol for our customers. Furthermore, increases in natural gas prices or changes in our natural gas costs relative to natural gas costs paid by competitors may adversely affect our results of operations and financial condition.
We seek to minimize the risks from fluctuations in the prices of corn and natural gas through the use of hedging instruments. However, these hedging transactions also involve risks to our business. See “Risks Relating to Our Business - We engage in hedging transaction which involve risks that can harm our business.”
18
The spread between ethanol and corn prices can vary significantly and we do not expect the spread to remain at recent high levels. Corn costs significantly impact our cost of goods sold. Our gross margins are principally dependent upon the spread between ethanol and corn prices. Recently, the spread between ethanol and corn prices has been at historically high level, due in large part to high oil prices and low corn prices. However, this spread has fluctuated significantly in 2005 and may fluctuate significantly in the future. Any reduction in the spread between ethanol and corn prices, whether as a result of an increase in corn prices or a reduction in ethanol prices, would adversely affect our results of operations and financial condition
Our revenues will be greatly affected by the price at which we can sell our ethanol and distillers grains. These prices can be volatile as a result of a number of factors. These factors include the overall supply and demand, the price of gasoline, level of government support, and the availability and price of competing products. For instance, the price of ethanol tends to increase as the price of gasoline increases, and the price of ethanol tends to decrease as the price of gasoline decreases. Any lowering of gasoline prices will likely also lead to lower prices for ethanol, which may decrease our ethanol sales and reduce revenues.
The price of ethanol has recently been much higher than its 10-year average. We do not expect these prices to be sustainable as supply from new and existing ethanol plants increases to meet increased demand. Increased production of ethanol may lead to lower prices. The increased production of ethanol could have other adverse effects. For example, the increased production could lead to increased supplies of co-products from the production of ethanol, such as distillers grains. Those increased supplies could outpace demand, which would lead to lower prices for those by-products. Also, the increased production of ethanol could result in increased demand for corn. This could result in higher prices for corn and corn production creating lower profits. There can be no assurance as to the price of ethanol or distillers grains in the future. Any downward changes in the price of ethanol and/or distillers grains may result in less income which would decrease our revenues and profitability.
We sell all of the ethanol we produce to ADM in accordance with an ethanol marketing agreement. ADM, a significant competitor of ours, is the sole buyer of all of our ethanol and we rely heavily on its marketing efforts to successfully sell our product. Because ADM sells ethanol for itself and a number of other producers, we have limited control over its sales efforts. Our financial performance is dependent upon the financial health of ADM, as a significant portion of our accounts receivable are attributable to ADM. If ADM breaches the ethanol marketing agreement or is not in the financial position to purchase all of the ethanol we produce, we could experience a material loss and we may not have any readily available means to sell our ethanol and our financial performance will be adversely and materially affected. If our agreement with ADM terminates, we may seek other arrangements to sell our ethanol, including selling our own product, but we give no assurance that our sales efforts would achieve results comparable to those achieved by ADM.
We engage in hedging transactions which involve risks that can harm our business. We are exposed to market risk from changes in commodity prices. Exposure to commodity price risk results from our dependence on corn and natural gas in the ethanol production process. We seek to minimize the risks from fluctuations in the prices of corn and natural gas through the use of hedging instruments. The effectiveness of our hedging strategies is dependent upon, the cost of corn and natural gas and our ability to sell sufficient products to use all of the corn and natural gas for which we have futures contracts. There is no assurance that our hedging activities will successfully reduce the risk caused by price fluctuation which may leave us vulnerable to high corn and natural prices. Alternatively, we may choose not to engage in hedging transactions in the future. As a result, our results of operations and financial conditions may also be adversely affected during periods in which corn and/or natural gas prices increase.
Hedging activities themselves can result in costs because price movements in corn and natural gas contracts are highly volatile and are influenced by many factors that are beyond our control. There are several variables that could affect the extent to which our derivative instruments are impacted by price fluctuations in the cost of corn or natural gas. However, it is likely that commodity cash prices will have the greatest impact on the derivatives instruments with delivery dates nearest the current cash price. We may incur such costs and they may be significant.
Changes and advances in ethanol production technology could require us to incur costs to update our plant or could otherwise hinder our ability to compete in the ethanol industry or operate profitably. Advances and changes in the technology of ethanol production are expected to occur. Such advances and changes may make the ethanol production technology installed in our plant less desirable or obsolete. These advances could also allow our competitors to produce ethanol at a lower cost than us. If we are unable to adopt or incorporate technological advances, our ethanol production methods and processes could be less efficient than our competitors, which could cause our plant to become uncompetitive or completely obsolete. If our competitors develop, obtain or license technology that is superior to ours or that makes our technology obsolete, we may be required to incur significant costs to enhance or acquire new technology so that our ethanol production remains competitive. Alternatively, we may be required to seek third-party licenses, which could also result in significant expenditures. We cannot guarantee or assure you that third-party licenses will be available or, once obtained, will continue to be available on commercially reasonable terms, if at all. These costs could negatively impact our financial performance by increasing our operating costs and reducing our net income.
19
Risks Related to Ethanol Industry
New plants under construction or decreases in the demand for ethanol may result in excess production capacity in our industry. The supply of domestically produced ethanol is at an all-time high. In 2004, 81 ethanol plants located in 20 states produce a record 3.41 billion gallons, a 21% increase from 2003 and 109% increase from 2000. At the end of 2004, 16 plants and 2 major expansions were under construction, representing an additional 750 million gallons of production capacity. The ethanol industry has grown to over 90 production facilities in the United States. Excluding our facility, Iowa currently has 27 ethanol plants in various stages of development or operation. Excess capacity in the ethanol industry would have an adverse impact on our results of operations, cash flows and general financial condition. Excess capacity may also result or intensify from increases in production capacity coupled with insufficient demand. If the demand for ethanol does not grow at the same pace as increases in supply, we would expect the price for ethanol to decline. If excess capacity in the ethanol industry occurs, the market price of ethanol may decline to a level that is inadequate to generate sufficient cash flow to cover our costs.
We operate in a competitive industry and compete with larger, better financed entities which could impact our ability to operate profitably. There is significant competition among ethanol producers with numerous producer and privately owned ethanol plants planned and operating throughout the Midwest and elsewhere in the United States. The number of ethanol plants being developed and constructed in the United States continues to increase at a rapid pace. The recent passage of the Energy Policy Act of 2005 included a renewable fuels mandate that we expect will further increase the number of domestic ethanol production facilities. The largest ethanol producers include Abengoa Bioenergy Corp., Archer Daniels Midland, Aventine Renewable Energy, Inc., Cargill, Inc., New Energy Corp. and VeraSun Energy Corporation, all of which are each capable of producing more ethanol than we expect to produce. Archer Daniels Midland, one of our limited partners and our sole ethanol marketer, recently announced its plan to add approximately 500 million gallons per year of additional ethanol production capacity in the United States. ADM is currently the largest ethanol producer in the U.S. and controls a significant portion of the ethanol market. ADM’s plan to produce an additional 500 million gallons of ethanol per year will strengthen its position in the ethanol industry and cause a significant increase in domestic ethanol supply. If the demand for ethanol does not grow at the same pace as increases in supply, we expect that lower prices for ethanol will result which may adversely affect our ability to generate profits and our financial condition.
Our ethanol plant also competes with producers of other gasoline additives made from raw materials other than corn having similar octane and oxygenate values as ethanol, such as producers of methyl tertiary butyl ether (MTBE). MTBE is a petrochemical derived from methanol which generally costs less to produce than ethanol. Many major oil companies produce MTBE and strongly favor its use because it is petroleum-based. Alternative fuels, gasoline oxygenates and alternative ethanol production methods are also continually under development. The major oil companies have significantly greater resources than we have to market MTBE, to develop alternative products, and to influence legislation and public perception of MTBE and ethanol. These companies also have significant resources to begin production of ethanol should they choose to do so.
Competition from the advancement of alternative fuels may lessen the demand for ethanol. Alternative fuels, gasoline oxygenates and ethanol production methods are continually under development. A number of automotive, industrial and power generation manufacturers are developing alternative clean power systems using fuel cells or clean burning gaseous fuels. Like ethanol, the emerging fuel cell industry offers a technological option to address increasing worldwide energy costs, the long-term availability of petroleum reserves and environmental concerns. Fuel cells have emerged as a potential alternative to certain existing power sources because of their higher efficiency, reduced noise and lower emissions. Fuel cell industry participants are currently targeting the
20
transportation, stationary power and portable power markets in order to decrease fuel costs, lessen dependence on crude oil and reduce harmful emissions. If the fuel cell and hydrogen industries continue to expand and gain broad acceptance, and hydrogen becomes readily available to consumers for motor vehicle use, we may not be able to compete effectively. This additional competition could reduce the demand for ethanol, resulting in lower ethanol prices that might adversely affect our results of operations and financial condition.
Corn-based ethanol may compete with cellulose-based ethanol in the future, which could make it more difficult for us to produce ethanol on a cost-effective basis. Most ethanol is currently produced from corn and other raw grains, such as milo or sorghum - especially in the Midwest. The current trend in ethanol production research is to develop an efficient method of producing ethanol from cellulose-based biomass, such as agricultural waste, forest residue, municipal solid waste, and energy crops. This trend is driven by the fact that cellulose-based biomass is generally cheaper than corn, and producing ethanol from cellulose-based biomass would create opportunities to produce ethanol in areas which are unable to grow corn. Although current technology is not sufficiently efficient to be competitive, a recent report by the U.S. Department of Energy entitled “Outlook for Biomass Ethanol Production and Demand” indicates that new conversion technologies may be developed in the future. If an efficient method of producing ethanol from cellulose-based biomass is developed, we may not be able to compete effectively. We do not believe it will be cost-effective to convert the ethanol plant we are proposing into a plant which will use cellulose-based biomass to produce ethanol. If we are unable to produce ethanol as cost-effectively as cellulose-based producers, our ability to generate revenue and financial condition will be negatively impacted.
Competition from ethanol imported from Caribbean basin countries may be a less expensive alternative to our ethanol. Ethanol produced or processed in certain countries in Central America and the Caribbean region is eligible for tariff reduction or elimination upon importation to the United States under a program known as the Caribbean Basin Initiative. Large ethanol producers, such as Cargill, have expressed interest in building dehydration plants in participating Caribbean Basin countries, such as El Salvador, which would convert ethanol into fuel-grade ethanol for shipment to the United States. Ethanol imported from Caribbean Basin countries may be a less expensive alternative to domestically produced ethanol. Competition from ethanol imported from Caribbean Basin countries may affect our ability to sell our ethanol profitably, adversely affect our results of operations and financial condition.
Competition from ethanol imported from Brazil may be a less expensive alternative to our ethanol. Brazil is currently the world’s largest producer and exporter of ethanol. In Brazil, ethanol is produced primarily from sugarcane, which is also used to produce food-grade sugar. Brazil experienced a dramatic increase in ethanol production and trade in 2004, exporting approximately 112 million gallons to the U.S. alone. Ethanol imported from Brazil may be a less expensive alternative to domestically produced ethanol, which is primarily made from corn. Tariffs presently protecting U.S. ethanol producers may be reduced or eliminated. Competition from ethanol imported from Brazil may affect our ability to sell our ethanol profitably and our financial condition.
Consumer resistance to the use of ethanol based on the belief that ethanol is expensive, adds to air pollution, harms engines and takes more energy to produce that it contributes may affect the demand for ethanol. Certain individuals believe that use of ethanol will have a negative impact on gasoline prices at the pump. Many also believe that ethanol adds to air pollution and harms car and truck engines. Still other consumers believe that the process of producing ethanol actually uses more fossil energy, such as oil and natural gas, than the amount of ethanol that is produced. These consumer beliefs could potentially be wide-spread. If consumers choose not to buy ethanol, it would affect the demand for the ethanol we produce which could lower demand for our product and negatively affect our profitability and financial condition.
Risks Related to Regulation and Governmental Action
A change in government policies favorable to ethanol may cause demand for ethanol to decline. Growth and demand for ethanol may be driven primarily by federal and state government policies, such as state laws banning MTBE and the national renewable fuels standard. The continuation of these policies is uncertain, which means that demand for ethanol may decline if these policies change or are discontinued. A decline in the demand for ethanol is likely to cause lower ethanol prices which in turn will negatively affect our results of operations, financial condition and cash flows.
21
Government incentives for ethanol production, including federal tax incentives, may be eliminated in the future, which could hinder our ability to operate at a profit. The ethanol industry and our business are assisted by various federal ethanol tax incentives, including those included in the Energy Policy Act of 2005. The provision of the Energy Policy Act of 2005 likely to have the greatest impact on the ethanol industry is the creation of a 7.5 billion gallon Renewable Fuels Standard (RFS). The RFS will begin at 4 billion gallons in 2006, increasing to 7.5 billion gallons by 2012. The RFS helps support a market for ethanol that might disappear without this incentive. The elimination or reduction of tax incentives to the ethanol industry could reduce the market for ethanol, which could reduce prices and our revenues by making it more costly or difficult for us to produce and sell ethanol. If the federal tax incentives are eliminated or sharply curtailed, we believe that a decreased demand for ethanol will result, which could negatively affect our profitability and financial condition.
Another important provision involves an expansion in the definition of who qualifies as a small ethanol producer. Historically, small ethanol producers were allowed a 10-cents-per-gallon production income tax credit on up to 15 million gallons of production annually. The size of the plant eligible for the tax credit was limited to 30 million gallons. Under the Energy Policy Act of 2005 the size limitation on the production capacity for small ethanol producers increases from 30 million to 60 million gallons. This tax credit may foster additional growth in ethanol plants of a larger size and increase competition in this particular plant size category.
Changes in environmental regulations or violations of the regulations could be expensive and reduce our profitability. We are subject to extensive air, water and other environmental laws and regulations. In addition some of these laws require our plant to operate under a number of environmental permits. These laws, regulations and permits can often require expensive pollution control equipment or operation changes to limit actual or potential impacts to the environment. A violation of these laws and regulations or permit conditions can result in substantial fines, damages, criminal sanctions, permit revocations and/or plant shutdowns. We do not assure you that we have been, are or will be at all times in complete compliance with these laws, regulations or permits or that we have had or have all permits required to operate our business. We do not assure you that we will not be subject to legal actions brought by environmental advocacy groups and other parties for actual or alleged violations of environmental laws or our permits. Additionally, any changes in environmental laws and regulations, both at the federal and state level, could require us to invest or spend considerable resources in order to comply with future environmental regulations. The expense of compliance could be significant enough to reduce our profitability and negatively affect our financial condition.
Risks Related to Expansion of Our Plant
We give no assurances that we will be able to implement our expansion strategy as planned or at all. We are planning to expand our current production capacity (52 million gallons per year) by an additional 40 million gallons annually. The cost of the expansion is expected to be approximately $50,000,000, which will be financed using both a portion of our cash and additional debt to finance the required capital expenditure. The use of cash to finance these expenditures could impact our ability to make future distributions to our members. We do not have contracts or commitments with any bank, lender, governmental entity, underwriter or financial institution for debt financing. If debt financing on acceptable terms is not available for any reason, we may be forced to abandon our expansion plans.
There is no assurance that the expansion will reduce our operating costs or increase our operating income. Our expansion projections are based upon our historical operating costs and historical revenues and there is no guarantee or assurance that our past financial performance can accurately predict future results especially in connection with expansion. In addition, the expansion may cost more and may present additional challenges and risks that negatively impact our future financial performance.
We will depend on Fagen, Inc. and ICM, Inc. to expand our plant, however, we currently have no binding agreement with them. We will be highly dependent upon Fagen, Inc. and ICM, Inc. to expand our plant, but we have no letter of intent or definitive binding agreement with either company. Fagen, Inc. has indicated its intention to deliver to us a proposed expansion design-build contract, in which it will serve as our general contractor and will engage ICM, Inc. to provide design and engineering services. We anticipate that we will execute a definitive binding design-build agreement with Fagen, Inc. to expand the plant. However, we have not yet negotiated, reviewed or executed the design-build agreement and there is no assurance that such an agreement will
22
be executed.
If we do not execute a definitive, binding design-build agreement with Fagen, Inc., or if Fagen, Inc. terminates its relationship with us after initiating construction, there is no assurance that we would be able to obtain a replacement general contractor. Accordingly, we give no assurances that we will be able to implement our expansion strategy as planned or at all.
We may need to increase cost estimates for construction of the ethanol plant, and such increase could reduce our revenue stream and make the expansion unprofitable. We anticipate that Fagen, Inc. will expand our plant for a fixed contract price, based on the plans and specifications in the anticipated design-build agreement. We have based our capital needs on a design for the plant expansion that will cost approximately $50,000,000. The estimated cost of the expansion is based on preliminary discussions, and there is no assurance that the final cost of the expansion will not be higher. There is no assurance that there will not be design changes or cost overruns associated with the expansion of the plant. In addition, shortages of steel could affect the final cost and final completion date of the project. Any significant increase in the estimated construction cost of the expansion may the expansion too expensive to complete or unprofitable to operate because our revenue stream may not be able to adequately support the increased cost and expense attributable to increased construction costs.
Construction delays could increase our costs. We anticipate construction of the expansion will begin in July 2006 and will be completed by July 2007; however, construction projects often involve delays in obtaining permits, construction delays due to weather conditions, or other events that delay the construction schedule. In addition, Fagen, Inc.’s involvement in the construction of a number of other plants while constructing our plant could cause delays in our construction schedule. Also, any changes in interest rates or the credit environment or any changes in political administrations at the federal, state or local level that result in policy change towards ethanol, could also cause construction and operation delays. If it takes longer to construct the expansion than we anticipate, it may substantially increase our costs, which could have a material adverse effect on our results of operations and financial condition.
Defects in expansion construction could impair our ability to produce ethanol and its co-products. There is no assurance that defects in materials and/or workmanship in the plant expansion will not occur. Under the terms of the anticipated design-build agreement with Fagen, Inc., Fagen, Inc. would warrant that the material and equipment furnished to build the plant will be new, of good quality, and free from material defects in material or workmanship at the time of delivery. Though we expect the expansion design-build agreement to require Fagen, Inc. to correct all defects in material or workmanship for a period of one year after substantial completion of the expansion, material defects in material or workmanship may still occur. Such defects could significantly impair operations of the plant or cause us to interrupt or discontinue the plant’s operation. Interrupting or discontinuing plant operations could materially affect our ability to generate sufficient cash flow to cover our costs and force us to terminate our business.
We have not received certain permits and failure to obtain these permits would prevent expansion of the plant. Before we can begin expansion of our plant, we must obtain numerous regulatory approvals and permits. While we anticipate receiving these approvals and permits, there is no assurance that these requirements can be satisfied in a timely manner or at all. In addition, as described above under “Risks Related to Regulation and Governmental Action - Changes in environmental regulations or violations of the regulations could be expensive and reduce our profitability,” governmental requirements may substantially increase our costs, which could have a material adverse effect on our results of operations and financial condition.
ITEM 2. PROPERTIES.
We own the general partnership interest in the limited partnership that owns the ethanol plant. The ethanol plant is located on an approximately 80 acre rural site that is located approximately two miles east of the City of Marcus, Iowa and approximately one mile north of Iowa State Highway 3. The plant’s address is 4808 F Avenue, Marcus, Iowa 51035. The plant grinds approximately 18 million to 19 million bushels of corn per year to produce approximately 52 million gallons of ethanol. The original construction of the plant was completed in 2003 and consists of the following buildings:
23
• A processing building, which contains processing equipment, laboratories, control room and offices;
• A grain receiving and shipping building, which contains a control room and 1st and 2nd level mezzanine;
• A mechanical building, which contains maintenance offices, storage and a welding shop; and
• An administrative building, along with furniture and fixtures, office equipment and computer and telephone systems.
The plant includes a fermenter walkway, gas dryer, evaporator and storage facilities for ethanol and distiller grains. The site also contains improvements such as rail tracks and a rail spur, landscaping, drainage systems and paved access roads.
In July, 2005, we completed an expansion to the plant which enabled us to increase our ethanol production from 40 million to 52 million gallons per year. This plant expansion included an additional fermenter, slurry tank, additional water treatment equipment, liquefaction tank, molecular sieves and additions to the process building, which will accommodate the additional fermenter and shop area. We also installed additional drier controls and maintenance system software in fiscal year 2005.
In addition in October 2005, we completed the installation of a corn oil segregation unit which separates corn oil from the distillers grains during the ethanol production process.
All of our tangible and intangible property, real and personal, serves as the collateral for the debt financing with First National Bank of Omaha, which is described below under “Item 7 – Management’s Discussion and Analysis of Financial Condition and Results of Operations – Indebtedness.”
ITEM 3. LEGAL PROCEEDINGS.
From time to time in the ordinary course of business, the Partnership or we may be named as a defendant in legal proceedings related to various issues, including without limitation, workers’ compensation claims, tort claims, or contractual disputes. We are not currently involved in any material legal proceedings, directly or indirectly, and we are not aware of any claims pending or threatened against us or any of the directors that could result in the commencement of legal proceedings.
ITEM 4. SUBMISSION OF MATTERS TO A VOTE OF SECURITY HOLDERS.
We did not submit any matter to a vote of our unit holders through the solicitation of proxies or otherwise during the fourth quarter of 2005.
PART II
ITEM 5. MARKET FOR MEMBERSHIP UNITS AND RELATED MEMBER MATTERS AND ISSUER PURCHASES OF MEMBERSHIP UNITS.
Recent Sales of Unregistered Securities
In 2002, we sold exclusively to residents of the State of Iowa, a total of 10,002 Class A membership units, which were exempt from federal registration but were registered and offered in the State of Iowa. We sold these membership units without the use of an underwriter. We sold 7,812 Class A membership units at a price of $1,000 per unit and we sold 2,190 Class A membership units for a price of $1,100 per unit. From our 2002 Class A membership unit sales we received total aggregate proceeds of approximately $10,226,000.
We claimed exemption from federal registration with respect to our Class A membership unit sales due to the application of Section 3(a)(11) of the Securities Act of 1933 (regarding intra-state offerings). The recipients of securities in each such transaction represented their domicile as the State of Iowa, their intention to acquire the securities for investment only and not with a view to, or for sale in connection with, any distribution thereof, and appropriate legends were affixed to unit certificates and instruments issued in such transactions. All recipients had
24
adequate access through their relationships with us, to information about us. We have no Class B membership units outstanding. On April 30, 2003, we registered our units with the U.S. Securities and Exchange Commission on Form 10-SB Registration Statement pursuant to Section 12(g) of the Securities Exchange Act of 1934.
Market Information
There is no public trading market for our units. We have created a private qualified online matching service in order to facilitate trading among our members. Our online matching service consists of an electronic bulletin board that provides information to prospective sellers and buyers of our units. We do not receive any compensation for creating or maintaining the matching service. We do not become involved in any purchase or sale negotiations arising from our qualified matching service. In advertising our qualified matching service, we do not characterize the Company as being a broker or dealer or an exchange. We do not give advice regarding the merits or shortcomings of any particular transaction. We do not receive, transfer or hold funds or securities as an incident of operating the online matching service. We do not use the bulletin board to offer to buy or sell securities other than in compliance with the securities laws, including any applicable registration requirements. We have no role in effecting the transactions beyond approval, as required under our operating agreement and the issuance of new certificates. So long as we remain a Section 12 registrant and a publicly reporting company, information about the Company will be publicly available through the SEC’s filing system. However, if at any time we cease to be a Section 12 registrant or publicly reporting company, we will continue to make information about the Company publicly available on our website.
Unit Holders
As of the date of filing of this report, the Company had 10,941 Class A membership units issued and outstanding and a total of 689 Class A membership unit holders. There is no other class of membership unit issued or outstanding.
Distributions
2005 Distributions
On January 18, 2005 our Board of Directors, acting as general partner of the Partnership, approved a total cash distribution of $4,000,000 from the Partnership to all limited partners of record as of January 18, 2005. At January 18, 2005, we owned 60.1539% of the limited partnership units of the Partnership. Accordingly the Company received a cash distribution of $2,406,156. The distribution was made in February 2005. On January 18, 2005, our Board of Directors approved a cash distribution of $219.92 per membership unit or a total of $2,406,144.72 to the Company’s unit holders of record as of January 18, 2005.
On March 15, 2005 our Board of Directors, acting as general partner of the Partnership, approved a total cash distribution of $3,000,000 from the Partnership to all limited partners of record as of March 15, 2005. As a holder of 60.1539% of the limited partnership units of the Partnership, we received a cash distribution of $1,804,617. On the same day, we approved a cash distribution of $159.96 per membership unit or a total of $1,750,122.36 to the Company’s unit holders of record as of March 15, 2005.
On September 20, 2005 our Board of Directors, acting as general partner of the Partnership, approved a cash distribution of $1,581,000 from the Partnership to all limited partners of record as of September 20, 2005. As a holder of 60.1539% of the limited partnership units of the Partnership, we received a cash distribution of $951,033. On September 20, 2005, our Board of Directors approved a cash distribution of $78.24 per membership unit or a total of $856,023.84 to the Company’s unit holders of record as of September 20, 2005.
2004 Distributions
On January 20, 2004, our Board of Directors, as general partner of the limited partnership, approved a total cash distribution of $1,050,000 from the limited partnership to all limited partners of record as of January 20, 2004. At January 20, 2004, we owned 58.5% of the limited partnership units in the limited partnership. Accordingly, the Company received a cash distribution of $614,724. The distribution was made in February 2004. Of the $614,724, we distributed $561,164 to our unit holders ($51.29 per membership unit) and used the remaining amount to reduce accounts payable for professional fees incurred on behalf of the Company by the limited partnership.
25
On August 17, 2004, our Board of Directors, acting as general partner of the limited partnership, approved a total cash distribution of $1,200,000 to all limited partners of record as of August 17, 2004. Due to our redemption of limited partnership units, our ownership interest in the limited partnership increased from 58.5% to 60.15%. As a holder of 60.15% of the limited partnership units on August 17, 2004, we received a cash distribution of $721,847 from the limited partnership. On the same day, we approved a cash distribution of $52.57 per membership unit or a total of $575,168 to the Company’s unit holders of record as of August 17, 2004.
Distributions to our unit holders are subject to certain loan covenants and restrictions that require us to make additional loan payments based on excess cash flow. These loan covenants and restrictions are described in greater detail under “Item 7 – Management’s Discussion and Analysis of Financial Condition and Results of Operations – Liquidity and Capital Resources.” Revenues generated from plant operations are distributed by the limited partnership to us in proportion to our equity ownership in the limited partnership. We distribute the revenues received from the limited partnership to our unit holders in proportion to the number of units held by each unit holder. A unit holder’s distribution is determined by dividing the number of units owned by such unit holder by the total number of units outstanding. Our Class A directors have complete discretion over the timing and amount of distributions to our unit holders, however, our operating agreement requires the Class A directors to endeavor to make cash distributions at such times and in such amounts as will permit our unit holders to satisfy their income tax liability in a timely fashion. Our expectations with respect to our ability to make future distributions are discussed in greater detail in “Item 7 – Management’s Discussion and Analysis of Financial Condition and Results of Operations – Indebtedness.”
ITEM 6. SELECTED FINANCIAL DATA.
The following table sets forth selected consolidated financial data of Little Sioux Corn Processors, LLC and our subsidiary, LSCP, LLLP for the periods indicated. The audited financial statements included in Item 8 of this report have been audited by our independent auditors, Boulay, Heutmaker, Zibell & Co., P.L.L.P.
Statement of Operations Data: | | 2005 | | 2004 | | 2003(1) | |
Revenues | | $ | 95,881,420 | | $ | 85,540,934 | | $ | 31,814,299 | |
| | | | | | | |
Cost of Goods Sold | | $ | 61,966,890 | | $ | 71,244,909 | | $ | 27,462,227 | |
| | | | | | | |
Gross Profit | | $ | 33,914,530 | | $ | 14,296,025 | | $ | 4,352,072 | |
| | | | | | | |
Operating Expenses | | $ | 5,924,998 | | $ | 6,138,653 | | $ | 2,660,909 | |
| | | | | | | |
Operating Income | | $ | 27,989,532 | | $ | 8,157,372 | | $ | 1,691,163 | |
| | | | | | | |
Other Income (Expense) | | $ | (4,469,066 | ) | $ | 5,360,140 | | $ | 5,300,716 | |
| | | | | | | |
Net Income Before Minority Interest | | $ | 23,520,466 | | $ | 13,517,512 | | $ | 6,991,879 | |
| | | | | | | |
Minority Interest in Subsidiary Income | | $ | 9,421,765 | | $ | 5,663,681 | | $ | 2,920,676 | |
| | | | | | | |
Net Income | | $ | 14,098,701 | | $ | 7,853,831 | | $ | 4,071,203 | |
| | | | | | | |
Average Units Outstanding | | 10,941 | | 10,941 | | 10,941 | |
Net Income Per Unit | | $ | 1,288.61 | | $ | 717.83 | | $ | 372.11 | |
Distributions Per Unit | | $ | 458.12 | | $ | 103.86 | | $ | — | |
26
Balance Sheet Data: | | 2005 | | 2004 | | 2003(1) | |
Cash & Equivalents | | $ | 14,135,954 | | $ | 3,907,380 | | $ | 536,483 | |
Current Assets | | $ | 26,748,278 | | $ | 11,946,926 | | $ | 8,048,340 | |
Property & Equipment | | $ | 50,128,437 | | $ | 47,536,127 | | $ | 48,797,341 | |
Total Assets | | $ | 77,162,356 | | $ | 59,828,204 | | $ | 57,308,872 | |
Current Liabilities | | $ | 10,644,316 | | $ | 4,966,448 | | $ | 4,951,852 | |
Long Term Debt | | $ | 16,092,315 | | $ | 19,572,989 | | $ | 28,157,443 | |
Deferred Compensation | | $ | 48,000 | | $ | — | | $ | — | |
Minority Interest | | $ | 20,209,574 | | $ | 14,207,003 | | $ | 10,052,753 | |
Members’ Equity | | $ | 30,168,151 | | $ | 21,081,764 | | $ | 14,146,824 | |
Book Value Per Unit | | $ | 2,757.35 | | $ | 1,926.86 | | $ | 1,293.01 | |
(1) Fiscal year 2003 represents only a partial year of operations, as the ethanol plant commenced production in April 2003.
ITEM 7. MANAGEMENT’S DISCUSSION AND ANALYSIS OF FINANCIAL CONDITION AND RESULTS OF OPERATION.
Except for the historical information, the following discussion contains forward-looking statements that are subject to risks and uncertainties. We caution you not to put undue reliance on any forward-looking statements, which speak only as of the date of this report. Our actual results or actions may differ materially from these forward-looking statements for many reasons, including the risks described in “Item 1A - Risk Factors” and elsewhere in this annual report. Our discussion and analysis of our financial condition and results of operations should be read in conjunction with the financial statements and related notes and with the understanding that our actual future results may be materially different from what we currently expect.
Overview
As general partner, we manage the business and day-to-day operations of the Partnership’s 52 million gallon per year ethanol plant in northwest Iowa. In July 2005, we completed the expansion of our plant from an ethanol production capacity of 40 million gallons per year to 52 million gallons per year. We expect the increased capacity will increase our operating income as a result of increasing revenue and operating efficiencies. However, we can not provide any guarantee that the expansion will reduce our operating costs or increase our operating income.
Our revenues are derived from the sale and distribution of our ethanol and distillers grains throughout the continental United States. Corn is supplied to us primarily from local agricultural producers and from purchases of corn on the open market. After processing the corn, ethanol is sold to ADM, which subsequently markets and sells the ethanol to gasoline blenders and refineries located throughout the continental United States. The price that we receive from the sale of ethanol to ADM is based upon the price that ADM receives from the sale to its customers, minus a fee. Except distillers grains we sell directly to local farmers, our distillers grains are sold through Commodity Specialist Company which markets and sells the product to livestock feeders. For our distillers grains, we receive a percentage of the selling price actually received by CSC in marketing the distillers grains to its customers.
Our operating income or loss is significantly tied to the price at which ethanol and distillers grains are sold. Historically, the price of ethanol tends to fluctuate in the same direction as the price of unleaded gasoline and other petroleum products. Surplus ethanol supplies also tend to put downward price pressure on ethanol. In contrast, the price of distillers grains generally tends to fluctuate based on the price of substitute livestock feed, such as corn and soybean meal. Surplus grain supplies also tend to put downward price pressure on distillers grains.
Our cost of revenues, which includes production expenses, is significantly affected by the cost of corn and natural gas. The cost of corn is affected primarily by supply and demand factors such as crop production, carryout, exports, risk management and weather, much of which we have no control. Natural gas prices fluctuate with the energy complex in general. Over the last few years, natural gas prices have trended higher than average and appear will continue to trend higher due to the high price of alternative fuels such as fuel oil.
27
We are subject to industry-wide factors that affect our revenues and profits. These factors include, but are not limited to, the available supply and cost of corn from which our ethanol and distillers grains are made; the cost of natural gas, which we use in the production of ethanol and distillers grains; dependence on one or a few major customers who market and distribute our products; the intensely competitive nature of our industry; possible legislation at the federal, state, and/or local level; changes in federal ethanol tax incentives; and the cost of complying with the extensive environmental laws that regulate our industry.
Results of Operations
Comparison of Year Ended September 30, 2005 and 2004.
The following table shows the results of our operations and the percentage of revenues, cost of goods sold, operating expenses and other items to total revenues in our consolidated statements of operations for the fiscal years ended September 30, 2005 and 2004:
| | 2005 | | 2004 | |
Income Statement Data | | Amount | | % | | Amount | | % | |
Revenues | | $ | 95,881,420 | | 100.0 | | $ | 85,540,934 | | 100.0 | |
| | | | | | | | | |
Cost of Goods Sold | | $ | 61,966,890 | | 64.6 | | $ | 71,244,909 | | 83.3 | |
| | | | | | | | | |
Gross Profit | | $ | 33,914,530 | | 35.4 | | $ | 14,296,025 | | 16.7 | |
| | | | | | | | | |
Operating Expenses | | $ | 5,924,998 | | 6.2 | | $ | 6,138,653 | | 7.2 | |
| | | | | | | | | |
Operating Income | | $ | 27,989,532 | | 29.2 | | $ | 8,157,372 | | 9.5 | |
| | | | | | | | | |
Other Income (Expense) | | $ | (4,469,066 | ) | (4.7 | ) | $ | 5,360,140 | | 6.3 | |
| | | | | | | | | |
Net Income Before Minority Interest | | $ | 23,520,466 | | 24.5 | | $ | 13,517,512 | | 15.8 | |
| | | | | | | | | |
Minority Interest in Subsidiary Income | | $ | 9,421,765 | | 9.8 | | $ | 5,663,681 | | 6.6 | |
| | | | | | | | | |
Net Income | | $ | 14,098,701 | | 14.7 | | $ | 7,853,831 | | 9.2 | |
Revenues
The increase in revenues from fiscal year 2005 compared to fiscal year 2004 is due primarily to an increase in the price we received for our ethanol. Net gallons of denatured ethanol sold totaled 49,183,000 in fiscal 2005 compared to 48,883,842 in fiscal 2004. The average per gallon price we received for our ethanol sold for 2005 increased approximately 12% compared to the twelve months ended September 30, 2004. We sold approximately the same quantity of ethanol in 2005 as compared 2004. Sales of co-products increased by approximately 7% in 2005 compared to co-products sales in 2004 due to a more favorable sales mix of wet and dry distillers grains sold.
In the third fiscal quarter and continuing through the first two thirds of the forth fiscal quarter, the demand for ethanol increased relative to supply causing upward pressure on ethanol market prices. In the last month of the quarter some of those gains have been reduced, but prices remain historically strong. Increased demand, firm crude oil and gas markets, public acceptance, and positive political signals have all contributed to a strengthening of ethanol prices. In order to sustain these higher price levels however, management believes the industry will need to continue to grow demand to offset the increased supply brought to the market place by additional production.
While we anticipate continued strong demand for ethanol, we are uncertain as to the sustainability of current ethanol prices given the increasing ethanol supply as new plants begin production and existing plants continue to expand. Ethanol production continues to grow as additional plants become operational. According to the Renewable Fuels Association, there are currently 88 ethanol plants in operation nationwide that have the capacity to annually produce 4.2 billion gallons. In addition, there are 21 new ethanol plants and 8 expansions of existing ethanol plants under construction constituting another 1.4 billion gallons of annual capacity. In addition, ADM has recently announced its plan to add 500 million gallons of ethanol production, clearly indicating its desire to maintain a significant share of the ethanol market.
28
We also expect to benefit from federal ethanol supports and federal tax incentives. Changes to these supports or incentives could significantly impact demand for ethanol. On August 8, 2005, President George W. Bush signed into law the Energy Policy Act of 2005 (the “Act”). The Act contains numerous provisions that are expected to favorably impact the ethanol industry by enhancing both the production and use of ethanol. Most notably, the Act created a 7.5 billion gallon renewable fuels standard (the “RFS”). The RFS is a national renewable fuels mandate as to the total amount of national renewable fuels usage but allows flexibility to refiners by allowing them to use renewable fuel blends in those areas where it is most cost-effective rather than requiring renewable fuels to be used in any particular area or state. The RFS will begin at 4 billion gallons in 2006, and increase to 7.5 billion gallons by 2012. According to the Renewable Fuels Association, the Act is expected to lead to about $6 billion in new investment in ethanol plants across the country.
Since our current national ethanol production capacity exceeds the 2006 RFS requirement, it is management’s belief that other market factors are primarily responsible for current ethanol prices. Accordingly, it is possible that the RFS requirements may not significantly impact ethanol prices in the short-term. For instance, if gasoline prices continue to trend higher, consumers will look for lower priced alternative fuels. The Consumer Federation of America recently published a report that states that consumers could save up to eight cents per gallon at the pump if ethanol were blended at 10 percent. Since ethanol blended fuel is a cheaper alternative for consumers, the demand for such ethanol blended fuel could increase thus increasing the overall demand for ethanol. This could positively affect our earnings. However, the increased requirement of 7.5 billion by 2012 is expected to support ethanol prices in the long term. A greater supply of ethanol on the market from these additional plants and plant expansions could reduce the price we are able to charge for our ethanol. This may have a negative impact on our revenues.
Demand for ethanol may also increase as a result of increased consumption of E85 fuel. E85 fuel is a blend of 70% to 85% ethanol and gasoline. According to the Energy Information Administration, E85 consumption is projected to increase from a national total of 11 million gallons in 2003 to 47 million gallons in 2025. E85 is used as an aviation fuel and as a hydrogen source for fuel cells. In the U.S., there are currently about 3 million flexible fuel vehicles capable of operating on E85 and 400 retail stations supplying it. Automakers have indicated plans to produce an estimated 2 million more flexible fuel vehicles per year.
Although the Energy Policy Act of 2005 did not impose a national ban of methyl tertiary butyl ether (“MTBE”), the primary competitor of ethanol as a fuel oxygenate, the Act’s failure to include liability protection for manufacturers of MTBE could result in refiners and blenders using ethanol as an oxygenate rather than MTBE to satisfy the Clean Air Act’s reformulated gasoline oxygenate requirement. While this may create some additional demand in the short term, the Act repeals the Clean Air Act’s 2% oxygenate requirement for reformulated gasoline immediately in California and 270 days after enactment elsewhere. However, the Clean Air Act also contains an oxygenated fuel requirement for areas classified as carbon monoxide non-attainment areas. These areas are required to establish an oxygenated fuels program for a period of no less than three months each winter. The minimum oxygen requirement for gasoline sold in these areas is 2.7% by weight. This is the equivalent of 7.7% ethanol by volume in a gasoline blend. This requirement was unaffected by the Act and a number of states, including California, participate in this program.
Consumer resistance to the use of ethanol may affect the demand for ethanol which could affect our ability to market our product and reduce our revenues. Certain individuals believe that use of ethanol will have a negative impact on prices at the pump. Many also believe that ethanol adds to air pollution and harms car and truck engines. Still other consumers believe that the process of producing ethanol actually uses more fossil energy, such as oil and natural gas, than the amount of ethanol that is produced. These consumer beliefs could potentially be wide-spread. If consumers choose not to buy ethanol, it would affect the demand for the ethanol we produce which could negatively affect our ability sell our product and negatively affect our profitability.
On March 15, 2005, the board of directors approved a $1,850,000 capital expenditure to install a corn oil segregation unit. Corn oil is a co-product of the ethanol industry and until recently has been sold as an energy component of our distillers grains. Corn oil in its raw form can be used as livestock feed, as a fuel under certain operating conditions, refined into bio-diesel fuel, or refined for human consumption. We project this investment will increase our revenues by approximately $1,200,000 million annually, but the actual impact on our revenues could vary. The equipment was installed in October 2005. We intend to initially market the unrefined corn oil to the animal feed and bio-diesel markets after startup to assure that quality specifications can be maintained. In the long term, the corn oil co-product could be marketed for human consumption. Specific details regarding market penetration into human food are unknown at this time since corn oil extraction in a dry mill situation such as ours has not yet been proven, nor has its suitability for human consumption been determined.
29
Cost of Goods Sold
Our cost of goods sold as a percentage of revenues were 64.6% and 83.3% for the twelve months ended September 30, 2005 and 2004 respectively. The decrease in our cost of goods sold from period to period is primarily due to our reduced corn costs. Our average per bushel price we paid for our corn decreased approximately 34% for the twelve months ended September 30, 2005 compared to the twelve months ended September 30, 2004. Although we can give no assurances, the plant expansion may increase our operating efficiency which would maintain or lower our cost of goods sold as a percentage of our revenues.
We recognize the gains or losses that result from the changes in the value of our derivative instruments in cost of goods sold as the changes occur. As corn and natural gas prices fluctuate, the value of our derivative instruments are impacted, which affects our financial performance. We partially offset these losses with the cash price we paid for corn. We anticipate continued volatility in our cost of goods sold due to the timing of the changes in value of the derivative instruments relative to the cost and use of the commodity being hedged.
Corn costs significantly impact our cost of goods sold. The 2004 corn crop was the largest corn crop on record with national production at approximately 11.8 billion bushels and Iowa production at approximately 2.24 billion bushels. This allowed ethanol plants to purchase corn cheaply throughout 2005, which widened profit margins for many ethanol plants in the current year. Nevertheless, the 2005 national corn crop is projected to be the second largest on record exceeded only by the 2004 crop which is the largest ever recorded. As a result, we expect corn prices to remain at relatively low levels into the 2005-2006 marketing year.
We expect the grain market to begin focusing on prospects for the 2006 crop. Variables such as rainfall, planting dates, and temperatures will likely cause market uncertainty and create corn price volatility as the growing season begins. Domestic and export demand for US corn is at an all time high. Although carryout supplies for 2006 marketing year appear adequate, any production shortfall during the 2006 growing season will create volatility and may increase our cost of corn.
Natural gas has recently been available only at prices exceeding historical averages. These prices are increasing our costs of production. In late August 2005, Hurricane Katrina caused dramatic damage to areas of Louisiana, which is the location of one of the largest natural gas hubs in the United States. As the damage from the hurricane became apparent, natural gas prices substantially increased. It is currently unknown how the damage will affect intermediate and long term prices of natural gas. Hurricane Rita also impacted the Gulf Coast and caused shutdowns at several Texas refineries, which further increased natural gas prices. Future hurricanes in the Gulf of Mexico could cause similar or greater uncertainty. We expect continued volatility in the natural gas market. Global demand for natural gas is expected to continue to increase, which may further drive up prices. Any ongoing increases in the price of natural gas will increase our cost of production and may negatively impact our future profit margins. We expect natural gas prices to remain high or increase at least through the 2005-2006 winter months.
Operating Expenses
Our operating expenses as a percentage of revenue were approximately 6.2% and 7.2% for fiscal year 2005 and 2004 respectively. This reduction is primarily due to our increased revenues. Our operating expense amounts have remained fairly level from period to period. Although we can give no assurances, the plant expansion may increase our operating efficiency which would maintain or lower our operating expenses as a percentage of our revenues.
30
On May 1, 2005, we established a deferred compensation plan for certain key employees providing supplemental benefits. For the first year of the plan, the board granted a discretionary deferred bonus of 20 percent of each plan participant’s base salary for the prior calendar year. Costs of the plan were recognized during the period so that the benefits automatically accrue when payments begin. We will transfer the amount of the deferred compensation to a trust established under the deferred bonus compensation plan. The benefit will vest on January 15th of the sixth calendar year following the year the participant is awarded the benefit, provided the participant is employed full-time by us throughout the entire six-year period.
Operating Income
Our income from operations for fiscal year 2005 totaled $27,989,532 compared to $8,157,372 for fiscal year 2004. This was a result of the increase in sales revenue for fiscal year 2005 combined with the decrease in cost of goods sold for the same period. We expect the expansion of our plant from 40 million gallon annual production capacity to 52 million gallon annual production capacity will increase our annual operating income by approximately $3,200,000 as a result of an increase in revenue and operating efficiency. There is no assurance, however, that the expansion will reduce our operating costs or increase our operating income. Our expansion projections are based upon our historical operating costs and historical revenues and there is no guarantee or assurance that our past financial performance can accurately predict future results especially in connection with expansion. In addition, the expansion may present additional challenges and risks that negatively impact our future financial performance.
Other Income and Expense
Our other income and expense for the twelve months ended September 30, 2005 was an expense of $4,469,066 compared to income of $5,360,140 for the twelve months ended September 30, 2004. This resulted from lower CCC Bio-Energy payments and a settlement of a dispute with ADM.
Our CCC Bioenergy payments were $172,850 for the twelve months ended September 30, 2005 compared to $6,645,512 for the twelve months ended September 30, 2004. We have seen a large fluctuation in other income due in large part to a reduction in the payments from the USDA Commodity Credit Corporation Bioenergy Program. These payments are based upon increases in ethanol production relative to previous years. Since we increased our production capacity from 40 to 52 million gallons per year through our plant expansion, we will be eligible to receive additional Bioenergy Program payments. However, due to the size of the expansion, any program payments we receive in the future will be significantly less than our original payments and we do not expect future program payments to have the same impact on cash flow as they have in the past. In addition, the accrued income from the Bioenergy Program is significantly less than the amount we are eligible for based on our production. This reduction is attributed to an increase in the number of eligible participants in the program, which reduces our share of the payments. We do not anticipate receiving unpaid amounts for past pro rata reductions. The receipt of these additional program payments is subject to the continued availability of program funds, which may be reduced as a result of increased participation in the program by new and expanding plants as well as decreased federal funding. The Bioenergy Program is scheduled to expire at the end of the federal government’s 2006 fiscal year.
Subsequent to the period covered by this report, we were involved in a dispute with ADM regarding the actual price ADM is required to pay for the ethanol it purchases from us under the ethanol marketing agreement. Pursuant to our ethanol marketing agreement with ADM, the price ADM pays us for our ethanol is calculated by averaging the price ADM receives for all the ethanol it sells originating from (i) our plant, (ii) ADM’s plant in Marshall, Minnesota and (iii) ADM’s plant in Columbus, Nebraska. In October 2005, ADM contacted us and claimed that that since the inception of the ethanol marketing agreement, ADM has mistakenly failed to factor in its hedging costs for the ethanol sold from Marshall and Columbus, which resulted in an overpayment to us of approximately $3.9 million. In support of its claim, ADM provided us with documentation demonstrating how the hedging costs incurred by ADM when it sold Marshall and Columbus ethanol would affect the price received by us for ethanol. After engaging independent accountants to review ADM’s claimed overpayment, we orally offered in December 2005 to settle the claim by paying ADM approximately $3,900,000 less actual legal and accounting expenses incurred in connection with investigation and settlement of the claimed overpayment. ADM has orally agreed to accept our settlement offer. We have not yet executed a written settlement agreement. We recorded the $3.9 million settlement as a loss as of September 30, 2005 in other income (expense).
31
Comparison of Year Ended September 30, 2004 and 2003.
The following table shows the results of our operations and the percentage of revenues, cost of goods sold, operating expenses and other items to total revenues in our consolidated statements of operations for the fiscal years ended September 30, 2004 and 2003:
| | 2004 | | 2003 | |
Income Statement Data | | Amount | | % | | Amount | | % | |
Revenues | | $ | 85,540,934 | | 100.0 | | $ | 31,814,299 | | 100.0 | |
| | | | | | | | | |
Cost of Goods Sold | | $ | 71,244,909 | | 83.3 | | $ | 27,462,227 | | 86.3 | |
| | | | | | | | | |
Gross Profit | | $ | 14,296,025 | | 16.7 | | $ | 4,352,072 | | 13.7 | |
| | | | | | | | | |
Operating Expenses | | $ | 6,138,653 | | 7.2 | | $ | 2,660,909 | | 8.4 | |
| | | | | | | | | |
Operating Income | | $ | 8,157,372 | | 9.5 | | $ | 1,691,163 | | 5.3 | |
| | | | | | | | | |
Other Income | | $ | 5,360,140 | | 6.3 | | $ | 5,300,716 | | 16.7 | |
| | | | | | | | | |
Net Income Before Minority Interest | | $ | 13,517,512 | | 15.8 | | $ | 6,991,879 | | 22.0 | |
| | | | | | | | | |
Minority Interest in Subsidiary Income | | $ | 5,663,681 | | 6.6 | | $ | 2,920,676 | | 9.2 | |
| | | | | | | | | |
Net Income | | $ | 7,853,831 | | 9.2 | | $ | 4,071,203 | | 12.8 | |
Revenues
Revenues from operations in fiscal 2004 totaled $85,540,934, up from $31,814,299 in fiscal 2003. Net gallons of denatured ethanol sold totaled 48,883,842 in fiscal 2004 compared to 20,673,634 gallons in fiscal 2003. Increased revenues in fiscal 2004 resulted from an increase in the total number of gallons of ethanol sold and higher ethanol prices.
Cost of Goods Sold
Our cost of goods sold for fiscal 2004 totaled $71,244,909, up from $27,462,227 in fiscal 2003. In addition to the short fiscal year in 2003, the average per bushel cost of corn increased from $2.24 in fiscal 2003 to $2.56 in fiscal 2004. Cost of good sold includes losses of $3,851,340 in fiscal 2004 related to our corn and natural gas derivative instruments, up from $648,714 in fiscal 2003. These losses were caused by the fluctuations in the price of corn in 2004. At the end of 2003, we increased our use of corn derivative instruments and positions to protect against the market price forecasts for corn. Those forecasts predicted higher prices for corn because of low world carryout prior to the growing season, decreased production, and drought. As the year progressed, however, and it became apparent that corn production would be much higher than expected, the original market forecasts proved incorrect and the market price of corn actually declined. When the market price declined, the value of the corn derivative instruments fell which led to an increase in cost of goods sold.
Operating Expenses
Operating expenses for fiscal 2004 totaled $6,138,653, up from $2,660,909 reported in fiscal 2003, due to the short operating year in 2003.
32
Operating Income
For the fiscal year 2004, income from operations was $8,157,372 as compared to $1,691,163 in fiscal year 2003. The increase primarily results from fiscal 2003 containing only six months of operations since the plant began operations in April 2003 and the fiscal year ended on September 30, 2003.
Other Income and Expense
Other income and expense consisted of income of $5,360,140 in fiscal 2004 compared to income of $5,300,526 reported in fiscal 2003. Payments under the USDA Commodity Credit Corporation Bioenergy Program make up a majority of this category. Fiscal 2004 payments totaled $6,645,512 compared to $5,535,733 in fiscal 2003. Since the Bioenergy Program is based on increases in production, fiscal 2004 program payments were calculated based upon increases in production over 2003. Because 2003 was our first year of production, the plant had the largest increase in production from the prior year. Between 2004 and 2003, the plant had a far smaller increase in production which, accordingly, led to less incentive revenue being earned. In addition, funding for this program was reduced in 2004 and the number of eligible participants in the program increased significantly, resulting in pro-rata reductions in payments to all program participants. We also do not anticipate receiving unpaid amounts for past pro rata reductions.
Plant Operations and Expansion
We plan to continue to operate the ethanol plant for the next 12 months. During fiscal year 2005, we underwent a plant expansion which increased the ethanol production capacity of our plant from 40 million gallons per year to 52 million gallons annually.
In connection with the expansion, we entered into an Agreement Between Owner and Design/Builder on the Basis of a Stipulated Price with ICM, Inc. on December 6, 2004. The expansion was completed in July 2005 and the plant is currently operating at a rate of 52 million gallons annual production, the design capacity guaranteed in the construction contract with ICM, Inc. Pursuant to the construction contract with ICM, Inc., we paid $4,600,000 to ICM, Inc. for the design and construction of this expansion. ICM, Inc. has agreed to provide a one year warranty period for correction of defective construction. The amount of damages that we can recover against ICM, Inc. for any breach of its obligations under the agreement, including, without limitation, damages related to ICM Inc.’s correction of defective construction is limited to $1,000,000. We waive all claims for any consequential damages that may arise out of or relate to the agreement or the performance of the construction of the expansion of the ethanol plant.
Also in connection with financing the expansion of our plant, we entered into a Sixth Amendment to Construction Loan Agreement with First National Bank of Omaha. Under this amendment, First National Bank of Omaha agreed to loan us up to $5,400,000 to finance the construction of the expansion of our existing ethanol plant. Upon completion of the construction, the outstanding balance of this new expansion loan will be added to the principal balance of our Term Note #3 with First National Bank of Omaha relating to the original construction of our ethanol plant. We were required to pay First National Bank of Omaha an origination fee of $40,500 in connection with this new loan. This loan is subject to all terms and conditions of our existing Construction Loan Agreement with First National Bank of Omaha, including the specific provisions regarding events of default and the granting of liens to secure our performance. In the event of default, First National Bank of Omaha may accelerate the due date of the new loan and declare all obligations immediately due and payable. Additional information regarding this loan may be found at “Item 7 – Management’s Discussion and Analysis of Financial Condition and Results of Operations – Indebtedness.”
In addition, we installed a corn oil segregation unit, additional drier controls, and maintenance system software in fiscal year 2005. We believe that installing this equipment has allowed the plant to continue producing 52 million gallons of ethanol per year while continuing to satisfy certain emission standards and maintain efficiencies. We may implement additional design improvements as they are developed. The plant may be shut down from time to time over the next 12 months to incorporate any design improvements.
33
On July 19, 2005 the Board of Directors determined that it is in the best interests of the Company to explore further expansion of our ethanol production capacity. The Board of Directors authorized studies to determine the financial impact of expanding the present plant beyond 52 million gallons per year, and/or building a new plant at a different location, and/or investing in other ethanol plants. On August 9, 2005, the Board of Directors approved plans to proceed with a 40 million gallon per year expansion to our plant. The cost of the expansion is expected to be approximately $50,000,000, which will be financed using both a portion of our cash and additional debt to finance the required capital expenditure. The use of cash to finance these expenditures could impact our ability to make future distributions to our members. We expect the expansion will nearly double our operating revenue and operating efficiencies. There is no assurance that the expansion will reduce our operating costs or increase our operating income. Our expansion projections are based upon our historical operating costs and historical revenues and there is no guarantee or assurance that our past financial performance can accurately predict future results especially in connection with expansion. In addition, the expansion may cost more and may present additional challenges and risks that negatively impact our future financial performance. We anticipate construction of the expansion will begin in July 2006 and will be completed by July 2007. The expansion may be delayed for a number of reasons and there is no assurance that the expansion will not be delayed beyond the anticipated completion date.
We have entered into negotiations with Fagen, Inc. of Granite Falls, Minnesota to expand our plant’s annual ethanol production capacity by 40 million gallons per year. We expect that as our expansion design-builder, Fagen, Inc. will engage ICM, Inc. to provide design and engineering services and design and construct expansion for a fixed contract price. However, we have not executed a letter of intent or definitive agreement with Fagen, Inc. and there is no assurance that we will be able to do so or that the terms will be as anticipated. If our negotiations with Fagen, Inc. are successful, we will be dependent upon Fagen, Inc. and ICM, Inc. for their expertise in integrating process and facility design into a construction and operationally efficient facility is very important to the success of the expansion. We will depend on our consultants for timely completion of the expansion of our plant, however, our consultants’ involvement in other projects could delay the commencement and start-up operation of our expansion. If we are unable to finalize a letter of intent or definitive agreement with Fagen, Inc., we will explore other options to expand the plant. However, there is no assurance that we will be able to obtain a replacement general contractor. If we are unable to retain a replacement general contractor, we may be forced to abandon our expansion plans.
Management anticipates that the plant will continue to operate at or above name-plate capacity of 52 MGY for the next twelve months. We expect to have sufficient cash from cash flow generated by continuing operations, anticipated additional debt financing secured to fund plant expansion, current lines of credit through our revolving promissory note, and cash reserves to cover the costs of expansion as well as our usual operating costs over the next 12 months, which consist primarily of corn supply, natural gas supply, staffing, office, audit, legal, compliance, working capital costs and debt service obligations.
The following is our estimate of our costs for the next 12 months for the plant as it currently operates (52 MGY production capacity):
Corn Costs | | $ | 34,750,000 | |
General and Administrative Costs | | $ | 8,100,000 | |
Natural Gas Costs | | $ | 13,900,000 | |
Chemical Costs | | $ | 4,900,000 | |
Other Production Costs | | $ | 14,800,000 | |
| | | |
Total Operating Costs: | | $ | 76,450,000 | |
After the expansion, our total operating costs have increased because of the increase in our production capacity. We expect to offset the increase in operating costs by increased ethanol revenues, however, a variety of market factors can affect both operating costs and revenues. These factors include:
• Changes in the availability and price of corn;
• Changes in the environmental regulations that apply to our plant operations;
• Increased competition in the ethanol and oil industries;
34
• Changes in interest rates or the availability of credit;
• Changes in our business strategy, capital improvements or development plans;
• Changes in plant production capacity or technical difficulties in operating the plant;
• Changes in general economic conditions or the occurrence of certain events causing an economic impact in the agriculture, oil or automobile industries;
• Changes in the availability and price of natural gas and the market for distillers grains; and
• Changes in federal and/or state laws (including the elimination of any federal and/or state ethanol tax incentives).
Application of Critical Accounting Policies
Management uses estimates and assumptions in preparing our consolidated financial statements in accordance with generally accepted accounting principles. These estimates and assumptions affect the reported amounts of assets and liabilities, the disclosure of contingent assets and liabilities, and the reported revenues and expenses. Of the significant accounting policies described in the notes to our consolidated financial statements, we believe that the following are the most critical:
Derivative Instruments
We enter into derivative instruments to hedge the variability of expected future cash flows related to forecasted corn and natural gas purchases, forward purchase contracts, and interest rates. We do not typically enter into derivative instruments other than for hedging purposes. All derivative instruments are recognized on our September 30, 2005 and September 30, 2004 balance sheet at their fair market value. Currently, none of our derivative instruments is classified as cash-flow hedges for accounting purposes. On the date the derivative instrument is entered into, we will designate the derivative as either a hedge of the variability of cash flows of a forecasted transaction or will not designate the derivative as a hedge. Changes in the fair value of a derivative that is designated as, and meets all of the required criteria for, a cash flow hedge are recorded in accumulated other comprehensive income and reclassified into earnings as the hedged items affect earnings. Changes in the fair value of a derivative that is not designated as a hedge are recorded in current period earnings. Although certain derivative instruments may not be designated as, and accounted for, as a cash flow hedge, they are effective economic hedges of specified risks.
At September 30, 2005 and 2004, we had recorded an asset for our derivative instruments related to corn and natural gas options and future positions of $496,853 and $212,319, respectively. We have recorded a loss on derivative instruments of approximately $2,697,000 and $3,851,340 in cost of goods sold for the fiscal years ended September 30, 2005 and 2004, respectively.
During the nine month fiscal year ended September 30, 2003, the Company dedesignated as cash flow hedges its option contract positions, although they continue to be effective economic hedges of specified risks. The Company recorded a loss in cost of goods sold of approximately $648,000 for the nine month fiscal year ended September 30, 2003.
At September 30, 2005 and 2004, we had an interest rate cap, as described in note 6 in the notes to our financial statements, with a fair value of $69,756 and $30,740, respectively recorded as an asset with derivative instruments. The interest rate cap was not designated as a cash flow hedge. We offset interest expense with a gain of approximately $39,000 on the interest rate cap for fiscal year ended September 30, 2005. We charged interest expense with the $50,484 loss in the fair value of the interest rate cap for the fiscal year ended September 30, 2004. We offset interest expense with the gain of $81,224 on the interest rate cap for the nine month fiscal year ending September 30, 2003.
Liquidity and Capital Resources
The following table shows cash flows for the last two years:
35
| | Year ended September 30, | |
| | 2005 | | 2004 | |
Net cash from operating activities | | $ | 34,093,417 | | $ | 17,479,109 | |
Net cash used for investing activities | | (7,409,870 | ) | (2,230,069 | ) |
Net cash used for financing activities | | (16,454,973 | ) | (11,878,143 | ) |
| | | | | | | |
Cash Flow From Operations. The increase in net cash flow provided from operating activities between 2005 and 2004 was primarily due to a favorable spread between the price of corn and the price of ethanol. Our capital needs are being adequately met through cash from our operating activities and our current credit facilities.
Cash Flow From Investing Activities. We used cash provided by operating activities as well as cash provided by a construction note, Term Note #5, totaling $5,400,000 for capital expenditures which totaled $5,774,450 for fiscal 2005 compared to $2,230,069 for fiscal 2004. This increase primarily reflects expenditures for the expansion of the plant production capacity from 40 MPY to 52 MPY.
Management estimates that approximately $1,000,000 in capital expenditures will be made in the next twelve months for general improvements and expansion of the plant, all of which are expected to be financed from a portion of cash flows from operations and additional debt financing.
On August 9, 2005, the Board of Directors approved plans to proceed with a 40 million gallon per year expansion to our plant. The cost of the expansion is expected to be approximately $50,000,000, which will be financed using both a portion of our cash and additional debt to finance the required capital expenditure. Our expansion projections are based upon our historical operating costs and historical revenues and there is no guarantee or assurance that our past financial performance can accurately predict future results especially in connection with expansion. In addition, the expansion may cost more and may present additional challenges and risks that negatively impact our future financial performance. We anticipate construction of the expansion will begin in July 2006 and will be completed by July 2007.
Cash Flow From Financing Activities. We used cash to pay down our debt by $8,023,465 in fiscal 2005 compared to $9,078,381 in fiscal 2004. Additionally, the total amount of cash we distributed to partners and members totaled $8,431,508 in 2005 compared to $2,049,762 in 2004. In addition, $750,000 was used to redeem limited partnership units (minority interest) in 2004.
The following table shows cash flows for 2004 and 2003:
| | Year ended September 30, | |
| | 2004 | | 2003 | |
Net cash from operating activities | | $ | 17,479,109 | | $ | 2,197,583 | |
Net cash used for investing activities | | (2,230,069 | ) | (293,274 | ) |
Net cash used for financing activities | | (11,878,143 | ) | (1,636,988 | ) |
| | | | | | | |
Cash Flow From Operations. The increase in net cash flow provided from operating activities between 2004 and 2003 was primarily due to a partial operating year in 2003 as plant operations did not commence until April 2003.
Cash Flow From Investing Activities. We used cash provided by operating activities was used for $2,230,069 of capital expenditures in 2004 compared to $7,033,842 in 2003 which were primarily financed through the construction note. This decrease primarily reflects expenditures for plant construction and equipment during fiscal 2003.
Cash Flow From Financing Activities. We used cash to pay down our debt by $9,078,381 in fiscal 2004 compared to $1,627,802. Additionally, the total amount of cash we distributed to partners and members totaled $2,049,762 in 2004. No distributions were paid in fiscal 2003.
36
Indebtedness
Short-Term Debt Sources
We have a revolving promissory note of up to $3,500,000 with First National Bank of Omaha through March 2006. The interest payable on the revolving promissory note is due monthly at the one month LIBOR plus 2.80%, which totaled 6.49% at September 30, 2005. The revolving promissory note is our operating line of credit. We pay a commitment fee of 0.125% on the unused portion of the line. We did not have an outstanding balance at September 30, 2005. The outstanding balance as of September 30, 2004, was $38,829. The maximum available credit under this note is based on receivable and inventory balances. As the balances in these accounts fluctuate, the amount of available credit on this note may be reduced or increased subject to the maximum of $3,500,000. The operating line of credit is subject to protective covenants requiring us to maintain various financial ratios. The operating line of credit is secured by all business assets.
Long-Term Debt Sources
We have long-term debt financing consisting of four term notes held by First National Bank of Omaha and referred to as Term Notes #2, #3, #4 and #5. At September 30, 2005, the principal balance on Term Note #2 was $12,732,447. Term Note #2 is payable in quarterly installments. Interest on Term Note #2 is at the three month LIBOR plus 2.80%, which totaled 6.67% as of September 30, 2005. Term Note #2 is payable in full on June 1, 2008. In order to achieve a fixed interest rate on Term Note #2, we entered into an interest rate swap which helps protect our exposure to increases in interest rates and the swap effectively fixes the interest rate on Term Note #2 at 5.79% until June 1, 2008.
At September 30, 2005, the principal balance on Term Note #3 is $1,293,643. Term Note #3 is payable in quarterly installments. Interest on Term Note #3 is at the three month LIBOR plus 2.80%, which totaled 6.67% as of September 30, 2005. Term Note #3 is payable in full on June 1, 2008. In order to protect our interest rate exposure on Term Note #3, we entered into an interest rate cap agreement based on a principal amount of $10,000,000. The financing agreement caps our interest rate at 6.80% for Term Note #3 until June 1, 2006. As part of the financing agreement, we have agreed to an annual servicing fee of $50,000 for five years.
At September 30, 2005, there was no principal balance on Term Note #4. Term Note #4 is payable in quarterly installments. Interest on Term Note #4 is at the one month LIBOR plus 2.80%. Term Note #4 is payable in full on June 1, 2008. Term Note #4 allows borrowings up to the original principal of $5,000,000 to the extent of principal payments made until maturity and requires a commitment fee of 0.375% on any unused portion.
In connection with financing the expansion of our plant on December 2, 2004, we entered into a Sixth Amendment to Construction Loan Agreement with First National Bank of Omaha. Under this amendment, First National Bank of Omaha agreed to loan us up to $5,400,000 to finance the construction of the expansion of our ethanol plant (Term Note #5). At September 30, 2005, the principal balance on Term Note #5 was $5,400,000. Term Note #5 bears interest at the one month LIBOR plus 330 basis points, which totaled 6.99% at September 30, 2005. Subsequent to the period covered by this report on October 1, 2005, the outstanding balance of Term Note #5 was added to the principal balance of Term Note #3. Prior to the conversion to Term Note #3, we were required to make interest only payments quarterly. At September 30, 2005, the aggregate indebtedness represented by Term Notes #2, #3, #4 and #5 was $19,426,090.
The revolving promissory note and Term Notes #2, #3, #4 and #5 are subject to numerous protective covenants requiring us to maintain various financial ratios. During the third quarter of fiscal year 2005, we renegotiated our covenants with First National Bank of Omaha to reflect our current operating structure. Our failure to comply with the protective loan covenants or maintain the required financial ratios may cause acceleration of the outstanding principal balances on the revolving promissory note and terms notes and/or the imposition of fees, charges or penalties.
We expect our interest rate swap and cap agreement to adequately protect us in the event of changes in interest rates. However, we may not be fully protected in the event of large movements in interest rates.
37
We have a capital lease obligation in the amount of $190,564 on which we initially pay monthly installments totaling $6,658, with an implicit interest rate at 3.67%. This obligation is secured by the leased equipment and runs through March 1, 2008.
We have a note in the amount of $138,889 payable to the Iowa Energy Center on which we pay monthly installments of $3,472 without interest. This note is secured by real estate, but is subordinated to the term notes. It matures on January 29, 2009.
We have a note with Farmers State Bank of Marcus, Iowa in the amount of $149,986 on which we pay monthly installments of $5,921, including interest at 6%. This note is secured by real estate, but is subordinated to the term notes. It matures on January 29, 2009.
We have a note totaling $192,500 payable to the Iowa Department of Economic Development on which we pay monthly installments of $1,167 without interest. This note is secured by all equipment and matures on July 1, 2009.
In addition to our long-term debt obligations, we have certain other contractual cash obligations and commitments. The following tables provide information regarding our consolidated contractual obligations and commitments as of September 30, 2005:
| | Payment Due By Period | |
Contractual Cash Obligations | | Total | | Less than
One Year | | One to
Three
Years | | Four to
Five
Years | | After Five
Years | |
| | | | | | | | | | | |
Long-Term Debt Obligations | | $ | 20,098,029 | | $ | 4,005,714 | | $ | 16,092,315 | | $ | 0 | | $ | 0 | |
Operating Lease Obligations | | 482,807 | | 187,371 | | 295,436 | | 0 | | 0 | |
Purchase Obligations | | 20,940,486 | | 20,102,837 | | 837,649 | | 0 | | 0 | |
Other Long-Term Liabilities | | 0 | | 0 | | 0 | | 0 | | 0 | |
Total Contractual Cash Obligations | | $ | 41,521,322 | | $ | 24,295,922 | | $ | 17,225,400 | | $ | 0 | | $ | 0 | |
Off-Balance Sheet Arrangements.
We do not have any off-balance sheet arrangements.
ITEM 7A. QUANTITATIVE AND QUALITATIVE DISCLOSURES ABOUT MARKET RISK.
We are exposed to the impact of market fluctuations associated with interest rates and commodity prices as discussed below. We have no exposure to foreign currency risk as all of its business is conducted in U.S. Dollars. We use derivative financial instruments as part of an overall strategy to manage market risk. We use cash, futures and option contracts to hedge changes to the commodity prices of corn and natural gas. We do not enter into these derivative financial instruments for trading or speculative purposes, nor do we designate these contracts as hedges for accounting purposes pursuant to the requirements of SFAS 133, Accounting for Derivative Instruments and Hedging Activities.
Interest Rate Risk
We are exposed to market risk from changes in interest rates. Exposure to interest rate risk results from holding a revolving promissory note and four term notes which bear variable interest rates. Specifically, we have $19,426,090 outstanding in variable rate, long-term debt as of September 30, 2005. The specifics of each note are discussed in greater detail in “Item 7 – Management’s Discussion and Analysis of Financial Condition and Results of Operations – Indebtedness.”
In order to achieve a fixed interest rate on Term Note #2, we entered into an interest rate swap which helps protect our exposure to increases in interest rates and the swap effectively fixes the interest rate on Term Note #2 at 5.79% until June 1, 2008. When the three month LIBOR plus 2.80% exceeds 5.79%, the Company receives payments for the difference between the market rate and the swap rate. Conversely, when the three-month LIBOR plus 2.80% is below 5.79%, the Company makes payments for the difference between the market rate and the swap rate. While our exposure is now greatly reduced, there can be no assurance that interest rate swap agreement will provide us with protection in all scenarios.
38
In order to protect our interest rate exposure on Term Note #3, we entered into an interest rate cap agreement to reduce the risk of increases in interest rates. The interest rate cap agreement is based on a notional amount of $10,000,000 and caps increases in interest rates at 6.8% on this amount. The interest rate cap agreement expires on June 1, 2006; however, obligations under Term Note #3 continue until June 1, 2008. Accordingly, when the interest rate cap expires, we will be vulnerable to rising interest rates.
At September 30, 2005 and 2004, the fair value of the interest rate cap was $69,756 and $30,740, respectively, recorded as an asset with derivative instruments. The interest rate cap was not designated as a cash flow hedge. The Company offset interest expense with a gain of approximately $39,000 on the interest rate cap for fiscal year ending September 30, 2005. The Company charged interest expense with the loss on the interest rate cap of approximately $50,000 for the fiscal year ending September 30, 2004. The Company offset interest expense with a gain of approximately $81,000 on the interest rate cap for the nine month fiscal year ending September 30, 2003.
Commodity Price Risk
We are also exposed to market risk from changes in commodity prices. Exposure to commodity price risk results from our dependence on corn and natural gas in the ethanol production process. We seek to minimize the risks from fluctuations in the prices of corn and natural gas through the use of hedging instruments. In practice, as markets move, we actively manage our risk and adjust hedging strategies as appropriate. Although we believe our hedge positions accomplish an economic hedge against our future purchases, they are not designated as such for hedge accounting purposes, which would match the gain or loss on our hedge positions to the specific commodity purchase being hedged. We are marking to market our hedge positions, which means as the current market price of our hedge positions changes, the gains and losses are immediately recognized in our cost of goods sold. For example, it is likely and we would generally expect that a 10% increase in the cash price of corn would produce an increase in the fair value of our derivative instruments equal to approximately $49,700 based on our positions at September 30, 2005.
The immediate recognition of hedging gains and losses can cause net income to be volatile from quarter to quarter due to the timing of the change in value of the derivative instruments relative to the cost and use of the commodity being hedged. As of September 30, 2005, the fair value of our derivative instruments for corn is an asset in the amount of $496,853. There are several variables that could affect the extent to which our derivative instruments are impacted by price fluctuations in the cost of corn or natural gas. However, it is likely that commodity cash prices will have the greatest impact on the derivatives instruments with delivery dates nearest the current cash price.
To manage our corn price risk, our hedging strategy is designed to establish a price ceiling and floor for our corn purchases. We have taken a net long position on our exchange traded futures and options contracts, which allows us to offset increases or decreases in the market price of corn. The upper limit of loss on our futures contracts is the difference between the contract price and the cash market price of corn at the time of the execution of the contract. The upper limit of loss on our exchange traded and over-the-counter option contracts is limited to the amount of the premium we paid for the option.
We estimate that our expected corn usage is approximately 18 to 19 million bushels per year for the production of 52 million gallons of ethanol. We have price protection for approximately 46% of our expected corn usage for fiscal year ended September 30, 2006 using CBOT futures and options and Over the Counter option contracts. As we move forward, additional protection may be necessary. As corn prices move in reaction to market trends and information, our income statement will be affected depending on the impact such market movements have on the value of our derivative instruments. As we move forward, additional price protection may be required to solidify our margins into fiscal year 2007. Depending on market movements, crop prospects and weather, these price protection positions may cause immediate adverse effects, but are expected to produce long-term positive growth for us.
39
To manage our natural gas price risk, we entered into a natural gas purchase agreement with our supplier to supply us with natural gas. This purchase agreement fixes the price at which we purchase natural gas. We estimate that we have forward contracts in place for approximately 100% of our natural gas needs through March 2006. The forward contracts provide for approximately 50% higher gas prices for the 2005-2006 winter months than for the 2004-2005 winter months. In addition to procuring natural gas requirements for winter 2005-2006, we have purchased approximately 100% of our summer and fall 2005 natural gas requirements utilizing both cash, futures and options contracts We may also purchase natural gas requirements for the winter 2006 months and 2007 calendar years as we attempt to further reduce our susceptibility to price increases.
At the time we purchased price protection for natural gas, the market was experiencing a great deal of price uncertainty. Due to this uncertainty, we purchased amounts for most of the plant’s needs and implemented derivative instruments on a portion of our requirements to allow us to benefit in the event natural gas prices declined. Energy sector prices have increased and natural gas, as a portion of the total energy market, has responded with higher prices to be cost competitive with its alternatives. In the future, we may not be able to secure natural gas for prices less than current market price and we may not recover high costs of production resulting from high natural gas prices, which may raise our costs of production.
A sensitivity analysis has been prepared to estimate our exposure to corn and natural gas price risk. The table presents the fair value of our derivative instruments as of September 30, 2005 and September 30, 2004 and the potential loss in fair value resulting from a hypothetical 10% adverse change in such prices. The fair value of the positions is a summation of the fair values calculated by valuing each net position at quoted market prices as of the applicable date. The results of this analysis, which may differ from actual results, are as follows:
Year Ended | | Fair Value | | Effect of Hypothetical
Adverse
Change— Market Risk | |
September 30, 2005 | | $ | 496,853 | | $ | 49,685 | |
September 30, 2004 | | $ | 212,319 | | $ | 21,232 | |
ITEM 8. FINANCIAL STATEMENTS AND SUPPLEMENTARY DATA.
40
LITTLE SIOUX CORN PROCESSORS, LLC AND SUBSIDIARY
Consolidated Financial Statements September 30, 2005 and 2004
CONTENTS
41
REPORT OF INDEPENDENT REGISTERED PUBLIC ACCOUNTING FIRM
Board of Directors
Little Sioux Corn Processors, LLC and Subsidiary
Marcus, Iowa
We have audited the accompanying consolidated balance sheet of Little Sioux Corn Processors, LLC and Subsidiary as of September 30, 2005 and 2004, and the related consolidated statements of operations, changes in members’ equity and accumulated other comprehensive income, and cash flows for the fiscal years ended September 30, 2005, 2004, and 2003. These consolidated financial statements are the responsibility of the Company’s management. Our responsibility is to express an opinion on these consolidated financial statements based on our audits.
We conducted our audits in accordance with the standards of the Public Company Accounting Oversight Board (United States). Those standards require that we plan and perform the audit to obtain reasonable assurance about whether the consolidated financial statements are free of material misstatement. An audit includes examining, on a test basis, evidence supporting the amounts and disclosures in the consolidated financial statements. An audit also includes assessing the accounting principles used and significant estimates made by management, as well as evaluating the overall financial statement presentation. We believe that our audits provide a reasonable basis for our opinion.
In our opinion, the consolidated financial statements referred to above present fairly, in all material respects, the financial position of Little Sioux Corn Processors, LLC and Subsidiary as of September 30, 2005 and 2004, and the results of their operations and their cash flows for the fiscal years ended September 30, 2005, 2004, and 2003, in conformity with U.S. generally accepted accounting principles.
| /s/ Boulay, Heutmaker, Zibell & Co. P.L.L.P. | |
| |
| | Certified Public Accountants |
Minneapolis, Minnesota | |
October 28, 2005 | |
| | | |
42
LITTLE SIOUX CORN PROCESSORS, LLC AND SUBSIDIARY
Consolidated Balance Sheet
| | September 30 | | September 30 | |
| | 2005 | | 2004 | |
ASSETS | | | | | |
Current Assets | | | | | |
Cash and equivalents | | $ | 14,135,954 | | $ | 3,907,380 | |
Restricted cash | | — | | 2,730,481 | |
Short-term investments | | 6,987,420 | | — | |
Trade accounts receivable, less allowance for doubtful accounts of $20,000 | | 2,518,278 | | 2,335,023 | |
Other receivables | | 185,046 | | 400,553 | |
Inventory | | 1,346,217 | | 2,084,604 | |
Derivative instruments | | 566,609 | | — | |
Prepaid expenses | | 1,008,754 | | 488,885 | |
Total current assets | | 26,748,278 | | 11,946,926 | |
| | | | | |
Property and Equipment | | | | | |
Land and improvements | | 2,762,708 | | 2,753,225 | |
Buildings | | 15,768,603 | | 15,061,750 | |
Processing equipment | | 32,910,303 | | 28,226,013 | |
Grain handling equipment | | 5,264,448 | | 5,172,406 | |
Rail and other equipment | | 1,342,950 | | 1,214,322 | |
Furniture and fixtures | | 195,298 | | 160,042 | |
Construction in progress | | 713,898 | | — | |
| | 58,958,208 | | 52,587,758 | |
Less accumulated depreciation | | 8,829,771 | | 5,051,631 | |
Net property and equipment | | 50,128,437 | | 47,536,127 | |
| | | | | |
Other Assets | | | | | |
Long-term investments | | 48,000 | | — | |
Deferred loan costs, net | | 237,641 | | 345,151 | |
Total other assets | | 285,641 | | 345,151 | |
| | | | | |
Total Assets | | $ | 77,162,356 | | $ | 59,828,204 | |
Notes to Consolidated Financial Statements are an integral part of this Statement.
43
LITTLE SIOUX CORN PROCESSORS, LLC AND SUBSIDIARY
Consolidated Balance Sheet
| | September 30 | | September 30 | |
| | 2005 | | 2004 | |
LIABILITIES AND MEMBERS’ EQUITY | | | | | |
| | | | | |
Current Liabilities | | | | | |
Revolving promissory note | | $ | — | | $ | 38,829 | |
Current maturities of long-term debt | | 4,005,714 | | 3,109,676 | |
Trade accounts payable | | 968,667 | | 1,337,513 | |
Derivative instruments | | — | | 181,579 | |
Accrued liabilities | | 5,669,935 | | 298,851 | |
Total current liabilities | | 10,644,316 | | 4,966,448 | |
| | | | | |
Long-Term Debt, net of current maturities | | 16,092,315 | | 19,572,989 | |
| | | | | |
Deferred Compensation | | 48,000 | | — | |
| | | | | |
Commitments and Contingencies | | | | | |
| | | | | |
Minority Interest | | 20,209,574 | | 14,207,003 | |
| | | | | |
Members’ Equity | | | | | |
Member contributions, 10,941 units outstanding at September 30, 2005 and 2004 | | 10,842,237 | | 10,842,237 | |
Retained earnings | | 19,325,914 | | 10,239,527 | |
Total members’ equity | | 30,168,151 | | 21,081,764 | |
| | | | | |
Total Liabilities and Members’ Equity | | $ | 77,162,356 | | $ | 59,828,204 | |
Notes to Consolidated Financial Statements are an integral part of this Statement.
44
LITTLE SIOUX CORN PROCESSORS, LLC AND SUBSIDIARY
Consolidated Statements of Operations
| | Twelve Months Ended | | Twelve Months Ended | | Nine Months Ended | |
| | Septemeber 30 | | September 30 | | September 30 | |
| | 2005 | | 2004 | | 2003 | |
| | | | | | | |
Revenues | | $ | 95,881,420 | | $ | 85,540,934 | | $ | 31,814,299 | |
| | | | | | | |
Cost of Goods Sold | | 61,966,890 | | 71,244,909 | | 27,462,227 | |
| | | | | | | |
Gross Profit | | 33,914,530 | | 14,296,025 | | 4,352,072 | |
| | | | | | | |
Operating Expenses | | 5,924,998 | | 6,138,653 | | 2,660,909 | |
| | | | | | | |
Operating Income | | 27,989,532 | | 8,157,372 | | 1,691,163 | |
| | | | | | | |
Other Income (Expense) | | | | | | | |
Interest income | | 158,761 | | 7,557 | | — | |
Interest expense | | (1,126,101 | ) | (1,439,020 | ) | (847,223 | ) |
CCC Bio-Energy income | | 172,850 | | 6,645,512 | | 5,535,733 | |
Grants and other income (expense), net | | (3,674,576 | ) | 146,091 | | 612,206 | |
Total other income (expense), net | | (4,469,066 | ) | 5,360,140 | | 5,300,716 | |
| | | | | | | |
Net Income Before Minority Interest | | 23,520,466 | | 13,517,512 | | 6,991,879 | |
| | | | | | | |
Minority Interest in Sudsidiary Income | | 9,421,765 | | 5,663,681 | | 2,920,676 | |
| | | | | | | |
Net Income | | $ | 14,098,701 | | $ | 7,853,831 | | $ | 4,071,203 | |
| | | | | | | |
Basic and Diluted Weighted Average Units Outstanding | | 10,941 | | 10,941 | | 10,941 | |
| | | | | | | |
Basic and Diluted Net Income Per Unit | | $ | 1,288.61 | | $ | 717.83 | | $ | 372.11 | |
| | | | | | | |
Distributions Per Unit | | $ | 458.12 | | $ | 103.86 | | $ | — | |
Notes to Consolidated Financial Statements are an integral part of this Statement.
45
LITTLE SIOUX CORN PROCESSORS, LLC AND SUBSIDIARY
Consolidated Statement of Changes in Members’ Equity and Accumulated Other Comprehensive Income
| | | | | | | | Accumulated | |
| | | | Retained | | | | Other | |
| | Member | | Earnings | | Comprehensive | | Comprehensive | |
| | Contributions | | (Deficit) | | Income | | Income (Loss) | |
| | | | | | | | | |
Balance - December 31, 2002 | | $ | 10,842,237 | | $ | (549,175 | ) | | | $ | (438,257 | ) |
| | | | | | | | | |
Net income | | | | 4,071,203 | | $ | 4,071,203 | | | |
| | | | | | | | | |
Other comprehensive loss: | | | | | | | | | |
Unrealized loss on derivative instruments | | | | | | (46,629 | ) | | |
Less: reclassification adjustement for losses included in net income | | | | | | 267,445 | | | |
| | | | | | 220,816 | | 220,816 | |
| | | | | | | | | |
Comprehensive income | | | | | | $ | 4,292,019 | | | |
| | | | | | | | | |
Balance - September 30, 2003 | | 10,842,237 | | 3,522,028 | | | | (217,441 | ) |
| | | | | | | | | |
Distributions | | | | (1,136,332 | ) | | | | |
| | | | | | | | | |
Net income | | | | 7,853,831 | | $ | 7,853,831 | | | |
| | | | | | | | | |
Other comprehensive income: | | | | | | | | | |
Less: reclassification adjustement for losses included in net income | | | | | | 217,441 | | 217,441 | |
| | | | | | | | | |
Comprehensive income | | | | | | $ | 8,071,272 | | | |
| | | | | | | | | |
Balance - September 30, 2004 | | 10,842,237 | | 10,239,527 | | | | — | |
| | | | | | | | | |
Distributions | | | | (5,012,314 | ) | | | | |
| | | | | | | | | |
Net income | | | | 14,098,701 | | | | | |
| | | | | | | | | |
Balance - September 30, 2005 | | $ | 10,842,237 | | $ | 19,325,914 | | | | $ | — | |
Notes to Consolidated Financial Statements are an integral part of this Statement.
46
LITTLE SIOUX CORN PROCESSORS, LLC AND SUBSIDIARY
Condensed Consolidated Statements of Cash Flows
| | Twelve Months | | Twelve Months | | Nine Months | |
| | Ended September 30 | | Ended September 30 | | Ended September 30 | |
| | 2005 | | 2004 | | 2003 | |
| | | | | | | |
Cash Flows from Operating Activities | | | | | | | |
Net income | | $ | 14,098,701 | | $ | 7,853,831 | | $ | 4,071,203 | |
Adjustments to reconcile net income to net cash from operations: | | | | | | | |
Depreciation and amortization | | 3,885,650 | | 3,519,323 | | 1,669,610 | |
Deferred compensation | | 48,000 | | | | | |
Minority interest in subsidiary’s income | | 9,421,765 | | 5,663,681 | | 2,920,676 | |
Provision for losses on recievables | | — | | 20,000 | | — | |
Loss on hedging activity | | — | | 312,777 | | 567,490 | |
Change in assets and liabilities: | | | | | | | |
Restricted cash | | 2,730,481 | | (2,717,579 | ) | 255,293 | |
Receivables | | 32,252 | | 2,360,756 | | (5,107,878 | ) |
Inventory | | 738,387 | | (664,360 | ) | (1,420,244 | ) |
Derivative instruments | | (748,188 | ) | 638,192 | | (1,117,860 | ) |
Prepaid expenses | | (519,869 | ) | 75,544 | | (546,942 | ) |
Accounts payable | | (964,846 | ) | 578,272 | | 496,972 | |
Accrued liabilities | | 5,371,084 | | (161,328 | ) | 409,263 | |
Net cash provided by operating activities | | 34,093,417 | | 17,479,109 | | 2,197,583 | |
| | | | | | | |
Cash Flows from Investing Activities | | | | | | | |
Payments for investments | | (7,035,420 | ) | — | | — | |
Capital expenditures | | (374,450 | ) | (2,230,069 | ) | (293,274 | ) |
Net cash used in investing activities | | (7,409,870 | ) | (2,230,069 | ) | (293,274 | ) |
| | | | | | | |
Cash Flows from Financing Activities | | | | | | | |
Bank overdraft | | — | | — | | (220,354 | ) |
Payments on short-term debt | | (38,829 | ) | (736,336 | ) | 775,165 | |
Payments of long-term debt | | (7,984,636 | ) | (8,342,045 | ) | (2,182,613 | ) |
Loan costs | | — | | — | | (9,186 | ) |
Redemption of minority interest | | — | | (750,000 | ) | — | |
Distribution to minority interest | | (3,419,194 | ) | (913,430 | ) | — | |
Distribution to members | | (5,012,314 | ) | (1,136,332 | ) | — | |
Net cash used in financing activities | | (16,454,973 | ) | (11,878,143 | ) | (1,636,988 | ) |
| | | | | | | |
Net increase in cash and equivalents | | 10,228,574 | | 3,370,897 | | 267,321 | |
| | | | | | | |
Cash and Equivalents – Beginning of Period | | 3,907,380 | | 536,483 | | 269,162 | |
| | | | | | | |
Cash and Equivalents – End of Period | | $ | 14,135,954 | | $ | 3,907,380 | | $ | 536,483 | |
| | | | | | | |
Supplemental Cash Flow Information | | | | | | | |
Cash paid during the year for: | | | | | | | |
Interest | | $ | 1,102,945 | | $ | 1,527,937 | | $ | 1,022,668 | |
| | | | | | | |
Supplemental Disclosure of Noncash Investing and Financing Activities | | | | | | | |
Construction in progress included in accrued liabilities | | $ | 596,000 | | $ | — | | $ | 250,000 | |
Property and equipment acquired through construction note | | $ | 5,400,000 | | $ | — | | $ | 6,490,568 | |
Reduction in property and equipment due to debt forgiveness | | $ | — | | $ | 90,000 | | $ | — | |
Capital lease obligations incurred | | $ | — | | $ | — | | $ | 4,337 | |
Notes to Consolidated Financial Statements are an integral part of this Statement.
47
LITTLE SIOUX CORN PROCESSORS, LLC AND SUBSIDIARY
Notes to Consolidated Financial Statements
September 30, 2005 and 2004
1. SUMMARY OF SIGNIFICANT ACCOUNTING POLICIES
Principles of Consolidation
The Consolidated financial statements include the accounts of Little Sioux Corn Processors, LLC (the “LLC”) and its 60.15% owned subsidiary, LSCP, LLLP (the “LSCP”), collectively, the “Company.” All significant intercompany balances and transactions are eliminated in consolidation.
Minority Interest
Amounts recorded as minority interest on the balance sheet relate to the net investment by limited partners in LSCP plus or minus any allocation of income or loss of LSCP. After giving effect to certain special allocations, income and losses of LSCP will be allocated to the partners based upon their respective percentage of partnership units held. The minority interest share of the comprehensive income for the fiscal years ending September 30, 2005, 2004, and 2003, is $9,421,765, $5,817,680, and $3,077,001, respectively.
Minority interest has been classified on the accompanying balance sheet to reflect it as a separate line item rather than including it as part of equity. This classification has no impact on net income or earnings per unit.
Nature of Business
The Company operates a 52 million gallon ethanol plant, located near Marcus, Iowa. The plant commenced operations in April 2003. In July 2005, the Company completed its expansion, from a 40 million gallon plant to 52 million gallon plant. The Company sells its production of ethanol, distiller’s grains and solubles, and modified wet distillers grains with solubles in the Continental United States.
Fiscal Reporting Period
On June 26, 2003, the Company adopted a fiscal year ending September 30 for reporting financial operations. Prior to that, the Company had a fiscal year ending December 31 for reporting financial operations.
Accounting Estimates
Management uses estimates and assumptions in preparing these consolidated financial statements in accordance with generally accepted accounting principles. Those estimates and assumptions affect the reported amounts of assets and liabilities, the disclosure of contingent assets and liabilities, and the reported revenues and expenses. Commodity Credit Corporation Bio-Energy Program incentives include significant estimates. Actual results could differ from those estimates.
48
LITTLE SIOUX CORN PROCESSORS, LLC AND SUBSIDIARY
Notes to Consolidated Financial Statements
September 30, 2005 and 2004
Revenue Recognition
Revenue from the sale of the Company’s products is recognized at the time title of the goods and all risks of ownership transfer to the customers. This generally occurs upon shipment to the customer or when the customer picks up the goods.
The Company records revenue from federal and state incentive programs related to the production of ethanol when the Company has sold the ethanol and completed all the requirements of the applicable incentive program.
Commodity Credit Corporation Bioenergy Program
The Company is enrolled in the Commodity Credit Corporation Bioenergy Program (CCC), a department of the United States Department of Agriculture. This program enables the Company to receive payments based on increases in production of ethanol over the previous year of up to $7,500,000 per year. New production is eligible and is considered increased production. Payments under the program are subject to pro rata reduction if aggregate payments to all producers in any fiscal year exceed the maximum annual funding of the program. For the fiscal years ended September 30, 2005, 2004, and 2003, the Company recorded $172,850, $6,645,512, and $5,535,733, respectively, as other income from the CCC. At September 30, 2005 and 2004, the Company had $23,000 and $262,246, respectively, recorded in other receivables.
Cash and Equivalents
The Company considers all highly liquid debt instruments purchased with a maturity of three months or less to be cash and equivalents.
The Company maintains its accounts primarily at two financial institutions. At times throughout the year, the Company’s cash and equivalents balances, which include money market funds and debt instrument with a maturity of less than three months, may exceed amounts insured by the Federal Deposit Insurance Corporation. At September 30, 2005, such money market funds and debt instruments approximated $11,779,000. There were no money market funds or debt instruments with maturities of three months or less at September 30, 2004. The Company does not believe it is exposed to any significant credit risk on cash and equivalents.
Restricted Cash
The Company is periodically required to maintain cash balances at its brokers related to derivative instrument positions.
Investments
The Company includes in investments certain debt instruments with maturities greater than three months and marketable securities, both classified as “available for sale”. The debt instruments primarily consist of treasury bills and certificates of deposit and are recorded as short term investments. The Company maintains marketable securities as part of the deferred compensation plan and classifies amounts as long-term investments. Accordingly, a corresponding liability has been recorded in deferred compensation.
49
LITTLE SIOUX CORN PROCESSORS, LLC AND SUBSIDIARY
Notes to Consolidated Financial Statements
September 30, 2005 and 2004
Investments are carried at their estimated fair market value based on quoted mark prices. There are no unrealized gains and losses on investments at September 30, 2005 and 2004.
Trade Accounts Receivable
Credit terms are extended to customers in the normal course of business. The Company performs ongoing credit evaluations of its customers’ financial condition and, generally, requires no collateral.
Trade accounts receivable are recorded at their estimated net realizable value. The Company follows a policy of providing an allowance for doubtful accounts. The Company’s estimate of the allowance for doubtful accounts is based upon historical experience, its evaluation of the current status of receivables, and unusual circumstances, if any. Accounts are considered past due if payment is not made on a timely basis in accordance with the Company’s credit terms. Accounts considered uncollectible are written off.
Inventory
Inventory consists of raw materials, work in process, and finished goods. Corn is the primary raw material and, along with other raw materials, is stated at the lower of average cost or market. Finished goods consist of ethanol produced and DDGS and MWDGS, and are stated at the lower of first-in, first-out, (FIFO method) cost or market.
Property and Equipment
Property and equipment are stated at the lower of cost or estimated value. Depreciation is computed over estimated useful lives by use of the straight-line method. Maintenance and repairs are expensed as incurred; major improvements and betterments are capitalized. The present value of capital lease obligations is classified as long-term debt and the related assets are included in equipment. Amortization of equipment under capital lease is included in depreciation expense.
The Company reviews its property and equipment for impairment whenever events indicate that the carrying amount of the asset may not be recoverable. An impairment loss is recorded when the sum of the future cash flows is less than the carrying amount of the asset. An impairment loss is measured as the amount by which the carrying amount of the asset exceeds its fair value.
Deferred Loan Costs
Costs associated with the issuance of the construction loan discussed in Note 5 are recorded as deferred loan costs, net of accumulated amortization. Loan costs are amortized to operations over the life of term note #3 using the effective interest method.
Derivative Instruments
The Company enters into derivative instruments to hedge the variability of expected future cash flows related to forecasted corn and natural gas purchases, forward purchase contracts, and interest rates. The Company does not typically enter into derivative instruments other than for hedging purposes. All derivative instruments are recognized on the September 30, 2005 and September 30, 2004 balance sheet at their fair market value. On the date the derivative instrument is entered into, the Company will designate the derivative as a hedge. Changes is the fair value of a derivative that is designated as, and meets all of the
50
LITTLE SIOUX CORN PROCESSORS, LLC AND SUBSIDIARY
Notes to Consolidated Financial Statements
September 30, 2005 and 2004
required criteria, for a cash flow hedge are recorded in accumulated other comprehensive income and reclassified into earnings as the hedged items affect earnings. Changes in the fair value of a derivative that is not designated as a hedge are recorded in current period earnings. Although certain derivative instruments may not be designated as, and accounted for, as a cash flow hedge, they are effective economic hedges of specified risks.
At September 30, 2005 and 2004, the Company had recorded an asset for derivative instruments related to corn options and futures positions of $496,853 and $212,319, respectively, for forecasted purchases. None of the positions open were designated as cash flow hedges. The Company has recorded a loss of approximately $2,697,000 and $3,851,000 in cost of goods sold for the fiscal years ended September 30, 2005 and 2004, respectively.
During the nine month fiscal year ended September 30, 2003, the Company dedesignated as cash flow hedges its option contract positions, although they continue to be effective economic hedges of specified risks. The Company recorded a loss in cost of goods sold of approximately $648,000 for the nine month fiscal year ended September 30, 2003.
At September 30, 2005 and 2004, the Company had an interest rate cap as described in Note 5 with a fair value of $69,756 and $30,740, respectively, recorded as an asset with derivative instruments. The interest rate cap was not designated as a cash flow hedge. The Company offset interest expense with a gain of approximately $39,000 on the interest rate cap for fiscal year ending September 30, 2005. The Company charged interest expense with the loss on the interest rate cap of approximately $50,000 for the fiscal year ending September 30, 2004. The Company offset interest expense with a gain of approximately $81,000 on the interest rate cap for the nine month fiscal year ending September 30, 2003.
Benefit Plans
The Company has a 401(k) plan covering substantially all employees who meet specified age and service requirements. Under this plan, the Company makes a matching contribution of up to 4% of the participants’ eligible wages.
In May 2005 the Company established a deferred compensation plan for certain employees providing supplemental benefits. The Board may annually grant a discretionary deferred bonus under the plan to each participant in an amount up to twenty percent of each participant’s base salary for the prior calendar year. Costs of the plan are recognized during the employee’s service period for the Company so that the benefits are accrued when payments begin. Participants are fully vested six years after the grant date provided that the participant is employed full-time.
Income Taxes
Little Sioux Corn Processors, LLC and LSCP, LLLP are treated as partnerships for federal and state income tax purposes and generally do not incur income taxes. Instead, their earnings and losses are included in the income tax returns of the members and partners. Therefore, no provision or liability for federal and state income taxes has been included in these financial statements. Differences between consolidated financial statement basis of assets and tax basis of assets is related to capitalization and amortization of organization and start-up costs for tax purposes, whereas these costs are expensed for financial statements purposes. In addition, the Company uses the modified accelerated cost recovery system method (MACRS) for tax depreciation instead of the straight-line method that is used for book depreciation, which also causes temporary differences.
51
LITTLE SIOUX CORN PROCESSORS, LLC AND SUBSIDIARY
Notes to Consolidated Financial Statements
September 30, 2005 and 2004
Fair Value of Financial Instruments
The carrying value of cash and equivalents and restricted cash approximates their fair value.
The Company believes the carrying amount of investments at their estimated fair market value based on quoted mark prices.
The Company believes the carrying amount of derivative instruments approximates fair value based on current market prices.
It is not currently practicable to estimate fair value of the line of credit and notes payable to the lending institution. Because these agreements contain certain unique terms, covenants, and restrictions, as discussed in Note 4 and 5, these are no readily determinable similar instruments on which to base an estimate of fair value.
Environmental Liabilities
The Company’s operations are subject to environmental laws and regulations adopted by various governmental entities in the jurisdiction in which it operates. These laws require the Company to investigate and remediate the effects of the release or disposal of materials at its location. Accordingly, the Company has adopted policies, practices, and procedures in the areas of pollution control, occupational health, and the production, handling, storage and use of hazardous materials to prevent material environmental or other damage, and to limit the financial liability, which could result from such events. Environmental liabilities are recorded when the liability is probable and the costs can reasonably estimated.
2. INVENTORY
Inventories consist of the following:
| | September 30, 2005 | | September 30, 2004 | |
| | | | | |
Raw materials | | $ | 579,568 | | $ | 1,279,912 | |
Work in process | | 437,872 | | 346,749 | |
Finished goods | | 328,777 | | 457,943 | |
| | | | | |
Totals | | $ | 1,346,217 | | $ | 2,084,604 | |
52
LITTLE SIOUX CORN PROCESSORS, LLC AND SUBSIDIARY
Notes to Consolidated Financial Statements
September 30, 2005 and 2004
3. CONSTRUCTION IN PROGRESS
Amounts included in construction in progress as of September 30, 2005 are as follows
Construction costs | | $ | 713,898 | |
| | | |
Total | | $ | 713,898 | |
During fiscal 2005, the Company capitalized interest of $26,526 during the expansion period prior to completing the expansion. The Company estimates its costs to complete the construction of assets not yet placed in service to be approximately $1,631,000 as of September 30, 2005.
4. DEFERRED LOAN COSTS
The Company had deferred loan costs of $487,060 with accumulated amortization of $240,460 at September 30, 2005. At September 30, 2004, the Company has deferred loan costs of $487,060 with accumulated amortization of $141,909. The amortization expense related to the deferred loan costs for fiscal years ended September 30, 2005, 2004, and 2003 was $107,510, $118,040 and $23,869, respectively.
5. REVOLVING PROMISSORY NOTE
Under the terms of the financing agreement with the lending institution, the Company has a revolving promissory note of up to $3,500,000, subject to borrowing base limitations. In July 2005, the lending institution renewed the revolving promissory note until March 2006. The revolving promissory note incurs interest monthly at the one month LIBOR plus 280 basis points, which totaled 6.49% at September 30, 2005. The Company pays a commitment fee of .125% on the unused portion of the revolving promissory note. The Company did not have an outstanding balance on the revolving promissory note at September 30, 2005. The Company had an outstanding balance at September 30, 2004 of $38,829. The revolving promissory note as well as the term notes described in Note 6 are subject to protective covenants under a common financing agreement requiring the Company to maintain various financial ratios, including debt service coverage and minimum net worth and working capital requirements and secured by all business assets.
53
LITTLE SIOUX CORN PROCESSORS, LLC AND SUBSIDIARY
Notes to Consolidated Financial Statements
September 30, 2005 and 2004
6. LONG–TERM DEBT
Long-term debt consists of the following:
| | September 30 2005 | | September 30 2004 | |
| | | | | |
Term note #2 payable to lending institution, see terms below. | | $ | 12,732,447 | | $ | 14,099,113 | |
| | | | | |
Term note #3 payable to lending institution, see terms below. | | 1,293,643 | | 3,177,819 | |
| | | | | |
Term note #4 payable to lending institution, see terms below. | | | | 4,564,175 | |
| | | | | |
Term note #5 payable to lending institution, see terms below. | | 5,400,000 | | | |
| | | | | |
Note payable to Iowa Energy Center, due in monthly payments of $3,472 without interest, maturing on January 29, 2009, secured by real estate, subordinated to term notes. | | 138,889 | | 180,555 | |
| | | | | |
Note payable to bank due in monthly payments of $5,921 including interest at 6% maturing on January 29, 2009, secured by real estate, subordinated to term notes. | | 149,986 | | 189,406 | |
| | | | | |
Note payable to Iowa Department of Economic Development, due in sixty monthly installments beginning August 1, 2004 of $1,167 without interest, payable in full on July 1, 2009, secured by all equipment. | | 192,500 | | 206,500 | |
| | | | | |
Capital lease obligation, due in monthly installments initially totaling $6,658 commencing April 1, 2003 including implicit interest at 3.67% through March 1, 2008, secured by leased equipment. | | 190,564 | | 265,097 | |
| | | | | |
Totals | | $ | 20,098,029 | | $ | 22,682,665 | |
| | | | | |
Less amounts due within one year | | 4,005,714 | | 3,109,676 | |
| | | | | |
Totals | | $ | 16,092,315 | | $ | 19,572,989 | |
54
LITTLE SIOUX CORN PROCESSORS, LLC AND SUBSIDIARY
Notes to Consolidated Financial Statements
September 30, 2005 and 2004
The Company obtained debt financing from a lending institution in the form of a revolving promissory note and term notes, referred to by the lending institution as term notes #2, #3, and #4. Term note #2 has fixed principal payments due quarterly with interest at the three month LIBOR plus 280 basis points, which totaled 6.67% at September 30, 2005, payable in full on June 1, 2008. As part of the financing agreement, the Company accepted a fixed rate option on term note #2 by entering into an interest rate swap which effectively fixes the interest rate on this term note at 5.79% until this term note is repaid on June 1, 2008.
Term note #3 bears interest at the three month LIBOR plus 280 basis points, which totaled 6.67% at September 30, 2005. Term note #4 bears interest at the one month LIBOR plus 280 basis points, which totaled 6.49% at September 30, 2005. Term notes #3 and #4 are payable in full on June 1, 2008. The Company is required to make quarterly payments of $506,588 applied first to accrued interest on term note #4. The remaining amount is applied to accrued interest on the term note #3 and then to principal until this note is repaid in full or until maturity. After term note #3 is repaid, payments are applied first to accrued interest and then to principal on the term note #4 until paid in full or until maturity. Term note #4 had no outstanding balance as of September 30, 2005. Term note #4 allows subsequent borrowings up to the original $5,000,000 to the extent of principal payments made until maturity and requires a commitment fee of .375% on any used portion.
Term note #5 bears interest at the one month LIBOR plus 330 basis points, which totaled 6.99% at September 30, 2005. Prior to the conversion to term note #3 on October 1, 2005, the Company was required to make interest only payments quarterly. After October 1, 2005, the outstanding balance of term note #5 was added to the principle balance of term note #3 with payments as described above.
As part of the financing agreement, the premium above the LIBOR on the term notes and revolving promissory note has been reduced based on a financial ratio from the original 380 basis points. The financing agreement requires an annual servicing fee of $50,000 for five years. As described in Note 1, the Company entered into an interest rate cap agreement to reduce the risk of increases in interest rates. The interest rate cap agreement is based on a notional amount of $10,000,000 and caps increases in interest rates at 6.8% on this amount until June 1, 2006.
At September 30, 2004, LSCP was in violation of the debt service covenant. The lender has waived compliance with this violation at September 30, 2004 and for the following year as it relates to this violation at September 30, 2004.
The estimated maturities of long-term debt at September 30, 2005 are as follows:
2006 | | $ | 4,005,714 | |
2007 | | 5,420,548 | |
2008 | | 10,490,848 | |
2009 | | 180,919 | |
Total long-term debt | | $ | 20,098,029 | |
55
LITTLE SIOUX CORN PROCESSORS, LLC AND SUBSIDIARY
Notes to Consolidated Financial Statements
September 30, 2005 and 2004
7. LEASES
The Company leases equipment under operating and capital leases through 2008. The Company is generally responsible for maintenance, taxes, and utilities for leased equipment. Equipment under operating leases includes rail cars and various other equipment. Rent expense for operating leases was approximately $229,000, $312,000, and $172,000 for the fiscal years ended September 30, 2005, 2004, and 2003, respectively. During the fiscal 2005, the Company rented rail cars on a month-to-month basis and recognized approximately $89,000 in other income. The Company also recorded income of approximately $90,000 on the permanent transfer of 30 rail cars of a 50 rail car lease to a third party. This transfer indemnified the Company from any liability and, as a result, the Company transferred all rights and privileges to the 30 rail cars.
Equipment under capital leases is as follows at September 30:
| | 2005 | | 2004 | |
| | | | | |
Equipment | | $ | 451,437 | | $ | 460,275 | |
Accumulated Amortization | | 75,116 | | 47,371 | |
| | | | | |
Total | | $ | 376,321 | | $ | 412,904 | |
At September 30, 2005, the Company had the following minimum commitments, which at inception had non-cancelable terms of more than one year:
| | Operating
Lease | | Capital
Lease | |
| | | | | |
2006 | | $ | 187,371 | | $ | 79,893 | |
2007 | | 187,371 | | 79,893 | |
2008 | | 108,065 | | 39,946 | |
Total minimum lease commitments | | $ | 482,807 | | 199,732 | |
Less amount representing interest | | | | 9,168 | |
| | | | | |
Present value of minimum lease commitments; included in the proceeding long-term debt | | | | $ | 190,564 | |
8. MEMBERS’ EQUITY
On January 18, 2005, the Board of Directors declared a distribution of $4,000,000 from LSCP to the partners, which was paid in February 2005. The LLC received approximately $2,406,000 of this distribution, which was paid to its members in February 2005. On March 15, 2005, the Board of Directors, declared a distribution of $3,000,000 from LSCP to the partners. The cash distribution was made in April 2005. The LLC received approximately $1,805,000 of this distribution. After paying expenses of approximately $55,000, the LLC distributed approximately $1,750,000 to its members in April 2005. On
56
LITTLE SIOUX CORN PROCESSORS, LLC AND SUBSIDIARY
Notes to Consolidated Financial Statements
September 30, 2005 and 2004
September 20, 2005, the Board of Directors, declared a distribution of $1,581,000 from LSCP to the partners. The cash distribution was made in September 2005. The LLC received approximately $951,000 of this distribution. After paying expenses of approximately $95,000, the LLC distributed approximately $856,000 to its members in September 2005.
9. RELATED PARTY TRANSACTIONS
In addition to the related party transactions described previously, the Company also had the following related party transactions:
The minority investors in LSCP include Archer Daniels Midland, Inc. (ADM), formerly MSCP Holdings Co., LLC, which owns 800 units of LSCP, Fagen, Inc (Fagen), the general contractor of the plant, which owns 350 units, and Indeck Energy Services, LLC, which owns 300 units. In July 2004 LSCP repurchased 100 units held by David Vander Griend, the owner of ICM, the engineering firm for LSCP, for $750,000. As a result, LSCP had 3,639 units outstanding as of September 30, 2005 and 2004. The LLC owns 2,189 LSCP units.
For the fiscal years ending September 30, 2005, 2004, and 2003, revenues from the sale of ethanol to marketing agent as described in Note 12 were approximately $82,549,000, $73,309,000, and $26,518,000, respectively. ADM markets all of the ethanol sold by LSCP as described in Note 9 and receives a marketing fee. The Company incurred marketing expenses of approximately $476,000, $489,000, and $205,000 to ADM for the fiscal years ended September 30, 2005, 2004, and 2003, respectively. At September 30, 2005 and 2004, amounts due from ADM approximated 82% and 90% of trade accounts receivable, respectively.
During the fiscal year ending September 30, 2005, the Company paid approximately $69,000 for services rendered by Fagen. During the fiscal year ended September 30, 2004, the note payable to Fagen, Inc., totaling $1,250,000, was repaid along with accrued interest of approximately $98,000. During the nine month fiscal year ended September 30, 2003, the Company paid fees to Fagen and ICM of approximately $9,795,000.
During the fiscal years ending September 30, 2005, 2004, 2003, LSCP purchased approximately $4,416,000, $8,781,000, and $2,504,000 in corn from members of the LLC.
10. EMPLOYEE BENEFIT PLANS
The Company recorded contributions to the 401(k) plan of approximately $33,000 and $28,000 in fiscal 2005 and 2004, respectively.
Compensation expense related to the deferred compensation plan was $48,000 in fiscal 2005.
57
LITTLE SIOUX CORN PROCESSORS, LLC AND SUBSIDIARY
Notes to Consolidated Financial Statements
September 30, 2005 and 2004
11. INCOME TAXES
The differences between consolidated financial statement basis and tax basis of assets are as follows:
| | September 30
2005 | | September 30
2004 | |
| | | | | |
Consolidated financial statement basis of assets | | $ | 77,162,356 | | $ | 59,828,204 | |
Plus: organization and start-up costs capitalized, net | | 397,163 | | 556,116 | |
Less: accumulated tax depreciation and amortization greater than financial statement basis | | (18,585,418 | ) | (15,359,862 | ) |
| | | | | |
Income tax basis of assets | | $ | 58,974,101 | | $ | 45,024,458 | |
There were no differences between the consolidated financial statement basis and tax basis of the Company’s liabilities.
12. COMMITMENTS AND CONTINGENCIES
Ethanol Marketing Agreement
As discussed in Note 9, the Company has entered into an ethanol marketing agreement with ADM. The Company agrees to pay ADM a fixed price per gallon for every gallon of ethanol produced by the Company and sold to ADM. The initial term is until April 2007 with renewal options thereafter in one-year increments.
Legal Proceedings
The Company was involved in a dispute with ADM involving the ethanol marketing agreement. Subsequent to year-end, the Company settled the claim by agreeing to pay ADM approximately $3,900,000, which the Company recorded as of September 30, 2005 in other income and expense.
Contractual Obligations
The following table provides information regarding the consolidated contractual obligations of the Company as of September 30, 2005:
| | Total | | Less than One Year | | One to Three Years | |
Long-Term Debt Obligations | | $ | 20,098,029 | | $ | 4,005,714 | | $ | 16,092,315 | |
Operating Lease Obligations | | $ | 482,807 | | $ | 187,371 | | $ | 295,436 | |
Purchase Obligations | | $ | 20,940,486 | | $ | 20,102,837 | | $ | 837,649 | |
Total Contractual Cash Obligations | | $ | 41,521,322 | | $ | 24,295,922 | | $ | 17,225,400 | |
58
LITTLE SIOUX CORN PROCESSORS, LLC AND SUBSIDIARY
Notes to Consolidated Financial Statements
September 30, 2005 and 2004
13. QUARTERLY FINANCIAL DATA (UNAUDITED)
Summary quarterly results are as follows:
| | First
Quarter | | Second
Quarter | | Third
Quarter | | Fourth
Quarter | |
Fiscal year ended September 30, 2005 | | | | | | | | | |
Revenues | | $ | 22,975,735 | | $ | 23,835,684 | | $ | 23,101,306 | | $ | 25,968,695 | |
Gross profit | | 6,675,503 | | 8,882,833 | | 8,666,583 | | 9,689,611 | |
Operating income | | 5,211,539 | | 7,470,042 | | 7,279,454 | | 8,028,497 | |
Income before minority interest | | 4,993,564 | | 7,375,228 | | 7,146,738 | | 4,004,936 | |
Minority interest in subsidiary income | | 1,992,348 | | 2,965,331 | | 2,858,942 | | 1,605,144 | |
Net income | | 3,001,216 | | 4,409,897 | | 4,287,796 | | 2,399,792 | |
Basic and diluted earnings per unit | | 274.31 | | 403.06 | | 391.90 | | 219.34 | |
| | | | | | | | | | | | | |
| | First
Quarter | | Second
Quarter | | Third
Quarter | | Fourth
Quarter | |
Fiscal year ended September 30, 2004 | | | | | | | | | |
Revenues | | $ | 19,266,908 | | $ | 20,203,296 | | $ | 21,497,087 | | $ | 24,573,643 | |
Gross profit (loss) | | 3,864,420 | | 8,891,404 | | (1,740,138 | ) | 3,280,339 | |
Operating income (loss) | | 2,295,699 | | 7,387,346 | | (3,223,140 | ) | 1,697,468 | |
Income (loss) before minority interest | | 4,529,123 | | 11,295,095 | | (3,900,172 | ) | 1,593,467 | |
Minority interest in subsidiary income (loss) | | 1,880,548 | | 4,715,589 | | (1,592,236 | ) | 659,782 | |
Net income (loss) | | 2,648,575 | | 6,579,506 | | (2,307,936 | ) | 933,685 | |
Basic and diluted earnings (loss) per unit | | 242.08 | | 601.36 | | (210.94 | ) | 85.34 | |
| | | | | | | | | | | | | |
| | First
Quarter | | Second
|Quarter | | Third
Quarter | | Fourth
Quarter | |
Fiscal year ended September 30, 2003 | | | | | | | | | |
Revenues | | $ | — | | $ | — | | $ | 11,764,929 | | $ | 20,049,370 | |
Gross profit | | — | | | | 1,711,732 | | 2,640,340 | |
Operating income (loss) | | (31,028 | ) | (361,549 | ) | 633,242 | | 1,450,498 | |
Income (loss) before minority interest | | (30,586 | ) | 90,202 | | 3,185,779 | | 3,746,484 | |
Minority interest in subsidiary income (loss) | | (12,694 | ) | 37,393 | | 1,334,501 | | 1,561,476 | |
Net income (loss) | | (17,892 | ) | 52,809 | | 1,851,278 | | 2,185,008 | |
Basic and diluted earnings (loss) per unit | | (1.64 | ) | 4.83 | | 169.21 | | 199.71 | |
| | | | | | | | | | | | | |
The above quarterly financial data is unaudited, but in the opinion of management, all adjustments necessary for a fair presentation of the selected data for these periods presented have been included.
59
REPORT OF INDEPENDENT REGISTERED PUBLIC ACCOUNTING FIRM ON
SUPPLEMENTARY INFORMATION
Board of Directors
Little Sioux Corn Processors, LLC and Subsidiary
Marcus, Iowa
Our report on our audits of the consolidated financial statements of Little Sioux Corn Processors, LLC and Subsidiary for the fiscal years ended September 30, 2005, 2004, and 2003 appears on page 42. Those audits were conducted for the purpose of forming an opinion on the consolidated financial statements taken as a whole. The supplementary information on pages 61 through 65 is presented for the purposes of additional analysis and is not a required part of the basic consolidated financial statements. Such information has not been subjected to the auditing procedures applied in the audits of the consolidated financial statements and, accordingly, we express no opinion on it.
| /s/ Boulay, Heutmaker, Zibell & Co. P.L.L.P. | |
| |
Certified Public Accountants | |
Minneapolis, Minnesota
October 28, 2005
60
LITTLE SIOUX CORN PROCESSORS, LLC AND SUBSIDIARY
Consolidating Balance Sheet
| | September 30 | |
| | 2005 | | 2004 | |
| | LSCP, LLLP | | Little Sioux Corn
Processors, LLC | | Eliminations | | Consolidated | | Consolidated | |
| | | | | | | | | | | |
ASSETS | | | | | | | | | | | |
| | | | | | | | | | | |
Current Assets | | | | | | | | | | | |
Cash and equivalents | | $ | 14,132,434 | | $ | 3,520 | | $ | — | | $ | 14,135,954 | | $ | 3,907,380 | |
Restricted cash | | — | | — | | — | | — | | 2,730,481 | |
Short-term investments | | 6,987,420 | | — | | — | | 6,987,420 | | — | |
Trade accounts receivable, less allowance for doubtful accounts of $20,000 | | 2,518,278 | | — | | — | | 2,518,278 | | 2,335,023 | |
Other receivables | | 208,502 | | — | | (23,456 | ) | 185,046 | | 400,553 | |
Inventory | | 1,346,217 | | — | | — | | 1,346,217 | | 2,084,604 | |
Derivative instruments | | 566,609 | | — | | — | | 566,609 | | — | |
Prepaid expenses | | 1,008,754 | | — | | — | | 1,008,754 | | 488,885 | |
Total current assets | | 26,768,214 | | 3,520 | | (23,456 | ) | 26,748,278 | | 11,946,926 | |
| | | | | | | | | | | |
Property and Equipment | | | | | | | | | | | |
Land | | 2,762,708 | | — | | — | | 2,762,708 | | 2,753,225 | |
Building | | 15,768,603 | | — | | — | | 15,768,603 | | 15,061,750 | |
Processing equipment | | 32,910,303 | | — | | — | | 32,910,303 | | 28,226,013 | |
Grain handling equipment | | 5,264,448 | | — | | — | | 5,264,448 | | 5,172,406 | |
Rail and other equipment | | 1,342,950 | | — | | — | | 1,342,950 | | 1,214,322 | |
Furniture and fixtures | | 195,298 | | — | | — | | 195,298 | | 160,042 | |
Construction in progress | | 713,898 | | — | | — | | 713,898 | | — | |
| | 58,958,208 | | — | | — | | 58,958,208 | | 52,587,758 | |
Less accumulated depreciation | | 8,829,771 | | — | | — | | 8,829,771 | | 5,051,631 | |
Net property and equipment | | 50,128,437 | | — | | — | | 50,128,437 | | 47,536,127 | |
| | | | | | | | | | | |
Other Assets | | | | | | | | | | | |
Long-term investments | | 48,000 | | — | | — | | 48,000 | | — | |
Investment in LP | | — | | 30,188,087 | | (30,188,087 | ) | — | | — | |
Loan costs | | 237,641 | | — | | — | | 237,641 | | 345,151 | |
Total other assets | | 285,641 | | 30,188,087 | | (30,188,087 | ) | 285,641 | | 345,151 | |
| | | | | | | | | | | |
Total Assets | | $ | 77,182,292 | | $ | 30,191,607 | | $ | (30,211,543 | ) | $ | 77,162,356 | | $ | 59,828,204 | |
See Report of Independent Registered Public Accounting Firm on Supplementary Information.
61
LITTLE SIOUX CORN PROCESSORS, LLC AND SUBSIDIARY
Consolidating Balance Sheet
| | September 30 | |
| | 2005 | | 2004 | |
| | LSCP, LLLP | | Little Sioux Corn
Processors, LLC | | Eliminations | | Consolidated | | Consolidated | |
| | | | | | | | | | | |
LIABILITIES AND EQUITY | | | | | | | | | | | |
| | | | | | | | | | | |
Current Liabilities | | | | | | | | | | | |
Revolving promissory note | | $ | — | | $ | — | | $ | — | | $ | — | | $ | 38,829 | |
Current maturities of long-term debt | | 4,005,714 | | — | | — | | 4,005,714 | | 3,109,676 | |
Trade accounts payable | | 968,667 | | 23,456 | | (23,456 | ) | 968,667 | | 1,337,513 | |
Derivative instruments | | — | | — | | — | | — | | 181,579 | |
Accrued liabilities | | 5,669,935 | | — | | — | | 5,669,935 | | 298,851 | |
Total current liabilities | | 10,644,316 | | 23,456 | | (23,456 | ) | 10,644,316 | | 4,966,448 | |
| | | | | | | | | | | |
Long-Term Debt, net of current maturities | | 16,092,315 | | — | | — | | 16,092,315 | | 19,572,989 | |
| | | | | | | | | | | |
Deferred compensation | | 48,000 | | — | | — | | 48,000 | | — | |
| | | | | | | | | | | |
Commitments and Contingencies | | | | | | | | | | | |
| | | | | | | | | | | |
Minority Interest | | — | | — | | 20,209,574 | | 20,209,574 | | 14,207,003 | |
| | | | | | | | | | | |
Members’ Equity | | | | | | | | | | | |
Member contributions | | 26,752,215 | | 10,842,237 | | (26,752,215 | ) | 10,842,237 | | 10,842,237 | |
Retained earnings | | 23,645,446 | | 19,325,914 | | (23,645,446 | ) | 19,325,914 | | 10,239,527 | |
| | 50,397,661 | | 30,168,151 | | (50,397,661 | ) | 30,168,151 | | 21,081,764 | |
| | | | | | | | | | | |
Total Liabilities and Members’ Equity | | $ | 77,182,292 | | $ | 30,191,607 | | $ | (30,211,543 | ) | $ | 77,162,356 | | $ | 59,828,204 | |
See Report of Independent Registered Public Accounting Firm on Supplementary Information.
62
LITTLE SIOUX CORN PROCESSORS, LLC AND SUBSIDIARY
Consolidating Statement of Operations
| | Years Ended September 30 | |
| | 2005 | | 2004 | | 2003 | |
| | LSCP, LLLP | | Little Sioux Corn
Processors, LLC | | Eliminations | | Consolidated | | Consolidated | | Consolidated | |
| | | | | | | | | | | | | |
Revenue | | $ | 95,881,420 | | $ | — | | $ | — | | $ | 95,881,420 | | $ | 85,540,934 | | $ | 31,814,299 | |
| | | | | | | | | | | | | |
Cost of Goods Sold | | 61,966,890 | | — | | — | | 61,966,890 | | 71,244,909 | | 27,462,277 | |
| | | | | | | | | | | | | |
Gross Profit | | 33,914,530 | | — | | — | | 33,914,530 | | 14,296,025 | | 4,352,022 | |
| | | | | | | | | | | | | |
Operating Expenses | | 5,800,000 | | 124,998 | | — | | 5,924,998 | | 6,138,653 | | 2,660,909 | |
| | | | | | | | | | | | | |
Operating Income | | 28,114,530 | | (124,998 | ) | — | | 27,989,532 | | 8,157,372 | | 1,691,113 | |
| | | | | | | | | | | | | |
Other Income (Expense) | | | | | | | | | | | | | |
Income from subsidiary | | — | | 14,223,681 | | (14,223,681 | ) | — | | — | | — | |
Interest income and other | | 158,761 | | — | | — | | 158,761 | | 7,557 | | — | |
Interest expense | | (1,126,101 | ) | — | | — | | (1,126,101 | ) | (1,439,020 | ) | (847,223 | ) |
CCC Bio-Energy income | | 172,850 | | — | | — | | 172,850 | | 6,645,512 | | 5,535,733 | |
Grants and other income (expense), net | | (3,674,594 | ) | 18 | | — | | (3,674,576 | ) | 146,091 | | 612,206 | |
Total other income (expense), net | | (4,469,084 | ) | 14,223,699 | | (14,223,681 | ) | (4,469,066 | ) | 5,360,140 | | 5,300,716 | |
| | | | | | | | | | | | | |
Net Income Before Minority Interest | | 23,645,446 | | 14,098,701 | | (14,223,681 | ) | 23,520,466 | | 13,517,512 | | 6,991,829 | |
| | | | | | | | | | | | | |
Minority Interest in Subsidiary Income | | — | | — | | 9,421,765 | | 9,421,765 | | 5,663,681 | | 2,920,676 | |
| | | | | | | | | | | | | |
Net Income | | $ | 23,645,446 | | $ | 14,098,701 | | $ | (23,645,446 | ) | $ | 14,098,701 | | $ | 7,853,831 | | $ | 4,071,153 | |
See Report of Independent Registered Public Accounting Firm on Supplementary Information.
63
LITTLE SIOUX CORN PROCESSORS, LLC AND SUBSIDIARY
Consolidated Schedule of Grain Purchases
License No. GD-5050
| | September 30
2005 | | September 30
2004 | |
| | | | | |
Grain purchases (in bushels) | | 17,450,845 | | 17,294,817 | |
64
LITTLE SIOUX CORN PROCESSORS, LLC AND SUBSIDIARY
Consolidated Schedule of Corn Payables
License No. GD-5050
| | September 30, 2005 | |
| | Bushels | | Price | |
| | | | | |
Deferred payment contract - corn | | 7,037 | | | |
| | | | | |
Corn payables | | 311,999 | | $ | 1.71 | |
| | | | | | |
See Report of Independent Registered Public Accounting Firm on Supplementary Information.
65
ITEM 9. CHANGES IN AND DISAGREEMENTS WITH ACCOUNTANTS ON ACCOUNTING AND FINANCIAL DISCLOSURES.
Boulay, Heutmaker, Zibell & Co., P.L.L.P. has been our independent auditor since the Company’s inception and is the Company’s independent auditor at the present time. The Company has had no disagreements with its auditors.
ITEM 9A. CONTROLS AND PROCEDURES.
Our management, including our President and Chief Executive Officer (the principal executive officer), Stephen Roe, along with our Chief Financial Officer (the principal financial officer), Gary Grotjohn, have reviewed and evaluated the effectiveness of our disclosure controls and procedures (as defined in Rule 13a-15(e) under the Securities Exchange Act of 1934, as amended) as of September 30, 2005. Based upon this review and evaluation, these officers have concluded that our disclosure controls and procedures are effective to ensure that information required to be disclosed in the reports that we file or submit under the Exchange Act is recorded, processed, summarized and reported within the time periods required by the forms and rules of the Securities and Exchange Commission; and to ensure that the information required to be disclosed by an issuer in the reports that it files or submits under the Exchange Act is accumulated and communicated to our management including our principal executive and principal financial officers, or persons performing similar functions, as appropriate to allow timely decisions regarding required disclosure.
Our management, including our principal executive officer and principal financial officer, have reviewed and evaluated any changes in our internal control over financial reporting that occurred as of September 30, 2005 and there has been no change that has materially affected or is reasonably likely to materially affect our internal control over financial reporting.
ITEM 9B. OTHER INFORMATION.
None.
PART III.
ITEM 10. DIRECTORS AND EXECUTIVE OFFICERS OF THE REGISTRANT
The information required by this Item is incorporated by reference to the definitive proxy statement for our 2006 Annual Meeting of Members to be filed with the Securities and Exchange Commission within 120 days after the end of our 2005 fiscal year. This proxy statement is referred to in this report as the 2006 Proxy Statement.
ITEM 11. EXECUTIVE COMPENSATION
The information required by this Item is incorporated by reference to the 2006 Proxy Statement.
ITEM 12. SECURITY OWNERSHIP OF CERTAIN BENEFICIAL OWNERS AND MANAGEMENT AND RELATED MEMBER MATTERS
The information required by this Item is incorporated by reference to the 2006 Proxy Statement.
ITEM 13. CERTAIN RELATIONSHIPS AND RELATED TRANSACTIONS
The information required by this Item is incorporated by reference to the 2006 Proxy Statement.
66
ITEM 14. PRINCIPAL ACCOUNTING FEES AND SERVICES
The information required by this Item is incorporated by reference to the 2006 Proxy Statement.
PART IV.
ITEM 15. EXHIBITS, FINANCIAL STATEMENT SCHEDULES.
The following exhibits and financial statements are filed as part of, or are incorporated by reference into, this report:
(1) Financial Statements – Reference is made to the “Index to Financial Statements” of Little Sioux Corn Processors, LLC located under Part II Item 8 of this report for a list of the financial statements and schedules for the fiscal year ended September 30, 2005 included herein.
(2) All supplemental schedules are omitted because of the absence of conditions under which they are required or because the information is shown in the Consolidated Financial Statements or notes thereto.
(3) The exhibits we have filed herewith or incorporated by reference herein are identified in the Exhibit Index set forth below.
(b) See Item 15(a)(3).
(c) Not applicable.
The following exhibits are filed as part of this report. Exhibits previously filed are incorporated by reference, as noted.
Exhibit No. | | Exhibit |
| | |
3.1 | | Articles of Organization of the registrant. Filed as Exhibit 2.1 to the registrant’s registration statement on Form 10-SB (Commission File 0001229899) and incorporated by reference herein. |
| | |
3.2 | | Second Amended and Restated Operating Agreement of the registrant. Filed as Exhibit 2.2 to the registrant’s registrations statement on Form 10-SB (Commission File 0001229899) and incorporated by reference herein. |
| | |
3.3 | | Certificate of Limited Partnership. Filed as Exhibit 2.3 to the registrant’s registration statement on Form 10-SB (Commission File 0001229899) and incorporated by reference herein. |
| | |
3.4 | | Limited Partnership Agreement. Filed as Exhibit 2.4 to the registrant’s registration statement on Form 10-SB (Commission File 0001229899) and incorporated by reference herein. |
| | |
10.1 | | Ethanol Marketing Agreement between Little Sioux Corn Processors, L.P. and Minnesota Corn Processors, L.L.C.* Filed as Exhibit 6.1 to the registrant’s registration statement on Form 10-SB (Commission File 0001229899) and incorporated by reference herein. |
| | |
10.2 | | Assignment of Ethanol Marketing Agreement between Little Sioux Corn Processors, L.P. and Minnesota Corn Processors, L.L.C. to Archer Daniels Midland Company. Filed as Exhibit 6.2 to the registrant’s registration statement on Form 10-SB (Commission File 0001229899) and incorporated by reference herein. |
| | |
10.3 | | Distillers Grain Marketing Agreement between Little Sioux Corn Processors, L.P. and |
67
| | Commodity Specialist Company*. Filed as Exhibit 6.3 to the registrant’s registration statement on Form 10-SB (Commission File 0001229899) and incorporated by reference herein. |
| | |
10.4 | | Design/Build Contract between Little Sioux Corn Processors, L.P. and Fagen, Inc.* Filed as Exhibit 6.4 to the registrant’s registration statement on Form 10-SB (Commission File 0001229899) and incorporated by reference herein. |
| | |
10.5 | | Construction Loan Agreement dated July 25, 2002 by and between LSCP, L.P. and First National Bank of Omaha. Filed as Exhibit 10.5 to the registrant’s Form 10-KSB filed on December 29, 2003 and incorporated by reference herein. |
| | |
10.6 | | First Amendment to Construction Loan Agreement dated April 29, 2003 by and between LSCP, L.P. and First National Bank of Omaha. Filed as Exhibit 10.6 to the registrant’s Form 10-KSB filed on December 29, 2003 and incorporated by reference herein. |
| | |
10.7 | | Second Amendment to Construction Loan Agreement dated June 1, 2003 by and between LCSP, L.P. and First National Bank of Omaha. Filed as Exhibit 10.7 to the registrant’s Form 10-KSB filed on December 29, 2003 and incorporated by reference herein. |
| | |
10.8 | | Third Amendment to Construction Loan Agreement dated June 23, 2003 by and between LCSP, L.P. and First National Bank of Omaha. Filed as Exhibit 10.9 to the registrant’s Form 10-KSB filed on December 29, 2003 and incorporated by reference herein. |
| | |
10.9 | | Revolving Promissory Note dated June 23, 2003 between LSCP, L.P. and First National Bank of Omaha. Filed as Exhibit 10.9 to the registrant’s Form 10-KSB filed on December 29, 2003 and incorporated by reference herein. |
| | |
10.10 | | Term Note #2 dated June 23, 2003 between LSCP, L.P. and First National Bank of Omaha. Filed as Exhibit 10.10 to the registrant’s Form 10-KSB filed on December 29, 2003 and incorporated by reference herein. |
| | |
10.11 | | Term Note #3 dated June 23, 2003 between LSCP, L.P. and First National Bank of Omaha. Filed as Exhibit 10.11 to the registrant’s Form 10-KSB filed on December 29, 2003 and incorporated by reference herein. |
| | |
10.12 | | Term Note #4 dated June 23, 2003 between LSCP, L.P. and First National Bank of Omaha. Filed as Exhibit 10.12 to the registrant’s Form 10-KSB filed on December 29, 2003 and incorporated by reference herein. |
| | |
10.13 | | Agreement Between Owner and Design/Builder on the Basis of a Stipulated Price. Filed as Exhibit 10.2 to the registrant’s Form 10-Q filed on February 14, 2005 and incorporated by reference herein. |
| | |
10.14 | | Sixth Amendment to Construction Loan Agreement (Term Note #5). Filed as Exhibit 10.2 to the registrant’s Form 10-Q filed on February 14, 2005 and incorporated by reference herein. |
| | |
10.15 | | LSCP, LLLP Deferred Bonus Compensation Plan. Filed as Exhibit 10.1 to the registrant’s Form 10-Q filed on August 15, 2005 and incorporated by reference herein. |
| | |
14.1 | | Code of Ethics of Little Sioux Corn Processors, L.L.C. adopted December 18, 2003. Filed as Exhibit 14.1 to the registrant’s Form 10-KSB filed on December 29, 2003 and incorporated by reference herein. |
| | |
31.1 | | Certificate Pursuant to 17 CFR 240.13a-14(a) |
68
31.2 | | Certificate Pursuant to 17 CFR 240.13a-14(a) |
| | |
32.1 | | Certificate Pursuant to 18 U.S.C. Section 1350 |
| | |
32.2 | | Certificate Pursuant to 18 U.S.C. Section 1350 |
*Material has been omitted pursuant to a request for confidential treatment and such materials have been filed separately with the Securities and Exchange Commission.
SIGNATURES
Pursuant to the requirements of Section 13 or 15(d) of the Securities Exchange Act of 1934, the registrant duly caused this report to be signed on its behalf by the undersigned, thereunto duly authorized.
| | LITTLE SIOUX CORN PROCESSORS, L.L.C. |
| | |
| | |
Date: | December 28, 2005 | | /s/ Stephen Roe |
| | Stephen Roe |
| | President and Chief Executive Officer
(Principal Executive Officer) |
| | |
| | |
Date: | December 28, 2005 | | /s/ Gary Grotjohn |
| | Gary Grotjohn |
| | Chief Financial Officer
(Principal Financial and Accounting Officer) |
Pursuant to the requirements of the Securities Exchange Act, this report has been signed below by the following persons on behalf of the registrant and in the capacities and on the dates indicated.
Date: December 28, 2005 | /s/ Vince Davis | |
| Vince Davis, Director | |
| | |
| | |
Date: December 28, 2005 | /s/ Doug Lansink | |
| Doug Lansink, Director | |
| | |
| | |
Date: December 28, 2005 | /s/ Ron Wetherell | |
| Ron Wetherell,Chairman and Director | |
| | |
| | |
Date: December 28, 2005 | /s/ Darrell Downs | |
| Darrell Downs, Director | |
| | |
| | |
Date: December 28, 2005 | /s/ Myron Pingel | |
| Myron Pingel, Vice Chairman and Director | |
69
Date: December 28, 2005 | /s/ Verdell Johnson | |
| Verdell Johnson, Director | |
70