As filed with the Securities and Exchange Commission on February 6, 2023
UNITED STATES
SECURITIES AND EXCHANGE COMMISSION
WASHINGTON, D.C. 20549
FORM N-CSR
CERTIFIED SHAREHOLDER REPORT OF REGISTERED MANAGEMENT
INVESTMENT COMPANIES
Investment Company Act file number 811-21650
ASA GOLD AND PRECIOUS METALS LIMITED
Three Canal Plaza, Suite 600
Portland, ME 04101
Karen Shaw, Principal Financial Officer
Three Canal Plaza, Suite 600
Portland, Maine 04101
207-347-2000
Date of fiscal year end: November 30
Date of reporting period: December 1 – November 30
ITEM 1. REPORT TO STOCKHOLDERS.

Annual Report and Financial Statements
November 30, 2022
A Closed-End Fund
Specializing in Gold and Other
Precious Metals Investments
ASA Gold and Precious Metals Limited
Annual Report and Financial Statements
November 30, 2022
Table of Contents
Dear Shareholder,
Fiscal year 2022 was another volatile year for the gold price and precious metals equities. The year got off to a strong start with a significant move higher in both the gold price and the prices of precious metal equities. The geopolitical turmoil, driven by the war in Ukraine, sent the gold price to the high for the year of $2,070/oz in March. Precious metal equity prices peaked a month later in April, propelled higher by a broad equity market rally the prior month. After fiscal Q1, the gold price and associated equities fell sharply as the Federal Reserve (the “Fed”) started to aggressively raise interest rates. The price of gold came under significant pressure as yields on government bonds rose. The 10-year real rates, that is 10-year bond yields net of 10-year inflation expectations, increased from below -1.1% early in the year to at some point over +1.7% later in the year. Precious metal miners suffered from both challenging revenue and cost environments: top-line revenue was under pressure due to lower metal prices; on the cost side, the much-discussed global inflation also impacted miners. These factors contributed to a deterioration in earnings and company share prices.
The gold price bounced three times off the ~$1,620/oz level between September and November before heading higher to end the fiscal year at $1,769/oz. The move higher in the price of gold coincided with a decline in the dollar and real yields. The NYSE Arca Gold Miners Index (the “Index”) bottomed with the broader market in September. Subsequently, the Index rallied into year-end along with the gold price. During the year, the gold price varied $455/oz from the March high to the November low. After a volatile year, the price of gold ended the fiscal year relatively unchanged, declining a mere 0.3% over the year.
ASA Statistics for the Fiscal year 2022:
| • | ASA Gold and Precious Metals Limited (“ASA”, the “Fund” or the “Company”) reported a total return decrease of 32.3% based on its net asset value (“NAV”), compared to a total return decrease of 7.7% for the Index. The total return based on ASA’s share price for the fiscal year was a decrease of 31.0%. At 2022 fiscal year-end, the total net assets of ASA were $325 million, a decrease of $156 million compared to fiscal year-end 2021. |
| • | The Fund’s expense ratio increased to 1.00% for the 2022 fiscal year from 0.91% for the 2021 fiscal year, primarily due to the decrease in assets. |
| • | Separately, investment income decreased slightly to $2.6 million during the 2022 fiscal year from $2.7 million during the 2021 fiscal year. The decrease was primarily due to some of the producing companies in the portfolio having lower dividend payouts due to increased costs without offsetting higher revenue. |
| • | The discount of ASA’s share price to its NAV per share fluctuated from 18.5% to a low of 9.6% and ended the fiscal year at a discount of 15.5%. The Board of Directors of ASA and Merk Investments LLC (“Merk” or the “Adviser”) monitor the Company’s share price and discount to NAV per share on an ongoing basis. |
Fund Performance Discussion:
When Peter Maletis became ASA’s portfolio manager in the spring of 2019, the Fund was repositioned to have a more significant allocation to exploration and development companies (E&D). While this positioning was a source of outperformance in 2019, 2020, and 2021, it was a headwind in 2022. Although we saw an increase in the gold price at the tail end of 2022, E&D stocks did not outperform producing companies during this rally. The rally at the end of the fiscal year benefitted larger miners that have significant allocations in the passive ETFs tracking the sector. In our analysis, it is often the case that the largest companies in the sector move first as investors allocate capital to the most liquid investment available: the ETFs and large mining companies. In the past, investors tended to allocate capital to E&D companies in sustained gold price rallies and when M&A in the sector picks up. The current rally in the gold price is just two months old.
The following table shows that in our portfolio, producers outperformed E&D companies during the fiscal year 2022. The declining gold price and increasing cost structure of the precious metals mining industry led to tepid investor demand for E&D companies. We believe the declining demand resulted from the larger miners focusing on addressing the margin compression in their own business and not pursuing acquisitions of E&D companies. Also, E&D companies rely on capital markets to fund exploration and development work because they do not generate cash flow. This year saw a dearth of funding available in the sector. Without ample funding from the capital markets, some E&D companies resort to offering more attractive pricing to entice investors or pursue other sources of financing, thereby putting downward pressure on their share prices.
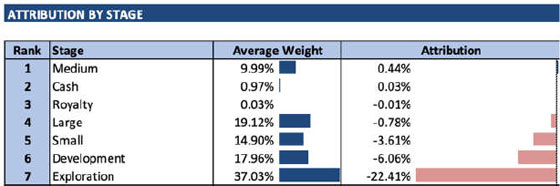
Large: annual production > 1,000,000 ounces
Medium: annual production 500,000 - 1,000,000 ounces
Small: annual production < 500,000 ounces
Attribution: a measure of the relative contribution to the performance
The sector ended the fiscal year with positive momentum in the gold price and the price of mining equities. The move higher coincided with what we assess as an improving macro environment for gold. The Fed has slowed the rate at which it is increasing the Federal Funds Rate, and we believe the market has priced in that the Fed could begin cutting rates as soon as 2023. Many leading economic indicators show that the economy is slowing, and a recession is likely in several countries around the globe. We believe that this data suggests we could move into a favorable economic environment for the gold price. The profligate fiscal spending, elevated debt levels globally, and slowing global growth contribute to our positive long-term outlook on gold prices and precious metal equities. We continue to pursue our strategy of allocating capital to what we assess to be the most attractive companies that can grow through exploration. Given the industry’s lack of investment in exploration and declining production, we believe this strategy will position our investors to generate an attractive return in a rising gold price environment.
We at Merk continue to wish everyone health and safety during this period of global uncertainty. As always, please reach out to us if you have any questions.
| Peter Maletis | James Holman | Axel Merk |
| Portfolio Manager | Portfolio Manager | Chief Investment Officer |
Forward-Looking Statements
This shareholder letter includes forward-looking statements, which involve known and unknown risks, uncertainties and other factors that may cause the actual results, levels of activity, performance or achievements of the Company, or industry results, to be materially different from any future results, levels of activity, performance or achievements expressed or implied by such forward-looking statements. The Company’s actual performance or results may differ from its beliefs, expectations, estimates, goals and projections, and consequently, investors should not rely on these forwardlooking statements as predictions of future events. Forward-looking statements are not historical in nature and generally can be identified by words such as “believe,” “anticipate,” “estimate,” “expect,” “intend,” “should,” “may,” “will,” “seek,” or similar expressions or their negative forms, or by references to strategy, plans, goals or intentions. The absence of these words or references does not mean that the statements are not forward-looking. The Company’s performance or results can fluctuate from month to month depending on a variety of factors, a number of which are beyond the Company’s control and/or are difficult to predict, including without limitation: the Company’s investment decisions, the performance of the securities in its investment portfolio, economic, political, market and financial factors, and the prices of gold, platinum and other precious minerals that may fluctuate substantially over short periods of time. The Company may or may not revise, correct or update the forward-looking statements as a result of new information, future events or otherwise.
The Company concentrates its investments in the gold and precious minerals sector. This sector may be more volatile than other industries and may be affected by movements in commodity prices triggered by international monetary and political developments. The Company is a non-diversified fund and, as such, may invest in fewer investments than that of a diversified portfolio. The Company may invest in smaller-sized companies that may be more volatile and less liquid than larger more established companies. Investments in foreign securities, especially those in the emerging markets, may involve increased risk as well as exposure to currency fluctuations. Shares of closed-end funds frequently trade at a discount to net asset value. All performance information reflects past performance and is presented on a total return basis. Past performance is no guarantee of future results. Current performance may differ from the performance shown.
This shareholder letter does not constitute an offer to sell or solicitation of an offer to buy any securities.
10-Year Performance Returns (Unaudited)
Comparison of Change in Value of a $10,000 Investment
ASA Gold and Precious Metals - Share Price and NYSE ARCA Gold Miners Index (NTR)(1)
The following chart reflects the change in the value of a hypothetical $10,000 investment, including reinvested dividends and distributions, in ASA Gold and Precious Metals, Ltd. (the “Company”) compared with the performance of the benchmark, NYSE ARCA Gold Miners Index (NTR), over the past ten fiscal years. The total return of the index includes the reinvestment of dividends and income. The total return of the Company includes operating expenses that reduce returns, while the total return of the indices do not include expenses. The Company is professionally managed, while the index is unmanaged and is not available for investment.

Fiscal Year Total Returns

| Best Quarter (NAV): | Q2 2020 | 80.11% |
| Worst Quarter (NAV): | Q2 2013 | -34.36% |
Average Annual Total Returns
| For the years ended November 30, 2022 | 1 Year | 3 Year | 5 Year | 10 Year |
| ASA Gold and Precious Metals - NAV | -32.34% | 4.55% | 6.10% | -3.17% |
| ASA Gold and Precious Metals - Share Price | -31.02% | 5.46% | 5.41% | -3.89% |
| NYSE ARCA Gold Miners Index (NTR)(1) | -7.68% | 3.47% | 6.38% | -3.78% |
The performance data quoted represent past performance and do not indicate future results. Current performance may be lower or higher than the performance data quoted. For more current performance data, please visit http://www.asaltd.com/investor-information/factsheets.
The results shown in the table reflect the reinvestment of income dividends and other distributions, if any. The results do not reflect the effect of taxes a shareholder would pay on Company distributions or on the sale of the Company’s common shares.
The investment return and market price will fluctuate and the Company’s common shares may trade at prices above or below NAV. The Company’s common shares, when sold, may be worth more or less than their original cost.
| (1) | The NYSE Arca Gold Miners Index (NTR) (the “Index”) is a net total return modified capitalization weighted index comprised of publicly traded companies primarily involved in the mining of gold and silver in locations around the world. The Company does not attempt to replicate the Index. The Index does not necessarily reflect investments in other precious metals companies (e.g., silver, platinum, and diamonds) in which the Company may invest. Data about the performance of the Index is prepared or obtained by Management and include reinvestment of all income dividends and other distributions, if any. The Fund may invest in securities not included in the Index and does not invest in all securities included in Index. |
For more complete information about the Company, please call us directly at 1-800-432-3378, or visit the Company’s website at www.asaltd.com.
Certain Investment Policies and Restrictions (Unaudited)
The following is a summary of certain of the Company’s investment policies and restrictions and is subject to the more complete statements contained in documents filed with the Securities and Exchange Commission.
The concentration of investments in a particular industry or group of industries. It is a fundamental policy (i.e., a policy that may be changed only by shareholder vote) of the Company that at least 80% of its total assets be (i) invested in common shares or securities convertible into common shares of companies engaged, directly or indirectly, in the exploration, mining or processing of gold, silver, platinum, diamonds or other precious minerals, (ii) held as bullion or other direct forms of gold, silver, platinum or other precious minerals, (iii) invested in instruments representing interests in gold, silver, platinum or other precious minerals such as certificates of deposit therefor, and/or (iv) invested in securities of investment companies, including exchange traded funds, or other securities that seek to replicate the price movement of gold, silver or platinum bullion. Compliance with the percentage limitation relating to the concentration of the Company’s investments will be measured at the time of investment. If investment opportunities deemed by the Company to be attractive are not available in the types of securities referred to above, the Company may deviate from the investment policy outlined in that paragraph and make temporary investments of unlimited amounts in securities issued by the U.S. Government, its agencies or instrumentalities or other high quality money market instruments.
The percentage of voting securities of any one issuer that the company may acquire. It is a non-fundamental policy (i.e., a policy that may be changed by the Board of Directors) of the Company that the Company shall not purchase a security if, at the time of purchase, more than 20% of the value of its total assets would be invested in securities of the issuer of such security.
Report of Independent Registered Public Accounting Firm
To the Board of Directors and Shareholders of ASA Gold and Precious Metals Limited
Opinion on the Financial Statements
We have audited the accompanying statement of assets and liabilities of ASA Gold and Precious Metals Limited (the “Company”), including the schedule of investments, as of November 30, 2022, the related statement of operations for the year then ended, statements of changes in net assets for each of the two years in the period then ended, and financial highlights for each of the five years in the period then ended, and the related notes (collectively referred to as the “financial statements”). In our opinion, the financial statements present fairly, in all material respects, the financial position of the Company as of November 30, 2022, the results of its operations for the year then ended, the changes in its net assets for each of the two years in the period then ended, and the financial highlights for each of the five years in the period then ended, in conformity with accounting principles generally accepted in the United States of America.
Basis for Opinion
These financial statements are the responsibility of the Company’s management. Our responsibility is to express an opinion on the Company’s financial statements based on our audit. We are a public accounting firm registered with the Public Company Accounting Oversight Board (United States) (“PCAOB”) and are required to be independent with respect to the Fund in accordance with the U.S. federal securities laws and the applicable rules and regulations of the Securities and Exchange Commission and the PCAOB. We have served as the Company’s auditor since 2012.
We conducted our audits in accordance with the standards of the PCAOB. Those standards require that we plan and perform the audits to obtain reasonable assurance about whether the financial statements are free of material misstatement, whether due to error or fraud. The Company is not required to have, nor were we engaged to perform, an audit of its internal control over financial reporting. As part of our audits we are required to obtain an understanding of internal control over financial reporting, but not for the purpose of expressing an opinion on the effectiveness of the Company’s internal control over financial reporting. Accordingly, we express no such opinion.
Our audits included performing procedures to assess the risks of material misstatement of the financial statements, whether due to error or fraud, and performing procedures that respond to those risks. Such procedures included examining, on a test basis, evidence regarding the amounts and disclosures in the financial statements. Our audits also included evaluating the accounting principles used and significant estimates made by management, as well as evaluating the overall presentation of the financial statements. Our procedures included confirmation of securities owned as of November 30, 2022 by correspondence with the custodians. We believe that our audits provide a reasonable basis for our opinion.

TAIT, WELLER & BAKER LLP
Philadelphia, Pennsylvania
January 25, 2023
Schedule of Investments
November 30, 2022
| Name of Company | | Shares | | | Value | | | % of Net
Assets |
| Common Shares |
| Gold mining, exploration, development and royalty companies | | | | | | | | | | | | |
| Australia | | | | | | | | | | | | |
| Alicanto Minerals, Ltd. (1) | | | 38,000,004 | | | $ | 1,470,173 | | | | 0.5 | % |
| Barton Gold Holdings, Ltd. (1) | | | 8,600,000 | | | | 1,021,518 | | | | 0.3 | |
| Bellevue Gold, Ltd. (1) | | | 8,966,667 | | | | 6,694,735 | | | | 2.1 | |
| Cygnus Gold, Ltd. (1) | | | 15,450,000 | | | | 5,243,342 | | | | 1.6 | |
| Emerald Resources NL (1) | | | 17,125,000 | | | | 13,134,657 | | | | 4.0 | |
| Los Cerros, Ltd. (1) | | | 30,625,000 | | | | 831,468 | | | | 0.2 | |
| Pantoro, Ltd. (1) | | | 16,000,000 | | | | 1,303,200 | | | | 0.4 | |
| Perseus Mining, Ltd. | | | 10,000,000 | | | | 15,136,120 | | | | 4.6 | |
| Predictive Discovery, Ltd. (1) | | | 81,850,000 | | | | 11,666,690 | | | | 3.6 | |
| Prodigy Gold NL (1) | | | 116,250,000 | | | | 867,951 | | | | 0.3 | |
| | | | | | | | 57,369,854 | | | | 17.6 | |
| Canada | | | | | | | | | | | | |
| Agnico Eagle Mines, Ltd. | | | 195,000 | | | | 9,822,150 | | | | 3.0 | |
| Alamos Gold, Inc. | | | 1,150,000 | | | | 11,155,000 | | | | 3.4 | |
| American Pacific Mining Corp. 144A (1)(2) | | | 3,000,000 | | | | 1,003,605 | | | | 0.3 | |
| Angel Wing Metals, Inc. (1) | | | 7,900,000 | | | | 616,660 | | | | 0.2 | |
| Atex Resources, Inc. (1) | | | 1,350,000 | | | | 602,163 | | | | 0.2 | |
| B2Gold Corp. | | | 2,000,000 | | | | 6,960,000 | | | | 2.1 | |
| Barrick Gold Corp. | | | 650,000 | | | | 10,608,000 | | | | 3.3 | |
| Calibre Mining Corp. (1)(3) | | | 11,083,000 | | | | 7,415,307 | | | | 2.3 | |
| Desert Gold Ventures, Inc. (1) | | | 14,588,264 | | | | 759,156 | | | | 0.2 | |
| G Mining Ventures Corp. (1) | | | 23,265,947 | | | | 11,415,474 | | | | 3.5 | |
| GoGold Resources, Inc. (1) | | | 2,857,140 | | | | 4,163,100 | | | | 1.3 | |
| Gold Mountain Mining Corp. (1) | | | 4,398,500 | | | | 539,533 | | | | 0.2 | |
| HighGold Mining, Inc. (1) | | | 3,000,000 | | | | 1,795,339 | | | | 0.6 | |
| Lahontan Gold Corp. (1) | | | 4,500,000 | | | | 234,175 | | | | 0.1 | |
| Liberty Gold Corp. (1) | | | 12,482,000 | | | | 3,804,497 | | | | 1.1 | |
| Lotus Gold Corp. (1)(4) | | | 4,400,000 | | | | 1,439,245 | | | | 0.4 | |
| Marathon Gold Corp. (1) | | | 6,389,200 | | | | 4,749,805 | | | | 1.5 | |
| Mawson Gold, Ltd. (1) | | | 10,600,000 | | | | 1,221,425 | | | | 0.4 | |
| Millennial Precious Metals Corp. (1) | | | 15,711,663 | | | | 2,219,244 | | | | 0.6 | |
| Monarch Mining Corp. (1) | | | 7,300,000 | | | | 352,749 | | | | 0.1 | |
| Newcore Gold, Ltd. (1) | | | 5,750,000 | | | | 790,804 | | | | 0.2 | |
| Nighthawk Gold Corp. (1) | | | 6,148,000 | | | | 1,599,673 | | | | 0.5 | |
| O3 Mining, Inc. (1) | | | 2,223,000 | | | | 2,528,484 | | | | 0.8 | |
| Orla Mining, Ltd. (1) | | | 7,200,000 | | | | 26,762,815 | | | | 8.2 | |
| Osino Resources Corp. (1) | | | 5,000,000 | | | | 3,159,499 | | | | 1.0 | |
| Prime Mining Corp. (1) | | | 6,450,000 | | | | 7,288,406 | | | | 2.2 | |
| Probe Metals, Inc. (1) | | | 7,087,500 | | | | 6,480,783 | | | | 2.0 | |
| Roscan Gold Corp. (1) | | | 10,886,900 | | | | 1,659,157 | | | | 0.5 | |
| Skeena Resources, Ltd. (1) | | | 700,000 | | | | 3,836,000 | | | | 1.2 | |
| Talisker Resources, Ltd. (1) | | | 12,500,000 | | | | 1,115,117 | | | | 0.4 | |
| TDG Gold Corp. (1) | | | 9,227,925 | | | | 1,577,833 | | | | 0.5 | |
| Thesis Gold, Inc. (1) | | | 7,400,000 | | | | 5,116,158 | | | | 1.6 | |
| Westhaven Gold Corp. (1) | | | 5,500,000 | | | | 1,594,618 | | | | 0.5 | |
| | | | | | | | 144,385,974 | | | | 44.4 | |
| Cayman Islands | | | | | | | | | | | | |
| Endeavour Mining PLC | | | 700,000 | | | | 14,857,079 | | | | 4.6 | |
| The notes to financial statements form an integral part of these statements. | 9 |
Schedule of Investments (continued)
November 30, 2022
| Name of Company | | Shares | | | Value | | | % of Net
Assets |
| Common Shares (continued) |
| Gold mining, exploration, development and royalty companies (continued) | | | | | | | | | | | | |
| South Africa | | | | | | | | | | | | |
| AngloGold Ashanti, Ltd. ADR | | | 500,000 | | | $ | 9,165,000 | | | | 2.8 | % |
| Gold Fields, Ltd. ADR | | | 600,000 | | | | 6,690,000 | | | | 2.1 | |
| | | | | | | | 15,855,000 | | | | 4.9 | |
| United States | | | | | | | | | | | | |
| SSR Mining, Inc. | | | 800,000 | | | | 12,121,980 | | | | 3.7 | |
| Total gold mining, exploration, development and royalty companies (Cost $186,121,290) | | | | | | | 244,589,887 | | | | 75.2 | |
| Diversified metals mining, exploration, development and royalty companies | | | | | | | | | | | | |
| Australia | | | | | | | | | | | | |
| Auteco Minerals, Ltd. (1) | | | 82,000,750 | | | | 3,116,847 | | | | 1.0 | |
| Bellavista Resources ltd (1) | | | 1,625,000 | | | | 319,861 | | | | 0.1 | |
| Castile Resources, Ltd. (1) | | | 15,143,255 | | | | 1,284,810 | | | | 0.4 | |
| Genesis Minerals, Ltd. (1) | | | 1,166,934 | | | | 1,013,832 | | | | 0.3 | |
| Geopacific Resources, Ltd. (1) | | | 17,857,143 | | | | 593,906 | | | | 0.2 | |
| Red Dirt Metals, Ltd. (1)(3) | | | 11,338,600 | | | | 4,348,281 | | | | 1.3 | |
| | | | | | | | 10,677,537 | | | | 3.3 | |
| Canada | | | | | | | | | | | | |
| Adventus Mining Corp. (1) | | | 5,310,000 | | | | 1,973,758 | | | | 0.6 | |
| Americas Gold & Silver Corp. (1) | | | 4,601,400 | | | | 2,206,331 | | | | 0.6 | |
| Arizona Metals Corp. (1) | | | 2,500,000 | | | | 7,322,603 | | | | 2.3 | |
| Aya Gold & Silver, Inc. (1) | | | 2,300,000 | | | | 14,157,529 | | | | 4.4 | |
| Benchmark Metals, Inc. (1) | | | 15,384,615 | | | | 4,346,098 | | | | 1.3 | |
| Bunker Hill Mining Corp. (1) | | | 19,214,957 | | | | 2,214,116 | | | | 0.7 | |
| Emerita Resources Corp. (1) | | | 2,750,000 | | | | 1,349,292 | | | | 0.4 | |
| Euro Sun Mining, Inc. (1) | | | 10,970,000 | | | | 611,642 | | | | 0.2 | |
| Huntsman Exploration, Inc. (1) | | | 6,175,000 | | | | 45,906 | | | | 0.0 | |
| Integra Resources Corp. (1) | | | 3,230,000 | | | | 2,096,394 | | | | 0.6 | |
| Max Resource Corp. (1) | | | 8,200,000 | | | | 1,889,752 | | | | 0.6 | |
| Pan Global Resources, Inc. (1) | | | 6,667,000 | | | | 2,106,438 | | | | 0.7 | |
| Sable Resources, Ltd. (1) | | | 26,160,000 | | | | 1,750,288 | | | | 0.5 | |
| | | | | | | | 42,070,147 | | | | 12.9 | |
| United States | | | | | | | | | | | | |
| Bendito Resources, Inc. 144A (1)(2)(4) | | | 4,288,000 | | | | 1,072,000 | | | | 0.3 | |
| Total diversified metals mining, exploration, development and royalty companies | | | | | | | | | | | | |
| (Cost $77,621,802) | | | | | | | 53,819,684 | | | | 16.5 | |
| Silver mining, exploration, development and royalty companies | | | | | | | | | | | | |
| Canada | | | | | | | | | | | | |
| Andean Precious Metals Corp. (1) | | | 2,000,000 | | | | 1,189,458 | | | | 0.4 | |
| Discovery Silver Corp. (1) | | | 7,154,545 | | | | 6,329,337 | | | | 1.9 | |
| Silver Mountain Resources, Inc. (1) | | | 10,000,000 | | | | 2,824,964 | | | | 0.9 | |
| Silver Tiger Metals, Inc. (1) | | | 12,395,333 | | | | 2,303,708 | | | | 0.7 | |
| | | | | | | | 12,647,467 | | | | 3.9 | |
| South Africa | | | | | | | | | | | | |
| Sibanye Stillwater, Ltd. ADR | | | 273,043 | | | | 3,060,812 | | | | 0.9 | |
| Total silver mining, exploration, development and royalty companies (Cost $13,103,848) | | | | | | | 15,708,279 | | | | 4.8 | |
| Total common shares (Cost $276,846,940 ) | | | | | | | 314,117,850 | | | | 96.5 | |
| 10 | The notes to financial statements form an integral part of these statements. |
Schedule of Investments (continued)
November 30, 2022
| Name of Company | | Shares | | | Value | | | % of Net
Assets |
| Rights (1)(4) |
| Silver mining, exploration, development and royalty companies | | | | | | | | | | | | |
| Canada | | | | | | | | | | | | |
| Pan American Silver Corp. (Exp. Date 2/22/29) | | | 393,200 | | | $ | 96,088 | | | | 0.0 | % |
| Total rights (Cost $136,720) | | | | | | | 96,088 | | | | 0.0 | |
| Warrants (1)(4) |
| Diversified metals mining, exploration, development and royalty companies | | | | | | | | | | | | |
| Australia | | | | | | | | | | | | |
Red Dirt Metals, Ltd. (Exercise Price $0.25, Exp. Date 11/18/24) | | | 2,834,650 | | | | 634,926 | | | | 0.2 | |
| Canada | | | | | | | | | | | | |
| Angel Wing Metals, Inc. (Exercise Price $0.40, Exp. Date 6/17/23) | | | 3,950,000 | | | | 0 | | | | 0.0 | |
| Aya Gold & Silver, Inc. (Exercise Price $3.30, Exp. Date 9/8/23) | | | 1,200,000 | | | | 4,549,678 | | | | 1.4 | |
| Benchmark Metals, Inc. (Exercise Price $0.65, Exp. Date 9/28/24) | | | 1,500,000 | | | | 33,454 | | | | 0.0 | |
| Bunker Hill Mining Corp. (Exercise Price $0.37, Exp. Date 4/1/25) | | | 5,000,000 | | | | 0 | | | | 0.0 | |
| Bunker Hill Mining Corp. (Exercise Price $0.50, Exp. Date 8/15/23) | | | 3,464,957 | | | | 0 | | | | 0.0 | |
| Bunker Hill Mining Corp. (Exercise Price $0.50, Exp. Date 8/15/23) | | | 9,500,000 | | | | 0 | | | | 0.0 | |
| Bunker Hill Mining Corp. (Exercise Price $0.60, Exp. Date 2/9/26) | | | 1,250,000 | | | | 0 | | | | 0.0 | |
| Emerita Resources Corp. (Exercise Price $1.50, Exp. Date 7/15/23) | | | 1,375,000 | | | | 10,222 | | | | 0.0 | |
| Euro Sun Mining, Inc. (Exercise Price $0.55, Exp. Date 6/5/23) | | | 5,500,000 | | | | 0 | | | | 0.0 | |
| Huntsman Exploration, Inc. (Exercise Price $0.35, Exp. Date 10/19/23) | | | 6,175,000 | | | | 0 | | | | 0.0 | |
| Max Resource Corp. (Exercise Price $0.85, Exp. Date 5/18/23) | | | 8,200,000 | | | | 0 | | | | 0.0 | |
| Sable Resources, Ltd. (Exercise Price $0.20, Exp. Date 9/10/23) | | | 11,000,000 | | | | 0 | | | | 0.0 | |
| | | | | | | | 4,593,354 | | | | 1.4 | |
Total diversified metals mining, exploration, development and royalty companies (Cost $1,647,759) | | | | | | | 5,228,280 | | | | 1.6 | |
| Gold mining, exploration, development and royalty companies | | | | | | | | | | | | |
| Canada | | | | | | | | | | | | |
| American Pacific Mining Corp. (Exercise Price $1.40, Exp. Date 12/10/23) | | | 1,500,000 | | | | 0 | | | | 0.0 | |
| Atex Resources, Inc. (Exercise Price $1.00, Exp. Date 8/31/25) | | | 675,000 | | | | 5,018 | | | | 0.0 | |
| Desert Gold Ventures, Inc. (Exercise Price $0.40, Exp. Date 8/28/23) | | | 6,700,000 | | | | 0 | | | | 0.0 | |
| Desert Gold Ventures, Inc. (Exercise Price $0.25, Exp. Date 12/31/24) | | | 594,132 | | | | 0 | | | | 0.0 | |
| G Mining Ventures Corp. (Exercise Price $1.90, Exp. Date 9/9/24) | | | 3,500,000 | | | | 52,039 | | | | 0.0 | |
| Gold Mountain Mining Corp. (Exercise Price $1.75, Exp. Date 4/21/24) | | | 2,200,000 | | | | 0 | | | | 0.0 | |
| Lahontan Gold Corp. (Exercise Price $0.65, Exp. Date 3/24/24) | | | 2,250,000 | | | | 0 | | | | 0.0 | |
| Lotus Gold Corp. (Exercise Price $0.75, Exp. Date 8/16/23) | | | 2,200,000 | | | | 32,710 | | | | 0.0 | |
| Marathon Gold Corp. (Exercise Price $1.35, Exp. Date 9/20/24) | | | 1,675,000 | | | | 174,330 | | | | 0.1 | |
| Millennial Precious Metals Corp. (Exercise Price $0.55, Exp. Date 6/16/24) | | | 1,689,165 | | | | 0 | | | | 0.0 | |
| Monarch Mining Corp. (Exercise Price $0.95, Exp. Date 4/6/27) | | | 1,700,000 | | | | 0 | | | | 0.0 | |
| Monarch Mining Corp. (Exercise Price $1.05, Exp. Date 6/29/23) | | | 2,500,000 | | | | 0 | | | | 0.0 | |
| Nighthawk Gold Corp. (Exercise Price $1.50, Exp. Date 7/7/23) | | | 2,174,000 | | | | 0 | | | | 0.0 | |
| Nighthawk Gold Corp. (Exercise Price $1.05, Exp. Date 5/3/24) | | | 900,000 | | | | 0 | | | | 0.0 | |
| Prime Mining Corp. (Exercise Price $1.10, Exp. Date 6/10/25) | | | 920,000 | | | | 410,363 | | | | 0.1 | |
| Prime Mining Corp. (Exercise Price $5.00, Exp. Date 4/27/24) | | | 400,000 | | | | 0 | | | | 0.0 | |
| TDG Gold Corp. (Exercise Price $0.75, Exp. Date 12/22/23) | | | 225,000 | | | | 0 | | | | 0.0 | |
| Westhaven Gold Corp. (Exercise Price $1.00, Exp. Date 2/4/23) | | | 2,750,000 | | | | 0 | | | | 0.0 | |
| | | | | | | | 674,460 | | | | 0.2 | |
| Total gold mining, exploration, development and royalty companies (Cost $2,006,709) | | | | | | | 674,460 | | | | 0.2 | |
| Silver mining, exploration, development and royalty companies | | | | | | | | | | | | |
| Canada | | | | | | | | | | | | |
| Silver Mountain Resources, Inc. (Exercise Price $0.50, Exp. Date 1/31/24) | | | 5,000,000 | | | | 37,171 | | | | 0.0 | |
| Silver Tiger Metals, Inc. (Exercise Price $0.50, Exp. Date 7/31/23) | | | 1,666,666 | | | | 0 | | | | 0.0 | |
| Total silver mining, exploration, development and royalty companies (Cost $260,869) | | | | | | | 37,171 | | | | 0.0 | |
| Total warrants (Cost $3,915,337) | | | | | | | 5,939,911 | | | | 1.8 | |
| The notes to financial statements form an integral part of these statements. | 11 |
Schedule of Investments (continued)
November 30, 2022
| Name of Company | | Shares | | | Value | | | % of Net
Assets |
| Money Market Fund |
| Federated US Treasury Cash Reserve Fund - Institutional Shares, 3.60% (5) | 4,912,863 | | | $ | 4,912,863 | | | | 1.5 | % |
| Total money market fund (Cost $4,912,863) | | | | | | | 4,912,863 | | | | 1.5 | |
| Investments, at value (Cost $285,811,860) | | | | | | | 325,066,712 | | | | 99.8 | |
| Cash, receivables and other assets less other liabilities | | | | | | | 505,917 | | | | 0.2 | |
| Net assets | | | | | | $ | 325,572,629 | | | | 100.0 | % |
| ADR | American Depositary Receipt |
| PLC | Public Limited Company |
| (1) | Non-income producing security. |
| (2) | Security exempt from registration under Rule 144A under the Securities Act of 1933. At year end, the value of these securities amounted to $2,075,605 or 0.6% of net assets. |
| (3) | Level 2 security. See Note 2 of Notes to Financial Statements. |
| (4) | Security fair valued in accordance with procedures adopted by the Board of Directors. At year end, the value of these securities amounted to $8,547,244 or 2.6% of net assets. |
| (5) | Dividend yield changes daily to reflect current market conditions. Rate was the quoted yield as of November 30, 2022. |
Portfolio Statistics (Unaudited)
November 30, 2022
| Australia | | | 21.1 | % |
| Canada | | | 62.8 | |
| Cayman Islands | | | 4.6 | |
| South Africa | | | 5.8 | |
| United States | | | 4.0 | |
| Cash | | | 1.7 | |
| | | | 100.0 | % |
*Geographic breakdown, which is based on company domiciles, is expressed as a percentage of total net assets including cash.
| 12 | The notes to financial statements form an integral part of these statements. |
Statement of Assets and Liabilities
November 30, 2022
| Assets | | | |
| Investments, at value (Cost $285,811,860) | | $ | 325,066,712 | |
| Cash | | | 78,459 | |
| Foreign currency (Cost $784,813) | | | 831,052 | |
| Dividends receivable, net of withholding taxes payable | | | 183,835 | |
| Prepaid expenses | | | 104,177 | |
| Total assets | | $ | 326,264,235 | |
| | | | | |
| Liabilities | | | | |
| Accrued investment adviser fees | | | 176,015 | |
| Accrued fund service fees | | | 26,519 | |
| Liability for retirement benefits due to retired directors | | | 379,242 | |
| Other expenses | | | 109,830 | |
| Total liabilities | | | 691,606 | |
| Net assets | | $ | 325,572,629 | |
| | | | | |
| Common shares $1 par value | | | | |
| Authorized: 40,000,000 shares | | | | |
| Issued and Outstanding: 19,289,905 shares | | $ | 19,289,905 | |
| Share premium (capital surplus) | | | 1,372,500 | |
| Distributable earnings | | | 304,910,224 | |
| Net assets | | $ | 325,572,629 | |
| Net asset value per share | | $ | 16.88 | |
The closing price of the Company’s shares on the New York Stock Exchange was $14.26 on November 30, 2022.
| The notes to financial statements form an integral part of these statements. | 13 |
Statement of Operations
For the year ended November 30, 2022
| Investment income | | | | |
Dividend income (net of withholding taxes of $592,116) | | $ | 2,550,038 | |
| Total investment income | | | 2,550,038 | |
| | | | | |
| Expenses | | | | |
| Investment adviser fees | | | 2,778,568 | |
| Fund services fees | | | 208,497 | |
| Compliance services fees | | | 80,532 | |
| Transfer agent fees | | | 63,615 | |
| Custodian fees | | | 125,708 | |
| Directors’ fees and expenses | | | 239,967 | |
| Retired directors’ fees | | | 74,996 | |
| Insurance fees | | | 125,012 | |
| Legal fees | | | 112,574 | |
| Audit fees | | | 35,000 | |
| Shareholder reports and proxy expenses | | | 39,898 | |
| Dues and listing fees | | | 25,000 | |
| Other expenses | | | 51,689 | |
| Total expenses | | | 3,961,056 | |
| Change in retirement benefits due to retired directors | | | 45,784 | |
| Investment adviser fees waived | | | (51,947 | ) |
| Net expenses | | | 3,954,893 | |
| Net investment loss | | | (1,404,855 | ) |
| | | | | |
| Net realized and unrealized gain (loss) from investments and foreign currency transactions | | | | |
| Proceeds from sales | | | 54,141,002 | |
| Cost of securities sold | | | (27,185,016 | ) |
| Net realized gain from investments | | | 26,955,986 | |
| Net realized gain (loss) from foreign currency transactions | | | | |
| Investments | | | (58,724 | ) |
| Foreign currency | | | (128,383 | ) |
| Net realized loss from foreign currency transactions | | | (187,107 | ) |
| Net increase in unrealized appreciation (depreciation) on investments | | | | |
| Balance, beginning of year | | | 220,598,062 | |
| Balance, end of year | | | 39,254,852 | |
| Net decrease in unrealized appreciation (depreciation) on investments | | | (181,343,210 | ) |
| Net unrealized gain on translation of assets and liabilities in foreign currency | | | 39,158 | |
| Net realized and unrealized loss from investments and foreign currency transactions | | | (154,535,173 | ) |
| Net decrease in net assets resulting from operations | | $ | (155,940,028 | ) |
| 14 | The notes to financial statements form an integral part of these statements. |
Statements of Changes in Net Assets
| | | Year Ended
November 30,
2022 | | | Year Ended
November 30,
2021 | |
| Net investment loss | | $ | (1,404,855 | ) | | $ | (1,687,120 | ) |
| Net realized gain | | | 26,955,986 | | | | 26,432,094 | |
| Net realized loss from foreign currency transactions | | | (187,107 | ) | | | (208,640 | ) |
| Net decrease in unrealized appreciation (depreciation) on investments | | | (181,343,210 | ) | | | (6,187,818 | ) |
| Net unrealized gain (loss) on translation of assets and liabilities in foreign currency | | | 39,158 | | | | (586 | ) |
| Net increase (decrease) in net assets resulting from operations | | | (155,940,028 | ) | | | 18,347,930 | |
| Dividends paid/payable | | | (385,798 | ) | | | (385,798 | ) |
| Net increase (decrease) in net assets | | | (156,325,826 | ) | | | 17,962,132 | |
| Net assets, beginning of year | | | 481,898,455 | | | | 463,936,323 | |
| Net assets, end of year | | $ | 325,572,629 | | | $ | 481,898,455 | |
| The notes to financial statements form an integral part of these statements. | 15 |
Notes to Financial Statements
Year ended November 30, 2022
1. Organization
ASA Gold and Precious Metals Limited (the “Company”) is a non-diversified, closed-end investment company registered under the Investment Company Act of 1940, as amended (the “1940 Act”).
The Company was initially organized as a public limited liability company in the Republic of South Africa in June 1958. On November 11, 2004, the Company’s shareholders approved a proposal to move the Company’s place of incorporation from the Republic of South Africa to the Commonwealth of Bermuda by reorganizing itself into an exempted limited liability company formed in Bermuda. The Company is registered with the Securities and Exchange Commission (the “SEC”) pursuant to an order under Section 7(d) of the 1940 Act.
The Company seeks long-term capital appreciation primarily through investing in companies engaged in the exploration for, development of projects or mining of precious metals and minerals. The Company is managed by Merk Investments LLC (the “Adviser”).
2. Summary of significant accounting policies
The following is a summary of the significant accounting policies:
A. Security valuation
The net asset value of the Company generally is determined as of the close of regular trading on the New York Stock Exchange (the “NYSE”) on the date for which the valuation is being made (the “Valuation Time”). Portfolio securities listed on U.S. and foreign stock exchanges generally are valued at the last reported sale price as of the Valuation Time on the exchange on which the securities are primarily traded, or the last reported bid price if a sale price is not available.
Pursuant to Rule 2a-5 under the Investment Company Act, the Company’s Board of Directors (the “Board”) has designated the Adviser, as defined in Note 4, as the Company’s valuation designee to perform any fair value determinations for securities and other assets held by the Company. The Adviser is subject to the oversight of the Board and certain reporting and other requirements intended to provide the Board the information needed to oversee the Adviser’s fair value determinations. The Adviser is responsible for determining the fair value of investments in accordance with policies and procedures that have been approved by the Board. Under these procedures, the Adviser convenes on a regular and ad hoc basis to review such investments and considers a number of factors, including valuation methodologies and unobservable inputs, when arriving at fair value. The Board has approved the Adviser’s fair valuation procedures as a part of the Company’s compliance program and will review any changes made to the procedures.
Securities traded over the counter are valued at the last reported sale price or the last reported bid price if a sale price is not available. Securities listed on foreign stock exchanges may be fair valued at a value other than the last reported sale price or last reported bid price based on significant events that have occurred subsequent to the close of the foreign markets. Shares of non-exchange traded open-end mutual funds are valued at net asset value (“NAV”). To value its warrants, the Company’s valuation designee typically utilizes the Black-Scholes model using the listed price for the underlying common shares. The valuation is a combination of value of the stock price less the exercise price, plus some value related to the volatility of the stock over the remaining time period prior to expiration.
Securities for which current market quotations are not readily available are valued at their fair value as determined in accordance with procedures approved by the Board. If a security is valued at a “fair value,” that value may be different from the last quoted price for the security. Various factors may be reviewed in order to make a good faith determination of a security’s fair value. These factors include, but are not limited to, the nature of the security; relevant financial or business developments of the issuer; actively traded similar or related securities; conversion rights on the security; and changes in overall market conditions.
The difference between cost and market value is reflected separately as net unrealized appreciation (depreciation) on investments. The net realized gain or loss from the sale of securities is determined for accounting purposes on the identified cost basis.
Notes to Financial Statements (continued)
Year ended November 30, 2022
2. Summary of significant accounting policies (continued)
B. Fair value measurement
In accordance with accounting principles generally accepted in the United States of America (“U.S. GAAP”), fair value is defined as the price that the Company would receive to sell an investment or pay to transfer a liability in a timely transaction with an independent buyer in the principal market, or in the absence of a principal market the most advantageous market for the investment or liability. U.S. GAAP establishes a three-tier hierarchy to distinguish between (1) inputs that reflect the assumptions market participants would use in pricing an asset or liability developed based on market data obtained from sources independent of the reporting entity (observable inputs) and (2) inputs that reflect the reporting entity’s own assumptions about the assumptions market participants would use in pricing an asset or liability developed based on the best information available in the circumstances (unobservable inputs) and to establish classification of fair value measurements for disclosure purposes. Various inputs are used in determining the value of the Company’s investments. The inputs are summarized in the three broad levels listed below.
| Level 1 – | Unadjusted quoted prices in active markets for identical assets or liabilities that the Company has the ability to access. |
| Level 2 – | Observable inputs other than quoted prices included in level 1 that are observable for the asset or liability either directly or indirectly. These inputs may include quoted prices for identical instruments on an inactive market, prices for similar investments, interest rates, prepayment speeds, credit risk, yield curves, default rates, and similar data. |
| Level 3 – | Unobservable inputs for the assets or liability to the extent that relevant observable inputs are not available, representing the Company’s own assumptions about the assumptions that a market participant would use in valuing the asset or liability, and that would be based on the best information available. |
The inputs or methodology used for valuing securities are not necessarily an indication of the risk associated with investing in those securities.
The following is a summary of the inputs used as of November 30, 2022 in valuing the Company’s investments at fair value:
Investment in Securities (1)
Measurements at November 30, 2022
| | | Level 1 | | | Level 2 | | | Level 3 | | | Total | |
| Common Stock | | | | | | | | | | | | |
| Gold mining, exploration, development and royalty companies | | $ | 235,735,335 | | | $ | 7,415,307 | | | $ | 1,439,245 | | | $ | 244,589,887 | |
| Diversified metals mining, exploration, development and royalty companies | | | 48,399,403 | | | | 4,348,281 | | | | 1,072,000 | | | | 53,819,684 | |
| Silver mining, exploration, development and royalty companies | | | 15,708,279 | | | | — | | | | — | | | | 15,708,279 | |
| Rights | | | | | | | | | | | | | | | | |
| Silver mining, exploration, development and royalty companies | | | — | | | | — | | | | 96,088 | | | | 96,088 | |
| Warrants | | | | | | | | | | | | | | | | |
| Diversified metals mining, exploration, development and royalty companies | | | — | | | | — | | | | 5,228,280 | | | | 5,228,280 | |
| Gold mining, exploration, development and royalty companies | | | — | | | | — | | | | 674,460 | | | | 674,460 | |
| Silver mining, exploration, development and royalty companies | | | — | | | | — | | | | 37,171 | | | | 37,171 | |
| Money Market Fund | | | 4,912,863 | | | | — | | | | — | | | | 4,912,863 | |
| Total Investments | | $ | 304,755,880 | | | $ | 11,763,588 | | | $ | 8,547,244 | | | $ | 325,066,712 | |
(1) See schedule of investments for country classifications.
Notes to Financial Statements (continued)
Year ended November 30, 2022
2. Summary of significant accounting policies (continued)
B. Fair value measurement (continued)
The following is a reconciliation of Level 3 investments for which significant unobservable inputs were used to determine fair value.
| | | Common Stock | | Rights | | Warrants |
| Balance November 30, 2021 | | $ | - | | | $ | 149,731 | | | $ | 22,342,769 | |
| Purchases | | | 2,389,179 | | | | - | | | | 1,596,118 | |
| Sales | | | - | | | | - | | | | (1,064,537 | ) |
| Realized loss | | | - | | | | - | | | | (772,820 | ) |
| Net change in unrealized appreciation (depreciation) | | | 122,066 | | | | (53,643 | ) | | | (16,161,619 | ) |
| Balance November 30, 2022 | | $ | 2,511,245 | | | $ | 96,088 | | | $ | 5,939,911 | |
| Net change in unrealized appreciation (depreciation) from investments held as of November 30, 2022* | | $ | 122,066 | | | $ | (53,643 | ) | | $ | (16,161,619 | ) |
* The change in unrealized appreciation/(depreciation) is included in net change in unrealized appreciation/(depreciation) of investments in the accompanying Statement of Operations.
Significant unobservable inputs developed by the valuation designee for Level 3 investments held at November 30, 2022 are as follows:
| Asset Categories | | Fair Value | | Valuation Technique(s) | | Unobservable Input | | Range (Weighted Average) |
| Common Shares1 | | $ | 2,511,245 | | | Transaction cost | | None | | None | |
| Rights2 | | | 96,088 | | | Market transaction | | Discount | | 70% (70%) | |
| Warrants3 | | | 5,939,911 | | | Black Scholes Method | | Volatility | | 20% - 50% (39%) | |
1 Fair valued common stocks with no public market are valued based on transaction cost and may be adjusted by the valuation designee, including for subsequent known market transactions.
2 Fair valued rights are valued based on the specifics of the rights at a discount to the market price of the underlying security.
3 Warrants are priced based on the Black Scholes Method; the key input to this method is modeled volatility of the investment; the lower the modeled volatility, the lower the valuation of the warrant.
C. Foreign Currency Translation
Portfolio securities and other assets and liabilities denominated in foreign currencies are translated into U.S. dollar amounts at the rate of exchange reported by independent data providers. Purchases and sales of investment securities and income and expense items denominated in foreign currencies are translated into U.S. dollar amounts on the respective dates of such transactions. The portion of the results arising from changes in the exchange rates and the portion due to fluctuations arising from changes in the market prices of securities are not isolated. The resulting net foreign currency gain or loss is included on the Statements of Operations. Realized foreign currency gains or losses arise from sales of foreign currencies, currency gains or losses realized between the trade and settlement dates on securities transactions and the difference between the amounts of dividends, interest, and foreign withholding taxes recorded on the Company’s books and the U.S. dollar equivalent of the amounts actually received or paid.
D. Securities Transactions and Investment Income
During the year ended November 30, 2022, sales and purchases of portfolio securities (other than temporary short-term investments) amounted to $54,141,002 and $52,746,627, respectively.
Notes to Financial Statements (continued)
Year ended November 30, 2022
2. Summary of significant accounting policies (continued)
D. Securities Transactions and Investment Income (continued)
As of November 30, 2022, a significant portion of the Company’s assets consisted of securities of junior and intermediate mining company issuers.
Dividend income is recorded on the ex-dividend date, net of withholding taxes or ADR fees, if any. Interest income is recognized on the accrual basis.
E. Dividends to Shareholders
Dividends to shareholders are recorded on the ex-dividend date. The reporting for financial statement purposes of dividends paid from net investment income and/or net realized gains may differ from their ultimate reporting for U.S. federal income tax purposes, primarily because of the separate line item reporting for financial statement purposes of foreign exchange gains or losses.
F. Use of Estimates
The preparation of the financial statements in conformity with U.S. GAAP requires management to make estimates and assumptions that affect amounts reported in the financial statements and accompanying notes. Actual results could differ from those estimates. It is management’s opinion that all adjustments necessary for a fair statement of the results of the interim periods presented have been made. All adjustments are of a normal recurring nature.
G. Basis of Presentation
The financial statements are presented in U.S. dollars. The Company is an investment company and accordingly follows the investment company accounting and reporting guidance of the Financial Accounting Standards Board (“FASB”) Accounting Standard Codification, Topic 946 “Financial Services - Investment Companies”.
H. Income Taxes
In accordance with U.S. GAAP requirements regarding accounting for uncertainties on income taxes, management has analyzed the Company’s tax positions taken on federal and state income tax returns, as applicable, for all open tax years (2019-2022). As of November 30, 2022, the Company has not recorded any unrecognized tax benefits. The Company’s policy, if it had unrecognized benefits, is to recognize accrued interest and penalties in operating expenses.
3. Tax status of the Company
The Company is a “passive foreign investment company” (“PFIC”) for U.S. federal income tax purposes and is not subject to Bermuda tax as an exempted limited liability company organized under the laws of Bermuda. Nor is the Company generally subject to U.S. federal income tax, since it is a non-U.S. corporation whose only business activity in the United States is trading in stocks or securities for its own account; under the U.S. federal tax law that activity does not constitute engaging in the conduct of a trade or business within the United States, even if its principal office is located therein. As a result, its gross income is not subject to U.S. federal income tax, though certain types of income it earns from U.S. sources (such as dividends of U.S. payors) are subject to U.S. federal withholding tax.
4. Fees and Expenses and Other Transactions with Affiliates
Investment Adviser - Merk Investments LLC (the “Adviser”) is the investment adviser to the Company. Pursuant to an investment advisory agreement, the Adviser receives an advisory fee, payable monthly, from the Company at an annual rate of 0.70% of the Company’s average daily net assets.
The Adviser voluntarily agreed to waive a portion of its advisory fee, equal to an annual rate of 0.05% of the Company’s net assets exceeding $300 million, and an additional 0.10% of the Company’s net assets exceeding $500 million. The Adviser waived $51,947 for the year ended November 30, 2022.
Other Service Providers - Apex US Holdings LLC (d/b/a Apex Fund Services) (“Apex”) provides fund accounting, fund administration and compliance services to the Company. The fees related to these services are included in fund services fees within the Statement of Operations. Apex also provides certain shareholder report production and EDGAR conversion and filing services. Pursuant to an Apex services agreement, the Company pays Apex customary fees for its services. Apex provides a Principal Financial Officer, as well as certain additional compliance support functions.
Foreside Fund Services, LLC, a wholly owned subsidiary of ACA Group, provides a Chief Compliance Officer to the Company.
Notes to Financial Statements (continued)
Year ended November 30, 2022
5. Exemptive order
The Company is a closed-end investment company and operates pursuant to an exemptive order issued by the Securities and Exchange Commission (the “SEC”) pursuant to Section 7(d) of the 1940 Act (the “Order”). The Order is conditioned upon, among other things, the Company complying with certain requirements relating to the custody of assets and settlement of securities transactions outside of the United States different than those required of other registered investment companies. These conditions make it more difficult for the Company to implement a flexible investment strategy and to fully achieve its desired portfolio diversification than if it were not subject to such requirements.
6. Retirement plans
The Company has recorded a liability for retirement benefits due to retired directors. The liability for these benefits at November 30, 2022 was $379,242. A director whose first election to the Board of Directors was prior to January 1, 2008 qualifies to receive retirement benefits if he has served the Company (and any of its predecessors) for at least twelve years prior to retirement. Directors first elected on or after January 1, 2008 are not eligible to participate in the plan.
7. Indemnifications
In the ordinary course of business, the Company enters into contracts that contain a variety of indemnification provisions. The Company’s maximum exposure under these arrangements is unknown.
8. Share repurchase
The Company may from time to time purchase its common shares at a discount to NAV on the open market in such amounts and at such prices as the Company may deem advisable.
The Company had 19,289,905 shares outstanding as of November 30, 2022. There were no repurchases during the year ended November 30, 2022.
9. Subsequent events
In accordance with U.S. GAAP provisions, management has evaluated the possibility of subsequent events existing in the Company’s financial statements through the date the financial statements were issued. Effective January 1, 2023, Jack Huntington was approved to replace James Nash as Chief Compliance Officer of the Company by the Board of Directors.
Financial Highlights
| | | Years Ended November 30, |
| Per share operating performance(1) | | 2022 | | 2021 | | 2020 | | 2019 | | 2018 |
| Net asset value, beginning of period | | $24.98 | | | $24.05 | | | $14.82 | | | $10.10 | | | $12.66 | |
| Net investment loss | | (0.07 | ) | | (0.09 | ) | | (0.13 | ) | | (0.06 | ) | | (0.07 | ) |
| Net realized gain (loss) from investments | | 1.40 | | | 1.37 | | | 1.83 | | | 0.09 | | | (0.47 | ) |
| Net realized gain (loss) from foreign currency transactions | | (0.01 | ) | | (0.01 | ) | | 0.05 | | | (0.06 | ) | | 0.01 | |
| Net increase (decrease) in unrealized appreciation on investments | | (9.40 | ) | | (0.32 | ) | | 7.50 | | | 4.77 | | | (2.00 | ) |
| Net unrealized gain on translation of assets and liabilities in foreign currency | | 0.00 | | | 0.00 | | | 0.00 | | | 0.00 | | | 0.00 | |
| Net increase (decrease) in net assets resulting from operations | | (8.08 | ) | | 0.95 | | | 9.25 | | | 4.74 | | | (2.53 | ) |
Dividends | | | | | | | | | | | | | | | |
| From net investment income | | — | | | — | | | (0.02 | ) | | (0.02 | ) | | (0.03 | ) |
| From net realized gain on investments | | (0.02 | ) | | (0.02 | ) | | — | | | — | | | — | |
| Net asset value, end of period | | $16.88 | | | $24.98 | | | $24.05 | | | $14.82 | | | $10.10 | |
| Market value per share, end of period | | $14.26 | | | $20.70 | | | $19.91 | | | $12.20 | | | $8.66 | |
| | | | | | | | | | | | | | | | |
Total investment return | | | | | | | | | | | | | | | |
| Based on market price (2) | | (31.02 | )% | | 4.06 | % | | 63.38 | % | | 41.14 | % | | (21.39 | )% |
| Based on net asset value (3) | | (32.34 | )% | | 3.96 | % | | 62.46 | % | | 47.01 | % | | (19.97 | )% |
| | | | | | | | | | | | | | | | |
Ratio of average net assets | | | | | | | | | | | | | | | |
| Expenses (4) | | 1.00 | % | | 0.94 | % | | 1.02 | % | | 1.38 | % | | 1.35 | % |
| Net expenses | | 1.00 | % | | 0.91 | % | | 1.02 | % | | 1.38 | % | | 1.35 | % |
| Net investment loss | | (0.36 | )% | | (0.35 | )% | | (0.67 | )% | | (0.44 | )% | | (0.63 | )% |
| | | | | | | | | | | | | | | | |
Supplemental data | | | | | | | | | | | | | | | |
| Net assets, end of Period (000 omitted) | | $325,573 | | | $481,898 | | | $463,936 | | | $285,879 | | | $194,834 | |
| Portfolio turnover rate | | 13 | % | | 17 | % | | 31 | % | | 45 | % | | 3 | % |
| Shares outstanding (000 omitted) | | 19,290 | | | 19,290 | | | 19,290 | | | 19,290 | | | 19,290 | |
| (1) | Per share amounts from operations have been calculated using the average shares method. |
| (2) | Total investment return is calculated assuming a purchase of shares at the current market price at close the day before and a sale at the current market price on the last day of each period reported. Dividends are assumed, for purposes of this calculation, to be reinvested at prices obtained under the Company’s dividend reinvestment plan. |
| (3) | Total investment return is calculated assuming a purchase of shares at the current net asset value at close the day before and a sale at the current net asset value on the last day of each period reported. Dividends are assumed, for purposes of this calculation, to be reinvested at prices obtained under the Company’s dividend reinvestment plan. |
| (4) | Reflects the expense ratio excluding any waivers and the change in retirement benefits due to retired directors. |
Certain Tax Information for U.S. Shareholders (Unaudited)
The Company is a “passive foreign investment company” (“PFIC”) for U.S. federal income tax purposes. In view of this, U.S. investors holding common shares in taxable accounts are strongly urged to review the important tax information regarding the consequences of an investment in the common shares of the Company, which may be found at www. asaltd.com under “Investor Information | Taxpayer Information - PFIC”. Due to the complexity and potentially adverse effect of the applicable tax rules, U.S. shareholders are strongly urged to consult their own tax advisors concerning the impact of these rules on their investment in the Company and on their individual situations, and any additional informational filing requirements.
Dividend Reinvestment and Stock Purchase Plan (Unaudited)
Computershare Trust Company, N.A. (“Computershare”) has been authorized by the Company to offer and administer the Computershare Investment Plan, a dividend reinvestment and stock purchase plan (“CIP”) to shareholders as well as new investors or non-shareholders. Shareholders and new investors may elect to participate in the CIP by signing an enrollment form or by going to www.computershare.com/investor and following the instructions. New investors or non-shareholders must include a minimum initial investment of at least $500. Computershare as agent will apply to the purchase of common shares of the Company in the open market (i) all cash dividends (after deduction of the service charge described below) that become payable to such participant on the Company’s shares (including shares registered in his or her name and shares accumulated under the CIP) and (ii) any optional cash purchases ($50 minimum, subject to an annual maximum of $250,000) received from such participant.
Computershare may combine CIP participant purchase requests with other purchase requests received from other CIP participants and may submit the combined purchase requests in bulk to Computershare’s broker as a single purchase order. Purchase requests may be combined, at Computershare’s discretion, according to one or more factors such as purchase type (e.g., dividend reinvestment, one-time ACH, check, etc.), request date, or request delivery method (e.g., online, regular mail, etc.). Computershare will submit bulk purchase orders to its broker as and when required under the terms of the CIP. Computershare’s broker may execute each bulk purchase order in one or more transactions over one or more days, depending on market conditions. Each participant whose purchase request is included in each bulk purchase order will receive the weighted average market price of all shares purchased by Computershare’s broker for such order. Any stock dividends or split shares distributed on shares held in the CIP will be credited to the participant’s account.
A one-time $10 enrollment fee to establish a new account for a new investor or non-shareholder will be deducted from the purchase amount. For each participant, each dividend reinvestment will entail a transaction fee of 5% of the amount reinvested, up to a maximum of $3 plus $0.03 per share purchased. Each optional cash purchase by check or one-time online bank debit will entail a transaction fee of $5 plus $0.03 per share purchased. If a participant has funds automatically deducted monthly from his or her savings or checking account, for each debit the transaction fee is $2.50 plus $0.03 per share purchased. Fees will be deducted from the purchase amount. Each batch order sale will entail a transaction fee of $15 plus $0.12 per share sold. Each market order sale will entail a transaction fee of $25 plus $0.12 per share sold. Fees are deducted from the proceeds derived from the sale. All per share fees include any brokerage commissions Computershare is required to pay. Any fractional share will be rounded up to a whole share for purposes of calculating the per share fee. Additional fees are charged by Computershare for specific shareholder requests such as copies of account statements for prior years ($10 per year requested) and a returned check and ACH reject fee of $25.
Participation in the CIP may be terminated by a participant at any time by written, telephone or Internet instructions to Computershare. Upon termination, a participant will receive a certificate for the whole number of shares credited to his or her account, unless he or she requests the sale of all or part of such shares. Dividends reinvested by a shareholder under the CIP will generally be treated for U.S. federal income tax purposes in the same manner as dividends paid to such shareholder in cash. See “Certain Tax Information for U.S. Shareholders” for more information regarding tax consequences of an investment in shares of the Company, including the effect of the Company’s status as a PFIC. The amount of the service charge is deductible for U.S. federal income tax purposes, subject to limitations.
To participate in the CIP, shareholders may not hold their shares in a “street name” brokerage account.
Additional information regarding the CIP may be obtained from Computershare, P.O. Box 505000, Louisville, KY 40233-5000. Information may also be obtained on the Internet at www.computershare.com/investor or by calling Computershare’s Telephone Response Center at (800) 317-4445 between 9:00 a.m. and 5:00 p.m., Eastern time, Monday through Friday.
Privacy Notice (Unaudited)
The Company is committed to protecting the financial privacy of its shareholders.
We do not share any nonpublic, personal information that we may collect about shareholders with anyone, including our affiliates, except to service and administer shareholders’ share accounts, to process transactions, to comply with shareholders’ requests of legal requirements or for other limited purposes permitted by law. For example, the Company may disclose a shareholder’s name, address, social security number and the number of shares owned to its administrator, transfer agent or other service providers in order to provide the shareholder with proxy statements, tax reporting forms, annual reports or other information about the Company. This policy applies to all of the Company’s shareholders and former shareholders.
We keep nonpublic personal information in a secure environment. We restrict access to nonpublic personal information to Company employees, agents and service providers who have a need to know the information based on their role in servicing or administering shareholders’ accounts. The Company also maintains physical, electronic and procedural safeguards to protect the confidentiality of nonpublic personal information.
Form N-PX/Proxy Voting (Unaudited)
The company files a list of its proxy votes with the SEC for the period of July 1 - June 30 of each year on Form N-PX. The policies and procedures used by the Company to determine how to vote proxies relating to portfolio securities and information regarding how the Company voted proxies relating to portfolio securities during the most recent twelve month period are available on the Company’s website at www.asaltd.com and on the SEC’s website at www.sec.gov. A written copy of the Company’s policies and procedures is available without charge, upon request, by calling (800) 432-3378.
Form N-PORT/Portfolio Holdings (Unaudited)
The Company files its complete schedule of portfolio holdings with the SEC for the first and third quarters of each fiscal year on Form N-PORT. The Company’s Forms N-PORT are available on the SEC’s website at www.sec.gov. The Company’s Forms N-PORT also may be reviewed and copied at the Reference Room in Washington, D.C.; information on the operation of the Public Reference Room may be obtained by calling 1-800-SEC-0330. The schedule of portfolio holdings on Form N-PORT also is included in the Company’s financial statements for the first and third quarters of each fiscal year which are available on the Company’s website at www.asaltd.com.
Share Repurchase (Unaudited)
Notice is hereby given in accordance with Section 23(c) of the 1940 Act that the Company is authorized to purchase its common shares in the open market if the discount to net asset value exceeds a certain threshold as determined by the Board of Directors from time to time. The Company may purchase its common shares in such amounts and at such prices as the Company may deem advisable. There can be no assurance that such action will reduce the discount. There were no repurchases during the year ended November 30, 2022. The Company had 19,289,905 shares outstanding on November 30, 2022.
Company Investment Objective, Investment Strategy and Risks (Unaudited)
Investment Objective
The Company’s investment objective is long-term capital appreciation through investment primarily in companies engaged in the exploration for, development of projects or mining of precious metals and minerals.
Investment Strategy
It is a fundamental policy of the Company that at least 80% of its total assets must be (i) invested in common shares or securities convertible into common shares of companies engaged, directly or indirectly, in the exploration, mining or processing of gold, silver, platinum, diamonds or other precious minerals, (ii) held as bullion or other direct forms of gold, silver, platinum or other precious minerals, (iii) invested in instruments representing interests in gold, silver, platinum or other precious minerals such as certificates of deposit therefor, and/or (iv) invested in securities of investment companies, including exchange traded funds, or other securities that seek to replicate the price movement of gold, silver or platinum bullion.
The Company employs bottom-up fundamental analysis and relies on detailed primary research including meetings with company executives, site visits to key operating assets, and proprietary financial analysis in making its investment decisions.
Risks
The following discussion summarizes certain (but not all) of the principal risks associated with investing in the Company. The Company may be subject to other risks in addition to those identified below, such as the risks associated with its tax status as a PFIC (see Note 3) and its reliance on an SEC exemptive order (see Note 5). The risk factors set forth in the following are described in no particular order and the order of the risk factors is not necessarily indicative of significance. The relative importance of, or potential exposure as a result of, each of these risks will vary based on market and other investment-specific considerations.
Concentration Risk. The Company invests at least 80% of its total assets in securities of companies engaged, directly or indirectly, in the exploration, mining or processing of gold or other precious minerals. The Company currently is invested in a limited number of securities and thus holds large positions in certain securities. Because the Company’s investments are concentrated in a limited number of securities of companies involved in the holding or mining of gold and other precious minerals and related activities, the net asset value of the Company may be subject to greater volatility than that of a more broadly diversified investment company.
Gold and Precious Metals/Minerals Risk. The Company invests in securities that typically respond to changes in the price of gold and other precious metals, which can be influenced by a variety of global economic, financial, and political factors; increased environmental and labor costs in mining; and changes in laws relating to mining or gold production or sales; and the price may fluctuate substantially over short periods of time.
Foreign Securities Risk/Emerging Markets Risk. The Company’s returns and share prices may be affected to a large degree by several factors, including fluctuations in currency exchange rates; political, social or economic instability; the rule of law with respect to the recognition and protection of property rights; and less stringent accounting, disclosure and financial reporting requirements in a particular country. These risks are generally intensified in emerging markets. The Company’s share prices will reflect the movements of the different stock markets in which it is invested and the currencies in which its investments are denominated.
Geographic Investment Risk. To the extent that the Company invests a significant portion of its assets in the securities of companies of a single country or region, it is more likely to be impacted by events or conditions affecting that country or region. As of November 30, 2022, a significant portion of the Company’s assets consisted of securities of Canadian issuers.
Canada Risk. The Canadian economy is susceptible to adverse changes in certain commodities markets, including those related to the natural resources and mining industries. It is also heavily dependent on trading with key partners. Any adverse events that affect Canada’s major industries may have a negative impact on the overall Canadian economy and the Company’s investments in Canadian issuers.
Junior and Intermediate Mining Companies Risk. The securities of junior and intermediate exploration and development, gold and silver mining companies, which are often more speculative in nature, tend to be less liquid and more volatile in price than securities of larger companies.
Private Placement Risk. Privately issued securities, including those which may be sold only in accordance with Rule 144A under the Securities Act of 1933, as amended, are restricted securities that are not registered with the U.S. Securities and Exchange Commission. The liquidity of the market for specific privately issued securities may vary. Accordingly, the Company may not be able to redeem or resell its interests in a privately issued security at an advantageous time or at an advantageous price, which may result in a loss to the Company.
Restricted Security Risk. The Company may make direct equity investments in securities that are subject to contractual and regulatory restrictions on transfer. These investments may involve a high degree of business and financial risk. The restrictions on transfer may cause the Company to hold a security at a time when it may be beneficial to liquidate the security, and the security could decline significantly in value before the Company could liquidate the security.
Depositary Receipts Risk. Depositary receipts risks include, but are not limited to, fluctuations in foreign currencies and foreign investment risks, such as political and financial instability, less liquidity and greater volatility, lack of uniform accounting auditing and financial reporting standards and increased price volatility. In addition, depositary receipts may not track the price of the underlying foreign securities, and their value may change materially at times when the U.S. markets are not open for trading. Investments in unsponsored depositary receipts may be subject to additional risks.
Warrants Risk. Warrants can provide a greater potential for profit or loss than an equivalent investment in the underlying security. Prices of warrants do not necessarily move, however, in tandem with prices of the underlying securities, particularly for shorter periods of time, and, therefore, may be considered speculative investments. If a warrant held by the Company were not exercised by the date of its expiration, the Company would incur a loss in the amount of the cost of the warrant.
Market Discount from Net Asset Value. Shares of closed-end investment companies such as the Company frequently trade at a discount from their net asset value. The Company cannot predict whether its common shares will trade at, below or above net asset value. This characteristic is a risk separate and distinct from the risk that the Company’s net asset value could decrease as a result of investment activities.
Valuation Risk. The Company may not be able to sell an investment at the price at which the Company has valued the investment. Such differences could be significant, particularly for illiquid securities and securities that trade in relatively thin markets and/or markets that experience extreme volatility. If market or other conditions make it difficult to value some investments, SEC rules and applicable accounting protocols may require the Company to value these investments using more subjective methods, known as fair value methodologies. Using fair value methodologies to price investments may result in a value that is different from an investment’s most recent price and from the prices used by other funds to calculate their NAVs. The Company’s ability to value its investments in an accurate and timely manner may be impacted by technological issues and/or errors by third party service providers, such as pricing services or accounting agents.
Market Events Risk. Geopolitical events, including pandemics (such as COVID-19), may destabilize various countries’ economies and markets, which may experience increased volatility and reduced liquidity. Policy changes by the Federal Reserve and/or other government actors could similarly cause increased volatility in financial markets. Trade barriers and other protectionist trade policies (including those in the U.S.) may also result in market turbulence. Market volatility and reductions in market liquidity may negatively affect issuers worldwide, including issuers in which the Company invests. Under such circumstances, the Company may have difficulty liquidating portfolio holdings, particularly at favorable prices. Also, the Company may be required to transact in contemporaneous markets, even if they are volatile and/or illiquid, which may negatively impact the Company’s net asset value.
The global outbreak of COVID-19 virus has caused negative effects on many companies, sectors, countries, regions, and financial markets in general, and uncertainty exists as to its long-term implications. The effects of the pandemic may adversely impact the Company’s assets and performance. The financial statements do not include any adjustments that might result from the outcome of this uncertainty.
Board of Directors and Officers of ASA Gold and Precious Metals Limited (Unaudited)
Directors are elected at each annual general meeting of shareholders to serve until the next annual general meeting. The address of each director and officer is c/o ASA Gold and Precious Metals Limited, Three Canal Plaza, Suite 600, Portland, ME 04101.
Independent Directors Mary Joan Hoene (73) Position held with the Company: Chair (non-executive)
since January 2019. Deputy Chair (non-executive)
2016 to 2018. Director since 2014. Principal occupations during past 5 years: Counsel,
Carter Ledyard & Milburn LLP 2010 to 2021. Other Directorships held by Director: None. | Bruce Hansen (65) Position held with the Company: Director since 2014. Principal occupations during past 5 years: Chief Executive Officer, General Moly, Inc. 2007 to 2020. Other Directorships held by Director: Director, Energy Fuels Inc. since 2006; Director, General Moly Inc. 2007 to 2020; Director and past Chairman (2011), Nevada Mining Association 2010 to 2019; Director, New Moly LLC since 2021. |
| | |
Anthony Artabane (68) Position held with the Company: Director since 2019. Principal occupations during past 5 years: Managing Member, Anthony Artabane CPA, PLLC since 2014. Other Directorships held by Director: None. | William Donovan (63) Position held with the Company: Director since 2020. Principal occupations during past 5 years: President, United States Steel and Carnegie Pension Fund 2011 to 2017. Other Directorships held by Director: None. |
| | |
Interested Directors*
Axel Merk (53)
Position held with the Company: Director since
September 2022 and Chief Operating Officer since
March 2019.
Principal occupations during past 5 years: Founder,
President and Chief Investment Officer, Merk
Investments since 1994.
* Axel Merk is considered an interested person of the Company, as defined in the 1940 Act, due to his affiliation with the Adviser and his role as Chief Executive Officer of the Company.
Other Officers
| Karen Shaw (50) | Peter Maletis (52) |
Position held with the Company: Chief Financial Officer since March 2019. Principal occupations during past 5 years: Senior Vice President, Apex Fund Services since 2019; Senior Vice President, Atlantic Fund Services 2008 to 2019. | Position held with the Company: President since March 2019. Principal occupations during past 5 years: Vice President, Merk Investments since March 2019; Research Analyst, Franklin Templeton Investments 2010 to 2019. |
| |
| James Nash (41) | Zachary Tackett (34) |
Position held with the Company: Chief Compliance Officer since September 2022. Principal occupations during past 5 years: Director and Fund Chief Compliance Officer at Foreside Fund Officer Services, LLC (d/b/a ACA Group, LLC) since 2016. | Position held with the Company: Corporate Secretary since November 2019. Principal occupations during past 5 years: Senior Counsel, Apex Fund Services since 2019; Counsel, Atlantic Fund Services 2014 to 2019. |

Other Information
Shareholder Services
ASA Gold and Precious Metals Limited
Three Canal Plaza, Suite 600
Portland, ME, U.S.A. 04101
(800) 432-3378
Registered Office
Canon’s Court
22 Victoria Street
Hamilton HM 12, Bermuda
Investment Adviser
Merk Investments LLC
Menlo Park, CA, U.S.A.
Independent Registered Public Accounting Firm
Tait, Weller & Baker LLP, Philadelphia, PA, U.S.A.
Counsel
Appleby, Hamilton, Bermuda
K&L Gates LLP, Washington, DC, U.S.A.
Custodian
JPMorgan Chase Bank, N.A.
New York, NY, U.S.A.
Fund Administrator
Apex Fund Services
Portland, ME, U.S.A.
Transfer Agent
Computershare Trust Company, N.A.
P.O. Box 505000
Louisville, KY, U.S.A. 40233-5000
(800) 317-4445
Website: www.asaltd.com
The Semi-annual and Annual Reports of the Company and the latest valuation of net assets per share may be viewed on the Company’s website or may be requested from the Executive Office (800-432-3378). Shareholders are reminded to notify Computershare of any change of address.
ITEM 2. CODE OF ETHICS.
| (a) | The registrant has adopted a code of ethics that applies to its principal executive officer and principal financial officer. |
| (c) | During the period covered by this report, there was no amendment to the code of ethics referred to in this paragraph (a) of this Item that apply to a covered person and relate to any element of such code set forth in paragraph (b) of this Item 2. |
| (d) | During the period covered by this report, there were no waivers to the provisions of the code of ethics referred to in paragraph (a) of this Item. |
| (f) | A copy of the registrant’s code of ethics is filed herewith. |
ITEM 3. AUDIT COMMITTEE FINANCIAL EXPERT.
The registrant’s board of directors determined that Bruce Hansen, Chairman of the registrant’s Audit and Ethics Committee, is an “audit committee financial expert” as defined in the instructions to Item 3 of Form N-CSR. Mr. Hansen is “independent” as defined in Item 3 of Form N-CSR.
ITEM 4. PRINCIPAL ACCOUNTANT FEES AND SERVICES.
| (a) | Audit Fees. The aggregate fees billed for professional services rendered by the independent auditors for the audit of the registrant’s annual financial statements and review of the semi-annual financial statements and services rendered in connection with statutory or regulatory filings for 2022 and 2021 were $30,000 and $30,000, respectively. |
| (b) | Audit-Related Fees – There were no fees billed for assurance and related services rendered by the independent auditors that were reasonably related to the performance of the audit or review of the registrant’s financial statements for 2022 and 2021. |
| (c) | Tax Fees – The aggregate fees billed for professional services rendered by the independent auditors in connection with tax compliance, tax advice and tax planning for 2022 and 2021 were $5,000 and $5,000, respectively. The figures for 2022 and 2021 include fees billed for U.S. tax advisory services. |
| (d) | All Other Fees – There were no non-audit fees not disclosed above that were billed for products and services provided by the independent auditors for 2022 and 2021. |
| (e)(1) | The Audit and Ethics Committee (“Committee”) of the registrant has the sole authority to pre-approve all audit and non-audit services to be provided by the independent auditors, subject to the de minimis exceptions for non-audit services described in Section 10A(i)(1)B of the Securities Exchange Act of 1934 (“Exchange Act”) which are approved by the Committee prior to the completion of the audit. Any individual project that does not exceed $25,000 may be pre-approved by the Chairman of the Committee. Any such pre-approval by the Chairman of the Committee must be presented to the full Committee at its next scheduled meeting. Any proposed services exceeding that cost level requires specific pre-approval by the Committee. Pre-approval of audit and non-audit services shall not be required if the engagement to render the services is entered into pursuant to pre-approved policies and procedures established by the Committee, provided the Committee is informed of each such service. The Committee has not established such policies and procedures. |
| (e)(2) | None of the services described in paragraphs (b) – (d) above were approved by the Audit and Ethics Committee pursuant to paragraph (c)(7)(i)(C) of Rule 2-01 of Regulation S-X. |
| (g) | The aggregate fees billed by the independent auditors for non-audit services rendered to the registrant for 2022 and 2021 were $5,000 and $5,000, respectively. |
ITEM 5. AUDIT COMMITTEE OF LISTED REGISTRANTS.
| (a) | The registrant has a standing audit committee established in accordance with Section 3(a)(58)(A) of the Exchange Act. The members of the audit committee are: Messrs. Bruce Hansen (Chair), Anthony Artabane, William Donovan and Ms. Mary Joan Hoene, which comprise the Independent Directors. |
ITEM 6. INVESTMENTS.
| (a) | Included as part of the report to shareholders under Item 1. |
ITEM 7. DISCLOSURE OF PROXY VOTING POLICIES AND PROCEDURES FOR CLOSED-END MANAGEMENT INVESTMENT COMPANIES.
ASA Gold and Precious Metals Limited
Proxy Voting Policies and Procedures
The following is a statement of the proxy voting policies and procedures of ASA Gold and Precious Metals Limited (“ASA”).
Proxy Administration
ASA’s portfolio is primarily comprised of holdings in precious metals companies, and thus proxy voting will be done on proposals made by these issuing companies (“portfolio company” or “portfolio companies”).
Authority and responsibility to vote proxies with respect to ASA’s portfolio securities has been delegated to Merk Investments LLC (the “Adviser”). In evaluating proxy proposals, the Adviser may consider information from various sources, including the Board of Directors (“Board”) of ASA presenting a proposal, as well as independent sources. The ultimate decision rests with the Adviser, who is accountable to the Board.
The Adviser understands its proxy voting responsibilities and that proxy voting decisions may affect the long-term interests of ASA’s shareholders. The Adviser attempts to process every proxy vote it receives on behalf of ASA. However, voting proxies for shares of certain non-U.S. companies may involve significantly greater effort and cost than voting proxies for shares of U.S. companies. There may be situations where the Adviser may not or cannot vote a proxy. For example, the Adviser may receive proxy material too late to act upon or the cost of voting may outweigh the benefit of voting. In addition, the Adviser may not receive proxy materials when it holds depository receipts, (“ADRs”) as opposed to the underlying securities. Certain issuers do not instruct the holding banks to solicit proxies from depository receipt holders.
General Principles
For the purposes of ASA, a “portfolio company” is defined as a company in which ASA holds securities or assets.
In voting proxies, the Adviser will act solely in the best economic interests of ASA’s shareholders with the goal of maximizing the value of ASA’s portfolio. These policies and procedures are designed to promote accountability of a portfolio company’s management and board to its shareholders and to align the interests of those portfolio companies and their management with those of shareholders. These policies and procedures recognize that a portfolio company’s managers are entrusted with the day-to-day operations of the company, as well as longer-term strategic planning, subject to the oversight of that company’s board.
ASA believes that the quality and depth of a portfolio company’s management and its board is an important consideration in determining the desirability of an investment. Accordingly, the recommendations of the portfolio company’s board on many issues are given substantial weight in determining how to vote a proxy. However, each issue is considered on its own merits, and the position of the portfolio company’s board will not be supported whenever it is determined not to be in the best interests of ASA and its shareholders.
Specific Policies
A. Routine Matters
| 1. | Election of Directors. In general, the Adviser will vote in favor of the board’s director nominees if they are running unopposed. ASA believes that the board is in the best position to evaluate the qualifications of its directors and the needs of a particular board. Nevertheless, the Adviser will vote against, or withhold its vote for, any nominee whom the Adviser considers is not qualified or appears to lacks sufficient independence. When the board’s nominees are opposed in a proxy contest, the Adviser will evaluate which nominee’s publicly-announced management policies and goals are most likely to maximize shareholder value, as well as the past performance of the incumbent. |
| 2. | Ratification of Selection of Auditors. In general, the Adviser will rely on the judgment of the board in selecting the independent auditors. Nevertheless, the Adviser will examine the recommendation of the board in appropriate cases (e.g., where there has been a change in auditors based upon a disagreement on accounting matters). |
| 3. | Stock Option and Other Equity Based Compensation Plan Proposals. The Adviser will generally approve the board’s recommendations with respect to the adoption or amendment of stock option plans and other equity based compensation plans, provided that the total number of shares reserved under all of a company’s plans is reasonable and not excessively dilutive. |
B. Acquisitions, Mergers, Reincorporations, Reorganizations and Other Transactions
Because voting on transactions such as acquisitions, mergers, reincorporations and reorganizations involve considerations unique to each transaction, ASA does not have a general policy in regard to voting on those transactions. The Adviser will vote on a case-by-case basis on each transaction.
C. Changes in Capital Structure
The Adviser evaluates proposed capital actions on a case-by-case basis and will generally defer to the business analysis of the portfolio company’s board in support of such actions. In cases where proposed capital actions support proxy defenses or act to reduce or limit shareholder rights, particular consideration will be given to all the effects of the action, and the Adviser’s vote will be made in a manner consistent with the objective of maximizing long-term shareholder value for ASA.
D. Anti-Takeover Proposals
In general, the Adviser will vote against any proposal which the Adviser believes would materially contribute to preventing a potential acquisition or takeover of the portfolio company, including proposals to:
| ● | Introduce cumulative voting; |
| ● | Introduce unequal voting rights; |
| ● | Create supermajority voting; |
| ● | Establish preemptive rights. |
In general, the Adviser will vote in favor of any proposals to reverse the above.
E. Shareholder Proposals Involving Social, Moral or Ethical Matters
In general, the Adviser will vote in accordance with the recommendation of the portfolio company’s board on issues that primarily involve social, moral or ethical matters, although exceptions may be made in certain instances where the Adviser believes a proposal has substantial economic implications.
F. Conflict of Interest
Any actual or potential conflicts of interest between the Adviser and the Company’s shareholders arising from the proxy voting process will be addressed by the Adviser and the Adviser’s application of its proxy voting procedures pursuant to the delegation of proxy voting responsibilities to the Adviser. In the event that the Adviser notifies the CCO that a conflict of interest cannot be resolved under the Adviser’s Proxy Voting Procedures, the CCO is responsible for notifying the Chair of the Board of the irreconcilable conflict of interest and assisting the Chair with any actions she or he determines are necessary.
A “conflict of interest” includes, for example, any circumstance when the Company, the Adviser or one or more of their affiliates (including officers, directors and employees) knowingly does business with, receives compensation from, or sits on the board of, a particular issuer or closely affiliated entity, and therefore, may appear to have a conflict of interest between its own interests and the interests of Company shareholders in how proxies of that issuer are voted. Situations where the issuer seeking the proxy vote is also a client of the Adviser are deemed to be potential conflicts of interest. Potential conflicts of interest may also arise in connection with consent solicitations relating to debt securities where the issuer of debt is also a client of the Adviser.
In cases of a conflict of interest, a record shall be maintained confirming that the Adviser’s vote was made solely in the interests of ASA and without regard to any other consideration.
G. Recordkeeping
The Adviser uses ProxyEdge, a third party automated proxy voting service. Where appropriate, rationales for “No” votes cast by the Adviser will be supported by footnoted documentation on ProxyEdge. According to the Proxy Edge website, this service is a “suite of electronic voting services that help simplify the management of institutional proxies. The system manages the process of meeting notifications, voting, tracking, mailing, reporting, record maintenance and even vote disclosure rules enacted by the SEC.”
Revised and Re-Approved December 12, 2019
Proxy Voting
The following is a statement of the proxy voting policies and procedures of registrant’s investment adviser, Merk Investments LLC (“Merk”).
Introduction
Merk exercises its voting authority with a goal of maintaining or enhancing shareholder value of the companies in which it has invested Advisory Client assets. Unless an Advisory Client specifically reserves the right, in writing, to vote its own proxies, Merk will vote proxies in accordance with its proxy voting policy. Merk is committed to minimizing conflicts of interest when voting proxies on behalf of Advisory Clients and strives to ensure that proxies are voted in the best interests of Advisory Clients, including investors in the Private Funds. Merk has adopted the following:
| ● | For routine matters, as the quality and depth of management is a primary factor considered when investing in an issuer, the recommendation of the issuer’s management on any issue will be given substantial weight. The position of the issuer’s management will not be supported in any situation where Merk assesses that it is not in the best interests of Clients and investors. |
| ● | For non-routine matters, such proposals should be examined on a case-by-case basis. |
| ● | Merk may abstain from voting a proxy if such vote cannot be cast with commercially reasonable efforts or if Merk deems it to be in the best interest of Advisory Clients and investors to abstain from voting a proxy. |
| ● | Merk may choose to abstain from voting for routine matters when it agrees with the recommendation of the issuer’s management. |
Responsibility
The CCO has the responsibility for monitoring compliance with our proxy voting policy, practices, disclosures and record keeping, including outlining our voting guidelines in our procedures.
Procedure
As a general rule, conflicts of interest will be resolved by Merk voting in accordance with its proxy voting policy when: Merk manages the account of a corporation or a pension fund sponsored by a corporation in which Advisory Clients of Merk also own stock; a Supervised Person or a member of his/her immediate family is on the Board of Directors or a member of senior management of the company that is the issuer of securities held in an Advisory Client’s account; or Merk has a material relationship with a corporation whose securities are the subject of the proxy.
If Merk determines that it has a conflict of interest with respect to voting proxies on behalf of the Merk Mutual Funds, the CIO or CCO shall contact the Chairman of the Board of Registered Funds to seek their voting recommendation. Merk shall vote the proposal according the determination of the Board and maintain records relating to this process.
Advisory Clients that wish to obtain information on how specific proxies were voted, or a copy of Merk’s proxy voting policy, may contact the CCO.
Recordkeeping
Merk shall retain the following proxy records in accordance with the SEC’s five-year retention requirement:
| ● | These policies and procedures and any amendments; |
| ● | Each proxy statement that the Firm receives; |
| ● | A record of each vote that the Firm casts; |
| ● | Any documents prepared by the Firm that were material to making a decision how to vote proxies, or that memorializes the basis of that decision. |
ITEM 8. PORTFOLIO MANAGERS OF CLOSED-END MANAGEMENT INVESTMENT COMPANIES.
Unless otherwise indicated, the information set forth below is as of November 30, 2022.
| (a)(1) | As of the date of this filing, on form N-CSR, Peter J. Maletis, President of the registrant since March 2019, and James Holman, are responsible for the day-to-day management of the registrant’s portfolio (each a “Portfolio Manager” and collectively the “Portfolio Managers”). Mr. Maletis joined Merk Investments as Vice President in March 2019. Mr. Maletis served as Research Analyst at Franklin Templeton Investments from 2010 to 2019. Mr. Holman joined Merk Investments as Portfolio Manager in April 2022. Prior to joining Merk Investments, Mr. Holman was a Director at Invesco US, where he worked on an industry-leading mining fund for nine years. Prior to that Mr. Holman worked at Oppenheimer Funds and as a Research Fellow at Colorado School of Mines. |
| (a)(2) | Other Accounts Managed by the Portfolio Manager. The chart below shows the number of other accounts managed by the Portfolio Manager as of November 30, 2022. |
PORTFOLIO
MANAGER | | REGISTERED
INVESTMENT
COMPANIES ($) | | OTHER POOLED
INVESTMENT
VEHICLES ($) | | OTHER ACCOUNTS
($) |
| Peter J. Maletis | | None | | None | | None |
| James Holman | | None | | None | | None |
| (a)(3) | Compensation of the Portfolio Manager. The compensation for each Portfolio Manager is comprised of a fixed annual salary and a variable compensation based on the assets of the Fund. Each Portfolio Manager may be eligible to receive additional compensation based on certain factors, including but not limited to, the economic performance of the Adviser. Any amounts earned by each Portfolio Manager are payable by the Adviser and not by the Fund. |
| (a)(4) | Beneficial Ownership by Portfolio Manager. As of November 30, 2022, the dollar range of shares of the Registrant owned by each Portfolio Manager was as follows: |
| PORTFOLIO MANAGER | | DOLLAR RANGE OF BENEFICIAL
OWNERSHIP |
| Peter J. Maletis | | $10,001 - $50,000 |
| James Holman | | None |
ITEM 9. PURCHASES OF EQUITY SECURITIES BY CLOSED-END MANAGEMENT INVESTMENT COMPANY AND AFFILIATED PURCHASERS.
During the period covered by this report, there were no purchases made by or on behalf of the registrant or any “affiliated purchaser,” as defined in Rule 10b-18(a)(3) under Securities Exchange Act of 1934 (the “Exchange Act”), of any common shares of the registrant.
ITEM 10. SUBMISSION OF MATTERS TO A VOTE OF SECURITY HOLDERS
There have been no material changes to the procedures by which shareholders may recommend nominees to the registrant’s board of directors since the registrant provided disclosure in response to Item 22(b)(15) of Schedule 14A in its proxy statement dated February 21, 2019.
ITEM 11. CONTROLS AND PROCEDURES
| (a) | The Principal Executive Officer and the Principal Financial Officer, in their capacities as principal executive officer and principal financial officer of the registrant, have concluded that the registrant’s disclosure controls and procedures (as defined in Rule 30a-3(c) under the Investment Company Act of 1940 (the “1940 Act”)) are effective, based on their evaluation of these controls and procedures as of a date within 90 days prior to the filing date of this report. |
| (b) | There were no changes in the registrant’s internal control over financial reporting (as defined in Rule 30a-3(d) under the 1940 Act) that occurred during the period covered by this report that have materially affected, or are reasonably likely to materially affect, the registrant’s internal control over financial reporting. |
ITEM 12. DISCLOSURE OF SECURITIES LENDING ACTIVITIES FOR CLOSED-END MANAGEMENT INVESTMENT COMPANIES
The Registrant did not participate in securities lending activities during the year ended November 30, 2022.
ITEM 13. EXHIBITS.
(a)(1) The code of ethics that is the subject of disclosure under Item 2 above is attached hereto.
(a)(2) The certifications required by Rule 30a-2(a) under the 1940 Act are attached hereto.
(a)(3) Not applicable.
(a)(4) Not applicable.
(b) The certifications required by Rule 30a-2(b) under the 1940 Act, Rule 13a-14(b) under the Exchange Act and Section 1350 of Chapter 63 of Title 18 of the United States Code are attached hereto. These certifications are not deemed “filed” for purposes of Section 18 of the Exchange Act, or otherwise subject to the liability of that section. Such certifications will not be deemed to be incorporated by reference into any filing under the Securities Act of 1933 or the Exchange Act, except to the extent that the registrant specifically incorporates them by reference.
SIGNATURES
Pursuant to the requirements of the Securities Exchange Act of 1934 and the Investment Company Act of 1940, the Registrant has duly caused this report to be signed on its behalf by the undersigned, thereunto duly authorized.
Registrant ASA Gold and Precious Metals Limited
| By | /s/ Axel Merk | |
| | Axel Merk, Principal Executive Officer | |
| | | |
| Date | 2/2/2023 | |
Pursuant to the requirements of the Securities Exchange Act of 1934 and the Investment Company Act of 1940, this report has been signed below by the following persons on behalf of the Registrant and in the capacities and on the dates indicated.
| By | /s/ Axel Merk | |
| | Axel Merk, Principal Executive Officer | |
| | | |
| Date | 2/2/2023 | |
| By | /s/ Karen Shaw | |
| | Karen Shaw, Principal Financial Officer | |
| | | |
| Date | 2/2/2023 | |