As filed with the Securities and Exchange Commission on July 31, 2019
UNITED STATES
SECURITIES AND EXCHANGE COMMISSION
WASHINGTON, D.C. 20549
FORM N-CSR
CERTIFIED SHAREHOLDER REPORT OF REGISTERED MANAGEMENT
INVESTMENT COMPANIES
Investment Company Act file number 811-21650
ASA GOLD AND PRECIOUS METALS LIMITED
Three Canal Plaza, Suite 600
Portland, ME 04101
Karen Shaw, Principal Financial Officer
Three Canal Plaza, Suite 600
Portland, Maine 04101
207-347-2000
Date of fiscal year end: November 30
Date of reporting period: December 1 – May 31
ITEM 1. REPORT TO STOCKHOLDERS.

Gold and Precious Metals Limited
Semi-Annual Report and Financial Statements
May 31, 2019
(Unaudited)
A Closed-End Fund
Specializing in Gold and Other
Precious Metals Investments
Beginning on January 1, 2021, as permitted by regulations adopted by the U.S. Securities and Exchange Commission, paper copies of the Company’s annual and semi-annual shareholder reports will no longer be sent by mail, unless you specifically request paper copies of the reports. Instead, the reports will be made available on the Company’s website www.asaltd.com, and you will be notified by mail each time a report is posted and provided with a website link to access the report.
If you already elected to receive shareholder reports electronically, you will not be affected by this change and you need not take any action. You may elect to receive shareholder reports and other communications from the Company electronically anytime by contacting your financial intermediary (such as a broker-dealer or bank) or, if you are a direct investor, by calling 1-800-432-3378 or by sending an e-mail request to info@asaltd.com.
Beginning on January 1, 2019, you may elect to receive all future reports in paper free of charge. If you invest through a financial intermediary, you can contact your financial intermediary to request that you continue to receive paper copies of your shareholder reports. If you invest directly with the Company, you can call 1-800-432-3378 or send an email request to info@asaltd.com to inform the Company that you wish to continue receiving paper copies of your shareholder reports. Your election to receive reports in paper will apply to all funds held in your account if you invest through your financial intermediary or all funds held with the fund complex if you invest directly with the Company.
ASA Gold and Precious Metals Limited
Semi-Annual Report and Financial Statements (Unaudited)
May 31, 2019 and May 31, 2018
Table of Contents
| Letter to Shareholders | 2 |
| Forward-looking statements | 5 |
| Performance returns | 6 |
| Certain investment policies and restrictions | 7 |
| Schedules of investments | 8 |
| Statements of assets and liabilities | 12 |
| Statements of operations | 13 |
| Statements of changes in net assets | 14 |
| Notes to financial statements | 15 |
| Financial highlights | 21 |
| Certain tax information for U.S. shareholders | 22 |
| Dividend reinvestment and stock purchase plan | 22 |
| Privacy notice | 23 |
| Board consideration of Investment Advisory Agreement | 23 |
| Results of the proposals presented at the annual general meeting of shareholders | 25 |
| Form N-PX/Proxy voting | 25 |
| Form N-Q/Portfolio Holdings | 25 |
| Common shares repurchased | 25 |
Dear Shareholder,
During the six-month fiscal period ended May 31, 2019, the gold price increased 7.0%, underperforming many gold mining equities. The gold price appeared to have found solid support in the beginning of the fiscal year, as the Fed signaled that it would be unlikely to raise rates over the short term. By the end of May, expectations were shifting, with the market pricing potential rate cuts for later in the year. With this backdrop, the price of gold increased by 7.6% during the first fiscal quarter that ended February 28, 2019, then giving back some of those gains, falling 0.6% during the second fiscal quarter that ended May 31, 2019. Economic data throughout the second quarter gave the market some pause as to the Federal Reserve’s rate direction, and mining equities traded in a range. A flareup in trade tensions at the end of the quarter that was associated with lower rate path expectation at the Fed caused the prices of gold and gold miners to end the quarter on a positive note.
ASA Gold and Precious Metals Limited (“ASA” or the “Company”) reported a net asset value (“NAV”) of $11.76 per share at May 31, 2019, for a six-month total return of positive 16.7% versus a total return of positive 14.1% for the FTSE Gold Mines Total Return Index (the “FTGMI”).
The ASA share price closed at $9.90, a total return of positive 14.4% for the six-month period ending May 31, 2019. The discount at which ASA’s shares traded in the market ended the first half of fiscal 2018 at 15.8%, an increase from 14.2% at the beginning of the fiscal year. During this period, the discount averaged 14.9%, ranging between 13.6% and 16.5%.
During the last six months, ASA distributed $0.01 per share to shareholders, $0.01 lower than the first six months of 2018, but similar to the last six months of fiscal 2018.
Investment Advisor Change and Portfolio Philosophy
In April of 2019, shareholders approved the transition from an internally managed portfolio to an external advisor structure. Merk Investments LLC (“Merk”) was approved as the external advisor at that time. As a firm, we bring a long history of portfolio management of registered investment companies, and research that includes primary research on central banks and their impact on the price of gold. I joined Merk after 8 years at Franklin Templeton, where I was the precious metals analyst. I spent much of my time at Franklin meeting with the management of gold companies from around the world as well as on due diligence site visits, where I developed an intimate understanding of the many companies in the precious metals sector. It is with that background that I am influencing changes to the ASA portfolio, also leveraging on the resources made available by Merk.
We believe that the environment for gold price support and appreciation is very strong. Over the last couple of years, companies have managed to solidify their balance sheets and cut operating costs. These companies are in a position to benefit from increasing margins and cash flows in a positive gold price environment. We believe ASA’s portfolio will benefit from this going forward.
As we believe we are entering a strong market for the price of gold and gold equities, we are changing the allocation of the portfolio. It is our opinion that with the increasing price of gold, companies with better leverage to gold exist in the mid-capitalization companies and that the portfolio will exhibit improved leverage to the price of gold by investing in such companies; as a result, we have increased select holdings in the mid-cap space. These companies, while showing improving margins and solid balance sheets, also have growing production and development pipelines relative to the larger cap names. Furthermore, we are looking for, and have taken positions in, development and exploration companies that have strong partners, who can support these capital-intensive developments in a time when sector funds and generalist investors are unable to perform the part of capital providers in the size that they have in previous cycles. With that in mind we are decreasing our exposure to the royalty and large cap production companies. It is our opinion that the royalty companies, while excellent companies, don’t offer the same value or leverage to the gold price that we would like for our investors who have invested in ASA for its leverage to the gold price. While we are firm proponents of the M&A trend in the industry, the recent mergers undertaken by Barrick and Newmont Goldcorp will take time to integrate and pose some risk to performance of these companies. As significant components of the gold equity indices, there is portfolio risk by being overexposed to these companies in our opinion. In addition to portfolio changes related to the size of the companies, we have increased geographical diversity with an increased exposure to the Australian equity market. The increasing Australian dollar denominated gold price and a weakening Australian dollar has created an opportunity for us to invest in what we believe to be well run companies, while increasing our exposure to the gold equity market in Australia and their improving operating margins.
Portfolio Changes
As you can see in the schedule of investments in the semi-annual report, there have been numerous changes to the portfolio over the last two months. The top ten holdings and country allocations have changed as follows:
| TOP 10 POSITIONS |
| March 31, 2019 | | May 31, 2019 |
| Barrick Gold Corp. | 13.8% | | Agnico Eagle Mines, Ltd. | 8.2% |
| Agnico Eagle Mines, Ltd. | 8.6% | | Newcrest Mining, Ltd. | 7.6% |
| Newcrest Mining, Ltd. | 8.2% | | Barrick Gold Corp. | 7.1% |
| Newmont Mining Corp. | 7.9% | | Newmont Goldcorp Corp. | 5.8% |
| Compañia de Minas Buenaventura SAA – ADR | 5.3% | | AngloGold Ashanti, Ltd. | 5.3% |
| Franco-Nevada Corp. | 5.3% | | B2Gold Corp. | 3.6% |
| AngloGold Ashanti, Ltd. | 5.2% | | Gold Fields, Ltd. | 3.3% |
| Royal Gold, Inc. | 4.8% | | Alacer Gold Corp. | 3.3% |
| Goldcorp, Inc. | 4.7% | | Endeavour Mining Corp. | 3.3% |
| Alacer Gold Corp. | 3.0% | | Alamos Gold, Inc. | 3.2% |
| COUNTRY ALLOCATION* |
| March 31, 2019 | | May 31, 2019 |
| Canada | 59.7% | | Canada | 56.4% |
| United States | 12.7% | | Australia | 17.2% |
| Australia | 8.2% | | South Africa | 9.1% |
| South Africa | 7.4% | | United States | 7.0% |
| Peru | 5.3% | | Cayman Islands | 3.3% |
| Cayman Islands | 2.5% | | Peru | 3.0% |
| Mexico | 1.3% | | Mexico | 1.7% |
| Channel Islands | 1.0% | | Channel Islands | 1.0% |
| Net Cash or Equivalent | 1.9% | | Net Cash or Equivalent | 1.3% |
| * | Based on the country of domicile. Holdings are subject to change. |
Allocation by Production Status
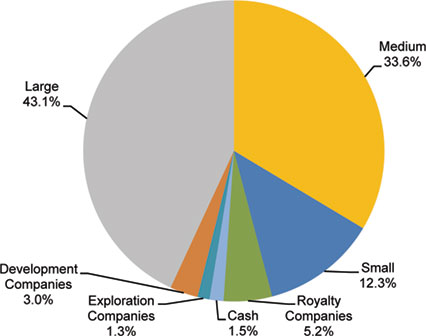
Large – Greater than 1 million ounces of gold equivalent produced
Mid – Between 1 million and five hundred thousand ounces of gold equivalent produced
Small – Less than five hundred thousand ounces of gold produced
Allocation by Market Capitalization
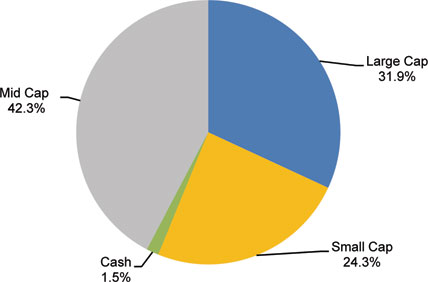
Large Cap – $10 billion and greater
Mid Cap – $2 billion to $10 billion
Small Cap – less than $2 billion
Peter Maletis, Portfolio Manager
* * * * * *
Focus on Process, Execution and Communication
My team has been working with various stakeholders in the runup to Merk taking on the management of ASA to ensure a smooth transition. In this context, we are grateful to ASA’s long-time Operations Manager Mary Sleeper, who joined Merk with her invaluable experience. We were thrilled when Peter Maletis agreed to join us earlier this year; as I trust you agree based on his writing above, he brings new energy to the ASA portfolio.
Like everyone else, we do not have a crystal ball. What we do have, though, is a passion for investing, a culture that values process, risk management and communication. We believe that a good process, consistently applied, is key to adding value.
Let me take a moment to address the discount ASA is trading at versus its Net Asset Value. Closed-end funds historically often trade at a discount to Net Asset Value, and ASA is no exception. At Merk, we believe reducing the discount is a process. If you look at most published metrics, they reflect that ASA has in recent years been defensively positioned, not reflecting what I call increased assertiveness that Peter has introduced. As of April 1, 2019, ASA is publishing its NAV daily, to provide more transparency. That said, the publication of this semi-annual report is the first opportunity for investors to see the full portfolio after Merk has taken on the management. At Merk, we have stepped up our public communication, including hosting a webinar and providing interviews (please visit asaltd.com for replays). Ultimately, investors may want to see us execute on our investment process, consistently, before embracing a lower discount. We will support this process with active communication.
If you agree with us that ASA’s portfolio may be well positioned for the environment to come, and that our management and initiatives may help reduce the discount, you can interpret this as an opportunity. I certainly do; my name now shows up as a top 20 shareholder with “only” 45,875 shares. I hope I can report to you a year from now that I have been pushed out of the top 20, not by reducing my stake, but by others holding more than I do.
Please tell your friends about this investment company with a history dating back to 1958, trading at a discount. We appreciate the support of the Board and our shareholders. For investors wishing for more information on ASA Gold and Precious Metals Limited, we encourage you to visit the Company’s website (www.asaltd.com) or to call us at (800) 432-3378.
Axel Merk, Chief Investment Officer
* * * * * *
Forward-Looking Statements
This shareholder letter includes forward-looking statements, which involve known and unknown risks, uncertainties and other factors that may cause the actual results, levels of activity, performance or achievements of the Company, or industry results, to be materially different from any future results, levels of activity, performance or achievements expressed or implied by such forward-looking statements. The Company’s actual performance or results may differ from its beliefs, expectations, estimates, goals and projections, and consequently, investors should not rely on these forward-looking statements as predictions of future events. Forward-looking statements are not historical in nature and generally can be identified by words such as “believe,” “anticipate,” “estimate,” “expect,” “intend,” “should,” “may,” “will,” “seek,” or similar expressions or their negative forms, or by references to strategy, plans, goals or intentions. The absence of these words or references does not mean that the statements are not forward-looking. The Company’s performance or results can fluctuate from month to month depending on a variety of factors, a number of which are beyond the Company’s control and/or are difficult to predict, including without limitation: the Company’s investment decisions, the performance of the securities in its investment portfolio, economic, political, market and financial factors, and the prices of gold, platinum and other precious minerals that may fluctuate substantially over short periods of time. The Company may or may not revise, correct or update the forward-looking statements as a result of new information, future events or otherwise.
The Company concentrates its investments in the gold and precious minerals sector. This sector may be more volatile than other industries and may be affected by movements in commodity prices triggered by international monetary and political developments. The Company is a non-diversified fund and, as such, may invest in fewer investments than that of a diversified portfolio. The Company may invest in smaller-sized companies that may be more volatile and less liquid than larger more established companies. Investments in foreign securities, especially those in the emerging markets, may involve increased risk as well as exposure to currency fluctuations. Shares of closed-end funds frequently trade at a discount to net asset value. All performance information reflects past performance and is presented on a total return basis. Past performance is no guarantee of future results. Current performance may differ from the performance shown.
This shareholder letter does not constitute an offer to sell or solicitation of an offer to buy any securities.
Performance Returns (Unaudited)
Average Annual Total Returns For the periods ended May 31, 2019 | 1 Year | 3 Year | 5 Year | 10 Year |
| ASA Gold and Precious Metals – NAV | -2.67% | -4.18% | -2.83% | -6.64% |
| ASA Gold and Precious Metals - Share Price | -4.60% | -5.31% | -5.03% | -7.25% |
| FTSE Gold Mines Index(1) | -1.53% | -1.50% | 1.11% | -6.10% |
The performance data quoted represent past performance and do not indicate future results. Current performance may be lower or higher than the performance data quoted. For more current performance data, please visit http://www.asaltd.com/investor-information/factsheets.
The results shown in the table reflect the reinvestment of income dividends and other distributions, if any. The results do not reflect the effect of taxes a shareholder would pay on Company distributions or on the sale of the Company’s common shares.
The investment return and market price will fluctuate and the Company’s common shares may trade at prices above or below NAV. The Company’s common shares, when sold, may be worth more or less than their original cost.
| (1) | The FTSE Gold Mines Total Return Index encompasses gold mining companies that have a sustainable, attributable gold production of at least 300,000 ounces a year and that derive 51% or more of their revenue from mined gold. Please note that the Index is unmanaged, and does not take into account any fees and expenses or any tax consequences of investing in the individual securities that it tracks and one cannot invest directly in the Index. The Company does not attempt to replicate the Index. The Index generally does not reflect investments in other precious metals companies (e.g., silver, platinum, and diamonds) in which the Company invests. Data about the performance of this Index are prepared or obtained by Management and include reinvestment of all income dividends and other distributions, if any. The Fund may invest in securities not included in the Index and generally does not invest in all securities included in the Index. |
For more complete information about the Company, please call us directly at 1-800-432-3378, or visit the Company’s website at www.asaltd.com.
Certain Investment Policies and Restrictions
The following is a summary of certain of the Company’s investment policies and restrictions and is subject to the more complete statements contained in documents filed with the Securities and Exchange Commission.
The concentration of investments in a particular industry or group of industries. It is a fundamental policy (i.e., a policy that may be changed only by shareholder vote) of the Company that at least 80% of its total assets be (i) invested in common shares or securities convertible into common shares of companies engaged, directly or indirectly, in the exploration, mining or processing of gold, silver, platinum, diamonds or other precious minerals, (ii) held as bullion or other direct forms of gold, silver, platinum or other precious minerals, (iii) invested in instruments representing interests in gold, silver, platinum or other precious minerals such as certificates of deposit therefor, and/or (iv) invested in securities of investment companies, including exchange traded funds, or other securities that seek to replicate the price movement of gold, silver or platinum bullion. Compliance with the percentage limitation relating to the concentration of the Company’s investments will be measured at the time of investment. If investment opportunities deemed by the Company to be attractive are not available in the types of securities referred to in the preceding paragraph, the Company may deviate from the investment policy outlined in that paragraph and make temporary investments of unlimited amounts in securities issued by the U.S. Government, its agencies or instrumentalities or other high quality money market instruments.
The percentage of voting securities of any one issuer that the company may acquire. It is a non-fundamental policy (i.e., a policy that may be changed by the Board of Directors) of the Company that the Company shall not purchase a security if, at the time of purchase, more than 20% of the value of its total assets would be invested in securities of the issuer of such security.
Report of Independent Registered Public Accounting Firm
To the Board of Directors and Shareholders of ASA Gold and Precious Metals Limited
Results of Review of Interim financial Information
We have reviewed the statements of assets and liabilities of ASA Gold and Precious Metals Limited (the “Company”), including the schedule of investments, as of May 31, 2019 and May 31, 2018, and the related statements of operations for the six month periods ended May 31, 2019 and May 31, 2018, the statement of changes in net assets for the six month period ended May 31, 2019, the financial highlights for the six month periods ended May 31, 2019 and May 31, 2018, and the related notes (collectively referred to as the interim financial statements). Based on our reviews, we are not aware of any material modifications that should be made to the accompanying interim financial statements for them to be in conformity with accounting principles generally accepted in the United States of America.
We have previously audited, in accordance with the standards of the Public Company Accounting Oversight Board (United States) (PCAOB), the statement of changes in net assets for the year ended November 30, 2018 and the financial highlights for each year in the five year period ended November 30, 2018; and in our report dated January 18, 2019, we expressed an unqualified opinion on those financial statements and financial highlights.
Basis for Review Results
These interim financial statements are the responsibility of the Company’s management. We conducted our review in accordance with the standards of the PCAOB. A review of interim financial information consists principally of applying analytical procedures and making inquiries of persons responsible for financial and accounting matters. It is substantially less in scope than an audit conducted in accordance with standards of the PCAOB, the objective of which is the expression of an opinion regarding the financial statements taken as a whole. Accordingly, we do not express such an opinion. We are a public accounting firm registered with the Public Company Accounting Oversight Board (United States) (PCAOB) and are required to be independent with respect to the Company in accordance with the U.S. federal securities laws and the applicable rules and regulations of the Securities and Exchange Commission and the PCAOB.

TAIT, WELLER & BAKER LLP
Philadelphia, Pennsylvania
July 18, 2019
Schedules of Investments (Unaudited)
May 31, 2019 and May 31, 2018
| | | 2019 | | 2018 |
| Name of Company | | Shares | | | Value | | | % of Net Assets | | | Shares | | | Value | | | % of Net Assets | |
| Common Shares |
| Gold mining, exploration, development and royalty companies |
| Australia | | | | | | | | | | | | | | | | | | | | | | | | |
| Bellevue Gold, Ltd. | | | 3,000,000 | | | $ | 1,290,282 | | | | 0.6 | % | | | – | | | $ | – | | | | – | % |
| Dacian Gold, Ltd.(1) | | | 4,000,000 | | | | 4,398,059 | | | | 1.9 | | | | – | | | | – | | | | – | |
| Echo Resources, Ltd.(1) | | | 642,307 | | | | 62,380 | | | | 0.0 | | | | – | | | | – | | | | – | |
| Echo Resources, Ltd. 144A (2) | | | 8,654,332 | | | | 840,492 | | | | 0.4 | | | | – | | | | – | | | | – | |
| Newcrest Mining, Ltd. | | | 900,000 | | | | 17,221,500 | | | | 7.6 | | | | 1,015,000 | | | | 15,965,950 | | | | 6.8 | |
| Northern Star Resources, Ltd. | | | 900,000 | | | | 6,062,246 | | | | 2.7 | | | | – | | | | – | | | | – | |
| Pantoro, Ltd.(1) | | | 2,000,000 | | | | 277,480 | | | | 0.1 | | | | – | | | | – | | | | – | |
| Pantoro, Ltd. 144A(1)(2) | | | 13,000,000 | | | | 1,803,620 | | | | 0.8 | | | | – | | | | – | | | | – | |
| Perseus Mining, Ltd.(1) | | | 11,000,000 | | | | 3,471,969 | | | | 1.5 | | | | – | | | | – | | | | – | |
| Westgold Resources, Ltd.(1) | | | 3,000,000 | | | | 3,610,709 | | | | 1.6 | | | | – | | | | – | | | | – | |
| | | | | | | | 39,038,737 | | | | 17.2 | | | | | | | | 15,965,950 | | | | 6.8 | |
| Canada | | | | | | | | | | | | | | | | | | | | | | | | |
| Agnico Eagle Mines, Ltd. | | | 425,000 | | | | 18,525,750 | | | | 8.2 | | | | 450,000 | | | | 20,227,500 | | | | 8.7 | |
| Alacer Gold Corp.(1) | | | 2,500,000 | | | | 7,528,115 | | | | 3.3 | | | | 2,500,000 | | | | 4,592,467 | | | | 2.0 | |
| Alamos Gold, Inc. | | | 1,500,000 | | | | 7,324,652 | | | | 3.2 | | | | 875,000 | | | | 4,842,351 | | | | 2.1 | |
| Atlantic Gold Corp. 144A(1)(2) | | | – | | | | – | | | | – | | | | 2,750,000 | | | | 4,096,558 | | | | 1.7 | |
| B2Gold Corp.(1) | | | 3,000,000 | | | | 8,190,293 | | | | 3.6 | | | | 1,594,338 | | | | 4,368,555 | | | | 1.9 | |
| Barrick Gold Corp. | | | 1,300,000 | | | | 16,146,000 | | | | 7.1 | | | | 1,125,000 | | | | 14,838,750 | | | | 6.4 | |
| Belo Sun Mining Corp.(1) | | | – | | | | – | | | | – | | | | 2,600,000 | | | | 421,426 | | | | 0.2 | |
| Centerra Gold, Inc. (1) | | | 675,000 | | | | 3,865,419 | | | | 1.7 | | | | – | | | | – | | | | – | |
| Detour Gold Corp.(1) | | | 450,000 | | | | 4,244,969 | | | | 1.9 | | | | 450,000 | | | | 3,560,127 | | | | 1.5 | |
| Franco-Nevada Corp. | | | 60,000 | | | | 4,632,732 | | | | 2.0 | | | | 160,000 | | | | 11,291,139 | | | | 4.8 | |
| Goldcorp, Inc. | | | – | | | | – | | | | – | | | | 932,400 | | | | 13,351,968 | | | | 5.7 | |
| Golden Star Resources, Ltd.(1) | | | 865,366 | | | | 2,968,205 | | | | 1.3 | | | | 2,900,000 | | | | 2,038,700 | | | | 0.9 | |
| Guyana Goldfields, Inc.(1) | | | 619,500 | | | | 412,511 | | | | 0.2 | | | | 619,500 | | | | 2,338,187 | | | | 1.0 | |
| IAMGOLD Corp.(1) | | | 675,000 | | | | 1,694,250 | | | | 0.8 | | | | 350,000 | | | | 2,184,000 | | | | 0.9 | |
| Kinross Gold Corp.(1) | | | 800,000 | | | | 2,616,000 | | | | 1.2 | | | | 800,000 | | | | 2,880,000 | | | | 1.2 | |
| Kirkland Lake Gold, Ltd. | | | 75,000 | | | | 2,588,250 | | | | 1.1 | | | | – | | | | – | | | | – | |
| Maverix Metals, Inc. (1) | | | 1,000,000 | | | | 3,995,265 | | | | 1.8 | | | | – | | | | – | | | | – | |
| New Gold, Inc.(1) | | | – | | | | – | | | | – | | | | 500,000 | | | | 1,145,000 | | | | 0.5 | |
| OceanaGold Corp. | | | 2,154,013 | | | | 5,944,413 | | | | 2.6 | | | | 2,654,013 | | | | 6,534,657 | | | | 2.8 | |
| Orla Mining, Ltd. (1) | | | 4,250,000 | | | | 3,270,198 | | | | 1.4 | | | | – | | | | – | | | | – | |
| Pretium Resources, Inc.(1) | | | 725,000 | | | | 6,184,250 | | | | 2.7 | | | | 725,000 | | | | 5,234,500 | | | | 2.2 | |
| Roxgold, Inc.(1) | | | 5,200,000 | | | | 4,270,494 | | | | 1.9 | | | | 2,827,200 | | | | 2,662,229 | | | | 1.1 | |
| SEMAFO, Inc.(1) | | | 1,750,000 | | | | 5,243,785 | | | | 2.3 | | | | 900,000 | | | | 2,452,146 | | | | 1.0 | |
| SSR Mining, Inc. (1) | | | 600,000 | | | | 7,008,000 | | | | 3.1 | | | | – | | | | – | | | | – | |
| Tahoe Resources, Inc. | | | – | | | | – | | | | – | | | | 708,200 | | | | 3,711,545 | | | | 1.6 | |
| TMAC Resources, Inc.(1) | | | 26,500 | | | | 120,187 | | | | 0.1 | | | | 26,500 | | | | 125,382 | | | | 0.1 | |
| TMAC Resources, Inc. 144A(1)(2) | | | 185,000 | | | | 839,043 | | | | 0.4 | | | | 185,000 | | | | 875,309 | | | | 0.4 | |
| Torex Gold Resources, Inc.(1) | | | 330,000 | | | | 3,027,523 | | | | 1.3 | | | | 330,000 | | | | 3,224,606 | | | | 1.4 | |
| Torex Gold Resources, Inc. 144A(1)(2) | | | 130,000 | | | | 1,192,661 | | | | 0.5 | | | | 130,000 | | | | 1,270,299 | | | | 0.5 | |
| | | | | | | | 121,832,965 | | | | 53.7 | | | | | | | | 118,267,401 | | | | 50.6 | |
| Cayman Islands | | | | | | | | | | | | | | | | | | | | | | | | |
| Endeavour Mining Corp.(1) | | | 500,000 | | | | 7,465,226 | | | | 3.3 | | | | 250,000 | | | | 4,339,688 | | | | 1.9 | |
| Channel Islands | | | | | | | | | | | | | | | | | | | | | | | | |
| Centamin PLC | | | 1,500,000 | | | | 1,709,085 | | | | 0.8 | | | | – | | | | – | | | | – | |
| Lydian International, Ltd.(1) | | | – | | | | – | | | | – | | | | 1,780,000 | | | | 467,119 | | | | 0.2 | |
| Lydian International, Ltd.(1)(3) | | | 3,369,000 | | | | 436,206 | | | | 0.2 | | | | 5,714,475 | | | | 1,499,630 | | | | 0.6 | |
| Lydian International, Ltd. 144A(1)(2) | | | – | | | | – | | | | – | | | | 6,879,300 | | | | 1,805,312 | | | | 0.8 | |
| Randgold Resources, Ltd. ADR | | | – | | | | – | | | | – | | | | 229,100 | | | | 18,218,032 | | | | 7.8 | |
| | | | | | | | 2,145,291 | | | | 1.0 | | | | | | | | 21,990,093 | | | | 9.4 | |
| Peru | | | | | | | | | | | | | | | | | | | | | | | | |
| Compañia de Minas Buenaventura S.A.A. ADR | | | 450,000 | | | | 6,826,500 | | | | 3.0 | | | | 699,000 | | | | 10,813,530 | | | | 4.6 | |
| The notes to financial statements form an integral part of these statements. |
Schedules of Investments (Unaudited) (continued)
May 31, 2019 and May 31, 2018
| | | 2019 | | 2018 |
| Name of Company | | | Shares | | | | Value | | | | % of Net
Assets | | | | Shares | | | | Value | | | | % of Net
Assets | |
| Common Shares (continued) |
Gold mining, exploration, development and royalty companies (continued) |
| South Africa | | | | | | | | | | | | | | | | | | | | | | | | |
| AngloGold Ashanti, Ltd. | | | 898,420 | | | $ | 11,940,002 | | | | 5.3 | % | | | 898,420 | | | $ | 7,744,380 | | | | 3.3 | % |
| Gold Fields, Ltd. | | | 1,029,577 | | | | 4,591,913 | | | | 2.0 | | | | 1,029,577 | | | | 3,675,590 | | | | 1.6 | |
| Gold Fields, Ltd. ADR | | | 670,423 | | | | 2,990,087 | | | | 1.3 | | | | – | | | | – | | | | – | |
| Sibanye Gold, Ltd.(1) | | | 1,092,174 | | | | 1,056,678 | | | | 0.5 | | | | 1,092,174 | | | | 704,452 | | | | 0.3 | |
| | | | | | | | 20,578,680 | | | | 9.1 | | | | | | | | 12,124,422 | | | | 5.2 | |
| United States | | | | | | | | | | | | | | | | | | | | | | | | |
| Newmont Goldcorp Corp. | | | 400,000 | | | | 13,236,000 | | | | 5.8 | | | | 570,368 | | | | 22,204,426 | | | | 9.5 | |
| Royal Gold, Inc. | | | 30,000 | | | | 2,639,700 | | | | 1.2 | | | | 190,000 | | | | 17,035,400 | | | | 7.3 | |
| | | | | | | | 15,875,700 | | | | 7.0 | | | | | | | | 39,239,826 | | | | 16.8 | |
| Total gold mining, exploration, development and royalty companies |
| (Cost $177,198,955 - 2019, $194,160,880 - 2018) | | | | | | | 213,763,099 | | | | 94.3 | | | | | | | | 222,740,910 | | | | 95.3 | |
| Silver mining, exploration and development companies |
| Canada | | | | | | | | | | | | | | | | | | | | | | | | |
| Americas Silver Corp.(1) | | | 995,000 | | | | 1,707,902 | | | | 0.8 | | | | – | | | | – | | | | – | |
| MAG Silver Corp.(1) | | | 325,000 | | | | 3,178,825 | | | | 1.4 | | | | 325,000 | | | | 3,790,329 | | | | 1.6 | |
| | | | | | | | 4,886,727 | | | | 2.2 | | | | | | | | 3,790,329 | | | | 1.6 | |
| Mexico | | | | | | | | | | | | | | | | | | | | | | | | |
| Fresnillo PLC | | | 400,000 | | | | 3,883,775 | | | | 1.7 | | | | – | | | | – | | | | – | |
| Total silver mining, exploration and development companies |
| (Cost $8,725,552 - 2019, $2,541,688 - 2018) | | | | | | | 8,770,502 | | | | 3.9 | | | | | | | | 3,790,329 | | | | 1.6 | |
| Diamond mining, exploration and development companies |
| Bermuda | | | | | | | | | | | | | | | | | | | | | | | | |
| Petra Diamonds, Ltd.(1) | | | – | | | | – | | | | – | | | | 1,000,000 | | | | 823,532 | | | | 0.4 | |
| Canada | | | | | | | | | | | | | | | | | | | | | | | | |
| Stornoway Diamond Corp.(1) | | | – | | | | – | | | | – | | | | 1,389,500 | | | | 520,151 | | | | 0.2 | |
| Stornoway Diamond Corp. 144A(1)(2) | | | – | | | | – | | | | – | | | | 9,698,550 | | | | 3,630,593 | | | | 1.6 | |
| | | | | | | | – | | | | – | | | | | | | | 4,150,744 | | | | 1.8 | |
| Total diamond mining, exploration and development companies |
| (Cost $0 - 2019, $10,222,661 - 2018) | | | | | | | – | | | | – | | | | | | | | 4,974,276 | | | | 2.2 | |
| Diversified metals mining, exploration, development and royalty companies |
| Canada | | | | | | | | | | | | | | | | | | | | | | | | |
| Adventus Zinc Corp.(1) | | | 978,000 | | | | 774,238 | | | | 0.3 | | | | – | | | | – | | | | – | |
| Total diversified metals mining, exploration, development and royalty companies |
| (Cost $766,825 - 2019, $0 - 2018) | | | | | | | 774,238 | | | | 0.3 | | | | | | | | – | | | | – | |
| Total common shares | | | | | | | | | | | | | | | | | | | | | | | | |
| (Cost $186,691,332 - 2019, $206,925,229 - 2018) | | | | | | | 223,307,839 | | | | 98.5 | | | | | | | | 231,505,515 | | | | 99.1 | |
| Rights | | | | | | | | | | | | | | | | | | | | | | | | |
| Silver mining, exploration and development companies |
| Canada | | | | | | | | | | | | | | | | | | | | | | | | |
| Pan American Silver Corp.(1)(4) | | | 393,200 | | | | 63,727 | | | | 0.0 | | | | – | | | | – | | | | – | |
| Total rights | | | | | | | | | | | | | | | | | | | | | | | | |
| (Cost $136,720 - 2019, $0 - 2018) | | | | | | | 63,727 | | | | 0.0 | | | | | | | | – | | | | – | |
| Warrants | | | | | | | | | | | | | | | | | | | | | | | | |
| Gold mining, exploration, development and royalty companies |
| Canada | | | | | | | | | | | | | | | | | | | | | | | | |
| Maverix Metals, Inc.(4) | | | 250,000 | | | | 443,918 | | | | 0.2 | | | | – | | | | – | | | | – | |
| Total warrants | | | | | | | | | | | | | | | | | | | | | | | | |
| (Cost $462,201 - 2019, $0 - 2018) | | | | | | | 443,918 | | | | 0.2 | | | | | | | | – | | | | – | |
| The notes to financial statements form an integral part of these statements. |
Schedules of Investments (Unaudited) (continued)
May 31, 2019 and May 31, 2018
| | | 2019 | | | 2018 |
| Investments, at value | | | | | | | | | | | | |
| (Cost $187,290,253 - 2019, $206,925,229 - 2018) | | $ | 223,815,484 | | | | 98.7 | % | | $ | 231,505,515 | | | | 99.1 | % |
| Cash, receivables and other assets less other liabilities | | | 3,014,315 | | | | 1.3 | | | | 2,118,906 | | | | 0.9 | |
| Net assets | | $ | 226,829,799 | | | | 100.0 | % | | $ | 233,624,421 | | | | 100.0 | % |
| ADR | American Depositary Receipt |
| PLC | Public Limited Company |
| (1) | Non-income producing security. |
| (2) | Security exempt from registration under Rule 144A under the Securities Act of 1933. At the period end, the value of these securities amounted on May 31, 2019 and May 31, 2018 to $4,675,816 and $11,678,071 or 2.1% and 5.0% of net assets, respectively. |
| (4) | Security fair valued in accordance with procedures adopted by the Board of Directors. At the period end, the value of these securities amounted to $507,645 or 0.2% of net assets. |
Portfolio Statistics (Unaudited)
May 31, 2019 and May 31, 2018
| Geographic Breakdown* | | 2019 | | | 2018 | |
| Australia | | | 17.2 | % | | | 6.8 | % |
| Bermuda | | | 0.0 | | | | 0.4 | |
| Canada | | | 56.4 | | | | 54.0 | |
| Cayman Islands | | | 3.3 | | | | 1.9 | |
| Channel Islands | | | 1.0 | | | | 9.4 | |
| Mexico | | | 1.7 | | | | 0.0 | |
| Peru | | | 3.0 | | | | 4.6 | |
| South Africa | | | 9.1 | | | | 5.2 | |
| United States | | | 7.0 | | | | 16.8 | |
| Cash | | | 1.3 | | | | 0.9 | |
| | | | 100.0 | % | | | 100.0 | % |
| * | Geographic breakdown, which is based on company domiciles, is expressed as a percentage of total net assets including cash. |
| The notes to financial statements form an integral part of these statements. |
Principal Portfolio Changes in Shares for the Periods Ended (Unaudited)
May 31, 2019 and May 31, 2018
| | | 2019 | | | 2018 | |
| Investments | | Increase | | | Decrease | | | Increase | | | Decrease | |
| Adventus Zinc Corp. | | | 978,000 | | | | - | | | | - | | | | - | |
| Agnico Eagle Mines, Ltd. | | | - | | | | 25,000 | | | | - | | | | - | |
| Alamos Gold, Inc. | | | 625,000 | | | | - | | | | - | | | | - | |
| Americas Silver Corp. | | | 995,000 | | | | - | | | | - | | | | - | |
| Atlantic Gold Corp. 144A | | | - | | | | 2,750,000 | | | | - | | | | - | |
| B2Gold Corp. | | | 1,405,662 | | | | 1,228,925 | | | | - | | | | - | |
| Barrick Gold Corp.(1) | | | 1,403,925 | | | | 393,200 | | | | - | | | | - | |
| Bellevue Gold, Ltd. | | | 3,000,000 | | | | - | | | | - | | | | - | |
| Belo Sun Mining Corp. | | | - | | | | 2,600,000 | | | | - | | | | - | |
| Centerra Gold, Inc. | | | 675,000 | | | | - | | | | - | | | | - | |
| Compañia de Minas Buenaventura S.A.A. ADR | | | - | | | | 249,000 | | | | - | | | | - | |
| Dacian Gold, Ltd. | | | 4,000,000 | | | | - | | | | - | | | | - | |
| Echo Resources, Ltd. 144A | | | 8,654,332 | | | | - | | | | - | | | | - | |
| Echo Resources, Ltd. | | | 642,307 | | | | - | | | | - | | | | - | |
| Eldorado Gold Corp. | | | - | | | | - | | | | - | | | | 1,296,570 | |
| Endeavour Mining Corp. | | | 250,000 | | | | - | | | | - | | | | - | |
| Franco-Nevada Corp. | | | - | | | | 100,000 | | | | - | | | | - | |
| Gold Fields, Ltd. ADR | | | 670,423 | | | | - | | | | - | | | | - | |
| Goldcorp, Inc.(2) | | | | | | | 932,400 | | | | - | | | | - | |
| Golden Star Resources, Ltd. | | | 285,366 | | | | - | | | | 2,900,000 | | | | - | |
| Guyana Goldfields, Inc. | | | - | | | | - | | | | - | | | | 50,000 | |
| IAMGOLD Corp. | | | - | | | | - | | | | 350,000 | | | | - | |
| Kirkland Lake Gold, Ltd. | | | 75,000 | | | | - | | | | - | | | | - | |
| Lydian International, Ltd. | | | | | | | 1,780,000 | | | | | | | | | |
| Lydian International, Ltd. | | | | | | | 2,345,475 | | | | | | | | | |
| Lydian International, Ltd. 144A | | | | | | | 4,879,300 | | | | | | | | | |
| Maverix Metals, Inc.(3) | | | 2,000,000 | | | | 1,000,000 | | | | - | | | | - | |
| Maverix Metals, Inc. (Warrant)(3) | | | 500,000 | | | | 250,000 | | | | - | | | | - | |
| Newcrest Mining, Ltd. | | | - | | | | 115,000 | | | | - | | | | - | |
| Newmont Mining Corp.(2) | | | 262,400 | | | | 432,768 | | | | - | | | | - | |
| Northern Star Resources, Ltd. | | | 900,000 | | | | - | | | | - | | | | - | |
| Orla Mining, Ltd. | | | 4,250,000 | | | | - | | | | - | | | | - | |
| Pantoro, Ltd. 144A | | | 13,000,000 | | | | - | | | | - | | | | - | |
| Pantoro, Ltd. | | | 2,000,000 | | | | - | | | | - | | | | - | |
| Perseus Mining, Ltd. | | | 11,000,000 | | | | - | | | | - | | | | - | |
| Petra Diamonds, Ltd. | | | - | | | | 1,000,000 | | | | - | | | | - | |
| Randgold Resources, Ltd. ADR(1) | | | - | | | | - | | | | - | | | | 25,000 | |
| Roxgold, Inc. | | | 2,372,800 | | | | - | | | | - | | | | - | |
| Royal Gold, Inc. | | | - | | | | 135,000 | | | | - | | | | - | |
| SEMAFO, Inc. | | | 850,000 | | | | - | | | | - | | | | - | |
| SSR Mining, Inc. | | | 600,000 | | | | - | | | | - | | | | - | |
| Stornoway Diamond Corp. 144A | | | - | | | | 9,698,550 | | | | - | | | | - | |
| Stornoway Diamond Corp. | | | - | | | | 1,389,500 | | | | - | | | | - | |
| Tahoe Resources, Inc.(4) | | | - | | | | 593,200 | | | | - | | | | - | |
| Torex Gold Resources, Inc. 144A | | | - | | | | - | | | | 5,000 | | | | - | |
| Westgold Resources, Ltd. | | | 3,000,000 | | | | - | | | | - | | | | - | |
| (1) | On January 2, 2019, Randgold Resources, Ltd. merged into Barrick Gold Corp. Each share of Randgold Resources, Ltd. was issued 6.128 shares of Barrick Gold Corp. |
| (2) | On April 18, 2019, Goldcorp, Inc. merged into Newmont Mining Corp. Each share of Goldcorp, Inc. was issued 0.0328 shares of Newmont Mining Corp and $0.02. |
| (3) | On May 23, 2019, Maverix Metals, Inc. shares had a 1 for 2 reverse stock split. |
| (4) | On February 22, 2019, Tahoe Resouces, Inc. was acquired by PanAmerican Silver Corp. Each share of Tahoe Resources, Inc. was acquired for $3.40. |
The notes to financial statements form an integral part of these statements.
Statements of Assets and Liabilities (Unaudited)
May 31, 2019 and May 31, 2018
| | | 2019 | | | 2018 | |
| Assets | | | | | | |
| Investments, at value | | | | | | |
| Cost $187,290,253 in 2019 | | | | | | | | |
| $206,925,229 in 2018 | | $ | 223,815,484 | | | $ | 231,505,515 | |
| Cash and cash equivalents | | | 3,653,080 | | | | 2,950,746 | |
| Dividends receivable, net of withholding taxes payable | | | 195,552 | | | | 62,438 | |
| Other assets | | | 62,780 | | | | 120,445 | |
| Total assets | | $ | 227,726,896 | | | $ | 234,639,144 | |
| | | | | | | | | |
| Liabilities | | | | | | | | |
| Securities purchased payable | | $ | 227,395 | | | $ | - | |
| Accrued affiliate expenses | | | 148,903 | | | | 438,702 | |
| Liability for retirement benefits due to current and future retired directors | | | 436,152 | | | | 433,679 | |
| Other expenses | | | 84,647 | | | | 142,343 | |
| Total liabilities | | $ | 897,097 | | | $ | 1,014,724 | |
| Net assets | | $ | 226,829,799 | | | $ | 233,624,421 | |
| | | | | | | | | |
| Common shares $1 par value | | | | | | | | |
| Authorized: 40,000,000 shares | | | | | | | | |
| Issued and Outstanding: 19,289,905 shares | | $ | 19,289,905 | | | $ | 19,289,905 | |
| Share premium (capital surplus) | | | 1,372,500 | | | | 1,372,500 | |
| Distributable earnings | | | 206,167,394 | | | | 212,962,016 | * |
| Net assets | | $ | 226,829,799 | | | $ | 233,624,421 | |
| Net asset value per share | | $ | 11.76 | | | $ | 12.11 | |
| | | | | | | | | |
| *Distributable earnings as of May 31, 2018 consist of the following: | | | | | | | | |
| Undistributed net investment income | | | | | | $ | 6,399,778 | |
| Undistributed net realized gain from investments | | | | | | | 301,016,468 | |
| Undistributed net realized loss from foreign currency transactions | | | | | | | (119,034,518 | ) |
| Net unrealized appreciation on investments | | | | | | | 24,580,288 | |
| Total distributable earnings | | | | | | $ | 212,962,016 | |
The closing price of the Company’s shares on the New York Stock Exchange was $9.90 and $10.40 on May 31, 2019 and May 31, 2018, respectively.
The notes to financial statements form an integral part of these statements.
Statements of Operations (Unaudited)
For the six months ended May 31, 2019 and May 31, 2018
| | | 2019 | | | 2018 | |
| Investment income | | | | | | | | |
| Dividend income (net of withholding taxes of $348,007 and $163,344, respectively, and ADR fees of $4,582 and $4,582, respectively) | | $ | 1,718,731 | | | $ | 1,013,729 | |
| Total investment income | | | 1,718,731 | | | | 1,013,729 | |
| | | | | | | | | |
| Expenses | | | | | | | | |
| Investment research | | | 681,521 | | | | 486,369 | |
| Administration and operations | | | 342,121 | | | | 587,024 | |
| Investment adviser fees | | | 234,989 | | | | – | |
| Fund services fees | | | 25,491 | | | | – | |
| Compliance services fees | | | 52,000 | | | | – | |
| Fund accounting | | | 62,442 | | | | 83,288 | |
| Transfer agent, registrar and custodian | | | – | | | | 69,975 | |
| Transfer agent fees | | | 41,602 | | | | – | |
| Custodian fees | | | 37,500 | | | | – | |
| Directors’ fees and expenses | | | 85,225 | | | | 115,768 | |
| Retired directors’ fees | | | 43,375 | | | | 33,750 | |
| Insurance | | | 80,540 | | | | 78,733 | |
| Legal fees | | | 168,503 | | | | 73,428 | |
| Audit fees | | | 17,500 | | | | 27,500 | |
| Professional fees – other | | | 1,000 | | | | 1,000 | |
| Shareholder reports and proxy expenses | | | 85,825 | | | | 63,872 | |
| Dues and listing fees | | | 12,500 | | | | 12,500 | |
| Other expenses | | | 28,440 | | | | – | |
| Total expenses | | | 2,000,574 | | | | 1,633,207 | |
| Change in retirement benefits due to directors | | | (5,979 | ) | | | (52,883 | ) |
| Net expenses | | | 1,994,595 | | | | 1,580,324 | |
| Net investment loss | | | (275,864 | ) | | | (566,595 | ) |
| | | | | | | | | |
| Net realized and unrealized gain (loss) from investments and foreign currency transactions | | | | | | | | |
| Proceeds from sales | | | 67,402,924 | | | | 3,846,208 | |
| Cost of securities sold | | | 80,359,456 | | | | 9,586,837 | |
| Net realized loss from investments | | | (12,956,532 | ) | | | (5,740,629 | ) |
| Net realized gain (loss) from foreign currency transactions Investments | | | (1,130,722 | ) | | | 39,542 | |
| Foreign currency | | | – | | | | (574 | ) |
| Net realized gain (loss) from foreign currency transactions | | | (1,130,722 | ) | | | 38,968 | |
| Net change in unrealized appreciation (depreciation) on investments Balance, beginning of period | | | (10,027,414 | ) | | | 28,503,384 | |
| Balance, end of period | | | 36,525,231 | | | | 24,580,288 | |
| Net change in unrealized appreciation (depreciation) on investments | | | 46,552,645 | | | | (3,923,096 | ) |
| Net unrealized loss on translation of assets and liabilities in foreign currency | | | (828 | ) | | | – | |
| Net realized and unrealized gain (loss) from investments and foreign currency transactions | | | 32,464,563 | | | | (9,624,757 | ) |
| Net increase (decrease) in net assets resulting from operations | | $ | 32,188,699 | | | $ | (10,191,352 | ) |
The notes to financial statements form an integral part of these statements.
Statement of Changes in Net Assets
| | | Six Months
Ended
May 31, 2019
(Unaudited) | | | Year Ended
November 30,
2018 | |
| Net investment loss | | $ | (275,864 | ) | | $ | (1,408,709 | ) |
| Net realized loss | | | (12,956,532 | ) | | | (9,051,561 | ) |
| Net realized gain (loss) from foreign currency transactions | | | (1,130,722 | ) | | | 202,193 | |
| Net change in unrealized appreciation (depreciation) on investments | | | 46,552,645 | | | | (38,530,798 | ) |
| Net unrealized loss on translation of assets and liabilities in foreign currency | | | (828 | ) | | | – | |
| Net increase (decrease) in net assets resulting from operations | | | 32,188,699 | | | | (48,788,875 | ) |
| Dividends paid/payable | | | (192,899 | ) | | | (578,697 | ) |
| Net increase (decrease) in net assets | | | 31,995,800 | | | | (49,367,572 | ) |
| Net assets, beginning of period | | | 194,833,999 | | | | 244,201,571 | |
| Net assets, end of period | | $ | 226,829,799 | | | $ | 194,833,999 | |
The notes to financial statements form an integral part of these statements.
Notes to Financial Statements (Unaudited)
Six months ended May 31, 2019 and May 31, 2018
ASA Gold and Precious Metals Limited (the “Company”) is a closed-end investment company registered under the Investment Company Act of 1940, as amended (the “1940 Act”), and was organized as an exempted limited liability company under the laws of Bermuda.
| 2. | Investment objective and strategy |
The Company is a non-diversified, closed-end fund that seeks long-term capital appreciation primarily through investing in companies engaged in the exploration for, development of projects or mining of precious metals and minerals. The Company is managed by Merk Investments LLC (the “Adviser”).
It is a fundamental policy of the Company that at least 80% of its total assets must be (i) invested in common shares or securities convertible into common shares of companies engaged, directly or indirectly, in the exploration, mining or processing of gold, silver, platinum, diamonds or other precious minerals, (ii) held as bullion or other direct forms of gold, silver, platinum or other precious minerals, (iii) invested in instruments representing interests in gold, silver, platinum or other precious minerals such as certificates of deposit therefor, and/or (iv) invested in securities of investment companies, including exchange traded funds, or other securities that seek to replicate the price movement of gold, silver or platinum bullion.
The Company employs bottom-up fundamental analysis and relies on detailed primary research including meetings with company executives, site visits to key operating assets, and proprietary financial analysis in making its investment decisions.
| 3. | Summary of significant accounting policies |
The following is a summary of the significant accounting policies:
A. Security valuation
The net asset value of the Company generally is determined as of the close of regular trading on the New York Stock Exchange (the “NYSE”) or the Toronto Stock Exchange (the “TSX”), whichever is later, on the date for which the valuation is being made (the “Valuation Time”). Portfolio securities listed on U.S. and foreign stock exchanges generally are valued at the last reported sale price as of the Valuation Time on the exchange on which the securities are primarily traded, or the last reported bid price if a sale price is not available. Securities traded over the counter are valued at the last reported sale price or the last reported bid price if a sale price is not available.
Securities listed on foreign stock exchanges may be fair valued based on significant events that have occurred subsequent to the close of the foreign markets. Securities for which current market quotations are not readily available are valued at their fair value as determined in good faith by, or in accordance with procedures approved by, the Company’s Board of Directors. If a security is valued at a “fair value,” that value may be different from the last quoted price for the security. Various factors may be reviewed in order to make a good faith determination of a security’s fair value. These factors include, but are not limited to, the nature of the security; relevant financial or business developments of the issuer; actively traded similar or related securities; conversion rights on the security; and changes in overall market conditions.
Where the Company holds securities listed on foreign stock exchanges and American Depository Receipts (“ADRs”) representing these securities are actively traded in U.S. markets, the securities normally are fair valued based on the last reported sales price of the ADRs.
The difference between cost and market value is reflected separately as net unrealized appreciation (depreciation) on investments. The net realized gain or loss from the sale of securities is determined for accounting purposes on the identified cost basis.
Notes to Financial Statements (Unaudited) (continued)
Six months ended May 31, 2019 and May 31, 2018
| 3. | Summary of significant accounting policies (continued) |
B. Restricted securities
At May 31, 2019 and May 31, 2018, the Company held investments in restricted securities of 0.19% and 0.64% of net assets, respectively, valued in accordance with procedures approved by the Company’s Board of Directors as follows:
Restricted Securities
May 31, 2019 | |
| Shares | | | Cost | | | Issuer | | Value Per
Unit | | | Value | | | Acquisition
Date | |
| | 3,369,000 | | | $ | 662,485 | | | Lydian International, Ltd. | | $ | 0.13 | | | $ | 436,206 | | | | 11/30/17* | |
| * | Acquisition date represents the conversion of warrant position to common stock. |
Restricted Securities
May 31, 2018 | |
| Shares | | | Cost | | | Issuer | | Value Per
Unit | | | Value | | | Acquisition
Date | |
| | 5,714,475 | | | $ | 1,869,119 | | | Lydian International, Ltd. | | $ | 0.26 | | | $ | 1,499,630 | | | | 11/30/17* | |
| * | Acquisition date represents the conversion of warrant position to common stock. |
C. Fair value measurement
In accordance with accounting principles generally accepted in the United States of America (“U.S. GAAP”), fair value is defined as the price that the Company would receive to sell an investment or pay to transfer a liability in a timely transaction with an independent buyer in the principal market, or in the absence of a principal market the most advantageous market for the investment or liability. U.S. GAAP establishes a three-tier hierarchy to distinguish between (1) inputs that reflect the assumptions market participants would use in pricing an asset or liability developed based on market data obtained from sources independent of the reporting entity (observable inputs) and (2) inputs that reflect the reporting entity’s own assumptions about the assumptions market participants would use in pricing an asset or liability developed based on the best information available in the circumstances (unobservable inputs) and to establish classification of fair value measurements for disclosure purposes. Various inputs are used in determining the value of the Company’s investments. The inputs are summarized in the three broad levels listed below.
| Level 1 – | Unadjusted quoted prices in active markets for identical assets or liabilities that the Company has the ability to access. |
| Level 2 – | Observable inputs other than quoted prices included in level 1 that are observable for the asset or liability either directly or indirectly. These inputs may include quoted prices for identical instruments on an inactive market, prices for similar investments, interest rates, prepayment speeds, credit risk, yield curves, default rates, and similar data. |
| Level 3 – | Unobservable inputs for the assets or liability to the extent that relevant observable inputs are not available, representing the Company’s own assumptions about the assumptions that a market participant would use in valuing the asset or liability, and that would be based on the best information available. |
The inputs or methodology used for valuing securities are not necessarily an indication of the risk associated with investing in those securities.
The following is a summary of the inputs used as of May 31, 2019 and May 31, 2018 in valuing the Company’s investments at fair value:
Notes to Financial Statements (Unaudited) (continued)
Six months ended May 31, 2019 and May 31, 2018
| 3. | Summary of significant accounting policies (continued) |
C. Fair value measurement (continued)
Investment in Securities (1) Measurements at May 31, 2019 | |
| | | Level 1 | | | Level 2 | | | Level 3 | | | Total | |
| Common Shares | | | | | | | | | | | | |
| Gold mining, exploration, development and royalty companies | | $ | 213,763,099 | | | $ | – | | | $ | – | | | $ | 213,763,099 | |
| Silver mining, exploration and development companies | | | 8,770,502 | | | | – | | | | – | | | | 8,770,502 | |
| Diversified metals mining, exploration, development and royalty companies | | | 774,238 | | | | – | | | | – | | | | 774,238 | |
| Rights | | | – | | | | – | | | | – | | | | – | |
| Silver mining, exploration and development companies | | | – | | | | – | | | | 63,727 | | | | 63,727 | |
| Warrants | | | – | | | | – | | | | – | | | | – | |
| Gold mining, exploration, development and royalty companies | | | – | | | | – | | | | 443,918 | | | | 443,918 | |
| Total Investments | | $ | 223,307,839 | | | $ | – | | | $ | 507,645 | | | $ | 223,815,484 | |
See schedules of investments for country classifications.
Investment in Securities (1) Measurements at May 31, 2018 | |
| | | Level 1 | | | Level 2 | | | Level 3 | | | Total | |
| Common Shares | | | | | | | | | | | | |
| Gold mining, exploration, development and royalty companies | | $ | 185,103,431 | | | $ | 37,637,481 | | | $ | – | | | $ | 222,740,912 | |
| Silver mining, exploration and development companies | | | 3,790,329 | | | | – | | | | – | | | | 3,790,329 | |
| Diamond mining, exploration, development and royalty companies | | | 1,343,683 | | | | 3,630,593 | | | | – | | | | 4,974,277 | |
| Total Investments | | $ | 190,237,443 | | | $ | 41,268,074 | | | $ | – | | | $ | 231,505,517 | |
See schedules of investments for country classifications.
The following is a reconciliation of Level 3 investments for which significant unobservable inputs were used to determine fair value.
| | | Rights | | | Warrants | |
| Balance November 30, 2018 | | $ | – | | | $ | – | |
| Purchases | | | – | | | | 129,088 | |
| Transfers In | | | 63,727 | | | | – | |
| Net change in unrealized depreciation | | | – | | | | 314,830 | |
| Balance May 31, 2019 | | $ | 63,727 | | | $ | 443,918 | |
| Net change in unrealized appreciation (depreciation) from investments held as of May 31, 2019* | | $ | – | | | $ | 314,830 | |
| * | The change in unrealized appreciation/(depreciation) is included in net change in unrealized appreciation/(depreciation) of investments in the accompanying Statement of Operations. |
Notes to Financial Statements (Unaudited) (continued)
Six months ended May 31, 2019 and May 31, 2018
| 3. | Summary of significant accounting policies (continued) |
D. Cash and Cash Equivalents
The Company considers all money market funds and all highly liquid temporary cash investments purchased with an original maturity of less than three months to be cash equivalents. The majority of the Company’s cash and cash equivalents at May 31, 2019, consisted of overnight deposit of excess funds in a commercial paper sweep account held at JPMorgan Chase & Co (“JPM”).
E. Foreign Currency Translation
Portfolio securities and other assets and liabilities denominated in foreign currencies are translated into U.S. dollar amounts at the rate of exchange reported by independent data providers. Purchases and sales of investment securities and income and expense items denominated in foreign currencies are translated into U.S. dollar amounts on the respective dates of such transactions. The Company separately reports the effect of changes in foreign exchange rates from changes in market prices of securities held. The resulting net foreign currency gain or loss is included on the Statements of Operations. Realized foreign currency gains or losses arise from sales of foreign currencies, currency gains or losses realized between the trade and settlement dates on securities transactions, fluctuation in exchange rates between the initial purchase date and subsequent sale date on securities transactions, and the difference between the amounts of dividends, interest, and foreign withholding taxes recorded on the Company’s books and the U.S. dollar equivalent of the amounts actually received or paid.
F. Securities Transactions and Investment Income
During the six months ended May 31, 2019, sales and purchases of portfolio securities (other than temporary short-term investments) amounted to $67,402,924 and $66,372,341, respectively. During the six months ended May 31, 2018, sales and purchases of portfolio securities (other than temporary short-term investments) amounted to $3,846,208 and $3,985,831, respectively.
Dividend income is recorded on the ex-dividend date, net of withholding taxes or ADR fees, if any. Interest income is recognized on the accrual basis.
G. Dividends to Shareholders
Dividends to shareholders are recorded on the ex-dividend date. The reporting for financial statement purposes of dividends paid from net investment income and/or net realized gains may differ from their ultimate reporting for U.S. federal income tax purposes, primarily because of the separate line item reporting for financial statement purposes of foreign exchange gains or losses.
H. Use of Estimates
The preparation of the financial statements in conformity with U.S. GAAP requires management to make estimates and assumptions that affect the amounts reported in the financial statements and accompanying notes. Actual results could differ from those estimates. It is management’s opinion that all adjustments necessary for a fair statement of the results of the interim periods presented have been made. All adjustments are of a normal recurring nature.
I. Basis of Presentation
The financial statements are presented in U.S. dollars. The Company is an investment company and accordingly follows the investment company accounting and reporting guidance of the Financial Accounting Standards Board (“FASB”) Accounting Standard Codification, Topic 946 “Financial Services - Investment Companies”.
J. Income Taxes
In accordance with U.S. GAAP requirements regarding accounting for uncertainties on income taxes, management has analyzed the Company’s tax positions taken on federal and state income tax returns, as applicable, for all open tax years (2015-2018). As of May 31, 2019 and May 31, 2018, the Company has not recorded any unrecognized tax benefits. The Company’s policy, if it had unrecognized benefits, is to recognize accrued interest and penalties in operating expenses.
| 4. | Tax status of the Company |
The Company is a “passive foreign investment company” (“PFIC”) for the U.S. federal income tax purposes and is not subject to Bermuda tax as an exempted limited liability company organized under the laws of Bermuda. Nor is the Company generally subject to U.S. federal income tax, since it is a non-U.S. corporation whose only business activity in the United States is trading in stocks or securities for its own account; under the U.S. federal tax law that activity does not constitute engaging in the conduct of a trade or business within the United States, even if its principal office is
Notes to Financial Statements (Unaudited) (continued)
Six months ended May 31, 2019 and May 31, 2018
| 4. | Tax status of the Company (continued) |
located therein. As a result, its gross income is not subject to U.S. federal income tax, though certain types of income it earns from U.S. sources (such as dividends of U.S. payors) are subject to U.S. federal withholding tax.
Investment Adviser – Effective April 12, 2019, Merk Investments LLC (the “Adviser”) is the investment adviser to the Company. Pursuant to an investment advisory agreement, the Adviser receives an advisory fee, payable monthly, from the Company at an annual rate of 0.70% of the Company’s average daily net assets. Prior to April 12, 2019, the Company was an internally managed fund.
Other Service Providers – On January 7, 2019, the Company entered into an agreement with Atlantic Fund Administration, LLC (d/b/a Atlantic Fund Services) (“Atlantic”) to provide fund accounting, fund administration and compliance services to the Company. The fees related to these services are included in fund services fees within the Statement of Operations. Atlantic also provides certain shareholder report production and EDGAR conversion and filing services. Pursuant to an Atlantic services agreement, the Company pays Atlantic customary fees for its services. Atlantic provides a Principal Financial Officer, as well as certain additional compliance support functions.
Foreside Fund Services, LLC provides a Chief Compliance Officer to the Company.
The Company is a closed-end investment company and operates pursuant to an exemptive order issued by the Securities and Exchange Commission (the “SEC”) pursuant to Section 7(d) of the 1940 Act (the “Order”). The Order is conditioned upon, among other things, the Company complying with certain requirements relating to the custody of assets and settlement of securities transactions outside of the United States different than those required of other registered investment companies. These conditions make it more difficult for the Company to implement a flexible investment strategy and to fully achieve its desired portfolio diversification than if it were not subject to such requirements.
The Company has recorded a liability for retirement benefits due to retired directors. The liability for these benefits at May 31, 2019 and May 31, 2018 was $436,152 and $433,679, respectively. A director whose first election to the Board of Directors was prior to January 1, 2008 qualifies to receive retirement benefits if he has served the Company (and any of its predecessors) for at least twelve years prior to retirement. Directors first elected on or after January 1, 2008 are not eligible to participate in the plan.
The Company invests at least 80% of its total assets in securities of companies engaged, directly or indirectly, in the exploration, mining or processing of gold or other precious minerals. The Company also invests a substantial portion of its assets in companies that are domiciled and/or have operations outside of the United States, including emerging market countries, such as South Africa. The Company is, therefore, subject to gold and precious metals-related risk as well as risk related to investing in foreign securities, including political, economic, regulatory, liquidity, currency fluctuation, and foreign exchange risks. The Company currently is invested in a limited number of securities and thus holds large positions in certain securities. Because the Company’s investments are concentrated in a limited number of securities of companies involved in the holding or mining of gold and other precious minerals and related activities, the net asset value of the Company may be subject to greater volatility than that of a more broadly diversified investment company.
In the ordinary course of business, the Company enters into contracts that contain a variety of indemnification pro-visions. The Company’s maximum exposure under these arrangements is unknown.
For the six months ended May 31, 2019 and May 31, 2018, the aggregate remuneration paid to the Company’s officers was $641,989 and $1,015,792, respectively. In addition, $510,410 and $341,000, respectively, was accrued for bonuses to the Company’s officers and employees. The Company has terminated the employment of its employees effective on March 31, 2019. Due to the employment termination, the unvested portion of the CEO’s deferred bonus from fiscal years
Notes to Financial Statements (Unaudited) (continued)
Six months ended May 31, 2019 and May 31, 2018
| 10. | Compensation matters (continued) |
2017 and 2018 has been fully vested as of May 31, 2019. In addition, the Company accrued $541,280 for severance costs to its employees. The accrued bonuses and severance costs were paid in full as of May 31, 2019.
The aggregate remuneration paid to the Company’s directors for the six months ended May 31, 2019 and May 31, 2018 was $87,580 and $104,000, respectively.
| 11. | Operating lease commitment |
In June 2017, the Company entered into a three-year operating lease agreement, commencing March 1, 2018, in San Mateo, CA for approximately 2,500 square feet to be used as office space for its employees. The lease provides for future minimum rental payments in the aggregate amount of $359,843 as of May 31, 2019. The lease contains escalation clauses relating to the tenant’s share of insurance, operating expenses and tax expenses of the lessor.
Future minimum rental commitments under the lease are as follows:
| 6/01/2019 – 11/30/2019 | | $ | 89,645 | |
| 12/01/2019 – 11/30/2020 | | | 215,842 | |
| 12/01/2020 – 02/28/2021 | | | 54,356 | |
| Total | | $ | 359,843 | |
The Company may from time to time purchase its common shares at a discount to NAV on the open market in such amounts and at such prices as the Company may deem advisable.
The Company had 19,289,905 shares outstanding as of May 31, 2019 and May 31, 2018. There were no repurchases during the years ended May 31, 2019 and May 31, 2018.
In accordance with U.S. GAAP provisions, management has evaluated the possibility of subsequent events existing in the Company’s financial statements through the date the financial statements were issued. On June 5, 2019, the Company entered into a sublease agreement for the San Mateo office space. After a 2 week abatement, the Company expects monthly sublease revenue of $11,308; beginning on the first anniversary of the sublease commencement date, monthly sublease revenue is expected to increase 3%. The sublease agreement terminates February 28, 2021. Management believes that there were no other material events that require disclosure.
Financial Highlights
| | | (Unaudited)
Six months ended May 31 | | | Year ended November 30 | |
| Per share operating performance (1) | | 2019 | | | 2018 | | | 2018 | | | 2017 | | | 2016 | | | 2015 | | | 2014 | |
| Net asset value, beginning of period | | $ | 10.10 | | | $ | 12.66 | | | $ | 12.66 | | | $ | 12.61 | | | $ | 8.33 | | | $ | 11.50 | | | $ | 12.98 | |
| Net investment loss | | | (0.01 | ) | | | (0.03 | ) | | | (0.07 | ) | | | (0.09 | ) | | | (0.10 | ) | | | (0.09 | ) | | | (0.08 | ) |
| Net realized gain (loss) from investments | | | (0.67 | ) | | | (0.30 | ) | | | (0.47 | ) | | | (0.36 | ) | | | (0.79 | ) | | | 0.13 | | | | (0.48 | ) |
| Net realized gain (loss) from foreign currency transactions | | | – | | | | – | | | | 0.01 | | | | 0.01 | | | | (0.14 | ) | | | (0.21 | ) | | | (0.05 | ) |
| Net increase (decrease) in unrealized appreciation on investments | | | 2.41 | | | | (0.20 | ) | | | (2.00 | ) | | | 0.53 | | | | 5.35 | | | | (2.96 | ) | | | (0.83 | ) |
| Net unrealized loss on translation of assets and liabilities in foreign currency | | | (0.06 | ) | | | – | | | | 0.00 | | | | 0.00 | | | | 0.00 | | | | 0.00 | | | | – | |
| Net increase (decrease) in net assets resulting from operations | | | 1.67 | | | | (0.53 | ) | | | (2.53 | ) | | | 0.09 | | | | 4.32 | | | | (3.13 | ) | | | (1.44 | ) |
| Dividends | | | | | | | | | | | | | | | | | | | | | | | | | | | | |
| From net investment income | | | (0.01 | ) | | | (0.02 | ) | | | (0.03 | ) | | | (0.04 | ) | | | (0.04 | ) | | | (0.04 | ) | | | (0.04 | ) |
| Net asset value, end of period | | $ | 11.76 | | | $ | 12.11 | | | $ | 10.10 | | | $ | 12.66 | | | $ | 12.61 | | | $ | 8.33 | | | $ | 11.50 | |
| Market value per share, end of period | | $ | 9.90 | | | $ | 10.40 | | | $ | 8.66 | | | $ | 11.05 | | | $ | 10.81 | | | $ | 7.16 | | | $ | 10.74 | |
| | | | | | | | | | | | | | | | | | | | | | | | | | | | | |
| Total investment return | | | | | | | | | | | | | | | | | | | | | | | | | | | | |
| Based on market price (2) | | | 14.44 | %(3) | | | (5.70 | )%(3) | | | (21.39 | )% | | | 2.57 | % | | | 51.50 | % | | | (33.02 | )% | | | (15.69 | )% |
| Based on net asset value (4) | | | 16.56 | %(3) | | | (4.15 | )%(3) | | | (19.97 | )% | | | 0.74 | % | | | 51.86 | % | | | (27.20 | )% | | | (11.11 | )% |
| | | | | | | | | | | | | | | | | | | | | | | | | | | | | |
| Ratio of average net assets | | | | | | | | | | | | | | | | | | | | | | | | | | | | |
| Expenses | | | 1.78 | %(5) | | | 1.31 | %(5) | | | 1.35 | % | | | 1.19 | % | | | 1.26 | % | | | 1.64 | % | | | 1.37 | % |
| Net investment loss | | | (0.25 | )%(5) | | | (0.47 | )%(5) | | | (0.63 | )% | | | (0.65 | )% | | | (0.79 | )% | | | (0.83 | )% | | | (0.54 | )% |
| | | | | | | | | | | | | | | | | | | | | | | | | | | | | |
| Supplemental data | | | | | | | | | | | | | | | | | | | | | | | | | | | | |
| Net assets, end of Period (000 omitted) | | $ | 226,830 | | | $ | 233,624 | | | $ | 194,834 | | | $ | 244,202 | | | $ | 243,229 | | | $ | 160,744 | | | $ | 221,800 | |
| Portfolio turnover rate | | | 31 | %(3) | | | 2 | %(3) | | | 3 | % | | | 9 | % | | | 10 | % | | | 10 | % | | | 7 | % |
| Shares outstanding (000 omitted) | | | 19,290 | | | | 19,290 | | | | 19,290 | | | | 19,290 | | | | 19,290 | | | | 19,290 | | | | 19,290 | |
| (1) | Per share amounts from operations have been calculated using the average shares method. |
| (2) | Total investment return is calculated assuming a purchase of shares at the current market price at close the day before and a sale at the current market price on the last day of each period reported. Dividends are assumed, for purposes of this calculation, to be reinvested at prices obtained under the Company’s dividend reinvestment plan. |
| (4) | Total investment return is calculated assuming a purchase of shares at the current net asset value at close the day before and a sale at the current net asset value on the last day of each period reported. Dividends are assumed, for purposes of this calculation, to be reinvested at prices obtained under the Company’s dividend reinvestment plan. |
Certain Tax Information for U.S. Shareholders
The Company is a “passive foreign investment company” (“PFIC”) for U.S. federal income tax purposes. In view of this, U.S. investors holding common shares in taxable accounts are strongly urged to review the important tax information regarding the consequences of an investment in the common shares of the Company, which may be found at www.asaltd.com under “Investor Information | Taxpayer Information - PFIC”. Due to the complexity and potentially adverse effect of the applicable tax rules, U.S. shareholders are strongly urged to consult their own tax advisors concerning the impact of these rules on their investment in the Company and on their individual situations, and any additional informational filing requirements.
Dividend Reinvestment and Stock Purchase Plan
Computershare Trust Company, N.A. (“Computershare”) has been authorized by the Company to offer and administer the Computershare Investment Plan, a dividend reinvestment and stock purchase plan (“CIP”) to shareholders as well as new investors or non-shareholders. Shareholders and new investors may elect to participate in the CIP by signing an enrollment form or by going to www.computershare.com/investor and following the instructions. New investors or non-shareholders must include a minimum initial investment of at least $500. Computershare as agent will apply to the purchase of common shares of the Company in the open market (i) all cash dividends (after deduction of the service charge described below) that become payable to such participant on the Company’s shares (including shares registered in his or her name and shares accumulated under the CIP) and (ii) any optional cash purchases ($50 minimum, subject to an annual maximum of $250,000) received from such participant.
Computershare may combine CIP participant purchase requests with other purchase requests received from other CIP participants and may submit the combined purchase requests in bulk to Computershare’s broker as a single purchase order. Purchase requests may be combined, at Computershare’s discretion, according to one or more factors such as purchase type (e.g., dividend reinvestment, one-time ACH, check, etc.), request date, or request delivery method (e.g., online, regular mail, etc.). Computershare will submit bulk purchase orders to its broker as and when required under the terms of the CIP. Computershare’s broker may execute each bulk purchase order in one or more transactions over one or more days, depending on market conditions. Each participant whose purchase request is included in each bulk purchase order will receive the weighted average market price of all shares purchased by Computershare’s broker for such order. Any stock dividends or split shares distributed on shares held in the CIP will be credited to the participant’s account.
A one-time $10 enrollment fee to establish a new account for a new investor or non-shareholder will be deducted from the purchase amount. For each participant, each dividend reinvestment will entail a transaction fee of 5% of the amount reinvested, up to a maximum of $3 plus $0.03 per share purchased. Each optional cash purchase by check or one-time online bank debit will entail a transaction fee of $5 plus $0.03 per share purchased. If a participant has funds automatically deducted monthly from his or her savings or checking account, for each debit the transaction fee is $2.50 plus $0.03 per share purchased. Fees will be deducted from the purchase amount. Each batch order sale will entail a transaction fee of $15 plus $0.12 per share sold. Each market order sale will entail a transaction fee of $25 plus $0.12 per share sold. Fees are deducted from the proceeds derived from the sale. All per share fees include any brokerage commissions Computershare is required to pay. Any fractional share will be rounded up to a whole share for purposes of calculating the per share fee. Additional fees are charged by Computershare for specific shareholder requests such as copies of account statements for prior years ($10 per year requested) and a returned check and ACH reject fee of $25.
Participation in the CIP may be terminated by a participant at any time by written, telephone or Internet instructions to Computershare. Upon termination, a participant will receive a certificate for the whole number of shares credited to his or her account, unless he or she requests the sale of all or part of such shares. Dividends reinvested by a shareholder under the CIP will generally be treated for U.S. federal income tax purposes in the same manner as dividends paid to such shareholder in cash. See “Certain Tax Information for U.S. Shareholders” for more information regarding tax consequences of an investment in shares of the Company, including the effect of the Company’s status as a PFIC. The amount of the service charge is deductible for U.S. federal income tax purposes, subject to limitations.
To participate in the CIP, shareholders may not hold their shares in a “street name” brokerage account.
Additional information regarding the CIP may be obtained from Computershare, P.O. Box 505000, Louisville, KY 40233-5000. Information may also be obtained on the Internet at www.computershare.com/investor or by calling Computershare’s Telephone Response Center at (800) 317-4445 between 9:00 a.m. and 5:00 p.m., Eastern time, Monday through Friday.
Privacy Notice
The Company is committed to protecting the financial privacy of its shareholders.
We do not share any nonpublic, personal information that we may collect about shareholders with anyone, including our affiliates, except to service and administer shareholders’ share accounts, to process transactions, to comply with shareholders’ requests of legal requirements or for other limited purposes permitted by law. For example, the Company may disclose a shareholder’s name, address, social security number and the number of shares owned to its administrator, transfer agent or other service providers in order to provide the shareholder with proxy statements, tax reporting forms, annual reports or other information about the Company. This policy applies to all of the Company’s shareholders and former shareholders.
We keep nonpublic personal information in a secure environment. We restrict access to nonpublic personal information to Company employees, agents and service providers who have a need to know the information based on their role in servicing or administering shareholders’ accounts. The Company also maintains physical, electronic and procedural safeguards to protect the confidentiality of nonpublic personal information.
Board Consideration of Investment Advisory Agreement
At the December 13, 2018 Board meeting, the Board, including the Independent Directors, approved an Investment Advisory Agreement between ASA Gold and Precious Metals Limited (“ASA” or the “Company”) and Merk Investments LLC (“Merk” or the “Adviser”). In preparation for its deliberations, the Board requested and reviewed extensive materials including written responses from the Adviser to a due diligence request circulated on the Board’s behalf concerning the services to be provided to the Company by the Adviser. The Board also discussed the materials with counsel to the Company and the Independent Directors.
The Independent Directors considered the following factors, among others, in connection with their consideration of the Advisory Agreement: (1) the nature, extent, and quality of the services to be provided by Merk; (2) the performance of ASA compared to a relevant market index and a peer group of investment companies; (3) the anticipated costs of the services provided and anticipated profits to be realized by Merk from its relationship with ASA; (4) the extent to which economies of scale might be realized as ASA grows; and (5) whether fee levels reflect any such potential economies of scale for the benefit of investors in ASA. In their deliberations, the Independent Directors did not identify any particular information that was all-important or controlling, and each Director may have attributed different weights to the various factors.
During extensive discussions that lasted over several meetings and included discussions between meetings, the Independent Directors considered the following, among other factors:
| ● | The Company’s unique structure (i.e., the Company is a Bermuda corporation that operates as a closed-end investment company pursuant to an exemptive order issued by the SEC pursuant to Section 7(d) of the 1940 Act, which requires, among other things, that the Company comply with certain requirements relating to the custody of assets and settlement of securities transactions outside of the United States that are different than those required of other registered investment companies). |
| ● | The size of the Company relative to Merk’s other clients and that the Company would be a significant client to Merk; also that the Company will receive the requisite attention from Merk and that Merk has a significant incentive to work proactively and effectively with ASA. |
| ● | ASA’s internal management structure and potential risk against more standard external management structures and after evaluating the potential benefits of each determined that it would be in the best interests of shareholders to replace the Company’s internal management with an external management structure. |
| ● | The transition costs necessarily involved with moving to external management, such as severance expenses for employees, including a required termination payment of $240,000 to the CEO, David Christensen, the overlap of employee and operating expense with costs of administration and accounting for a short period of time, the Company’s lease for office space and additional legal costs associated with obtaining advice on the proxy statement and other matters. The Independent Directors considered that the transition costs associated with retaining Merk as investment adviser were likely to be substantially less than the costs of other options such as liquidation of the Company or seeking a merger with another entity, and that the costs should not deter their decision. |
| ● | The potential reduction of investment management and other expenses, in particular, the potential of Merk to reduce the Company’s costs through economies of scale in operational costs from managing investments for other clients as well as the Company. |
| ● | That a change to an external management structure would provide shareholders with increased transparency and stronger governance procedures through the discipline of their ongoing and annual reviews of Merk. |
In considering the nature, extent and quality of the services to be provided by Merk, the Independent Directors received a presentation by Merk as to the services it would provide and as to its qualifications to manage ASA. The Independent Directors had a full discussion with Merk and determined the firm to be capable and qualified to perform the services to be provided under the Advisory Agreement and that the nature and extent of the services to be provided by Merk would be of high quality. The Independent Directors also noted that Merk has the experience, skills, and capabilities to manage the Company, and considered Merk’s assurance that it would hire additional professionals including an experienced portfolio manager.
The Independent Directors noted that, although the peer funds identified by Merk were limited, the Company’s expense ratio, once the Advisory Agreement took effect and the transition is accomplished, is expected to be fair and reasonable and remain competitive relative to other closed-end funds and investment vehicles with similar investment strategies. The Independent Directors recognized the difficulty of identifying a peer group of funds due to ASA’s unique structure and the limited number of other closed-end funds in this space.
The Independent Directors reviewed the projected profitability of Merk in connection with the provision of services to the Company and Merk’s projected costs in providing services to the Company. The Independent Directors recognized the challenges of estimating costs prior to commencing any work with this type of closed-end fund and, keeping this in mind, concluded that the profitability projections were not excessive. They considered other ways that Merk could benefit from its relationship with the Company and noted that other than the advisory fee, there was no other investment advisory or brokerage fee received or receivable by Merk from the Company, and that there were no affiliated brokers of ASA or Merk that received commissions over the last fiscal year. The Independent Directors concluded that Merk would not, at this point, derive other significant benefits from its relationship with the Company.
The Independent Directors considered that the fees to be paid pursuant to the Advisory Agreement provided a framework to pass on to shareholders potential expense savings. They reviewed comparative information provided by Merk with respect to fees paid by funds identified as peers and noted the difficultly in determining appropriate peer funds due to the Company’s distinctive structure and investment strategy. The Independent Directors determined that the compensation to be paid to Merk would be fair and reasonable in light of the services to be provided and expenses to be incurred by Merk. They determined that due to ASA’s closed-end fund structure and historic asset levels there would be only limited opportunities to grow in size and therefore break points were not needed in the advisory fee structure.
The Independent Directors based their consideration and evaluation of Merk on the information presented and specific factors regarding the nature, extent and quality of services to be provided, including Merk’s experience managing other registered investment companies and the firm’s intention to employ additional investment and operational personnel to support ASA. After considering all information presented, the Independent Directors unanimously voted to approve the Advisory Agreement.
Results of the proposals presented at the annual general meeting of shareholders
The following votes were cast at the Annual General Meeting of Shareholders held on March 26, 2019:
Election of Directors
| | For | Against | Abstain |
| Gary Glynn | 7,544,092 | 384,350 | 84,790 |
| Bruce Hansen | 7,138,514 | 790,059 | 84,659 |
| Mary Joan Hoene | 7,560,468 | 369,965 | 82,799 |
Appointment of Independent Registered Public Accounting Firm
| | For | Against | Abstain |
| Tait, Weller & Baker LLP | 10,049,437 | 1,483,915 | 192,181 |
The following votes were cast April 12, 2019 at the adjournment of the Annual General Meeting of Shareholders:
Approval of Investment Advisory Agreement
| | For | Against | Abstain |
| Merk Investments LLC | 8,140,530 | 379,204 | 86,196 |
Form N-PX/Proxy Voting
The company files a list of its proxy votes with the SEC for the period of July 1 - June 30 of each year on Form N-PX. The policies and procedures used by the Company to determine how to vote proxies relating to portfolio securities and information regarding how the Company voted proxies relating to portfolio securities during the most recent twelve month period are available on the Company’s website at www.asaltd.com and on the SEC’s website at www.sec.gov. A written copy of the Company’s policies and procedures is available without charge, upon request, by calling (800) 432-3378.
Form N-Q/Portfolio Holdings
The Company files its complete schedule of portfolio holdings with the SEC for the first and third quarters of each fiscal year on Form N-Q. The Company’s Forms N-Q are available on the SEC’s website at www.sec.gov. The Company’s Forms N-Q also may be reviewed and copied at the Reference Room in Washington, D.C.; information on the operation of the Public Reference Room may be obtained by calling 1-800-SEC-0330. The schedule of portfolio holdings on Form N-Q also is included in the Company’s financial statements for the first and third quarters of each fiscal year which are available on the Company’s website at www.asaltd.com.
Common Shares Repurchased
Notice is hereby given in accordance with Section 23(c) of the 1940 Act that the Company is authorized to purchase its common shares in the open market if the discount to net asset value exceeds a certain threshold as determined by the Board of Directors from time to time. The Company may purchase its common shares in such amounts and at such prices as the Company may deem advisable. There can be no assurance that such action will reduce the discount. There were no repurchases during the twelve months ended May 31, 2019 or May 31, 2018. The Company had 19,289,905 shares outstanding on May 31, 2019.
Gold and Precious Metals Limited
Other Information
Shareholder Services
ASA Gold and Precious Metals Limited
Three Canal Plaza, Suite 600
Portland, ME 04101 U.S.A.
(800) 432-3378
Registered Office
Canon’s Court
22 Victoria Street
Hamilton HM 12, Bermuda
Investment Adviser
Merk Investments LLC
San Francisco, CA
Independent Registered Public Accounting Firm
Tait, Weller & Baker LLP, Philadelphia, PA, U.S.A.
Counsel
Appleby, Hamilton, Bermuda
K&L Gates LLP, Washington, DC, U.S.A.
Custodian
JPMorgan Chase Bank, N.A.
New York, NY, U.S.A.
Fund Administrator
Atlantic Fund Services, LLC
Portland, ME, U.S.A.
Transfer Agent
Computershare Trust Company, N.A.
P.O. Box 505000
Louisville, KY U.S.A. 40233-5000
(800) 317-4445
Website: www.asaltd.com
The Semi-annual and Annual Reports of the Company and the latest valuation of net assets per share may be viewed on the Company’s website or may be requested from the Executive Office (800-432-3378). Shareholders are reminded to notify Computershare of any change of address.
ITEM 2. CODE OF ETHICS.
Not applicable.
ITEM 3. AUDIT COMMITTEE FINANCIAL EXPERT.
The registrant’s board of directors determined that Bruce Hansen, Chairman of the registrant’s Audit and Ethics Committee, is an “audit committee financial expert” as defined in the instructions to Item 3 of Form N-CSR. Mr. Hansen is “independent” as defined in Item 3 of Form N-CSR.
ITEM 4. PRINCIPAL ACCOUNTANT FEES AND SERVICES.
Not applicable.
ITEM 5. AUDIT COMMITTEE OF LISTED REGISTRANTS.
Not applicable.
ITEM 6. INVESTMENTS.
| (a) | Included as part of the report to shareholders under Item 1. |
ITEM 7. DISCLOSURE OF PROXY VOTING POLICIES AND PROCEDURES FOR CLOSED-END
MANAGEMENT INVESTMENT COMPANIES.
Not applicable.
ITEM 8. PORTFOLIO MANAGERS OF CLOSED-END MANAGEMENT INVESTMENT COMPANIES.
Not applicable.
ITEM 9. PURCHASES OF EQUITY SECURITIES BY CLOSED-END MANAGEMENT INVESTMENT COMPANY AND AFFILIATED PURCHASERS.
During the period covered by this report, there were no purchases made by or on behalf of the registrant or any “affiliated purchaser,” as defined in Rule 10b-18(a)(3) under Securities Exchange Act of 1934 (the “Exchange Act”), of any common shares of the registrant.
ITEM 10. SUBMISSION OF MATTERS TO A VOTE OF SECURITY HOLDERS
There have been no material changes to the procedures by which shareholders may recommend nominees to the registrant’s board of directors since the registrant provided disclosure in response to Item 22(b)(15) of Schedule 14A in its proxy statement dated February 21, 2019.
ITEM 11. CONTROLS AND PROCEDURES
(a) The Principal Executive Officer and the Principal Financial Officer, in their capacities as principal executive officer and principal financial officer of the registrant, have concluded that the registrant’s disclosure controls and procedures (as defined in Rule 30a-3(c) under the Investment Company Act of 1940 (the “1940 Act”)) are effective, based on their evaluation of these controls and procedures as of a date within 90 days prior to the filing date of this report.
(b) There were no changes in the registrant’s internal control over financial reporting (as defined in Rule 30a-3(d) under the 1940 Act) that occurred during the second fiscal quarter of the period covered by this report that have materially affected, or are reasonably likely to materially affect, the registrant’s internal control over financial reporting.
ITEM 12. DISCLOSURE OF SECURITIES LENDING ACTIVITIES FOR CLOSED-END MANAGEMENT INVESTMENT COMPANIES
The Registrant did not participate in securities lending activities during the six months ended May 31, 2019.
ITEM 13. EXHIBITS.
(a)(1) Not applicable.
(a)(2) The certifications required by Rule 30a-2(a) under the 1940 Act are attached hereto.
(a)(3) Not applicable.
(a)(4) Not applicable.
(b) The certifications required by Rule 30a-2(b) under the 1940 Act, Rule 13a-14(b) under the Exchange Act and Section 1350 of Chapter 63 of Title 18 of the United States Code are attached hereto. These certifications are not deemed “filed” for purposes of Section 18 of the Exchange Act, or otherwise subject to the liability of that section. Such certifications will not be deemed to be incorporated by reference into any filing under the Securities Act of 1933 or the Exchange Act, except to the extent that the registrant specifically incorporates them by reference.
SIGNATURES
Pursuant to the requirements of the Securities Exchange Act of 1934 and the Investment Company Act of 1940, the Registrant has duly caused this report to be signed on its behalf by the undersigned, thereunto duly authorized.
Registrant ASA Gold and Precious Metals Limited
| By | /s/ Axel Merk |
| | Axel Merk, Principal Executive Officer |
| | |
| Date | 7/25/19 |
Pursuant to the requirements of the Securities Exchange Act of 1934 and the Investment Company Act of 1940, this report has been signed below by the following persons on behalf of the Registrant and in the capacities and on the dates indicated.
| By | /s/ Axel Merk |
| | Axel Merk, Principal Executive Officer |
| | |
| Date | 7/25/19 |
| By | /s/ Karen Shaw |
| | Karen Shaw, Principal Financial Officer |
| | |
| Date | 7/25/19 |