As filed with the Securities and Exchange Commission on Febuary 3, 2020
UNITED STATES
SECURITIES AND EXCHANGE COMMISSION
WASHINGTON, D.C. 20549
FORM N-CSR
CERTIFIED SHAREHOLDER REPORT OF REGISTERED MANAGEMENT
INVESTMENT COMPANIES
Investment Company Act file number 811-21650
ASA GOLD AND PRECIOUS METALS LIMITED
Three Canal Plaza, Suite 600
Portland, ME 04101
Karen Shaw, Principal Financial Officer
Three Canal Plaza, Suite 600
Portland, Maine 04101
207-347-2000
Date of fiscal year end: November 30
Date of reporting period: December 1 – November 30
ITEM 1. REPORT TO STOCKHOLDERS.

Gold and Precious Metals Limited
Annual Report and Financial Statements
November 2019
A Closed-End Fund
Specializing in Gold and Other
Precious Metals Investments
Beginning on January 1, 2021, as permitted by regulations adopted by the U.S. Securities and Exchange Commission, paper copies of the Company’s annual and semi-annual shareholder reports will no longer be sent by mail, unless you specifically request paper copies of the reports. Instead, the reports will be made available on the Company’s website www.asaltd.com, and you will be notified by mail each time a report is posted and provided with a website link to access the report.
If you already elected to receive shareholder reports electronically, you will not be affected by this change and you need not take any action. You may elect to receive shareholder reports and other communications from the Company electronically anytime by contacting your financial intermediary (such as a broker-dealer or bank) or, if you are a direct investor, by calling 1-800-432-3378 or by sending an e-mail request to info@asaltd.com.
Beginning on January 1, 2019, you may elect to receive all future reports in paper free of charge. If you invest through a financial intermediary, you can contact your financial intermediary to request that you continue to receive paper copies of your shareholder reports. If you invest directly with the Company, you can call 1-800-432-3378 or send an email request to info@asaltd.com to inform the Company that you wish to continue receiving paper copies of your shareholder reports.
ASA Gold and Precious Metals Limited
Annual Report and Financial Statements
November 30, 2019
Table of Contents
| Letter to Shareholders (Unaudited) | 2 |
| Note from the Board of Directors (Unaudited) | 4 |
| Change to the Company’s Primary Benchmark Index (Unaudited) | 5 |
| Forward-looking statements (Unaudited) | 5 |
| 10-Year performance returns (Unaudited) | 6 |
| Certain investment policies and restrictions (Unaudited) | 7 |
| Report of Independent Registered Public Accounting Firm | 8 |
| Schedule of investments | 9 |
| Statement of assets and liabilities | 12 |
| Statement of operations | 13 |
| Statements of changes in net assets | 14 |
| Notes to financial statements | 15 |
| Financial highlights | 20 |
| Certain tax information for U.S. shareholders (Unaudited) | 21 |
| Dividend reinvestment and stock purchase plan (Unaudited) | 21 |
| Privacy notice (Unaudited) | 22 |
| Form N-PX/proxy voting (Unaudited) | 22 |
| Form N-Q/portfolio holdings (Unaudited) | 22 |
| Common shares repurchased (Unaudited) | 22 |
| Board of directors and officers (Unaudited) | 23 |
Dear Shareholder,
In 2019, the gold price increased as global uncertainty led to lower global interest rates, in part driven by trade tensions and concerns of a potential recession. The move earlier in the year by the Federal Reserve (the “Fed”) to a more dovish stance propelled gold higher in the middle of the year, as they cut rates three times. Gold peaked at $1,552 in September of 2019 from a low of $1,221 at the end of November 2018, an increase of over $300, one of the largest intra-year increases we have seen since the post financial crisis gains in 2010-11.
Gold increased 20.0% during the fiscal year ended November 30, 2019, while ASA Gold and Precious Metals Limited (“ASA” or the “Company”) reported a total return of 47.0% based on its net asset value (“NAV”), compared to a total return of 43.0% for the FTSE Gold Mines Total Return Index (the “Index”). Total return of ASA’s share price for the fiscal year was 41.1%. At fiscal year-end, total net assets of ASA were $286 million, an increase of $91 million as compared to fiscal year-end 2018.
The Company’s average expense ratio rose to 1.38% during the 2019 fiscal year from 1.35% during fiscal year 2018 due primarily to higher operating costs associated with the transition from internal management to Merk Investments (the “Adviser” or “Merk”) as external adviser, which saw severance payments to the departing management team and elevated legal costs. Together with the Board, we worked hard to keep these transition costs low to the extent possible. If assets remain relatively constant and no unforeseen expenses arise, we expect the expense ratio to drop in the coming fiscal year.
Separately, investment income increased to $2.4 million during fiscal year 2019 from $1.6 million during 2018, generated by increased dividends from portfolio investments.
The discount at which ASA’s shares traded in the market fluctuated during the year from a high of 17.8% to a low of 13.6% and ended the fiscal year at 17.7%. The Board of Directors of ASA and Merk monitor the Company’s share price and discount to NAV on an ongoing basis. Part of the higher discount might be a result of good performance, with market participants taking their time to evaluate whether the improved absolute and relative performance is a fluke or may be due to a robust investment process (outperformance leads to a greater discount if the NAV increases faster than the share price). At Merk, we have launched several initiatives which we hope will help address the discount over time, including:
First and foremost, we will continue to focus on execution of our investment process as to achieve ASA’s investment objective. ASA’s portfolio has become more dynamic as we have reduced large cap and royalty companies, increasing investments in mid-cap, development and exploration firms. ASA has also helped finance several mining companies, usually at a discount to prevailing market prices, and sometimes taking warrants and similar interests along with the equity investments. Unlike in other industries, such dilutions to shareholders are often taken as a positive, as the injection of capital provides much needed resources for the development or exploration company’s next phase of growth, bolstering the respective balance sheet. Merk looks for companies that have other strong backers that may be available to inject additional capital down the road as the need may arise. While any such investments tend to be small relative to the fund’s assets, we believe they have the potential to deliver positive returns over time.
Second, we have worked hard to increase public awareness about ASA, in several ways:
| * | Merk has significantly increased communications about ASA and our portfolio management, including holding webinars to explain our investment process in more detail and giving interviews to industry associations. We invite you to visit www.asaltd.com for replays. |
| * | We invite anyone to reach out to us with questions about ASA and our investment process. We have spoken to many shareholders over the past year and would like to encourage anyone who has not spoken to us to send us a note at www.asaltd.com/contact to schedule a call. |
| * | Starting with the September 2019 fact sheet, we publish all of ASA’s holdings monthly, whereas previously only the top 10 holdings were reported. Until then, the complete holdings were only available from regulatory filings that are published with significant delay. While the smaller holdings may not influence the portfolio much on a day-to-day basis, we believe many investors may appreciate the additional information, especially in the gold mining space where significant value can potentially be added through smaller holdings. ASA’s monthly fact sheet is available at www.asaltd.com. |
| * | Also, starting in September 2019, we initiated a Google Ads campaign seeking to increase investor awareness (Merk pays for the campaign). ASA has not raised money since it was first launched all the way back in 1958, and we do not seek to raise money now. That said, we believe it may be helpful to the discount to have a new generation of investors evaluate whether ASA may be appropriate for them. |
Some investors find a significant discount to be a buying opportunity. Such investors may want to evaluate whether our efforts will bear fruit; if so, maybe they can help us reduce the discount by buying shares in ASA.
As mentioned in the semi-annual letter, we were in the process of transitioning the portfolio to be more dynamic so the fund will react more positively to the gold price in a bullish gold environment. Since Merk took over the adviser role of ASA, our analysis suggests the fund has shown increased performance relative to the gold price, indices and peer funds. After significant repositioning of ASA’s portfolio, notably by moving down in market cap, we believe the majority of the portfolio transition has been completed.
The significant increase in the gold price during the 2nd and 3rd fiscal quarters was fast and took many by surprise. In our analysis, the initial move in a broader trend always starts with the large caps as market participants move into the liquid names. In our experience, once the market gets comfortable with a higher gold price, the investor base usually moves further down in capitalization, attempting to gain increased leverage to the gold price. The speed at which gold increased appears to have so far limited the breadth of the gains in gold equities. Furthermore, by the fiscal 4th quarter, the Fed was beginning to communicate an end to the recent series of rate cuts. This, and what appears to be an understanding that the trade dispute between the U.S. and China was easing, caused the gold price to drop and then stabilize below $1,500/oz.
In recent months, we continued to move away from the large cap producers and royalty companies, into medium and smaller capitalization companies, which we believe will react more favorably to an increasing gold price due to better growth opportunities and increased margin expansion. We also invested in development and exploration companies based on our belief that the larger companies will need to improve their production profile because mine lives are getting shorter due to lack of investment over the previous 10 years, as when many companies focused on balance sheet improvements and cost reductions. Fortunately, most of these improvements were completed by the time that gold started rallying and a significant portion of that increase should start to drop to the bottom-line during the calendar year 3rd quarter. Among our larger holdings, Agnico, Alacer, Perseus and Detour all showed solid quarterly improvements. Furthermore, a number of smaller companies that we helped finance started to release solid results; in combination with the market feeling comfortable with the medium-term balance sheet, their share prices reacted favorably post financings.
Despite the more dynamic positioning, the portfolio reacted less than some might have anticipated to the down to neutral gold price at the end of the fiscal year. It is in this backdrop that we continue to believe that the fund should continue to outperform in a rising gold environment.
As seen below, ASA’s portfolio now emphasizes medium sized producers with significant holdings in development and exploration companies:
| Stage of Development1 | Market Capitalization2 |
| | |
 | 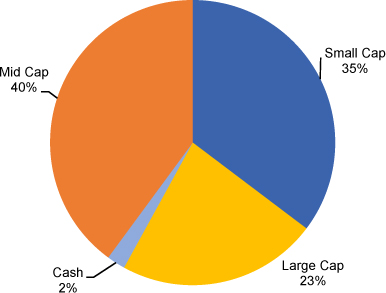 |
| 1 | Large – annual production greater than 1 million ounces; Medium – annual production between five hundred thousand ounces and 1 million ounces; Small – annual production less than five hundred thousand ounces |
| 2 | Large Cap - market cap greater than $10 billion; Mid Cap – market cap between $2 billion and $10 billion; Small Cap –market cap less than $1 billion |
Mergers & Acquisitions
The mergers and acquisitions/asset dispositions that the gold sector has been waiting for since the large mergers that Barrick and Newmont undertook at the end of 2018 and early 2019 finally started in the final two months of the calendar year. Once Barrick announced the sale of their half of the Kalgoorlie Superpit to Saracen in early November, a few weeks ensued where we saw eight significant transactions, culminating in the sale by Newmont of the other half of the Superpit to Northern Star in the middle of December 2019, putting this historic asset back into the hands of Australian operators. We believe ASA’s portfolio is well placed to participate in further portfolio rationalization into the new year.
It is in this environment, that Merk believes ASA will realize the benefits of a more dynamic portfolio and improved returns. Feel free to reach out to us if you have any questions.
| Peter Maletis, Portfolio Manager | Axel Merk, Chief Investment Officer |
| Merk Investments LLC | Merk Investments LLC |
| January 2020 | |
Note from the Board of Directors
The Board would like to thank ASA’s shareholders for their support over the past year. After deciding to transition from our previous internally-managed state and identifying Merk as our desired investment adviser for the fund during the latter part of FY 2018, we engaged in significant due diligence with Merk and also with Apex Fund Services, whom we selected as the new external administrator and fund accounting agent. This process continued during the first part of FY 2019, culminating in the positive shareholder vote affirming the selection of Merk as investment adviser in April 2019. The transition was a tremendous amount of work for all concerned, and expensive due to winding down the internal operation, payment of severance and other costs, legal and proxy expenses, and ongoing lease expense for our former office space that is only partially offset by a sublease which goes through early 2021. Key drivers of our structural changes were the desire to achieve improved investment performance, cost savings and efficiencies for ASA, and reduction of risk through outsourcing investment management and administration. So far, we believe that the transition is achieving our objectives.
We had change at the Board level as well, losing two valued independent directors during 2019 along with the position formerly occupied by a representative of management. We were delighted to gain a new independent member, Tony Artabane, a fund industry CPA with significant accounting and financial management experience. ASA’s 2020 proxy statement, which accompanies this annual report, announces our nomination of another new independent director, William Donovan, who has a deep background in portfolio and financial management.
We have also decided to re-evaluate what may be the most appropriate benchmark index for ASA to use in light of, among other factors, the portfolio changes instituted by Merk and recent merger activity amongst the larger companies in the industry. As a result, our disclosure to shareholders will incorporate the NYSE Arca Gold Miners Total Return Index, rather than the FTSE Gold Mines Total Return Index, as further described below. We believe this change will provide more meaningful information to shareholders, even while recognizing that comparison of an actively managed fund, such as ASA, to a passive index has inherent limitations.
ASA has been in business since 1958, when it was founded to invest in gold mining companies located in South Africa. Over the years ASA has expanded its universe along with the mining industry and become a global fund. Even with the dramatic changes in the fund industry such as the popularity of index funds and ETFs, and competitive pressures, the Board believes there is still a place for an actively managed, closed end fund that is dedicated to the gold and precious metals space. With the team of Merk and Apex, we believe that ASA is well positioned for the future. We are very grateful for the support of our shareholders – thank you, and rest assured that we will continue our focus on achieving results for you.
| Mary Joan Hoene, Chair | Bruce Hansen, Director | Anthony Artabane, Director |
| | | |
| January 2020 | | |
Change to the Company’s Primary Benchmark Index
At a meeting of the Board held on January 10, 2020, the Board approved a change in the Company’s primary benchmark index from the FTSE Gold Mines Total Return Index (“FTSE Gold Index”) to the NYSE Arca Gold Miners Total Return Index (“GDMNTR”). The change in the Company’s primary benchmark index was made at the recommendation of the Company’s investment adviser, Merk Investments LLC, based on an evolving investment landscape and gradual changes in the composition of the FTSE Gold Index over time that resulted in the FTSE Gold Index no longer serving as an optimal comparison metric for the Company. Although there are limitations inherent in a direct comparison of the Company’s performance to the performance of any broad-based securities market index, the Board believes that the GDMNTR is the most appropriate benchmark for the Company due to the broader composition of the index and lower weightings in the larger capitalization companies, which became outsized in the FTSE Gold Index relative to the holdings of the funds within the sector as a result of recent merger activity.
As a result of the Company’s adoption of the GDMNTR as the primary benchmark index, it is expected that a comparison of the Company’s performance against each of the GDMNTR and FTSE Gold Index will be provided for the next twelve months, and against the GDMNTR thereafter. The change in the Company’s primary benchmark index will not have any impact on the investment objective or strategy of the Company. In addition, whether or not the Company outperforms or underperforms the GDMNTR or any other benchmark index will not impact the compensation paid to the investment adviser by the Company and the change in the Company’s benchmark index is not expected to result in a change to the expense ratio of the Company’s shares.
On page 6, please find the performance of the Company compared to that of the FTSE Gold Index and GDMNTR.
Forward-Looking Statements
This shareholder letter includes forward-looking statements, which involve known and unknown risks, uncertainties and other factors that may cause the actual results, levels of activity, performance or achievements of the Company, or industry results, to be materially different from any future results, levels of activity, performance or achievements expressed or implied by such forward-looking statements. The Company’s actual performance or results may differ from its beliefs, expectations, estimates, goals and projections, and consequently, investors should not rely on these forward-looking statements as predictions of future events. Forward-looking statements are not historical in nature and generally can be identified by words such as “believe,” “anticipate,” “estimate,” “expect,” “intend,” “should,” “may,” “will,” “seek,” or similar expressions or their negative forms, or by references to strategy, plans, goals or intentions. The absence of these words or references does not mean that the statements are not forward-looking. The Company’s performance or results can fluctuate from month to month depending on a variety of factors, a number of which are beyond the Company’s control and/or are difficult to predict, including without limitation: the Company’s investment decisions, the performance of the securities in its investment portfolio, economic, political, market and financial factors, and the prices of gold, platinum and other precious minerals that may fluctuate substantially over short periods of time. The Company may or may not revise, correct or update the forward-looking statements as a result of new information, future events or otherwise.
The Company concentrates its investments in the gold and precious minerals sector. This sector may be more volatile than other industries and may be affected by movements in commodity prices triggered by international monetary and political developments. The Company is a non-diversified fund and, as such, may invest in fewer investments than that of a diversified portfolio. The Company may invest in smaller-sized companies that may be more volatile and less liquid than larger more established companies. Investments in foreign securities, especially those in the emerging markets, may involve increased risk as well as exposure to currency fluctuations. Shares of closed-end funds frequently trade at a discount to net asset value. All performance information reflects past performance and is presented on a total return basis. Past performance is no guarantee of future results. Current performance may differ from the performance shown.
This shareholder letter does not constitute an offer to sell or solicitation of an offer to buy any securities.
10-Year Performance Returns
Fiscal Year Total Returns

| Best Quarter (NAV): | Q1 2016 | 45.98% |
| Worst Quarter (NAV): | Q2 2013 | -34.36% |
Average Annual Total Returns For the years ended November 30, 2019 | 1 Year | 3 Year | 5 Year | 10 Year |
| ASA Gold and Precious Metals – NAV | 47.01% | 5.83% | 5.55% | -6.07% |
| ASA Gold and Precious Metals - Share Price | 41.14% | 4.41% | 2.92% | -6.78% |
| FTSE Gold Mines Index(1) | 42.97% | 9.95% | 10.57% | -5.23% |
| NYSE Arca Gold Miners Total Return Index(1) | 42.85% | 10.09% | 8.94% | -5.07% |
The performance data quoted represent past performance and do not indicate future results. Current performance may be lower or higher than the performance data quoted. For more current performance data, please visit http://www.asaltd.com/investor-information/factsheets.
The results shown in the table reflect the reinvestment of income dividends and other distributions, if any. The results do not reflect the effect of taxes a shareholder would pay on Company distributions or on the sale of the Company’s common shares.
The investment return and market price will fluctuate and the Company’s common shares may trade at prices above or below NAV. The Company’s common shares, when sold, may be worth more or less than their original cost.
| (1) | The FTSE Gold Mines Total Return Index (“FTSE Gold Index”) encompasses gold mining companies that have a sustainable, attributable gold production of at least 300,000 ounces a year and that derive 51% or more of their revenue from mined gold. Please note that the Index is unmanaged, and does not take into account any fees and expenses or any tax consequences of investing in the individual securities that it tracks and one cannot invest directly in the Index. The NYSE Arca Gold Miners Index (the “Index”) is a net total return modified capitalization weighted index comprised of publicly traded companies primarily involved in the mining of gold and silver in locations around the world. The Company does not attempt to replicate the FTSE Gold Index or the Index. The FTSE Gold Index and Index do not necessarily reflect investments in other precious metals companies (e.g., silver, platinum, and diamonds) in which the Company may invest. Data about the performance of the FTSE Gold Index and Index are prepared or obtained by Management and include reinvestment of all income dividends and other distributions, if any. The Fund may invest in securities not included in the FTSE Gold Index or Index and generally does not invest in all securities included in the FTSE Gold Index or Index. |
For more complete information about the Company, please call us directly at 1-800-432-3378, or visit the Company’s website at www.asaltd.com.
Certain Investment Policies and Restrictions
The following is a summary of certain of the Company’s investment policies and restrictions and is subject to the more complete statements contained in documents filed with the Securities and Exchange Commission.
The concentration of investments in a particular industry or group of industries. It is a fundamental policy (i.e., a policy that may be changed only by shareholder vote) of the Company that at least 80% of its total assets be (i) invested in common shares or securities convertible into common shares of companies engaged, directly or indirectly, in the exploration, mining or processing of gold, silver, platinum, diamonds or other precious minerals, (ii) held as bullion or other direct forms of gold, silver, platinum or other precious minerals, (iii) invested in instruments representing interests in gold, silver, platinum or other precious minerals such as certificates of deposit therefor, and/or (iv) invested in securities of investment companies, including exchange traded funds, or other securities that seek to replicate the price movement of gold, silver or platinum bullion. Compliance with the percentage limitation relating to the concentration of the Company’s investments will be measured at the time of investment. If investment opportunities deemed by the Company to be attractive are not available in the types of securities referred to in the preceding paragraph, the Company may deviate from the investment policy outlined in that paragraph and make temporary investments of unlimited amounts in securities issued by the U.S. Government, its agencies or instrumentalities or other high quality money market instruments.
The percentage of voting securities of any one issuer that the company may acquire. It is a non-fundamental policy (i.e., a policy that may be changed by the Board of Directors) of the Company that the Company shall not purchase a security if, at the time of purchase, more than 20% of the value of its total assets would be invested in securities of the issuer of such security.
Report of Independent Registered Public Accounting Firm
To the Board of Directors and Shareholders of ASA Gold and Precious Metals Limited
Opinion on the Financial Statements
We have audited the accompanying statement of assets and liabilities of ASA Gold and Precious Metals Limited (the “Company”), including the schedule of investments, as of November 30, 2019, the related statement of operations for the year then ended, statements of changes in net assets for each of the two years in the period then ended, and financial highlights for each of the five years in the period then ended, and the related notes (collectively referred to as the “financial statements”). In our opinion, the financial statements present fairly, in all material respects, the financial position of the Company as of November 30, 2019, the results of its operations for the year then ended, the changes in its net assets for each of the two years in the period then ended, and the financial highlights for each of the five years in the period then ended, in conformity with accounting principles generally accepted in the United States of America.
Basis for Opinion
These financial statements are the responsibility of the Company’s management. Our responsibility is to express an opinion on the Company’s financial statements based on our audit. We are a public accounting firm registered with the Public Company Accounting Oversight Board (United States) (“PCAOB”) and are required to be independent with respect to the Fund in accordance with the U.S. federal securities laws and the applicable rules and regulations of the Securities and Exchange Commission and the PCAOB. We have served as the Company’s auditor since 2012.
We conducted our audit in accordance with the standards of the PCAOB. Those standards require that we plan and perform the audit to obtain reasonable assurance about whether the financial statements are free of material misstatement, whether due to error or fraud. The Company is not required to have, nor were we engaged to perform, an audit of its internal control over financial reporting. As part of our audits we are required to obtain an understanding of internal control over financial reporting, but not for the purpose of expressing an opinion on the effectiveness of the Company’s internal control over financial reporting. Accordingly, we express no such opinion.
Our audit included performing procedures to assess the risks of material misstatement of the financial statements, whether due to error or fraud, and performing procedures that respond to those risks. Such procedures included examining, on a test basis, evidence regarding the amounts and disclosures in the financial statements. Our audits also included evaluating the accounting principles used and significant estimates made by management, as well as evaluating the overall presentation of the financial statements. Our procedures included confirmation of securities owned as of November 30, 2019 by correspondence with the custodian. We believe that our audit provides a reasonable basis for our opinion.

TAIT, WELLER & BAKER LLP
Philadelphia, Pennsylvania
January 23, 2020
Schedule of Investments
November 30, 2019
| Name of Company | | Shares | | | Value | | | % of Net Assets | |
| Common Shares | | | | | | | | | |
| Gold mining, exploration, development and royalty companies | | | | | |
| Australia | | | | | | | | | | | | |
| Bellevue Gold, Ltd. (1) | | | 6,000,000 | | | $ | 2,008,908 | | | | 0.7 | % |
| Dacian Gold, Ltd. (1) | | | 5,000,000 | | | | 4,667,160 | | | | 1.6 | |
| Newcrest Mining, Ltd. | | | 750,000 | | | | 15,604,550 | | | | 5.4 | |
| Northern Star Resources, Ltd. | | | 1,000,000 | | | | 6,486,677 | | | | 2.3 | |
| Pantoro, Ltd. (1) | | | 16,000,000 | | | | 1,623,360 | | | | 0.6 | |
| Perseus Mining, Ltd. (1) | | | 11,000,000 | | | | 6,473,149 | | | | 2.3 | |
| Prodigy Gold NL (1) | | | 17,250,000 | | | | 828,421 | | | | 0.3 | |
| Westgold Resources, Ltd. (1) | | | 3,000,000 | | | | 4,058,400 | | | | 1.4 | |
| | | | | | | | 41,750,625 | | | | 14.6 | |
| Canada | | | | | | | | | | | | |
| Adventus Mining Corp. 144A (1)(2) | | | 1,300,000 | | | | 929,760 | | | | 0.3 | |
| Adventus Mining Corp. (1) | | | 2,298,000 | | | | 1,643,529 | | | | 0.6 | |
| Agnico Eagle Mines, Ltd. | | | 400,000 | | | | 23,840,000 | | | | 8.3 | |
| Alacer Gold Corp. (1) | | | 2,500,000 | | | | 13,438,229 | | | | 4.7 | |
| Alamos Gold, Inc. | | | 1,750,000 | | | | 9,922,500 | | | | 3.5 | |
| B2Gold Corp. | | | 3,000,000 | | | | 11,089,362 | | | | 3.9 | |
| Barrick Gold Corp. | | | 1,000,000 | | | | 16,800,000 | | | | 5.9 | |
| Bonterra Resources, Inc. (1) | | | 600,000 | | | | 808,552 | | | | 0.3 | |
| Calibre Mining Corp. (1) | | | 11,083,000 | | | | 7,342,498 | | | | 2.6 | |
| Centerra Gold, Inc. (1) | | | 875,000 | | | | 7,483,249 | | | | 2.6 | |
| Corvus Gold, Inc. (1) | | | 2,000,000 | | | | 2,815,629 | | | | 1.0 | |
| Detour Gold Corp. (1) | | | 450,000 | | | | 8,333,961 | | | | 2.9 | |
| Franco-Nevada Corp. | | | 30,000 | | | | 2,949,600 | | | | 1.0 | |
| Gold Standard Ventures Corp. (1) | | | 1,200,000 | | | | 795,001 | | | | 0.3 | |
| Golden Star Resources, Ltd. (1) | | | 1,850,000 | | | | 6,123,500 | | | | 2.1 | |
| Integra Resources Corp. (1) | | | 1,055,814 | | | | 914,090 | | | | 0.3 | |
| Integra Resources Corp. (1)(3) | | | 1,744,186 | | | | 1,510,061 | | | | 0.5 | |
| K92 Mining, Inc. (1) | | | 1,725,000 | | | | 3,272,604 | | | | 1.1 | |
| Kinross Gold Corp. (1) | | | 600,000 | | | | 2,598,000 | | | | 0.9 | |
| Liberty Gold Corp. (1) | | | 7,865,000 | | | | 4,973,726 | | | | 1.7 | |
| Marathon Gold Corp. (1) | | | 1,675,000 | | | | 1,929,346 | | | | 0.7 | |
| Maverix Metals, Inc. | | | 1,500,000 | | | | 6,131,898 | | | | 2.1 | |
| OceanaGold Corp. | | | 2,154,013 | | | | 4,297,323 | | | | 1.5 | |
| Orla Mining, Ltd. (1) | | | 5,950,000 | | | | 7,659,791 | | | | 2.7 | |
| Pretium Resources, Inc. (1) | | | 725,000 | | | | 7,068,750 | | | | 2.5 | |
| Pure Gold Mining, Inc. (1) | | | 3,000,000 | | | | 1,490,627 | | | | 0.5 | |
| Roxgold, Inc. (1) | | | 7,200,000 | | | | 4,553,188 | | | | 1.6 | |
| SEMAFO, Inc. (1) | | | 1,750,000 | | | | 3,675,751 | | | | 1.3 | |
| SilverCrest Metals, Inc. (1) | | | 250,000 | | | | 1,464,278 | | | | 0.5 | |
| SSR Mining, Inc. (1) | | | 600,000 | | | | 9,396,000 | | | | 3.3 | |
| Torex Gold Resources, Inc. (1) | | | 330,000 | | | | 4,966,273 | | | | 1.7 | |
| Torex Gold Resources, Inc. 144A (1)(2) | | | 130,000 | | | | 1,956,411 | | | | 0.7 | |
| | | | | | | | 182,173,487 | | | | 63.6 | |
| Cayman Islands | | | | | | | | | | | | |
| Endeavour Mining Corp. (1) | | | 550,000 | | | | 10,504,780 | | | | 3.7 | |
| South Africa | | | | | | | | | | | | |
| AngloGold Ashanti, Ltd. | | | 898,420 | | | | 16,806,933 | | | | 5.9 | |
| Gold Fields, Ltd. | | | 1,029,577 | | | | 5,407,730 | | | | 1.9 | |
| Gold Fields, Ltd. ADR | | | 670,423 | | | | 3,586,763 | | | | 1.3 | |
The notes to financial statements form an integral part of these statements.
Schedule of Investments (continued)
November 30, 2019
| Name of Company | | Shares | | | Value | | | % of Net Assets | |
| Common Shares (continued) | | | | | | | | | |
| South Africa (continued) | | | | | | | | | | | | |
| Sibanye Gold, Ltd. (1) | | | 1,092,174 | | | $ | 2,152,963 | | | | 0.7 | % |
| | | | | | | | 27,954,389 | | | | 9.8 | |
| United States | | | | | | | | | | | | |
| Newmont Goldcorp Corp. | | | 150,000 | | | | 5,760,000 | | | | 2.0 | |
| Total gold mining, exploration, development and royalty companies (Cost $188,595,165) | | | | | | | 268,143,281 | | | | 93.7 | |
| Diversified metals mining, exploration, development and royalty companies | | | |
| Canada | | | | | | | | | | | | |
| Americas Gold & Silver Corp. (1) | | | 1,475,000 | | | | 4,130,844 | | | | 1.5 | |
| Discovery Metals Corp. (1) | | | 4,444,444 | | | | 1,405,305 | | | | 0.5 | |
| | | | | | | | 5,536,149 | | | | 2.0 | |
| United Kingdom | | | | | | | | | | | | |
| Adriatic Metals PLC (1) | | | 2,500,000 | | | | 2,223,666 | | | | 0.8 | |
| Total diversified metals mining, exploration, development and royalty companies (Cost $6,123,643) | | | | | | | 7,759,815 | | | | 2.8 | |
| Silver mining, exploration, development and royalty companies | | | |
| Canada | | | | | | | | | | | | |
| MAG Silver Corp. (1) | | | 325,000 | | | | 3,474,250 | | | | 1.2 | |
| Total silver mining, exploration and development companies (Cost $2,541,688) | | | | | | | 3,474,250 | | | | 1.2 | |
| Total common shares (Cost $197,260,496) | | | | | | | 279,377,346 | | | | 97.7 | |
| Rights | | | | | | | | | | | | |
| Silver mining, exploration, development and royalty companies | | | |
| Canada | | | | | | | | | | | | |
| Pan American Silver Corp. (Expiration Date 2/22/29) (1)(4) | | | 393,200 | | | | 112,855 | | | | 0.1 | |
| Total rights (Cost $136,720) | | | | | | | 112,855 | | | | 0.1 | |
| Warrants | | | | | | | | | | | | |
| Gold mining, exploration, development and royalty companies | | | |
| Canada | | | | | | | | | | | | |
| Bonterra Resources, Inc. (Exercise Price $3.10, Expiration Date 8/20/21) (1)(4) | | | 300,000 | | | | 94,858 | | | | 0.0 | |
| Marathon Gold Corp. (Exercise Price $1.32, Expiration Date 9/30/21) (1)(4) | | | 837,500 | | | | 189,152 | | | | 0.1 | |
| Maverix Metals, Inc. (Exercise Price $1.65, Expiration Date 12/23/21) (1)(4) | | | 250,000 | | | | 415,945 | | | | 0.1 | |
| Pure Gold Mining, Inc. (Exercise Price $0.85, Expiration Date 7/18/22) (1)(4) | | | 1,500,000 | | | | 158,097 | | | | 0.1 | |
| Total warrants (Cost $906,541) | | | | | | | 858,052 | | | | 0.3 | |
| Investments, at value (Cost $198,303,757) (5) | | | | | | | 280,348,253 | | | | 98.1 | |
| Cash, receivables and other assets less other liabilities | | | | | | | 5,530,967 | | | | 1.9 | |
| Net assets | | | | | | $ | 285,879,220 | | | | 100.0 | % |
| ADR | American Depositary Receipt |
| PLC | Public Limited Company |
| (1) | Non-income producing security. |
| (2) | Security exempt from registration under Rule 144A under the Securities Act of 1933. At the period end, the value of these securities amounted on November 30, 2019 to $2,886,171 or 1.0% of net assets. |
| (4) | Security fair valued in accordance with procedures adopted by the Board of Directors. At the period end, the value of these securities amounted to $970,907 or 0.3% of net assets. |
| (5) | Cost of investments shown approximates adjusted basis for U.S. federal income tax purposes, determined in accordance with U.S. federal income tax principles. Gross unrealized appreciation of investments and gross unrealized depreciation of investments at November 30, 2019 were $99,284,661 and $17,240,165, respectively, resulting in net unrealized appreciation on investments of $82,044,496. |
The notes to financial statements form an integral part of these statements.
Portfolio Statistics (Unaudited)
November 30, 2019
| Geographic Breakdown* | | | |
| Australia | | | 14.9 | % |
| Canada | | | 68.5 | |
| Cayman Islands | | | 3.8 | |
| South Africa | | | 10.0 | |
| United States | | | 2.0 | |
| Cash | | | 0.8 | |
| | | | 100.0 | % |
| * | Geographic breakdown, which is based on company domiciles, is expressed as a percentage of total net assets including cash. |
The notes to financial statements form an integral part of these statements.
Statement of Assets and Liabilities
November 30, 2019
| Assets | | | |
| Investments, at value (Cost $198,303,757) | | $ | 280,348,253 | |
| Cash and cash equivalents | | | 4,582,829 | |
| Foreign currency (Cost $1,466,012) | | | 1,456,019 | |
| Dividends receivable, net of withholding taxes payable | | | 116,311 | |
| Other assets | | | 109,070 | |
| Total assets | | $ | 286,612,482 | |
| | | | | |
| Liabilities | | | | |
| Accrued affiliate expenses | | $ | 184,782 | |
| Liability for retirement benefits due to retired directors | | | 411,349 | |
| Other expenses | | | 137,131 | |
| Total liabilities | | $ | 733,262 | |
| Net assets | | $ | 285,879,220 | |
| | | | | |
| Common shares $1 par value | | | | |
| Authorized: 40,000,000 shares | | | | |
| Issued and Outstanding: 19,289,905 shares | | $ | 19,289,905 | |
| Share premium (capital surplus) | | | 1,372,500 | |
| Distributable earnings | | | 265,216,815 | |
| Net assets | | $ | 285,879,220 | |
| Net asset value per share | | $ | 14.82 | |
The closing price of the Company’s shares on the New York Stock Exchange was $12.20 on November 30, 2019.
The notes to financial statements form an integral part of these statements.
Statement of Operations
For the year ended November 30, 2019
| Investment income | | | | |
| Dividend income (net of withholding taxes of $549,241) | | $ | 2,371,123 | |
| Total investment income | | | 2,371,123 | |
| | | | | |
| Expenses | | | | |
| Investment research | | | 593,622 | |
| Administration and operations | | | 559,559 | |
| Investment adviser fees | | | 1,218,656 | |
| Fund services fees | | | 106,052 | |
| Compliance services fees | | | 92,722 | |
| Fund accounting | | | 62,442 | |
| Transfer agent fees | | | 109,539 | |
| Custodian fees | | | 75,115 | |
| Directors’ fees and expenses | | | 162,522 | |
| Retired directors’ fees | | | 73,375 | |
| Insurance | | | 143,975 | |
| Legal fees | | | 179,437 | |
| Audit fees | | | 35,000 | |
| Professional fees – other | | | 1,000 | |
| Shareholder reports and proxy expenses | | | 97,392 | |
| Dues and listing fees | | | 25,000 | |
| Other expenses | | | 37,448 | |
| Total expenses | | | 3,572,856 | |
| Change in retirement benefits due to directors | | | (29,282 | ) |
| Sublease revenue (Note 11) | | | (61,155 | ) |
| Net expenses | | | 3,482,419 | |
| Net investment loss | | | (1,111,296 | ) |
| | | | | |
| Net realized and unrealized gain (loss) from investments and foreign currency transactions | | | | |
| Proceeds from sales | | | 116,152,185 | |
| Cost of securities sold | | | 114,528,516 | |
| Net realized gain (loss) from investments | | | 1,623,669 | |
| Net realized gain (loss) from foreign currency transactions Investments | | | (1,143,899 | ) |
| Net realized gain (loss) from foreign currency transactions | | | (1,143,899 | ) |
| Net change in unrealized appreciation (depreciation) on investments | | | | |
| Balance, beginning of year | | | (10,027,414 | ) |
| Balance, end of year | | | 82,044,496 | |
| Net change in unrealized appreciation (depreciation) on investments | | | 92,071,910 | |
| Net unrealized loss on translation of assets and liabilities in foreign currency | | | (9,365 | ) |
| Net realized and unrealized gain (loss) from investments and foreign currency transactions | | | 92,542,315 | |
| Net increase (decrease) in net assets resulting from operations | | $ | 91,431,019 | |
The notes to financial statements form an integral part of these statements.
Statements of Changes in Net Assets
| | | Year Ended November 30, 2019 | | | Year Ended November 30, 2018 | |
| Net investment loss | | $ | (1,111,296 | ) | | $ | (1,408,709 | ) |
| Net realized gain (loss) | | | 1,623,669 | | | | (9,051,561 | ) |
| Net realized gain (loss) from foreign currency transactions | | | (1,143,899 | ) | | | 202,193 | |
| Net change in unrealized appreciation (depreciation) on investments | | | 92,071,910 | | | | (38,530,798 | ) |
| Net unrealized loss on translation of assets and liabilities in foreign currency | | | (9,365 | ) | | | – | |
| Net increase (decrease) in net assets resulting from operations | | | 91,431,019 | | | | (48,788,875 | ) |
| Dividends paid/payable | | | (385,798 | ) | | | (578,697 | ) |
| Net increase (decrease) in net assets | | | 91,045,221 | | | | (49,367,572 | ) |
| Net assets, beginning of year | | | 194,833,999 | | | | 244,201,571 | |
| Net assets, end of year | | $ | 285,879,220 | | | $ | 194,833,999 | |
The notes to financial statements form an integral part of these statements.
Notes to Financial Statements
Year ended November 30, 2019
ASA Gold and Precious Metals Limited (the “Company”) is a closed-end investment company registered under the Investment Company Act of 1940, as amended (the “1940 Act”), and was organized as an exempted limited liability company under the laws of Bermuda.
| 2. | Investment objective and strategy |
The Company is a non-diversified, closed-end fund that seeks long-term capital appreciation primarily through investing in companies engaged in the exploration for, development of projects or mining of precious metals and minerals. The Company is managed by Merk Investments LLC (the “Adviser”).
It is a fundamental policy of the Company that at least 80% of its total assets must be (i) invested in common shares or securities convertible into common shares of companies engaged, directly or indirectly, in the exploration, mining or processing of gold, silver, platinum, diamonds or other precious minerals, (ii) held as bullion or other direct forms of gold, silver, platinum or other precious minerals, (iii) invested in instruments representing interests in gold, silver, platinum or other precious minerals such as certificates of deposit therefor, and/or (iv) invested in securities of investment companies, including exchange traded funds, or other securities that seek to replicate the price movement of gold, silver or platinum bullion.
The Company employs bottom-up fundamental analysis and relies on detailed primary research including meetings with company executives, site visits to key operating assets, and proprietary financial analysis in making its investment decisions.
| 3. | Summary of significant accounting policies |
The following is a summary of the significant accounting policies:
A. Security valuation
The net asset value of the Company generally is determined as of the close of regular trading on the New York Stock Exchange (the “NYSE”) or the Toronto Stock Exchange (the “TSX”), whichever is later, on the date for which the valuation is being made (the “Valuation Time”). Portfolio securities listed on U.S. and foreign stock exchanges generally are valued at the last reported sale price as of the Valuation Time on the exchange on which the securities are primarily traded, or the last reported bid price if a sale price is not available. Securities traded over the counter are valued at the last reported sale price or the last reported bid price if a sale price is not available. Securities listed on foreign stock exchanges may be fair valued based on significant events that have occurred subsequent to the close of the foreign markets.
Securities for which current market quotations are not readily available are valued at their fair value as determined in good faith by, or in accordance with procedures approved by, the Company’s Board of Directors. If a security is valued at a “fair value,” that value may be different from the last quoted price for the security. Various factors may be reviewed in order to make a good faith determination of a security’s fair value. These factors include, but are not limited to, the nature of the security; relevant financial or business developments of the issuer; actively traded similar or related securities; conversion rights on the security; and changes in overall market conditions.
The difference between cost and market value is reflected separately as net unrealized appreciation (depreciation) on investments. The net realized gain or loss from the sale of securities is determined for accounting purposes on the identified cost basis.
B. Restricted securities
At November 30, 2019, the Company held investments in restricted securities of 0.53% of net assets valued in accordance with procedures approved by the Company’s Board of Directors as follows:
| Shares | | | Cost | | | Issuer | | Value per Unit | | | Value | | | Acquisition Date |
| | 1,744,186 | | | $ | 1,132,930 | | | Integra Resources Corp. | | $ | 0.87 | | | $ | 1,510,061 | | | 11/26/19 |
Notes to Financial Statements (continued)
Year ended November 30, 2019
| 3. | Summary of significant accounting policies (continued) |
C. Fair value measurement
In accordance with accounting principles generally accepted in the United States of America (“U.S. GAAP”), fair value is defined as the price that the Company would receive to sell an investment or pay to transfer a liability in a timely transaction with an independent buyer in the principal market, or in the absence of a principal market the most advantageous market for the investment or liability. U.S. GAAP establishes a three-tier hierarchy to distinguish between (1) inputs that reflect the assumptions market participants would use in pricing an asset or liability developed based on market data obtained from sources independent of the reporting entity (observable inputs) and (2) inputs that reflect the reporting entity’s own assumptions about the assumptions market participants would use in pricing an asset or liability developed based on the best information available in the circumstances (unobservable inputs) and to establish classification of fair value measurements for disclosure purposes. Various inputs are used in determining the value of the Company’s investments. The inputs are summarized in the three broad levels listed below.
| | Level 1 – | Unadjusted quoted prices in active markets for identical assets or liabilities that the Company has the ability to access. |
| | | |
| | Level 2 – | Observable inputs other than quoted prices included in level 1 that are observable for the asset or liability either directly or indirectly. These inputs may include quoted prices for identical instruments on an inactive market, prices for similar investments, interest rates, prepayment speeds, credit risk, yield curves, default rates, and similar data. |
| | | |
| | Level 3 – | Unobservable inputs for the assets or liability to the extent that relevant observable inputs are not available, representing the Company’s own assumptions about the assumptions that a market participant would use in valuing the asset or liability, and that would be based on the best information available. |
The inputs or methodology used for valuing securities are not necessarily an indication of the risk associated with investing in those securities.
The following is a summary of the inputs used as of November 30, 2019 in valuing the Company’s investments at fair value:
Investment in Securities (1) Measurements at November 30, 2019 | |
| | | Level 1 | | | Level 2 | | | Level 3 | | | Total | |
| Common Shares | | | | | | | | | | | | | | | | |
| Gold mining, exploration, development and royalty companies | | $ | 268,143,281 | | | $ | – | | | $ | – | | | $ | 268,143,281 | |
| Diversified metals mining, exploration, development and royalty companies | | | 7,759,815 | | | | – | | | | – | | | | 7,759,815 | |
| Silver mining, exploration and development companies | | | 3,474,250 | | | | – | | | | – | | | | 3,474,250 | |
| Rights | | | | | | | | | | | | | | | | |
| Silver mining, exploration and development companies | | | – | | | | – | | | | 112,855 | | | | 112,855 | |
| Warrants | | | | | | | | | | | | | | | | |
| Gold mining, exploration, development and royalty companies | | | – | | | | – | | | | 858,052 | | | | 858,052 | |
| Total Investments | | $ | 279,377,346 | | | $ | – | | | $ | 970,907 | | | $ | 280,348,253 | |
| (1) | See schedules of investments for country classifications. |
Notes to Financial Statements (continued)
Year ended November 30, 2019
| 3. | Summary of significant accounting policies (continued) |
C. Fair value measurement (continued)
The following is a reconciliation of Level 3 investments for which significant unobservable inputs were used to determine fair value.
| | | Rights | | | Warrants | |
| Balance November 30, 2018 | | $ | – | | | $ | – | |
| Purchases | | | 136,720 | | | | 906,540 | |
| Net change in unrealized depreciation | | | (23,865 | ) | | | (48,488 | ) |
| Balance November 30, 2019 | | $ | 112,855 | | | $ | 858,052 | |
| Net change in unrealized appreciation (depreciation) from investments held as of November 30, 2019* | | $ | (23,865 | ) | | $ | (48,488 | ) |
| * | The change in unrealized appreciation/(depreciation) is included in net change in unrealized appreciation/(depreciation) of investments in the accompanying Statement of Operations. |
The Level 3 investments for the Company represented 0.34% of net assets and did not warrant a disclosure of significant unobservable inputs.
D. Cash and Cash Equivalents
The Company considers all money market funds and all highly liquid temporary cash investments purchased with an original maturity of less than three months to be cash equivalents. The majority of the Company’s cash and cash equivalents at November 30, 2019 consisted of a money market fund, Federated U.S. Treasury Cash Reserve Fund, Institutional Shares.
E. Foreign Currency Translation
Portfolio securities and other assets and liabilities denominated in foreign currencies are translated into U.S. dollar amounts at the rate of exchange reported by independent data providers. Purchases and sales of investment securities and income and expense items denominated in foreign currencies are translated into U.S. dollar amounts on the respective dates of such transactions. The portion of the results arising from changes in the exchange rates and the portion due to fluctuations arising from changes in the market prices of securities are not isolated. The resulting net foreign currency gain or loss is included on the Statements of Operations. Realized foreign currency gains or losses arise from sales of foreign currencies, currency gains or losses realized between the trade and settlement dates on securities transactions, fluctuation in exchange rates between the initial purchase date and subsequent sale date on securities transactions, and the difference between the amounts of dividends, interest, and foreign withholding taxes recorded on the Company’s books and the U.S. dollar equivalent of the amounts actually received or paid.
F. Securities Transactions and Investment Income
During the year ended November 30, 2019, sales and purchases of portfolio securities (other than temporary short-term investments) amounted to $116,152,185 and $111,554,284, respectively.
Dividend income is recorded on the ex-dividend date, net of withholding taxes or ADR fees, if any. Interest income is recognized on the accrual basis.
G. Dividends to Shareholders
Dividends to shareholders are recorded on the ex-dividend date. The reporting for financial statement purposes of dividends paid from net investment income and/or net realized gains may differ from their ultimate reporting for U.S. federal income tax purposes, primarily because of the separate line item reporting for financial statement purposes of foreign exchange gains or losses.
H. Use of Estimates
The preparation of the financial statements in conformity with U.S. GAAP requires management to make estimates and assumptions that affect the amounts reported in the financial statements and accompanying notes. Actual results could differ from those estimates. It is management’s opinion that all adjustments necessary for a fair statement of the results of the interim periods presented have been made. All adjustments are of a normal recurring nature.
Notes to Financial Statements (continued)
Year ended November 30, 2019
| 3. | Summary of significant accounting policies (continued) |
I. Basis of Presentation
The financial statements are presented in U.S. dollars. The Company is an investment company and accordingly follows the investment company accounting and reporting guidance of the Financial Accounting Standards Board (“FASB”) Accounting Standard Codification, Topic 946 “Financial Services - Investment Companies”.
J. Income Taxes
In accordance with U.S. GAAP requirements regarding accounting for uncertainties on income taxes, management has analyzed the Company’s tax positions taken on federal and state income tax returns, as applicable, for all open tax years (2016-2019). As of November 30, 2019, the Company has not recorded any unrecognized tax benefits. The Company’s policy, if it had unrecognized benefits, is to recognize accrued interest and penalties in operating expenses.
| 4. | Tax status of the Company |
The Company is a “passive foreign investment company” (“PFIC”) for U.S. federal income tax purposes and is not subject to Bermuda tax as an exempted limited liability company organized under the laws of Bermuda. Nor is the Company generally subject to U.S. federal income tax, since it is a non-U.S. corporation whose only business activity in the United States is trading in stocks or securities for its own account; under the U.S. federal tax law that activity does not constitute engaging in the conduct of a trade or business within the United States, even if its principal office is located therein. As a result, its gross income is not subject to U.S. federal income tax, though certain types of income it earns from U.S. sources (such as dividends of U.S. payors) are subject to U.S. federal withholding tax.
Investment Adviser – Effective April 12, 2019, Merk Investments LLC (the “Adviser”) is the investment adviser to the Company. Pursuant to an investment advisory agreement, the Adviser receives an advisory fee, payable monthly, from the Company at an annual rate of 0.70% of the Company’s average daily net assets. Prior to April 12, 2019, the Company was an internally managed fund.
Other Service Providers – On January 7, 2019, the Company entered into an agreement with Atlantic Fund Administration, LLC, a wholly owned subsidiary of Apex US Holdings LLC (d/b/a Apex Fund Services) (“Apex”) to provide fund accounting, fund administration and compliance services to the Company. The fees related to these services are included in fund services fees within the Statement of Operations. Apex also provides certain shareholder report production and EDGAR conversion and filing services. Pursuant to an Apex services agreement, the Company pays Apex customary fees for its services. Apex provides a Principal Financial Officer, as well as certain additional compliance support functions.
Foreside Fund Services, LLC provides a Chief Compliance Officer to the Company.
The Company is a closed-end investment company and operates pursuant to an exemptive order issued by the Securities and Exchange Commission (the “SEC”) pursuant to Section 7(d) of the 1940 Act (the “Order”). The Order is conditioned upon, among other things, the Company complying with certain requirements relating to the custody of assets and settlement of securities transactions outside of the United States different than those required of other registered investment companies. These conditions make it more difficult for the Company to implement a flexible investment strategy and to fully achieve its desired portfolio diversification than if it were not subject to such requirements.
The Company has recorded a liability for retirement benefits due to retired directors. The liability for these benefits at November 30, 2019 was $411,349. A director whose first election to the Board of Directors was prior to January 1, 2008 qualifies to receive retirement benefits if he has served the Company (and any of its predecessors) for at least twelve years prior to retirement. Directors first elected on or after January 1, 2008 are not eligible to participate in the plan.
The Company invests at least 80% of its total assets in securities of companies engaged, directly or indirectly, in the exploration, mining or processing of gold or other precious minerals. The Company also invests a substantial portion of its assets in companies that are domiciled and/or have operations outside of the United States, including emerging market countries, such as South Africa. The Company is, therefore, subject to gold and precious metals-related risk as well as risk related to investing in foreign securities, including political, economic, regulatory, liquidity, currency
Notes to Financial Statements (continued)
Year ended November 30, 2019
| 8. | Concentration risk (continued) |
fluctuation, and foreign exchange risks. The Company currently is invested in a limited number of securities and thus holds large positions in certain securities. Because the Company’s investments are concentrated in a limited number of securities of companies involved in the holding or mining of gold and other precious minerals and related activities, the net asset value of the Company may be subject to greater volatility than that of a more broadly diversified investment company.
In the ordinary course of business, the Company enters into contracts that contain a variety of indemnification provisions. The Company’s maximum exposure under these arrangements is unknown.
For the year ended November 30, 2019, the aggregate remuneration paid to the Company’s officers was $641,989. In addition, $510,410 was accrued for bonuses to the Company’s officers and employees. The Company has terminated the employment of its employees effective March 31, 2019. Due to the employment termination, the unvested portion of the CEO’s deferred bonus from fiscal years 2017 and 2018 has been fully vested as of November 30, 2019. In addition, the Company accrued $541,280 for severance costs to its employees. The accrued bonuses and severance costs were paid in full as of November 30, 2019.
The aggregate remuneration paid to the Company’s directors for the year ended November 30, 2019 is included in Directors’ fees and expenses and Retired directors’ fees on the Statement of Operations.
| 11. | Operating lease commitment |
In June 2017, the Company entered into a three-year operating lease agreement, commencing March 1, 2018, in San Mateo, CA for approximately 2,500 square feet to be used as office space for its employees. The lease provides for future minimum rental payments in the aggregate amount of $270,198 as of November 30, 2019. The lease contains escalation clauses relating to the tenant’s share of insurance, operating expenses and tax expenses of the lessor.
Future minimum rental commitments under the lease are as follows:
| 12/01/2019 – 11/30/2020 | | $ | 215,842 | |
| 12/01/2020 – 02/28/2021 | | | 54,356 | |
| Total | | $ | 270,198 | |
On June 5, 2019, the Company entered into a sublease agreement for the San Mateo office space. The Company receives monthly sublease revenue of $11,308; beginning on the first anniversary of the sublease commencement date, monthly sublease revenue is expected to increase 3%. The sublease agreement terminates February 28, 2021. For the year ended November 30, 2019, the Company received $61,155 per this agreement, as presented on the accompanying Statement of Operations.
The Company may from time to time purchase its common shares at a discount to NAV on the open market in such amounts and at such prices as the Company may deem advisable.
The Company had 19,289,905 shares outstanding as of November 30, 2019. There were no repurchases during the year ended November 30, 2019.
In accordance with U.S. GAAP provisions, management has evaluated the possibility of subsequent events existing in the Company’s financial statements through the date the financial statements were issued. The Company believes that there are no material events that would require disclosure.
Financial Highlights
| | | Years ended November 30 | |
| Per share operating performance (1) | | 2019 | | | 2018 | | | 2017 | | | 2016 | | | 2015 | |
| Net asset value, beginning of year | | $ | 10.10 | | | $ | 12.66 | | | $ | 12.61 | | | $ | 8.33 | | | $ | 11.50 | |
| Net investment loss | | | (0.06 | ) | | | (0.07 | ) | | | (0.09 | ) | | | (0.10 | ) | | | (0.09 | ) |
| Net realized gain (loss) from investments | | | 0.09 | | | | (0.47 | ) | | | (0.36 | ) | | | (0.79 | ) | | | 0.13 | |
| Net realized gain (loss) from foreign currency transactions | | | (0.06 | ) | | | 0.01 | | | | 0.01 | | | | (0.14 | ) | | | (0.21 | ) |
| Net increase (decrease) in unrealized appreciation on investments | | | 4.77 | | | | (2.00 | ) | | | 0.53 | | | | 5.35 | | | | (2.96 | ) |
| Net unrealized loss on translation of assets and liabilities in foreign currency | | | 0.00 | | | | 0.00 | | | | 0.00 | | | | 0.00 | | | | 0.00 | |
| Net increase (decrease) in net assets resulting from operations | | | 4.74 | | | | (2.53 | ) | | | 0.09 | | | | 4.32 | | | | (3.13 | ) |
| Dividends | | | | | | | | | | | | | | | | | | | | |
| From net investment income | | | (0.02 | ) | | | (0.03 | ) | | | (0.04 | ) | | | (0.04 | ) | | | (0.04 | ) |
| Net asset value, end of year | | $ | 14.82 | | | $ | 10.10 | | | $ | 12.66 | | | $ | 12.61 | | | $ | 8.33 | |
| Market value per share, end of year | | $ | 12.20 | | | $ | 8.66 | | | $ | 11.05 | | | $ | 10.81 | | | $ | 7.16 | |
| | | | | | | | | | | | | | | | | | | | | |
| Total investment return | | | | | | | | | | | | | | | | | | | | |
| Based on market price (2) | | | 41.14 | % | | | (21.39 | )% | | | 2.57 | % | | | 51.50 | % | | | (33.02 | )% |
| Based on net asset value (3) | | | 47.01 | % | | | (19.97 | )% | | | 0.74 | % | | | 51.86 | % | | | (27.20 | )% |
| | | | | | | | | | | | | | | | | | | | | |
| Ratio of average net assets | | | | | | | | | | | | | | | | | | | | |
| Expenses | | | 1.38 | % | | | 1.35 | % | | | 1.19 | % | | | 1.26 | % | | | 1.64 | % |
| Net investment loss | | | (0.44 | )% | | | (0.63 | )% | | | (0.65 | )% | | | (0.79 | )% | | | (0.83 | )% |
| | | | | | | | | | | | | | | | | | | | | |
| Supplemental data | | | | | | | | | | | | | | | | | | | | |
| Net assets, end of year (000 omitted) | | $ | 285,879 | | | $ | 194,834 | | | $ | 244,202 | | | $ | 243,229 | | | $ | 160,744 | |
| Portfolio turnover rate | | | 45 | % | | | 3 | % | | | 9 | % | | | 10 | % | | | 10 | % |
| Shares outstanding (000 omitted) | | | 19,290 | | | | 19,290 | | | | 19,290 | | | | 19,290 | | | | 19,290 | |
| (1) | Per share amounts from operations have been calculated using the average shares method. |
| (2) | Total investment return is calculated assuming a purchase of shares at the current market price at close the day before and a sale at the current market price on the last day of each period reported. Dividends are assumed, for purposes of this calculation, to be reinvested at prices obtained under the Company’s dividend reinvestment plan. |
| (3) | Total investment return is calculated assuming a purchase of shares at the current net asset value at close the day before and a sale at the current net asset value on the last day of each period reported. Dividends are assumed, for purposes of this calculation, to be reinvested at prices obtained under the Company’s dividend reinvestment plan. |
Certain Tax Information for U.S. Shareholders
The Company is a “passive foreign investment company” (“PFIC”) for U.S. federal income tax purposes. In view of this, U.S. investors holding common shares in taxable accounts are strongly urged to review the important tax information regarding the consequences of an investment in the common shares of the Company, which may be found at www.asaltd.com under “Investor Information | Taxpayer Information - PFIC”. Due to the complexity and potentially adverse effect of the applicable tax rules, U.S. shareholders are strongly urged to consult their own tax advisors concerning the impact of these rules on their investment in the Company and on their individual situations, and any additional informational filing requirements.
Dividend Reinvestment and Stock Purchase Plan
Computershare Trust Company, N.A. (“Computershare”) has been authorized by the Company to offer and administer the Computershare Investment Plan, a dividend reinvestment and stock purchase plan (“CIP”) to shareholders as well as new investors or non-shareholders. Shareholders and new investors may elect to participate in the CIP by signing an enrollment form or by going to www.computershare.com/investor and following the instructions. New investors or non-shareholders must include a minimum initial investment of at least $500. Computershare as agent will apply to the purchase of common shares of the Company in the open market (i) all cash dividends (after deduction of the service charge described below) that become payable to such participant on the Company’s shares (including shares registered in his or her name and shares accumulated under the CIP) and (ii) any optional cash purchases ($50 minimum, subject to an annual maximum of $250,000) received from such participant.
Computershare may combine CIP participant purchase requests with other purchase requests received from other CIP participants and may submit the combined purchase requests in bulk to Computershare’s broker as a single purchase order. Purchase requests may be combined, at Computershare’s discretion, according to one or more factors such as purchase type (e.g., dividend reinvestment, one-time ACH, check, etc.), request date, or request delivery method (e.g., online, regular mail, etc.). Computershare will submit bulk purchase orders to its broker as and when required under the terms of the CIP. Computershare’s broker may execute each bulk purchase order in one or more transactions over one or more days, depending on market conditions. Each participant whose purchase request is included in each bulk purchase order will receive the weighted average market price of all shares purchased by Computershare’s broker for such order. Any stock dividends or split shares distributed on shares held in the CIP will be credited to the participant’s account.
A one-time $10 enrollment fee to establish a new account for a new investor or non-shareholder will be deducted from the purchase amount. For each participant, each dividend reinvestment will entail a transaction fee of 5% of the amount reinvested, up to a maximum of $3 plus $0.03 per share purchased. Each optional cash purchase by check or one-time online bank debit will entail a transaction fee of $5 plus $0.03 per share purchased. If a participant has funds automatically deducted monthly from his or her savings or checking account, for each debit the transaction fee is $2.50 plus $0.03 per share purchased. Fees will be deducted from the purchase amount. Each batch order sale will entail a transaction fee of $15 plus $0.12 per share sold. Each market order sale will entail a transaction fee of $25 plus $0.12 per share sold. Fees are deducted from the proceeds derived from the sale. All per share fees include any brokerage commissions Computershare is required to pay. Any fractional share will be rounded up to a whole share for purposes of calculating the per share fee. Additional fees are charged by Computershare for specific shareholder requests such as copies of account statements for prior years ($10 per year requested) and a returned check and ACH reject fee of $25.
Participation in the CIP may be terminated by a participant at any time by written, telephone or Internet instructions to Computershare. Upon termination, a participant will receive a certificate for the whole number of shares credited to his or her account, unless he or she requests the sale of all or part of such shares. Dividends reinvested by a shareholder under the CIP will generally be treated for U.S. federal income tax purposes in the same manner as dividends paid to such shareholder in cash. See “Certain Tax Information for U.S. Shareholders” for more information regarding tax consequences of an investment in shares of the Company, including the effect of the Company’s status as a PFIC. The amount of the service charge is deductible for U.S. federal income tax purposes, subject to limitations.
To participate in the CIP, shareholders may not hold their shares in a “street name” brokerage account.
Additional information regarding the CIP may be obtained from Computershare, P.O. Box 505000, Louisville, KY 40233-5000. Information may also be obtained on the Internet at www.computershare.com/investor or by calling Computershare’s Telephone Response Center at (800) 317-4445 between 9:00 a.m. and 5:00 p.m., Eastern time, Monday through Friday.
Privacy Notice
The Company is committed to protecting the financial privacy of its shareholders.
We do not share any nonpublic, personal information that we may collect about shareholders with anyone, including our affiliates, except to service and administer shareholders’ share accounts, to process transactions, to comply with shareholders’ requests of legal requirements or for other limited purposes permitted by law. For example, the Company may disclose a shareholder’s name, address, social security number and the number of shares owned to its administrator, transfer agent or other service providers in order to provide the shareholder with proxy statements, tax reporting forms, annual reports or other information about the Company. This policy applies to all of the Company’s shareholders and former shareholders.
We keep nonpublic personal information in a secure environment. We restrict access to nonpublic personal information to Company employees, agents and service providers who have a need to know the information based on their role in servicing or administering shareholders’ accounts. The Company also maintains physical, electronic and procedural safeguards to protect the confidentiality of nonpublic personal information.
Form N-PX/Proxy Voting
The company files a list of its proxy votes with the SEC for the period of July 1 - June 30 of each year on Form N-PX. The policies and procedures used by the Company to determine how to vote proxies relating to portfolio securities and information regarding how the Company voted proxies relating to portfolio securities during the most recent twelve month period are available on the Company’s website at www.asaltd.com and on the SEC’s website at www.sec.gov. A written copy of the Company’s policies and procedures is available without charge, upon request, by calling (800) 432-3378.
Form N-Q/Portfolio Holdings
The Company files its complete schedule of portfolio holdings with the SEC for the first and third quarters of each fiscal year on Form N-Q. The Company’s Forms N-Q are available on the SEC’s website at www.sec.gov. The Company’s Forms N-Q also may be reviewed and copied at the Reference Room in Washington, D.C.; information on the operation of the Public Reference Room may be obtained by calling 1-800-SEC-0330. The schedule of portfolio holdings on Form N-Q also is included in the Company’s financial statements for the first and third quarters of each fiscal year which are available on the Company’s website at www.asaltd.com.
Common Shares Repurchased
Notice is hereby given in accordance with Section 23(c) of the 1940 Act that the Company is authorized to purchase its common shares in the open market if the discount to net asset value exceeds a certain threshold as determined by the Board of Directors from time to time. The Company may purchase its common shares in such amounts and at such prices as the Company may deem advisable. There can be no assurance that such action will reduce the discount. There were no repurchases during the twelve months ended November 30, 2019. The Company had 19,289,905 shares outstanding on November 30, 2019.
Board of Directors and Officers of ASA Gold and Precious Metals Limited
Directors are elected at each annual general meeting of shareholders to serve until the next annual general meeting. The address of each director and officer is c/o ASA Gold and Precious Metals Limited, Three Canal Plaza, Suite 600, Portland, ME 04101.
Independent Directors
Mary Joan Hoene, (70) Position held with the Company: Chair (non-executive) since January 2019. Deputy Chair (non-executive) 2016 to 2018. Director since 2014. Principal occupations during past 5 years: Counsel, Carter Ledyard & Milburn LLP since 2010. Other Directorships held by Director: None. | Bruce Hansen (62) Position held with the Company: Director since 2014. Principal occupations during past 5 years: Chief Executive Officer, General Moly, Inc. since 2007. Other Directorships held by Director: Director of Energy Fuels Inc. since 2006; Director of General Moly Inc. since 2007; Director and past Chairman (2011) of the Nevada Mining Association 2010 to 2019. |
Anthony Artabane (65) Position held with the Company: Director since 2019. Principal occupations during past 5 years: Managing Member, Anthony Artabane CPA, PLLC since 2014. Other Directorships held by Director: None. | |
Other Officers
Axel Merk (50) Position held with the Company: Chief Operating Officer since March 2019. Principal occupations during past 5 years: Founder, President and Chief Investment Officer, Merk Investments since 1994. | Karen Shaw (47) Position held with the Company: Chief Financial Officer since March 2019. Principal occupations during past 5 years: Senior Vice President, Apex Fund Services since 2019; Senior Vice President, Atlantic Fund Services 2008 to 2019. |
Peter Maletis (49) Position held with the Company: President since March 2019. Principal occupations during past 5 years: Vice President, Merk Investments since March 2019; Research Analyst, Franklin Templeton Investments 2010 to 2019. | Jack Huntington (49) Position held with the Company: Chief Compliance Officer since September 2015. Principal occupations during past 5 years: Fund Chief Compliance Officer at Foreside Fund Officer Services, LLC since 2015; Senior Vice President and Counsel at Citi Fund Services 2008 to 2015. |
Zachary Tackett (31) Position held with the Company: Corporate Secretary since November 2019. Principal occupations during past 5 years: Counsel, Apex Fund Services since 2019; Counsel, Atlantic Fund Services 2014 to 2019. | |
Gold and Precious Metals Limited
Other Information
Shareholder Services
ASA Gold and Precious Metals Limited
Three Canal Plaza, Suite 600
Portland, ME, U.S.A. 04101
(800) 432-3378
Registered Office
Canon’s Court
22 Victoria Street
Hamilton HM 12, Bermuda
Investment Adviser
Merk Investments LLC
San Francisco, CA, U.S.A.
Independent Registered Public Accounting Firm
Tait, Weller & Baker LLP, Philadelphia, PA, U.S.A.
Counsel
Appleby, Hamilton, Bermuda
K&L Gates LLP, Washington, DC, U.S.A.
Custodian
JPMorgan Chase Bank, N.A.
New York, NY, U.S.A.
Fund Administrator
Apex Fund Services
Portland, ME, U.S.A.
Transfer Agent
Computershare Trust Company, N.A.
P.O. Box 505000
Louisville, KY, U.S.A. 40233-5000
(800) 317-4445
Website: www.asaltd.com
The Semi-annual and Annual Reports of the Company and the latest valuation of net assets per share may be viewed on the Company’s website or may be requested from the Executive Office (800-432-3378). Shareholders are reminded to notify Computershare of any change of address.
ITEM 2. CODE OF ETHICS.
| (a) | The registrant has adopted a code of ethics that applies to its principal executive officer and principal financial officer. |
| (c) | During the period covered by this report, there was no amendment to the code of ethics referred to in this paragraph (a) of this Item that apply to a covered person and relate to any element of such code set forth in paragraph (b) of this Item 2. |
| (d) | During the period covered by this report, there were no waivers to the provisions of the code of ethics referred to in paragraph (a) of this Item. |
| (f) | A copy of the registrant’s code of ethics is filed herewith. |
ITEM 3. AUDIT COMMITTEE FINANCIAL EXPERT.
The registrant’s board of directors determined that Bruce Hansen, Chairman of the registrant’s Audit and Ethics Committee, is an “audit committee financial expert” as defined in the instructions to Item 3 of Form N-CSR. Mr. Hansen is “independent” as defined in Item 3 of Form N-CSR.
ITEM 4. PRINCIPAL ACCOUNTANT FEES AND SERVICES.
| (a) | Audit Fees. The aggregate fees billed for professional services rendered by the independent auditors for the audit of the registrant’s annual financial statements and review of the semi-annual financial statements and services rendered in connection with statutory or regulatory filings for 2019 and 2018 were $30,000 and $50,000, respectively. |
| (b) | Audit-Related Fees – There were no fees billed for assurance and related services rendered by the independent auditors that were reasonably related to the performance of the audit or review of the registrant’s financial statements for 2019 and 2018. |
| (c) | Tax Fees – The aggregate fees billed for professional services rendered by the independent auditors in connection with tax compliance, tax advice and tax planning for 2019 and 2018 were $5,000 and $5,000, respectively. The figures for 2019 and 2018 include fees billed for U.S. tax advisory services. |
| (d) | All Other Fees – There were no non-audit fees not disclosed above that were billed for products and services provided by the independent auditors for 2019 and 2018. |
| (e)(1) | The Audit and Ethics Committee (“Committee”) of the registrant has the sole authority to pre-approve all audit and non-audit services to be provided by the independent auditors, subject to the de minimis exceptions for non-audit services described in Section 10A(i)(1)B of the Securities Exchange Act of 1934 (“Exchange Act”) which are approved by the Committee prior to the completion of the audit. Any individual project that does not exceed $25,000 may be pre-approved by the Chairman of the Committee. Any such pre-approval by the Chairman of the Committee must be presented to the full Committee at its next scheduled meeting. Any proposed services exceeding that cost level requires specific pre-approval by the Committee. Pre-approval of audit and non-audit services shall not be required if the engagement to render the services is entered into pursuant to pre-approved policies and procedures established by the Committee, provided the Committee is informed of each such service. The Committee has not established such policies and procedures. |
| (e)(2) | None of the services described in paragraphs (b) – (d) above were approved by the Audit and Ethics Committee pursuant to paragraph (c)(7)(i)(C) of Rule 2-01 of Regulation S-X. |
| (g) | The aggregate fees billed by the independent auditors for non-audit services rendered to the registrant for 2019 and 2018 were $5,000 and $5,000, respectively. |
ITEM 5. AUDIT COMMITTEE OF LISTED REGISTRANTS.
| (a) | The registrant has a standing audit committee established in accordance with Section 3(a)(58)(A) of the Exchange Act. The members of the audit committee are: Messrs. Bruce Hansen (Chairman), Anthony Artabane and Ms. Mary Joan Hoene. |
ITEM 6. INVESTMENTS.
| (a) | Included as part of the report to shareholders under Item 1. |
ITEM 7. DISCLOSURE OF PROXY VOTING POLICIES AND PROCEDURES FOR CLOSED-END
MANAGEMENT INVESTMENT COMPANIES.
ASA Gold and Precious Metals Limited
Proxy Voting Policies and Procedures
The following is a statement of the proxy voting policies and procedures of ASA Gold and Precious Metals Limited (“ASA”).
Proxy Administration
ASA’s portfolio is primarily comprised of holdings in precious metals companies, and thus proxy voting will be done on proposals made by these issuing companies (“portfolio company” or “portfolio companies”).
Authority and responsibility to vote proxies with respect to ASA’s portfolio securities has been delegated to Merk Investments LLC (the “Adviser”). In evaluating proxy proposals, the Adviser may consider information from various sources, including the Board of Directors (“Board”) of ASA presenting a proposal, as well as independent sources. The ultimate decision rests with the Adviser, who is accountable to the Board.
The Adviser understands its proxy voting responsibilities and that proxy voting decisions may affect the long-term interests of ASA’s shareholders. The Adviser attempts to process every proxy vote it receives on behalf of ASA. However, voting proxies for shares of certain non-U.S. companies may involve significantly greater effort and cost than voting proxies for shares of U.S. companies. There may be situations where the Adviser may not or cannot vote a proxy. For example, the Adviser may receive proxy material too late to act upon or the cost of voting may outweigh the benefit of voting. In addition, the Adviser may not receive proxy materials when it holds depository receipts, (“ADRs”) as opposed to the underlying securities. Certain issuers do not instruct the holding banks to solicit proxies from depository receipt holders.
General Principles
For the purposes of ASA, a “portfolio company” is defined as a company in which ASA holds securities or assets.
In voting proxies, the Adviser will act solely in the best economic interests of ASA’s shareholders with the goal of maximizing the value of ASA’s portfolio. These policies and procedures are designed to promote accountability of a portfolio company’s management and board to its shareholders and to align the interests of those portfolio companies and their management with those of shareholders. These policies and procedures recognize that a portfolio company’s managers are entrusted with the day-to-day operations of the company, as well as longer-term strategic planning, subject to the oversight of that company’s board.
ASA believes that the quality and depth of a portfolio company’s management and its board is an important consideration in determining the desirability of an investment. Accordingly, the recommendations of the portfolio company’s board on many issues are given substantial weight in determining how to vote a proxy. However, each issue is considered on its own merits, and the position of the portfolio company’s board will not be supported whenever it is determined not to be in the best interests of ASA and its shareholders.
Specific Policies
A. Routine Matters
| 1. | Election of Directors. In general, the Adviser will vote in favor of the board’s director nominees if they are running unopposed. ASA believes that the board is in the best position to evaluate the qualifications of its directors and the needs of a particular board. Nevertheless, the Adviser will vote against, or withhold its vote for, any nominee whom the Adviser considers is not qualified or appears to lacks sufficient independence. When the board’s nominees are opposed in a proxy contest, the Adviser will evaluate which nominee’s publicly-announced management policies and goals are most likely to maximize shareholder value, as well as the past performance of the incumbent. |
| 2. | Ratification of Selection of Auditors. In general, the Adviser will rely on the judgment of the board in selecting the independent auditors. Nevertheless, the Adviser will examine the recommendation of the board in appropriate cases (e.g., where there has been a change in auditors based upon a disagreement on accounting matters). |
| 3. | Stock Option and Other Equity Based Compensation Plan Proposals. The Adviser will generally approve the board’s recommendations with respect to the adoption or amendment of stock option plans and other equity based compensation plans, provided that the total number of shares reserved under all of a company’s plans is reasonable and not excessively dilutive. |
B. Acquisitions, Mergers, Reincorporations, Reorganizations and Other Transactions
Because voting on transactions such as acquisitions, mergers, reincorporations and reorganizations involve considerations unique to each transaction, ASA does not have a general policy in regard to voting on those transactions. The Adviser will vote on a case-by-case basis on each transaction.
C. Changes in Capital Structure
The Adviser evaluates proposed capital actions on a case-by-case basis and will generally defer to the business analysis of the portfolio company’s board in support of such actions. In cases where proposed capital actions support proxy defenses or act to reduce or limit shareholder rights, particular consideration will be given to all the effects of the action, and the Adviser’s vote will be made in a manner consistent with the objective of maximizing long-term shareholder value for ASA.
D. Anti-Takeover Proposals
In general, the Adviser will vote against any proposal which the Adviser believes would materially contribute to preventing a potential acquisition or takeover of the portfolio company, including proposals to:
| • | Introduce cumulative voting; |
| • | Introduce unequal voting rights; |
| • | Create supermajority voting; |
| • | Establish preemptive rights. |
In general, the Adviser will vote in favor of any proposals to reverse the above.
E. Shareholder Proposals Involving Social, Moral or Ethical Matters
In general, the Adviser will vote in accordance with the recommendation of the portfolio company’s board on issues that primarily involve social, moral or ethical matters, although exceptions may be made in certain instances where the Adviser believes a proposal has substantial economic implications.
F. Conflict of Interest
Any actual or potential conflicts of interest between the Adviser and the Company’s shareholders arising from the proxy voting process will be addressed by the Adviser and the Adviser’s application of its proxy voting procedures pursuant to the delegation of proxy voting responsibilities to the Adviser. In the event that the Adviser notifies the CCO that a conflict of interest cannot be resolved under the Adviser’s Proxy Voting Procedures, the CCO is responsible for notifying the Chair of the Board of the irreconcilable conflict of interest and assisting the Chair with any actions she or he determines are necessary.
A “conflict of interest” includes, for example, any circumstance when the Company, the Adviser or one or more of their affiliates (including officers, directors and employees) knowingly does business with, receives compensation from, or sits on the board of, a particular issuer or closely affiliated entity, and therefore, may appear to have a conflict of interest between its own interests and the interests of Company shareholders in how proxies of that issuer are voted. Situations where the issuer seeking the proxy vote is also a client of the Adviser are deemed to be potential conflicts of interest. Potential conflicts of interest may also arise in connection with consent solicitations relating to debt securities where the issuer of debt is also a client of the Adviser.
In cases of a conflict of interest, a record shall be maintained confirming that the Adviser’s vote was made solely in the interests of ASA and without regard to any other consideration.
G. Recordkeeping
The Adviser uses ProxyEdge, a third party automated proxy voting service. Where appropriate, rationales for “No” votes cast by the Adviser will be supported by footnoted documentation on ProxyEdge. According to the Proxy Edge website, this service is a “suite of electronic voting services that help simplify the management of institutional proxies. The system manages the process of meeting notifications, voting, tracking, mailing, reporting, record maintenance and even vote disclosure rules enacted by the SEC.”
Revised and Re-Approved December 12, 2019
ITEM 8. PORTFOLIO MANAGERS OF CLOSED-END MANAGEMENT INVESTMENT COMPANIES.
Unless otherwise indicated, the information set forth below is as of November 30, 2019.
| (a)(1) | As of the date of this filing, on form N-CSR, Peter J. Maletis, President of the registrant since March 2019, is responsible for the day-to-day management of the registrant’s portfolio (the “Portfolio Manager”). Mr. Maletis joined the Merk Investments as Vice President in March 2019. He served as Research Analyst at Franklin Templeton Investments from 2010 to 2019. |
| (a)(2) | Other Accounts Managed by the Portfolio Manager. The chart below shows the number of other accounts managed by the Portfolio Manager as of November 30, 2019. |
| PORTFOLIO MANAGER | | REGISTERED INVESTMENT COMPANIES ($) | | OTHER POOLED INVESTMENT VEHICLES ($) | | OTHER ACCOUNTS ($) |
| Peter J. Maletis | | None | | None | | None |
| (a)(3) | Compensation of the Portfolio Manager. The compensation of the Portfolio Manager is comprised of a fixed annual salary and a variable compensation based on the assets of the Fund. The Portfolio Manager may be eligible to receive additional compensation based on certain factors, including but not limited to, the economic performance of the Adviser. Any amounts earned by the Portfolio Manager are payable by the Adviser and not by the Fund. |
| (a)(4) | Beneficial Ownership by Portfolio Manager. As of November 30, 2019, the Portfolio manager did not own any shares of the Registrant. |
ITEM 9. PURCHASES OF EQUITY SECURITIES BY CLOSED-END MANAGEMENT INVESTMENT COMPANY AND AFFILIATED PURCHASERS.
During the period covered by this report, there were no purchases made by or on behalf of the registrant or any “affiliated purchaser,” as defined in Rule 10b-18(a)(3) under Securities Exchange Act of 1934 (the “Exchange Act”), of any common shares of the registrant.
ITEM 10. SUBMISSION OF MATTERS TO A VOTE OF SECURITY HOLDERS
There have been no material changes to the procedures by which shareholders may recommend nominees to the registrant’s board of directors since the registrant provided disclosure in response to Item 22(b)(15) of Schedule 14A in its proxy statement dated February 21, 2019.
ITEM 11. CONTROLS AND PROCEDURES
| (a) | The Principal Executive Officer and the Principal Financial Officer, in their capacities as principal executive officer and principal financial officer of the registrant, have concluded that the registrant’s disclosure controls and procedures (as defined in Rule 30a-3(c) under the Investment Company Act of 1940 (the “1940 Act”)) are effective, based on their evaluation of these controls and procedures as of a date within 90 days prior to the filing date of this report. |
| (b) | There were no changes in the registrant’s internal control over financial reporting (as defined in Rule 30a-3(d) under the 1940 Act) that occurred during the second fiscal quarter of the period covered by this report that have materially affected, or are reasonably likely to materially affect, the registrant’s internal control over financial reporting. |
ITEM 12. DISCLOSURE OF SECURITIES LENDING ACTIVITIES FOR CLOSED-END MANAGEMENT INVESTMENT COMPANIES
The Registrant did not participate in securities lending activities during the year ended November 30, 2019.
ITEM 13. EXHIBITS.
(a)(1) The code of ethics that is the subject of disclosure under Item 2 above is attached hereto.
(a)(2) The certifications required by Rule 30a-2(a) under the 1940 Act are attached hereto.
(a)(3) Not applicable.
(a)(4) Not applicable.
(b) The certifications required by Rule 30a-2(b) under the 1940 Act, Rule 13a-14(b) under the Exchange Act and Section 1350 of Chapter 63 of Title 18 of the United States Code are attached hereto. These certifications are not deemed “filed” for purposes of Section 18 of the Exchange Act, or otherwise subject to the liability of that section. Such certifications will not be deemed to be incorporated by reference into any filing under the Securities Act of 1933 or the Exchange Act, except to the extent that the registrant specifically incorporates them by reference.
SIGNATURES
Pursuant to the requirements of the Securities Exchange Act of 1934 and the Investment Company Act of 1940, the Registrant has duly caused this report to be signed on its behalf by the undersigned, thereunto duly authorized.
Registrant ASA Gold and Precious Metals Limited
| By | /s/ Axel Merk
|
| | Axel Merk, Principal Executive Officer |
| | |
| Date | 1/31/2020 |
Pursuant to the requirements of the Securities Exchange Act of 1934 and the Investment Company Act of 1940, this report has been signed below by the following persons on behalf of the Registrant and in the capacities and on the dates indicated.
| By | /s/ Axel Merk
|
| | Axel Merk, Principal Executive Officer |
| | |
| Date | 1/31/2020 |
| By | Karen Shaw
|
| | Karen Shaw, Principal Financial Officer |
| | |
| Date | 1/31/2020 |