Exhibit 99.1
AMC Mining Consultants (Canada) Ltd. BC0767129 — 200 Granville Street, Suite 202 Vancouver BC V6C 1S4 CANADA — T +1 604 669 0044 F +1 604 669 1120 E vancouver@amcconsultants.com W amcconsultants.com |  |
Technical Report
MAG Silver Juanicipio NI 43-101 Technical Report
MAG Silver Corp
Zacatecas State, Mexico
In accordance with the requirements of National Instrument 43-101 “Standards of Disclosure for Mineral Projects” of the Canadian Securities Administrators
Qualified Persons:
A. Ross, Ph.D., P.Geo. (BC, AB)
G. Methven, P.Eng. (BC)
H. Muller, MAusIMM, CP
C. Kottmeier, P.Eng. (BC)
AMC Project 717002
Effective date 21 October 2017
Adviser of choice to the world’s minerals industry
| MAG Silver Juanicipio NI 43-101 Technical Report | |
| MAG Silver Corp. | 717002 |
This Technical Report (the Report) provides an update of the Mineral Resource estimate and Preliminary Economic Assessment (2017 PEA) of the Mineral Resources identified within the Minera Juanicipio Property (the Property) in Zacatecas State, Mexico. The Report has been prepared by AMC Mining Consultants (Canada) Ltd. (AMC) of Vancouver, Canada on behalf of MAG Silver Corp. (MAG Silver).
MAG Silver owns 44% of Minera Juanicipio S.A. de C.V. (Minera Juanicipio), a Mexican incorporated joint venture company, which owns (100%) of the Property. Fresnillo plc (Fresnillo) holds the remaining 56% interest in the joint venture and is the project operator. The Report has been prepared in accordance with the requirements of National Instrument 43-101 (NI 43-101), “Standards of Disclosure for Mineral Projects” of the Canadian Securities Administrators (CSA) for lodgement on CSA’s “System for Electronic Document Analysis and Retrieval” (SEDAR).
The economic analysis in the 2017 PEA is preliminary in nature and is based, in part, on Inferred Mineral Resources that are considered too speculative geologically to have the economic considerations applied to them that would enable them to be categorized as Mineral Reserves. There is no certainty that the PEA will be realized.
The monetary values shown in the Report are in US dollars ($).
The Juanicipio deposit consists of two main vein systems that lie in the north-eastern part of the Property, which is situated about 6 km to the south-west of the city of Fresnillo, a town located about 60 km north-west of the state capital, Zacatecas City. Zacatecas City has a population of approximately 140,000 and is located about 550 km northwest of Mexico City. Zacatecas City is serviced by daily flights from Mexico City. Surface rights to the part of the Property where mineral resources have been identified are held by Minera Juanicipio.
| 1.3 | Geology and mineralization |
The Juanicipio deposit consists of two main vein systems, the Valdecañas vein system and the Juanicipio vein, which are significant silver-gold epithermal structures. The Valdecañas vein system consists of five veins (V1E, V1W, HW1, VANT, and V2W) and the Juanicipio vein (VJUA). Both systems strike east-southeast and dip 35° to 70° with an average dip of about 58° southwest. The Valdecañas vein system displays the metal zonation typical of the Fresnillo District and epithermal veins in general, of an upper precious metal zone (Bonanza Zone) grading downwards into a deeper base metal zone (Deep Zone). There is significant evidence for a repeat of this zonation in the deeper reaches, perhaps reflecting “stacked” boiling levels (Buchanan, 1981). The Valdecañas structure hosts the majority of the Mineral Resources currently estimated on the Property.
The Juanicipio vein is located some 1,100 m to the south of the Valdecañas vein. Thirty-five drillholes contribute to the definition of this vein. Overall, Juanicipio is a much thinner vein and appears to have a higher gold content; however, this interpretation is based on a limited number of overall samples. Mineralization styles and host rocks are the same as those for Valdecañas.
The Valdecañas vein system has undergone multiple mineralizing events as suggested by various stages of brecciation and quartz sealing, local rhythmic microcrystalline quartz-pyrargyrite-acanthite banding, and open-space cocks-comb textures and vuggy silica. The vein system exhibits the characteristic metal zoning of the principal veins in the Fresnillo district, observed as a change from silver- and gold-rich zones at the top (Bonanza Zone) to increased lead and zinc in the deeper reaches (Deep Zone), with copper coming in at the deepest levels.
Mineralization in the Bonanza Zone consists of precious metal-rich, banded, or brecciated quartz-pyrargyrite-acanthite-polybasite-galena-sphalerite veins. Mineralization in the Deep Zone consists of base metal-rich, banded, or brecciated quartz-galena-sphalerite-chalcopyrite veins with lesser acanthite and pyrargyrite. Portions of the veins in the Deep Zone show skarn minerals, including garnets, pyroxenes, ilvaite and axinite within and surrounding the veins. Retrograde hydration of these minerals to chlorite and hydrogrossular is pervasive and widespread.
| MAG Silver Juanicipio NI 43-101 Technical Report | |
| MAG Silver Corp. | 717002 |
In December 2016, MAG Silver commissioned AMC to prepare an independent estimate of the Mineral Resources of the Property, to be compiled using exploration data available up to 31 December 2016. The updated global Mineral Resource estimate is summarized in Table 1.1. The Mineral Resources are based on a cut-off Net Smelter Return (NSR) value of $55/t.
| Table 1.1 | Summary of Global Mineral Resources as of 21 October 2017 |
| Resource Category | Tonnes (Mt) | Ag (g/t) | Au (g/t) | Pb (%) | Zn (%) | Cu (%) | Metal contained in Mineral Resources |
| Ag (Moz) | Au (koz) | Pb (Mlbs) | Zn (Mlbs) | Cu (Mlbs) |
| Indicated | 12.83 | 427 | 2.10 | 2.11 | 3.68 | 0.13 | 176 | 867 | 598 | 1041 | 38 |
| Inferred | 12.13 | 232 | 1.44 | 2.46 | 4.68 | 0.27 | 91 | 562 | 658 | 1252 | 71 |
Notes: CIM Definition Standards were used for reporting the Mineral Resources.
Dr A. Ross, Ph.D., P.Geo. of AMC is the Qualified Person under NI 43-101 and takes responsibility for the Mineral Resource estimate.
Mineral Resources are estimated at a resource NSR cut-off value of $55 per tonne.
Resource NSR values are calculated in US$ using factors of $0.61 per g/t Ag, $34.27 per g/t Au, $19.48 per % Pb, and $19.84 per % Zn. These factors are based on metal prices of $20/oz Ag, $1,300/oz Au, $0.95/lb Pb, and $1.00/lb Zn and estimated recoveries of 82% Au, 95% Ag, 93% Pb, 90% Zn. The Mineral Resource NSR does not include offsite costs.
Drilling results up to 31 December 2016.
The numbers may not compute exactly due to rounding.
Source: AMC Mining Consultants (Canada) Ltd.
The Valdecañas vein system displays the vertical grade transition from upper silver-rich zones to deep base metal dominant areas that is typical of Fresnillo District veins and epithermal silver veins in general. The Mineral Resource estimate was manually divided into the Bonanza Grade Silver (BGS) Zone and the Deep Zone to highlight differing metal content within the two zones. Parts of the Juanicipio vein are included in the BGS Zone as well as the silver-rich portions of the other veins. The BGS Zone terminology was used in the previous report and is kept for continuity. The results are shown in Table 1.2.
| Table 1.2 | Mineral Resource by Bonanza and Deep Zones as of 21 October 2017 |
| Zone | Resource category | Tonnes (Mt) | Ag (g/t) | Au (g/t) | Pb (%) | Zn (%) | Cu (%) | Ag (Moz) | Au (koz) | Pb (Mlbs) | Zn (Mlbs) | Cu (Mlbs) |
| BGS Zone | Indicated | 8.17 | 550 | 1.94 | 1.63 | 3.08 | 0.08 | 145 | 509 | 294 | 554 | 14 |
| Inferred | 1.98 | 648 | 0.81 | 1.32 | 2.80 | 0.06 | 41 | 52 | 58 | 123 | 3 |
| Deep Zone | Indicated | 4.66 | 209 | 2.39 | 2.96 | 4.73 | 0.23 | 31 | 359 | 304 | 486 | 24 |
| Inferred | 10.14 | 151 | 1.57 | 2.69 | 5.05 | 0.31 | 49 | 510 | 601 | 1129 | 69 |
Notes: See footnotes under Table 1.1.
Mineral Resources do not have demonstrated economic viability. Additionally, it cannot be assumed that Inferred Mineral Resources will be upgraded to a higher mineral resource category.
| 1.5 | Geotechnical considerations |
Following the 2012 PEA, Minera Juanicipio conducted additional exploration drilling and captured further geotechnical data from the drill core. This data was used to complement the existing data, and a re-assessment of conceptual stope dimensions, ground support requirements and vertical development stability analyses was conducted. The assessment findings were recorded in a Preliminary Geotechnical Report compiled in September 2015.
Subsequently, AMC was requested to further review the available geotechnical information and to undertake underground visits to neighbouring mines and the existing decline at Juanicipio. These visits afforded AMC’s geotechnical engineers the opportunity to take relevant measurements, obtain an appreciation of the geotechnical environment in which the mining operation is expected to take place, assess the stability of existing underground excavations taking cognisance of installed support systems, and liaise with technical services personnel.
| MAG Silver Juanicipio NI 43-101 Technical Report | |
| MAG Silver Corp. | 717002 |
AMC also assisted the Minera Juanicipio geologists in reviewing the existing geotechnical model, and a new 3D geotechnical model was developed by AMC for Juanicipio. The new geotechnical model takes cognisance of the additional laboratory-conducted rock strength testing recommended by AMC.
| 1.5.1 | Rock mass properties and hydrogeology |
A total of 20 drillholes has been geotechnically logged for the Juanicipio project area. The results indicate that the quality of the host rock can be anticipated to be Fair; and that there will be some areas where Poor ground conditions could be expected, these being in the vicinity of faults and intersections with rhyolite tuff agglomerate or shale.
The Deformation Modulus (Young’s Modulus) is an indication of the stiffness of the rock type. The host rock at Juanicipio is fairly soft, implying that deformation can be expected when subjected to large loads / stress.
To assess the rock mass properties, the results of data reduction analyses were input into Rocscience’s RocLab software package. Only the LUAR rock mass properties were evaluated, reflecting both the predominance of the LUAR lithology as the host rock for the mineralized vein and the quantity and type of available rock strength test data. The results of the rock mass property analysis indicate that the waste rock strength is Fair to Good. The single sample for vein mineralization indicated a Uniaxial Compressive Strength (UCS) of 178 MPa or Good classification.
Based on limited data, the depth of weathering appears to vary significantly across the site. Depths of weathering down to 400 m below surface have been recorded.
There have been no detailed investigations carried out on the hydrogeology of the Juanicipio area. AMC recommends that hydrogeological investigations be carried out, taking particular cognisance of any further available relevant information from other mines close by. The strategy adopted for mine planning is to have the main development (ramps and footwall access) ahead of the stope mining front. This strategy will assist in dewatering levels prior to stoping.
No additional detailed geotechnical core logging has been conducted on drillhole core since the assessment of potential stope panel dimensions and vertical development recommendations were made in 2015. The results of the stope stability assessments for the Juanicipio project using the empirical Stability Graph Method (Mathews et al. 1981; Potvin, Y. 1988) indicate that hangingwall stability is strongly influenced by vein dip. At a 65° dip a vertical stope height of 21.8 m is projected to be stable without support. At lower dip angles cable bolt support may be needed, especially in the volcanic lithologies. At a 45° dip and in the volcanic lithology, a 15 m or greater vertical height is projected to require hangingwall support for stability.
| 1.5.3 | Stope dilution estimation |
Dilution for Long Hole Open Stopes (LHOS) has been geotechnically estimated using the equivalent linear overbreak slough (ELOS) technique (Clark and Pakalnis, 1997). This empirical method estimates the overbreak based on recorded case histories and established design curves relating the modified stability number N’ and the hydraulic radius. Stopes are considered likely to be sensitive to overbreak to some degree given the blocky ground conditions. The dilution estimation indicates an anticipated dilution of ~0.55 m from a sedimentary hangingwall dipping at 55°.
A number of mining method studies have been carried out to identify suitable design strategies for the project. The studies include identification of the most suitable stoping method, production rate, backfilling method, and haulage method for the mine. Methods that provide high mining recovery and lower dilution have been assessed against other methods that may be cheaper, but result in greater loss or dilution of mineralization.
| MAG Silver Juanicipio NI 43-101 Technical Report | |
| MAG Silver Corp. | 717002 |
The 2012 PEA study considered a longhole stoping mining method with pastefill and a production rate of 2,650 tpd. AMC undertook several site visits to other operating mines in the area to review the details of the mining methods used and the application of rock fill. The primary mining method continues to be longhole stoping, but at an increased production rate of 4,000 tpd. Some cost savings and production efficiencies have been identified with the use of waste rock fill, which is now considered as the primary backfill; in the wider stopes where more than one longitudinal pass is required, cemented rock fill will be utilized.
The proposed mining method employs zone access via three internal ramps on 20 m sub-levels, as well as footwall access to the extents of the mineralization to allow placement of rock fill. Stopes 20 m high (floor to floor) are mined from the extents back to the central access (on retreat) with rock fill placed within 20 m of the blasting face.
In the lower levels of the vein, the vein widens out to a maximum thickness of approximately 30 m. In these areas, the vein will be mined in two longitudinal passes with a maximum width of 15 m. The footwall stope will be taken first over the full strike length, followed by the hangingwall stope. Cemented rock fill will be used in the footwall stope to prevent waste entering the hanging wall stope.
A composite plan view of the mine design showing the general layout of ramps and footwall drives for backfill access is shown in Figure 1.1.
| Figure 1.1 | Composite plan view of mine design |
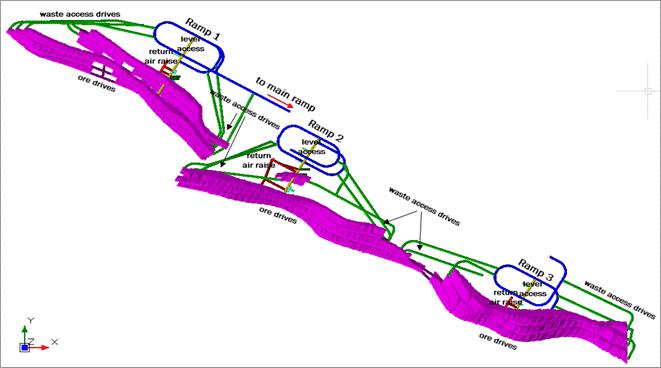
Truck haulage, shaft hoisting, and conveying have been considered for transferring mineralized rock and waste from the mine workings to surface. All waste not placed directly in stopes will be trucked to surface via twin access declines, where it will be stockpiled and later used for backfilling stopes as they are mined out. In early mining, mineralized rock from development and stoping will be trucked to a rock pass feeding the underground crusher. The crusher station is located on 1950 RL, from where the mineralized rock will be transferred to surface via a main conveyor (base at 1940 RL). The decline portal for the conveyor is near the projected processing plant location.
An underground winze (780 m in length) will be sunk in the hangingwall of the mineralization. The winze is planned to eventually hoist (after Year 8) mineralized rock from the loading station on 1300 RL to the top of the shaft on 2040 RL. Mineralized rock is transferred directly from the skips to the decline conveyor via a rock pass and loading station.
| MAG Silver Juanicipio NI 43-101 Technical Report | |
| MAG Silver Corp. | 717002 |
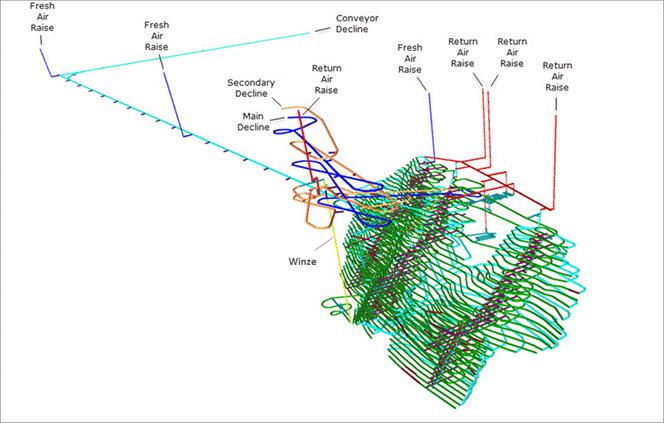
It is envisaged that mining will be carried out using modern trackless mining equipment. The proposed mine ventilation circuit will include a number of ventilation raises, raise-bored from surface.
Figure 1.2 is an illustration of the mine as a whole, showing the ventilation layout, the conveyor route to surface, and the winze.
| Figure 1.2 | Overall mine layout |
Metallurgical test work was carried out between 2008 and 2015 on metallurgical samples composited from 67 drillhole samples taken from the Valdecañas vein system.
The proposed process plant consists of a comminution circuit followed by the sequential flotation of a silver-rich lead concentrate, a zinc concentrate, and a gold-rich pyrite concentrate.
It is envisaged that crushed mineralized rock will be delivered to a stockpile located near the mill and will feed directly to the mill via transfer conveyors.
The proposed milling circuit comprises a semi-autogenous grinding mill and ball mill, producing feed to the flotation circuit. Separate lead, zinc, and pyrite concentrates would be thickened, filtered, and stockpiled for dispatch by truck directly to customers or for onward shipment. It is noted that, although Cu is estimated in the Mineral Resource, it is not considered in this study, additional mineral processing work being required to establish prospects for reasonable extraction.
It is envisaged that the process plant will ramp up operations over a three year period to a steady state throughput rate of 1.4 Mtpa. Estimated mill recoveries are summarized in Table 1.3.
| MAG Silver Juanicipio NI 43-101 Technical Report | |
| MAG Silver Corp. | 717002 |
| | Gold | Silver | Lead | Zinc |
| Mill recovery | 82% | 95% | 93% | 90% |
| 1.8 | Project infrastructure |
A 6.5 km access road, mostly over hilly terrain, will be required to access the main decline portal site from the mill. A two-lane sealed road suitable for use by heavy vehicles is proposed.
Power would be supplied to a main substation at the site via a 115 kV overhead power line supplied from the local grid. The line would have a length of approximately 1.5 km to the main processing plant sub-station.
The electrical supply system for the Juanicipio project will be developed in stages as the project develops. An initial system, with power sourced from a nearby mine, has been used for the initial decline development. This power will eventually be disconnected and the supply switched over to the permanent mine system, which originates at the mill substation.
The permanent system will have power feeding the underground and surface facilities from the mill substation. There will be two feeders for the mine: a power line that will follow the access road to deliver power from the mill to the current portal and surface ventilation fans, and a second power line going down the conveyor decline.
It is anticipated that water will initially be provided via a pipeline from a neighbouring mine that has excess water from ground water inflow. This water will be supplemented by any water from dewatering the underground workings at Juanicipio.
It is envisaged that all mill tailings will be discharged to a tailings storage facility (TSF) with a total volume of approximately 18 Mm3. No detailed environmental or geotechnical studies have been carried out on suitable sites for the TSF for the project. Nevertheless, several sites have been considered, including a location adjacent to the proposed mill site.
| 1.9 | Underground infrastructure |
The handling system for mineralized material is based around a nominal 4,000 tpd capacity, approximately equivalent to 216 tph over a 24-hour period, based on a capacity factor of 1.3. This allows for excess capacity in the mineralized material handling system relative to any potential disconnection between the mine and mill. Initially mineralized material transport from various mining levels will be by truck haulage to the crusher on 1950 RL. The crushed material is then placed on a load-out belt feeding two sequential conveyors to the surface stockpile adjacent to the mill.
Later in the mine life, an internal winze is projected to be sunk to allow the hoisting of mineralized material from the loading pocket on 1300 RL up to the crusher on 1950 RL. From there, the material will be conveyed out of the mine via the existing conveyor system. The winze hoist consists of a double drum, dual skip system with rope guides. The hoist is mounted at the head of the winze excavation in a chamber above the skip dumps. The skips are discharged via pneumatic self-discharge systems into a raise that leads to a 500 t storage bin. Mineralized material that is delivered to the bin will be sized to minus 200 mm. The storage bin discharges into a jaw crusher that sizes the material to minus 100 mm. The hoist is designed to accommodate the production capacity of 1.4 Mtpa, however there is some spare capacity built in through potential minor adjustments in hoisting schedules or skip sizes.
Development waste is either hauled to surface by trucks via the twin access declines, or placed directly into stopes as backfill. All waste hauled to surface will be stored near the current portal. Waste required for subsequent backfilling will be delivered down a waste pass driven as close to the deposit as practicable, and then distributed to the stopes.
Two bays will be provided for the storage of bulk emulsion, each containing one 24,000 L storage tank and a storage area. A third bay will be designated for the storage of detonators on wooden shelves. A powder bay will be designated for the storage of all other explosive products (other than the bulk emulsion and the detonators) on wooden shelves. A concrete wall with a steel door will separate this bay from the rest of the mine workings. All explosives bays will be located on 1920 RL.
| MAG Silver Juanicipio NI 43-101 Technical Report | |
| MAG Silver Corp. | 717002 |
The main maintenance area will be located on surface. All major scheduled planned maintenance and rebuilds will take place in the surface workshop. Two small service bays will be located underground for low-level maintenance such as lubrication and small repairs. To reduce the quantity of fuel and oils stored underground, it is envisaged that the truck fleet and most utility vehicles will be fuelled on surface and maintained in a surface heavy equipment workshop. Only vehicles and equipment not travelling to surface as part of their daily routine will be fuelled underground.
Local area compressors will supply compressed air for the underground maintenance and service bay area, with compressed air lines from the air receiver routed to convenient locations in the area. All mobile drilling equipment, including jumbos, longhole drills, bolters, and cable bolters will be equipped with on-board compressors. ITH drills will have portable adjacent compressors to meet their elevated pressure requirements. Two units are required for this purpose.
Refuge station chambers with 30-person capacity will be used for emergencies; these chambers will be portable for flexibility of location at the most appropriate areas of the mine.
The ground water inflow into the mine has been estimated using information from nearby mines and is not based on a hydrogeological model. The hydrology data available at the time of this report is not sufficiently detailed to fully understand the likely magnitude of water inflow into the mine along faults or other geological features. AMC understands that other mines in the area are currently experiencing a steady mine inflow of the order of 190 L/s in similar geological structures and lithologies to those that will be encountered at Juanicipio. Relating the strike length of the Juanicipio mineralization to other mineralization strike lengths in the area has allowed a design criterion for long term steady state inflow of 95 L/s to be projected. The mine dewatering system will be sized to handle twice this amount as the peak outflow.
The overall dewatering strategy largely depends on accessing the lower levels of the mine well ahead of stope production. This early development approach provides a means for installing a series of dewatering sumps that will dewater sections of the mine prior to production mining. The risk of flooding will be partially mitigated by this early development strategy and by the provision of spare pumping capacity.
| 1.10 | Project development and production schedule |
Minera Juanicipio is currently developing an access decline to the mineralization, which is at approximately 1920 RL as of the time of this Report. It is estimated that it will take approximately two years to extract first mineralization and commence concentrate production. Key milestones relating to the project development are shown in Table 1.4.
| Table 1.4 | Project development milestones |
| Milestone | Start | Finish |
| Decline development | Year 1 | Year 8 |
| Conveyor decline | Year 1 | Year 2 |
| Internal winze, engineering, and construction | Year 3 | Year 9 |
| Processing plant | Year 1 | Year 3 |
| Full production (ramp up to 1.4 Mtpa) | Year 2 | Year 5 |
Year 1 is assumed to be 2018.
The estimated LOM production tonnage and grade that forms the basis for the economic assessment is set out in Table 1.5. Mill feed from vein development comprises approximately 25% of total mill feed, with the remainder from stoping operations.
| MAG Silver Juanicipio NI 43-101 Technical Report | |
| MAG Silver Corp. | 717002 |
| Table 1.5 | Material projected to be mined and processed as a basis for the economic assessment |
| | Grade | Contained metal |
| Tonnes | Ag (g/t) | Au (g/t) | Pb (%) | Zn (%) | Ag (Moz) | Au (koz) | Pb (Mlbs) | Zn (Mlbs) |
| 23,123,706 | 282 | 1.37 | 1.84 | 3.43 | 210 | 1,019 | 938 | 1,748 |
The tonnage and grades shown in Table 1.5 have resulted from the mine design and scheduling process conducted on the Mineral Resource estimate and block model prepared by AMC and described in this Report. A $55 Net Smelter Return (NSR) cut-off was applied to the resource model, stope shapes have been projected, and estimated dilution and mining losses have been accounted for. Metal prices used in the NSR calculation were $1,225 per ounce gold, $17.30 per ounce silver, $0.87 per pound lead, and $0.94 per pound zinc. An exchange rate of 18.46 Mexican pesos to one US dollar was assumed.
In developing the tonnage and grade estimates, stope blocks that were in contact with the property boundaries were excluded and zero grade has been assumed for the dilution material. Approximately 38% of the tonnage and 22% of the silver content of the material that forms the basis of the economic assessment is derived from Inferred Mineral Resources. Inferred Mineral Resources are considered too speculative geologically to have the economic considerations applied to them that would enable them to be categorized as Mineral Reserves.
| 1.11 | Project capital costs |
Project capital is estimated at $840M; pre-production capital (Year 1 to Q1 Year 3 inclusively) is estimated to be $360M. Sustaining capital ($480M) is defined as all capital following pre-production and includes ongoing mine development after concentrate production commences, and mobile and fixed equipment replacements and rebuilds over the mine life. A summary of projected capital costs is shown in Table 1.6.
| Table 1.6 | Summary of projected capital costs |
| | Capital ($) | Pre-production capital ($) |
| Item | Total LOM | Y01 | Y02 | Y03* |
| Underground development | 226,272,930 | 25,243,270 | 32,209,310 | 5,241,840 |
| Mine equipment | 161,878,000 | 0 | 7,284,510 | 4,249,300 |
| Winze | 64,044,740 | 0 | 0 | 0 |
| Material movement - trucking development waste | 46,949,770 | 1,778,840 | 2,082,660 | 1,414,330 |
| Road and powerline to portal | 5,914,000 | 5,914,000 | 0 | 0 |
| Process plant | 91,877,700 | 23,902,690 | 38,244,310 | 9,561,080 |
| Surface infrastructure | 68,138,330 | 13,865,330 | 13,865,330 | 13,865,330 |
| UG infrastructure | 65,830,930 | 19,276,980 | 19,276,980 | 19,276,980 |
| Capitalized operating costs | 22,770,790 | 5,149,800 | 14,096,800 | 3,524,200 |
| EPCM | 24,956,260 | 8,318,750 | 8,318,750 | 8,318,750 |
| Owners cost | 16,377,420 | 5,459,140 | 5,459,140 | 5,459,140 |
| Contingency | 45,157,810 | 15,052,600 | 15,052,600 | 9,572,230 |
| Total | 840,168,680 | 123,961,400 | 155,890,390 | 80,483,180 |
| Pre-production capital | 360,334,970 | | | |
| Sustaining capital | 479,833,710 | | | |
Totals do not necessarily equal the sum of the components due to rounding adjustments.
* Assumed to be Q1 2020
Total site operating costs have been estimated at $58.67/t milled. The unit costs are broken down as follows:
| · | Milling: $20.37/t milled |
| · | General and Administration: $3.34/t milled |
| MAG Silver Juanicipio NI 43-101 Technical Report | |
| MAG Silver Corp. | 717002 |
Key factors relating to the operating cost estimate include:
| · | Some unit mine operating costs from the 2012 PEA were updated for inflation. |
| · | Revised costs were estimated for trucking, conveying and hoisting activities. Costs relating to labour, equipment and power were also updated to reflect the current production schedule. |
| · | Power costs were estimated based on updated infrastructure needs and a unit cost of $0.0834/kWh. |
| · | A waste rock backfill operating cost of $0.87/t mineralized material for imported waste rock fill from surface was estimated from first principles. |
| · | Ore drift development cost per metre was based on a single-face average advance rate of 100 m/month. The labour component (~30%) of unit costs was scaled-up from the 2012 PEA to reflect this (2012 PEA assumed 120 m/month single-face advance). Unit ore development costs were also projected 10% higher for 100 m/month compared to the 2012 PEA. Unit development rates reflect current contractor pricing. |
| · | Variable processing unit costs ($/t milled) remained the same as for the 2012 PEA to reflect inflation, but also taking account of the savings due to economies of scale. Fixed processing costs ($/year) for items such as salaries, mill maintenance and other fixed costs, were escalated by the 6 / 10 power rule to account for the higher mill throughput rate, and suitable cost inflation was also applied. |
| · | Fixed general and administration (G&A) costs ($/year) for items including site administration, human resources, finance and purchasing, general maintenance, safety and environment, were escalated by the 6 / 10 power rule to account for the higher production rate, and suitable cost inflation was also applied. |
| · | Operating costs were estimated for the underground conveyor at $0.59/t and for the winze and crusher at $1.22/t. These costs include labour, energy, and maintenance. |
A summary of the annual operating costs over the life of mine is provided in Table 1.7.
| Table 1.7 | Summary of life of mine site operating costs |
| Year | Date | Operating cost $M |
| Year 1 | 2018 | n/a – capitalized as pre-operative capital |
| Year 2 | 2019 | n/a – capitalized as pre-operative capital |
| Year 3 | 2020 | 48 |
| Year 4 | 2021 | 79 |
| Year 5 | 2022 | 83 |
| Year 6 | 2023 | 85 |
| Year 7 | 2024 | 84 |
| Year 8 | 2025 | 87 |
| Year 9 | 2026 | 85 |
| Year 10 | 2027 | 85 |
| Year 11 | 2028 | 87 |
| Year 12 | 2029 | 89 |
| Year 13 | 2030 | 80 |
| Year 14 | 2031 | 78 |
| Year 15 | 2032 | 74 |
| Year 16 | 2033 | 74 |
| Year 17 | 2034 | 73 |
| Year 18 | 2035 | 57 |
| Year 19 | 2036 | 48 |
| Year 20 | 2037 | 34 |
| Year 21 | 2038 | 29 |
| Total | | 1,357 |
Note: Totals do not necessarily equal the sum of the components due to rounding adjustments.
| MAG Silver Juanicipio NI 43-101 Technical Report | |
| MAG Silver Corp. | 717002 |
| 1.13 | Offsite costs (Concentrate transport, treatment, and refining costs) |
No detailed market studies have been undertaken at this stage of the project. Lead and zinc concentrates are commonly sold as part of the world’s mining and metals industries. It is envisaged that silver-rich lead concentrate and zinc concentrate may be sold to smelters in the Asian region. Lead concentrate could potentially be sold to a smelter in Mexico or exported to offshore smelters. If sold to a local smelter, transport costs could be reduced.
For purposes of its analysis, AMC has assumed that both the lead and zinc concentrates will be treated in Asia, with lead and zinc treatment charges of $235/dry metric tonne of concentrate, silver refining charges equivalent to 4% of the silver price, gold refining charges of $5/oz and, subject to a transport cost of $115/wet metric tonne. Treatment and other terms for lead and zinc concentrates were suggested by Neil S. Seldon & Associates Ltd. (NSA, 2016). Both lead and zinc concentrates are projected to incur minor treatment penalties for impurities. The pyrite concentrate is expected to be of high value and it is assumed that it will be sold to a Mexican smelter, but other alternatives are expected to be available.
Total off-site costs have been estimated at $41.32/t milled.
Income and other taxes presented in the PEA are based on Mexican legislated tax rates and do not reflect any tax planning opportunities. The tax provisions include a conventional profit based tax using the 30% corporate tax rate currently in effect, a 7.5% special mining duty applied on earnings before amortization and taxes, and a 0.5% gross revenue royalty on all gold and silver revenues. Employee profit sharing (PTU) is not included in the financial estimates and the net present value (NPV) and internal rate of return (IRR) of the project may fluctuate depending on how the project is structured once it is in operation.
Project economics have been assessed using the following metal prices (Base Case Prices), which were selected after discussion with MAG Silver and referencing current market and recent historical prices, values used in other recent projects, and forecasts in the public domain:
| · | Silver price = $17.90/oz |
It is envisaged that a silver-rich zinc concentrate will be sold primarily to smelters in the Asian region. Lead concentrate could potentially be sold to a smelter in Mexico or exported to offshore smelters. It is envisaged that the gold-rich pyrite concentrate will be sold to a customer able to recover gold and silver using a conventional cyanide leach process.
All currency is in US dollars ($) unless otherwise stated. The cost estimate was prepared with a base date of Year 1 and does not include any escalation beyond this date. For net present value (NPV) estimation, all costs and revenues are discounted at 5% from the base date. An exchange rate of MXP18.46:US$1 and a corporate tax rate of 30% have been assumed.
AMC conducted a high level economic assessment of the conceptual underground operation of the Juanicipio deposit. The mine is projected to generate approximately $1,860M pre-tax NPV and $1,138 M post-tax NPV at 5% discount rate, pre-tax IRR of 64.5% and post-tax IRR of 44.5%. Project capital is estimated at $840 M with a payback period of 3.4 years (undiscounted pre-tax cash flow from Year 1).
Table 1.8 provides a summary of the key inputs and results of the economic analysis. The results of the 2017 PEA compare favorably with the previous 2012 PEA, which projected a post-tax NPV at 5% discount rate of $1,233M and post-tax IRR of 43%.
| MAG Silver Juanicipio NI 43-101 Technical Report | |
| MAG Silver Corp. | 717002 |
| Table 1.8 | Key inputs and results of economic analysis |
| Juanicipio deposit | Unit | Value(7) |
| Total mineralized rock | tonnes | 23,123,706 |
| Total waste production | tonnes | 6,758,008 |
| Production tonnage silver grade(1) | g/t | 282 |
| Production tonnage gold grade(1) | g/t | 1.37 |
| Production tonnage zinc grade(1) | % | 3.43 |
| Production tonnage lead grade(1) | % | 1.84 |
| Silver recovery(1) | % | 94.8 |
| Gold recovery(1) | % | 81.6 |
| Zinc recovery(1) | % | 89.8 |
| Lead recovery(1) | % | 92.8 |
| Silver price | $/oz | $17.90 |
| Gold price | $/oz | $1,250 |
| Zinc price | $/lb | $0.95 |
| Lead price | $/lb | $1.00 |
| Silver payable(2) | % | 87 |
| Gold payable(2) | % | 73 |
| Zinc payable(2) | % | 76 |
| Lead payable(2) | % | 86 |
| Payable silver metal | oz | 182,789,511 |
| Payable gold metal | oz | 747,417 |
| Payable zinc metal | lb | 1,326,904,724 |
| Payable lead metal | lb | 811,923,951 |
| Revenue split by commodity | Silver | 51.90% |
| Revenue split by commodity | Gold | 14.82% |
| Revenue split by commodity | Zinc | 21.05% |
| Revenue split by commodity | Lead | 12.23% |
| Gross revenue | $ (M) | $6,304 |
| Capital costs | $ (M) | 840 |
| Operating costs (total)(3) | $ (M) | 1,357 |
| Mine operating costs(4) | $/t | 34.95 |
| Processing costs | $/t | 20.37 |
| Operating costs (total)(3) | $/t | 58.67 |
| Operating cash cost (Ag) | $/oz Ag | (3.94) |
| Total all-in sustaining cost (Ag) | $/oz Ag | 5.02 |
| Payback period from plant start up(5) | Years | 1.8 |
| Cumulative net cash flow(6) | $ (M) | 3,152 |
| Pre-tax NPV @5% discount rate | $ (M) | 1,860 |
| Pre-tax IRR | % | 64.5 |
| Post-tax NPV @5% discount rate | $ (M) | 1,138 |
| Post-tax IRR | % | 44.5 |
1. LOM average.
2. Overall payable % includes recoveries, treatment, transport, refining costs and selling costs.
3. Includes mine operating costs, milling, and mine G&A.
4. Underground mining costs only.
5. Values are post-tax from projected plant start up.
6. Pre-tax and undiscounted.
7. The results are preliminary in nature and include Inferred Mineral Resources that are considered too speculative geologically to have economic considerations applied to them that would enable them to be categorized as Mineral Reserves, and there is no certainty that the PEA will be realized.
| MAG Silver Juanicipio NI 43-101 Technical Report | |
| MAG Silver Corp. | 717002 |
AMC has carried out a sensitivity analysis of the project economics. The sensitivity analysis examined the impact on the post-tax NPV (at 5% discount rate) of a 30% positive or negative change in metal prices, operating costs, capital costs, corporate tax rate, foreign exchange rate (MXN Peso:$) and the discount rate. The results (Figure 1.3) show that the post-tax NPV is very positive and remains so for the range of sensitivities evaluated.
| Figure 1.3 | Sensitivity analysis – post-tax NPV at 5% discount rate |

| 1.18.1 | Mineral Resource estimate |
AMC makes the following observations and conclusions:
| · | Indicated tonnes have increased by 27%, while Inferred tonnes have increased by 138%. |
| · | Both Indicated and Inferred grades have decreased for silver and increased for base metals. |
| · | Average gold grades have increased in the Indicated category and decreased in Inferred category. |
| · | The net result in the Indicated category has been an increase in contained silver of 6% and an increase in contained gold of 59%. The increases in contained lead and zinc are 43% and 34% respectively. |
| · | The net result in the Inferred category has been an increase in contained silver of 48% and an increase in contained gold of 76%. Contained lead and zinc show increases of 226% and 295% respectively. |
| · | Although not a significant part of the total Mineral Resource, copper is quoted for the first time as a result of high copper values being intercepted at depth in the new drilling. |
Reasons for the differences in grade, tonnes and contained metal include Mineral Resource addition down-dip and conversion to higher categories arising from the new drilling. The most significant change from the previous estimate is the increase in extent of the Deep Zone mineralization as a result of the new drilling. This is in keeping with the increase in tonnes seen in the 2017 AMC estimate. Also, the overall decrease in average precious metal grades and increase in average base metal grades reflects the new drilling targeting the deeper base metal rich zones.
| MAG Silver Juanicipio NI 43-101 Technical Report | |
| MAG Silver Corp. | 717002 |
| · | The mine will be accessed by twin declines and a conveyor decline. |
| · | Mechanized longhole stoping with waste backfill has been selected as the mining method. This offers good productivity while maintaining selectivity. |
| · | Trade-off studies have identified that conveying the mineralized rock directly to the relocated process plant from underground is economically and operationally superior to other arrangements. |
| · | Evaluation of the planned production rate and scheduling of the deposit indicates that the deposit supports 1.4 Mtpa. |
| · | All waste will be tipped directly into stopes or trucked to surface. There will be a deficit in the amount of waste required for backfilling, projected to be in Year 11. It is assumed that waste will be mined from a small pit and dropped down a waste pass for distribution to the stopes. |
| · | A 780 m long winze will be developed to handle the mineralized material at depth. The winze will commence hoisting in Year 8. |
| · | A 1.5 km paved access road is required from the main highway to the process plant. A 6.5 km access road, mostly over hilly terrain, will be required to access the main portal site from the plant. A two-lane sealed road suitable for use by heavy vehicles is proposed. |
| · | Power would be supplied to a main substation at the site via a 115 kV overhead power line from an existing power line located to the north of the property. The line would have a length of approximately 2 km to the main processing plant sub-station. |
| · | It is anticipated that mine service water will initially be provided via a pipeline from a neighbouring mine that has excess water from groundwater inflow. This water will be supplemented by any water from dewatering the underground workings at Juanicipio (see final point below). |
| · | It is envisaged that all mill tailings will be discharged to a tailings storage facility (TSF) with a total volume of approximately 18 Mm3. |
| · | No detailed environmental or geotechnical studies have been carried out on suitable sites for the TSF for the project. |
| · | Extensive groundwater is anticipated at Juanicipio. Currently there has not been a detailed hydrogeological study for the mine; this may be considered a risk. |
| · | A third metallurgical laboratory test program was undertaken during 2013, building on the two previous programs. Locked cycle flotation tests confirmed that the flotation circuit will be viable and good recoveries of silver (80.1%), lead (92.8%), and copper (38.4%) to the lead concentrate were achieved. Recoveries to zinc concentrate were 4.9% for gold, 6.8% for silver, 43.9% for copper, and 89.8% for zinc. Gold recoveries of 22.1% to pyrite concentrate were also achieved, along with 9.9% of the silver and 58.1% of the iron. Losses to final tails were reasonable, with metal grades observed in the final tails stream of 0.2 g/t gold, 24 g/t silver, 0.11% lead, 0.01% copper, and 0.11% zinc. Cyanidation of the pyrite concentrate demonstrated good gold and silver recoveries of 52% and 80% respectively. |
| · | The proposed flowsheet is designed to treat a nominal 4,000 tpd of feed and consists of a comminution circuit, with underground primary crushing, secondary crushing and milling on surface, followed by sequential flotation to produce a silver-rich lead concentrate; followed by production of a zinc concentrate and a gold-containing pyrite concentrate. The flowsheet is conventional for lead-zinc operations, with the pyrite flotation circuit providing a variation to the most commonly used circuits. Test work supports the selection and design of the flotation circuits. |
| · | The location of the processing plant has changed from previous studies to a large flat area suitable for construction and of sufficient size to accommodate the processing plant and tailings facility. |
| MAG Silver Juanicipio NI 43-101 Technical Report | |
| MAG Silver Corp. | 717002 |
The preliminary economic assessment clearly indicates that the Juanicipio Project has the potential to be developed into an economically positive, high-grade underground silver mine. Further drilling and investigation work aimed at upgrading Inferred Mineral Resources and increasing the geotechnical and hydrogeological understanding of the deposit is recommended to augment the next stage of project design and evaluation.
Mineral resources are not Mineral Reserves and do not have demonstrated economic viability. There is a degree of uncertainty attributable to the estimation of Mineral Resources. Until resources are actually mined and processed, the quantity of mineralization and grades must be considered as estimates only. Any material change in quantity of resources, mineralization, or grade may affect the economic viability of the project.
| 1.18.6 | Opportunities for further consideration currently excluded from project scope |
Potential opportunities for the project include:
| · | Significant exploration potential within a large land package and a number of high priority drill targets. |
| · | The Valdecañas vein system, including the new Anticipada Vein, is largely open at depth. |
| · | Deep zone is open to the east and west boundaries of the joint venture property. |
| · | Juanicipio vein open to the west and to depth for further exploration. |
| · | This 2017 PEA only considers the identified Mineral Resources within the Valdecañas vein system, the Juanicipio vein is not considered at this time. |
| · | Further analysis to determine the metal grade of the diluting material from the Hangingwall and Footwall over blast. |
| · | A characterization study of the planned dilution and dilution grade. |
| · | Lease versus purchase analysis of equipment, considering equipment availability and tax benefits of leasing. |
| · | Assess the ability to increase the recoverability and payability of Ag and Au with a gravity circuit. |
| · | Potential recoverability of copper to be considered and assessed. |
| | |
| · | An opportunity exists to commence negotiations with potential smelters to possibly capitalize on lower lead and zinc treatment charges, and possibilities to reduce transportcosts ofconcentrate. |
| 1.19 | Recommendations for further work |
AMC recommends the following additional work:
| · | In-fill drilling to convert Inferred Mineral Resources to Indicated Mineral Resources in the Valdecañas vein system. |
| · | Step-out drilling to expand the Deep Zone in the Valdecañas vein system and to delineate the western extent and depth of the Juanicipio vein. |
| · | Undertake surface exploration and drilling programs on targets outside of the existing Mineral Resource area, as only 5% to 10% of the overall property has been drill tested and numerous targets for drill-based exploration have been identified. |
| · | Continue with relevant mapping, sampling and geophysical surveys to assist in identification of new drill targets. |
| · | Undertake a hydrogeological study to reduce risks associated with ground water and better define the dewatering strategy. |
| · | Undertake a geotechnical data collection program to include an appropriate number of laboratory-conducted rock strength tests on all lithological units that are expected to be intersected by underground mining. |
| · | Geotechnically log the centreline of the planned winze and conduct a geophysical survey of the proposed shaft centreline using an optical and acoustic televiewer. |
| MAG Silver Juanicipio NI 43-101 Technical Report | |
| MAG Silver Corp. | 717002 |
| · | Create a more detailed cost estimate and life of mine production plan for the next phase of the project. Assess potential to optimize lateral and vertical development quantities. The depth of the winze may need to be re-evaluated if the Mineral Resource extends further at depth. |
| · | Optimization of the lead flotation circuit should be investigated to improve the lead grade of the concentrate without compromising recoveries. It has been shown that up to 37% of the gold and 28% of the silver in feed could be recovered to a gravity concentrate, which could improve project economics and potentially eliminate the requirement for a pyrite flotation circuit. More test work will be required to demonstrate the viability of including a gravity circuit in the final process design. An overall cost benefit study of the pyrite flotation circuit should be undertaken. |
| · | The potential impact of variability within the ore body has not been demonstrated and more variability work may be required to ensure that projected grades and recoveries can be reasonably assumed to be consistently achievable over the life of the operation. |
| · | Detailed mass and water balances should be generated to confirm metal deportment throughout the processing circuit, process water requirements and, as necessary, water discharge requirements. Similarly, energy requirements for processing operations should be further evaluated. |
| · | Discussions with potential customers are recommended to better define likely concentrate payment terms. The discussions should be directed towards establishing provisional concentrate off-take agreements. |
| · | Undertake further work to identify and establish firm contracts for water supply either with a neighbouring mine or from an alternative source. Further understanding of the likely quantity of ground water will be gained from a hydrogeological study; this together with catchment dams could be an alternative solution. |
It is recommended that further work be carried out as part of a structured program that includes completion of a more detailed project feasibility study (FS). The estimated cost of this program is $15.2M.
| MAG Silver Juanicipio NI 43-101 Technical Report | |
| MAG Silver Corp. | 717002 |
Contents
| 1 Summary | 1 |
| 1.1 Introduction | 1 |
| 1.2 Location | 1 |
| 1.3 Geology and mineralization | 1 |
| 1.4 Mineral Resources | 2 |
| 1.5 Geotechnical considerations | 2 |
| 1.5.1 Rock mass properties and hydrogeology | 3 |
| 1.5.2 Stable stope spans | 3 |
| 1.5.3 Stope dilution estimation | 3 |
| 1.6 Mining concept | 3 |
| 1.7 Mineral processing | 5 |
| 1.8 Project infrastructure | 6 |
| 1.9 Underground infrastructure | 6 |
| 1.10 Project development and production schedule | 7 |
| 1.11 Project capital costs | 8 |
| 1.12 Site operating costs | 8 |
| 1.13 Offsite costs (Concentrate transport, treatment, and refining costs) | 10 |
| 1.14 Taxes | 10 |
| 1.15 Project revenue | 10 |
| 1.16 Economic analysis | 10 |
| 1.17 Sensitivity | 12 |
| 1.18 Conclusions | 12 |
| 1.18.1 Mineral Resource estimate | 12 |
| 1.18.2 Mining | 13 |
| 1.18.3 Processing | 13 |
| 1.18.4 Economics | 14 |
| 1.18.5 Risks | 14 |
| 1.18.6 Opportunities for further consideration currently excluded from project scope | 14 |
| 1.19 Recommendations for further work | 14 |
| 2 Introduction | 25 |
| 2.1 Purpose | 25 |
| 2.2 Terms of reference | 25 |
| 2.3 Sources of information | 25 |
| 2.4 Qualified Persons | 25 |
| 2.5 Units of measure and currency | 26 |
| 3 Reliance on other experts | 27 |
| 4 Property description and location | 28 |
| 4.1 Land tenure | 28 |
| 5 Accessibility, climate, local resources, infrastructure, and physiography | 31 |
| 5.1 Accessibility | 31 |
| 5.2 Climate | 31 |
| 5.3 Local resources | 31 |
| 5.4 Infrastructure | 31 |
| 5.5 Physiography | 31 |
| 6 History | 32 |
| 6.1 Prior ownership | 32 |
| 6.2 Exploration history | 32 |
| 6.3 Previous Mineral Resource estimates | 32 |
| 6.4 Scoping study – 2009 | 33 |
| 6.5 PEA study – 2012 | 33 |
| 6.6 RPA Technical Report June 2014 | 34 |
| | |
|
| MAG Silver Juanicipio NI 43-101 Technical Report | |
| MAG Silver Corp. | 717002 |
| | |
| 7 Geological setting and mineralization | 35 |
| 7.1 Regional geology | 35 |
| 7.2 Property geology | 39 |
| 7.2.1 Mesozoic rocks | 39 |
| 7.2.2 Tertiary igneous rocks | 39 |
| 7.2.3 Upper Tertiary rocks | 39 |
| 7.2.4 Structural geology | 40 |
| 7.3 Mineralization | 42 |
| 7.3.1 Valdecañas vein system | 42 |
| 7.3.2 Juanicipio vein | 43 |
| 7.3.3 Other known mineralization | 43 |
| 8 Deposit types | 44 |
| 9 Exploration | 45 |
| 10 Drilling | 46 |
| 10.1 Introduction | 46 |
| 10.2 Drilling progress | 46 |
| 10.3 Procedures | 46 |
| 10.3.1 Sampling by MAG Silver (2004) | 46 |
| 10.3.2 Sampling by Fresnillo (2005-2016) | 46 |
| 10.4 Drilling results | 47 |
| 11 Sample preparation, analyses, and security | 53 |
| 11.1 Sample preparation and analysis | 53 |
| 11.1.1 MAG Silver samples (2005) | 53 |
| 11.1.2 Fresnillo samples (2005-2016) | 53 |
| 11.2 Quality assurance and quality control | 53 |
| 11.2.1 Assay results of standards | 53 |
| 11.2.2 Assay results of blank samples | 56 |
| 11.2.3 Assay results of duplicates | 57 |
| 11.2.4 Assay results of umpire data | 57 |
| 11.3 Core storage and security | 59 |
| 12 Data verification | 60 |
| 12.1 Previous work | 60 |
| 12.1.1 Wardrop 2009 | 60 |
| 12.1.2 Strathcona 2011 | 60 |
| 12.1.3 AMC 2012 | 60 |
| 12.1.4 RPA 2014 | 60 |
| 12.2 AMC verification | 61 |
| 13 Mineral processing and metallurgical testing | 62 |
| 13.1 Metallurgical testing | 62 |
| 13.2 Sample preparation | 62 |
| 13.3 Head assays | 63 |
| 13.4 Mineralogical characterization | 63 |
| 13.4.1 Mineral composition and species distribution | 63 |
| 13.4.2 Mineral liberation | 65 |
| 13.5 Flotation tests | 65 |
| 13.5.1 Open circuit flotation test work | 65 |
| 13.5.2 Locked cycle flotation test work | 68 |
| 13.6 Cyanidation of pyrite concentrate | 70 |
| 13.7 Gravity recoverable gold and silver | 70 |
| 13.8 Ball mill work indexes | 71 |
| 13.9 Metal recoveries and concentrate grade | 71 |
| | |
|
| MAG Silver Juanicipio NI 43-101 Technical Report | |
| MAG Silver Corp. | 717002 |
| | |
| 14 Mineral Resource estimates | 72 |
| 14.1 Data used | 73 |
| 14.1.1 Drillhole database | 73 |
| 14.1.2 Bulk density | 74 |
| 14.2 Domain modelling | 75 |
| 14.2.1 Lithological domains | 75 |
| 14.2.2 Mineralization domains | 75 |
| 14.3 Statistics and compositing | 76 |
| 14.4 Block model | 80 |
| 14.4.1 Block model parameters | 80 |
| 14.4.2 Variography and grade estimation | 80 |
| 14.4.3 Resource classification | 80 |
| 14.4.4 Block model validation | 80 |
| 14.4.5 Mineral Resource estimation | 82 |
| 14.5 Comparison with previous Mineral Resource estimate | 84 |
| 15 Mineral Reserve estimates | 86 |
| 16 Mining method | 87 |
| 16.1 Geotechnical considerations | 87 |
| 16.1.1 Rock mass properties | 87 |
| 16.1.2 Stable stope spans – geotechnical analysis | 94 |
| 16.1.2.1 Stability number (N’) | 94 |
| 16.1.3 Stope dilution estimation | 97 |
| 16.1.3.1 Stope design parameters | 98 |
| 16.1.3.2 Stope back design parameters | 100 |
| 16.1.4 Tunnel support design | 100 |
| 16.1.4.1 General ground support | 101 |
| 16.1.5 Vertical development support design | 101 |
| 16.2 Mineral Resource and PEA | 102 |
| 16.3 Stope optimization | 102 |
| 16.4 Net Smelter Return (NSR) | 103 |
| 16.5 Production rate | 104 |
| 16.6 Mineralized rock and waste handling | 104 |
| 16.7 Access development | 104 |
| 16.8 Mine design | 106 |
| 16.9 Tonnage and grade of projected material to be mined and milled | 108 |
| 16.10 Mining factors | 108 |
| 16.11 Backfilling method | 109 |
| 16.12 Ventilation | 110 |
| 16.12.1 Design criteria | 111 |
| 16.12.2 Airflow determination | 112 |
| 16.12.2.1 Airflow for underground infrastructure | 112 |
| 16.12.2.2 Airflow determination based on diesel fleet size | 112 |
| 16.12.2.4 Total airflow requirement | 113 |
| 16.12.3 Ventilation modelling | 114 |
| 16.12.4 Ventilation control and distribution | 114 |
| 16.12.5 Ventilation circuit operability | 114 |
| 16.12.6 Primary fan duties | 115 |
| 16.12.7 Auxiliary ventilation | 115 |
| 16.12.8 Ventilating the conveyor decline | 116 |
| 16.12.8.1 Conveyor decline airflow requirement | 117 |
| 16.12.8.2 Conveyor risk of fire | 117 |
| 16.13 Stope drill and blast design | 118 |
| 16.13.1 Drill selection for stoping | 118 |
| 16.13.2 Stope layout and design | 118 |
| 16.16 Project development and production schedule | 120 |
| 16.17 Production and development schedule | 120 |
| | |
|
| MAG Silver Juanicipio NI 43-101 Technical Report | |
| MAG Silver Corp. | 717002 |
| | |
| 16.18 Mobile equipment | 123 |
| 17 Recovery methods | 128 |
| 17.1 Ore transport | 128 |
| 17.2 Ore stockpile | 128 |
| 17.3 Grinding and classification | 128 |
| 17.4 Lead flotation circuit | 128 |
| 17.5 Zinc flotation circuit | 129 |
| 17.6 Pyrite flotation circuit | 129 |
| 17.7 Thickening of lead concentrate | 129 |
| 17.8 Surge tank for lead concentrate | 130 |
| 17.9 Lead concentrate filtration | 130 |
| 17.10 Thickening of zinc concentrate | 130 |
| 17.11 Surge tank for zinc concentrate | 130 |
| 17.12 Filtration of zinc concentrate | 130 |
| 17.13 Thickening of pyrite concentrate | 130 |
| 17.14 Surge tank for pyrite concentrate | 130 |
| 17.15 Thickening of final tails | 130 |
| 17.16 Shipment of lead and zinc concentrate | 131 |
| 17.17 Tailings storage facility | 131 |
| 17.18 Mineral processing schedule and recovery | 133 |
| 18 Project infrastructure | 134 |
| 18.1 Site layout | 134 |
| 18.2 Access road | 134 |
| 18.3 Power supply | 136 |
| 18.4 Communications systems | 139 |
| 18.4.1 Personnel and equipment tracking | 139 |
| 18.4.2 Fixed plant monitoring and control | 140 |
| 18.5 Water supply | 140 |
| 18.6 Stockpiles | 140 |
| 18.7 Tailings storage | 141 |
| 18.8 Other surface facilities | 141 |
| 18.8.1 Offices and change house | 141 |
| 18.8.2 Workshops and fuel storage | 142 |
| 18.9 Underground infrastructure | 142 |
| 18.9.1 Haulage and mineralized material and waste handling system | 142 |
| 18.9.2 Winze mineralized material handling | 144 |
| 18.9.3 Crusher and conveyor belt mineralized material handling | 148 |
| 18.10 Underground conveyor system | 151 |
| 18.11 Magazines | 153 |
| 18.12 Underground workshops and warehouse | 156 |
| 18.13 Fuel storage | 156 |
| 18.14 Compressed air requirements | 157 |
| 18.15 Refuge stations, emergency egress, and other emergency provisions | 157 |
| 18.15.2 Emergency egress | 158 |
| 18.15.3 Stench system | 158 |
| 18.15.4 Fire doors | 158 |
| 18.16.4 Zones 1, 2, and 3 dewatering system | 160 |
| 19 Market studies and contracts | 165 |
| 19.1 Metal prices | 165 |
| 19.2 Marketing | 165 |
| 20 Environmental studies, permitting, and social or community impact | 167 |
| 21 Capital and operating costs | 168 |
| 21.1 Capital costs | 168 |
| | |
|
| MAG Silver Juanicipio NI 43-101 Technical Report | |
| MAG Silver Corp. | 717002 |
| | |
| 21.1.1 Total capital cost estimate for the mine | 168 |
| 21.1.2 Underground mine capital cost estimate | 170 |
| 21.1.2.1 Underground development capital costs | 170 |
| 21.1.2.2 Underground mobile equipment capital costs | 171 |
| 21.1.2.3 Winze capital costs | 171 |
| 21.1.2.4 Underground infrastructure capital costs | 171 |
| 21.1.3 Process plant capital costs | 172 |
| 21.1.4 Surface infrastructure capital costs | 172 |
| 21.1.4.1 Access road and powerline capital costs | 173 |
| 21.1.5 Indirect capital costs | 173 |
| 21.1.6 Capital contingency | 173 |
| 21.2 Operating costs | 174 |
| 21.2.1 Mine site operating costs | 174 |
| 21.2.2 Underground mine operating costs | 175 |
| 21.2.3 Process plant operating costs | 176 |
| 21.2.4 General and administration operating cost | 176 |
| 21.2.5 Estimated annual power costs | 177 |
| 22 Economic analysis | 178 |
| 22.1 Assumptions | 178 |
| 22.2 Economic analysis | 178 |
| 22.3 LOM payable metal | 181 |
| 22.4 Taxes | 181 |
| 22.5 Overall cash operating cost (on-site and off-site costs) | 181 |
| 22.6 Economic sensitivity analysis | 185 |
| 23 Adjacent properties | 187 |
| 24 Other relevant data and information | 189 |
| 25 Interpretation and conclusions | 190 |
| 25.1 Mineral Resource estimate | 190 |
| 25.2 Mining | 190 |
| 25.3 Processing | 191 |
| 25.4 Economics | 191 |
| 25.4.1 Risks | 191 |
| 25.4.2 Opportunities for further consideration currently excluded from project scope | 191 |
| 26 Recommendations | 192 |
| 27 References | 193 |
| 28 QP Certificates | 195 |
Tables
| Table 1.1 Summary of Global Mineral Resources as of 21 October 2017 | 2 |
| Table 1.2 Mineral Resource by Bonanza and Deep Zones as of 21 October 2017 | 2 |
| Table 1.3 Mill recoveries | 6 |
| Table 1.4 Project development milestones | 7 |
| Table 1.5 Material projected to be mined and processed as a basis for the economic assessment | 8 |
| Table 1.6 Summary of projected capital costs | 8 |
| Table 1.7 Summary of life of mine site operating costs | 9 |
| Table 1.8 Key inputs and results of economic analysis | 11 |
| Table 2.1 Persons who prepared or contributed to this technical report | 26 |
| Table 4.1 Tenure data | 28 |
| Table 7.1 Stratigraphy of the Fresnillo district | 38 |
| | |
|
| MAG Silver Juanicipio NI 43-101 Technical Report | |
| MAG Silver Corp. | 717002 |
| | |
| Table 10.1 Bulk density results by vein | 47 |
| Table 10.2 Vein intercept results for holes shown in Figure 10.3 | 51 |
| Table 11.1 Internal standards and Certified Reference Material | 54 |
| Table 11.2 Assay results of Certified Reference Material (November 2014 – December 2016) | 54 |
| Table 11.3 Assay results of blank material | 56 |
| Table 11.4 Results of blank materials above two standard deviations | 56 |
| Table 13.1 Metallurgical samples - head assay | 63 |
| Table 13.2 Head sample - minerals composition | 64 |
| Table 13.3 Elemental metal distribution by mineralogical species | 64 |
| Table 13.4 Tests 1 to 5 - calculated head grades | 66 |
| Table 13.5 Tests 1 to 5 - Pb concentrate grades and recoveries | 66 |
| Table 13.6 Tests 1 to 5 - Zn concentrate grades and recoveries | 66 |
| Table 13.7 Tests 1 to 5 - tails grades and recoveries | 66 |
| Table 13.8 Tests 6 and 13 - calculated head grades | 67 |
| Table 13.9 Tests 6 and 13 - Pb concentrate grades and recoveries | 67 |
| Table 13.10 Tests 6 and 13 - Zn concentrate grades and recoveries | 67 |
| Table 13.11 Tests 6 and 13 - Pyrite concentrate grades and recoveries | 67 |
| Table 13.12 Tests 6 and 13 - Tails grades and recoveries | 67 |
| Table 13.13 Flotation circuit metallurgical balance | 69 |
| Table 13.14 Gravity recoverable gold and silver test results | 70 |
| Table 13.15 Metal recovery and concentrate grade | 71 |
| Table 14.1 Summary of Global Mineral Resources as of 21 October 2017 | 72 |
| Table 14.2 Mineral Resources as of 21 October 2017 by vein | 73 |
| Table 14.3 Mineral Resource by metal zone 1 September 2017 | 73 |
| Table 14.4 Drillhole data used in the estimate | 74 |
| Table 14.5 Comparative statistics of bulk density measurements and estimates | 75 |
| Table 14.6 Grade capping summary | 77 |
| Table 14.7 Statistics of raw, composited, and capped assay data | 78 |
| Table 14.8 Block model parameters | 80 |
| Table 14.9 Minimum and maximum sample parameters | 80 |
| Table 14.10 Statistical comparison of capped assay data and block model | 81 |
| Table 14.11 Input parameters in calculating resource NSR | 83 |
| Table 14.12 Juanicipio underground Mineral Resource estimates at a range of cut-off values | 83 |
| Table 14.13 Comparison of 2013 and 2017 Mineral Resource estimates | 84 |
| Table 16.1 Lithology code definitions | 89 |
| Table 16.2 Summary of laboratory-conducted rock strength tests | 90 |
| Table 16.3 Assessment of stability number (N’) for the hangingwall (dip-55°) and vein back | 94 |
| Table 16.4 Assessment of unsupported stope height for the hangingwall | 96 |
| Table 16.5 Assessment of unsupported stope width for the back | 96 |
| Table 16.6 Assessment of supported stope heights for the hangingwall | 96 |
| Table 16.7 Assessment of supported stope width for the back | 96 |
| Table 16.8 Stope design parameters for vein inclinations of 55° and 65° (unsupported) | 98 |
| Table 16.9 Stope design parameters for vein inclinations of 45° to 55° (with cable bolt support) | 99 |
| Table 16.10 Tendon support requirements for Juanicipio Mine | 101 |
| Table 16.11 MSO parameters used to estimate economically viable mineralization | 103 |
| | |
|
| MAG Silver Juanicipio NI 43-101 Technical Report | |
| MAG Silver Corp. | 717002 |
| | |
| Table 16.12 NSR calculation assumptions | 103 |
| Table 16.13 Development quantities (m) for access design | 105 |
| Table 16.14 Tonnage and grade of projected material to be mined and milled | 108 |
| Table 16.15 Key assumptions for surface waste mining | 109 |
| Table 16.16 Ventilation velocity criteria | 112 |
| Table 16.17 Infrastructure airflow allowance | 112 |
| Table 16.18 Airflow requirements | 113 |
| Table 16.19 Total airflow allowance | 113 |
| Table 16.20 Airway dimensions and friction factors | 114 |
| Table 16.21 Design powder factors for LHOS and development | 120 |
| Table 16.22 Project development milestones | 120 |
| Table 16.23 PEA LOM production schedule | 122 |
| Table 16.24 Equipment list | 123 |
| Table 16.25 Mine personnel requirements | 125 |
| Table 17.1 Metal recoveries adopted for the PEA | 133 |
| Table 17.2 Annual processing throughput | 133 |
| Table 18.1 Estimated site power demand | 136 |
| Table 18.2 Estimate of site water usage | 140 |
| Table 19.1 Lead concentrate treatment terms | 165 |
| Table 19.2 Zinc concentrate treatment terms | 165 |
| Table 19.3 Pyrite concentrate treatment terms | 166 |
| Table 19.4 Concentrate transport costs | 166 |
| Table 21.1 Total capital cost estimate | 169 |
| Table 21.2 Annual capital expenditure | 169 |
| Table 21.3 Underground capital costs | 170 |
| Table 21.4 Capital mine development unit rates | 171 |
| Table 21.5 Underground mobile equipment capital costs | 171 |
| Table 21.6 Winze capital costs | 171 |
| Table 21.7 Underground infrastructure capital costs | 172 |
| Table 21.8 Process plant capital costs | 172 |
| Table 21.9 Surface infrastructure capital costs | 172 |
| Table 21.10 Indirect capital costs | 173 |
| Table 21.11 Owner’s and EPCM capital cost details | 173 |
| Table 21.12 Capital contingency | 174 |
| Table 21.13 Summary of life of mine site operating costs | 174 |
| Table 21.14 Summary of life of mine site operating costs | 175 |
| Table 21.15 Unit site operating costs | 175 |
| Table 21.16 Life of mine underground mine operating costs | 176 |
| Table 21.17 Life of mine process plant operating costs (variable and fixed) | 176 |
| Table 21.18 Annual and life of mine general and administration operating costs | 177 |
| Table 21.19 Estimated life of mine and annual power costs at steady state production | 177 |
| Table 22.1 Key economic assumptions and results | 178 |
| Table 22.2 Metal price sensitivity analysis | 180 |
| Table 22.3 Impact of varying silver and zinc pricing on after-tax NPV and IRR(1) | 180 |
| | |
|
| MAG Silver Juanicipio NI 43-101 Technical Report | |
| MAG Silver Corp. | 717002 |
| | |
| Table 22.4 Estimated LOM payable production by metal including silver equivalent ounces (AgEq. oz.) | 181 |
| Table 22.5 Cash costs, total cash costs and AISC per oz of silver (base case) | 181 |
| Table 22.6 LOM undiscounted cash flow, revenue and cost summary | 182 |
| Table 22.7 Juanicipio PEA LOM production and cash flow forecast | 183 |
| Table 22.8 Economic sensitivity analysis (post-tax) | 185 |
| Table 26.1 Cost breakdown of recommended further work for the FS | 192 |
Figures
| Figure 1.1 Composite plan view of mine design | 4 |
| Figure 1.2 Overall mine layout | 5 |
| Figure 1.3 Sensitivity analysis – post-tax NPV at 5% discount rate | 12 |
| Figure 4.1 Location map | 29 |
| Figure 4.2 Claim map and surface rights on the Property | 30 |
| Figure 7.1 Regional geology | 36 |
| Figure 7.2 Regional stratigraphy | 37 |
| Figure 7.3 Property geology | 41 |
| Figure 10.1 Drillhole plan map | 48 |
| Figure 10.2 Eastern cross section through the Valdecañas vein system | 49 |
| Figure 10.3 Western cross section through the Valdecañas vein system | 50 |
| Figure 10.4 Cross section through the Juanicipio vein system | 52 |
| Figure 11.1 Control chart for CRM CDN-ME-1305 (silver) | 55 |
| Figure 11.2 Control chart for CRM CDN-ME-1303 (silver) | 55 |
| Figure 11.3 Control chart for blank material (silver) | 57 |
| Figure 11.4 Control chart for IPL versus ALS duplicates (silver) | 58 |
| Figure 11.5 Control chart for SGS versus ALS duplicates (silver) | 59 |
| Figure 13.1 Lead flotation locked cycle test work flowsheet | 69 |
| Figure 14.1 3-dimensional view of mineralization domains looking northeast | 76 |
| Figure 14.2 Silver grade longitudinal projection vein V1E | 81 |
| Figure 14.3 Copper grade longitudinal projection vein V1E | 85 |
| Figure 16.1 Longhole stoping with rock fill general layout | 87 |
| Figure 16.2 Location of drillholes geotechnically logged for the Juanicipio project area | 88 |
| Figure 16.3 Average RMR89 values determined from geotechnical logging of the borehole cores | 89 |
| Figure 16.4 Average intact rock strength (± standard deviation) | 90 |
| Figure 16.5 Data reduction results of Young’s Modulus (obtained from the UCS tests) | 91 |
| Figure 16.6 Rock mass strength parameter determination results | 92 |
| Figure 16.7 Determination of mi from the LUAR triaxial test results | 93 |
| Figure 16.8 Stability graph results for the stope HW (vein dip-55°) and stope back | 95 |
| Figure 16.9 Recommended spacing and minimum length for cable bolts | 97 |
| Figure 16.10 Stope dilution estimated for the HW (dip 55°) | 98 |
| Figure 16.11 Stability graph results for vein inclinations of 55° to 65° | 99 |
| Figure 16.12 Stability graph results for vein inclinations of 45° to 55° | 100 |
| Figure 16.13 Access development composite plan layout (over three production levels) | 105 |
| Figure 16.14 Composite plan view of the underground mine design | 106 |
| Figure 16.15 Long-section view of the underground mine design | 107 |
| | |
|
| MAG Silver Juanicipio NI 43-101 Technical Report | |
| MAG Silver Corp. | 717002 |
| | |
| Figure 16.16 Long-section view of the access development and underground infrastructure | 108 |
| Figure 16.17 Waste rock fill production and demand | 110 |
| Figure 16.18 Ventilation system overview* | 111 |
| Figure 16.19 Steady state ventilation configuration | 115 |
| Figure 16.20 Cross section of decline development | 116 |
| Figure 16.21 Conveyor decline development ventilation strategy | 117 |
| Figure 16.22 LHOS plan view | 119 |
| Figure 16.23 LHOS cross section view of production rings | 119 |
| Figure 16.24 Projected production profile | 123 |
| Figure 16.25 Major equipment required over LOM | 124 |
| Figure 16.26 Personnel profile over LOM | 127 |
| Figure 17.1 Process flow sheet | 132 |
| Figure 18.1 Site layout concept | 135 |
| Figure 18.2 Single line diagram – electrical distribution | 137 |
| Figure 18.3 Underground communications system schematic | 139 |
| Figure 18.4 Concept design of tailings storage facility | 141 |
| Figure 18.5 Flow sheet showing the mineralized material and waste handling system | 143 |
| Figure 18.6 Loading pocket general arrangement | 145 |
| Figure 18.7 Shaft section schematic | 146 |
| Figure 18.8 Winze performance | 147 |
| Figure 18.9 Winze headframe and transfer conveyor arrangement | 148 |
| Figure 18.10 Schematic of upper dump | 149 |
| Figure 18.11 Feeder schematic | 150 |
| Figure 18.12 Jaw crusher | 151 |
| Figure 18.13 Underground conveyor arrangement | 152 |
| Figure 18.14 Cross section of the conveyor decline | 153 |
| Figure 18.15 Bulk emulsion storage - plan and sections | 155 |
| Figure 18.16 Underground workshop and related services | 156 |
| Figure 18.17 Overall mine dewatering schematic | 160 |
| Figure 18.18 Dirty water sump arrangement | 161 |
| Figure 18.19 Intermediate sump arrangement | 162 |
| Figure 18.20 Stacked impeller mine dewatering pump | 164 |
| Figure 22.1 Sensitivity analysis – post-tax NPV at 5% discount rate | 186 |
| Figure 23.1 Adjacent properties | 188 |
Distribution list
1 e-copy to George Paspalas, MAG Silver
1 e-copy to AMC Vancouver office
| MAG Silver Juanicipio NI 43-101 Technical Report | |
| MAG Silver Corp. | 717002 |
This Technical Report (Report) provides an update of the Mineral Resource estimate and Preliminary Economic Assessment (2017 PEA) of the Mineral Resources identified within the Minera Juanicipio Property (Property) in Zacatecas State, Mexico. The Report has been prepared by AMC Mining Consultants (Canada) Ltd. (AMC) of Vancouver, Canada on behalf of MAG Silver Corp (MAG Silver).
MAG Silver owns 44% of Minera Juanicipio S.A. de C.V. (Minera Juanicipio), a Mexican incorporated joint venture company, which owns (100%) and operates the Property. Fresnillo plc (Fresnillo) holds the remaining 56% interest in the joint venture and is the project operator. The Report has been prepared in accordance with the requirements of National Instrument 43-101 (NI 43-101) “Standards of Disclosure for Mineral Projects” of the Canadian Securities Administrators (CSA) for lodgement on CSA’s “System for Electronic Document Analysis and Retrieval” (SEDAR).
In December 2016, MAG Silver commissioned AMC to prepare an independent estimate of the Mineral Resources of the Property, to be compiled using exploration data available up to December 2016. This Mineral Resource estimate is the basis for the 2017 PEA. The Mineral Resource estimate was prepared by Ms A. Ross, Ph.D., P.Geo. (BC and AB).
The 2017 PEA considers the identified Mineral Resources within the Valdecañas vein system only, the Juanicipio vein is not considered at this time. The 2017 PEA has been carried out on the assumption that this vein system will be exploited as a stand-alone project. All mining and processing facilities are to be contained within the property boundary. Access roads and other surface infrastructure are to be restricted to areas over which Minera Juanicipio can reasonably be expected to secure surface tenure or access rights.
AMC’s scope of work included determination of appropriate methods for mining and processing the resource. Plans, schedules, and cost estimates for the mine and infrastructure development concepts were prepared for input to an economic model with which to carry out the economic assessment.
Projected risks and opportunities associated with the project were compiled together with a list of recommendations for further project development activities, including resource drilling, geotechnical and hydrogeological investigations, and metallurgical test work.
| 2.3 | Sources of information |
Key sources of information include the diamond drill hole database, metallurgical test work reports, and marketing information gained with the assistance of MAG Silver. A full reference list is included at the end of the Report. The most recent report often referred to is: Technical Report on the Mineral Resource Update for the Juanicipio Joint Venture, Zacatecas State, Mexico (Roscoe Postle Associates Inc. (RPA) 2014 Technical Report).
A listing of the authors of the Report, together with the sections for which they are responsible, is shown in Table 2.1.
| MAG Silver Juanicipio NI 43-101 Technical Report | |
| MAG Silver Corp. | 717002 |
| Table 2.1 | Persons who prepared or contributed to this technical report |
| Qualified Person | Position | Employer | Independent of MAG Sliver | Date of site visit | Professional designation | Sections of report |
| Qualified Persons responsible for the preparation and signing of this Technical Report** |
| Mr G. Methven | Principal Mining Engineer | AMC Mining Consultants (Canada) Ltd. | Yes | 14-19 March 2016 | P.Eng. (BC) | 1 (part), 3 (part) 2, 15, 16, 20, 24, 25 (part), 26 (part) |
| Mr H. Muller* | Principal Consultant | AMC Consultants Pty Ltd | Yes | No | FAusIMM, CP | 1 (part), 13, 17, 19, 25 (part), 26 (part), 27 (part) |
| Mr C. Kottmeier | Principal Mining Engineer | AMC Mining Consultants (Canada) Ltd. | Yes | No | P.Eng. (BC) | 1 (part), 3 (part), 18, 21, 22, 25 (part), 26 (part) |
| Dr A. Ross | Geology Manager and Principal Geologist | AMC Mining Consultants (Canada) Ltd. | Yes | No | PhD, P.Geo. (BC) P.Geol. (AB) | 1 (part), 3 (part), 4-12, 14, 23, 25 (part), 26 (part), 27 (part) |
*As of the effective date of this Report, Mr Muller is no longer employed by AMC Consultants Pty Ltd.
** QP responsibility for ‘part’ sections is governed by their respective areas of expertise: Mr G Methven – Mining aspects; Mr H Muller – Metallurgical aspects; Mr C Kottmeier – Underground and surface infrastructure aspects; Dr A Ross – Geology and Mineral Resource aspects.
MAG Silver has been provided with a draft of this Report to review for factual content.
This Report is effective as of 21 October 2017.
| 2.5 | Units of measure and currency |
Throughout this Report, measurements are in metric units and currency is in United States Dollars ($) unless otherwise stated.
| MAG Silver Juanicipio NI 43-101 Technical Report | |
| MAG Silver Corp. | 717002 |
| 3 | Reliance on other experts |
This report has been prepared by AMC for MAG Silver. The information, conclusions, opinions, and estimates contained herein, for which the named Qualified Persons take responsibility, are based on:
| · | Information available to AMC, including from the AMC database, at the time of preparation of this report. |
| · | Assumptions, conditions, and qualifications as set forth in this report. |
| · | Data, reports, and other information supplied by MAG Silver and from other sources. |
The Qualified Persons have relied, in respect of legal aspects, upon the work of the Expert listed below. To the extent permitted under NI 43-101, the Qualified Persons disclaim responsibility for the relevant section of the Report:
| · | Expert: Creel Abogados, S.C., Special Mexican counsel to Minera Los Lagartos S.A. de C.V., as advised in a letter of 1 November 2017 to AMC. |
| · | Report, opinion or statement relied upon: information on mineral tenure and status, title issues and mining concessions. |
| · | Extent of reliance: full reliance following a review by the Qualified Persons. |
| · | Portion of Technical Report to which disclaimer applies: Section 4. |
The Qualified Persons have relied, in respect of environmental aspects, upon the work of the issuer’s Expert listed below. To the extent permitted under NI 43-101, the Qualified Persons disclaim responsibility for the relevant section of the Report:
| · | The following disclosure is made in respect of information provided by the operator, Minera Juanicipio. |
| · | Report, opinion or statement relied upon: information on environmental studies and permitting. |
| · | Extent of reliance: full reliance following a review by the Qualified Persons. |
| | |
| · | Portion of Technical Report to which disclaimer applies: Section 20. |
The Qualified Persons have relied, in respect of taxation and royalty aspects, upon the work of the issuer’s Expert listed below. To the extent permitted under NI 43-101, the Qualified Persons disclaim responsibility for the relevant section of the Report:
| · | The following disclosure is made in respect of information provided by Larry Taddei, CFO, MAG Silver Corp. |
| · | Report, opinion or statement relied upon: information on taxation and royalty aspects. |
| · | Extent of reliance: full reliance following a review by the Qualified Persons. |
| | |
| · | Portion of Technical Report to which disclaimer applies: Section 20. |
The Qualified Persons have relied, in respect of environmental aspects, upon the information provided by the operator. To the extent permitted under NI 43-101, the Qualified Persons disclaim responsibility for the relevant section of the Report:
| · | The following disclosure is made in respect of information provided by MAG Silver Corp on behalf of the operator. |
| · | Report, opinion or statement relied upon: information on environmental requirements for permitting and current status. |
| · | Extent of reliance: full reliance following a review by the Qualified Persons. |
| | |
| · | Portion of Technical Report to which disclaimer applies: Section 20. |
Except for the purposes legislated under applicable securities laws in Canada, any use of this report by any third party is at that party’s sole risk.
| MAG Silver Juanicipio NI 43-101 Technical Report | |
| MAG Silver Corp. | 717002 |
| 4 | Property description and location |
The Property is located in central Zacatecas State, approximately 70 km by road northwest of the state capital of Zacatecas City (Figure 4.1). Zacatecas City has a population of approximately 140,000 and is located about 550 km northwest of Mexico City. Zacatecas City is serviced by daily direct flights from Mexico City, Dallas, Los Angeles, and Chicago. The property is accessible by Federal Highway 49 northwest from Zacatecas City to Fresnillo, then 6 km to the southwest along paved and dirt roads. The centre of the property is located at approximately 102° 58’ east longitude and 23° 05’ north latitude.
The Property consists of a single mining concession measuring 7,679.21 ha (Figure 4.2). Table 4.1 lists the tenure information for the Juanicipio concession. All concessions in Mexico are classified as exploitation concessions and have a 50 year life from the date of issue, renewable for another 50 years if desired.
| Concession | Date issued | Expiry date | Area (ha) | Title No. | Owner |
| Juanicipio 1 | 13 Dec 2005 | 12 Dec 2055 | 7,679.2106 | Tx 226339 | Minera Juanicipio S.A. |
MAG Silver provided an independent opinion by Creel Abogados of México, dated 1 November 2017, which agrees with the above land tenure information.
The Property is owned by Minera Juanicipio, a joint venture company held 56% by Fresnillo and 44% by MAG Silver, with Fresnillo acting as the operator. Industrias Peñoles S.A. de C.V. (Peñoles) holds a 75% interest in Fresnillo and therefore a beneficial 42% interest in the Property.
Surface ownership over the area of interest in the northeast portion of the Property was held by the Valdecañas Ejido and Ejido Saucito de Poleo. The joint venture has purchased the surface rights of that area for $1.4M (Figure 4.2).
More recently, Minera Juanicipio has purchased 312.12 hectares of surface rights north of the mining concession for the mine processing and tailings storage facilities and access roads and continues to purchase small parcels of land, to expand the overall facilities footprint and increase highway frontage.
Except for liabilities related to the reclamation of exploration drill roads and sites, AMC is not aware of any outstanding environmental liabilities. MAG Silver reports that all applicable permits required to conduct mineral exploration, drive the decline, prepare the mill-site and improve or construct access roads and powerlines have been granted.
AMC is not aware of any other significant factors and risks that may affect access, title, or the right or ability to perform the proposed work program on the Property.
| MAG Silver Juanicipio NI 43-101 Technical Report | |
| MAG Silver Corp. | 717002 |
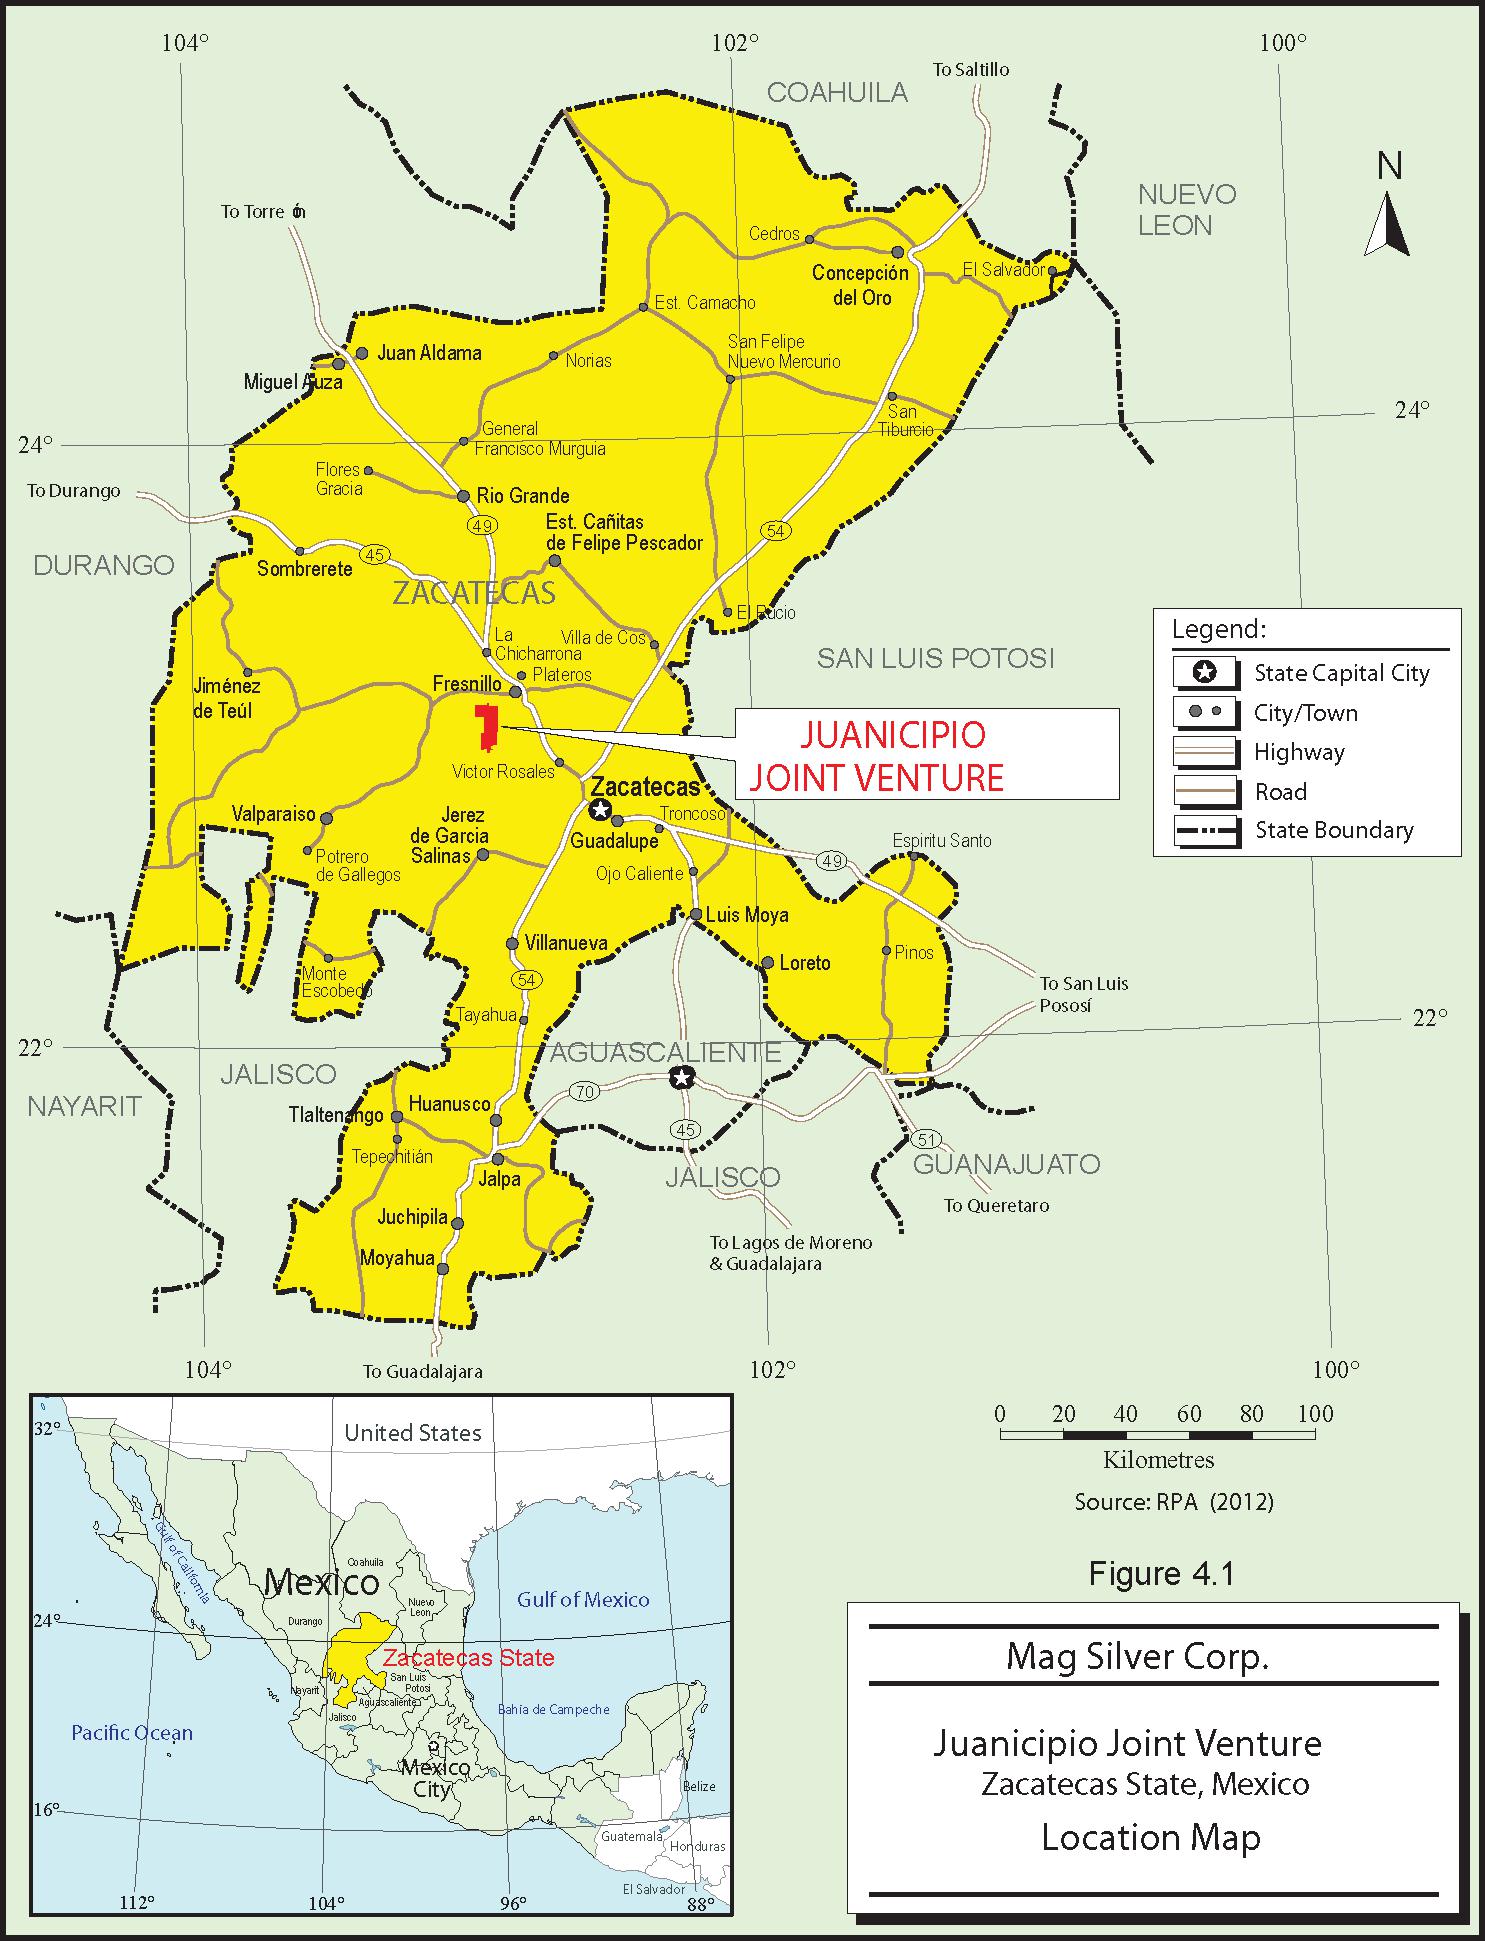
| MAG Silver Juanicipio NI 43-101 Technical Report | |
| MAG Silver Corp. | 717002 |
| Figure 4.2 | Claim map and surface rights on the Property |

| MAG Silver Juanicipio NI 43-101 Technical Report | |
| MAG Silver Corp. | 717002 |
| 5 | Accessibility, climate, local resources, infrastructure, and physiography |
The Property is located 70 km by road northwest of Zacatecas City in central Zacatecas State. The Property is accessible by taking Federal Highway 49 northwest from Zacatecas City to Fresnillo and then travelling 6 km to the southwest along paved and dirt roads. The closest airport with daily air service to Mexico City is located at Zacatecas City. Both Zacatecas City and Fresnillo are serviced by rail.
The climate is warm and arid. Temperatures vary from 0°C to 41°C and average 21°C. The average annual precipitation is 290 mm, with the period from June to October being the wettest. Exploration and development can be carried out twelve months a year.
The closest full-service town is Fresnillo, located 8 km from the Property. Fresnillo has a population of approximately 200,000 and has all the services required to support a mining operation including a trained workforce, hospital, and accommodations.
Site infrastructure consists of the following items:
| · | A series of roads used to access: drill sites, the decline portal, mine offices, workshop, and the surface magazine. |
| · | An underground access portal, and an advanced underground access ramp. |
| · | A surface explosives magazine. |
| · | Waste stockpile. |
| | |
| · | Interim power lines and sub-station. |
Section 18 describes the project infrastructure in detail. Section 23 describes infrastructure located immediately outside the Property boundary.
The Property lies within the Mexican Mesa Central or Altiplano. This region is flanked to the west by the Sierra Madre Occidental and to the east by the Sierra Madre Oriental mountain ranges. The Altiplano in this region is dominated by broad alluvium filled valleys between mountain ranges with an average elevation of approximately 1,700 m above sea level (masl). Local mountain ranges reach 3,000 masl. Elevations on the Property itself range from 2,050 masl to 2,450 masl and the terrain is moderate to rugged.
Vegetation is sparse and consists mainly of grasses, low thorny shrubs, and cacti with scattered oak forests at higher elevations. Surface water is rare, but groundwater is available.
At this stage of the project, there are sufficient surface rights and available power, water, and personnel to carry out the exploration and access development.
| MAG Silver Juanicipio NI 43-101 Technical Report | |
| MAG Silver Corp. | 717002 |
The Juanicipio 1 concession was originally staked in 1996, with title eventually granted in 1998. It was held under the name of Juan Antonio Rosales and covered an area of approximately 28,000 ha. The concession was later acquired by Martin Sutti, who optioned it to Minera Sunshine de Mexico S.A. de C.V. (Minera Sunshine) until 2001.
In July 2002, Minera Lagartos S.A. de C.V. (Minera Lagartos) optioned the Juanicipio 1 concession from Mr. Sutti. On 8 August 2002, MAG Silver entered into an agreement whereby it could acquire 98% of the issued and outstanding shares of Minera Lagartos. This agreement was later amended such that MAG Silver could acquire a 99% interest in Minera Lagartos and a beneficial ownership of the remaining 1% interest.
On 4 April 2005, MAG Silver announced that it had entered into a joint venture agreement with Peñoles whereby Peñoles could earn a 56% interest in the Property by spending $5M on or before the end of year four of the agreement. Peñoles committed to a minimum expenditure of $750,000 including at least 3,000 m of drilling in the first year of the agreement. Peñoles subscribed for $500,000 in MAG Silver shares at the market price on signing and an additional $500,000 in MAG Silver shares if the contract continued into the second year. All earn-in requirements have been met.
In 2007, Peñoles’ precious metals assets were spun out into Fresnillo plc, which was simultaneously listed on the London Stock Exchange.
On 21 December 2007, Fresnillo and MAG Silver announced the formation of a new company incorporated in Mexico, Minera Juanicipio, to operate the joint venture. Minera Juanicipio is 56% held by Fresnillo and 44% held by MAG Silver, with Fresnillo acting as the operator.
Silver mineralization in the Fresnillo area is reported to have been discovered in 1554. Although no records exist prior to the 1970s, the Property was likely prospected periodically over the years because of its proximity to the Fresnillo mining area.
Peñoles drilled several holes to the northeast of the Property in the 1970s and 1980s, prior to the discovery of the nearby San Carlos Vein. Concerted exploration of the areas adjoining the Property was begun by Fresnillo in 2006 based on results from the Valdecañas and San Carlos veins.
From 2000 to 2001, Minera Sunshine contracted IMDEX Inc./Cascabel S.A. de C.V. (IMDEX/Cascabel) to complete property-wide (1:50,000 scale) geological mapping, preliminary rock chip sampling, and Landsat image and air photo analysis. This was followed by more detailed (1:5,000 scale) geological mapping in areas of interest, additional Landsat image analysis, detailed geochemical sampling, and a limited amount of Natural Source Audio Magnetotelluric (NSAMT) geophysical surveying. The NSAMT survey was used to define structures, mainly in the north-eastern part of the Property. Minera Sunshine obtained drill permits to test this area but was not able to undertake drilling before it went bankrupt in 2001 (Megaw and Ramirez, 2001).
| 6.3 | Previous Mineral Resource estimates |
In April 2008, Fresnillo reported an initial Mineral Resource estimate for the Valdecañas deposit. In June 2008, MAG Silver retained SRK Consulting (Canada) Inc. (SRK) to prepare a NI 43-101 Technical Report documenting the initial Mineral Resource estimate prepared by Fresnillo and audited by SRK (Chartier et al., 2008).
��
In 2009, RPA, then Scott Wilson RPA, prepared a Mineral Resource estimate based on drillhole results available to 29 January 2009. This work was done independently of the modelling and estimation work by Fresnillo (Ross and Roscoe, 2009).
RPA updated the Mineral Resource estimate in late 2010 based on data available to 10 September 2010 (Ross, 2011). Fresnillo prepared a parallel estimate using similar drillhole data. The Fresnillo estimate was audited by SRK (Brown et al., 2011). The two estimates differed in the silver grade, which led to studies by additional consultants (Srivastava, 2011; Leuangthong et al., 2011).
| MAG Silver Juanicipio NI 43-101 Technical Report | |
| MAG Silver Corp. | 717002 |
On 10 November 2011, MAG Silver announced an updated Mineral Resource estimate made by Strathcona Mineral Resources Ltd (Strathcona) on behalf of Minera Juanicipio. The estimate was based on drill results available as of 1 June 2011, and used a cut-off grade of 100 g/t Ag. Indicated Mineral Resources were estimated to total 5.7 million tonnes at 702 g/t Ag, 1.9 g/t Au, 2.2% Pb, and 4.2% Zn. Total contained metals in the Indicated Resource were 128 million ounces of silver, 346,000 ounces of gold, 268 million pounds of lead, and 521 million pounds of zinc. Inferred Mineral Resources were estimated to total 4.3 million tonnes at 513 g/t Ag, 1.4 g/t Au, 1.6% Pb, and 3.0% Zn. The Inferred Mineral Resources were estimated to contain an additional 71 million ounces of silver, 192,000 ounces of gold, 152 million pounds of lead, and 280 million pounds of zinc.
On 19 December 2011, MAG Silver announced an updated Mineral Resource estimate by RPA (Ross, 2011). Using drillhole data available as of 5 August 2011, and a net smelter return (NSR) cut-off value of $55/t, Indicated Mineral Resources were estimated to total 6.2 million tonnes at 728 g/t Ag, 1.9 g/t Au, 1.9% Pb, and 3.9% Zn. Inferred Mineral Resources were estimated to total 7.1 million tonnes at 373 g/t Ag, 1.6 g/t Au, 1.5% Pb, and 2.6% Zn. The contained metals in the Indicated Resource were estimated to total 146 million ounces of silver, 384,000 ounces of gold, 267 million pounds of lead, and 539 million pounds of zinc. The Inferred Resources were estimated to contain a total of 85 million ounces of silver, 370,000 ounces of gold, 236 million pounds of lead, and 400 million pounds of zinc.
The Mineral Resource was updated again by RPA on 12 June 2014 (RPA 2014 Technical Report).
All Mineral Resource estimates reported in this section are superseded by the current Mineral Resource estimate contained in Section 14 of this report and the issuer is not treating any of the previous estimates as current Mineral Resources.
In May 2009, Tetra Tech WEI Inc., formerly Wardrop Engineering (Wardrop), was retained by Minera Juanicipio to carry out an initial scoping level study on the Valdecañas deposit. The study (Ghaffari et al., 2009) was filed on SEDAR on 6 November 2009.
The study was completed on the basis that the joint mine/mill project would be conducted on a "stand-alone" basis, independent of any other regional mining operations or related infrastructure. It was also assumed that the most economical and efficient access to the mine would be via a ramp. The estimates were stated to be to an accuracy of + 35%. All costs were in US$ and the Wardrop Base Case utilized the Energy and Metals Consensus Forecasts (EMCF) quarterly reports in calculating Wardrop / EMCF prices.
In October 2011 AMC was retained by Minera Juanicipio to carry out a PEA on the Property and to complete an NI 43-101 Technical Report. The PEA (Thomas et al., 2012) was filed on SEDAR in July 2012.
The study was completed on the basis that the joint mine / mill project would be conducted on a "stand-alone" basis, independent of any other regional mining operations or related infrastructure. It was based on Mineral Resource estimates made by Strathcona (November 2011).
It was also assumed that the most economical and efficient access to the mine would be via a ramp. The mining method adopted was longhole open stoping with paste fill. Truck haulage was considered to be the most economic means of transporting waste and mineralized material.
The proposed process plant consisted of a comminution circuit followed by sequential flotation of silver-rich lead concentrate, a zinc concentrate, and a gold-rich pyrite concentrate. The cost estimates were indicated to be at an accuracy of +/- 35%. All costs were in US$ and the metal price assumptions were based on three year trailing averages to the year ending December 2011. The study indicated a robust economic project with an after tax NPV discounted at 5% of $1,233M and an Internal Rate of Return of 43%.
| MAG Silver Juanicipio NI 43-101 Technical Report | |
| MAG Silver Corp. | 717002 |
The Technical Report in this section is superseded by the current Technical Report.
| 6.6 | RPA Technical Report June 2014 |
In June 2014 RPA completed a Technical Report on the Mineral Resource update for the Juanicipio joint venture, Zacatecas State, Mexico. The Technical Report confirmed the results of the AMC 2012 PEA.
The Technical Report in this section is superseded by the current Technical Report.
| MAG Silver Juanicipio NI 43-101 Technical Report | |
| MAG Silver Corp. | 717002 |
| 7 | Geological setting and mineralization |
Sections 7.1 and 7.2 are modified from Megaw and Ramirez (2001). Figure 7.1 shows the regional geology and Figure 7.2 depicts the regional stratigraphy.
The Property lies on the western flank of the Mexican Mesa Central or Altiplano, just east of the Sierra Madre Occidental range. Basement rocks underlying the western Altiplano are a late Palaeozoic to Mesozoic assemblage of marine sedimentary and submarine volcanic rocks belonging to the Guerrero Terrane (Simmons, 1991) that were obducted onto older Palaeozoic and Precambrian continental rocks during the early Jurassic. These were then overlapped by a Jurassic-Cretaceous epi-continental marine and volcanic arc sequence that in the Fresnillo area is represented by the Proaño and Chilitos formations (Simmons, 1991; Wendt, 2002). The late Cretaceous to early Tertiary Laramide Orogeny folded and thrust faulted the basement rocks in the entire area and preceded the emplacement of mid-Tertiary plutons and related dykes and stocks (Ruvalcaba-Ruiz and Thompson, 1988). Mesozoic marine rocks are host to the San Nicolas volcanogenic massive sulphide (VMS) deposit and Francisco Madero sedimentary exhalative (Sedex) deposit (Wendt, 2002).
Unconformably overlying the Mesozoic basement rocks in the western Altiplano are units from the late Cretaceous to Tertiary, Sierra Madre Occidental magmatic arc. These rocks consist of a lower assemblage of late Cretaceous to Tertiary volcanic, volcaniclastic, conglomerate and locally limestone rocks, the “lower volcanic complex”, and a mid-Tertiary (~25 to 45 Ma) “upper volcanic supergroup” of caldera related, rhyolite ash flow tuffs and flows. Eocene to Oligocene intrusions occur throughout the Altiplano and are related to the later felsic volcanic event. Locally, these two units are separated by an unconformity (Ruvalcaba-Ruiz and Thompson, 1988; Wendt, 2002).
| MAG Silver Juanicipio NI 43-101 Technical Report | |
| MAG Silver Corp. | 717002 |
| Figure 7.1 | Regional geology |
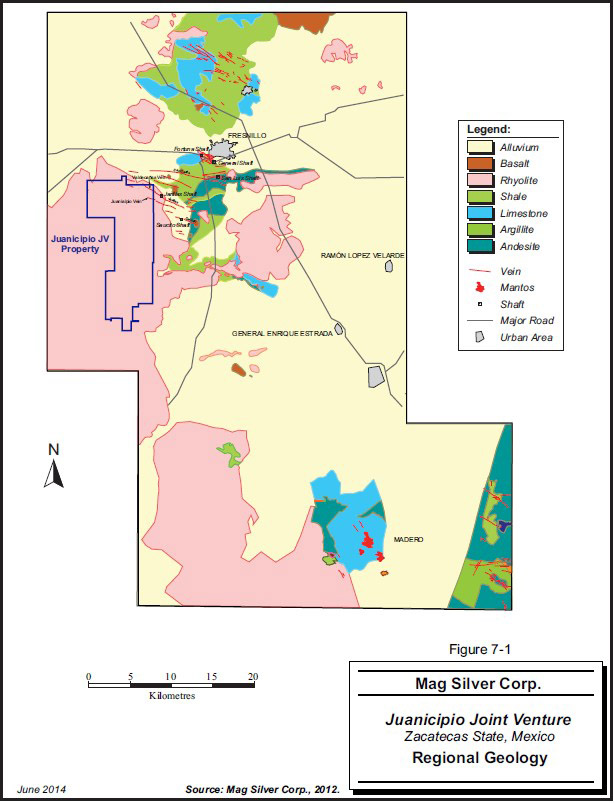
Note: Property boundary has not changed since 2012.
| MAG Silver Juanicipio NI 43-101 Technical Report | |
| MAG Silver Corp. | 717002 |
| Figure 7.2 | Regional stratigraphy |

| MAG Silver Juanicipio NI 43-101 Technical Report | |
| MAG Silver Corp. | 717002 |
A late northeast-southwest extensional tectonic event accompanied by major strike-slip fault movement affected the Altiplano starting ca. 35 Ma. This extension was most intense during the Miocene and developed much of the current basin and range topography. Calcrete cemented alluvial material covered the basins within the Fresnillo area.
The Fresnillo district’s lowest stratigraphic units are the early Cretaceous greywacke and shale units of the Proaño Group (Table 7.1). The Proaño Group is broken into two formations: the “lower greywacke” Valdecañas Formation, comprising thinly bedded greywacke and shale, and the “upper greywacke” Plateros Formation, comprising carbonaceous and calcareous shale at the base grading to immature sandstone units (Ruvalcaba-Ruiz and Thompson, 1988).
| Table 7.1 | Stratigraphy of the Fresnillo district |
| Per. | Age | Group name | Fm. | Local name | Thickness | Rock type | Assoc. min / alt |
| Cenozoic | Quaternary | | | | 1-250 m | Alluvium | None |
| Miocene-Pliocene | | | Basalt | 100 m | Olivine basalt | None |
| Eocene-Miocene | | | Altamira Volcanics | 400 m | Conglomerate, welded rhyolite ash-flow tuff | None |
| Eocene | | | Quartz monzonite | - | Quartz monzonite | Ag-Pb-Zn skam |
| Paleocene-Eocene | | Fresnillo | Linares Volcanics | 400 m | Conglomerate, welded rhyolite ash-flow tuff, flow domes, volarenite | Veins, advanced argillic alt., silicification |
| Cretaceous | Late | | Cuestra del Cura | Cerro Gordo | 300 m | Limestone | Replacement and veins |
| Fortuna | 300 m | Limestone | Replacement and veins |
| Early | Proaño | Plateros | Upper Greywacke | 250 m | Calcareous greywacke and shale | Veins |
| Calcareous shale | 50 m | Calcareous shale | Veins and replacement |
| Valdecañas | Lower Greywacke | 700 m | Greywacke | Veins |
(Modified after Ruvalcaba-Ruiz and Thompson, 1988 and Wendt, 2002).
Laramide thrust faulting complicates the stratigraphy of the overlying limestone units, called the Cerro Gordo and Fortuna units in the Fresnillo district, and the Chilitos Formation volcanic and volcaniclastic rocks. Regionally, the Cerro Gordo and Fortuna limestone units appear to be the stratigraphic equivalents of the Cuesta del Cura formation and are probably early Cretaceous in age and overlie the Proaño Group clastic sedimentary rocks (Megaw and Ramirez, 2001). In this case, volcanic and volcaniclastic rocks of the Chilitos formation are likely late Cretaceous in age and represent the earliest phase of volcanism identified in the area, and possibly correlate to the base of the “lower volcanic complex” of the Sierra Madre volcanic arc.
Overlying the Chilitos formation are Tertiary volcanic rocks of the Fresnillo formation (> 29 Ma), which consist of conglomerate, welded rhyolitic ash-flow tuff and flow domes, later (< 29 Ma) conglomerate, rhyolitic ash-flow tuff, and finally upper Tertiary olivine basalt flows.
Within this stratigraphy is a quartz-monzonite stock / dyke that intruded the Fresnillo mine area in mid-Tertiary (~32.4 Ma) prior to mineralization (Veladoret al., 2010). Silver-lead-zinc veins and mineralized skarn were emplaced between 31 and 29.6 Ma, roughly coeval with the emplacement of the rhyolite volcanic package affected by widespread silicification and argillic alteration (Veladoret al., 2010).
| MAG Silver Juanicipio NI 43-101 Technical Report | |
| MAG Silver Corp. | 717002 |
Geological mapping on the Property was conducted by IMDEX / Cascabel on behalf of Minera Sunshine from 1999 to 2001. The results of this mapping are detailed in a company report by Megaw and Ramirez (2001) and Megaw (2010), and are summarized in the following subsections. Figure 7.3 shows the Property geology.
The oldest rocks observed in the Juanicipio area are fragments of greywacke found on dumps in the Cerro Colorado area south of the Property and presumably belong to the Proaño Group. The oldest rocks observed in outcrop are calcareous shale and andesitic volcaniclastic rocks of the Chilitos formation at the base of Linares Canyon. They are highly deformed and sheared and are locally boudinaged and dip shallowly to moderately northeast. The upper contact of the Chilitos formation forms an irregular unconformity to the overlying Tertiary volcanic and volcaniclastic rocks.
Drilling and ramp development from 2003 to date have cut significant sections of the Chilitos and Proaño formations. The Chilitos formation consists of intermediate-composition volcanic-dominated sandstones (volarenites) and altered tuffs. The Proaño Group comprises a broad range of shale, greywacke, sandstones, polymictic intermediate volcanic breccias and intermediate lava flows or sills. Exhalite layers composed of pyritic silica to 20 cm in thickness are locally observed. Alteration of these units ranges from moderate to pervasive chloritization, argillization and silicification, resulting in highly variable ground conditions. Notably, none of the limestones encountered elsewhere in the Fresnillo District have been seen in the Juanicipio area.
| 7.2.2 | Tertiary igneous rocks |
Tertiary igneous rocks are divided into the Linares and Altamira volcanic assemblages that are separated by an unconformity.
The lower assemblage, informally named the Linares volcanic package (Megaw and Ramirez, 2001) consists of volcaniclastic sedimentary units, welded and non-welded crystal lithic tuff, flow breccia, and rhyolite flow domes. The basal unit is composed of 5 m to 20 m of epiclastic volarenites and arkoses overlain by 20 m to 100 m of variably welded, rhyolite to dacite, composite ash-flow tuff that resembles, and may correlate with, Fresnillo Formation volcanic rocks (Megaw and Ramirez, 2001). This unit has been dated at 44.7 to 31.7 Ma (Veladoret al., 2010) and generally hosts the pervasive silicification “sinter”, advanced argillic alteration (kaolinite-alunite) and iron-oxide alteration found on the Property. Textural variation and Landsat interpretation within this unit suggests several eruptive centres (calderas) for these volcanic rocks in the Sierra Valdecañas range.
Overlying the ash-flows is a well bedded volarenite layer and then 100 m to 150 m of welded ash-flow tuff, which are less silicified than the lower unit. Several rhyolite domes occur locally between Linares Canyon and the Cesantoni Kaolinite Mine.
The Linares volcanic rocks are block-faulted along north-northwest trending faults with shallow to moderate southwest dips. Silicification appears to post-date the faulting as the faults only locally cut or displace silicified units (Megaw and Ramirez, 2001).
Megaw and Ramirez (2001) also describe and informally name the Altamira volcanic package after the tallest peak in the area, Cerro Altamira, where the thickest section of these volcanic rocks outcrops. These volcanic rocks overlie the Linares volcanic package across an angular unconformity overlain by a 20 m to 50 m thick layer of well bedded conglomerate and coarse volarenite. Rounded fragments of silicified Linares volcanic rocks occur within the conglomerate. Overlying these clastic rocks is a 20 m to 350 m thick section of welded rhyolite to rhyodacite ash-flow tuff that have been dated at 27.4 and 28.7 Ma (Langet al., 1988). Several caldera complexes have been identified within this package. This unit is post-alteration and presumably post-mineralization and does not appear to contain any alteration or mineralization.
| 7.2.3 | Upper Tertiary rocks |
These rocks are composed of olivine basalt flows that locally overlie the felsic mid-Tertiary volcanic and volcaniclastic rocks on the Property. They have not been dated, but are probably quite young.
| MAG Silver Juanicipio NI 43-101 Technical Report | |
| MAG Silver Corp. | 717002 |
Regional satellite image interpretation suggests that the Sierra Valdecañas range is a topographically high, but structurally down-dropped block that is bounded by several major orthogonal northeast and northwest structures. The most notable of these is the more than 200 km long Fresnillo strike-slip fault and its parallel structure, the San Acacio-Zacatecas fault to the east of the Property. Also, it appears that the San Acacio-Zacatecas structure traverses the northeast corner of the Property and coincides with the Valdecañas and Juanicipio veins.
On the Property, the dominant structural features are:
| 1 | 340° to 020°, or north-south structures |
| 2 | 290° to 310° trending, steeply dipping faults |
| 3 | Lesser 040° to 050° structures |
From field observations, the north-south structures appear to be steeply dipping normal faults that cut and down-drop blocks of silicified tuff, especially in the vicinity of Linares Canyon. More important to the silicification appears to be the 290° to 310° trending, steeply to moderately dipping faults. These faults occur where silicification and advanced argillic alteration are most intense and may have served as major hydrothermal fluid pathways. Regional structural analysis suggests these 290° to 310° trending faults were extensional faults generated between the regional left-lateral strike-slip faults. Repeated opening of these faults by intra-mineral strike-slip movements may have coincided closely with mineralization pulses, resulting in the remarkable lateral continuity of mineralization within the Valdecañas and other veins of the Fresnillo District. Coincidence of extensional opening and mineralization pulses may also explain the significant shifts in depth of boiling in the veins (Simmons, 1991).
| MAG Silver Juanicipio NI 43-101 Technical Report | |
| MAG Silver Corp. | 717002 |
| Figure 7.3 | Property geology |
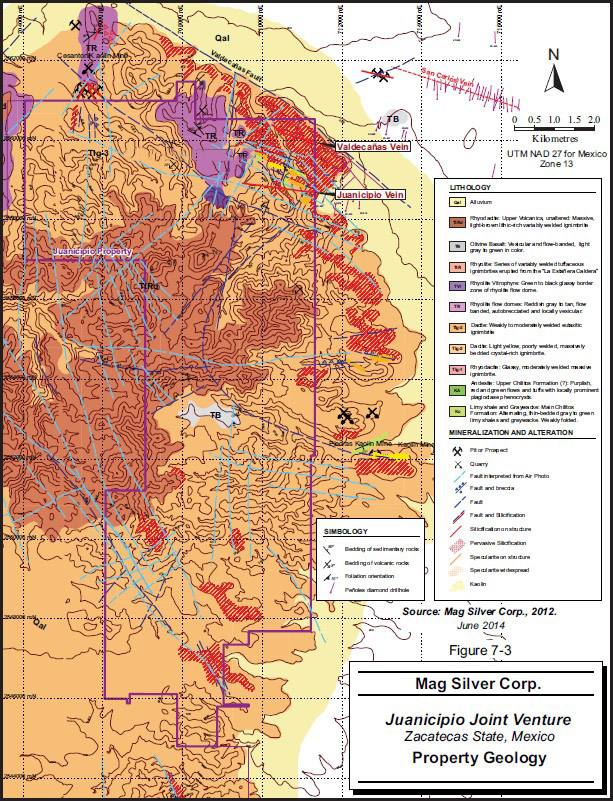
Geologic map credited to Megaw and Ramirez, 2001.
| MAG Silver Juanicipio NI 43-101 Technical Report | |
| MAG Silver Corp. | 717002 |
Mineralization on the Property occurs as classically zoned precious metal-rich epithermal veins hosted within the altered Eocene and older rocks mentioned in Section 7.2 above. The two significant silver-gold epithermal structures discovered to date on the Property are known as the Valdecañas vein system and the Juanicipio vein. They are both located in the northeast corner of the claim and strike east-southeast and dip 35° to 70° with an average of about 58° southwest. The Valdecañas vein extends to well beyond both the north and east property boundaries. The Juanicipio vein extends to beyond the east boundary but is open to the west.
The Valdecañas vein system displays the metal zonation typical of the Fresnillo District and epithermal veins in general, of an upper precious metal zone, the “Bonanza Zone” grading downwards into a deeper base metal dominant zone, the “Deep Zone”. New to the district is significant copper mineralization that has recently been discovered within the Deep Zone in the Valdecañas vein system. There is significant evidence for a repeat of this zonation in the deeper reaches, perhaps reflecting “stacked” boiling levels (Buchanan, 1981). The Valdecañas structure hosts the majority of the Mineral Resources currently estimated on the Property.
| 7.3.1 | Valdecañas vein system |
As of 31 December 2016, 179 drillholes, including six metallurgical holes, had tested the lateral and depth extensions of the Valdecañas vein system and were used for vein modelling. Although the metallurgical holes were used for vein modelling, they were not all assayed in detail, so only 173 holes were used for analysis. The vein system is a continuously mineralized en echelon system containing an east vein called “Valdecañas East” (V1E) and a west vein called “Valdecañas West” (V1W) with three well defined splays: Anticipada (VANT), Hangingwall (HW1) and Desprendido (V2W). A summary of the naming convention is listed below:
| · | V1E is the eastern part of the en echelon Valdecañas vein system. |
| · | V1W is the western part of the en echelon Valdecañas vein system. |
| · | V2W is a footwall splay off V1W. It was referred to as the Desprendido vein in the 2012 PEA. V2W was formerly known as the combined footwall vein 1 and footwall vein 2 in previous RPA reports. |
| · | VANT is the newly discovered Anticipada vein, which appears to be a hanging wall splay off V1E. |
| | |
| · | HW1 is a hanging wall vein splay off V1W. |
The naming convention of these individual veins within the Valdecañas vein system has remained unchanged since the RPA 2014 Technical Report, and is maintained in this Technical Report apart from the addition of the Anticipada vein “VANT”.
Vertical metal zoning, typical of epithermal veins systems, has prompted the division of the continuously mineralized veins into “Bonanza” and “Deep” zones. The “Bonanza” part of the vein, roughly everything above 1,500 m above mean sea level (amsl), is where the majority of the high-grade silver is present and it tops out at about 1,850 m amsl. The “Deep Zone”, which is everything below the “Bonanza Zone” is base metal dominant with significant copper occurring roughly below 1,400 m amsl. The deepest mineralization encountered to date is in hole P12 and is about 1,160 m amsl. The Valdecañas vein system extends beyond the Property boundary both to the north and to the east. The vein system sits in the northeast corner of the Property and dips to the southwest into the joint venture claim and as a result the strike length of the mineralization increases from 1,200 m at the top, to about 2,000 m at the currently defined bottom.
The true thickness of the Bonanza Zone ranges from less than one metre to up to 18.5 m, averaging approximately 5 m. The Deep Zone contains a roughly horizontal dilatant (thick) zone stemming from steepening and flattening of the veins. The horizontally-elongated dilatant zone in the West Deep Zone, the deep part of V1W, remains consistently wide (9.7 m to 26.5 m) and extends to the western property boundary. The East Deep Zone (the deep part of V1E) geometry appears more complex but has thick intercepts up to 19.5 m.
The veins have undergone multiple mineralizing events as suggested by repeated stages of brecciation and quartz sealing, local rhythmic microcrystalline quartz-pyrargyrite banding, and open-space cocks-comb textures. The veins exhibit the characteristic metal zoning of the principal veins in the Fresnillo district, observed as a change from silver and gold rich zones at the top (Bonanza Zone) to increased lead and zinc in the deeper reaches (Deep Zone) with copper coming in at the deepest levels. Notably, the gold rich mineralization cuts across the silver-dominant zones, which in turn cut earlier base-metal dominant stages indicating complex multi-stage mineralization as is seen separately in other parts of the district. Gold appears to be present with silver as electrum.
| MAG Silver Juanicipio NI 43-101 Technical Report | |
| MAG Silver Corp. | 717002 |
Mineralization in the Bonanza Zone consists of precious metal rich, banded, or brecciated quartz-pyrargyrite-acanthite-polybasite-galena-sphalerite veins. Within 10 m to 20 m of the upper parts of the veins, the wall rocks are progressively and pervasively silicified and cut by quartz veinlets carrying pyrite-sphalerite-galena sulphide minerals. Alteration in the volcaniclastic / sedimentary host rock farther away from the vein is characterized by weak pyritization, moderate clay alteration, and calcite veining. Mineralization in the Deep Zone consists of base metal rich, banded, or brecciated quartz-galena-sphalerite-chalcopyrite veins with lesser acanthite and pyrargyrite. Much of the silver mineralization appears to occur in late sugary quartz veins that cut across the finer-grained massive base metal vein stages. Portions of the veins in the Deep Zone show skarn minerals including garnets, pyroxenes and axinite within and surrounding the veins. Retrograde hydration of these minerals to chlorite, ilvaite and hydrogrossular is locally pervasive and widespread. The deep skarn zone appears best developed beneath the overlap zone between V1E and V1W and diminishes in pervasiveness laterally in both directions. The combination of the degree and geometry of skarn development coupled with high boron mineralogy (axinite) and complex vein overprinting suggests this reflects a major mineralized fluid upwelling zone, possibly overlying an intrusive cupola at depth.
The Juanicipio vein was discovered in 2003 by MAG Silver prior to the discovery of the Valdecañas vein system, which is located 1,100 m to the north. Discovery hole JI03-01 (now renamed JU1) intersected two metres averaging 630 g/t Ag and 11.4 g/t Au at a vertical depth of approximately 515 m. Thirty-five (35) drillholes contribute to the definition of this vein and the current Mineral Resource estimate includes the Juanicipio vein. The Juanicipio vein is referred to as JV1 and JV2 in most statistical and modelling examinations. No new drilling on the Juanicipio vein has been conducted since the 2014 PEA report. Overall, Juanicipio is a much thinner vein and appears to have a higher gold content; however, this is based on a limited number of overall samples. Mineralization styles and host rocks are the same as Valdecañas.
| 7.3.3 | Other known mineralization |
There have been several limited drilling programs aimed at finding other veins outside of the Valdecañas vein system and Juanicipio vein. To date, only narrow epithermal vein material has been intercepted in drillholes outside of the defined mineralization. However, several of these intercepts from the exploration holes are above the 1,850 m amsl top-out of the Valdecañas vein system and future drill programs will test if these are above the top- outs of new veins.
About 7 km to the south of the Valdecañas vein system is an area called Mesa Grande. Seven exploration holes were drilled in this area. Results indicate narrow epithermal veins with anomalous silver and gold hosted in similar volcanic rocks with similar alteration as at the Valdecañas vein system and Juanicipio vein. In this area, there is a significant thickness of post-mineralization volcanic rocks overlying the same host rocks as in the Valdecañas vein system, so drilling these targets requires long holes. The intercepts made at Mesa Grande were at or above 1850 m amsl so likely above the top-out of any mineralization that might be present in the area. Results from Mesa Grande are proof of concept in that conditions are right for epithermal veins to exist at least this far south. Future drill programs will follow up on these results, but they are not a top priority.
Elsewhere on the Property, extensive areas of intense silicification and advanced argillic alteration have been found on the surface and are similar to that documented above for the Valdecañas and Juanicipio veins. These represent prospective new targets for future vein discoveries.
| MAG Silver Juanicipio NI 43-101 Technical Report | |
| MAG Silver Corp. | 717002 |
The following is taken from Chartier et al. (2008).
The Fresnillo district is a world-class silver mining district located in the centre of the 800 km long Mexican Silver Belt including mining districts Sombrerete (San Martín, Sabinas Mines), Zacatecas, Real de Angeles, Pachuca, and Taxco. Fresnillo owns and operates the Proaño silver mine which has been in production since 1554. From 1554 to 2010, the district had produced more than 850 million ounces of silver at an average grade of approximately 400 g/t Ag, with substantial gold, lead, and zinc credits (Megaw, 2010). According to the Silver Institute (http://www.silverinstitute.org), the Proaño mine produced 26.38 million ounces of silver in 2012, ranking second in the world. Also, according to the Silver Institute, the Saucito mine produced 7.5 million ounces of silver.
The deposits in the district consist of low-sulphidation epithermal quartz-carbonate veins forming an extensive array of stacked steeply dipping, west to west-northwest-trending veins, crosscutting Cretaceous and Jurassic age rocks, mostly of sedimentary origin.
The veins are laterally very extensive and, although the structures are quite persistent with depth, the silver-gold rich section of each structure is typically limited to a 300 m to 400 m range of elevation corresponding to the boiling zone of the fossil hydrothermal system. Metal distributions show a subhorizontal zoning, with base metal abundance increasing with depth. The main veins in the district have been mined continuously over lateral distances ranging from one kilometre to eight kilometres.
The epithermal mineralization is characterized by quartz-adularia-carbonate veins, stockworks, and breccias exhibiting classical epithermal textures such as colloform banding, druzy, and vuggy cockade infilling, suggesting repeated episodes of hydrothermal deposition in open structures. Mineralization includes sphalerite, galena, pyrite, pyrrhotite, silver sulphosalts, and gold. The hydrothermal veins are associated with minor clay alteration.
Epithermal deposits comprise a wide range of hydrothermal deposits associated with volcanic and magmatic edifices and formed at shallow crustal levels by the circulation of magmatic-related hydrothermal fluids into fractured rocks. These deposits are typically related with arrays of regional structures developed in extensional tectonic settings.
Low sulphidation epithermal deposits are related with the circulation of reduced, near neutral, dilute fluids developed by mixing of hot magmatic fluids with deep circulating groundwater. Metal deposition typically occurs during fluid ascent along open deep-seated structures through a combination of processes including fluid mixing, cooling, degassing, and transient boiling. The hydrothermal deposits exhibit strong vertical zoning about the transient boiling zone, with precious metals generally enriched above the boiling zone and base metals abundances increasing with depth.
These hydrothermal deposits are an important supply of silver, gold, and base metals such as lead, zinc, and occasionally copper.
| MAG Silver Juanicipio NI 43-101 Technical Report | |
| MAG Silver Corp. | 717002 |
Exploration on the Property prior to MAG Silver’s involvement is documented in Section 6 of this report. Most of the exploration on the Property since MAG Silver’s involvement has been drilling and is documented in Section 10 of this report.
MAG Silver, and later Minera Juanicipio, did some surface sampling and prospecting; however, until recently this has been very limited because the project already had a significant portfolio of drill-ready targets when MAG Silver acquired the Property. Some of the targets that were labelled high priority have yet to be drill-tested primarily due to the success in the Valdecañas area (See Section 7). Overall, less than approximately 5% of the Property has been systematically explored or drilled. A significant shift towards exploring other areas of the Property began in 2016. Prior to 2016, an airborne geophysical survey was conducted on the Property in 2007.
The 2007 airborne geophysical survey was a helicopter-borne geophysical survey using Aeroquest’s AeroTEM II time domain electromagnetic system employed in conjunction with a high-sensitivity caesium vapour magnetometer. Ancillary equipment included a real-time differential GPS navigation system, radar altimeter, video recorder, and a base station magnetometer. Full-waveform streaming electromagnetic data were recorded at 36,000 samples per second. The total survey coverage presented was 351 line kilometres. The survey was flown at 100 m line spacing in a north-south flight direction. The survey was successful in mapping the magnetic and conductive properties of the geology throughout the survey area.
In 2016 Fresnillo, the operator of Minera Juanicipio, commenced a surface mapping and detailed sampling program to assist with identifying other structures on the Property that may contain mineralization at depth. This program incorporated hyperspectral analyses on drill core coupled with localized channel sampling. Results to data are preliminary in nature and the work is ongoing.
| MAG Silver Juanicipio NI 43-101 Technical Report | |
| MAG Silver Corp. | 717002 |
Drilling on the Property has been contracted to various companies since 2004. All the drilling has been diamond core. Fresnillo currently contracts drilling to Rockdrill a company headquartered in Durango, Mexico and Boytec headquartered in Hermosillo, Mexico. Diamond drillholes are commonly collared using HQ (64 mm core diameter) equipment and reduced to NQ (48 mm core diameter) or BQ (37 mm) as drilling conditions dictate.
Fresnillo uses a Datamine database and 3D model to plan borehole locations and orientations. Spacing varies from 70 m to 100 m along strike and 50 m to 100 m down dip in the plane of mineralization. All drillhole collars are surveyed using differential GPS or a transit system. Downhole deviation is monitored using a Reflex Flexit instrument with readings at intervals ranging from 50 m to 150 m. Drilling by MAG Silver recorded surveys every 15 m. Once a drillhole is completed, casing is pulled and collars are identified with cement monuments with the drillhole number engraved. The site is then revegetated per local law.
As of 31 December 2016, 342 holes have been completed on the Property for a total of 280,523 m. These include all resource definition, metallurgical, exploration, and development related drilling and lost holes. There have been 34 lost holes (failed attempts) totalling 15,456.20 m with some having data of limited use. Figure 10.1 shows drillhole locations. From May 2003 to June 2004, MAG Silver completed nine core holes for a total of 7,346 m. From August 2005 to 31 December 2016, Fresnillo completed 333 core holes for a total of 273,177 m, most of this on the Valdecañas vein system.
During 2016 a total of 16 diamond drillholes for 11,920 m were completed from underground. This included five holes which were drilled for geotechnical purposes, such that 12 holes for 11,354 m of NQ size were drilled for definition purposes, one of which one did not reach the target.
Sections 10.3.1 and 10.3.2 are modified after those contained in the RPA 2014 Technical Report.
| 10.3.1 | Sampling by MAG Silver (2004) |
Drill core was delivered to a core logging facility in Fresnillo where it was labelled, photographed, logged, and sampled under the supervision of MAG Silver geologists. Core recovery was generally greater than 90% except in extremely fractured near-surface rock, argillite, or wider fault structures.
Samples were collected from half core and split lengthwise with a manual wheel splitter. Sample intervals ranged from 0.1 m to more than 3.0 m in length, and mostly honour geological, alteration, and mineralization contacts. Several metres were also sampled above and below mineralized zones. Sampling intervals were marked by a geologist and core was typically sampled continuously between sampling marks.
In AMC’s opinion, the MAG Silver sampling method and approach is appropriate for the style of mineralization and for estimation of Mineral Resources.
| 10.3.2 | Sampling by Fresnillo (2005-2016) |
Drill core was transported by Fresnillo personnel once daily to a core handling facility located near the Saucito mine site. Geotechnicians checked the depth markers and box numbers, reconstructed the core, and calculated recoveries. Fresnillo geologists logged, marked out sample intervals, and assigned sample numbers. Descriptive information was collected including recovery, lithology, alteration, structure, mineralization, and rock quality designation (RQD). Sample intervals ranged from three centimetres to twelve metres. One blank and one of two different standards were submitted into each batch of 20 or 30 samples.
| MAG Silver Juanicipio NI 43-101 Technical Report | |
| MAG Silver Corp. | 717002 |
Core was split using either a diamond saw or mechanical splitter. The splitter was cleaned regularly to avoid potential cross-sample contamination. Samples were placed in pre-numbered plastic sample bags, boxed, and stored in a secure facility prior to shipping. Sample batches commonly contained 20 or 30 samples.
Bulk Density was measured using a water displacement method. Volume was estimated to the nearest 10 mL using a beaker with graduations of 100 mL. Mass was measured using a triple beam balance to the nearest half gram. The core was sealed in cellophane when required. Fresnillo has duplicated some previous density measurements using the Archimedes’ principle whereby core is weighed in air and again in water.
A summary of the results from the 11,790 determinations is shown in Table 10.2, and further information is shown in Section 14.1.2.
| Table 10.1 | Bulk density results by vein |
| Vein | Mean bulk density |
| V1E | 2.94 |
| V1W | 2.87 |
| HW1 | 2.54 |
| VANT | 2.91 |
| V2W(a) | 2.86 |
| V2W(b) | 2.75 |
| JV1 | 2.53 |
| JV2 | 2.99 |
The procedures outlined by Fresnillo staff, as stated above, were found to meet generally accepted industry practices.
Figure 10.2 to Figure 10.4 show representative cross sections through the Valdecañas and Juanicipio vein systems respectively. Table 10.2 shows the drillhole intercept values from Figure 10.3.
Since the RPA 2014 Technical Report, 53 holes (includes lost holes and development holes) totalling 48,384 m have been drilled on the Property. Drilling in these programs was primarily aimed at extending the resource to depth and further defining by infilling. A few holes were dedicated to exploration elsewhere on the Property.
Drillhole M3 has very poor recovery and is very high grade. Drillhole RV-5, which had excellent recovery, was drilled to confirm this hole. RV-5 confirmed the mineralization and both holes have been used in the Mineral Resource estimate.
There are no known drilling, sampling, or recovery factors that could materially affect the accuracy and reliability of the results.
| MAG Silver Juanicipio NI 43-101 Technical Report | |
| MAG Silver Corp. | 717002 |
| Figure 10.1 | Drillhole plan map |
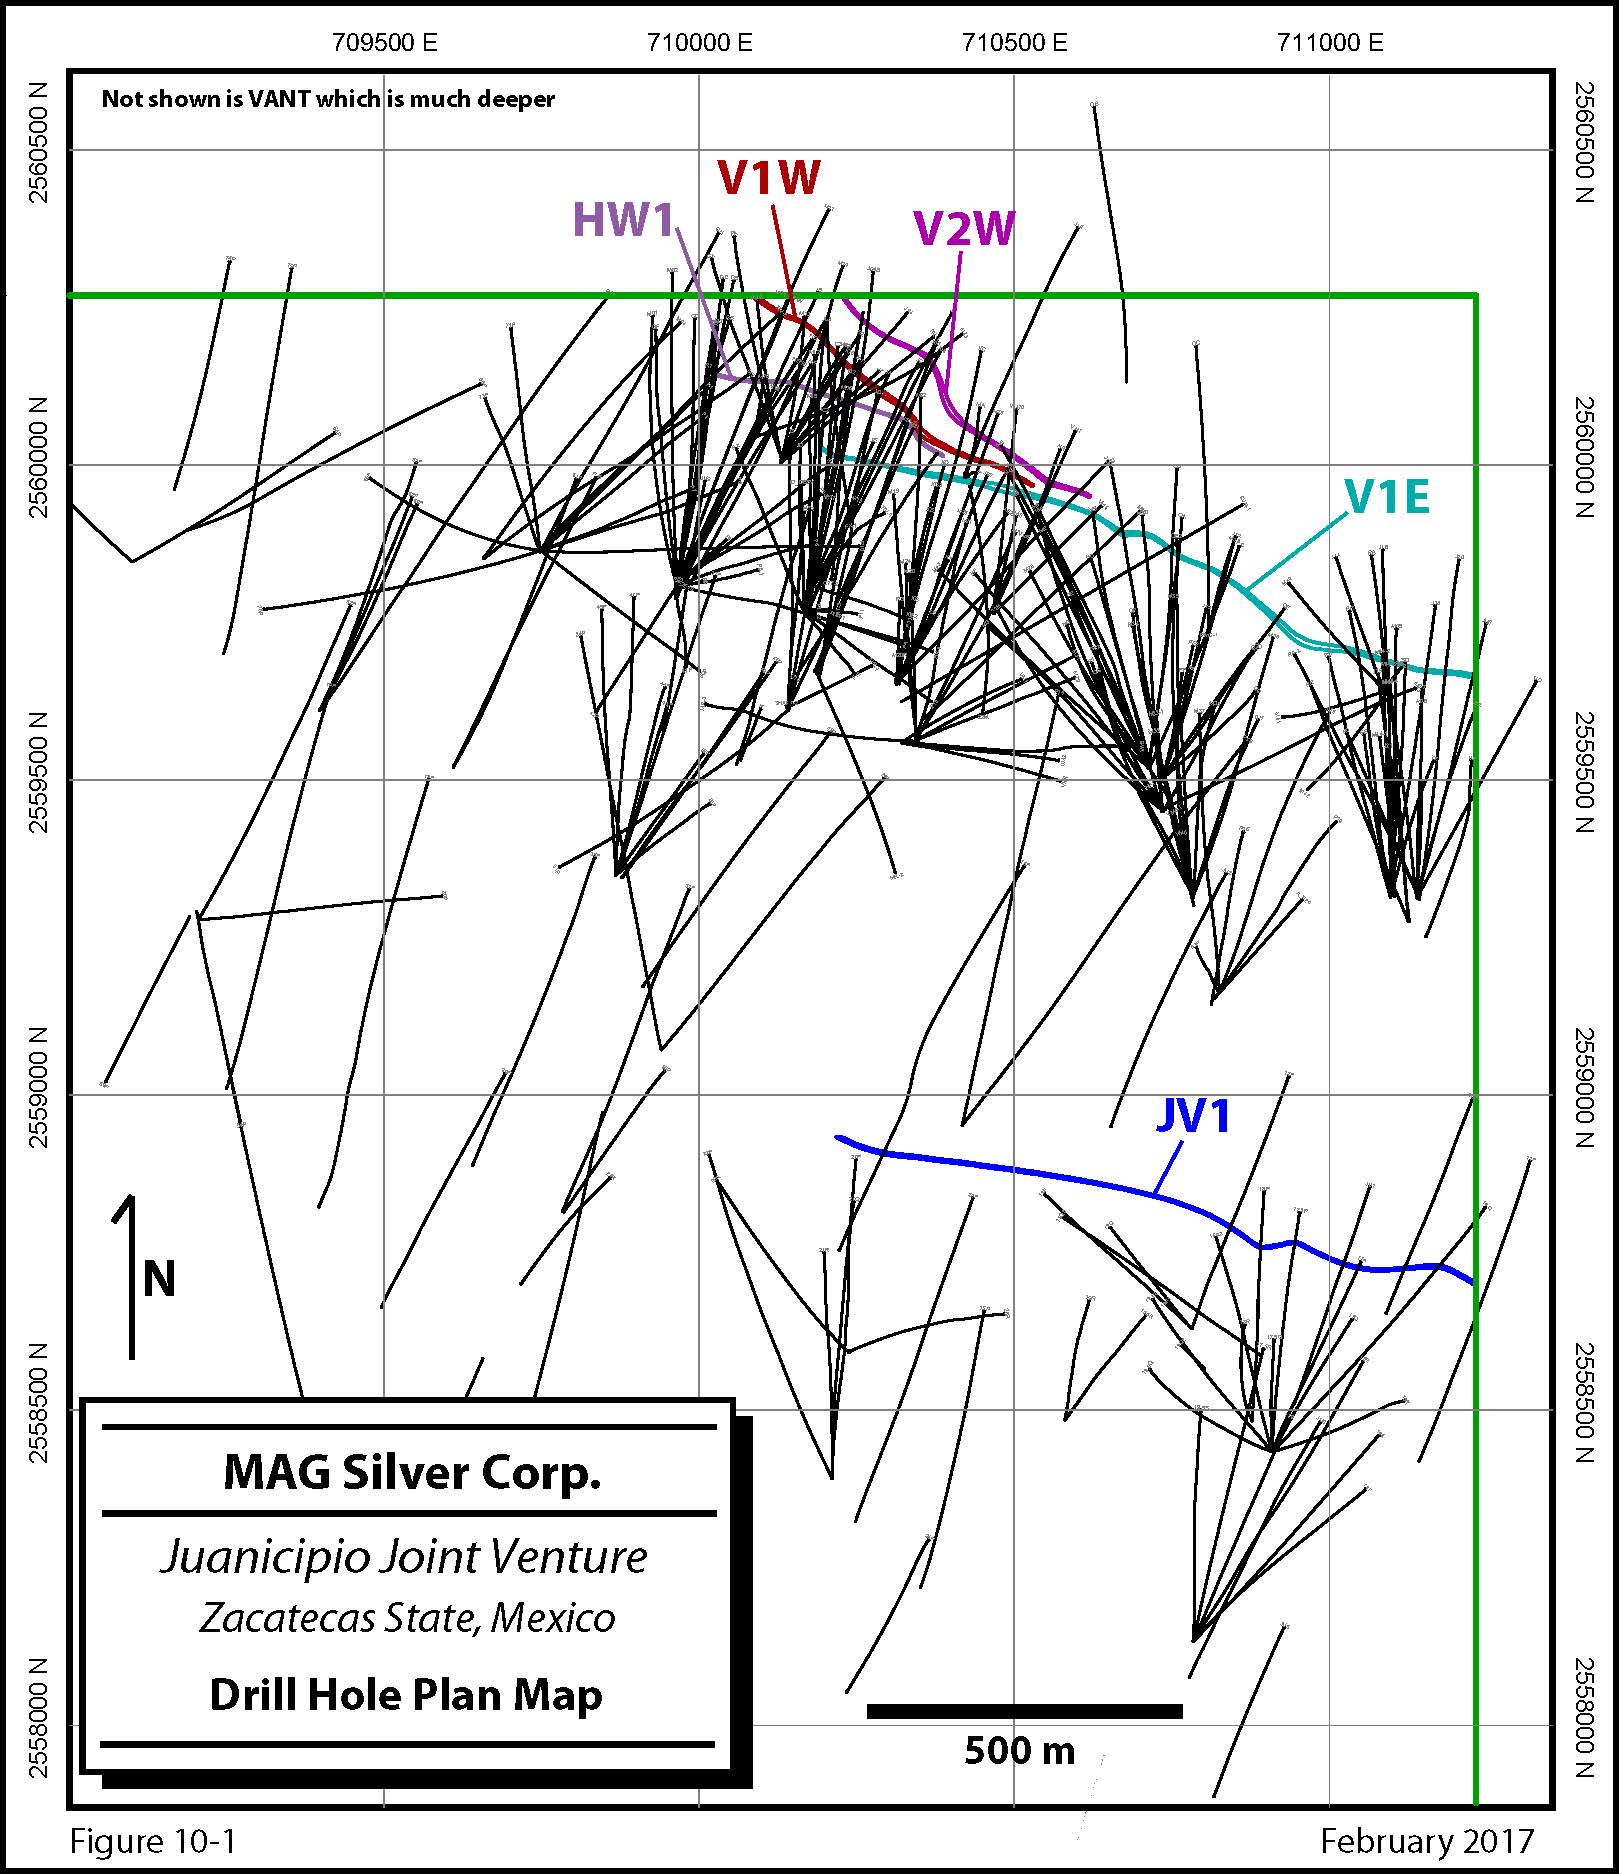
Source: MAG Silver Corp.
| MAG Silver Juanicipio NI 43-101 Technical Report | |
| MAG Silver Corp. | 717002 |
| Figure 10.2 | Eastern cross section through the Valdecañas vein system |
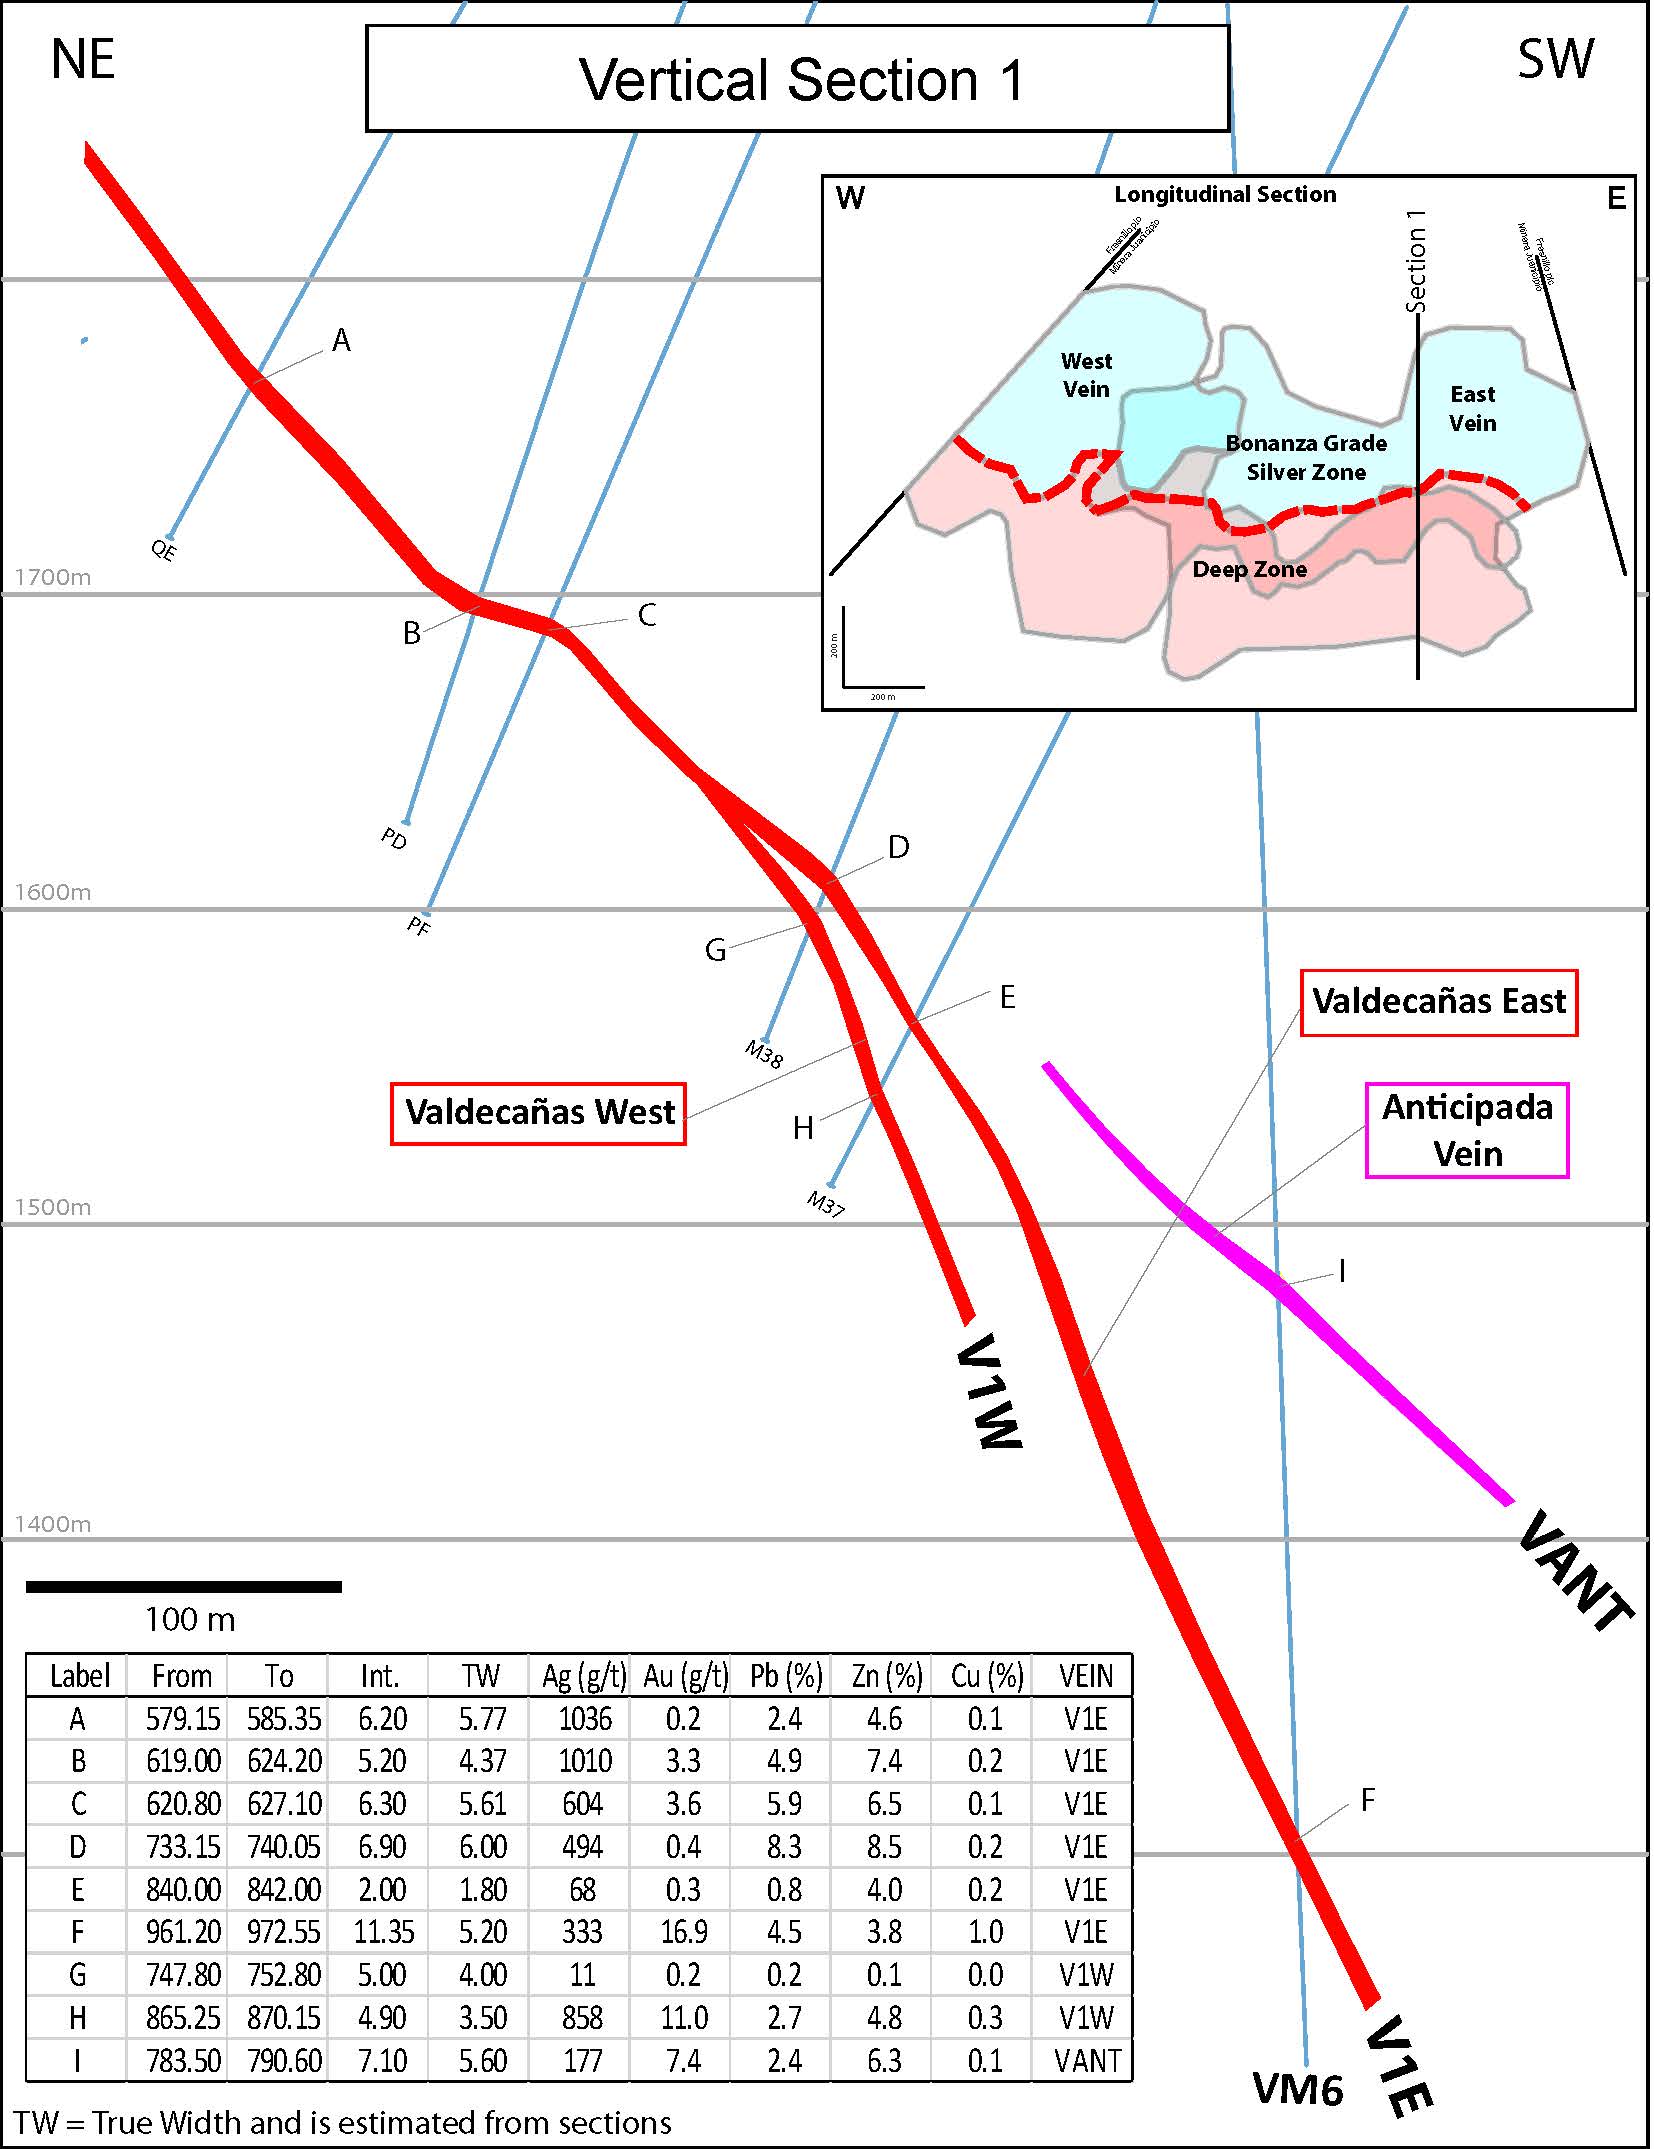
Source: MAG Silver Corp.
| MAG Silver Juanicipio NI 43-101 Technical Report | |
| MAG Silver Corp. | 717002 |
| Figure 10.3 | Western cross section through the Valdecañas vein system |
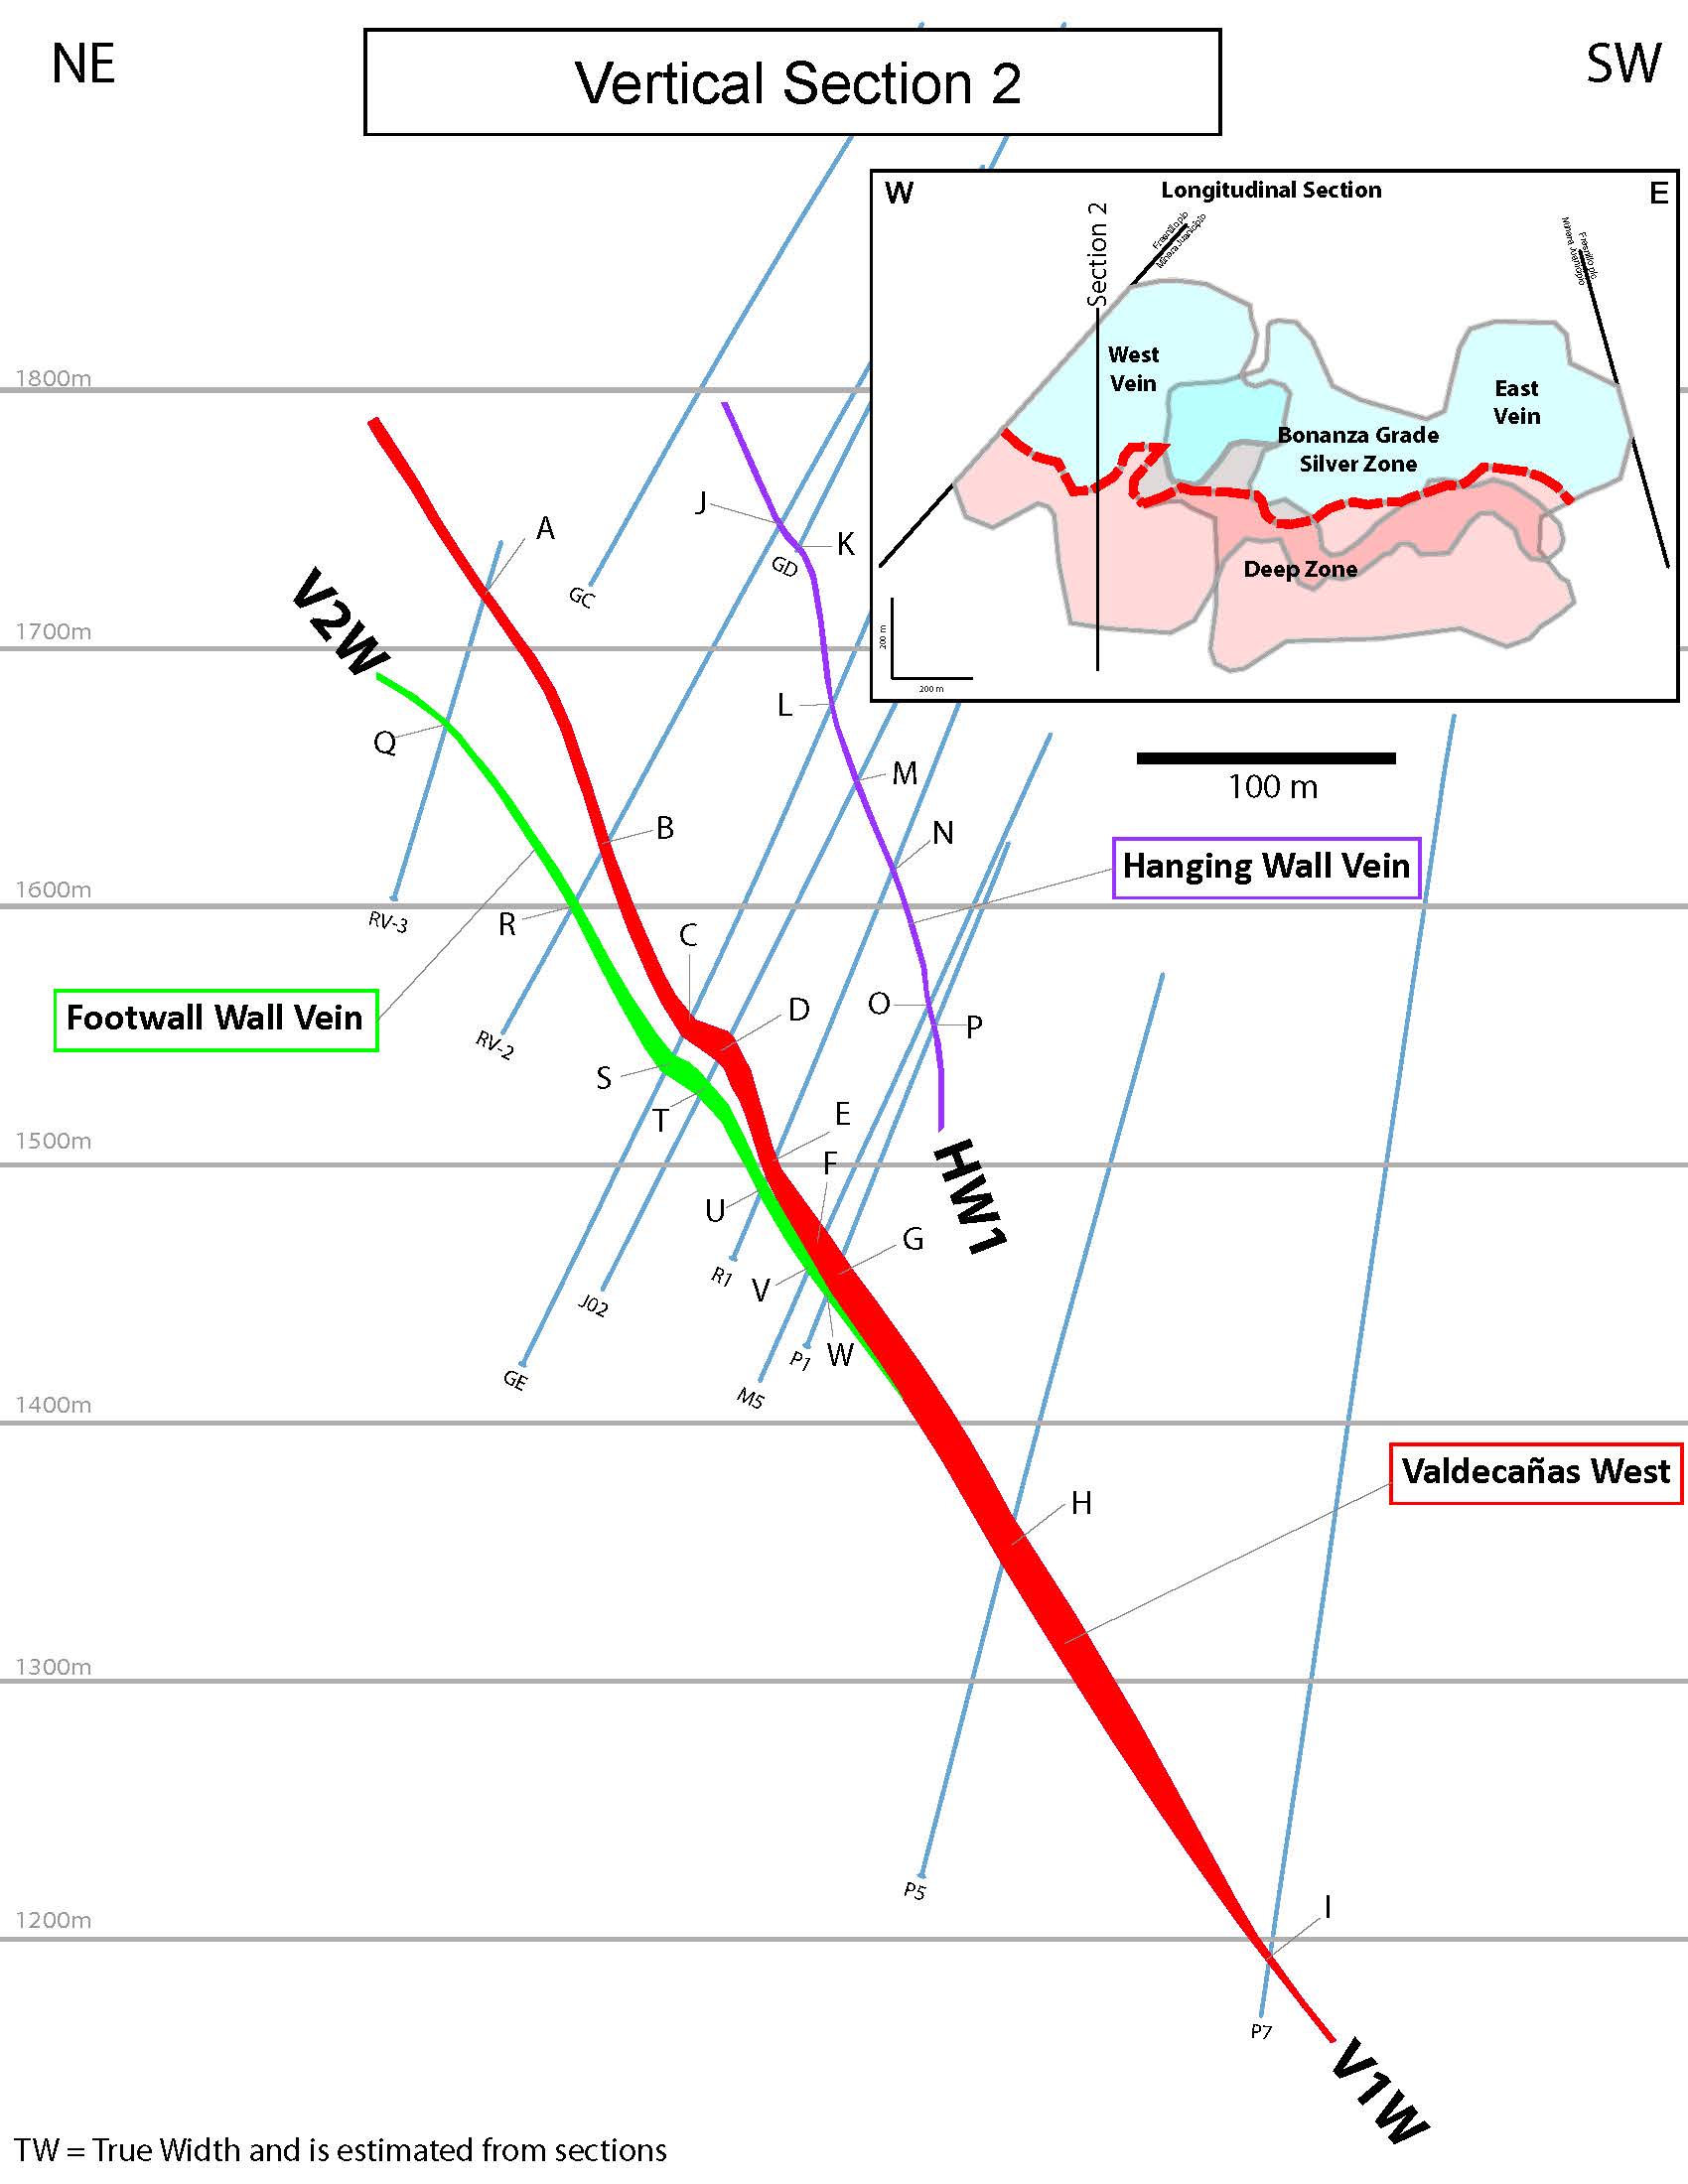
Notes: Intercepts shown as letters A to W. See intercept values in Table 10.2.
Source: MAG Silver Corp.
| MAG Silver Juanicipio NI 43-101 Technical Report | |
| MAG Silver Corp. | 717002 |
| Table 10.2 | Vein intercept results for holes shown in Figure 10.3 |
| Label | Vein | From (m) | To (m) | Int. (m) | TW (m) | Ag (g/t) | Au (g/t) | Pb (%) | Zn | Cu |
| (%) | (%) |
| A | V1W | 676.45 | 680.25 | 3.8 | 2.8 | 139 | 0.25 | 0.04 | 0.75 | 0.01 |
| B | V1W | 833.85 | 838.15 | 4.3 | 3.3 | 113 | 1.06 | 0.58 | 1.62 | 0.05 |
| C | V1W | 823.15 | 831 | 7.85 | 6.5 | 124 | 4.97 | 1.26 | 5.05 | 0.18 |
| D | V1W | 827.6 | 839.75 | 12.15 | 9.5 | 143 | 4.83 | 1.35 | 3.46 | 0.09 |
| E | V1W | 871.85 | 880.6 | 8.75 | 7.9 | MET | MET | MET | MET | MET |
| F | V1W | 948.3 | 960.65 | 12.35 | 10.1 | 295 | 2.1 | 3.56 | 5.02 | 0.05 |
| G | V1W | 941.8 | 955.3 | 13.5 | 11.7 | 101 | 1.47 | 2.33 | 4.52 | 0.18 |
| H | V1W | 1016.2 | 1033.15 | 16.95 | 15.4 | 115 | 1.67 | 3.03 | 7.54 | 0.31 |
| I | V1W | 1154.5 | 1157.2 | 2.7 | 2.1 | 118 | 0.06 | 2.1 | 6.91 | 0.5 |
| J | HW1 | 692 | 694.3 | 2.3 | 2.1 | 5 | 0.04 | 0 | 0.01 | 0 |
| K | HW1 | 644.6 | 646.8 | 2.2 | 2.1 | 66 | 0.03 | 0.01 | 0.02 | 0.01 |
| L | HW1 | 686 | 688.15 | 2.15 | 1.6 | 994 | 0.34 | 1.91 | 6.3 | 0.05 |
| M | HW1 | 717.55 | 720.15 | 2.6 | 2.1 | 40 | 0.05 | 0.03 | 0.14 | 0.02 |
| N | HW1 | 742 | 744.45 | 2.45 | 1.9 | 14 | 0.03 | 0.04 | 0.07 | 0.02 |
| O | HW1 | 857.5 | 859.8 | 2.3 | 1.7 | 4 | 0.03 | 0.01 | 0.06 | 0.01 |
| P | HW1 | 832.5 | 834.7 | 2.2 | 1.6 | 7 | 0.05 | 0.11 | 0.21 | 0.02 |
| Q | V2W | 720 | 722.1 | 2.1 | 2 | 4 | 0.02 | 0 | 0.02 | 0.01 |
| R | V2W | 855.65 | 859.15 | 3.5 | 3.2 | 217 | 0.31 | 0.66 | 1.53 | 0.04 |
| S | V2W | 838.05 | 847.2 | 9.15 | 9.1 | 885 | 1.65 | 2.4 | 1.98 | 0.18 |
| T | V2W | 848.25 | 854.7 | 6.45 | 6.4 | 616 | 1.91 | 2.55 | 1.81 | 0.37 |
| U | V2W | 880.6 | 885.5 | 4.9 | 4.6 | MET | MET | MET | MET | MET |
| V | V2W | 960.65 | 968.95 | 8.3 | 8.1 | 33 | 0.24 | 0.05 | 0.07 | 0.05 |
| W | V2W | 955.3 | 956.95 | 1.65 | 1.5 | 7 | 0.01 | 0.06 | 0.12 | 0.01 |
Notes: TW=True Width and is estimated from Sections, MET=metallurgical sampling.
Source: MAG Silver Corp.
| MAG Silver Juanicipio NI 43-101 Technical Report | |
| MAG Silver Corp. | 717002 |
| Figure 10.4 | Cross section through the Juanicipio vein system |

Source: MAG Silver Corp.
| MAG Silver Juanicipio NI 43-101 Technical Report | |
| MAG Silver Corp. | 717002 |
| 11 | Sample preparation, analyses, and security |
| 11.1 | Sample preparation and analysis |
| 11.1.1 | MAG Silver samples (2005) |
Technicians at MAG Silver’s core facility in Fresnillo split, sealed, and labelled samples into plastic sample bags. Batches of samples were packed in rice bags for shipment. Samples were then transported to BSI Inspectorate preparatory laboratory in Durango, Mexico, by courier. The preparatory laboratory crushed, split, and pulverized the subsamples. Pulps were then flown to Reno, Nevada, in the United Sates for analysis (Wetherup, 2006). No sample preparation was conducted by MAG Silver personnel, and the laboratories are independent of MAG Silver.
Samples were analyzed for silver, arsenic, antimony, copper, mercury, lead, and zinc by aqua regia digestion and flame atomic absorption analysis. A standard fire assay was used for gold. The procedures used by BSI Inspectorate and the detection limits of each method can be found in the appendix of Wetherup (2006).
| 11.1.2 | Fresnillo samples (2005-2016) |
Samples were shipped to the ALS Chemex preparatory laboratory in Guadalajara, Mexico, for preparation and pulps were then forwarded to ALS Chemex Assay Laboratory in Vancouver, Canada, for analysis. No sample preparation was conducted by Fresnillo personnel.
The ALS Chemex Vancouver laboratory is accredited to ISO 9001 by QMI-SAI Global and ISO 17025 by the Standards Council of Canada for a number of specific test procedures, including fire assay for gold with an atomic absorption and gravimetric finish, multi-element inductively coupled plasma optical emission spectroscopy (ICP-AES), and atomic absorption assays for silver, copper, lead, and zinc.
At ALS Chemex in Guadalajara, core samples were prepared using industry standard preparation procedures. After receipt, samples were organized into batches and weighed (method code LOG-22). Samples were then crushed to 70% passing below a two millimetre mesh screen (CRU-31). A subsample of up to 1,500 g was prepared using a riffle splitter (SPL-21) and pulverized to 85% passing below 75 µm (PUL-31).
Each sample was analyzed for a suite of elements including silver, lead, and zinc by ICP-AES analysis (method ME-ICP41m) and standard fire assay for gold (Au-AA23). In the case where the silver ICP-AES upper limit of 100 ppm was reached, the sample was tested using a gravimetric analysis method (Ag-GRA21).
In AMC’s opinion, the sample preparation and analysis procedures are adequate for use in the estimation of Mineral Resources. ALS Chemex is independent of MAG Silver.
| 11.2 | Quality assurance and quality control |
| 11.2.1 | Assay results of standards |
Various standards have been used on the Property, and consist of internal standards described below and commercially certified reference materials (CRM). Table 11.1 below lists the standards and CRMs utilized by Fresnillo from 2006 to December 2016. Note that the number of assays refers to all holes drilled on the Property, including those that were not used for estimation purposes.
Four internal standards were prepared in-house by Fresnillo from crushed (not pulverized) mineralization from one of its operations. These standards were assayed at ALS Chemex to determine the accepted assay values, but were not subjected to assay verification by multiple laboratories. By their nature, these four standards are not reliable, due to a lack of homogenization that can only be achieved by pulverization. The remaining standards are CRMs produced by CDN Resource Laboratories Ltd. (CRL).
| MAG Silver Juanicipio NI 43-101 Technical Report | |
| MAG Silver Corp. | 717002 |
| Table 11.1 | Internal standards and Certified Reference Material |
| Dates used | No of assays | CRM | Silver (g/t) | Comments |
| Jan 2006 - Sept 2010 | 41 | Baja Ley 219135 | 348 | Medium grade internal standard |
| Jan 2006 - Sept 2010 | 20 | 222544 | 2227* | High grade internal standard |
| Jan 2006 - Sept 2010 | 69 | 222542 | 2060 | High grade internal standard |
| Jan 2006 - Sept 2010 | 8 | 222546 | 7170 | High grade internal standard |
| Oct 2010 - Dec 2012 | 200 | CDN-ME-5 | 206 | Certified Reference Material from CRL |
| Jan 2013 - Nov 2014 | 275 | CDN-ME-1206 | 274 | Certified Reference Material from CRL |
| Nov 2014 - Sept 2015 | 181 | CDN-ME-1305 | 231 | Certified Reference Material from CRL |
| Sept 2015 – Dec 2016 | 343 | CDN-ME-1303 | 152 | Certified Reference Material from CRL |
| Total | 1058 | | | |
Note: *For standard 222544, the silver grade is an average of the Fresnillo assays, not the ALS Chemex result. The ALS Chemex number was not supplied in the provided data.
Source: AMC Mining Consultants (Canada) Ltd.
In the RPA 2014 Technical Report, results from five different standards for a total of 154 analyses were reviewed. The results were acceptable. AMC reviewed RPA’s report as well as plotted the results for silver, gold, lead, and zinc for CDN-ME-1305 and CDN-ME-1303, which covers the CRM analyses since the RPA report – see Table 11.2.
| Table 11.2 | Assay results of Certified Reference Material (November 2014 – December 2016) |
| CRM | Metal | Expected value | No of assays | Warnings | Fails |
| CDN-ME-1305 | Silver (g/t) | 231 | 181 | 10* | 1 |
| CDN-ME-1305 | Gold (g/t) | 1.92 | 181 | 9 | 1 |
| CDN-ME-1305 | Lead (%) | 3.21 | 181 | 18* | 8 |
| CDN-ME-1305 | Zinc (%) | 1.61 | 181 | 23* | 5 |
| CDN-ME-1303 | Silver (g/t) | 152 | 343 | 0 | 0 |
| CDN-ME-1303 | Gold (g/t) | 0.924 | 343 | 42* | 10 |
| CDN-ME-1303 | Lead (%) | 1.22 | 343 | 0 | 0 |
| CDN-ME-1303 | Zinc (%) | 0.931 | 343 | 33* | 7 |
*Includes consecutive warnings.
CDN-ME-1303 – most of the warnings and all of the fails on zinc were for underestimating the amount of zinc.
CDN-ME-1303 – most of the warnings on gold were for underestimating the amount of gold.
CDN-ME-1305 – most warnings for both lead and gold were for underestimating the metals. The fail for lead was mostly underestimating.
CDN-ME-1305 – most warning and fails for zinc were for underestimating the amount of zinc.
Figure 11.1 and Figure 11.2 show the results of the silver analysis for CDN-ME-1305 and CDN-ME-1303 respectively, as plotted from Table 11.2. The plotted results were acceptable despite a small bias high, but only one fail.
| MAG Silver Juanicipio NI 43-101 Technical Report | |
| MAG Silver Corp. | 717002 |
| Figure 11.1 | Control chart for CRM CDN-ME-1305 (silver) |
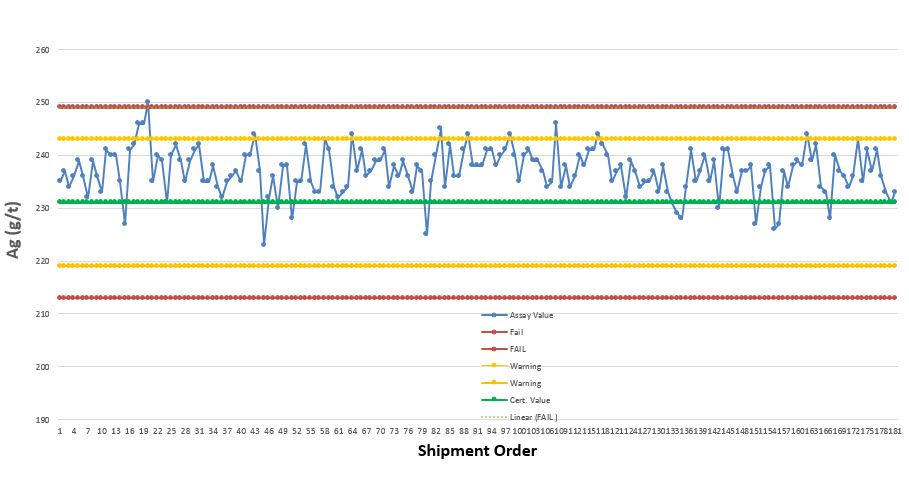
| Figure 11.2 | Control chart for CRM CDN-ME-1303 (silver) |
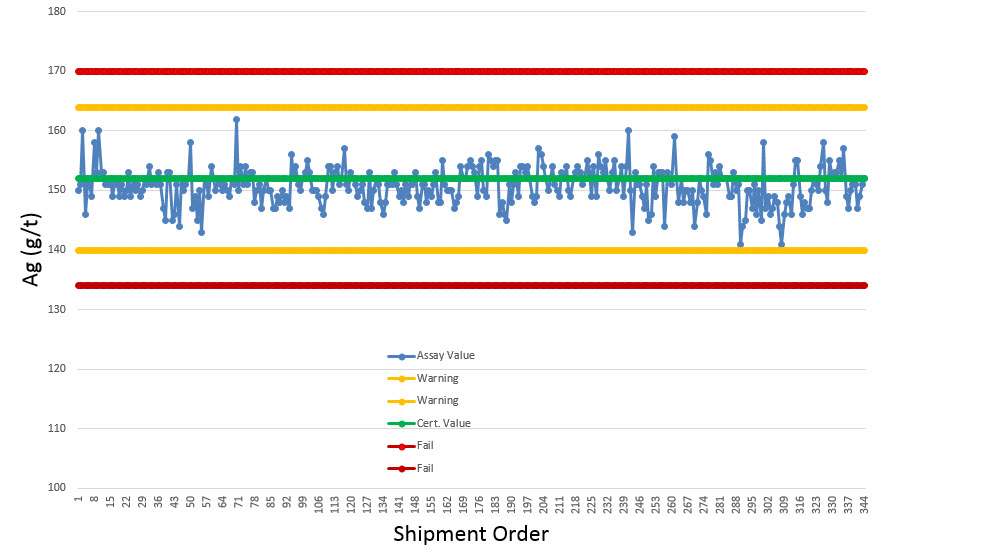
The insertion frequency of one CRM every 20 to 30 samples can result in some vein intersections remaining without any CRMs. Because of the procedure of one CRM being used at a given time and the incomplete coverage, the CRM results do not provide proof positive that the assays used for resource estimation are reliable; however, the available information does not indicate any major issues with the assay database of the Juanicipio project.
| MAG Silver Juanicipio NI 43-101 Technical Report | |
| MAG Silver Corp. | 717002 |
AMC recommends that three CRMs are used at one time, a low grade sample, a high grade sample, and a sample that represents the average grade of the deposit. AMC also recommends that CRMs be plotted and evaluated based on the stated certified assay.
| 11.2.2 | Assay results of blank samples |
Coarse blanks test for contamination during both the sample preparation and assay process. During the drilling performed between January 2006 and December 2016, 1,227 blanks composed of grey cement were inserted into the sample stream. Two cements have been used: “Cruz Azul Cement” and, currently, “Cementos Monterrey” is used.
In AMC’s opinion, the “pass” requirement for the blanks is that 80% of the coarse blank assays should be less than twice the detection limit for that element.
Table 11.3 shows the assay results for blank material from the Property.
| Table 11.3 | Assay results of blank material |
| | Total no of assays | Ag | Au | Pb | Zn |
| No Assays > fail | 1,227 | 731 | 30 | 1225 | 1226 |
| Fail Criteria (ppm) | | > 0.4 | >0.01 | > 4 | > 4 |
Note: Detection limit for silver = 0.2 ppm, gold= 0.005 ppm, lead= 2 ppm zinc= 2 ppm.
No Assays > fail, refers to the number of blank samples that assayed greater than 2 x the detection limit. “Fail criteria” is the level of the element which is considered failed. So for example if a blank assay is greater than 4 ppm lead, it has failed as a blank.
The large number of failures suggests that the blank material inherently contains low levels of silver, lead, and zinc. While it is preferable to use blanks containing no detectable trace of the key minerals identified within the mineral resource, in-house standards can be used. In-house blanks require their own QA / QC testing; typically, sampling should be undertaken at a minimum of three laboratories on a quarterly basis to ensure the blank material is of suitable quality. Alternatively, and only because of the high-grade nature of the deposit, AMC recommends that Fresnillo set an internal “fail” level on their blanks, above which assay batches are re-assayed. Currently, Fresnillo calculates the average grade of all blank assays and the two standard deviations. Graphs are then plotted. There is no procedure in place to re-assay batches when a blank fails.
AMC recommends that the in-house material be subjected to quarterly QA / QC testing.
Evaluating the blanks on a basis of the “average assay + 2 standard deviations” introduces an inherent circular argument where by a high assay then elevates the average acceptable grade of the blank. However, AMC notes that the amount of silver, gold, lead and zinc in the in-house blank is minimal and that when blanks are evaluated by this method nearly 90% of the data passed as shown in Table 11.4.
| Table 11.4 | Results of blank materials above two standard deviations |
| | No of assays | Ag (ppm) | Au (ppm) | Pb (ppm) | Zn (ppm) |
| Fresnillo average | 1227 | 1.17 | 0.01 | 54.62 | 294.44 |
| Ave+ 2STD Dev | 1227 | 4.97 | 0.05 | 228.09 | 916.55 |
| No assays > _2STD Dev | 1227 | 36 | 4 | 22 | 73 |
| % fail | | 3% | 0% | 2% | 6% |
AMC reviewed the charts for silver, gold, lead and zinc over time and notes that the blanks were elevated in lead and zinc and to a less extent silver earlier in the Property history. The unexpected high values for both lead and zinc suggests that the material submitted as blanks at that time was unacceptable. Recent results for lead and zinc are acceptable.
| MAG Silver Juanicipio NI 43-101 Technical Report | |
| MAG Silver Corp. | 717002 |
Figure 11.3 is the blank chart for silver. The chart shows the improvement of blank results over time.
| Figure 11.3 | Control chart for blank material (silver) |

* Shipment order approximates time.
| 11.2.3 | Assay results of duplicates |
Fresnillo does not collect duplicate data, but rather does umpire samples on mineralized material. See Section 11.2.4 below.
AMC recommends inclusion of mineralized crushed reject duplicated and field duplicates into the quality control program. In AMC’s opinion, duplicates should constitute around 5% of the samples submitted to the laboratory.
| 11.2.4 | Assay results of umpire data |
Fresnillo requests assay pulps from mineralized intercepts from ALS Chemex. The samples are quartered to generate two additional pulps that are sent to two different laboratories in Vancouver, Canada for re-assay. To date 1,364 pulps of the mineralized intercepts for the Valdecañas Vein have been sent to umpire labs. Umpire labs have been Acme Analytical Laboratories Ltd. (ACME), now BVMinerals IPL, and more recently SGS Minerals. All are accredited laboratories.
Figure 11.4 and Figure 11.5 show the control charts of silver for IPL and SGS.
| MAG Silver Juanicipio NI 43-101 Technical Report | |
| MAG Silver Corp. | 717002 |
| Figure 11.4 | Control chart for IPL versus ALS duplicates (silver) |
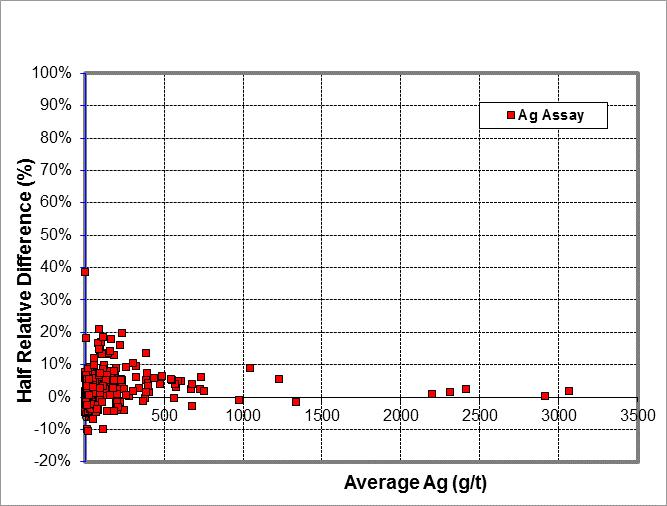
| MAG Silver Juanicipio NI 43-101 Technical Report | |
| MAG Silver Corp. | 717002 |
| Figure 11.5 | Control chart for SGS versus ALS duplicates (silver) |
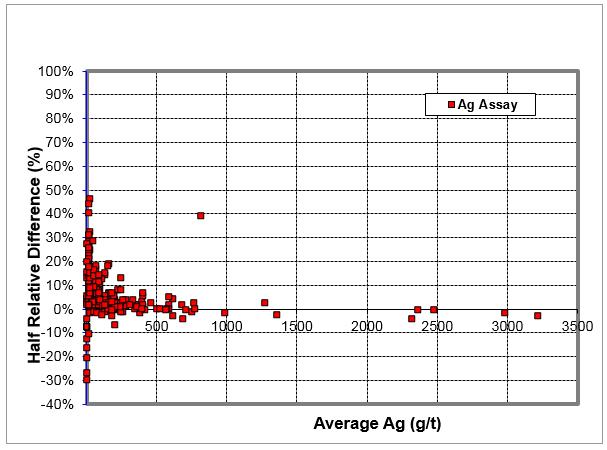
| 11.3 | Core storage and security |
Drill core from the Property was previously stored in two locations. Mineralized intercepts were stored in a locked shed located at the Fresnillo core handling facility near the Saucito mine site. Other core was stored alongside core from other Fresnillo projects in a large core storage facility located on Fresnillo’s private land near the Saucito mine shaft. All Juanicipio drill core has now been moved to a secure facility dedicated to Juanicipio drill core.
Split core that has been bagged and readied for shipment is securely stored in the dedicated facility prior to shipping.
In the opinion of the QP the sample preparation, security and analytical procedures are adequate and the data is fit for purpose.
| MAG Silver Juanicipio NI 43-101 Technical Report | |
| MAG Silver Corp. | 717002 |
As part of the data verification process the QP reviewed previous work. There have been several NI 43-101 reports on the Property, and for which various levels of data verification have been carried out. The sections below summarize the work carried out at the time of those reports. This is followed by a commentary from the AMC QP for this current report.
This summary is from information contained in the Valdecañas Project Scoping Study NI 43-101 Technical Report, Wardrop 2009 (Robertson et al, 2009).
At the time of MAG Silver transferring the data and the drill core to Fresnillo when the joint venture option agreement was signed. Fresnillo visually verified the electronic data for consistency and incorporated the data into its own internal project database.
Reference is made to the previous technical report (Wetherup, 2006) where validity of the original drill holes with external assay checks, blanks, standards, and duplicates was confirmed and SRK believed that these data were sufficiently reliable for use in the resource estimation.
Comments were also made on the practices implemented by Fresnillo to ensure the reliability and trustworthiness of exploration data acquired on the Property, and these field procedures were said to generally meet industry best practices.
SRK visited the Property in April 2007 during active drilling and a thorough review allowed for the QP to state that exploration data collected by MAG Silver and Fresnillo were acquired using procedures generally meeting industry best practices, and that the electronic data were reliable, appropriately documented, and exhaustive.
This summary is from information contained in the Mineral Resource estimate, Minera Juanicipio S.A. de C.V., Zacatecas, Mexico, the Strathcona 2011 Technical Report (Thalenhorst, 2011).
The QP observed core from 16 drill holes, and verified the existence of a few drill-hole markers on surface. The general reasonableness of the base metal assays received was assessed against the sphalerite and galena abundances, and the presence of acanthite or argentite was noted in some of the silver-rich core intervals. Based on these observations, independent check sampling was not deemed necessary.
There was also a comment on a conflict with the procedure and what was been done when determining bulk density values. This involved the systematic application of wax coating when using the water immersion method for the determinations. AMC understands that this comment had significance relative to the early drilling of the locally vuggy Bonanza mineralization. Current drilling is not encountering vuggy mineralization and a wax coating is not applied.
The information in the AMC 2012 Technical Report was the same as that above, as the QP for this section was the same author as for the Strathcona 2011 report. See Thomas et al. (2012) for further details.
This summary is extracted from the RPA 2014 Technical Report.
| MAG Silver Juanicipio NI 43-101 Technical Report | |
| MAG Silver Corp. | 717002 |
MAG Silver provided RPA a Dassault Systèmes GEOVIA GEMS (GEMS) project file containing updated drillhole database, core recovery and density measurement files. Wireframes models of the veins were provided in ARANZ Geo Limited’s Leapfrog software. Copies of the assay certificates were also provided.
The digital database was reviewed by RPA and verified during three site visits, and via a series of digital queries, checks of laboratory certificates, and review of Fresnillo’s QA / QC results. RPA also visually inspected the drillhole traces, performed GEMS database validation procedures, and reviewed the interpreted vein wireframe models.
RPA visited the Property on several occasions after the discovery of Juanicipio and Valdecañas vein systems. In December 2010, May 2011 and May 2014, drill core was reviewed and compared with assay results and descriptive log records were made by Fresnillo geologists. In addition to reviewing core, RPA examined outcrops, drill rigs, sampling procedures, and other general exploration protocols in use by the Joint Venture.
During the May 2011 visit, four samples of split core were selected randomly for duplicate analysis. This independent sampling by RPA confirmed that there is significant mineralization in the drillholes sampled.
Comparisons of database assay values against both digital and hardcopy results provided by ALS Chemex and BSI Inspectorate prior to and from 2011 were carried out and no significant discrepancies were found.
Again, in April 2014, RPA verified the silver, gold, lead, and zinc results for 663 samples from ten certificates of which 73 samples were located within the resource wireframes. In addition, RPA randomly selected ten of the highest-grade samples and verified analytical results. No discrepancies were found. RPA did observe, however, that the protocol for rounding a lead or zinc analytical result ending in “50” to the nearest hundred ppm was inconsistent.
AMC reviewed the processes used in the data collection and handling for 2015 / 2016 and undertook random cross-checks of assay results in the database with original assay results on the assay certificates returned from ALS Laboratory for the following metals: gold, silver, copper, lead and zinc. This verification consisted of comparing 638 of the 8,134 assays for the 2015-2016 drilling at Juanicipio (8%). Cross-checking the sample set of the database with the original assay results uncovered no material errors. This includes automatic verification by the software used. It was noted that there was an inconsistency as to whether an assay was rounded up or down.
In addition, verification was carried out using the normal routines in Datamine where the database was checked for collar, survey and assay inconsistencies, overlaps, and gaps.
The QP considers the database fit-for-purpose and, in the QP’s opinion, the geological data provided by MAG Silver for the purposes of Mineral Resource estimation were collected in line with industry best practice as defined in the CIM Exploration Best Practice Guideline and CIM Mineral Resource, Mineral Reserve Best Practice Guidelines. As such, the data are suitable for use in the estimation of Mineral Resources.
| MAG Silver Juanicipio NI 43-101 Technical Report | |
| MAG Silver Corp. | 717002 |
| 13 | Mineral processing and metallurgical testing |
| 13.1 | Metallurgical testing |
AMC has reviewed all the metallurgical test work reports to date; the most recent report issued provided information on a flotation and milling test work programme conducted during 2013. The metallurgical test work reports consisted of the following:
| · | The May 2008 Interim Report (Proyecto Juanicipio, 2008) describes the initial tests on samples from the Valdecañas Vein. |
| · | The June 2009 Final Report (Proyecto Juanicipio, 2009) describes additional tests from a more representative suite of samples from the Valdecañas Vein. |
| · | October 2013 - Proyecto Juanicipio 0023-OT10-015-13, Recovery of gold, silver, lead, and zinc. |
The May 2008 Interim Report included mineralogical characterization, basic work index determinations, and selective flotation tests for lead, zinc, and pyrite. The test work was carried out on an overall composite sample prepared from 79 individual samples obtained from 10 drill holes in the Valdecañas vein, as well as separate flotation test composites. Mineralogical examinations indicated that the mineral matrix is mainly composed of quartz, pyrite and calcite, with lead and zinc present as galena and sphalerite.
The most abundant silver species were sulphides, and in minor occurrences, native silver and electrum. The mineralogical texture is fine grained for all the silver species, so it was necessary to grind 80% to -40 µm to achieve an appropriate liberation for the flotation process. Even with this relatively fine particle size, a significant amount of gold and a smaller proportion of silver is found in pyrite, with particle sizes at around 5 µm. This supported the decision to also generate a pyrite concentrate to reduce the gold and silver deportment to tails.
The June 2009 Final Report was built on findings from the previous work and included additional test results on a more representative suite of samples from recent exploration. An overall composite was prepared from 190 m of mineralized intersections from 27 drill holes and in addition, four composites were prepared and subjected to flotation tests to determine any metallurgical variability across the mineralized zones.
The October 2013 report was based on test work conducted on 136 samples obtained from 24 drill holes from the Valdecañas vein. The test work was again aimed at further building on the data developed during the previous two test programs.The following work was covered in this third test program:
| · | Chemical analyses of head samples. |
| · | Mineralogical characterisation. |
| · | Liberation studies of the mineral species at a particle size of 80% passing 42 µm. |
| · | Selective flotation of lead, zinc, and pyrite in an open circuit under the operating conditions as defined in the first two stages of test work. |
| · | Locked cycle flotation tests. |
| · | Cyanidation test work of the pyrite concentrate. |
| · | Determination of ball mill working indexes. |
| · | Determination of gravity recoverable gold and silver. |
For the 2013 metallurgical test work, a single 50 kg composite sample was made up from the available core samples. The following procedure was used to prepare the sample:
| · | Mix each sample by passing it four times through a Jones sample splitter. |
| · | Obtain a weighted subsample based on thickness using a Jones sample splitter. |
| · | Collect all subsamples to form the general composite. |
| · | Set 10 kg apart for Work Index determinations. |
| MAG Silver Juanicipio NI 43-101 Technical Report | |
| MAG Silver Corp. | 717002 |
| · | Homogenize and form lots of 1 kg using a rotary splitter. |
| · | Pulverise at -200 nominal mesh for the head assay. |
| | |
| · | The remainder was used in flotation tests and to test gold and silver recoverable by gravimetry. |
The average composition of the samples used for the 2013 metallurgical test work is shown in Table 13.1. These values compare reasonably well with the average grades of all the drill core samples used to make up the composite sample for the test work programme.
| Table 13.1 | Metallurgical samples - head assay |
| Element | Unit | Grade |
| Au | g/t | 1.90 |
| Ag | g/t | 549 |
| Pb | % | 2.14 |
| Cd | % | 0.04 |
| Cu | % | 0.09 |
| Zn | % | 4.63 |
| Fe | % | 8.90 |
| Al | % | 1.44 |
| As | % | 0.37 |
| Ca | % | 5.05 |
| Si | % | 22.78 |
| C (Total) | % | 1.32 |
| S (Total) | % | 5.77 |
| Insoluble | % | 57.58 |
| 13.4 | Mineralogical characterization |
| 13.4.1 | Mineral composition and species distribution |
Table 13.2 shows the results of the 2013 mineral composition analysis and Table 13.3 shows the distribution by mineralogical species of gold, silver, lead, copper, zinc, and iron.
| MAG Silver Juanicipio NI 43-101 Technical Report | |
| MAG Silver Corp. | 717002 |
| Table 13.2 | Head sample - minerals composition |
| Minerals | Density (g/cm3) | Formula | Head grade |
| Sphalerite | 4.0 | (Zn,Fe)S | 9.34 |
| Galena | 7.4 | PbS | 2.34 |
| Chalcopyrite | 4.2 | CuFeS2 | 0.18 |
| Pyrite | 5.0 | FeS2 | 15.83 |
| Pyrrhotite | 4.6 | Fe1-xS | 1.08 |
| Arsenopyrite | 6.0 | FeAsS | 1.12 |
| Gold electrum | 12.2 | Au2Ag | <0.001 |
| Pyrargyrite | 5.8 | Ag3SbS3 | 0.05 |
| Argentite | 4.5 | Ag2S | 0.03 |
| Freibergite | 4.9 | (Ag,Cu,Fe,Zn)12(Sb,As)4S13 | 0.03 |
| Aguilarite | 7.5 | Ag4SeS | 0.001 |
| Native silver | 10.5 | Ag | 0.001 |
| Quartz | 2.7 | SiO2 | 47.69 |
| Calcite | 2.6 | CaCO3 | 5.86 |
| Orthoclase | 2.8 | KAlSi3O8 | 5.83 |
| Iron oxides | 5.5 | FexOy | 2.82 |
| Wollastonite | 3.4 | CaSiO3 | 2.32 |
| Chlorite | 4.0 | (AI,Mg,Fe)10(Si,AI)8O10 | 1.14 |
| Ankerite | 2.6 | Ca(Mg,Fe)(C03)2 | 1.09 |
| Fluorite | 2.6 | Ca5(PO4)3F | 1.25 |
| Muscovite | 3.6 | KAl2(Si3AI)O10(OH)2 | 0.51 |
| Albite | 3.0 | NaAlSiO8 | 0.38 |
| Andradite | 2.7 | Ca5Fe2(SiO4)3 | 0.36 |
| Other | --- | ---- | 0.75 |
Lead and zinc are only present as galena and sphalerite. Gold was only detected as electrum and the silver species were pyrargyrite, argentite, freibergite, aguilarite, and native silver. The gangue consists mainly of quartz, calcite, orthoclase, iron oxides, wollastonite, fluorite, chlorite, ankerite, and smaller amounts of other silicates.
| Table 13.3 | Elemental metal distribution by mineralogical species |
| Mineral | Weight % | Au (%) | Ag (%) | Pb (%) | Cu (%) | Zn (%) | Fe (%) |
| Galena | 2.35 | | | 100 | | | |
| Sphalerite | 9.34 | | | | | 100 | 6 |
| Chalcopyrite | 0.18 | | | | 92 | | 0.43 |
| Pyrite | 15.82 | | | | | | 66.6 |
| Pyrrhotite | 1.08 | | | | | | 5 |
| Arsenopyrite | 1.12 | | | | | | 3 |
| Gold electrum | <0.001 | 100 | <0.05 | | | | 0.01 |
| Native silver | <0.01 | | 2 | | | | 19 |
| Argentite | 0.03 | | 34 | | | | |
| Freibergite | 0.03 | | 12 | | 8 | | |
| Pyrargyrite | 0.05 | | 50 | | | | |
| Aguilarite | <0.01 | | 2 | | | | |
| Gangue | 70 | | | | | | |
| Total | 100 | 100 | 100 | 100 | 100 | 100 | 100 |
| MAG Silver Juanicipio NI 43-101 Technical Report | |
| MAG Silver Corp. | 717002 |
Mineral liberation studies indicate that:
| · | At a P80 of 42 µm, the degree of liberation observed for various minerals was: |
| · | Liberation of silver species was around 62% |
| · | Non-sulphurous gangue liberation was 95% |
The most important binary associations were:
| · | Galena: 7% associated with gangue, 3% with sphalerite, and 2% with pyrite. |
| · | Sphalerite: 11% associated with gangue, 3% with galena, 3% with pyrite, and 3% with pyrrhotite. |
| · | Chalcopyrite: 16% associated with sphalerite, 5% with pyrite, 4% with gangue, and 3% with silver species. |
| · | Silver species: 11% associated with pyrite, 8% with sphalerite, 6% with gangue, and 5% with galena. |
Gold was found as electrum particles, but also associated mainly with pyrite particles, both in the edges of particles and as inclusion in the particles.
For the 2013 test work, 17 selective flotation lead-zinc-pyrite tests were conducted in open circuit configuration, using the composite sample. The tests were performed in accordance with the reagent regime and flowchart established in previous experimental stages and with a grind P80 of 42 µm. The production of a pyrite concentrate was aimed at the recovery of finely disseminated gold and silver particles in the pyrite of the Juanicipio ore. The pyrite concentrate was subjected to cyanidation to evaluate gold and silver recoveries. The presence of small quantities of native gold and silver particles also encouraged testing gravimetric separation of the gold and silver prior to the flotation circuit.
To take account of recycle streams, further locked cycle tests were also conducted with the composite ore sample.
| 13.5.1 | Open circuit flotation test work |
Test work conditions selected were:
| · | Lead flotation: Operate at pH 8 to 8.5 by adding zinc sulphate combined with sodium cyanide, sodium metabisulphite, lime and sodium carbonate during grinding to depress sphalerite, pyrite, as well as cleaning surfaces and promote the flotation of metallic gold and silver. Aerofloat 31 promoter was added due to the presence of native silver and electrum, with Aerophine A-3418 added as a gold-silver-lead collector to maintain selectivity against pyrite, pyrrhotite and sphalerite. The lead concentrate was cleaned three times. |
| · | Zinc flotation: Copper sulphate was added to activate sphalerite and Aerophine A-3418 as a collector at pH about 10.5 and the concentrate was cleaned four times. |
| · | Pyrite flotation: Ammonium potassium xanthate was dosed as a collector and the pyrite concentrate was cleaned twice. |
Tests 1 to 5 were focused on selectively floating lead-zinc under operating conditions relatively similar to the previous test work programmes to reproduce results. The results of tests 1 to 5 are shown in Table 13.4 to Table 13.7.
| MAG Silver Juanicipio NI 43-101 Technical Report | |
| MAG Silver Corp. | 717002 |
| Table 13.4 | Tests 1 to 5 - calculated head grades |
| Test no | Au (g/t) | Ag (g/t) | Pb (%) | Zn (%) | Cu (%) | Fe (%) |
| 1 | 1.9 | 533 | 2.09 | 4.54 | 0.09 | 9.90 |
| 2 | 2.0 | 532 | 2.03 | 4.44 | 0.08 | 9.40 |
| 3 | 1.8 | 542 | 2.07 | 4.58 | 0.08 | 9.40 |
| 4 | 2.0 | 543 | 2.14 | 4.57 | 0.11 | 9.30 |
| 5 | 2.0 | 543 | 2.14 | 4.61 | 0.10 | 9.80 |
| Average | 1.9 | 539 | 2.10 | 4.55 | 0.10 | 9.50 |
| Table 13.5 | Tests 1 to 5 - Pb concentrate grades and recoveries |
| | Grade | Recovery |
| Test no | P80(µm) | % Weight | Au (g/t) | Ag (g/t) | Pb (%) | Zn (%) | Cu (%) | Fe (%) | Au (%) | Ag (%) | Pb (%) | Zn (%) | Cu (%) | Fe (%) |
| 1 | 42 | 3.76 | 30.6 | 10,434 | 48.8 | 5.9 | 0.70 | 11.5 | 60.2 | 73.6 | 87.8 | 5.7 | 28.2 | 4.4 |
| 2 | 42 | 2.73 | 40.8 | 11,377 | 60.9 | 5.6 | 0.24 | 5.7 | 54.7 | 58.5 | 82.1 | 3.4 | 7.7 | 1.7 |
| 3 | 42 | 3.15 | 33.6 | 11,196 | 58.5 | 6.1 | 0.23 | 7.2 | 59.2 | 64.9 | 85.7 | 4.2 | 9.0 | 2.4 |
| 4 | 42 | 3.89 | 33.6 | 10,911 | 48.7 | 7.3 | 0.75 | 9.9 | 65.1 | 78.2 | 88.3 | 6.2 | 27.3 | 4.1 |
| 5 | 42 | 3.90 | 29.9 | 10,809 | 50.4 | 7.1 | 0.87 | 9.7 | 61.6 | 76.8 | 90.6 | 6.0 | 32.5 | 3.9 |
| Average | | 3.49 | 33.7 | 10,945 | 53.5 | 6.4 | 0.56 | 8.8 | 60.1 | 70.4 | 86.9 | 5.1 | 20.9 | 3.3 |
| Table 13.6 | Tests 1 to 5 - Zn concentrate grades and recoveries |
| | Grade | Recovery |
| Test no | P80(µm) | % Weight | Au (g/t) | Ag (g/t) | Pb (%) | Zn (%) | Cu (%) | Fe (%) | Au (%) | Ag (%) | Pb (%) | Zn (%) | Cu (%) | Fe (%) |
| 1 | 42 | 6.65 | 1.3 | 400 | 0.34 | 49.4 | 0.43 | 12.9 | 4.5 | 5.0 | 1.1 | 72.4 | 30.6 | 8.6 |
| 2 | 42 | 7.27 | 1.6 | 591 | 0.50 | 49.8 | 0.42 | 11.3 | 5.5 | 8.1 | 1.8 | 81.5 | 36.3 | 8.7 |
| 3 | 42 | 7.91 | 1.2 | 562 | 0.50 | 49.6 | 0.45 | 12.0 | 5.1 | 8.2 | 1.9 | 85.6 | 43.1 | 10.1 |
| 4 | 42 | 7.54 | 1.3 | 394 | 0.39 | 50.4 | 0.44 | 12.0 | 4.8 | 5.5 | 1.4 | 83.2 | 31.3 | 9.8 |
| 5 | 42 | 7.56 | 1.5 | 499 | 0.36 | 50.8 | 0.50 | 11.8 | 5.9 | 6.9 | 1.2 | 83.3 | 35.7 | 9.1 |
| Average | | 7.39 | 1.4 | 489 | 0.42 | 50.0 | 0.45 | 12.0 | 5.2 | 6.7 | 1.5 | 81.2 | 35.4 | 9.3 |
| Table 13.7 | Tests 1 to 5 - tails grades and recoveries |
| | Grade | Recovery |
| Test no | P80(µm) | % Weight | Au (g/t) | Ag (g/t) | Pb %) | Zn (%) | Cu (%) | Fe (%) | Au (%) | Ag (%) | Pb (%) | Zn (%) | Cu (%) | Fe (%) |
| 1 | 42 | 78.42 | 0.73 | 55 | 0.09 | 0.08 | 0.02 | 8.5 | 20.5 | 8.1 | 3.5 | 1.4 | 14.3 | 67.6 |
| 2 | 42 | 80.56 | 0.73 | 73 | 0.14 | 0.14 | 0.01 | 8.8 | 28.9 | 11.1 | 5.6 | 2.4 | 12.5 | 75.9 |
| 3 | 42 | 81.21 | 0.62 | 75 | 0.15 | 0.15 | 0.01 | 9.0 | 28.2 | 11.3 | 5.7 | 2.6 | 12.9 | 77.8 |
| 4 | 42 | 82.77 | 0.59 | 64 | 0.11 | 0.10 | 0.03 | 8.6 | 24.3 | 9.7 | 4.4 | 1.8 | 20.9 | 76.9 |
| 5 | 42 | 83.59 | 0.65 | 77 | 0.12 | 0.14 | 0.03 | 9.3 | 28.7 | 11.8 | 4.5 | 2.5 | 20.0 | 79.6 |
| Average | | 81.31 | 0.66 | 69 | 0.12 | 0.12 | 0.02 | 8.9 | 26.1 | 10.4 | 4.7 | 2.1 | 16.1 | 75.6 |
Tests 6 and 13 included flotation of pyrite, with tests 7 to 12 and 14 to 17 performed to generate pyrite concentrate for cyanidation tests and not reported separately. The results for tests 6 and 13 are shown in Table 13.8 to Table 13.12.
| MAG Silver Juanicipio NI 43-101 Technical Report | |
| MAG Silver Corp. | 717002 |
| Table 13.8 | Tests 6 and 13 - calculated head grades |
| Test no | Au (g/t) | Ag (g/t) | Pb (%) | Zn (%) | Cu (%) | Fe (%) |
| 6 | 1.91 | 533 | 2.09 | 4.54 | 0.09 | 9.9 |
| 13 | 2.04 | 532 | 2.03 | 4.44 | 0.08 | 9.4 |
| Average | 1.97 | 532 | 2.06 | 4.49 | 0.09 | 9.6 |
| Table 13.9 | Tests 6 and 13 - Pb concentrate grades and recoveries |
| | Grade | Recovery |
| Test no | P80(µm) | % Weight | Au (g/t) | Ag (g/t) | Pb (%) | Zn (%) | Cu (%) | Fe (%) | Au (%) | Ag (%) | Pb (%) | Zn (%) | Cu (%) | Fe (%) |
| 6 | 42 | 3.13 | 35.9 | 11,816 | 55.3 | 6.8 | 0.58 | 7.9 | 57.6 | 69.4 | 87.6 | 4.6 | 18.7 | 2.6 |
| 13 | 42 | 3.36 | 36.1 | 12,520 | 52.8 | 6.7 | 0.90 | 7.6 | 65.3 | 77.3 | 83.9 | 4.9 | 37.8 | 3.6 |
| Average | | 3.25 | 36.0 | 12,168 | 54.1 | 6.7 | 0.74 | 7.7 | 61.5 | 73.4 | 85.8 | 4.7 | 28.2 | 3.1 |
| Table 13.10 | Tests 6 and 13 - Zn concentrate grades and recoveries |
| | Grade | Recovery |
| Test no | P80(µm) | % Weight | Au (g/t) | Ag (g/t) | Pb (%) | Zn (%) | Cu (%) | Fe (%) | Au (%) | Ag (%) | Pb (%) | Zn (%) | Cu (%) | Fe (%) |
| 6 | 42 | 7.21 | 1.1 | 419 | 0.26 | 53.4 | 0.45 | 11.0 | 3.9 | 5.7 | 0.9 | 83.0 | 33.3 | 8.5 |
| 13 | 42 | 5.92 | 1.3 | 409 | 0.46 | 52.3 | 0.37 | 10.0 | 4.0 | 4.5 | 1.3 | 67.4 | 26.2 | 7.3 |
| Average | | 6.57 | 1.2 | 414 | 0.36 | 52.8 | 0.41 | 10.5 | 4.0 | 5.1 | 1.1 | 75.2 | 29.8 | 7.9 |
| Table 13.11 | Tests 6 and 13 - Pyrite concentrate grades and recoveries |
| | Grade | Recovery |
| Test no | P80(µm) | % Weight | Au (g/t) | Ag (g/t) | Pb (%) | Zn (%) | Cu (%) | Fe (%) | Au (%) | Ag (%) | Pb (%) | Zn (%) | Cu (%) | Fe (%) |
| 6 | 42 | 12.66 | 2.60 | 366 | 0.27 | 0.35 | 0.05 | 40.0 | 16.8 | 8.7 | 1.7 | 1.0 | 6.6 | 54.3 |
| 13 | 42 | 11.22 | 2.80 | 336 | 0.36 | 0.48 | 0.03 | 33.9 | 16.6 | 6.9 | 1.9 | 1.2 | 4.3 | 47.2 |
| Average | | 11.94 | 2.70 | 351 | 0.31 | 0.41 | 0.04 | 36.9 | 16.7 | 7.8 | 1.8 | 1.1 | 5.4 | 50.7 |
| Table 13.12 | Tests 6 and 13 - Tails grades and recoveries |
| | Grade | Recovery |
| Test no | P80(µm) | % Weight | Au (g/t) | Ag (g/t) | Pb (%) | Zn (%) | Cu (%) | Fe (%) | Au (%) | Ag (%) | Pb (%) | Zn (%) | Cu (%) | Fe (%) |
| 6 | 42 | 68.20 | 0.16 | 10 | 0.07 | 0.05 | 0.01 | 2.9 | 5.6 | 1.3 | 2.5 | 0.8 | 8.4 | 21.2 |
| 13 | 42 | 69.31 | 0.16 | 12 | 0.10 | 0.07 | 0.07 | 3.1 | 6.0 | 1.5 | 3.1 | 1.0 | 7.5 | 26.3 |
| Average | | 68.76 | 0.16 | 11 | 0.08 | 0.06 | 0.04 | 3.0 | 5.8 | 1.4 | 2.8 | 0.9 | 7.9 | 23.8 |
From the test results, it is considered feasible to achieve recoveries of around 65% of the gold in feed to the final lead concentrate, producing a gold grade of around 34 g/t. Similarly, it is considered viable to recover about 78% of the silver to the lead concentrate at a grade of around 11,000 g/t.
Lead recovery to the lead concentrate was just below 90%, with the lead grades at about 53%. Further efforts at optimization of the lead concentrate grade should be undertaken, aimed at improving grades without impacting on recoveries. Generally, higher grades could demand higher premiums for the concentrate when sold to smelter operations for further processing.
| MAG Silver Juanicipio NI 43-101 Technical Report | |
| MAG Silver Corp. | 717002 |
Zinc recovery to the zinc concentrate was around 86% with grades at about 50%. Typically, recovery will decrease if grades are increased; however, further optimization of the grade vs. recovery equation may still be possible and should be further investigated.
The pyrite concentrate of Test 6 achieved a reasonable iron grade (40%), with 54% recovery of the iron. 17% gold recovery and 9% silver recovery were also significant at respective grades of 2.6 g/t and 366 g/t. During Test 13, gold, silver, and iron recoveries to the lead concentrate were higher, resulting in lower grades in the pyrite concentrate. This may indicate that optimization of the lead flotation circuit could result in lower values reporting to the pyrite concentrate. This should be further investigated, as the pyrite flotation circuit will impact both on capital and operating costs.
| 13.5.2 | Locked cycle flotation test work |
To evaluate the impact of recycle streams on the overall flotation grades and recoveries, a five-cycle locked cycle test was conducted, with the configuration of the flotation circuit shown in Figure 13.1.
Lead circuit:
| · | Primary lead rougher flotation, with resulting concentrate going through three stages of cleaning with the tails of each cleaner stage recycled to the preceding stage of the next cycle (e.g. Cleaner 2 Cycle 1 tails will go Cleaner 1 of Cycle 2). |
| · | Rougher tails to a secondary rougher or scavenger, with the concentrate recycled to the Primary Rougher stage of the following cycle, where it is combined with the feed of the next cycle. |
Zinc circuit:
| · | Primary zinc rougher flotation, with the resulting concentrate going through four stages of cleaning with tails of each cleaner stage recycled to the preceding stage of the next cycle (e.g. Cleaner 2 Cycle 1 tails will go Cleaner 1 of Cycle 2). |
| · | Rougher tails to a secondary rougher or scavenger, with the concentrate recycled to the Primary Rougher stage of the following cycle, where it is combined with the feed of the next cycle. |
Pyrite circuit:
| · | Primary pyrite rougher flotation, with the resulting concentrate going through two stages of cleaning with the tails of each cleaner stage recycled to the preceding stage of the next cycle (e.g. Cleaner 2 Cycle 1 tails will go Cleaner 1 of Cycle 2). |
| · | Rougher tails to a secondary rougher or scavenger, with the concentrate recycled to the Primary Rougher stage of the following cycle, where it is combined with the feed of the next cycle. |
| MAG Silver Juanicipio NI 43-101 Technical Report | |
| MAG Silver Corp. | 717002 |
| Figure 13.1 | Lead flotation locked cycle test work flowsheet |
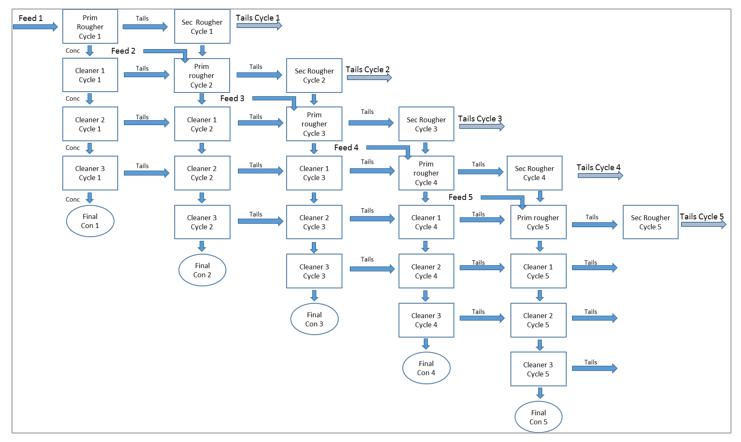
The mass balance resulting from the locked cycle test work demonstrated the following:
| · | It was possible to stabilize lead, zinc and pyrite concentrate recoveries and grades with some adjustments to the reagents and operating regime. It was found that these are within the ranges expected for typical operations. |
| · | Gold and silver recoveries and grades also stabilized in the lead and pyrite concentrate. However, significant losses to tails were still recorded due to the presence of fine gold- and silver-bearing particles. It was observed that these particles appear to concentrate in the scavenger circuit after several cycles before being rejected into tails. In the mass balance, it was observed that the last cycles recorded the highest gold and silver assays. |
| · | Calculated head grades were very close to the analysed values. |
The metallurgical mass balance for the flotation circuit is shown in Table 13.13.
| Table 13.13 | Flotation circuit metallurgical balance |
| | | Grades | Distribution |
| Product | % weight | Au (g/t) | Ag (g/t) | Pb (%) | Zn (%) | Cu (%) | Fe (%) | Insols (%) | Au (%) | Ag (%) | Pb (%) | Zn (%) | Cu (%) | Fe (%) | Insols (%) |
| Pb concentrate | 4.02 | 30.68 | 11,156 | 49.4 | 6.1 | 0.8 | 9.5 | 4.9 | 65.2 | 80.1 | 92.8 | 5.3 | 38.4 | 4.3 | 0.4 |
| Zn concentrate | 8.24 | 1.14 | 459 | 0.4 | 50.5 | 0.4 | 10.9 | 1.5 | 4.9 | 6.8 | 1.5 | 89.8 | 43.9 | 10.1 | 0.2 |
| Pyrite concentrate | 14.80 | 2.83 | 376 | 0.3 | 1.0 | 0.0 | 35.0 | 6.5 | 22.1 | 9.9 | 1.9 | 3.0 | 7.3 | 58.1 | 1.7 |
| Tails | 72.94 | 0.20 | 24 | 0.1 | 0.1 | 0.0 | 3.4 | 73.6 | 7.8 | 3.2 | 3.8 | 1.9 | 10.4 | 27.5 | 97.7 |
| Calculated head grade | 100 | 1.89 | 560 | 2.14 | 4.63 | 0.08 | 8.9 | 55 | 100 | 100 | 100 | 100 | 100 | 100 | 100 |
| Head assays | | 1.9 | 549 | 2.14 | 4.63 | 0.09 | 8.9 | 57.6 | | | | | | | |
| MAG Silver Juanicipio NI 43-101 Technical Report | |
| MAG Silver Corp. | 717002 |
The following observation are made:
| · | Concentrate grades are aligned to the test results achieved during the open circuit tests. |
| · | Gold recovery to the lead concentrate was 65.2%. |
| · | Silver, lead, and copper recoveries to lead concentrate were 80.1%, 92.8%, and 38.4%, respectively. |
| · | Gold, silver, copper, and zinc recoveries to the zinc concentrate were 4.9%, 6.8%, 43.9%, and 89.8%, respectively. |
| · | Gold, silver, and iron recoveries to pyrite concentrate were 22.1%, 9.9%, and 58.1% respectively. |
| · | Metal grades observed in the final tails stream were 0.2 g/t gold, 24 g/t silver, 0.11% lead, 0.01% copper, and 0.11% zinc. |
| 13.6 | Cyanidation of pyrite concentrate |
As the previous test work programs had indicated significant recovery of both gold and silver to a pyrite concentrate, cyanidation test work was undertaken during this programme to confirm recovery of gold and silver from the concentrate. Tests were conducted over 120 hours with the cyanide concentration monitored and controlled at 5 g/L and the pH of the leach slurry adjusted with lime to between 10.5 and 12.0.
The test results indicated the following:
| · | Cyanidation without regrind: 16% of the gold and 47% of the silver were recovered. Copper, zinc, and iron recovery was around 62%, 34%, and 0.1% respectively, which may indicate an excess of cyanide. Cyanide and lime consumption were 9 kg/t and 7 kg/t respectively. |
| · | Cyanidation with regrind to 5 µm and 72 hours of agitation: Recoveries averaged 51% for gold and 79% for silver. Copper, zinc, and iron recoveries increased to 72%, 42%, and 0.3%, with the consumption of cyanide and lime at around 17 kg/t and 16 kg/t respectively. |
| · | Cyanidation with regrind to 5 µm and 120 hours of agitation: Average recoveries increased slightly to 53% for gold and 81% for silver. The copper and zinc recoveries also increased slightly to 73% and 45% respectively, and the iron recovery remained unchanged. The consumption of cyanide and lime was 16 kg/t and 32 kg/t respectively. |
| · | On average, gold and silver recoveries with a regrind of the concentrate to 5 µm were 52% for gold and 80% for silver, and tails contained an average of 1.28 g/t gold and 73 g/t silver, with the best recoveries achieved after 120 hours of agitated cyanide leaching. |
| 13.7 | Gravity recoverable gold and silver |
Preliminary tests were carried out to determine if some of the gold and silver is recoverable by gravity with particle sizes of 80% passing 89 µm, 65 µm, and 42 µm. A laboratory scale Knelson concentrator was used during this test work, requiring a 1 kg head sample. A summary of results is shown in Table 13.14.
| Table 13.14 | Gravity recoverable gold and silver test results |
| | | Knelson concentrate | Knelson tails | Calculated head | Recovery to conc. | Tails distribution |
| Test no | P80(µm) | % Weight | Au (g/t) | Ag (g/t) | Au (g/t) | Ag (g/t) | Au (g/t) | Ag (g/t) | Au (%) | Ag (%) | Au (%) | Ag (%) |
| 1 | 42 | 5.0 | 17.0 | 2,799 | 1.51 | 462 | 2.29 | 580 | 37.0 | 24 | 63.0 | 76 |
| 2 | 65 | 9.3 | 6.6 | 2,040 | 1.10 | 411 | 1.61 | 562 | 38.0 | 34 | 62.0 | 66 |
| 3 | 89 | 8.2 | 6.1 | 1,970 | 1.30 | 452 | 1.69 | 577 | 30.0 | 28 | 70.0 | 72 |
It is observed that the best gold and silver concentrate grades were obtained at a finer grind, reaching 17 g/t for gold and 2,799 g/t for silver.
The results confirm the presence of metallic gold and silver and indicate that there is good potential to recover both gold and silver by gravity. The potential benefit of a gravity circuit will be impacted by the efficiency of the flotation circuit, as well as the size and quantity of gold and silver particles.
| MAG Silver Juanicipio NI 43-101 Technical Report | |
| MAG Silver Corp. | 717002 |
More extensive test work should be conducted to enable an objective evaluation of the benefits of a gravity circuit. Such work could improve the project economics due to improved payment terms if a gold and silver concentrate could be produced and sold, or alternatively, a separate leach and precious metal recovery circuit could be installed to produce doré bar. If successful, the benefit of a pyrite flotation circuit is likely to also be reduced, which may lead to capital cost savings as well as a reduction in ongoing operating costs.
| 13.8 | Ball mill work indexes |
The Ball Mill Working Index (BWi) was determined to be 18.07 kWh/t, which is slightly higher than the average value shown in the May 2008 report, which was 17.4 kWh/t.
| 13.9 | Metal recoveries and concentrate grade |
AMC has adopted the metal recoveries and concentrate grades as summarized in Table 13.15 for this PEA.
| Table 13.15 | Metal recovery and concentrate grade |
| Product | Grade (%) | Au recovery | Ag recovery | Pb recovery | Zn recovery |
| Pb concentrate | 43 | 65.2 | 80.1 | 92.8 | |
| Zn concentrate | 52 | 4.9 | 6.8 | | 89.8 |
| Pyrite concentrate | 35 | 11.5 | 7.9 | | |
| Total recovery (%) | | 81.6 | 94.8 | 92.8 | 89.8 |
| MAG Silver Juanicipio NI 43-101 Technical Report | |
| MAG Silver Corp. | 717002 |
| 14 | Mineral Resource estimates |
The Mineral Resources for the Juanicipio deposit have been estimated by Dr Adrienne Ross, P.Geo., of AMC, who takes responsibility for these estimates.
AMC is not aware of any known environmental, permitting, legal, title, taxation, socioeconomic, marketing, political, or other similar factors that could materially affect the stated Mineral Resource estimates.
The estimate is dated 21 October 2017 and supersedes the previous estimate outlined in the “Technical Report on the Mineral Resource Update for the Juanicipio Joint Venture, Zacatecas State, Mexico” dated 30 June 2014, (RPA 2014 Technical Report). The previous estimate had an effective date of 31 December 2013 and included drilling to 31 December 2013.
The data used in the 21 October 2017 estimate includes results of all drilling carried out on the Property to 31 December 2016.
The estimation was carried out in Datamine™ software. Interpolation was carried out using ordinary kriging (OK) for all the mineralized domains.
The result of the current estimate is summarized in Table 14.1 and expanded in Table 14.2.
| Table 14.1 | Summary of Global Mineral Resources as of 21 October 2017 |
| Resource Category | Tonnes (Mt) | Ag (g/t) | Au (g/t) | Pb (%) | Zn (%) | Cu (%) | Metal contained in Resource |
| Ag (Moz) | Au (koz) | Pb (Mlbs) | Zn (Mlbs) | Cu (Mlbs) |
| Indicated | 12.83 | 427 | 2.10 | 2.11 | 3.68 | 0.13 | 176 | 867 | 598 | 1041 | 38 |
| Inferred | 12.13 | 232 | 1.44 | 2.46 | 4.68 | 0.27 | 91 | 562 | 658 | 1252 | 71 |
Notes: CIM Definition Standards were used for reporting the Mineral Resources.
Refer to Table 14.2 for prices and NSR cut-off.
Drilling results up to 31 December 2016.
The numbers may not compute exactly due to rounding.
Source: AMC Mining Consultants (Canada) Ltd.
| MAG Silver Juanicipio NI 43-101 Technical Report | |
| MAG Silver Corp. | 717002 |
| Table 14.2 | Mineral Resources as of 21 October 2017 by vein |
| Resource Category | Vein | Tonnes (Mt) | Ag (g/t) | Au (g/t) | Pb (%) | Zn (%) | Cu (%) | Metal Contained in Resource |
| Ag (Moz) | Au (koz) | Pb (Mlbs) | Zn (Mlbs) | Cu (Mlbs) |
| Indicated | V1E | 6.35 | 528 | 1.86 | 1.89 | 3.81 | 0.09 | 108 | 379 | 264 | 533 | 12 |
| V1W | 6.48 | 327 | 2.35 | 2.34 | 3.55 | 0.18 | 68 | 488 | 334 | 507 | 26 |
| | Total Indicated | 12.83 | 427 | 2.10 | 2.11 | 3.68 | 0.13 | 176 | 867 | 598 | 1041 | 38 |
| Inferred | V1E | 3.18 | 121 | 0.95 | 2.14 | 3.60 | 0.54 | 12 | 97 | 150 | 253 | 38 |
| V1W | 3.74 | 155 | 1.88 | 3.18 | 5.97 | 0.26 | 19 | 226 | 262 | 492 | 21 |
| HW | 0.25 | 529 | 0.59 | 0.52 | 0.89 | 0.03 | 4 | 5 | 3 | 5 | 0 |
| VANT | 2.06 | 111 | 1.39 | 3.50 | 7.41 | 0.18 | 7 | 92 | 159 | 337 | 8 |
| V2W (a) | 0.61 | 330 | 1.37 | 2.44 | 3.41 | 0.14 | 7 | 27 | 33 | 46 | 2 |
| V2W (b) | 1.01 | 659 | 0.64 | 1.23 | 2.72 | 0.05 | 21 | 21 | 27 | 60 | 1 |
| JV1 | 0.58 | 260 | 3.74 | 0.35 | 0.82 | 0.03 | 5 | 70 | 5 | 11 | 0 |
| JV2 | 0.70 | 678 | 1.07 | 1.29 | 3.18 | 0.04 | 15 | 24 | 20 | 49 | 1 |
| | Total Inferred | 12.13 | 232 | 1.44 | 2.46 | 4.68 | 0.27 | 91 | 562 | 658 | 1252 | 71 |
Notes: CIM Definition Standards were used for reporting the Mineral Resources.
Mineral Resources are estimated at a resource NSR cut-off value of $55 per tonne.
Resource NSR values are calculated in US$ using factors of $0.61 per g/t Ag, $34.27 per g/t Au, $19.48 per % Pb, and $19.84 per % Zn. These factors are based on metal prices of $20/oz Ag, $1,300/oz Au $0.95/lb Pb, and $1.00/lb Zn and estimated recoveries of 82% Au, 95% Ag, 93% Pb, 90% Zn. The Mineral Resource NSR does not include offsite costs.
Valdecañas Vein System: V1W=Valdecañas West, V1E= Valdecañas East, V2W= footwall splay off V1W, VANT= Anticipada Vein, HW1=Hangingwall Vein; Juanicipio Vein System: JV1/JV2.
Drilling results up to 31 December 2016.
The numbers may not compute exactly due to rounding.
Source: AMC Mining Consultants (Canada) Ltd.
The Valdecañas vein system displays the vertical grade transition from upper silver-rich zones to deep base metal dominant areas that is typical of Fresnillo District veins and epithermal silver veins in general. The Mineral Resource estimate was manually divided into the Bonanza Grade Silver (BGS) Zone and the Deep Zone to reflect this vertical metal zonation and highlight the definition of the Deep Zone. Parts of the Juanicipio vein are included in the BGS Zone as well as the silver-rich portions of the other veins. The BGS Zone terminology was used in the previous report and is kept for continuity. The Mineral Resources by BGS and Deep Zone division are shown in Table 14.3.
| Table 14.3 | Mineral Resource by metal zone 1 September 2017 |
| Zone | Resource Category | Tonnes (Mt) | Ag (g/t) | Au (g/t) | Pb (%) | Zn (%) | Cu (%) | Ag (Moz) | Au (koz) | Pb (Mlbs) | Zn (Mlbs) | Cu (Mlbs) |
| BGS Zone | Indicated | 8.17 | 550 | 1.94 | 1.63 | 3.08 | 0.08 | 145 | 509 | 294 | 554 | 14 |
| Inferred | 1.98 | 648 | 0.81 | 1.32 | 2.80 | 0.06 | 41 | 52 | 58 | 123 | 3 |
| Deep Zone | Indicated | 4.66 | 209 | 2.39 | 2.96 | 4.73 | 0.23 | 31 | 359 | 304 | 486 | 24 |
| Inferred | 10.14 | 151 | 1.57 | 2.69 | 5.05 | 0.31 | 49 | 510 | 601 | 1129 | 69 |
Notes: See main footnotes under Table 14.1 and Table 14.2.
The data used in the estimate consists of surface and underground diamond drillholes. As operator, Fresnillo maintains the resource database and provides MAG Silver with Microsoft Excel® Files when requested. MAG Silver provided data to AMC as Microsoft Excel® files. The number of holes and number of assays used in the AMC estimate, by year of drilling, are shown in Table 14.4.
| MAG Silver Juanicipio NI 43-101 Technical Report | |
| MAG Silver Corp. | 717002 |
| Table 14.4 | Drillhole data used in the estimate |
| Year drilled | No. of drillholes | No. of assays | Metres drilled (m) |
| 2004 | 9 | 581 | 7,346 |
| 2005 | 6 | 306 | 5,048 |
| 2006 | 8 | 598 | 6,306 |
| 2007 | 12 | 1,335 | 10,120 |
| 2008 | 30 | 3,183 | 24,615 |
| 2009 | 27 | 1,490 | 21,351 |
| 2010 | 30 | 2,471 | 26,649 |
| 2011 | 31 | 2,345 | 25,360 |
| 2012 | 23 | 2,648 | 18,068 |
| 2013 | 39 | 6,290 | 34,899 |
| 2014 | 5 | 894 | 4,440 |
| 2015 | 5 | 868 | 5,024 |
| 2016 | 36 | 7,266 | 35,879 |
| Total | 261 | 30,275 | 225,105 |
Note: Drillholes are surface and underground diamond drillholes.
Drill data to 31 December 2016.
Numbers may not add due to rounding.
Resource area includes drilling along strike of mineralization wireframes.
Metallurgical drillholes, exploration drillholes and drillholes with poor recovery that were re-drilled are excluded from this table.
Source: AMC Mining Consultants (Canada) Ltd.
Fresnillo performed 11,790 density measurements from the core drilled on the Property. The collection of bulk density measurements is described in Section 10. The spacing and distribution of the measurements allows for density to be estimated throughout the block model. AMC used ordinary kriging (OK) with a minimum of three and maximum of ten composites to estimate block density.
Table 14.5 compares the original density measurements with the results from the block model estimate. Blocks are in general agreement with the original measurements.
| MAG Silver Juanicipio NI 43-101 Technical Report | |
| MAG Silver Corp. | 717002 |
| Table 14.5 | Comparative statistics of bulk density measurements and estimates |
| Vein | Statistic | Measured density | Estimated block density |
| V1E | Minimum | 2.09 | 2.35 |
| Maximum | 4.38 | 3.89 |
| Mean | 2.94 | 2.92 |
| V1W | Minimum | 2.19 | 2.34 |
| Maximum | 4.35 | 3.54 |
| Mean | 2.87 | 2.86 |
| HW1 | Minimum | 2.24 | 2.35 |
| Maximum | 3.06 | 2.87 |
| Mean | 2.54 | 2.60 |
| VANT | Minimum | 1.90 | 2.24 |
| Maximum | 3.63 | 3.63 |
| Mean | 2.91 | 2.95 |
| V2W(a) | Minimum | 2.43 | 2.52 |
| Maximum | 3.66 | 3.32 |
| Mean | 2.86 | 2.86 |
| V2W(b) | Minimum | 2.31 | 2.47 |
| Maximum | 3.52 | 3.24 |
| Mean | 2.75 | 2.74 |
| JV1 | Minimum | 2.30 | 2.41 |
| Maximum | 2.75 | 2.66 |
| Mean | 2.53 | 2.57 |
| JV2 | Minimum | 2.68 | 2.74 |
| Maximum | 3.76 | 3.61 |
| Mean | 2.99 | 3.07 |
Source: AMC Mining Consultants (Canada) Ltd.
| 14.2.1 | Lithological domains |
The Juanicipio deposit consists of six veins, five within the Valdecañas vein system (V1E, V1W, HW1, VANT, and V2W) and the Juanicipio vein (VJUA). The lithological domains for these deposits are vein structures modelled in Leapfrog Geo 4.0 and provided by MAG Silver. The domains were reviewed and accepted by AMC.
| 14.2.2 | Mineralization domains |
Building of mineralization domains, which represent a subset of the lithological veins, was also carried out by MAG Silver. The change from un-mineralized to mineralized material is abrupt. MAG Silver coded an NSR formula into the drillhole database and then used these values to build the mineralization domains. Final mineralization domains were also expanded to a minimum 2 m true width using Leapfrog’s minimum thickness function. Vein V2W was subset into V2W(a) and V2W(b), and vein VJUA was subset into JV1 and JV2 by MAG Silver.
The mineralization domains were built on the understanding that the potentially economic mineralization occurs as smaller subsets within the larger veins. Mineralization domains were reviewed and accepted by AMC with no changes.
The blocks inside the block model are coded by estimated silver, gold, lead, zinc, copper, and density values.
| MAG Silver Juanicipio NI 43-101 Technical Report | |
| MAG Silver Corp. | 717002 |
The number of mineralization domains varies within each vein. There was one mineralization domain for veins V1E, V1W, and HW1. There were two mineralization domains for both V2W and VJUA. The total number of mineralization domains was eight. Figure 14.1 shows the mineralization domains in 3-dimensional space.
On completion of the domain modelling, visual checks were carried out to ensure that the constraining wireframes respected the raw data.
| Figure 14.1 | 3-dimensional view of mineralization domains looking northeast |
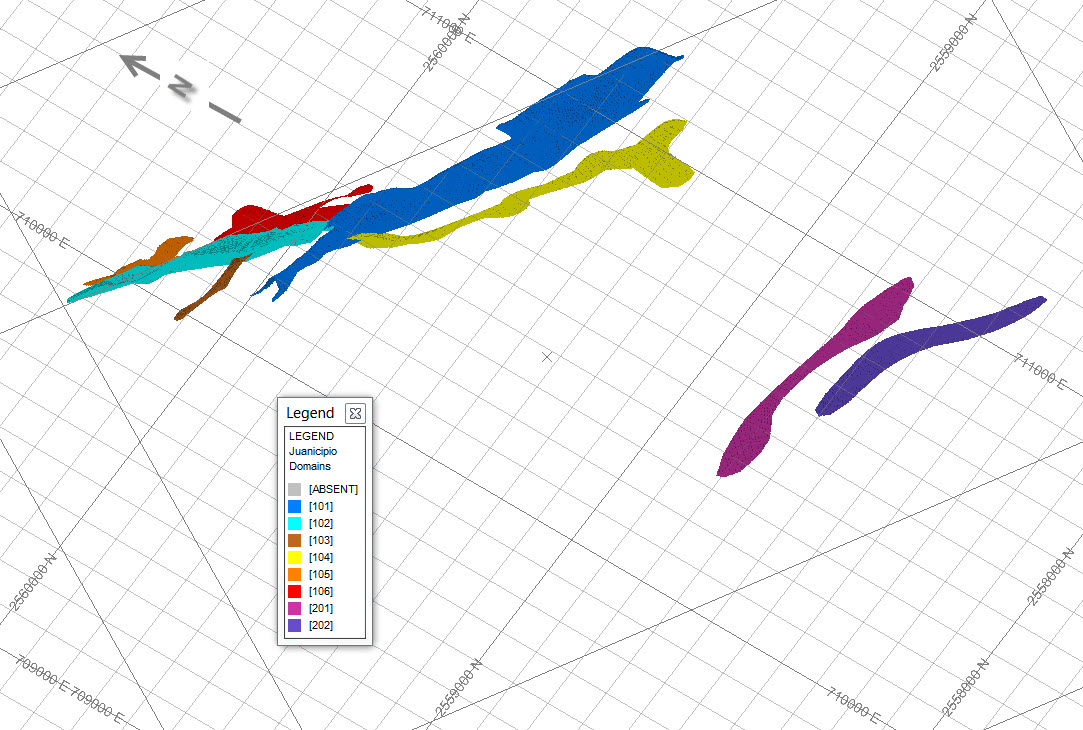
Note: Different colours represent individual mineral domains including subsets of the same vein. 101=VIE, 102=V1W, 103=HW1, 104=VANT, 105=V2W (a), 106=V2W(b), 201=JV1, 202=JV2.
Source: AMC Mining Consultants (Canada) Ltd.
| 14.3 | Statistics and compositing |
Sample lengths range from 20 cm to 3.65 m within the wireframe models. Approximately 50% of the samples were taken at one-metre intervals. Given this distribution and considering the width of the mineralization, AMC chose to composite to one-metre lengths. Assays within the wireframe domains were composited starting at the first mineralized wireframe boundary from the collar and resetting at each new wireframe boundary. Composites less than 0.5 m, located at the bottom of the mineralized intercept, were removed from the database.
The silver, gold, lead, and zinc assay data sets for all eight mineralization domains were viewed on log probability plots. Capping was applied by domain to the composites as shown in Table 14.6.
| MAG Silver Juanicipio NI 43-101 Technical Report | |
| MAG Silver Corp. | 717002 |
| Table 14.6 | Grade capping summary |
| Vein | Top cut | Original mean | New mean | Number of samples top cut | New as % of original |
| Silver |
| V1W | 8000 | 353 | 328 | 3 | 93% |
| HW1 | 2000 | 546 | 466 | 1 | 85% |
| V2W(b) | 6000 | 681 | 648 | 1 | 95% |
| JV1 | 630 | 400 | 245 | 1 | 61% |
| JV2 | 3000 | 727 | 621 | 2 | 85% |
| Gold |
| VANT | 10 | 1.88 | 1.69 | 3 | 90% |
| V2W(a) | 10 | 1.44 | 1.38 | 3 | 96% |
| JV2 | 4 | 1.31 | 0.92 | 2 | 70% |
| Lead |
| V1E | 30 | 2.25 | 2.23 | 2 | 99% |
| Zinc |
| HW1 | 4 | 1.20 | 0.91 | 1 | 76% |
| V2W(a) | 12 | 3.05 | 2.85 | 3 | 93% |
Source: AMC Mining Consultants (Canada) Ltd.
It was noted that both mineralized domains of the Juanicipio vein were very sensitive to capping of silver with average grades dropping from 400 g/t Ag to 245 g/t Ag for JV1 and from 727 g/t Ag to 621 g/t Ag for JV2 with capping of just one and two samples respectively. This is in part due to the small number of samples in the dataset. It is possible that additional drilling will infill the grades and allow a higher top cut to be applied at a future time.
The raw, composited, and capped assay data for the mineralized domains are shown in Table 14.7.
| MAG Silver Juanicipio NI 43-101 Technical Report | |
| MAG Silver Corp. | 717002 |
| Table 14.7 | Statistics of raw, composited, and capped assay data |
| Vein | Statistic | Ag (g/t) | Au (g/t) | Pb (%) | Zn (%) | Cu (%) |
| Raw | Comp | Capped | Raw | Comp | Capped | Raw | Comp | Capped | Raw | Comp | Capped | Raw | Comp | Capped |
| V1E | No. samples | 629 | 587 | 587 | 629 | 587 | 587 | 629 | 587 | 587 | 629 | 587 | 587 | 629 | 587 | 587 |
| Minimum | 1 | 2 | 2 | 0 | 0 | 0.00 | 0 | 0 | 0.00 | 0 | 0 | 0.00 | 0 | 0 | 0 |
| Maximum | 8,530 | 6,135 | 6,135 | 69.60 | 58.88 | 58.88 | 48.91 | 39.49 | 30.00 | 29.80 | 23.92 | 23.92 | 6.79 | 5.28 | 5.28 |
| Mean | 513 | 515 | 515 | 1.92 | 1.95 | 1.95 | 2.25 | 2.25 | 2.23 | 4.11 | 4.12 | 4.12 | 0.25 | 0.25 | 0.25 |
| Coeff. var | 1.81 | 1.63 | 1.63 | 2.73 | 2.48 | 2.48 | 1.78 | 1.61 | 1.53 | 1.12 | 1.03 | 1.03 | 2.48 | 2.26 | 0.05 |
| V1W | No. samples | 707 | 663 | 663 | 707 | 663 | 663 | 707 | 663 | 663 | 707 | 663 | 663 | 707 | 663 | 663 |
| Minimum | 1 | 1 | 1 | 0 | 0.01 | 0.01 | 0 | 0 | 0.00 | 0 | 0 | 0.00 | 0 | 0 | 0 |
| Maximum | 27,411 | 16,632 | 8,000 | 161.50 | 106.92 | 106.92 | 30.00 | 23.06 | 23.06 | 29.90 | 29.74 | 29.74 | 2.30 | 1.75 | 1.75 |
| Mean | 351 | 353 | 328 | 2.38 | 2.40 | 2.40 | 2.26 | 2.28 | 2.28 | 3.60 | 3.63 | 3.63 | 0.17 | 0.17 | 0.17 |
| Coeff. var | 3.94 | 3.26 | 2.68 | 3.26 | 2.58 | 2.58 | 1.74 | 1.56 | 1.56 | 1.28 | 1.17 | 1.17 | 1.55 | 1.37 | 0.10 |
| HW1 | No. samples | 28 | 26 | 26 | 28 | 26 | 26 | 28 | 26 | 26 | 28 | 26 | 26 | 28 | 26 | 26 |
| Minimum | 1 | 1 | 1 | 0.01 | 0.01 | 0.01 | 0 | 0 | 0.00 | 0.01 | 0.01 | 0.01 | 0 | 0 | 0 |
| Maximum | 10,000 | 4,044 | 2,000 | 9.69 | 3.92 | 3.92 | 6.83 | 3.21 | 3.21 | 11.95 | 11.46 | 4.00 | 0.25 | 0.10 | 0.10 |
| Mean | 643 | 546 | 466 | 0.62 | 0.54 | 0.54 | 0.57 | 0.50 | 0.50 | 1.21 | 1.20 | 0.91 | 0.03 | 0.02 | 0.02 |
| Coeff. var | 2.66 | 1.65 | 1.37 | 2.66 | 1.81 | 1.81 | 2.25 | 1.55 | 1.55 | 1.91 | 1.84 | 1.10 | 1.55 | 0.99 | 0.23 |
| VANT | No. samples | 149 | 131 | 131 | 149 | 131 | 131 | 149 | 131 | 131 | 149 | 131 | 131 | 149 | 131 | 131 |
| Minimum | 3 | 4 | 4 | 0 | 0.017 | 0.02 | 0.01 | 0.03 | 0.03 | 0.01 | 0.022 | 0.02 | 0 | 0 | 0 |
| Maximum | 983 | 795 | 795 | 18.85 | 18.85 | 10.00 | 17.95 | 17.03 | 17.03 | 30.00 | 28.83 | 28.83 | 2.49 | 2.49 | 1.00 |
| Mean | 117 | 118 | 118 | 1.86 | 1.88 | 1.69 | 2.62 | 2.65 | 2.65 | 6.37 | 6.44 | 6.44 | 0.24 | 0.24 | 0.23 |
| Coeff. var | 1.22 | 1.07 | 1.07 | 1.82 | 1.70 | 1.39 | 1.46 | 1.32 | 1.32 | 1.07 | 0.94 | 0.94 | 1.38 | 1.25 | 0.23 |
| V2W(a) | No. samples | 66 | 62 | 62 | 66 | 62 | 62 | 66 | 62 | 62 | 66 | 62 | 62 | 66 | 62 | 62 |
| Minimum | 4 | 4 | 4 | 0.02 | 0.02 | 0.02 | 0 | 0 | 0.00 | 0.01 | 0.01 | 0.01 | 0 | 0 | 0 |
| Maximum | 6310 | 6310 | 6310 | 17.65 | 12.41 | 10.00 | 14.75 | 13.70 | 13.70 | 25.10 | 21.01 | 12.00 | 0.97 | 0.96 | 0.70 |
| Mean | 370 | 365 | 365 | 1.44 | 1.44 | 1.38 | 2.00 | 2.02 | 2.02 | 3.08 | 3.05 | 2.85 | 0.14 | 0.14 | 0.14 |
| Coeff. var | 2.57 | 2.37 | 2.37 | 2.00 | 1.73 | 1.61 | 1.65 | 1.55 | 1.55 | 1.36 | 1.26 | 1.09 | 1.36 | 1.25 | 0.19 |
| V2W(b) | No. samples | 97 | 92 | 92 | 97 | 92 | 92 | 97 | 92 | 92 | 97 | 92 | 92 | 97 | 92 | 92 |
| Minimum | 3 | 3 | 3 | 0.01 | 0.01 | 0.01 | 0 | 0.0045 | 0.00 | 0.01 | 0.01 | 0.01 | 0 | 0 | 0 |
| Maximum | 8930 | 8930 | 6000 | 5.70 | 5.70 | 5.70 | 14.05 | 14.05 | 14.05 | 15.90 | 13.75 | 13.75 | 0.21 | 0.21 | 0.21 |
| Mean | 670 | 681 | 648 | 0.59 | 0.60 | 0.60 | 1.22 | 1.23 | 1.23 | 2.39 | 2.44 | 2.44 | 0.04 | 0.04 | 0.04 |
| Coeff. var | 2.00 | 1.82 | 1.61 | 1.54 | 1.50 | 1.50 | 1.85 | 1.81 | 1.81 | 1.50 | 1.37 | 1.37 | 1.05 | 0.97 | 0.21 |
| MAG Silver Juanicipio NI 43-101 Technical Report | |
| MAG Silver Corp. | 717002 |
| Vein | Statistic | Ag (g/t) | Au (g/t) | Pb (%) | Zn (%) | Cu (%) |
| Raw | Comp | Capped | Raw | Comp | Capped | Raw | Comp | Capped | Raw | Comp | Capped | Raw | Comp | Capped |
| JV1 | No. samples | 9 | 12 | 12 | 9 | 12 | 12 | 9 | 12 | 12 | 9 | 12 | 12 | 9 | 12 | 12 |
| Minimum | 7 | 7 | 7 | 0.02 | 0.02 | 0.02 | 0 | 0 | 0.00 | 0.01 | 0.01 | 0.01 | 0 | 0 | 0 |
| Maximum | 4100 | 2468 | 630 | 11.44 | 11.44 | 11.44 | 2.02 | 1.21 | 1.21 | 4.07 | 2.89 | 2.89 | 0.17 | 0.11 | 0.11 |
| Mean | 394 | 400 | 245 | 3.43 | 3.41 | 3.41 | 0.25 | 0.24 | 0.24 | 0.58 | 0.55 | 0.55 | 0.02 | 0.02 | 0.02 |
| Coeff. var | 2.21 | 1.65 | 0.97 | 1.12 | 1.14 | 1.14 | 2.10 | 1.83 | 1.83 | 1.97 | 1.76 | 1.76 | 1.57 | 1.27 | 0.22 |
| JV2 | No. samples | 23 | 22 | 22 | 23 | 22 | 22 | 23 | 22 | 22 | 23 | 22 | 22 | 23 | 22 | 22 |
| Minimum | 7 | 7 | 7 | 0.01 | 0.02 | 0.02 | 0.01 | 0.01 | 0.01 | 0.02 | 0.02 | 0.02 | 0 | 0 | 0 |
| Maximum | 4370 | 4370 | 3000 | 15.45 | 11.72 | 4.00 | 10.50 | 4.34 | 4.34 | 11.25 | 11.25 | 11.25 | 0.24 | 0.24 | 0.24 |
| Mean | 713 | 727 | 621 | 1.27 | 1.31 | 0.92 | 1.26 | 1.30 | 1.30 | 2.99 | 3.06 | 3.06 | 0.04 | 0.04 | 0.04 |
| Coeff. var | 1.79 | 1.70 | 1.53 | 2.25 | 1.94 | 1.24 | 1.53 | 0.99 | 0.99 | 1.20 | 1.10 | 1.10 | 1.38 | 1.29 | 0.17 |
Source: AMC Mining Consultants (Canada) Ltd.
| MAG Silver Juanicipio NI 43-101 Technical Report | |
| MAG Silver Corp. | 717002 |
| 14.4.1 | Block model parameters |
The parent block size was 6 m by 24 m by 12 m with sub-blocking employed. Sub-blocking resulted in minimum cell dimensions of 1 m by 2 m by 1 m.
The block model dimensions and rotations used for the estimate are shown in Table 14.8. The models were rotated counter-clockwise around the Z-axis.
| Table 14.8 | Block model parameters |
| Parameter | X | Y | Z |
| Origin (m) | 711181.17 | 2557649.00 | 1110.00 |
| Rotation angle (deg) | 0 | 0 | -60 |
| No. of blocks | 333 | 110 | 100 |
Note: This is the block model origin used for the estimate, model JUACLAV7, and does not correspond to the origins of models that have been placed in a different grid orientation for engineering purposes.
Source: AMC Mining Consultants (Canada) Ltd.
| 14.4.2 | Variography and grade estimation |
Variography was carried out on all domains that had sufficient sample density. If a domain did not have enough sample density for variography, the variography of the full data set was used.
Interpolation was carried out using the ordinary kriging (OK) method. A number of passes were employed, each using different search distances and multiples as follows:
| · | Pass 1 = 1 x search distance |
| · | Pass 2 = 1.5 x search distance |
| · | Pass 3 = 4 x search distance |
The search distances are shown in Table 14.9 along with the minimum and maximum number of samples used for each pass. Note that 94% of the blocks were filled in Pass 1. Pass 3 had large search distances to ensure all blocks were informed. Pass 2 informed 4 % of the blocks and only 2% of the blocks were informed by Pass 3.
| Table 14.9 | Minimum and maximum sample parameters |
| Pass | X (m) | Y (m) | Z (m) | Minimum no. of samples | Maximum no. of samples | Minimum no. of drill holes | % of blocks filled by pass |
| 1 | 50 | 130-170 | 170 | 3 | 10 | 2 | 94% |
| 2 | 75 | 195-255 | 255 | 3 | 10 | 2 | 4% |
| 3 | 200 | 520-680 | 680 | 3 | 10 | 2 | 2% |
Source: AMC Mining Consultants (Canada) Ltd.
| 14.4.3 | Resource classification |
Mineral Resource classification was completed using an assessment of geological and mineralization continuity, data quality and data density. Classification was carried out using drillhole density and continuity of mineralization as the main criteria.
| 14.4.4 | Block model validation |
The block models were validated in three ways. First, visual checks were carried out to ensure that the grades respected the raw assay data, and also lay within the constraining wireframes. Secondly, swath plots were reviewed. Lastly, the estimate was statistically compared to the capped assay data, with satisfactory results.
| MAG Silver Juanicipio NI 43-101 Technical Report | |
| MAG Silver Corp. | 717002 |
Figure 14.2 shows an example of the drillhole composite silver grades compared to the block model estimated grades for vein V1E. V1E contains the largest Indicated tonnage and silver is the most significant economic metal. The figure shows good agreement between the drillhole composite grades and the estimated block model grades.
| Figure 14.2 | Silver grade longitudinal projection vein V1E |
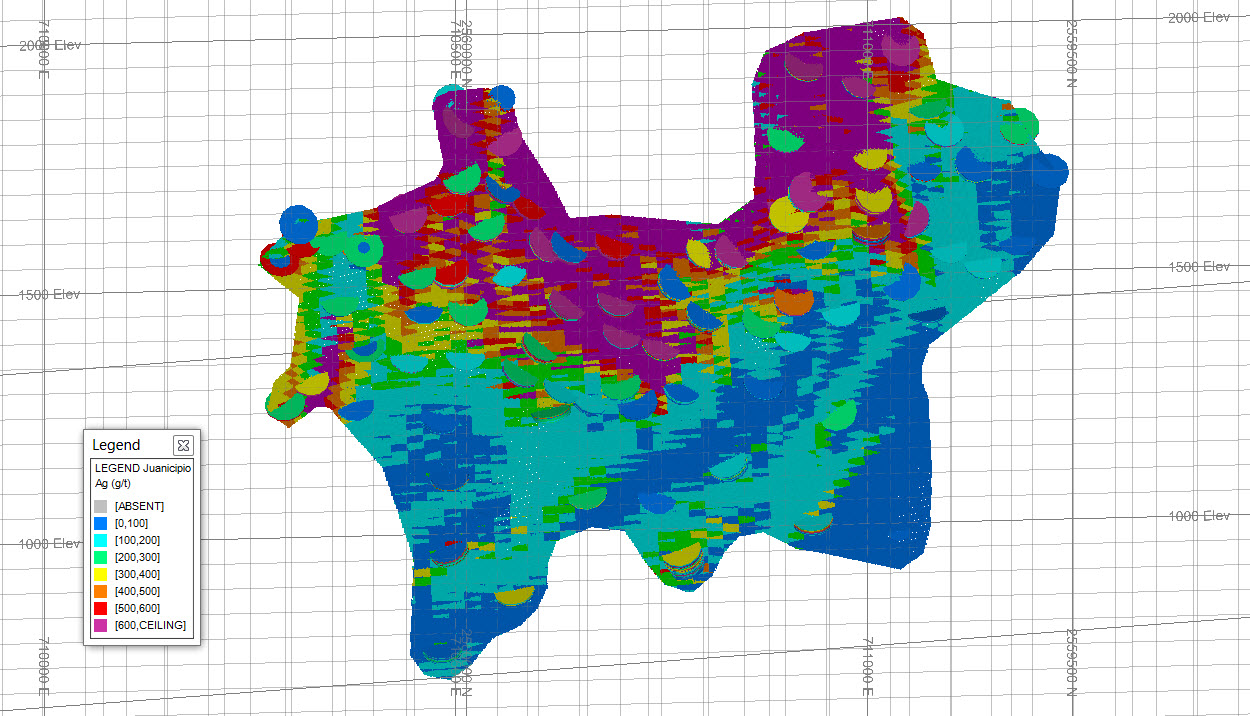
Note: Drillholes: coloured discs. Model: Lighter solid colours. Drillhole composites and model coloured by silver grade (legend displayed).
Source: AMC Mining Consultants (Canada) Ltd.
Table 14.10 shows the statistical comparison on the composites versus the block model grades for silver, gold, lead, and zinc.
| Table 14.10 | Statistical comparison of capped assay data and block model |
| Vein | Statistic | Ag | Au | Pb | Zn | Cu |
| Capped | BM | Capped | BM | Capped | BM | Capped | BM | Capped | BM |
| V1E | No. samples | 587 | 298,785 | 587 | 298,785 | 587 | 298,785 | 587 | 298,785 | 587 | 298,785 |
| Minimum | 2 | 20 | 0.00 | 0.01 | 0.00 | 0.03 | 0.00 | 0.04 | 0 | 0.00 |
| Maximum | 6135 | 3940 | 58.88 | 46.71 | 30.00 | 23.93 | 23.92 | 15.42 | 5.28 | 4.00 |
| Mean | 515 | 389 | 1.95 | 1.62 | 2.23 | 1.83 | 4.12 | 3.58 | 0.25 | 0.20 |
| Coeff. Var | 1.63 | 1.02 | 2.48 | 1.36 | 1.53 | 0.88 | 1.03 | 0.64 | 0.05 | 1.44 |
| V1W | No. samples | 663 | 268,273 | 663 | 268,273 | 663 | 268,273 | 663 | 268,273 | 663 | 268,273 |
| Minimum | 1 | 3 | 0.01 | 0.00 | 0.00 | 0.00 | 0.00 | 0.00 | 0 | 0.00 |
| Maximum | 8000 | 5481 | 106.92 | 61.12 | 23.06 | 15.14 | 29.74 | 22.62 | 1.75 | 1.20 |
| Mean | 328 | 272 | 2.40 | 1.92 | 2.28 | 2.26 | 3.63 | 3.74 | 0.17 | 0.17 |
| Coeff. Var | 2.68 | 1.72 | 2.58 | 1.26 | 1.56 | 1.03 | 1.17 | 0.90 | 0.10 | 0.96 |
| HW1 | No. samples | 26 | 9,531 | 26 | 9,531 | 26 | 9,531 | 26 | 9,531 | 26 | 9,531 |
| Minimum | 1 | 87 | 0.01 | 0.11 | 0.00 | 0.07 | 0.01 | 0.15 | 0 | 0.01 |
| Maximum | 2000 | 1441 | 3.92 | 1.69 | 3.21 | 1.94 | 4.00 | 2.64 | 0.10 | 0.06 |
| Mean | 466 | 560 | 0.54 | 0.61 | 0.50 | 0.54 | 0.91 | 0.86 | 0.02 | 0.03 |
| Coeff. Var | 1.37 | 0.71 | 1.81 | 0.58 | 1.55 | 0.94 | 1.10 | 0.68 | 0.23 | 0.38 |
| MAG Silver Juanicipio NI 43-101 Technical Report | |
| MAG Silver Corp. | 717002 |
| Vein | Statistic | Ag | Au | Pb | Zn | Cu |
| Capped | BM | Capped | BM | Capped | BM | Capped | BM | Capped | BM |
| VANT | No. samples | 131 | 75,082 | 131 | 75,082 | 131 | 75,082 | 131 | 75,082 | 131 | 75,082 |
| Minimum | 4 | 4 | 0.02 | 0.02 | 0.03 | 0.03 | 0.02 | 0.02 | 0 | 0.00 |
| Maximum | 795 | 795 | 10.00 | 10.00 | 17.03 | 17.03 | 28.83 | 25.29 | 1.00 | 1.00 |
| Mean | 118 | 97 | 1.69 | 1.08 | 2.65 | 2.62 | 6.44 | 6.29 | 0.23 | 0.15 |
| Coeff. Var | 1.07 | 1.04 | 1.39 | 1.76 | 1.32 | 1.26 | 0.94 | 0.77 | 0.23 | 1.08 |
| V2W(a) | No. samples | 62 | 23,590 | 62 | 23,590 | 62 | 23,590 | 62 | 23,590 | 62 | 23,590 |
| Minimum | 4 | 32 | 0.02 | 0.07 | 0.00 | 0.18 | 0.01 | 0.18 | 0 | 0.02 |
| Maximum | 6310 | 1741 | 10.00 | 8.26 | 13.70 | 8.70 | 12.00 | 9.55 | 0.70 | 0.46 |
| Mean | 365 | 329 | 1.38 | 1.20 | 2.02 | 2.18 | 2.85 | 3.15 | 0.14 | 0.12 |
| Coeff. Var | 2.37 | 0.71 | 1.61 | 0.85 | 1.55 | 0.77 | 1.09 | 0.67 | 0.19 | 0.71 |
| V2W(b) | No. samples | 92 | 42,929 | 92 | 42,929 | 92 | 42,929 | 92 | 42,929 | 92 | 42,929 |
| Minimum | 3 | 78 | 0.01 | 0.07 | 0.00 | 0.04 | 0.01 | 0.06 | 0 | 0.00 |
| Maximum | 6000 | 3289 | 5.70 | 3.53 | 14.05 | 5.90 | 13.75 | 8.81 | 0.21 | 0.15 |
| Mean | 648 | 577 | 0.60 | 0.61 | 1.23 | 1.12 | 2.44 | 2.39 | 0.04 | 0.04 |
| Coeff. Var | 1.61 | 0.78 | 1.50 | 0.93 | 1.81 | 0.84 | 1.37 | 0.82 | 0.21 | 0.54 |
| JV1 | No. samples | 12 | 40,246 | 12 | 40,246 | 12 | 40,246 | 12 | 40,246 | 12 | 40,246 |
| Minimum | 7 | 104 | 0.02 | 0.38 | 0.00 | 0.02 | 0.01 | 0.15 | 0 | 0.01 |
| Maximum | 630 | 555 | 11.44 | 10.23 | 1.21 | 1.00 | 2.89 | 2.50 | 0.11 | 0.06 |
| Mean | 245 | 260 | 3.41 | 3.72 | 0.24 | 0.36 | 0.55 | 0.83 | 0.02 | 0.03 |
| Coeff. Var | 0.97 | 0.47 | 1.14 | 0.67 | 1.83 | 0.64 | 1.76 | 0.69 | 0.22 | 0.39 |
| JV2 | No. samples | 22 | 42,566 | 22 | 42,566 | 22 | 42,566 | 22 | 42,566 | 22 | 42,566 |
| Minimum | 7 | 97 | 0.02 | 0.10 | 0.01 | 0.16 | 0.02 | 0.47 | 0 | 0.01 |
| Maximum | 3000 | 2250 | 4.00 | 2.47 | 4.34 | 2.83 | 11.25 | 9.31 | 0.24 | 0.12 |
| Mean | 621 | 698 | 0.92 | 1.06 | 1.30 | 1.27 | 3.06 | 3.06 | 0.04 | 0.04 |
| Coeff. Var | 1.53 | 0.86 | 1.24 | 0.51 | 0.99 | 0.39 | 1.10 | 0.66 | 0.17 | 0.55 |
Notes: For minimum, maximum and mean values, gold and silver values are in g/t and lead, zinc and copper are in %.
Source: AMC Mining Consultants (Canada) Ltd.
| 14.4.5 | Mineral Resource estimation |
Mineral Resource estimates consist of material within the mineralized domains with a resource NSR cut-off of $55/t applied. Note this “resource NSR” is derived differently to the NSR quoted in subsequent sections including Section 16 and all tables therein. Input parameters for calculating the NSR are shown in Table 14.10. The cut-off value was based on estimated mining costs, processing costs and recoveries.
| MAG Silver Juanicipio NI 43-101 Technical Report | |
| MAG Silver Corp. | 717002 |
| Table 14.11 | Input parameters in calculating resource NSR |
| Item | Value | Unit |
| Gold price | $1,300 | $/oz |
| Silver price | $20 | $/oz |
| Lead price | $0.95 | $/lb |
| Zinc price | $1.00 | $/lb |
| Gold recovery | 82% | % |
| Silver recovery | 95% | % |
| Lead recovery | 93% | % |
| Zinc recovery | 90% | % |
| Conversions | 31.10348 | g/oz |
| | 2,204.623 | lb/t |
Source: AMC Mining Consultants (Canada) Ltd.
A summary of the Mineral Resource estimates (Table 14.1), Mineral Resources by vein (Table 14.2) and Mineral Resources by metal zone (Table 14.3) have been shown above.
The results of reporting out of the block model at a range of cut-offs are shown in Table 14.12, with the preferred cut-off shown in bold text.
| Table 14.12 | Juanicipio underground Mineral Resource estimates at a range of cut-off values |
| Resource Category | NSR cut-off ($/t) | Tonnes (Mt) | Ag (g/t) | Au (g/t) | Pb (%) | Zn (%) | Cu (%) | Ag (Moz) | Au (koz) | Pb (Mlbs) | Zn (Mlbs) | Cu (Mlbs) |
| Total Indicated | 0 | 12.84 | 426 | 2.10 | 2.11 | 3.68 | 0.13 | 176 | 868 | 598 | 1041 | 38 |
| 30 | 12.84 | 426 | 2.10 | 2.11 | 3.68 | 0.13 | 176 | 868 | 598 | 1041 | 38 |
| 40 | 12.84 | 426 | 2.10 | 2.11 | 3.68 | 0.13 | 176 | 868 | 598 | 1041 | 38 |
| 55 | 12.83 | 427 | 2.10 | 2.11 | 3.68 | 0.13 | 176 | 867 | 598 | 1041 | 38 |
| 70 | 12.79 | 428 | 2.11 | 2.12 | 3.69 | 0.13 | 176 | 867 | 597 | 1040 | 38 |
| 90 | 12.67 | 431 | 2.12 | 2.14 | 3.72 | 0.14 | 176 | 864 | 597 | 1039 | 38 |
| 100 | 12.61 | 433 | 2.13 | 2.14 | 3.73 | 0.14 | 176 | 862 | 596 | 1038 | 38 |
| 150 | 11.87 | 454 | 2.20 | 2.24 | 3.88 | 0.14 | 173 | 840 | 585 | 1017 | 36 |
| Total Inferred | 0 | 12.38 | 228 | 1.42 | 2.42 | 4.60 | 0.26 | 91 | 564 | 660 | 1255 | 72 |
| 30 | 12.32 | 229 | 1.42 | 2.43 | 4.62 | 0.26 | 91 | 563 | 659 | 1254 | 72 |
| 40 | 12.25 | 230 | 1.43 | 2.44 | 4.64 | 0.26 | 91 | 563 | 659 | 1254 | 71 |
| 55 | 12.13 | 232 | 1.44 | 2.46 | 4.68 | 0.27 | 91 | 562 | 658 | 1252 | 71 |
| 70 | 11.94 | 235 | 1.46 | 2.49 | 4.74 | 0.27 | 90 | 559 | 657 | 1249 | 71 |
| 90 | 11.66 | 240 | 1.48 | 2.54 | 4.84 | 0.27 | 90 | 554 | 653 | 1244 | 69 |
| 100 | 11.46 | 243 | 1.49 | 2.58 | 4.90 | 0.27 | 89 | 550 | 651 | 1237 | 69 |
| 150 | 10.03 | 266 | 1.60 | 2.84 | 5.34 | 0.27 | 86 | 517 | 628 | 1180 | 60 |
Notes: CIM Definition Standards were used for reporting the Mineral Resources.
Mineral Resources are shown at a range of resource NSR cut-off values. The preferred value of $55 per tonne is shown in bold.
Drilling results up to 31 December 2016.
The numbers may not compute exactly due to rounding.
Source: AMC Mining Consultants (Canada) Ltd.
| MAG Silver Juanicipio NI 43-101 Technical Report | |
| MAG Silver Corp. | 717002 |
| 14.5 | Comparison with previous Mineral Resource estimate |
This Technical report supersedes the previous Mineral Resource estimate on the Property dated 31 December 2013 as published in the RPA 2014 Technical Report. Changes to the Mineral Resource estimate in this report are due predominantly to:
| · | New drilling on the Valdecañas veins, which converted Inferred Resources into Indicated Resources and extended base metal rich mineralization at depth. |
| · | Re-interpretation of the mineralized domains resulting in larger wireframes to incorporate the new drilling as well as re-defining mineralized domains. |
| · | Updated NSR parameters and reporting at different cut-off values. |
Table 14.13 shows a comparison between the estimates at the reported cut-off values.
| Table 14.13 | Comparison of 2013 and 2017 Mineral Resource estimates |
| Estimate | Resource category | Tonnes (Mt) | Ag (g/t) | Au (g/t) | Pb (%) | Zn (%) | Cu (%) | Ag (Moz) | Au (Koz) | Pb (Mlbs) | Zn (Mlbs) | Cu (Mlbs) |
| RPA 2013 | Indicated | 10.1 | 511 | 1.7 | 1.9 | 3.5 | | 166 | 544 | 419 | 778 | |
| Inferred | 5.1 | 372 | 2 | 1.8 | 2.8 | | 61 | 319 | 202 | 317 | |
| AMC 2017 | Indicated | 12.8 | 427 | 2.1 | 2.1 | 3.7 | 0.1 | 176 | 867 | 598 | 1041 | 38 |
| Inferred | 12.1 | 232 | 1.4 | 2.5 | 4.7 | 0.3 | 91 | 562 | 658 | 1252 | 71 |
| Difference | Indicated | 27% | -17% | 24% | 11% | 5% | | 6% | 59% | 43% | 34% | |
| Inferred | 138% | -38% | -28% | 37% | 67% | | 48% | 76% | 226% | 295% | |
Notes for the RPA Estimate:
CIM Definition Standards were followed for the classification of Mineral Resources.
Mineral Resources are reported at an incremental NSR cut-off value of $70 per tonne.
NSR values are calculated in $ using factors of $0.57 per g/t Ag, $30.11 per g/t Au, $9.07 per % Pb, and $12.21 per % Zn. These factors are based on metal prices of $21.50/oz Ag, $1,250/oz Au, $0.91/lb Pb, and $0.99/lb Zn and estimated recoveries and smelter terms.
The Mineral Resource estimate uses drillhole data available as of 31 December 2013.
Mineral Resources that are not Mineral Reserves do not have demonstrated economic viability.
Totals may not add correctly due to rounding.
Notes for the AMC Estimate:
See notes on Table 14.2 with respect to the current estimate.
Sources: AMC Mining Consultants (Canada) Ltd. and RPA Inc. (Canada).
The following observations have been made by the QP from the table comparing the 2017 estimate with the 2014 estimate:
| · | Indicated tonnes have increased by 27%, while the Inferred tonnes have increased by 138%. |
| · | Both Indicated and Inferred grades have decreased for silver and increased for base metals. |
| · | Gold grades have increased in the Indicated category and decreased in Inferred category. |
| · | The net result in the Indicated category has been an increase in the contained silver metal of 6% and an increase in contained gold metal of 59%. The increases in the contained lead and zinc metals are 43% and 34% respectively. |
| · | The net result in the Inferred category has been an increase in the contained silver metal of 48% and an increase in contained gold metal of 76%. Lead and zinc contained metal showed increases of 226% and 295% respectively. |
| · | Although not a significant part of the total Mineral Resource, copper is quoted for the first time as a result of high copper values being intercepted at depth in the new drilling. |
Reasons for the differences in grade, tonnes and contained metal include Mineral Resource addition down-dip and conversion to higher categories arising from the new drilling. Also, given the greater degree of geological understanding, some parts of a vein were assigned to a different vein between the two estimates and new vein wireframes were constructed. The most significant change is the volume of the mineralized wireframes.
| MAG Silver Juanicipio NI 43-101 Technical Report | |
| MAG Silver Corp. | 717002 |
The RPA 2014 Technical Report quoted a wireframe volume of 5,340,000 m3 and the AMC wireframe volume for this Mineral Resource is 9,115,000 m3. This is in keeping with the increase in tonnes seen in the AMC estimate. The overall decrease in precious metal grades and increase in base metal grades reflects the new drilling targeting the deeper base metal rich zones.
The RPA 2014 Technical Report did not quote copper values. Although not a significant part of the total Mineral Resource, copper is quoted in the current Mineral Resource because of the relatively high copper values intercepted at depth in the new drilling. This is shown in Figure 14.3.
| Figure 14.3 | Copper grade longitudinal projection vein V1E |
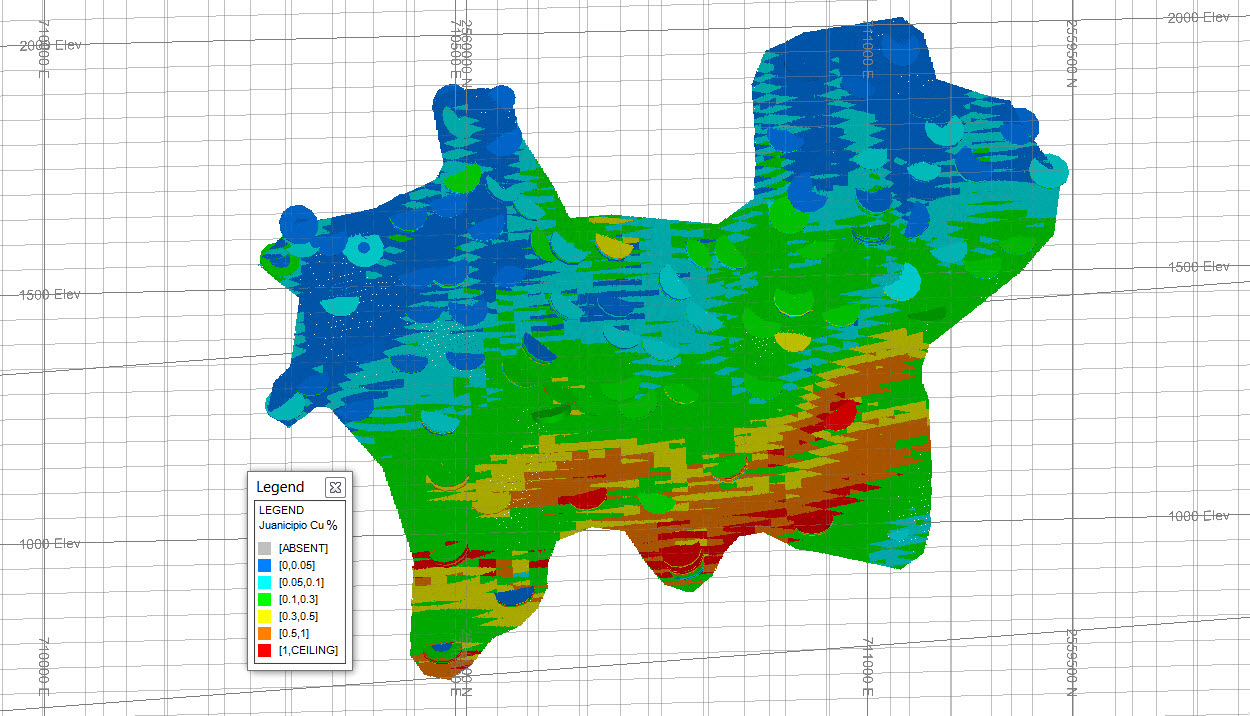
Note: Drillholes: coloured discs. Model: Lighter solid colours. Drillhole composites and model coloured by copper grade (legend displayed).
Source: AMC Mining Consultants (Canada) Ltd.
| MAG Silver Juanicipio NI 43-101 Technical Report | |
| MAG Silver Corp. | 717002 |
| 15 | Mineral Reserve estimates |
There are currently no Mineral Reserves estimated for the project.
| MAG Silver Juanicipio NI 43-101 Technical Report | |
| MAG Silver Corp. | 717002 |
The 2012 PEA considered a longhole stoping mining method with pastefill. AMC undertook site visits to other operating mines in the area to review the details of the mining methods used and the application of rock fill. The primary mining method continues to be longhole stoping, however some cost savings and production efficiencies were identified with waste rock fill over pastefill. Waste rock is now considered as the primary backfill and in the wider stopes where more than one longitudinal pass is required, cemented rock fill will be utilized.
The mine access is via twin declines to the top of the mineralization. The access route then splits into three internal ramp systems on 20 m sub-level spacing, with central accesses to the vein as well as footwall drives to the extents of the mineralization to allow placement of rock fill. Stopes 20 m high (floor to floor) are mined from the extents back to the central access (retreat) with rock fill placed within 20 m of the retreating face.
In the lower levels of the mine, the vein widens out to a maximum thickness of approximately 30 m. In these areas, the vein will be mined in two longitudinal passes with a maximum width of 15 m. The footwall stope will be taken first over the full strike length, followed by the hangingwall stope. Cemented rock fill will be used in the footwall stope to minimize fill dilution into the hangingwall stope.
A long-section schematic of the proposed mining method is shown in Figure 16.1.
| Figure 16.1 | Longhole stoping with rock fill general layout |
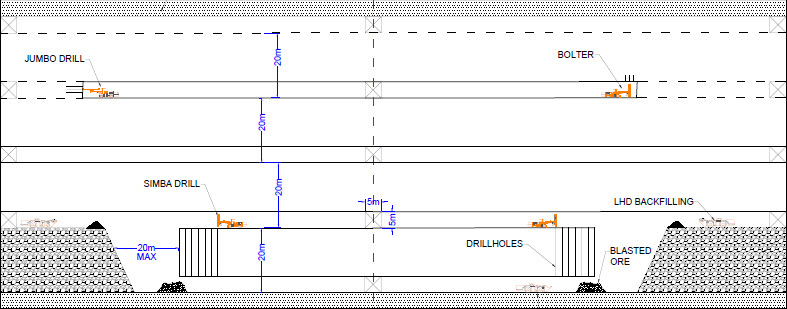
| 16.1 | Geotechnical considerations |
Following the 2012 PEA, Juanicipio conducted further exploration drilling and captured additional geotechnical data from the drill core. This data was used to complement the existing data, and a re-assessment of stope dimensions, ground support requirements, and vertical development stability analyses was conducted.
| 16.1.1 | Rock mass properties |
A total of 20 drillholes have been geotechnically logged for the Juanicipio project area, with the data being used to compile the AMC Preliminary Geotechnical Report, dated 30 September 2015. During AMC’s site visit conducted in April 2016, five drillholes spatially distributed across the project in variable orientations were selectively reviewed to accomplish the following:
| · | Provide a visual sense of the rock mass quality across the site. |
| · | Compare rock mass and joint conditions of new holes with those previously reported; AMC determined that the rock mass characteristics by lithology noted in the 2012 PEA report remain valid for the new core drilled. |
| · | Understand if geotechnical domain boundaries are generally related to lithology boundaries. |
| MAG Silver Juanicipio NI 43-101 Technical Report | |
| MAG Silver Corp. | 717002 |
| · | Select representative intact laboratory samples for testing. |
The location of the geotechnically logged drillholes is indicated in Figure 16.2. The results of the geotechnical logging of these drillhole cores were used to determine the Bieniawski Rock Mass Rating (RMR89) values which, in turn, were used to calculate the GSI (rock mass characterization index) values using the following relationship:

| Figure 16.2 | Location of drillholes geotechnically logged for the Juanicipio project area |
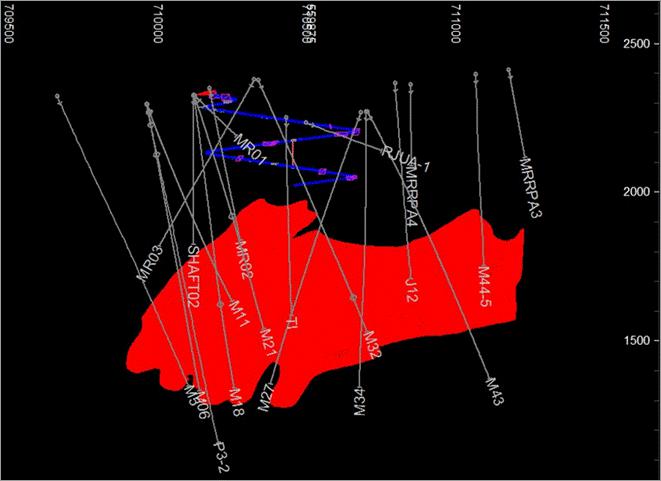
The results of the RMR89 determination are presented in Figure 16.3.
| MAG Silver Juanicipio NI 43-101 Technical Report | |
| MAG Silver Corp. | 717002 |
| Figure 16.3 | Average RMR89 values determined from geotechnical logging of the borehole cores |
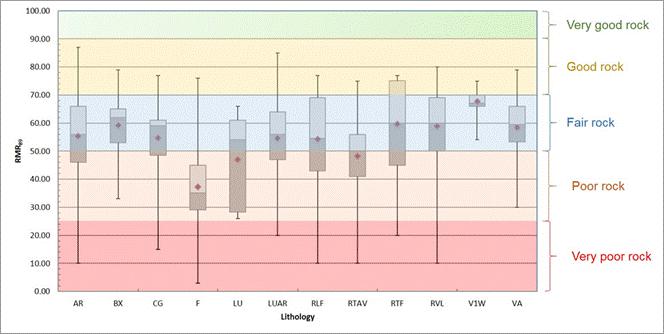
The lithology code definitions are indicated below in Table 16.1.
| Table 16.1 | Lithology code definitions |
| Lithological domains | Lithological unit | Code |
| Fault | Fault | F |
| Cretaceous sediments | Shale | LU |
| Sandstone | AR |
| Sandstone / Shale | LUAR |
| Green Lava | RVL |
| Vein associated lithologies | Stockwork | STWK |
| Vein 1 | V1 |
| Vein 2 | V2 |
| Isolated veins | VA |
| Breccia | BX |
| Tertiary volcanics | Rhyolite Lithic Tuff | RLF |
| Rhyolite Tuff Agglomerate | RTAV |
| Rhyolite Tuff Pumice | RTP |
| Conglomerate | CG |
The results of the geotechnical core logging indicate that the quality of the host rock at Juanicipio can be anticipated to be Fair. There will be some areas where Poor ground conditions could be expected, these being in the vicinity of faults and intersections with rhyolite tuff agglomerate or shale.
Table 16.2 is a summary of laboratory strength tests conducted on core samples for the project area. A total of 74 samples has been tested, of which only one was in mineralized rock. The results of the data reduction are reported in Figure 16.4 and Figure 16.5.
| MAG Silver Juanicipio NI 43-101 Technical Report | |
| MAG Silver Corp. | 717002 |
| Table 16.2 | Summary of laboratory-conducted rock strength tests |
| Pre-2016 | 2016 |
| UCS tests only | Lithology | Test type |
| UCS | TCS | UTB |
| 12 | LUAR | Chloritized | 1 | 1 | 0 |
| Hangingwall | 3 | 3 | 1 |
| Footwall | 1 | 2 | 0 |
| 12 | RVL | Andesites (Roca Verde) | 0 | 1 | 1 |
| 12 | AR | Sandstones (Areniscas) | 0 | 1 | 1 |
| 0 | CG | Conglomerates | 1 | 1 | 1 |
| 16 | RTP/RTAV | Rhyolites | 0 | 1 | 1 |
| 0 | V1/V2 | Mineralized rock | 1 | 0 | 0 |
UCS = Uniaxial Compressive Strength
TCS = Triaxial Compressive Strength
UTB = Indirect tensile test – Brazilian
The results of the data reduction are reported in Figure 16.4 and Figure 16.5.
| Figure 16.4 | Average intact rock strength (± standard deviation) |

As with mineralized rock, only a single value of Unconfined Compressive Strength (UCS) was obtained for conglomerates. Of the area rock types and, as could be expected, the rhyolite tuff agglomerate was seen to be the weakest, having an average UCS of less than 10 MPa.
| MAG Silver Juanicipio NI 43-101 Technical Report | |
| MAG Silver Corp. | 717002 |
| Figure 16.5 | Data reduction results of Young’s Modulus (obtained from the UCS tests) |
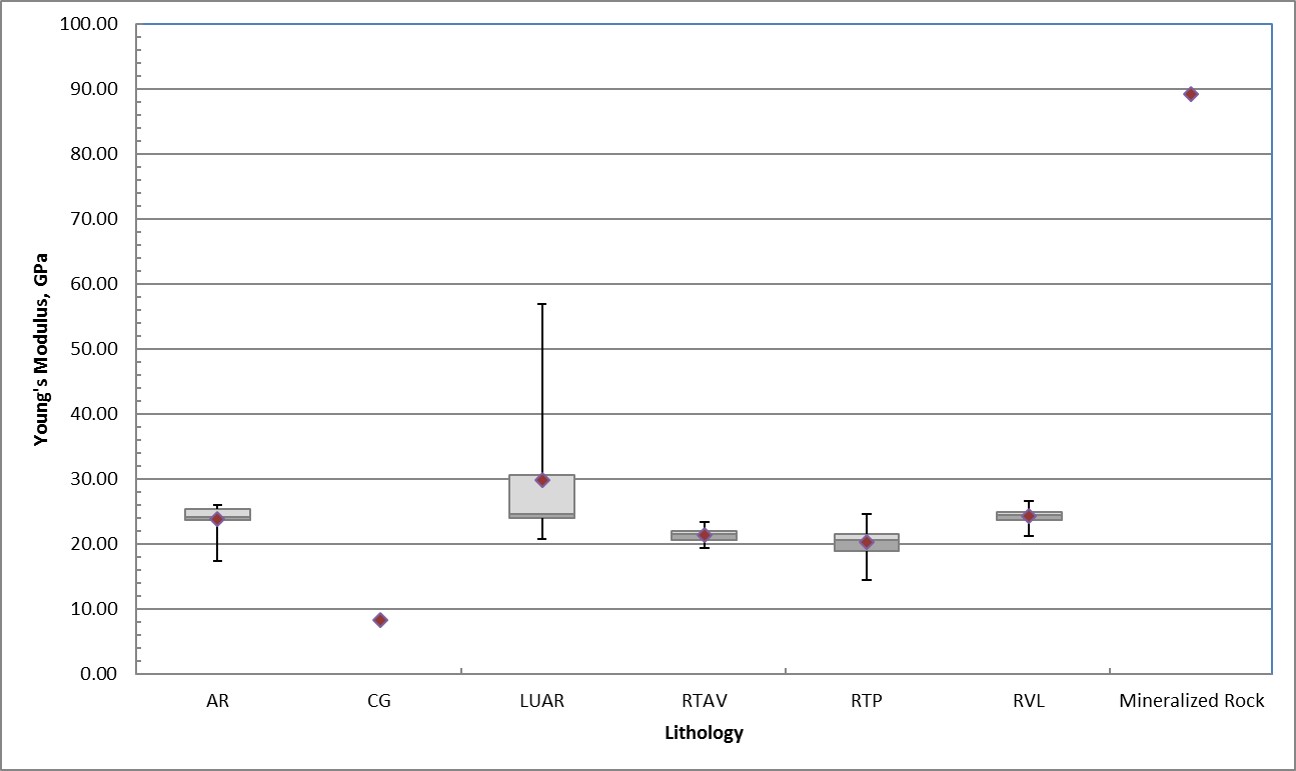
The Deformation Modulus (Young’s Modulus) is an indication of the stiffness of the rock type. The host rock at Juanicipio is fairly soft, implying that deformation can be expected when subjected to large loads / stress.
To evaluate rock mass properties, the results of the data reduction analyses were input into Rocscience’s RocLab software package. The input parameters for this software include: UCS, GSI, the material strength constant - mi, and a blast damage criterion factor - D. Only the LUAR rock mass properties were evaluated, reflecting both the predominance of the LUAR lithology as the host rock for the mineralized vein and the quantity and type of available rock strength test data. The results of the rock mass property determination are indicated in Figure 16.6.
| MAG Silver Juanicipio NI 43-101 Technical Report | |
| MAG Silver Corp. | 717002 |
| Figure 16.6 | Rock mass strength parameter determination results |
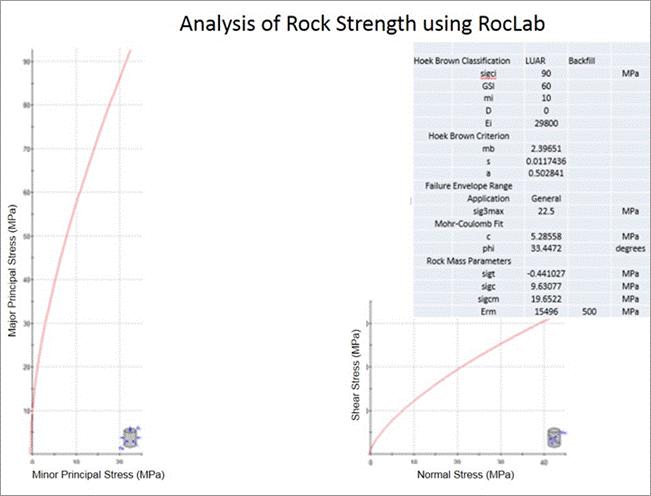
The value of mi in Figure 16.6 was obtained by fitting a curve to the results of the triaxial tests (Figure 16.7).
| MAG Silver Juanicipio NI 43-101 Technical Report | |
| MAG Silver Corp. | 717002 |
| Figure 16.7 | Determination of mi from the LUAR triaxial test results |
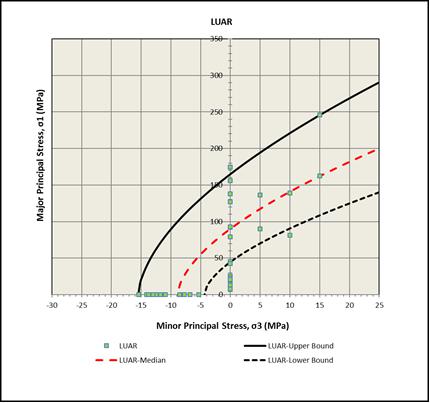
The results of the rock mass property determination exercise were used for material property inputs into the Map3D numerical modelling code in order to evaluate the planned stoping sequence.
It is envisaged that the rock mass property values will be reassessed when the still applicable recommendations made in the AMC 2015 report have been followed. These recommendations were:
| · | Develop a series of 3D models that includes lithology, alteration and major structure. |
| · | Using data from these models develop a 3D geotechnical model. |
| · | Hydrogeological characterization of the site. |
| · | A geotechnical diamond drilling program with oriented core would assist in increasing the geotechnical understanding of the mining area. Triple tube drilling is recommended. |
| · | A laboratory testing program should be performed on the various lithologies to assist in understanding the rock properties. The following suite of rock property tests is recommended: Uniaxial Compressive Strength (UCS) with Young’s Modulus (E) and Poisson’s Ratio (u), Confined Compressive Strength (Triaxial Compressive Strength, TCS), and Indirect Tensile Strength (Brazilian, UTB)1. |
| · | A shaft pilot hole should be drilled to provide geotechnical and geological information ahead of shaft development. |
| · | Joint orientation data within the pilot hole should be assessed using an acoustic or optical televiewer. |
| · | The concrete ring (shaft lining) design, if a shaft lining is deemed necessary, should be reviewed by a structural (suitably experienced Civil Geotechnical) engineer. |
________________
1 A minimum of five samples per lithology per test is required.
| MAG Silver Juanicipio NI 43-101 Technical Report | |
| MAG Silver Corp. | 717002 |
AMC also recommends that any available knowledge on ground conditions and behaviour in mines in the same area as Juanicipio and in which similar rock types, structures, orientations, hydrogeological conditions, depths, etc. may have been encountered, should be factored into future geotechnical assessments.
| 16.1.2 | Stable stope spans – geotechnical analysis |
No additional detailed geotechnical core logging has been conducted on drillhole core since the assessment of stope panel dimensions and vertical development recommendations made in 2015. Therefore, the analysis conducted during 2015 is summarized below.
Following on from the work undertaken by AMC in 2012, AMC conducted additional stope stability assessments for the Juanicipio project using the updated data and the empirical Stability Graph Method (Mathews et al. 1981; Potvin, Y. 1988). This is widely used in the Australian and North American mining industries to obtain first-pass estimates of possible stope spans in mining studies.
It should be noted that the stability graph method is approximate only and early stoping should be carefully monitored and designs adjusted in response to actual performance. Test stoping to provide information on site-specific controls for stope stability is recommended.
In the stability graph method, the stability number N' is calculated using the following expression:
N' = Q' x A x B x C
| Where: | Q' | is the modified Q Tunnelling Quality Index (after Barton et al. 1974) |
| | A | is the rock stress factor |
| | B | is the joint orientation adjustment factor |
| | C | is the gravity adjustment factor |
| | | |
| 16.1.2.1 | Stability number (N’) |
The stability number parameters A, B, and C were based on interpretations of stress, strength, and structure. A low to moderate stress regime is assumed. Factor C was calculated based on average dip values (45° to 65°) for the mineralization. The stability number parameters are summarized for the median dip value (55°) in Table 16.3.
| Table 16.3 | Assessment of stability number (N’) for the hangingwall (dip-55°) and vein back |
| Unit | Q’ lower | Q’ average | Q’ Upper | A-500m | B | C (55) | N’ lower | N’ average | N’ upper |
| Sedimentary | 3.40 | 16.40 | 29.40 | 1.00 | 0.50 | 4.5 | 8 | 37 | 66 |
| Vein-back | 7.40 | 18.60 | 29.90 | 0.10 | 0.50 | 2.0 | 1 | 2 | 3 |
The stability number (N’) for the rock mass conditions for each geotechnical sub-unit is plotted on the stability graph shown in Figure 16.8. This figure is representative of the stope walls and back and illustrates the correlation between N’ and the excavation surface hydraulic radius (HR).
Separate assessments of stope footwall stability were not conducted as part of this study. Based on the limited available geotechnical data it was not possible to differentiate between expected rock mass conditions in the footwall and the hangingwall. As such, AMC assumed the stope hangingwall and back to be the critical stope surfaces for determining stable open spans along the strike of the vein.
For the stope walls, the hydraulic radius is calculated from the inclined stope height (H) and stope length (L) as follows:
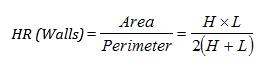
| MAG Silver Juanicipio NI 43-101 Technical Report | |
| MAG Silver Corp. | 717002 |
For the stope back, the hydraulic radius is calculated from the stope width (W) and stope length (L) as follows:
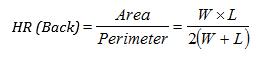
The data for the stability graph method, once determined, is plotted on a stability graph. This graph was developed from the results of a number of case histories and may generally be used as a first pass approximation of where the assessed stope geometries will be in terms of their stability. The graph differentiates areas where stopes may be stable and unsupportable. The graph also indicates confidence intervals for the implementation of cable bolt support of the hangingwall and back as a means of projecting whether or not this support approach may ensure stability of the open stope.
The aim of the assessment was to prohibit the minimum value of the stability number extending beyond the boundaries between the ‘High confidence’ and the ‘Some confidence’ intervals. Figure 16.8 indicates the results of the stability assessment for a 55° dipping vein for the sedimentary and vein lithological sub-units. The results for these units include the average, lower and upper thresholds of the determined modified stability number, N’. The results are presented for the hangingwall (sedimentary) and stope back.
| Figure 16.8 | Stability graph results for the stope HW (vein dip-55°) and stope back |

| MAG Silver Juanicipio NI 43-101 Technical Report | |
| MAG Silver Corp. | 717002 |
The stability graph method has been used to investigate possible stable stope heights for the anticipated excavated strike lengths. A range of vein dips, from 45° to 65°, have been investigated as the dip varies across the project area. The results have been determined for both unsupported and supported cases and are presented in Table 16.4 to Table 16.7. The results are for the lower HR threshold, which AMC believes is applicable for this level of assessment.
| Table 16.4 | Assessment of unsupported stope height for the hangingwall |
| | Stope HW 45 deg. | Stope HW 55 deg. | Stope HW 65 deg. |
| Unit | HR lower | Vein strike length (m) | Vertical height (m) | Inclined height (m) | HR lower | Vein strike length (m) | Vertical height (m) | Inclined height (m) | HR lower | Vein strike length (m) | Vertical height (m) | Inclined height (m) |
| Sedimentary | 4.8 | 24 | 9.2 | 16 | 5.1 | 24 | 14.8 | 18 | 5.5 | 24 | 18 | 20 |
| Table 16.5 | Assessment of unsupported stope width for the back |
| | Back |
| Unit | HR lower | Strike length (m) | Back width (m) |
| Vein-back | 2.25 | 24 | 6 |
| Table 16.6 | Assessment of supported stope heights for the hangingwall |
| | Stope HW 45 deg. | Stope HW 55 deg. | Stope HW 65 deg. |
| Unit | HR lower | Vein strike length (m) | Vertical height (m) | Inclined height (m) | HR lower | Vein strike length (m) | Vertical height (m) | Inclined height (m) | HR lower | Vein strike length (m) | Vertical height (m) | Inclined height (m) |
| Sedimentary | 8.7 | 24 | 44.5 | 63 | 9.3 | 24 | 68 | 83 | 9.3 | 24 | 75 | 83 |
| Table 16.7 | Assessment of supported stope width for the back |
| | Back |
| Unit | HR lower | Strike length (m) | Back width (m) |
| Vein-back | 4.4 | 24 | 12 |
The results obviously indicate that hangingwall stability is influenced by the vein dip. For the lower HR threshold, at a 65° dip, the assessment indicates that a vertical stope height of 15 m will be stable without support. At lower dip angles, tendon support is seen to be required, particularly in the volcanic lithologies. A vein dipping at 45° in the volcanic lithology is indicated to require hangingwall support if the stope panel height is to be 15 m.
Preliminary cable bolt spacing and length may be derived from empirical data (Hutchinson 1996). Figure 16.9 indicates recommended spacing and minimum cable bolt length. The recommended length and spacing of cable bolts are 6 m and 2 m respectively.
| MAG Silver Juanicipio NI 43-101 Technical Report | |
| MAG Silver Corp. | 717002 |
| Figure 16.9 | Recommended spacing and minimum length for cable bolts |
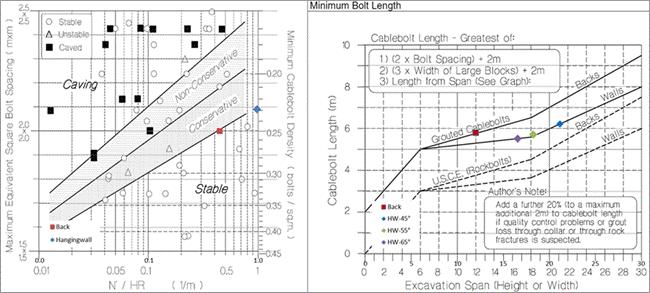
| 16.1.3 | Stope dilution estimation |
Dilution for longhole open stopes has been geotechnically estimated using the equivalent linear overbreak slough (ELOS) technique (Clark and Pakalnis, 1997). This empirical method estimates the overbreak based on recorded case histories and established design curves relating the modified stability number N’ and the hydraulic radius. Stopes are considered likely to overbreak to some degree given the blocky nature of the ground conditions. The dilution estimation is presented in Figure 16.10, which indicates an anticipated dilution of ~0.55 m from a sedimentary hangingwall dipping at 55°.
| MAG Silver Juanicipio NI 43-101 Technical Report | |
| MAG Silver Corp. | 717002 |
| Figure 16.10 | Stope dilution estimated for the HW (dip 55°) |
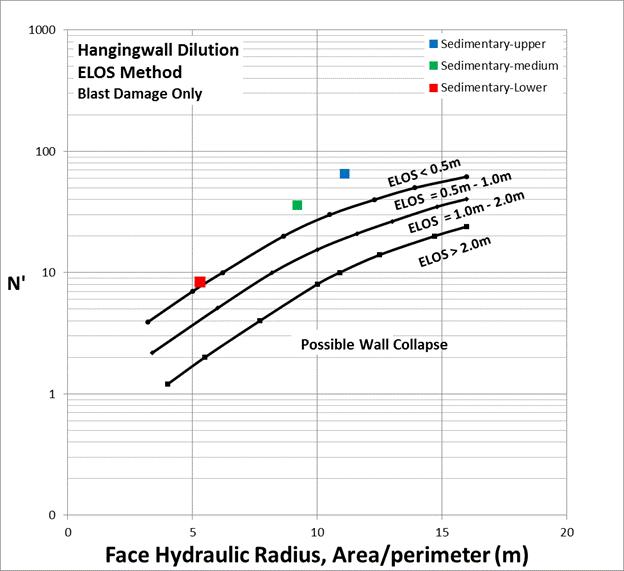
| 16.1.3.1 | Stope design parameters |
Stope dimension recommendations for vein inclinations of 55° and 65° are provided in Table 16.8.
| Table 16.8 | Stope design parameters for vein inclinations of 55° and 65° (unsupported) |
| | Stope HW 55 degrees | Stope HW 65 degrees |
| Unit | HR | Strike length (m) | Vertical height (m) | Inclined height (m) | HR | Strike length (m) | Vertical height (m) | Inclined height (m) |
| Sedimentary | 5.2 | 20 | 18 | 22 | 4.9 | 20 | 17.2 | 19 |
The results of the stability analysis are shown for the dip angles of 55° to 65° in Figure 16.11.
| MAG Silver Juanicipio NI 43-101 Technical Report | |
| MAG Silver Corp. | 717002 |
| Figure 16.11 | Stability graph results for vein inclinations of 55° to 65° |
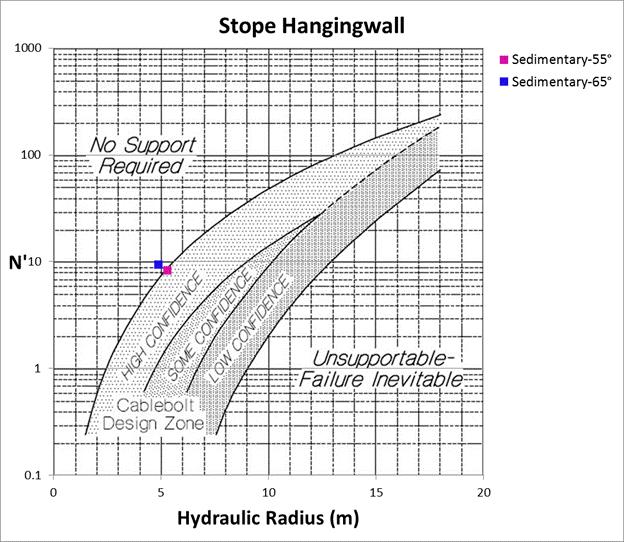
For vein dips from 45° to 55° the analysis indicates that cable bolt support will be required. In addition, consideration will need to be given to the rill angle of muck and the ability to muck the stopes. Cable bolt designs and access requirements will need to be developed. Table 16.9 and Figure 16.12 respectively show stope design parameters and stability graph results for vein inclinations of 45° to 55°.
| Table 16.9 | Stope design parameters for vein inclinations of 45° to 55° (with cable bolt support) |
| | Stope HW 45 degrees to 55 degrees |
| Unit | HR | Strike length (m) | Vertical height (m) | Inclined height (m) |
| Sedimentary | 5.6 | 20 | 20.5 | 25 |
| MAG Silver Juanicipio NI 43-101 Technical Report | |
| MAG Silver Corp. | 717002 |
| Figure 16.12 | Stability graph results for vein inclinations of 45° to 55° |
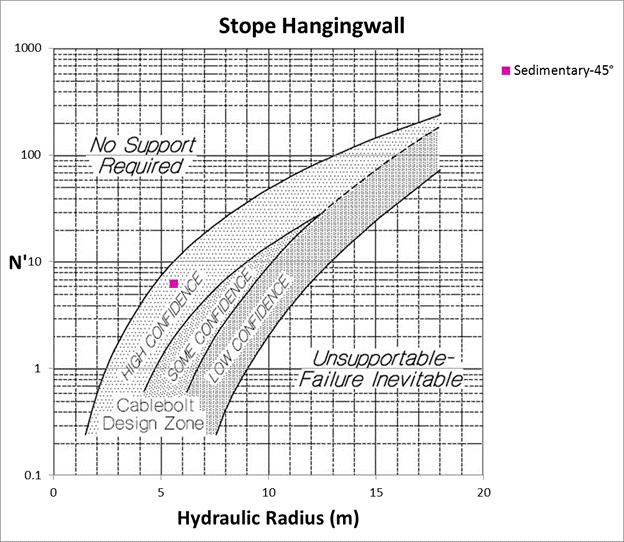
| 16.1.3.2 | Stope back design parameters |
Final open stope back widths up to 15 m maximum are envisaged. Based on the assessments carried out, stope backs of 15 m wide over a 20 m strike length will require cable bolt support. Initial drifts in mineralization are being designed at 4 m (W) x 4 m (H). Cable bolt arrays for the wide areas will need to be designed with the angle of the vein in mind.
| 16.1.4 | Tunnel support design |
The depth of tensile zone around the tunnel provides guidance on the minimum length of tendon required to cater for deadweight loading of the tensile zone on the tunnel periphery. The determination of the extent of the tensile zone assumes that there is no stress interaction between the tunnel and the stoping horizon. Other components that are to be included in deciding upon tendon length include the jointed nature of the host rock, proximity of other excavations, orientation and magnitude of the stress field in which the tunnel is being excavated, anchoring mechanism and the load-bearing capacity of the tendon. No dynamic loading of the support system is expected; therefore, the design is based only on quasi-static loading.
For tunnel intersections, a methodology proposed by Lang (1961) is followed. Lang suggested that for excavation widths of less than six metres, the tendon length should be at least 0.5 x excavation span. He further suggested that for excavation spans between 18 m and 30 m, the length of tendon = 0.25 x span. AMC suggests that the length of tendon required in intersections to complement the already installed support system for the original tunnel dimension is ⅓ x diameter of inscribed circle.
| MAG Silver Juanicipio NI 43-101 Technical Report | |
| MAG Silver Corp. | 717002 |
| 16.1.4.1 | General ground support |
Support units are classed into two very distinct performance categories: active or passive. Active support units are generally prestressed, thereby exerting a resisting force immediately upon installation. Passive support units require movement of the rock wall to generate resistive loads between the grouted tendon and the rock wall. These tendons are generally either cement- or resin-grouted untensioned tendons (e.g. grouted rebar or grouted smoothbar) or friction stabilizers (e.g. Splitsets, Swellex, Hydrabolt, XPandabolt, etc.).
The minimum length of tendon required for full anchorage depends on a number of variables;
| · | Grouted tendon: depends on the strength of the grout, the aperture between the tendon and the wall of the support hole. |
| | |
| · | Friction stabilizer: depends on the profile of the wall of the support hole (i.e. how much of the wall comes into contact with the stabilizer), the support hole diameter, the inflation of the Swellex, Hydrabolt and XPandabolt, etc. |
The lengths of resin- or cement-encapsulated rockbolts recommended for the tunnels at Juanicipio are summarized in Table 16.10.
| Table 16.10 | Tendon support requirements for Juanicipio Mine |
| Excavation | Tunnel dimensions (width x height) | Resin- or cement-anchored rockbolt length | Rockbolt spacing |
| Crown | Sidewalls |
| Decline shaft | 5.5 m x 5.5 m | 2.4 m | 2.4 m long spaced 1.3 m apart to a square pattern | 2.4 m long spaced 1.3 m apart down to the grade line |
| Horizontal drifts | 4 m x 4 m | 2.4 m | 2.4 m long spaced 1.2 m apart to a diamond / staggered pattern | 2.4 m long spaced 1.2 m apart down to the grade line |
| Stope drift | Vein 1 | 6.5 m x 4 m | 3 m | 3 m long Splitsets spaced 1.2 m apart | 2.4 m long rockbolts spaced 1.2 m apart down to the grade line |
| Vein 2 | 4.2 m x 4 m | 3 m | 3 m long Splitsets spaced 1.2 m apart | 2.4 m long rockbolts spaced 1.2 m apart down to the grade line |
| 16.1.5 | Vertical development support design |
AMC (September 2015) conducted a stability analysis on possible vertical development to allow conveying of broken rock from the underground workings to surface. A maximum raisebore diameter was determined for the anticipated ground conditions through which a raisebored shaft could be excavated.
AMC evaluated the stability of a 4 m diameter raisebored shaft, using the geotechnical data obtained from Shaft-02 borehole core. The analysis indicated that: “it is apparent that zones of poor ground will adversely impact the use of raise bores for vertical development and will limit the effective diameter that can be practically achieved”. An issue pertaining to the presence of swelling clays along the Shaft-02 centreline geotechnical drillhole was discussed, and it was recommended that the presence of the swelling clays should be further investigated to identify locations where these may be expected along the length of the possible shaft.
It was further suggested by AMC that a phased approach to obtaining the final shaft dimension should be considered. The suggestion included, for the location in question, the initial development of a smaller diameter raisebored shaft, which would then be slashed to a final dimension using conventional top-down shaft sinking techniques.
| MAG Silver Juanicipio NI 43-101 Technical Report | |
| MAG Silver Corp. | 717002 |
Only the Rock Quality Designation (RQD) geotechnical parameter was logged on the Shaft-02 centreline core. Initial indications are that the core appears to be generally fairly competent, except for a few zones where the RQD value is zero. These are possibly the zones of swelling clay. Based on the limited geotechnical data from the centre-line core log for this potential shaft location, AMC does not consider that there is, as yet, sufficient geotechnical data on which to conduct a shaft support design.
AMC reiterates that geotechnical centre-line logging of a site specific geotechnical drill-hole should be a key part of any decision on an actual shaft location and design.
| 16.2 | Mineral Resource and PEA |
In December 2016, MAG Silver commissioned AMC to prepare an independent estimate of the Mineral Resources of the Property compiled using exploration data available up to December 2016. This Mineral Resource estimate is discussed in Section 14 of this Technical Report and is the basis for the 2017 PEA. An NSR field was added to the resource block model (reference jua_engineer.bm) for selection of mineralization above the established cut-off value.
The NSR field is calculated as follows:
NSR = 32.164*AUOK+0.483*AGOK+10.019*PBOK+12.394*ZNOK
Notes
AUOK: Gold grade, g/t
AGOK: Silver grade, g/t
PBOK: Lead grade, %
ZNOK: Zinc grade, %
Mineral Resources have been identified within the main Valdecañas vein system and the Juanicipio vein. This PEA only considers the Valdecañas vein system.
An estimation of the economically viable mineralization was generated using the stope shape optimizing software, Mineable Shape Optimizer (MSO), on the Mineral Resource block model. The estimation is based on the application of the longhole mining method with rock fill and all supporting development. Stope wireframes were generated using MSO on a 3 m increment. Additional factors for unplanned dilution of 10% at zero grade and mining recovery of 90% were applied to the tonnes and grade of the MSO shapes and the NSR recalculated to ensure mineralization remains economically viable. A final check was made to remove any outlying stopes that would not be economic when the cost of access development was included.
The cost of access development was then determined for each level and each level was evaluated to determine if the value was sufficient to pay for its access. Once the projected economic value stopes were selected, the wireframes were combined into stopes 24 m in length.
The MSO parameters used for the generation of stope wireframes are summarized in Table 16.11.
| MAG Silver Juanicipio NI 43-101 Technical Report | |
| MAG Silver Corp. | 717002 |
| Table 16.11 | MSO parameters used to estimate economically viable mineralization |
| Parameter field | Parameter value |
| NSR cut-off value | $55/t |
| Density, default (waste) | 2.51 t/m3 |
| Default dip (seed) | 66° |
| Default strike azimuth (seed) | 30° |
| Sub-stoping | None |
| Stope slice interval | 1 m (perpendicular to strike) |
| Model discretization interval | Vertical: 4, Horizontal: 4 |
| Stope waste max fraction | 1:1 |
| Stope creation interval | 3 m (along strike) |
| Stope height / sublevel interval | 20 m |
| Model evaluation plane | XZ |
| Stope width | Minimum: 3 m, Maximum: None |
| Waste pillar width | Minimum: 7 m |
| Dilution* | Hangingwall: 0.55 m, Footwall: 0.55 m |
| Stope dip | Minimum: 45°, Maximum: 70° |
| Strike angle tolerance | Maximum: 45°, Maximum Change: 20° |
| Side-length ratio | Maximum: 2.25 |
| Stope orientation plane | XZ |
*The MSO dilution parameters represent averages for the entire stoping area.
| 16.4 | Net Smelter Return (NSR) |
An NSR value field was generated in the Mineral Resource model and used to select the projected economic stopes. The cut-off value selected represents the estimate of operating costs. The assumptions for the NSR calculation are summarized in Table 16.12.
| Table 16.12 | NSR calculation assumptions |
| Parameter field | Unit | Parameter value |
| Gold price | $/oz | 1225.00 |
| Silver price | $/oz | 17.30 |
| Lead price | $/lb | 0.87 |
| Zinc price | $/lb | 0.94 |
| Gold recovery | % | 82 |
| Silver recovery | % | 95 |
| Lead recovery | % | 93 |
| Zinc recovery | % | 90 |
| Lead concentrate grade | % | 43 |
| Zinc concentrate grade | % | 52 |
| Lead concentrate treatment charge | $/dmt | 235 |
| Zinc concentrate treatment charge | $/dmt | 235 |
| Concentrate transport cost | $/wmt | 115 |
| Silver refining cost | $/oz | 1.50 |
| Gold refining cost | $/oz | 5.00 |
| Concentrate moisture | % | 10 |
| NSR cut-off value | $/t | 55.00 |
| MAG Silver Juanicipio NI 43-101 Technical Report | |
| MAG Silver Corp. | 717002 |
In order to initially arrive at an appropriate production rate that can be supported by the deposit, AMC has used a combination of Taylor`s rule of thumb and vertical tonnes per metre to project production ranges.
Production rate based on Taylor’s rule of thumb is estimated at 1.6 Mtpa.
Annual Production Rate = 5 * ‘Mineable mineralization’0.75
Most successful narrow vein mines do not exceed 30 to 40 vertical metres/annum. Based on the mineralization by level, this would be equivalent to 1.4 Mtpa.
AMC has recommended a production rate of 1.4 Mtpa (4,000 tpd). This production rate is well supported by the production scheduling.
| 16.6 | Mineralized rock and waste handling |
A number of trade-off studies were undertaken to identify the optimum mineralized rock and waste handling systems. One of the initial studies considered moving the processing plant from near the mine portal to an alternate site near the main highway. This study identified that conveying the mineralized rock directly to the relocated process plant from underground was economically and operationally superior to other arrangements. The other arrangements included trucking all mineralized rock to surface and then either conveying, piping or trucking the rock to the processing plant located either near the portal or near the main highway.
The results of the trade-off studies involving the underground conveyor indicated a pre-tax NPV benefit of $84M for the conveyor option over the next best option (surface truck haul). The construction schedule also showed that when mineralized rock was first produced, three months of construction remained to be completed on the underground conveyor. During this period, it was assumed that the mineralized rock (approximately 0.1 Mt) would be trucked via the ramp to the current portal and then from there to the mill. The underground conveyor, once constructed, was seen as the primary means of mineralized rock transport to the mill.
The trade-off studies also assumed that all waste would be trucked to surface or placed into stopes as available. AMC has projected that there will be a waste fill deficit in Year 11 of the mine life. It was assumed that the additional waste needed would be sourced from a small pit near the waste stockpile. All waste required from surface would be transferred via a waste pass to 1820 RL for loading and distribution to stopes as required.
Based on the selected depth of the start of the underground conveyor (1940 RL), further analysis in the form of a trade-off study was undertaken to determine the optimum method of handling mineralized material from below 1940 RL. AMC considered several options including trucking, vertical conveying and hoisting via a winze. Of these options trucking was found to be the best economically. However, the economic benefit differences were small between the three systems and well within the accuracy range, and there were seen to be some operational benefits to hoisting or conveying over trucking. Further work was undertaken from a long-term point of view to consider a potentially expanded resource at depth (on the basis of approximately 20% additional material to current Mineral Resources) and the possible impact on mine economics. The potential additional material was envisaged as an extension to the mine life. This assessment and other operational considerations resulted in the underground winze being the preferred option for handling mineralized material from depth. The underground winze is scheduled to commence hoisting in Year 8 of the PEA study timeline.
Three internal ramps are used to access the mineralization, as shown in Figure 16.13, waste accesses are developed in the footwall to provide access for backfill directly off the main ramp systems east and west along strike.
| MAG Silver Juanicipio NI 43-101 Technical Report | |
| MAG Silver Corp. | 717002 |
| Figure 16.13 | Access development composite plan layout (over three production levels) |
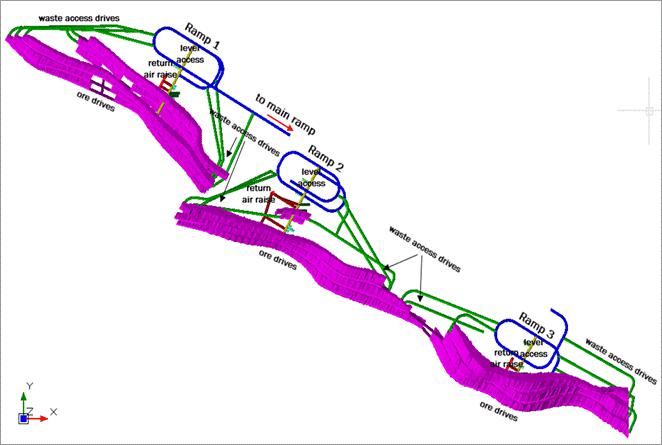
Table 16.13 provides a summary of the access development metres required over the projected LOM.
| Table 16.13 | Development quantities (m) for access design |
| | Access development (m) |
| Access declines* | 22,746 |
| Conveyor decline | 4,230 |
| Return air drives | 4,614 |
| Remuck bays | 2,655 |
| Waste access drives | 37,914 |
| Development in mineralization | 65,935 |
| Other waste development | 3,691 |
| Infrastructure development | 1,990 |
| Total lateral development | 143,775 |
| Ventilation raises | 5,198 |
| Winze | 780 |
| Rock passes | 2,691 |
| Total vertical development | 8,669 |
*Ramp development assumes an additional 13% of miscellaneous ancillary development (not designed), and level access development assumes an additional 20% in order to account for sumps, etc.
| MAG Silver Juanicipio NI 43-101 Technical Report | |
| MAG Silver Corp. | 717002 |
It is envisaged that the veins would be divided into six stoping sections (three zones comprising east and west stopes) with each zone accessed by a decline. Access crosscuts from the declines to the veins would be positioned approximately in the centre of each pair of stoping sections to enable stope extraction to progress on retreat from the end of each stoping section to the central access. Each stoping section would have a maximum strike length of approximately 250 m.
It is envisaged that, at the base of each sub-zone, sill pillars would vertically separate the stoping sections into independently accessed stoping areas providing flexibility in production scheduling and simplifying ventilation, stope mucking, and truck loading arrangements.
A composite plan view of the mine design is shown in Figure 16.14 and a long-section view is shown in Figure 16.15.
| Figure 16.14 | Composite plan view of the underground mine design |
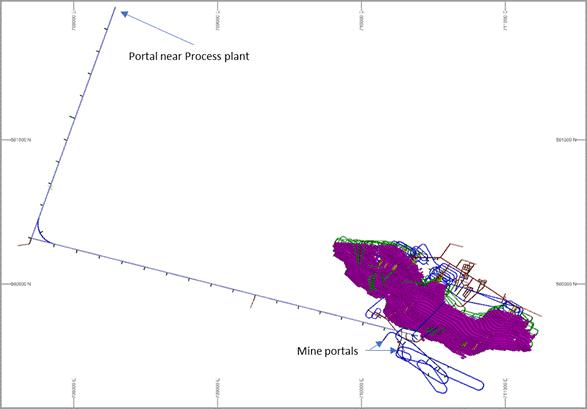
| MAG Silver Juanicipio NI 43-101 Technical Report | |
| MAG Silver Corp. | 717002 |
| Figure 16.15 | Long-section view of the underground mine design |
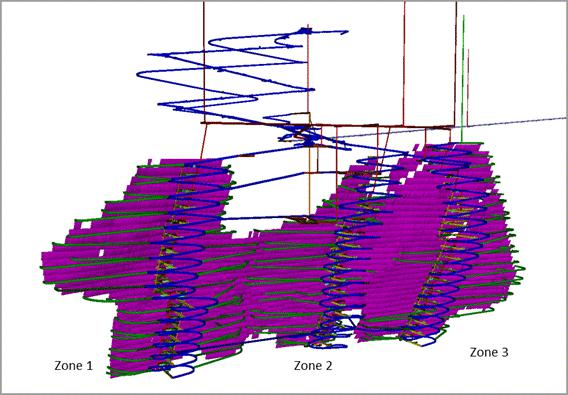
Figure 16.16 provides a long-section view of the development and underground infrastructure only (Mineral Resource not shown).
| MAG Silver Juanicipio NI 43-101 Technical Report | |
| MAG Silver Corp. | 717002 |
| Figure 16.16 | Long-section view of the access development and underground infrastructure |

| 16.9 | Tonnage and grade of projected material to be mined and milled |
Table 16.14 shows the tonnage and grade of material projected to be mined and milled, which forms the basis of the updated PEA.
| Table 16.14 | Tonnage and grade of projected material to be mined and milled |
| | Tonnes | Ag (g/t) | Au (g/t) | Pb (%) | Zn (%) |
| 1 Zone | 10,235,093 | 275 | 1.40 | 2.01 | 3.53 |
| 2 Zone | 6,158,665 | 307 | 1.22 | 1.86 | 3.41 |
| 3 Zone | 6,729,948 | 270 | 1.45 | 1.58 | 3.26 |
| Total | 23,123,706 | 282 | 1.37 | 1.84 | 3.42 |
Totals may not compute exactly due to rounding adjustments.
Geotechnical evaluation of dilution for longhole stopes using the equivalent linear overbreak slough (ELOS) technique suggests approximately 0.5 m from the hangingwall of the LUAR rocks in which most mining is projected to take place.
There are two main sources of dilution in narrow vein stopes:
| · | Planned dilution. This is the dilution required to achieve the designed stope shape. Designed dilution can result from waste included: |
| ¾ | To achieve minimum mining width. |
| ¾ | To achieve a viable mining shape. |
| · | Unplanned dilution. This is dilution that is outside of the designed stope shape. Depending on the mining method, it may include both overbreak and floor dilution. |
| ¾ | Overbreak is typically a result of blasting practices and geotechnical conditions. |
| ¾ | Floor dilution is the result of mucking waste rock from the rock fill floor. |
| MAG Silver Juanicipio NI 43-101 Technical Report | |
| MAG Silver Corp. | 717002 |
AMC has applied a planned dilution of 0.55 m to each of the hangingwall and the footwall with a minimum stope width of 3 m. The stope shape is then evaluated against the Mineral Resource model. An additional 10% is assumed for unplanned dilution at zero grade. A mining recovery factor of 90% has also been applied to the stopes.
The study assumed that all filling of production stopes would be achieved with the use of unconsolidated waste, other than for wider stoping areas where cemented rock fill may be used. Figure 16.17 below profiles the waste planned to be available through the mine development and also the projected shortfall, which is assumed to be accounted for by excavation from a small waste pit located near to the surface collar of a waste pass (or from any other readily available broken waste source). Approximately 6.2 Mt of waste rock will be required over the life of mine; this quantity takes into account actual waste development completed to date. The envisaged waste pit would need to be approximately 400 m in length, 400 m wide and 20 m deep to provide the quantity of fill required. AMC has estimated the cost of mining the surface waste and hauling it to the waste pass collar. The assumptions for surface waste mining are summarized in Table 16.5.
| Table 16.15 | Key assumptions for surface waste mining |
| Parameter | Optimization study |
| Pit size | 400 m L, 400 m W and 20 m deep |
| In pit average haulage distance | 1.5 km |
| Level haulage distance | 3 km |
| Trucks | 40 t |
| Loader | Cat 950 |
| Cycle time | 39 minutes |
| Drill, blast, and crush cost | $0.94/t |
| Truck cost | $96/hr |
| Loader cost | $55/hr |
| Loader operating hours / annum | 5,500 |
| Truck operating hours / annum | 4,200 |
Based on these assumptions the average surface waste mining cost is estimated to be $0.87/t of mineralized material in the PEA production plan. It is assumed that the waste will be mined by a contractor. Surface waste mining will be required from Year 11, at an average of 560 ktpa and a maximum of 800 ktpa. Total quarried rock required is estimated at 6.2 Mt over the life of mine.
| MAG Silver Juanicipio NI 43-101 Technical Report | |
| MAG Silver Corp. | 717002 |
| Figure 16.17 | Waste rock fill production and demand |
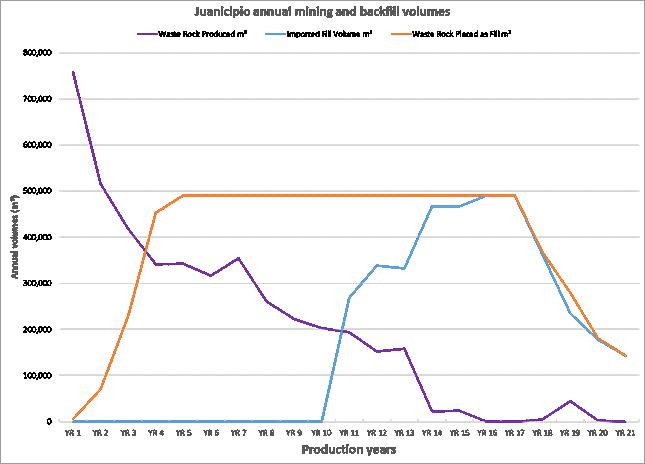
As a comparison against waste rock fill, a cost for paste fill of $1.17/t mineralized material was also determined by AMC. This is based on the assumption that cement is added at a rate of 3.5% and that bulk cement costs are $150/t. In order to fill the stopes with paste fill approximately 3.8 Mm3of pastefill would be required over the LOM. A pastefill plant is estimated to cost about $12M.
It was determined that the use of waste rather than paste as backfill will result in a significant cost saving over the LOM.
The ventilation system has been designed to meet the requirements of Mexican Regulations and industry best practices. The ventilation system for Juanicipio is designed as a ‘pull’ system with primary exhaust fans located on surface at the top of each primary exhaust raise, with the exception of the exhaust raise for the conveyor decline near the winze, where a smaller fan is located at the bottom of the raise. Figure 16.18 shows the projected steady state ventilation configuration. Fresh air is delivered into the mine from the two declines, conveyor decline and fresh air raises. Internal return air raises carried with the production ramps connect to a dedicated return airway and the exhaust raises to surface.
| MAG Silver Juanicipio NI 43-101 Technical Report | |
| MAG Silver Corp. | 717002 |
| Figure 16.18 | Ventilation system overview* |

*Main flows and directions are shown in Figure 16.19.
Regulations extracted from the Mexico Regulations for Safety and Hygiene in Mines (Norma Oficial Mexicana NOM-023-STPS-2012) that are relevant to the design of the ventilation system are summarized as follows:
| · | Each horsepower of diesel combustion motor driven machinery located in the interior of the mine must be supplied with a minimum of 2.13 cubic metres of air per minute (equivalent to approximately 0.05 m3/s/kW). |
| · | In any areas where diesel engines operate, a minimum air velocity of 15.24 metres/minute (approximately 0.25 m/s) must be maintained. |
| · | A volume of air equal to 1.5 cubic metres per minute per worker must be supplied to the interior of the mine. |
In addition to ensuring that the ventilation design meets the regulatory requirements noted above, consideration has also been given to best practice employed at comparable mines. As such, the design criteria shown in Table 16.6 were adopted for the design of the ventilation system for the Juanicipio project.
| MAG Silver Juanicipio NI 43-101 Technical Report | |
| MAG Silver Corp. | 717002 |
| Table 16.16 | Ventilation velocity criteria |
| Airway | Minimum velocity (m/s) | Criteria | Maximum velocity (m/s) | Criteria |
| Ramps / travel ways | 0.5 | Desirable minimum airflow for areas where personnel are present | 6 | 5 m/s is the velocity at which visible dust can become entrained in air resulting in reduced visibility and dusty working areas |
| Working area | 0.5 | Desirable minimum velocity for areas where personnel are present | 4 | Dust minimization, personal comfort |
| Conveyor decline | 0.5 | Desirable minimum velocity for areas where personnel are present | 6 | Limit liberation of dust from conveyed material |
| Return air raise (RAR) | No minimum | Air velocities between 7 m/s and 13 m/s should be avoided in up-cast RARs to prevent formation of water blankets | 20 | Economic considerations - in certain conditions velocity can be exceeded |
| Emergency egress | 0.5 | Desirable minimum velocity for areas where personnel are present | 10 | Avoid creation of additional hazards in the form of dust and decreased mobility in any area used for emergency egress |
| Drawpoint | 0.5 | Desirable minimum velocity for dust and blast fume removal | No maximum | |
| Return air drive | 0.5 | | 12 | Maximum for personnel to be able to travel |
| 16.12.2 | Airflow determination |
Two approaches have been used to estimate the total quantity of air required to ventilate the mine:
| · | An assessment of the operating diesel fleet required for the maximum anticipated production and development activities, and the airflow required to meet statutory requirements. |
| · | An assessment of airflow required for personnel based upon Mexico Regulation 8.4.4 (a) (1). |
In addition, an airflow allowance is also required for underground infrastructure and leakage, and for balancing inefficiencies.
| 16.12.2.1 | Airflow for underground infrastructure |
The Juanicipio mine design includes an underground workshop with fuel bay and an underground magazine. As such, some fresh air will be supplied to these areas with the exhaust from each location reporting to a dedicated return air raise. The amount of air reporting to these areas will satisfy the minimum design velocity criteria. Table 16.17 shows the airflow allocations for the underground infrastructure.
The ventilation configuration and airflow requirements, including for the conveyor decline, are discussed in greater detail below. The conveyor decline is planned to be supplied with 37 m3/s of air.
| Table 16.17 | Infrastructure airflow allowance |
| Area | Airflow (m3/s) |
| UG workshop | 28 |
| Crusher airflow | 40 |
| UG magazine | 14 |
| Conveyor decline | 37 |
| Total | 119 |
| 16.12.2.2 | Airflow determination based on diesel fleet size |
An estimate of the diesel equipment fleet anticipated to be operating in the mine at any time is shown in Table 16.18. When estimating the effective equipment to be included in the calculation, it has been assumed that only a portion of the support equipment (service vehicles and light vehicles, etc.) is operating or active within the mine at any one time. The manufacturer’s nameplate engine power has been used to estimate ventilation quantities for each type of equipment. AMC notes that the equipment list shown in Table 16.18 is an estimate of the number of operating units during peak production. Per Mexico Regulation 8.4.4 (a) (2), the airflow quantities have been based on a dilution factor of 0.05 m3/s per kW.
| MAG Silver Juanicipio NI 43-101 Technical Report | |
| MAG Silver Corp. | 717002 |
| Table 16.18 | Airflow requirements |
| Equipment | No operating | Power (kW) | Utilization (%) | Airflow (m3/s) |
| Scoop (14 t) | 9 | 256 | 100 | 111 |
| Trucks (40 t) | 6 | 405 | 100 | 117 |
| Jumbo | 9 | 110 | 40 | 19 |
| Bolter | 9 | 55 | 40 | 10 |
| Development charge-up | 4 | 110 | 20 | 4 |
| Production charge-up | 3 | 110 | 20 | 3 |
| Production drill rig | 3 | 75 | 20 | 2 |
| Cable bolter | 2 | 110 | 20 | 2 |
| Spraymec | 3 | 100 | 40 | 6 |
| Trans-mixer | 4 | 155 | 60 | 18 |
| Grader | 1 | 140 | 100 | 7 |
| Landcruiser | 10 | 100 | 40 | 19 |
| Water truck | 2 | 140 | 100 | 14 |
| Scissor lift | 3 | 120 | 50 | 9 |
| Fuel truck | 2 | 120 | 40 | 5 |
| Boom truck | 2 | 120 | 40 | 5 |
| Telehandler | 2 | 120 | 40 | 5 |
| Explosive truck | 2 | 120 | 40 | 5 |
| Light vehicle | 17 | 75 | 25 | 15 |
| Total | 93 | | | 376 |
| 16.12.2.3 | Airflow for personnel |
Noting Mexico Regulation 8.4.4 (a) (1), 1.5 m³/minute of airflow must be supplied for each worker underground. Based upon the manpower calculations in Section 16.11 of this report, a total of up to approximately 200 personnel may be underground on any shift. This equates to 5 m³/s of airflow.
| 16.12.2.4 | Total airflow requirement |
To ensure that the local regulatory standards are met, at least 376 m3/sec should pass through the active mine workings. All mines experience leakage and balancing inefficiencies in the distribution of air through the mine workings. It is therefore common to add a contingency to the total primary airflow of between 10% and 30% above the airflow calculation. AMC has factored the calculated air quantity by 10%.
With the infrastructure airflow and leakage and balancing allowances the total airflow determination based on the diesel fleet size is 550 m3/s (Table 16.19).
| Table 16.19 | Total airflow allowance |
| Area | Airflow (m3/s) |
| Underground infrastructure | 119 |
| Diesel equipment | 376 |
| Personnel | 5 |
| Leakages and losses | 50 |
| Total | 550 |
| MAG Silver Juanicipio NI 43-101 Technical Report | |
| MAG Silver Corp. | 717002 |
| 16.12.3 | Ventilation modelling |
AMC has conducted ventilation modelling (Ventsim™) for the Juanicipio project for three primary purposes:
| · | To validate the operability of the ventilation circuit to ensure airflow can be provided to all the required areas. |
| · | To ensure compliance with design criteria. |
| | |
| · | For determination of peak permanent primary fan duties. |
Peak primary fan duties will occur with maximum concurrent development and production activity in the lowest levels of each ventilation district. Airway dimensions and friction factors used in the modelling are summarized in Table 16.20.
| Table 16.20 | Airway dimensions and friction factors |
| | Excavation method | Profile | Height (m) | Width (m) | Friction factor (kg/m3) |
| Main decline / production ramp and other lateral development | Drill and blast | Arched | 5.5 | 5.5 | 0.012 |
| Conveyor decline | Drill and blast | Arched | 5.5 | 5.5 | 0.015 |
| Level to level exhaust raises | Raisebore | Round | 4.0 (diameter) | n/a | 0.004 |
| Return air raises to surface | Raisebore | Round | 3.5 (diameter) | n/a | 0.004 |
| Fresh air raises to surface | Raisebore | Round | 3.5 (diameter) | n/a | 0.004 |
| 16.12.4 | Ventilation control and distribution |
The distribution of the required airflow from the primary intakes to the working areas will be controlled by a combination of regulators and fans.
The crusher area at the bottom of the deposit will be ventilated via fresh air going down the main shaft. The dust generated at the tipple will be carried with the exhaust air leading to the internal return air raise system on level 1310 RL. Auxiliary fans will be used to deliver fresh air to the production levels. Drop-board regulators in the return air raises on each level access will ensure that the required amount of air is supplied to the auxiliary fans.
To ensure the primary airflow is available in sufficient quantities to the active working places, diligent airflow monitoring and control will be required as development in mineralization and waste access drives progresses to breakthrough.
| 16.12.5 | Ventilation circuit operability |
Main intake airways are comprised of one main access decline, a secondary decline and one raise (raisebored) to surface. The main and secondary declines deliver fresh air to the active production levels in Zones One and Two. Fresh air for Zone Three is supplied by the intake raise to surface. With the appropriate amount of regulation at the exhaust raise on the level accesses, the appropriate airflow will be supplied to the auxiliary fan(s) forcing air to the production areas.
The main exhaust circuit comprises return air raises on each production level access that deliver air to the main exhaust airway running from the top of the deposit to the base of a series of main exhaust raises. The main axial exhaust fans are positioned on surface at the top of each raise, with the exception of the exhaust raise for the conveyor decline near the winze, where a smaller auxiliary fan is located at the bottom of the raise.
A minimal amount of fresh air will travel down the projected winze shaft and associated conveyor infrastructure. The air will ultimately report to an exhaust drift at the base of the two rock pass systems. This air volume will be sufficient to support the operation of the two required production scoops in the area. These scoops will load, haul and dump mineralized material from the base of the rock passes to the winze loading bin.
| MAG Silver Juanicipio NI 43-101 Technical Report | |
| MAG Silver Corp. | 717002 |
Figure 16.19 shows a schematic of the steady state Juanicipio ventilation circuit with airflows and air velocities in key intake and exhaust airways. The airflow to the active working areas is distributed as needed while adhering to the mine design criteria.
| Figure 16.19 | Steady state ventilation configuration |
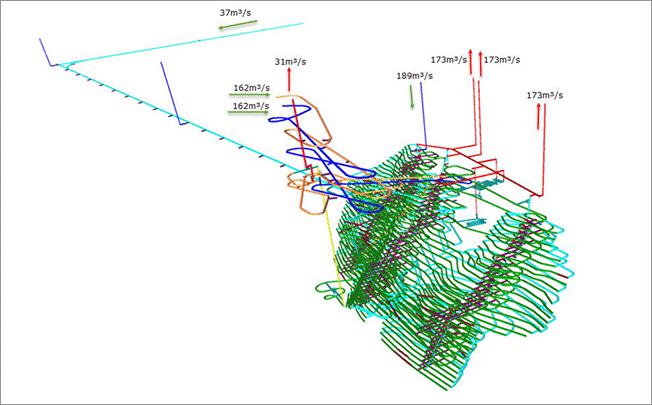
| 16.12.6 | Primary fan duties |
AMC carried out computer simulation of the proposed ventilation circuit to determine reasonable airway dimensions and to determine the duty of the main ventilation fans. Based on the use of raisebored shafts, three identical 3.5 m diameter axial flow fans horizontally mounted on the shaft collars would be suitable. When the mine is fully developed, the fans are projected to operate at a pressure of approximately 2.9 kPa and a power draw of 675 kW each. The fans would be fitted with 810 kW motors.
| 16.12.7 | Auxiliary ventilation |
During access and level development, distances of up to 1,000 m are to be ventilated using auxiliary systems. The peak airflow requirements during development activities will be that for a 40 t truck and 14 t scoop, requiring 33 m³/s.
Modelling indicates that a parallel system comprised of two-stage 55 kW fans (in series) with 1,220 mm diameter low resistance, low leakage ducting will supply 33 m3/s up to 1,000 m. As shown in Figure 16.20, this arrangement allows for adequate overhead clearance for a fully loaded 40 t truck.
| MAG Silver Juanicipio NI 43-101 Technical Report | |
| MAG Silver Corp. | 717002 |
| Figure 16.20 | Cross section of decline development |
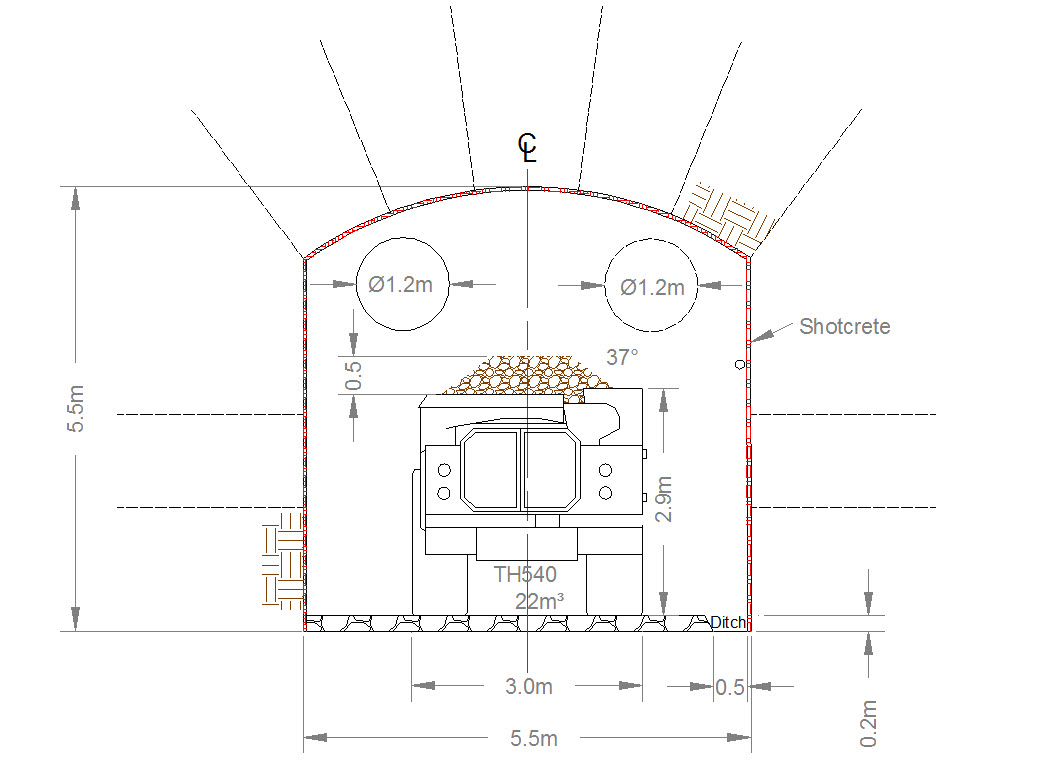
For drive development in mineralized material and production activities, the largest piece of diesel equipment operating in the heading will be a 256 kW, 14 t loader. The loader will require 12.5 m3/s of air. Ventilation modelling indicates that a single 55 kW fan and a 1,000 mm duct will supply this airflow up to 400 m. A duct size of 1,200 mm can be employed for longer forcing distances.
| 16.12.8 | Ventilating the conveyor decline |
The two legs of the conveyor decline total approximately 4.2 km in length. The development of the decline will require long force-ventilation distances and raises to surface. AMC undertook an assessment to develop a ventilation strategy to optimize the number of ventilation raises to surface.
The assessment considered both the use of flexible ducting and rigid ducting with in-line booster fans. A cost analysis including ducting costs, development fan capital and operating costs, and raise development costs formed the basis of the assessment. The outcome of the assessment indicated that adopting flexible ducting and three strategically placed raises to surface provides the lowest total cost.
This selected strategy involves a maximum forcing distance of approximately 1,500 m with flexible ducting before a raise is established from the conveyor decline to the surface. To provide the required amount of air to the face, two parallel 1,220 mm diameter ducts each fitted with two 90 kW fans in series will be required. The prescribed maximum forcing distance in combination with the available mining faces advancing at anticipated development rates allows for the use of only three raises to surface along the length of the conveyor decline. During steady state production the Stage 3 FAR will serve as the conveyor decline exhaust raise.
This ventilation strategy is outlined in Figure 16.21.
| MAG Silver Juanicipio NI 43-101 Technical Report | |
| MAG Silver Corp. | 717002 |
| Figure 16.21 | Conveyor decline development ventilation strategy |
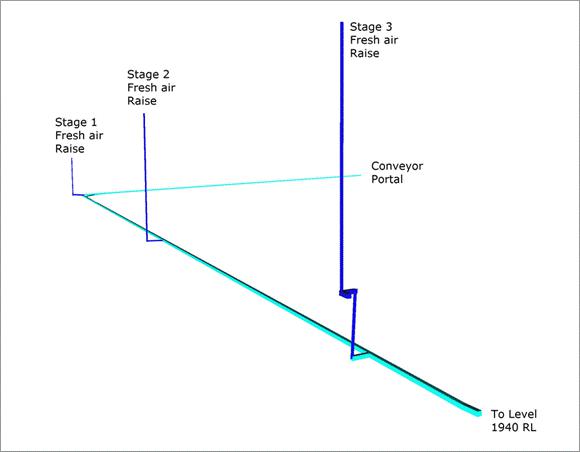
| 16.12.8.1 | Conveyor decline airflow requirement |
During steady state operations, the conveyor decline may act as a primary means of access for personnel travelling in light vehicles, primarily at shift change. AMC has included 37 m3/s of fresh air to ventilate the conveyor decline. This volume will meet the minimum air velocity design criteria, provide sufficient air to support the maximum anticipated level of diesel equipment likely to be concurrently operating within the decline, and be of a sufficiently low velocity to maintain acceptable dust levels.
| 16.12.8.2 | Conveyor risk of fire |
An underground conveyor belt carries the risk of a conveyor belt fire. AMC believes that, with the appropriate measures in place, the risk of a conveyor fire can be safely managed, as has been, and is being done at many mining operations.
To manage the risk, the design includes allowance for the following:
| · | Fire retardant grease and lubricants. |
| · | Ventilation controls to isolate the air in the conveyor decline in the event of a fire. |
| · | Regular inspection of the conveyor decline during operation in order to detect the development of faulty rollers, belt misalignment, or excessive dust build-up. |
The conveyor decline will be a fresh air intake but the air will not be reused as it reports directly to the exhaust raise located near the crusher. In the unlikely event of a conveyor belt fire, smoke will not be introduced into the primary ventilation circuit. Fire-rated airlock doors in the connecting development from the conveyor decline to the main ramp will be required.
| MAG Silver Juanicipio NI 43-101 Technical Report | |
| MAG Silver Corp. | 717002 |
| 16.13 | Stope drill and blast design |
LHOS with waste rock fill is the primary mining method for Juanicipio. The following design parameters, assumptions and constraints have been incorporated into the drill and blast design:
| · | Applicable explosives products have been identified (e.g. bulk emulsion, packaged explosive products, and electric and non-electric detonators). |
| · | Designs are understood to be not final. |
| · | The stope size ranges are: 20 m high (floor to floor), width varies from 4 m to 15 m, and total stoping panel lengths range from 150 m to 350 m. |
| · | Longhole stopes will be filled with waste rock fill and the fill kept within 20 m of the retreating production face. |
| · | Overcuts and undercuts are 4.5 m high and from 4 m to 15 m in width. |
| · | Production drills must be capable of drilling holes with diameters up to 102 mm. The production drill must also be capable of drilling 154 mm reamer holes. |
| · | All holes are assumed to be drilled to maximize drilling accuracy, minimize hole-loading and blasting problems, minimize dilution, and optimize fragmentation. |
| · | No advice on standards / procedures and / or safety issues is provided in this document, although these issues must be fully addressed before stoping commences. |
| 16.13.1 | Drill selection for stoping |
The recommended production drill rig is the Sandvik DL431-7 or equivalent (slot and production blasthole drilling).
The Sandvik DL431-7 is capable of drilling holes with diameters between 76 mm and 102 mm in a single pass to a depth greater than 38 m down-hole. Larger hole diameters up to 154 mm can be drilled in multiple passes, but this may result in significant extra wear on the drill. The drill rig is suitable for accurate drilling of the downhole drop raise blastholes and the slot blastholes. It is also capable of operating under remote and tele-remote control making it suitable for production ring drilling if required.
| 16.13.2 | Stope layout and design |
Figure 16.22 and Figure 16.23 show an example of a LHOS plan view and LHOS cross section of production rings with a height of 20 m (floor to floor), width from 4 m to 15 m, lengths of 150 m to 350 m, and a vein width from 4 m to 15 m.
The LHOS overall design powder factor including the relief raise, slot and production rings is 0.4 kg/t.
| MAG Silver Juanicipio NI 43-101 Technical Report | |
| MAG Silver Corp. | 717002 |
| Figure 16.22 | LHOS plan view |
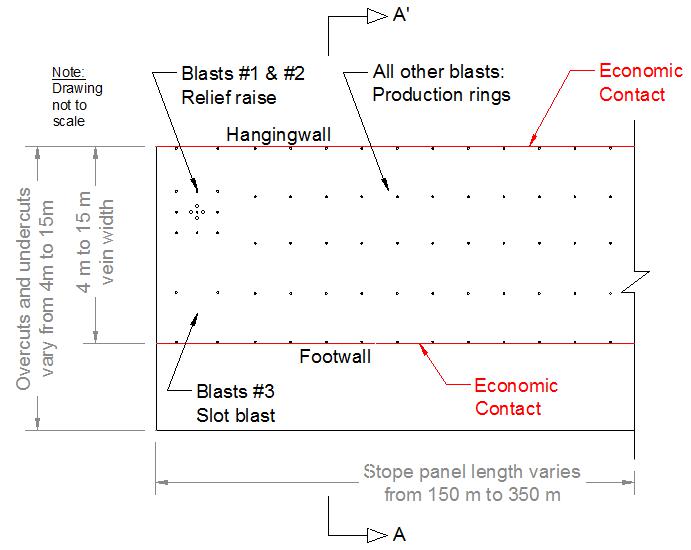
| Figure 16.23 | LHOS cross section view of production rings |
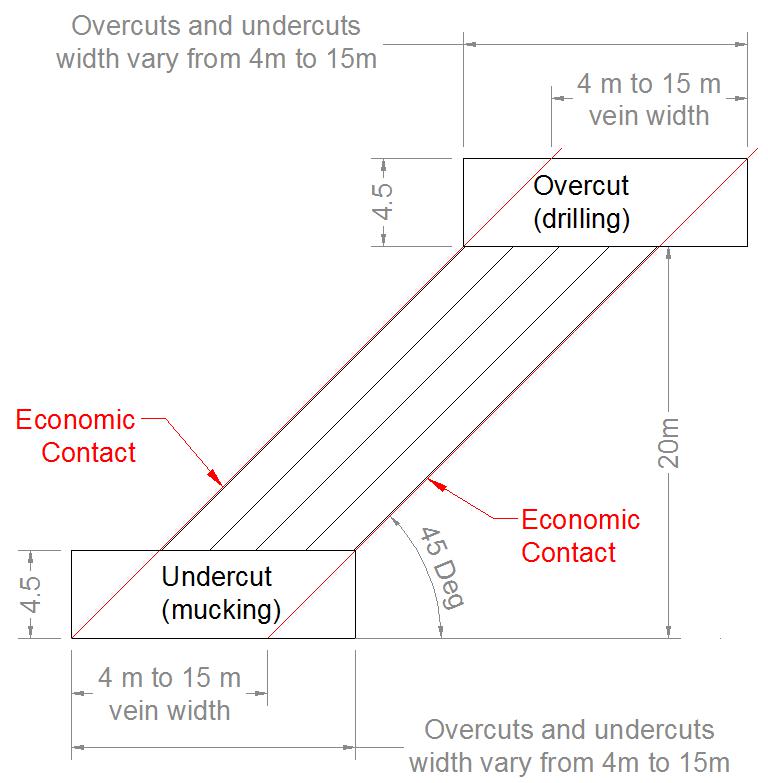
| MAG Silver Juanicipio NI 43-101 Technical Report | |
| MAG Silver Corp. | 717002 |
| 16.14 | Lateral development blast design |
The following indicates assumptions and constraints for blast design for both the main ramp and overcut / undercut development at Juanicipio:
| · | Explosive products have been selected (e.g. bulk emulsion, packaged explosive products, non-electric detonators, and electronic initiator detonators). |
| · | Main ramp development rounds are 5.5 m high and 5.5 m wide. |
| · | Overcut / undercut development rounds are 4.5 m high and (nominally) 4.5 m wide. |
| · | Drills must be capable of reaming drilling holes to a diameter up to 102 mm. |
| · | All holes are assumed to be drilled to maximize drilling accuracy, minimize hole-loading and blasting problems, minimize dilution, and optimize fragmentation. |
The overall powder factor using bulk emulsion for this development drive design is 1.05 kg/t.
| 16.14.1 | Drill selection for lateral development |
The recommended development drill is the Sandvik DD421-60C or equivalent.
| 16.15 | Explosives consumption |
The Juanicipio underground mine will consume approximately 75 t/month of bulk emulsion. The design powder factors for LHOS and lateral development are summarized in Table 16.21.
| Table 16.21 | Design powder factors for LHOS and development |
| Description | Powder factor (kg/t) |
| LLHOS (average) | 0.40 |
| Main ramp development | 1.05 |
| 16.16 | Project development and production schedule |
Minera Juanicipio is currently developing an access decline to the mineralization, which is at approximately 1920 RL as of the time of this report. It is estimated that it will take approximately two years to be in position to extract the first mineralization. A production ramp-up period will lead to full production of 1.4Mtpa (or 4,000 tpd) being attained in Project Year 5. Key milestone assumptions relating to the early project development are shown in Table 16.22.
| Table 16.22 | Project development milestones |
| Milestone | Start | Finish |
| Decline development | Year 1 | Year 8 |
| Conveyor decline | Year 1 | Year 2 |
| Internal winze, engineering, and construction | Year 3 | Year 9 |
| Processing plant construction | Year 1 | Year 3 |
| Production ramp-up to 1.4Mtpa (or 4,000 tpd) | Year 2 | Year 5 |
Year 1 is assumed to be 2018.
| 16.17 | Production and development schedule |
AMC has scheduled the development required to support a production rate of 4,000 tpd or 1.4 Mtpa. The production schedule is based on achieving a single-face development advance rate of 100 m/month per crew in both waste and mineralized material. Scheduling of the production from stopes is based on an overall rate of 1,000 tpd/panel for each mining zone. A panel is described as two stopes mined on retreat from a central access point. The production rate accounts for the drilling and mucking required to obtain a mine production rate of 4,000 tpd or 1.4 Mtpa. The waste fill placement scheduling is based on a rate of 1,200 t/d. Waste rock fill is assumed to be maintained at a maximum distance of 20 m from the stope blasting face.
| MAG Silver Juanicipio NI 43-101 Technical Report | |
| MAG Silver Corp. | 717002 |
The total projected production is derived from the mining of the three Main Zones (numbered 1, 2, and 3) over a 21 year mine life. The start date is depicted as Year 1 (Y1) in the following table. Over this period a total of 23.1 Mt at an average silver grade of 282 g/t is scheduled.
In order to reach a production rate of 1.4 Mtpa, two areas are required to be mined simultaneously in both Zones 1 and 2 and one in Zone 3.
The production and development schedule is summarized in Table 16.23. The total projected waste development tonnes, and the annual production and NSR value from the mine as a whole is provided in Figure 16.24.
| MAG Silver Juanicipio NI 43-101 Technical Report | |
| MAG Silver Corp. | 717002 |
| Table 16.23 | PEA LOM production schedule |
| Y1 to Y10 | Year | Y1 | Y2 | Y3 | Y4 | Y5 | Y6 | Y7 | Y8 | Y9 | Y10 | Y11 | Y12 | Y13 | Y14 | Y15 | Y16 | Y17 | Y18 | Y19 | Y20 | Y21 |
| Mineralization and waste | Total | | | | | | | | | | | | | | | | | | | | | |
| Total waste mined (t) | 6,758,008 | 913,030 | 842,673 | 682,854 | 556,996 | 559,895 | 517,483 | 578,646 | 425,950 | 363,231 | 330,869 | 317,241 | 248,921 | 258,819 | 37,162 | 39,122 | - | - | 8,086 | 72,457 | 4,574 | - |
| Production – stopes (t) | 17,354,702 | - | 81,795 | 403,964 | 910,276 | 955,979 | 970,698 | 931,953 | 948,855 | 841,266 | 771,034 | 746,783 | 750,514 | 1,082,228 | 1,178,641 | 1,322,063 | 1,325,358 | 1,400,000 | 1,050,000 | 760,801 | 515,031 | 407,464 |
| Production – development (t) | 5,769,005 | 15,260 | 117,696 | 248,250 | 380,324 | 444,021 | 429,302 | 468,047 | 451,145 | 558,734 | 628,966 | 653,217 | 649,485 | 317,772 | 218,141 | 77,938 | 74,642 | - | - | 35,695 | 368 | - |
| Total mineral production (t) | 23,123,706 | 15,260 | 199,491 | 652,214 | 1,290,599 | 1,400,000 | 1,400,000 | 1,400,000 | 1,400,000 | 1,400,000 | 1,400,000 | 1,400,000 | 1,400,000 | 1,400,000 | 1,396,782 | 1,400,000 | 1,400,000 | 1,400,000 | 1,050,000 | 796,496 | 515,399 | 407,464 |
| Production tonnage silver grade (g/t) | 282 | 369.7 | 800.5 | 636.4 | 550.1 | 447.6 | 468.2 | 354.3 | 300.7 | 280.4 | 201.9 | 194.9 | 181.0 | 198.0 | 153.7 | 155.6 | 180.9 | 195.9 | 185.5 | 203.0 | 178.4 | 350.0 |
| Production tonnage gold grade (g/t) | 1.37 | 1.7 | 2.3 | 1.7 | 1.3 | 1.4 | 1.3 | 1.3 | 1.5 | 1.5 | 1.3 | 1.3 | 1.3 | 1.2 | 1.2 | 1.1 | 1.2 | 1.3 | 1.6 | 1.6 | 1.6 | 1.8 |
| Production tonnage lead grade (%) | 1.84 | 0.2 | 0.4 | 0.7 | 0.9 | 1.2 | 1.2 | 1.5 | 1.8 | 1.7 | 2.0 | 2.1 | 2.1 | 1.8 | 2.4 | 2.2 | 2.3 | 2.1 | 2.5 | 2.5 | 2.6 | 2.1 |
| Production tonnage zinc grade (%) | 3.43 | 0.2 | 0.7 | 1.6 | 1.9 | 2.4 | 2.5 | 3.0 | 3.3 | 3.5 | 3.8 | 3.9 | 3.8 | 3.3 | 4.1 | 4.0 | 4.1 | 4.0 | 4.3 | 4.3 | 4.5 | 3.5 |
| Mine development | | | | | | | | | | | | | | | | | | | | | | |
| Access decline (m) | 22,746 | 3,036 | 4,533 | 3,502 | 2,828 | 2,856 | 2,786 | 2,301 | 904 | - | - | - | - | - | - | - | - | - | - | - | - | - |
| Return air drive (m) | 4,614 | 1,646 | 266 | 224 | 351 | 202 | 270 | 160 | 299 | 140 | 229 | 205 | 215 | 115 | 40 | 20 | - | - | 11 | 221 | - | - |
| Remuck bays (m) | 2,655 | 221 | 366 | 415 | 342 | 358 | 300 | 257 | 129 | 133 | - | 49 | - | 43 | - | - | - | - | - | 43 | - | - |
| Footwall drives (m) | 37,914 | 967 | 2,055 | 3,022 | 2,605 | 3,116 | 2,366 | 3,549 | 3,086 | 3,734 | 3,490 | 3,138 | 2,404 | 2,956 | 351 | 434 | - | - | 88 | 521 | 32 | - |
| Mineralized material development (m) | 65,935 | 291 | 2,067 | 3,666 | 4,496 | 4,170 | 4,807 | 4,433 | 5,725 | 6,437 | 6,881 | 6,961 | 7,556 | 3,639 | 2,286 | 721 | 707 | - | - | 897 | 195 | - |
| Development in waste (m) | 1,921 | - | 15 | 146 | 77 | 15 | 182 | 295 | 304 | 230 | 53 | 306 | 223 | - | 47 | - | - | - | - | 4 | 24 | - |
| Miscellaneous (m) | 3,760 | 73 | 1,164 | 178 | 732 | 98 | 184 | 265 | 353 | 126 | 147 | 137 | 158 | 30 | 17 | 25 | - | - | - | 73 | - | - |
| Conveyor decline (m) | 4,230 | 1,800 | 2,430 | - | - | - | - | - | - | - | - | - | - | - | - | - | - | - | - | - | - | - |
| Total lateral development (m) | 143,775 | 11,235 | 12,895 | 11,153 | 11,431 | 10,815 | 10,895 | 11,260 | 10,800 | 10,800 | 10,800 | 10,796 | 10,556 | 6,783 | 2,741 | 1,200 | 707 | - | 99 | 1,759 | 251 | - |
| Winze (m) | 780 | - | 230 | 550 | - | - | - | - | - | - | - | - | - | - | - | - | - | - | - | - | - | - |
| Rock pass (m) | 2,691 | - | - | 190 | 60 | - | 320 | 893 | 580 | 60 | 423 | 90 | 45 | 30 | - | - | - | - | - | - | - | - |
| Ventilation raise (m) | 5,198 | 2,232 | 1,014 | 177 | 431 | 127 | 191 | 137 | 323 | 46 | 260 | 64 | 184 | - | - | - | - | - | - | 15 | - | - |
| Total vertical development (m) | 8,669 | 2,232 | 1,244 | 917 | 491 | 127 | 511 | 1,030 | 903 | 106 | 683 | 154 | 229 | 30 | - | - | - | - | - | 15 | - | - |
| Backfill | | | | | | | | | | | | | | | | | | | | | | |
| Backfill placed (m3) | 8,113,581 | 5,355 | 69,997 | 228,847 | 452,842 | 491,228 | 491,228 | 491,228 | 491,228 | 491,228 | 491,228 | 491,228 | 491,228 | 491,228 | 490,099 | 491,228 | 491,228 | 491,228 | 368,421 | 279,472 | 180,842 | 142,970 |
| Imported backfill from surface (t) | 6,169,200 | - | - | - | - | - | - | - | - | - | - | 439,004 | 553,422 | 543,524 | 763,336 | 763,221 | 802,343 | 802,343 | 593,671 | 384,016 | 290,802 | 233,518 |
| Trucking | - | | | | | | | | | | | | | | | | | | | | | |
| Total trucking (t.km) | 72,522,328 | 3,346,677 | 4,754,224 | 6,242,255 | 7,697,467 | 7,853,088 | 7,587,680 | 7,922,552 | 6,969,972 | 3,452,807 | 2,923,710 | 2,727,580 | 2,379,013 | 2,352,812 | 1,098,877 | 1,181,254 | 882,620 | 1,068,947 | 556,178 | 865,067 | 297,942 | 361,606 |
| Conveyor / winze | - | | | | | | | | | | | | | | | | | | | | | |
| Winze (t) | 15,119,102 | - | - | - | - | - | - | - | 382,731 | 1,081,615 | 1,343,738 | 1,400,000 | 1,400,000 | 1,387,243 | 1,388,264 | 1,400,000 | 1,400,000 | 1,310,403 | 1,050,000 | 760,801 | 515,031 | 299,277 |
| Conveyor (t) | 23,123,706 | - | - | 866,966 | 1,290,599 | 1,400,000 | 1,400,000 | 1,400,000 | 1,400,000 | 1,400,000 | 1,400,000 | 1,400,000 | 1,400,000 | 1,400,000 | 1,396,782 | 1,400,000 | 1,400,000 | 1,400,000 | 1,050,000 | 796,496 | 525,885 | 407,464 |
| MAG Silver Juanicipio NI 43-101 Technical Report | |
| MAG Silver Corp. | 717002 |
| Figure 16.24 | Projected production profile |
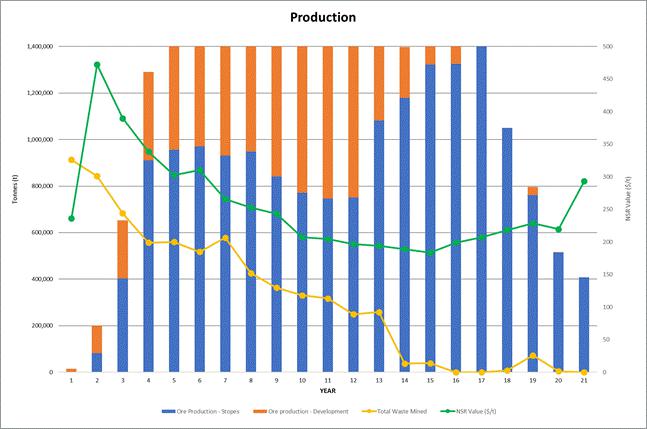
During pre-production and production, the owner is envisaged to supply and maintain all mobile equipment. An estimate of the fleet of mobile equipment required based on meeting the demands of the development and production schedule has been developed.
Equipment has been selected based on expected productivities but also considering the practical tramming distances between mining zones. As the time to tram from one zone to another could be significant, the fleet size for the major pieces of development and production equipment is based on most pieces being captive within the mining zones. The haul truck fleet sizes, however, are sized based on the mineralization and waste haulage requirements of the mine plan.
Table 16.24 shows numbers for steady state key primary equipment required for development and stope production.
| Table 16.24 | Equipment list |
| Equipment | Number of units | Comments |
| Jumbo | 9 | Development headings |
| Production rig | 4 | Production drilling |
| Loader (17 t) | 13 | Movement from stopes and development to passes |
| Truck (40 t) | 10 | Mineralized material and waste haulage |
| Bolter | 6 | Cable and ground support bolter |
| MAG Silver Juanicipio NI 43-101 Technical Report | |
| MAG Silver Corp. | 717002 |
Figure 16.25 shows the truck, jumbo, bolter, production drill and scoop requirements over the LOM.
| Figure 16.25 | Major equipment required over LOM |
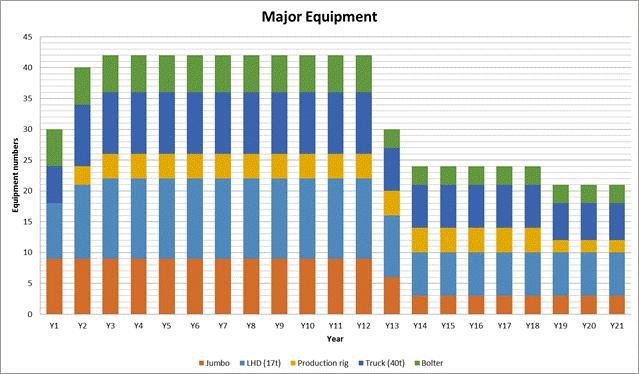
All vertical development will be completed by the raiseboring and drop-raising methods and will be undertaken by contractors. The recommended construction of concrete road surfaces for the main ramps will also be completed by a contract workforce. The remaining workforce is assumed to be made up of owner employees.
The underground mining team is organized into the following operational groups:
| · | General and administration |
Table 16.25 shows the projected maximum total mine personnel by operational group. It is assumed that the underground workforce will be made up of three rotations working a 14-days on and 7-days off rotation. Technical support staff, mining supervisors and general and administration employees will work a 5-day per week schedule. The crew work-up is based on providing sufficient manpower to operate the equipment necessary to complete the work in a timely manner. Additional personnel are included to cover absenteeism.
| MAG Silver Juanicipio NI 43-101 Technical Report | |
| MAG Silver Corp. | 717002 |
| Table 16.25 | Mine personnel requirements |
| | Total | Day shift | Night shift |
| Mining supervision | | | |
| Mine Manager | 1 | 1 | 0 |
| Mine Superintendent | 6 | 2 | 2 |
| Mining supervision subtotal | 7 | 3 | 2 |
| General and administration | | | |
| HR Manager | 1 | 1 | 0 |
| HR Supervisor | 2 | 2 | 0 |
| Accounting Supervisor | 1 | 1 | 0 |
| Procurement | 2 | 2 | 0 |
| Safety Supervisor | 1 | 1 | 0 |
| Safety / training / first aid | 3 | 3 | 0 |
| Head of security | 3 | 1 | 1 |
| Guards | 6 | 2 | 2 |
| Admin assistants | 3 | 3 | 0 |
| General and administration subtotal | 22 | 16 | 3 |
| Development crew | | | |
| Development shift boss | 9 | 3 | 3 |
| Jumbo operators | 27 | 9 | 9 |
| Bolter operators | 18 | 6 | 6 |
| LHD operators | 27 | 9 | 9 |
| Truck operators | 18 | 6 | 6 |
| Blasters | 27 | 9 | 9 |
| Service installers | 18 | 6 | 6 |
| Spraymec operators | 9 | 3 | 3 |
| Trans-mixer operators | 9 | 3 | 3 |
| Development crew subtotal | 162 | 54 | 54 |
| Production crew | | | |
| Production shift boss | 6 | 2 | 2 |
| Long hole drillers | 12 | 4 | 4 |
| Blasters | 27 | 9 | 9 |
| LHD operators | 12 | 4 | 4 |
| Truck operators | 12 | 4 | 4 |
| Crusher operator | 3 | 1 | 1 |
| Crusher labourer | 3 | 1 | 1 |
| Production crew subtotal | 75 | 25 | 25 |
| Raising | | | |
| Raise leader (contract) | 9 | 3 | 3 |
| Raise miner (contract) | 9 | 3 | 3 |
| Raise mechanic (contract) | 3 | 1 | 1 |
| Raising crew subtotal | 21 | 7 | 7 |
| Logistics | | | |
| Underground chief of logistics | 1 | 1 | 0 |
| Underground warehouse supervisor | 1 | 1 | 0 |
| Warehouse person | 6 | 2 | 2 |
| Boom truck / grader operators | 9 | 3 | 3 |
| Labourer / forklift operator | 18 | 6 | 6 |
| MAG Silver Juanicipio NI 43-101 Technical Report | |
| MAG Silver Corp. | 717002 |
| | Total | Day shift | Night shift |
| Fuel delivery person | 6 | 2 | 2 |
| Logistics subtotal | 41 | 15 | 13 |
| Maintenance | | | |
| Maintenance Superintendent | 1 | 1 | 0 |
| Master mechanic | 12 | 4 | 4 |
| Mechanics | 21 | 7 | 7 |
| Apprentices / labourers | 6 | 2 | 2 |
| Welders | 6 | 2 | 2 |
| Lead electrician | 6 | 2 | 2 |
| Electricians | 9 | 3 | 3 |
| Electrical apprentices | 6 | 2 | 2 |
| Fixed plant maintenance | 9 | 3 | 3 |
| Maintenance subtotal | 76 | 26 | 25 |
| Materials Handling | | | |
| Winze operator | 3 | 1 | 1 |
| Shaftman | 6 | 2 | 2 |
| Skip tender | 3 | 1 | 1 |
| Hoist mechanic | 3 | 1 | 1 |
| Hoist electrician | 3 | 1 | 1 |
| Winze rock breaker operator | 6 | 2 | 2 |
| Conveyor operators | 9 | 3 | 3 |
| Materials handling subtotal | 33 | 11 | 11 |
| Technical support | | | |
| Technical Services Manager | 1 | 1 | 0 |
| Chief Engineer | 1 | 1 | 0 |
| Chief Geologist | 1 | 1 | 0 |
| Geotechnical Engineer | 2 | 2 | 0 |
| Production Geologist | 6 | 6 | 0 |
| Planning Engineers | 2 | 2 | 0 |
| Ventilation Engineer | 2 | 2 | 0 |
| Mining Engineer | 6 | 6 | 0 |
| Surveyors | 6 | 6 | 0 |
| Technical support subtotal | 27 | 27 | 0 |
| Total | 505 | 184 | 140 |
| Absenteeism (8%) | 41 | | |
Personnel numbers will fluctuate over time to some extent as per the development and production schedule requirements. Figure 16.26 shows the personnel profile over the LOM.
| MAG Silver Juanicipio NI 43-101 Technical Report | |
| MAG Silver Corp. | 717002 |
| Figure 16.26 | Personnel profile over LOM |

| MAG Silver Juanicipio NI 43-101 Technical Report | |
| MAG Silver Corp. | 717002 |
The processing plant will have a nominal capacity of 4,000 tpd and consists of comminution circuit, with underground primary crushing, secondary crushing and milling on surface, followed by sequential flotation to produce a silver-rich lead concentrate, followed by a zinc concentrate and a gold-containing pyrite concentrate.
The underground crusher will process the run-of-mine (ROM) material by using a primary jaw crusher to reduce the material from a nominal 500 mm to a 100% passing size (P100) of 178 mm (P80 of 87 mm). The ore will then be transported by means of a conveyor belt discharging directly onto the mill stockpile.
The main objective of the ore stock pile is to maintain continuity of the operation of the processing plant and to allow blending of different ore grades, if required, and a consistent sizing of material. The stockpile acts as a buffer to any delays experienced in underground production. The stockpile will have a live capacity for two days of mill operation (8,000 t). From the stockpile, the ore is delivered by a front-end loader (FEL) onto the conveyor leading to the semi-autogenous grinding (SAG) mill via a vibrating feeder.
17.3 Grinding and classification
The main objective of grinding and classification is to liberate the valuable minerals in the ore by reducing the size of the ore and classifying it to reach a final product size (P80) of 60 microns. This is the minimum size required to generate the metal recoveries determined during metallurgical test work. An automated process control system will be implemented to ensure consistent grinding of the ore. There will be a SAG mill - ball mill grinding circuit with subsequent processing in a flotation circuit. The SAG mill will operate in closed circuit with a vibrating screen. The ball mill will operate in closed circuit with hydrocyclones.
The ore from the stockpile is fed via three variable speed feeders that discharge onto the conveyor belt that feeds the SAG mill. The discharge of the SAG mill flows over a vibrating screen and the oversized material is returned to the SAG mill by means of a conveyor belt system.
The underflow of the screen flows under gravity to a pump-box where, together with ball mill discharge, it is transferred by centrifugal pumps to a bank of D-10 hydrocyclones. The fines resulting from the classification with a P80 of 60 microns, i.e. cyclone overflow, constitute the feed to the lead flotation circuit.
Cyclone overflow is transferred to a vibrating screen to eliminate trash and present a clean feed to flow by gravity to the lead circuit conditioning tank. The ball mill receives the coarse underflow from the cyclone for regrinding and its discharge is then again combined with the SAG mill screen undersized material and returned to the hydrocyclones to separate the fines and coarse material. This results in a closed grinding circuit to achieve a product size P80 of 60 microns. Slurry from the ball mill discharge pump-box is transferred via a further horizontal centrifugal pump to a Knelson centrifugal concentrator to recover some of the gravity recoverable gold and silver from the grinding circuit. The feed to the Knelson is screened, with the underflow feeding the Knelson concentrator and the oversize returned to the ball mill.
The concentrate from the Knelson concentrator is pumped directly to the lead concentrate thickener. The Knelson concentrator tails flow by gravity back to the ball mill discharge pump-box.
17.4 Lead flotation circuit
The general objectives of the lead circuit are to obtain a concentrate of lead with the least amount of impurities and recover as much as possible of the mineralogical species containing gold, silver, lead and copper. The cyclone overflow feeds by gravity to the conditioning tank for the lead flotation circuit, where the pH is adjusted and collectors, together with frother and zinc and pyrite depressants are added. Subsequently the overflow of the conditioning tank also flows by gravity to the lead flotation circuit. This circuit consists of the rougher 1, rougher 2, scavenger sections, and three stages of cleaning. The rougher and scavenger flotation stages are performed in three banks of two cells of 100 m3 respectively. The first cleaning stage consists of a bank of four smaller flotation cells of 20 m3 each, and the second and third cleaners of banks of three 20 m3 cells respectively.
| MAG Silver Juanicipio NI 43-101 Technical Report | |
| MAG Silver Corp. | 717002 |
The rougher and scavenger flotation is carried out in series and the rougher concentrates 1 and 2 are cleaned three times in cascade, with the tails of the third cleaner returned to the second cleaner and the tails of the second cleaner returned to the first cleaner. The scavenger concentrate is combined with the tails of the first cleaner and returned to the head of the second rougher bank. The concentrate obtained in the third cleaner constitutes the final concentrate and is sent to the lead concentrate thickener.
The tails of the scavenger bank are the lead circuit tails and become feed for the zinc circuit. This zinc feed is pumped to two zinc conditioning tanks.
| 17.5 | Zinc flotation circuit |
The overall objectives of the zinc circuit are to recover most of the zinc content in a concentrate with a minimum grade of 50% Zn at the lowest possible impurities content. The lead circuit tails are pumped to two zinc conditioners, where the pH is adjusted with lime, and cyanide, collector and frother are added. Subsequently the tails pass by gravity to the zinc flotation circuit, consisting of two rougher stages, a scavenger stage, and three stages of cleaning.
The two rougher and scavenger flotation stages are performed in three banks of two cells of 100 m3 respectively. The first cleaning stage consists of a bank of four 20 m3 cells, with the second and third cleaner stages consisting of a bank of three cells of 20 m3 each respectively. Similar to the lead circuit, the rougher and scavenger flotation is carried out in series, and the rougher concentrates 1 and 2 are cleaned three times in cascade. The tails of the third cleaner are returned to the second cleaner and the tails of the second cleaner are returned to the first. The scavenger concentrate is combined with the tails of the first cleaner and returned to the head of the second zinc rougher bank.
The concentrate obtained in the third cleaner constitutes the final concentrate and is sent to the zinc concentrate thickener. In a case where there is no pyrite circuit, the tails of the scavenger bank are the final tails and are pumped to the tails thickener, where the maximum amount of process water is recovered.
| 17.6 | Pyrite flotation circuit |
The general objectives of the pyrite circuit are to recover most of the gold and silver content in a pyrite concentrate with a minimum grade of 35% Fe and the lowest possible amount of impurities. The zinc circuit tails are pumped to the pyrite flotation conditioning tank, where potassium amyl xanthate is added as a collector, then passed by gravity to the pyrite flotation circuit, where xanthate is also added in the scavenger stage and frother in the two cleaner stages.
The circuit for the pyrite flotation consists of a rougher flotation stage, a scavenger stage and two stages of cleaning. The rougher and scavenger flotation are carried out in two banks of four and two cells of 200 m3 respectively. The cleaning stages consist of two banks of five cells of 50 m3 in the first stage and four cells of 50 m3in the second stage. The rougher and scavenger flotation are carried out in series, whereas the rougher concentrate is cleaned twice in cascade. The tails of the second cleaner return to the first cleaner and the tails of the first cleaner are combined with the scavenger concentrate and are returned to the head of the rougher bank. The concentrate obtained in the second cleaner constitutes the final concentrate and is sent to the pyrite concentrate thickener. The tails of the scavenger bank are the final tails, and they are pumped to the tails thickener, where the maximum amount of process water is recovered.
| 17.7 | Thickening of lead concentrate |
The main objective of thickening the lead concentrate is to increase the percentage of solids in the underflow and to obtain in the overflow clarified water with the minimum content of suspended solids. The 20% solids lead concentrate is pumped into a 60 ft by 10 ft (18.3 m by 3.0 m) thickener, where flocculant is added, and the underflow of the thickener, containing 60% solids, is pumped to the surge tank. The water from the overflow of the thickener flows by gravity to a pump-box, from where it is pumped to a polishing filter. The discharge of this filter flows directly to the surge tank, while the filtered water flows under gravity to the pump-box of the process water.
| MAG Silver Juanicipio NI 43-101 Technical Report | |
| MAG Silver Corp. | 717002 |
| 17.8 | Surge tank for lead concentrate |
The function of the lead concentrate surge tank is to keep the feed supply to the lead filter constant. A surge tank will be installed with capacity to store 12 hours of lead concentrate production from the plant.
| 17.9 | Lead concentrate filtration |
The main objective of filtering the lead concentrate is to decrease its moisture content to a maximum of 9.0%. The pulp of the surge tank with 60% solids is pumped to a pressure filter for lead concentrate with sufficient capacity to filter the daily production during the 18 hours of operation considered in the design parameters. The filtered concentrate is stored in the loading yard and then loaded onto specialized trucks, which are weighed, loaded and sampled before onward transportation to the smelter location.
| 17.10 | Thickening of zinc concentrate |
The main objective of the thickening of the zinc concentrate is to increase the percentage of solids in the underflow and to obtain in the overflow clarified water with the minimum content of suspended solids. The zinc concentrate with 20% solids is pumped into a 60 ft by 10 ft (18.3 m by 3.0 m) thickener. The underflow of the thickener, containing 60% solids, is pumped into a surge tank. The water from the overflow of the thickener flows by gravity to a pump-box, from where it is pumped to a polishing filter. The discharge of this filter flows directly to the surge tank, and the filtered water flows under gravity to the pump-box of the process water.
| 17.11 | Surge tank for zinc concentrate |
The function of the zinc concentrate surge tank is to keep the feed to the zinc filter constant. A surge tank will be installed with capacity to store 12 hours of zinc concentrate production from the plant.
| 17.12 | Filtration of zinc concentrate |
The main objective of filtering the zinc concentrate is to reduce its moisture content to a maximum of 9.0%. The pulp of the surge tank, with 60% solids, is pumped to a pressure filter for zinc concentrate with sufficient capacity to filter the daily production during the 18 hours of operation considered in the design parameters. The filtered concentrate is stored in the loading yard and then loaded onto specialized trucks, which are weighed, loaded and sampled before onward transportation to the smelter location.
| 17.13 | Thickening of pyrite concentrate |
The main objective of the thickening of the pyrite concentrate is to increase the percentage of solids in the underflow and to obtain in the overflow clarified water with the minimum content of suspended solids. The pyrite concentrate with 20% solids is pumped into a 60 ft by 10 ft (18.3 m by 3.0 m) thickener, where flocculant is added, and the underflow of the thickener containing 60% solids is pumped to the surge tank. The water from the overflow of the thickener tank of the pyrite concentrate flows under gravity to the process water pump-box.
| 17.14 | Surge tank for pyrite concentrate |
The function of the surge tank is to store 12 hours of pyrite concentrate production from the plant. The slurry with 60% solids is pumped from the surge tank for delivery to the cyanidation plant.
| 17.15 | Thickening of final tails |
The main goal of thickening final tails is to increase the percentage of solids in the underflow and recover the maximum amount of process water as soon as possible. The final tails with 10% solids are pumped to the 85 ft by 10 ft (25.9 m by 3.0 m) thickener. The underflow of the thickener containing 50% solids is pumped to the tailings dam. The overflow of the thickener flows by gravity to a pump-box where it is combined with the water recovered from the lead, zinc and pyrite pressure filters. Subsequently, the water is pumped into the process water tank for reuse in the process.
| MAG Silver Juanicipio NI 43-101 Technical Report | |
| MAG Silver Corp. | 717002 |
| 17.16 | Shipment of lead and zinc concentrate |
Lead and zinc concentrates are stored in separate concentrate storage areas with capacity for 7 days of operation. The shipment of concentrates is carried out from Monday to Saturday using a front-end loader and specialized concentrate trucks, which transport the concentrates directly to a smelter or to a port or rail system for onward shipment.
| 17.17 | Tailings storage facility |
The underflow of the tailings thickener is pumped into the tailings storage facility, where the discharge is performed at the perimeter of the facility. A downstream construction method is used for the impoundment dyke and the water is recovered by a floating pontoon. The recovered water flows under gravity to a channel that leads to a process water pond for reuse in the process. Figure 17.1 shows the planned process flow sheet.
| MAG Silver Juanicipio NI 43-101 Technical Report | |
| MAG Silver Corp. | 717002 |
| Figure 17.1 | Process flow sheet |

| MAG Silver Juanicipio NI 43-101 Technical Report | |
| MAG Silver Corp. | 717002 |
| 17.18 | Mineral processing schedule and recovery |
Based on the testwork undertaken to date (Section 13) the processing recoveries adopted for the PEA are summarized in Table 17.1.
| Table 17.1 | Metal recoveries adopted for the PEA |
| Product | Au | Ag | Pb | Zn |
| Lead concentrate (% metal) | 65.2 | 80.1 | 92.8 | |
| Zinc concentrate (% metal) | 4.9 | 6.8 | | 89.8 |
| Pyrite concentrate (% metal) | 11.5 | 7.9 | | |
| Overall recovery (% metal) | 82 | 95 | 93 | 90 |
The mineralization material projected to be processed is summarized in Table 17.2.
| Table 17.2 | Annual processing throughput |
| Total | Y1 | Y2 | Y3 | Y4 | Y5 | Y6 | Y7 | Y8 | Y9 | Y10 | Y11 |
| 23,123,706 | 15,260 | 199,491 | 652,214 | 1,290,599 | 1,400,000 | 1,400,000 | 1,400,000 | 1,400,000 | 1,400,000 | 1,400,000 | 1,400,000 |
| | Y12 | Y13 | Y14 | Y15 | Y16 | Y17 | Y18 | Y19 | Y20 | Y21 | Y22 |
| | 1,400,000 | 1,400,000 | 1,396,782 | 1,400,000 | 1,400,000 | 1,400,000 | 1,050,000 | 796,496 | 515,399 | 407,464 | 0 |
| MAG Silver Juanicipio NI 43-101 Technical Report | |
| MAG Silver Corp. | 717002 |
A conceptual layout has been developed for the site. Existing infrastructure includes the main portal and decline access to the deposit, surface mine offices, contractor offices and main workshop located near the main portal. Currently, service water and power is distributed underground via the existing decline that is under development and road access to the main portal is via the neighbouring property.
As discussed in Section 16, a trade-off study was completed to assess the optimal mill location and means of delivering mineralized material. As a result of this assessment, the mill will be located approximately 6.5 km from the main portal, and delivery from underground will be via a conveyor decline. On surface, the mill will be accessed directly from the main highway (Highway 44) via a paved road approximately 1.4 km in length. The proposed site layout showing the new mill location relative to the existing mine and portal is shown in Figure 18.1.
The proposed access road from the mill to the mine is also shown in Figure 18.1. The road has a length of approximately 6.5 km and maximum grade of 12%. It is envisaged that the road will be a two-lane paved road suitable for use by heavy vehicles.
| MAG Silver Juanicipio NI 43-101 Technical Report | |
| MAG Silver Corp. | 717002 |
| Figure 18.1 | Site layout concept |

| MAG Silver Juanicipio NI 43-101 Technical Report | |
| MAG Silver Corp. | 717002 |
The following text indicates the conceptual plan for the electrical system and associated equipment at Juanicipio.
The electrical supply system for the Juanicipio project will be developed in stages as the project grows. The initial system, with power sourced from a nearby mine, is being used to develop the first decline. This power will eventually be disconnected and the supply of power switched over to the permanent system, which will originate at the mill substation.
The estimated power demand for the site is shown in Table 18.1.
| Table 18.1 | Estimated site power demand |
| Purpose | Total installed power (kW) | Overall load factor | Average load (kW) | GWh per annum |
| Mine ventilation | 3,993 | 97% | 3,892 | 34.1 |
| Mine dewatering | 6,852 | 25% | 1,710 | 15.0 |
| Winze hoist and crusher | 2,107 | 21% | 441 | 3.9 |
| Conveyor | 1,100 | 26% | 283 | 2.5 |
| Other underground* | 480 | 44% | 213 | 1.9 |
| Underground | 14,532 | 45% | 6,538 | 57.3 |
| Mill | 10,334 | 78% | 8,060 | 70.6 |
| Surface infrastructure | 380 | 65% | 247 | 2.2 |
| Total | 25,246 | 59% | 14,845 | 130.1 |
*Includes compressors, lighting, communications.
A 25 kV pole-mounted transmission line connected to the local grid will be routed along the proposed access road to the mill substation. The permanent system will have power feeding the underground and surface facilities from the mill substation. There will be two feeders for the mine: a power line that will follow the access road to deliver power from the mill to the current portal and surface ventilation fans, and a second power line going down the conveyor decline. This arrangement will provide some degree of redundancy using cross-feed switchgear.
Once the conveyor decline is developed, power will be routed down it from the mill substation at a high voltage to minimize losses. Large loads such as the conveyor drives, crusher, main fans, and main pump stations will have their own substations and be driven at medium voltages.
The availability of uninterrupted electrical power from the grid can be classified as a risk. It is therefore recommended that backup diesel generators be purchased to supply power for essential services in the event of a power outage. Essential services include power for basic mine ventilation and dewatering to prevent flooding of the underground workings.
A single-line diagram showing the proposed electrical distribution and main equipment loads is provided in Figure 18.2.
| MAG Silver Juanicipio NI 43-101 Technical Report | |
| MAG Silver Corp. | 717002 |
| Figure 18.2 | Single line diagram – electrical distribution |
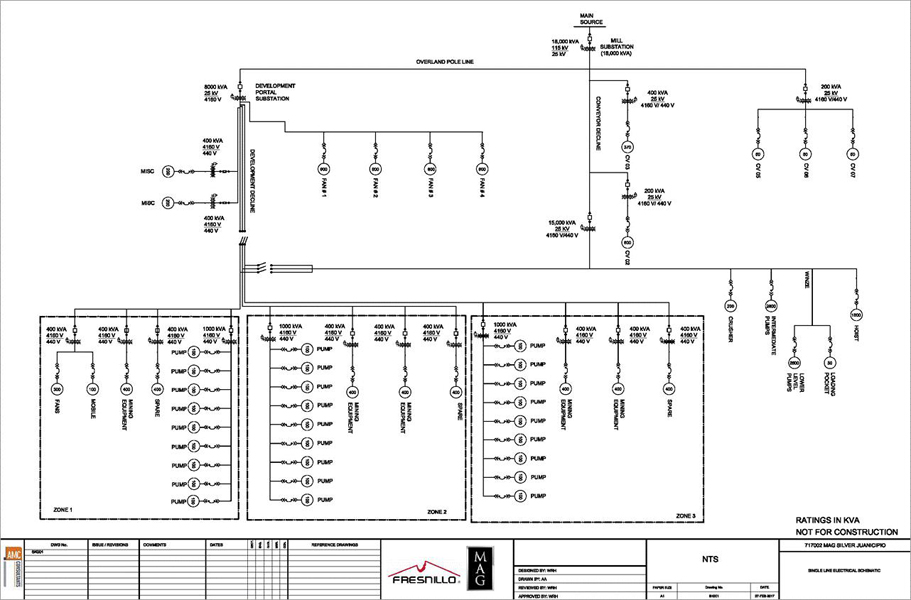
| MAG Silver Juanicipio NI 43-101 Technical Report | |
| MAG Silver Corp. | 717002 |
| 18.3.1 | Source of electrical power |
Power from the local grid will be connected at 115 kV to the mill substation and then distributed to the mine at 25 kV. This voltage is recommended due to the distances required to transmit power and the size of the installed equipment loads that will be serviced.
| 18.3.2 | Power for the underground conveyor and crushing plant |
The underground conveyor drives will be fed via a 25 kV transmission line routed along the conveyor decline. A substation located at each of the drive locations will step the voltage down to 4,160 V for use at the main drives. A substation at the crushing plant will also step the voltage down to the required 4,160 V.
| 18.3.3 | Power for the winze |
The winze hoist motors will be fed via the same 25 kV transmission line as the conveyors. A substation at the head of the winze will step the voltage down to 4,160 V for use in the drives. Electrical transmission lines (4,160 V) will be routed down the shaft to drive the equipment at the loading pocket and the pumps for the lower sump levels.
| 18.3.4 | Power for the surface fans |
A 25 kV pole-mounted transmission line will be routed along the proposed access road to the existing surface portal from the mill substation. A local substation at the portal will reduce the voltage to 4,160 V to power the existing main ventilation fan located near this portal. The transmission line will be routed overland along the access road to the ridge overlying the deposit to supply the ventilation raise fans that will be located there.
| 18.3.5 | Power distribution to each production level |
Portable substations fed at 4,160 V from power distribution cables along the declines will step the power down to 440 V for use on each production level to feed the auxiliary ventilation fans, submersible pumps, and other equipment. The equipment and the portable substations will be relocated and/or supplemented to meet the production schedule demands as required.
| 18.3.6 | Power for the intermediate sump |
The intermediate sump will be fed from the same substation used to feed the crushing plant and winze. Power for the intermediate dewatering pumps will be stepped down to 4,160 V.
| 18.3.7 | Power for the lower sump |
Power for the lower sump dewatering pumps will be fed from the 4,160 V line routed down the winze.
| 18.3.8 | Power distribution to the Zone 1, Zone 2, and Zone 3 declines |
The main substation at the intermediate sump / crushing plant will provide 4,160 V power for the declines. Substations along the decline will provide 440 V power to submersible pumps, mobile equipment, and other loads. As the declines are deepened and ventilation raises are established, the 4,160 V lines will be rerouted via the ventilation raises in order to minimize losses.
| 18.3.9 | Power for the existing portal |
The existing portal will continue to be fed locally until the overland 25 kV pole line is run from the mill. The existing substation will then be revised to use this power and the current distribution system switched over. The now obsolete line will be retained in place as an emergency source of power (not shown on the single line diagram).
| 18.3.10 | Power for maintenance shops |
The underground maintenance shop on 1850 RL will be fed from the same centrally located substation that provides 4,160 V power to the crusher, winze, and intermediate sump. A local substation near the shop will step the power down to 440 V for ventilation, lighting and other small equipment loads. Welding plugs will be provided in the shop itself.
| MAG Silver Juanicipio NI 43-101 Technical Report | |
| MAG Silver Corp. | 717002 |
| 18.4 | Communications systems |
The underground wireless network infrastructure is proposed to consist of:
| · | Voice over Internet Protocol (VoIP) mine phones |
| · | Cap lamps |
| | |
| · | Asset and personnel tracking |
Radio communications are proposed to be established underground by a wireless digital, Local Area Network (LAN) protocol Wi-Fi compatible system. The backbone of the network will comprise of gigabit network switches connected by a composite cable that runs fibre and power to each device. Each switch will also house up to two wireless radios, giving pervasive wireless coverage along travelways. This will also provide the ability to make continuous VoIP telephone calls from the portal to the face, and to have full asset and personnel tracking capability. The system will also have redundancy to maintain operation if the fibre gets damaged. A schematic of the underground communications system is shown in Figure 18.3.
| Figure 18.3 | Underground communications system schematic |
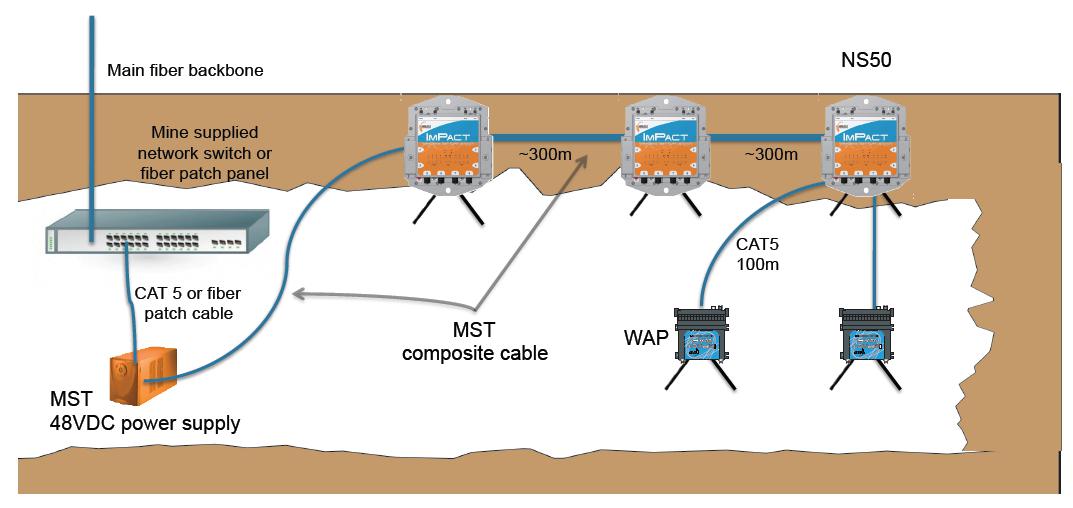
Fibre optic cable will be installed from the mill control room to the underground mine via the mine’s overland power line which extends past the entrance to the conveyor decline and out to the underground mine’s main portal. The fibre optic cable will be fed into the underground mine from two locations in a redundant manner that will provide for greater communications reliability. One fibre optic line will enter the underground mine via the conveyor decline and another line will enter the underground mine via one of the main portals. Should one of the fibre optic lines get severed, communications service will continue with the remaining line.
Branch lines will then extend underground from the two feeder lines with amplifiers spaced between ultra-high frequency (UHF) coax cable segments at no more than 350 m intervals. A communications cable will also branch out at drifts as necessary, with “end-of-line” termination antennas as required.
| 18.4.1 | Personnel and equipment tracking |
Personnel tracking will be accomplished by a radio frequency identification tag (RFID) that uses electromagnetic fields to automatically identify and track tags attached to objects. An integrated communications cap lamp (ICCL) will contain the RFID Tag. The ICCLs will also contain an Ultra High Frequency (UHF) radio for an “all-in-one underground miner solution”. Vehicles will also contain RFID tags and UHF radios.
| MAG Silver Juanicipio NI 43-101 Technical Report | |
| MAG Silver Corp. | 717002 |
The proposed system will be integrated into MineDash, a browser-based tracking and reporting application, allowing operators and mine controllers to monitor, track and allocate personnel and resources. Having the ability to ensure that mine staff are accounted for in an emergency will increase safety and speed the provision of help to any personnel requiring assistance. Tracking vehicles and assets can also lead to increased productivity and efficiency by eliminating time wasted looking for equipment underground.
| 18.4.2 | Fixed plant monitoring and control |
A programmable logic controller (PLC) system will be used for fixed plant monitoring and control. The PLC system processor (main rack) will reside in the portal area. Remote PLC racks placed near equipment (as necessary) will monitor and control the underground systems, including, but not limited to:
| · | Traffic control |
| | |
| · | Air quality and quantity |
The PLC system will be tied to the mill and control room on surface via a fibre-optic link that will connect the underground network and the control room networks together. Camera systems can also use this network bridge to provide camera data to the control room. Camera systems can be controlled by a PC with IP cameras positioned at critical areas underground. This can be replicated on a large monitor or television in the control room as necessary.
A water catchment dam will be developed on the site, near to the plant. Water from the underground mine will also be fed to the catchment dam and this reclaimed water will be allowed to settle prior to being re-used in the processing plant. It has been assumed that sufficient water will be obtained from these sources to meet the project’s process requirements. This assumption is dependent on the findings of a hydrological assessment to be carried out during further studies. The reclaimed water could potentially be used as potable water if it can be effectively treated and made potable. Depending on the cost of treating the reclaimed water, other local sources of potable water may have to be found, including the provision of bottled drinking water. The estimated water usage for the project is shown in Table 18.2.
| Table 18.2 | Estimate of site water usage |
| Water usage | ML per annum |
| Process plant (0.7 kL/t processed) | 980 |
| Potable water | 40 |
| Mine | 350 |
| Other surface uses | 140 |
| Total | 1,510 |
An 8,000 t stockpile will provide a two-day buffer between the underground mine production and the plant. Mineralized material will be transported to surface via the underground conveyor and then transferred to the surface conveyor feeding the mill silo.
| MAG Silver Juanicipio NI 43-101 Technical Report | |
| MAG Silver Corp. | 717002 |
A total of approximately 6.8 Mt of waste rock is expected to be produced over the mine life. It is envisaged that waste rock produced during the initial development period will be used for road and tailings dam construction or stockpiled on surface. Later in the mine life, any waste rock produced will be backfilled to stopes and worked out areas. Temporary waste rock dumps have been designed near the portal. In Year 11, the mine plan projects a deficit in the amount of waste required for backfilling. It is assumed that waste rock will be mined from a small surface pit and dropped down a rock pass to 1950 RL, where it will be distributed to the stopes for filling.
It is envisaged that all mill tailings will be discharged to a tailings storage facility (TSF) with a total volume of approximately 18 Mm3. No detailed environmental or geotechnical studies have yet been carried out on suitable sites for the TSF for the project. Nevertheless, several sites have been considered, including a location adjacent to the proposed mill site (see Figure 18.1 for mill site location).
Following a brief site inspection and discussions with personnel from Minera Juanicipio, it was considered that the most likely location for a TSF would be on relatively flat lying land to the north-east of the project site. The area is underlain by conglomerates and alluvium and is close to the proposed access road.
A turkey-nest construction is envisaged for the TSF with materials, including clays, for the construction of the dam walls sourced from within the dam and from mine development waste. It is envisaged that the dam would be lined, also with locally sourced clays, or if necessary, a high-density polyethylene (HDPE) liner. Because of the high evaporation rate in the region and the plan to pump thickened tailings to the dam, no water reclaim facility has been included in the design. The concept design of the facility is shown in Figure 18.4.
| Figure 18.4 | Concept design of tailings storage facility |
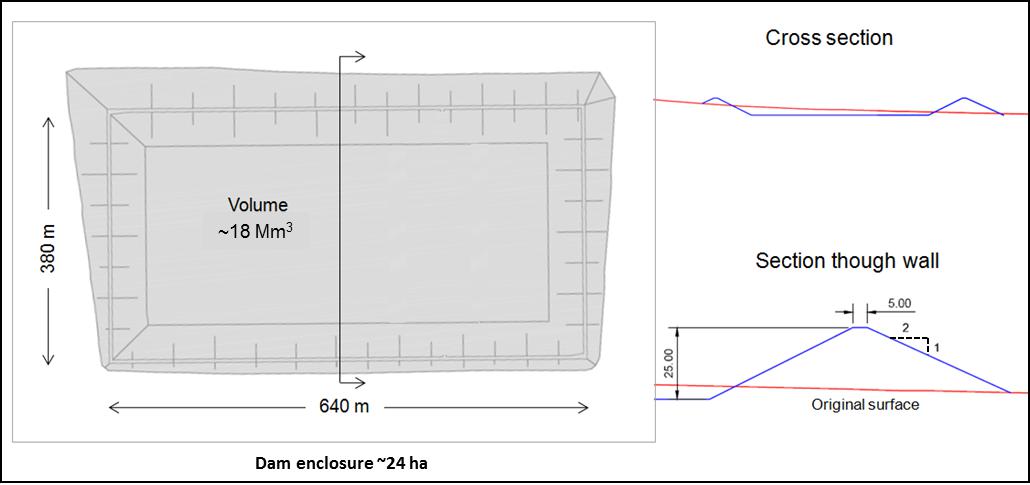
It is envisaged that tailings will be delivered to the TSF by a 200 mm diameter HDPE pipe installed in a suitable spillage containment ditch alongside the mine access road.
| 18.8 | Other surface facilities |
| 18.8.1 | Offices and change house |
It is envisaged that an office complex located close to the concentrator will accommodate the metallurgical staff and the site laboratory.
| MAG Silver Juanicipio NI 43-101 Technical Report | |
| MAG Silver Corp. | 717002 |
A mine office complex located near the main decline portal is proposed to accommodate mine engineering staff, geology staff, mining supervisors, and maintenance supervisors. The facility would be air conditioned and equipped with individual offices, a computer room, kitchenette, restrooms, and meeting rooms. Extensions to the office complex would accommodate a mine control room, the mine cap lamp room, a small first-aid room, and a mine rescue station.
A change-room and shower facility, also near the main decline portal, is proposed to service the mining and maintenance crews. The building will include fresh water showers, toilets, individual lockers, changing areas, and dry basket storage for each person’s clothes and personal equipment.
| 18.8.2 | Workshops and fuel storage |
A maintenance workshop and warehouse facility is proposed to be attached to the mill building. The building would also house a small change-room and other facilities for the mill operating personnel.
A surface workshop near the main decline portal is proposed to be constructed to facilitate all major and minor mobile fleet repairs. It is expected that equipment which regularly exits the mine, such as the haulage fleet and light vehicles, would be serviced at the surface shop, whilst equipment such as production scoops, jumbos and production drills, would generally be serviced in the underground workshop. All major overhauls and large component change-outs would be performed in the surface shop.
The surface workshop is envisaged to be a five-bay configuration with provisions for a pit in one of the bays and a 10 t overhead crane. It is anticipated that one bay would be allocated to tire change-outs, two for lubrication and routine service, and two for general repair work. A small secure warehouse holding spare parts for mine equipment will be attached to the surface workshop.
A dedicated light vehicle workshop will be constructed near the surface workshop with appropriate space and equipment for two light vehicles to be maintained and serviced simultaneously.
A 110 kL fuel storage and dispensing facility is proposed for the portal area. This will allow for approximately ten days of fuel storage during normal operations. The tank is planned to be double-walled, installed in combination with appropriate pumps, emergency shut-off mechanisms, concrete containment area, and fire suppression equipment.
| 18.9 | Underground infrastructure |
| 18.9.1 | Haulage and mineralized material and waste handling system |
The handling system for mineralized material is based around a nominal 4,000 tpd capacity, which is approximately equivalent to 216 tph, based on a capacity factor of 1.3 over a 24 hour operating period. This allows for excess capacity in the mineralized material handling system relative to any potential disconnection between the mine and mill. Initially, mineralized material transport from various mining levels will be by truck haulage to the crusher on 1950 RL. The crushed material is then placed on a load-out belt feeding two other conveyors to surface, with an overland conveyor providing final delivery of mineralized material to the mill.
Later in the mine life, an internal winze will be sunk to allow the hoisting of mineralized material from the loading pocket on 1300 RL up to the crusher on 1950 RL. From there, the material will be conveyed out of the mine via the existing conveyor system. There is some available spare capacity built into the system that could be realized through increased running speed or hours of operation, with minimal increase in costs.
Development waste is either hauled to surface by trucks via the twin access declines or placed directly into stopes as backfill. All waste hauled to surface will be stored near the current portal. Waste required for subsequent backfilling will be dropped down a waste pass driven as close to the deposit as practicable, and then distributed to the stopes.
A flowsheet of the proposed final mineralized material and waste handling system is shown in Figure 18.5.
| MAG Silver Juanicipio NI 43-101 Technical Report | |
| MAG Silver Corp. | 717002 |
| Figure 18.5 | Flow sheet showing the mineralized material and waste handling system |
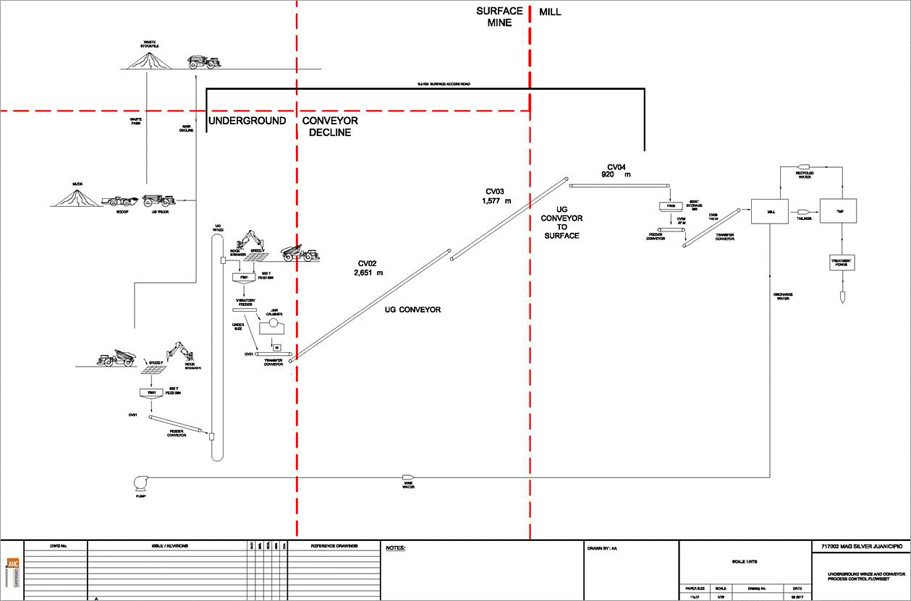
| MAG Silver Juanicipio NI 43-101 Technical Report | |
| MAG Silver Corp. | 717002 |
| 18.9.2 | Winze mineralized material handling |
Depending on the elevation being mined, mineralized material can be hauled by truck up to the crusher or it can be dumped into the nearest rock pass. Section 18.9.3 describes how mineralized material is proposed to be handled at the crusher.
Mineralized material at the bottom of the rock pass is loaded onto trucks for haulage to the lower truck dump that is located above the winze loading pocket. The truck dump has a grizzly positioned above a 500 t storage bin that is served by a vibratory feeder. The vibratory feeder discharges into the loading pocket where mineralized material is loaded into one of two skips inside the 4.5 m diameter winze.
The grizzly consists of a steel girder grid with 200 mm openings and is served by a hydraulic rock breaker to handle oversize. A grizzly operator is responsible for managing the oversize, operating the rock breaker, and keeping the storage bin full.
The 500 t storage bin consists of steel plate liners over concrete mounted in structural steel beneath the grizzly. The material entering the bin has been sized by the grizzly and rock breaker to 100% passing 200 mm. The bin also includes a rock box as part of its design to help manage wear on the liners.
An inclined vibrating feeder is mounted beneath the bin to control the discharge of mineralized material onto the feed belt. The vibrating feeder has controls that can be used to adjust the flow rate of the material.
| 18.9.2.4 | Feed belt and magnet |
The vibrating feeder discharges onto the feed belt. The feed belt is wide, slow moving, and has many idlers to handle the impact and static loads imposed by the rock. Fully enclosed hoods coupled with a ventilation system control dust generated by the process. The belt discharges into the loading pocket diverting chute after passing under a belt magnet that picks up tramp steel such as bucket teeth or ground support steel. The feed belt is considered a sacrificial piece of equipment in that it can be quickly changed or repaired at a lower cost than a main conveyor belt, should it be damaged or degraded by foreign objects in the mineralized material feed.
The loading pocket consists of a diverting chute and a pair of flasks (bins) with arc gate chutes. Mineralized material from the feed belt flows into the diverting chute and into each of the flasks, one at a time. The flasks are equipped with volume and mass sensors to control the amount discharged. When a flask is filled, the diverter chute directs mineralized material to the other flask. If both are full, the feed belt is stopped.
The flasks are then discharged by the arc gates into the skips in the loading pocket. Various interlocks are provided to ensure that the skip is in place before a flask can be discharged. The general arrangement of the loading pocket is shown in Figure 18.6.
| MAG Silver Juanicipio NI 43-101 Technical Report | |
| MAG Silver Corp. | 717002 |
| Figure 18.6 | Loading pocket general arrangement |

| 18.9.2.6 | Winze general arrangement |
The proposed winze hoist consists of a double drum dual skip system with rope guides. The hoist is mounted at the head of the winze excavation in a chamber above the skip dumps. A shaft horizontal section schematic is provided in Figure 18.7.
| MAG Silver Juanicipio NI 43-101 Technical Report | |
| MAG Silver Corp. | 717002 |
| Figure 18.7 | Shaft section schematic |
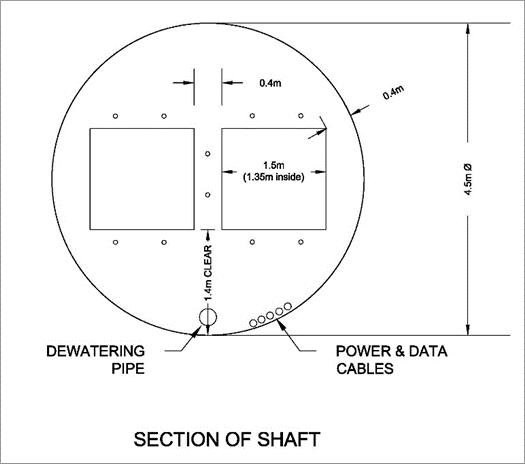
The energy required to operate the skips was calculated based upon the production rate. The cycle times and power requirements were then more closely estimated by including the effects of the rotational moment of inertia of the hoist and the unbalanced rope. A summary of key performance criteria during a hoist is included in Figure 18.8. From this, an estimate of the overall average energy required for the entire cycle was used to estimate operating costs.
| MAG Silver Juanicipio NI 43-101 Technical Report | |
| MAG Silver Corp. | 717002 |
| Figure 18.8 | Winze performance |

| 18.9.2.7 | Skip dump and conveyor system |
The skips are discharged via pneumatic self-discharge systems into a raise that leads to a 500 t storage bin. Mineralized material that is delivered to the 500 t storage bin will be sized to minus 200 mm. The storage bin discharges into a jaw crusher which sizes the material to minus 100 mm. Thereafter, the material is loaded onto the conveyor belt system leading to the mill.
Figure 18.9 shows the general arrangement for the winze headframe.
| MAG Silver Juanicipio NI 43-101 Technical Report | |
| MAG Silver Corp. | 717002 |
| Figure 18.9 | Winze headframe and transfer conveyor arrangement |
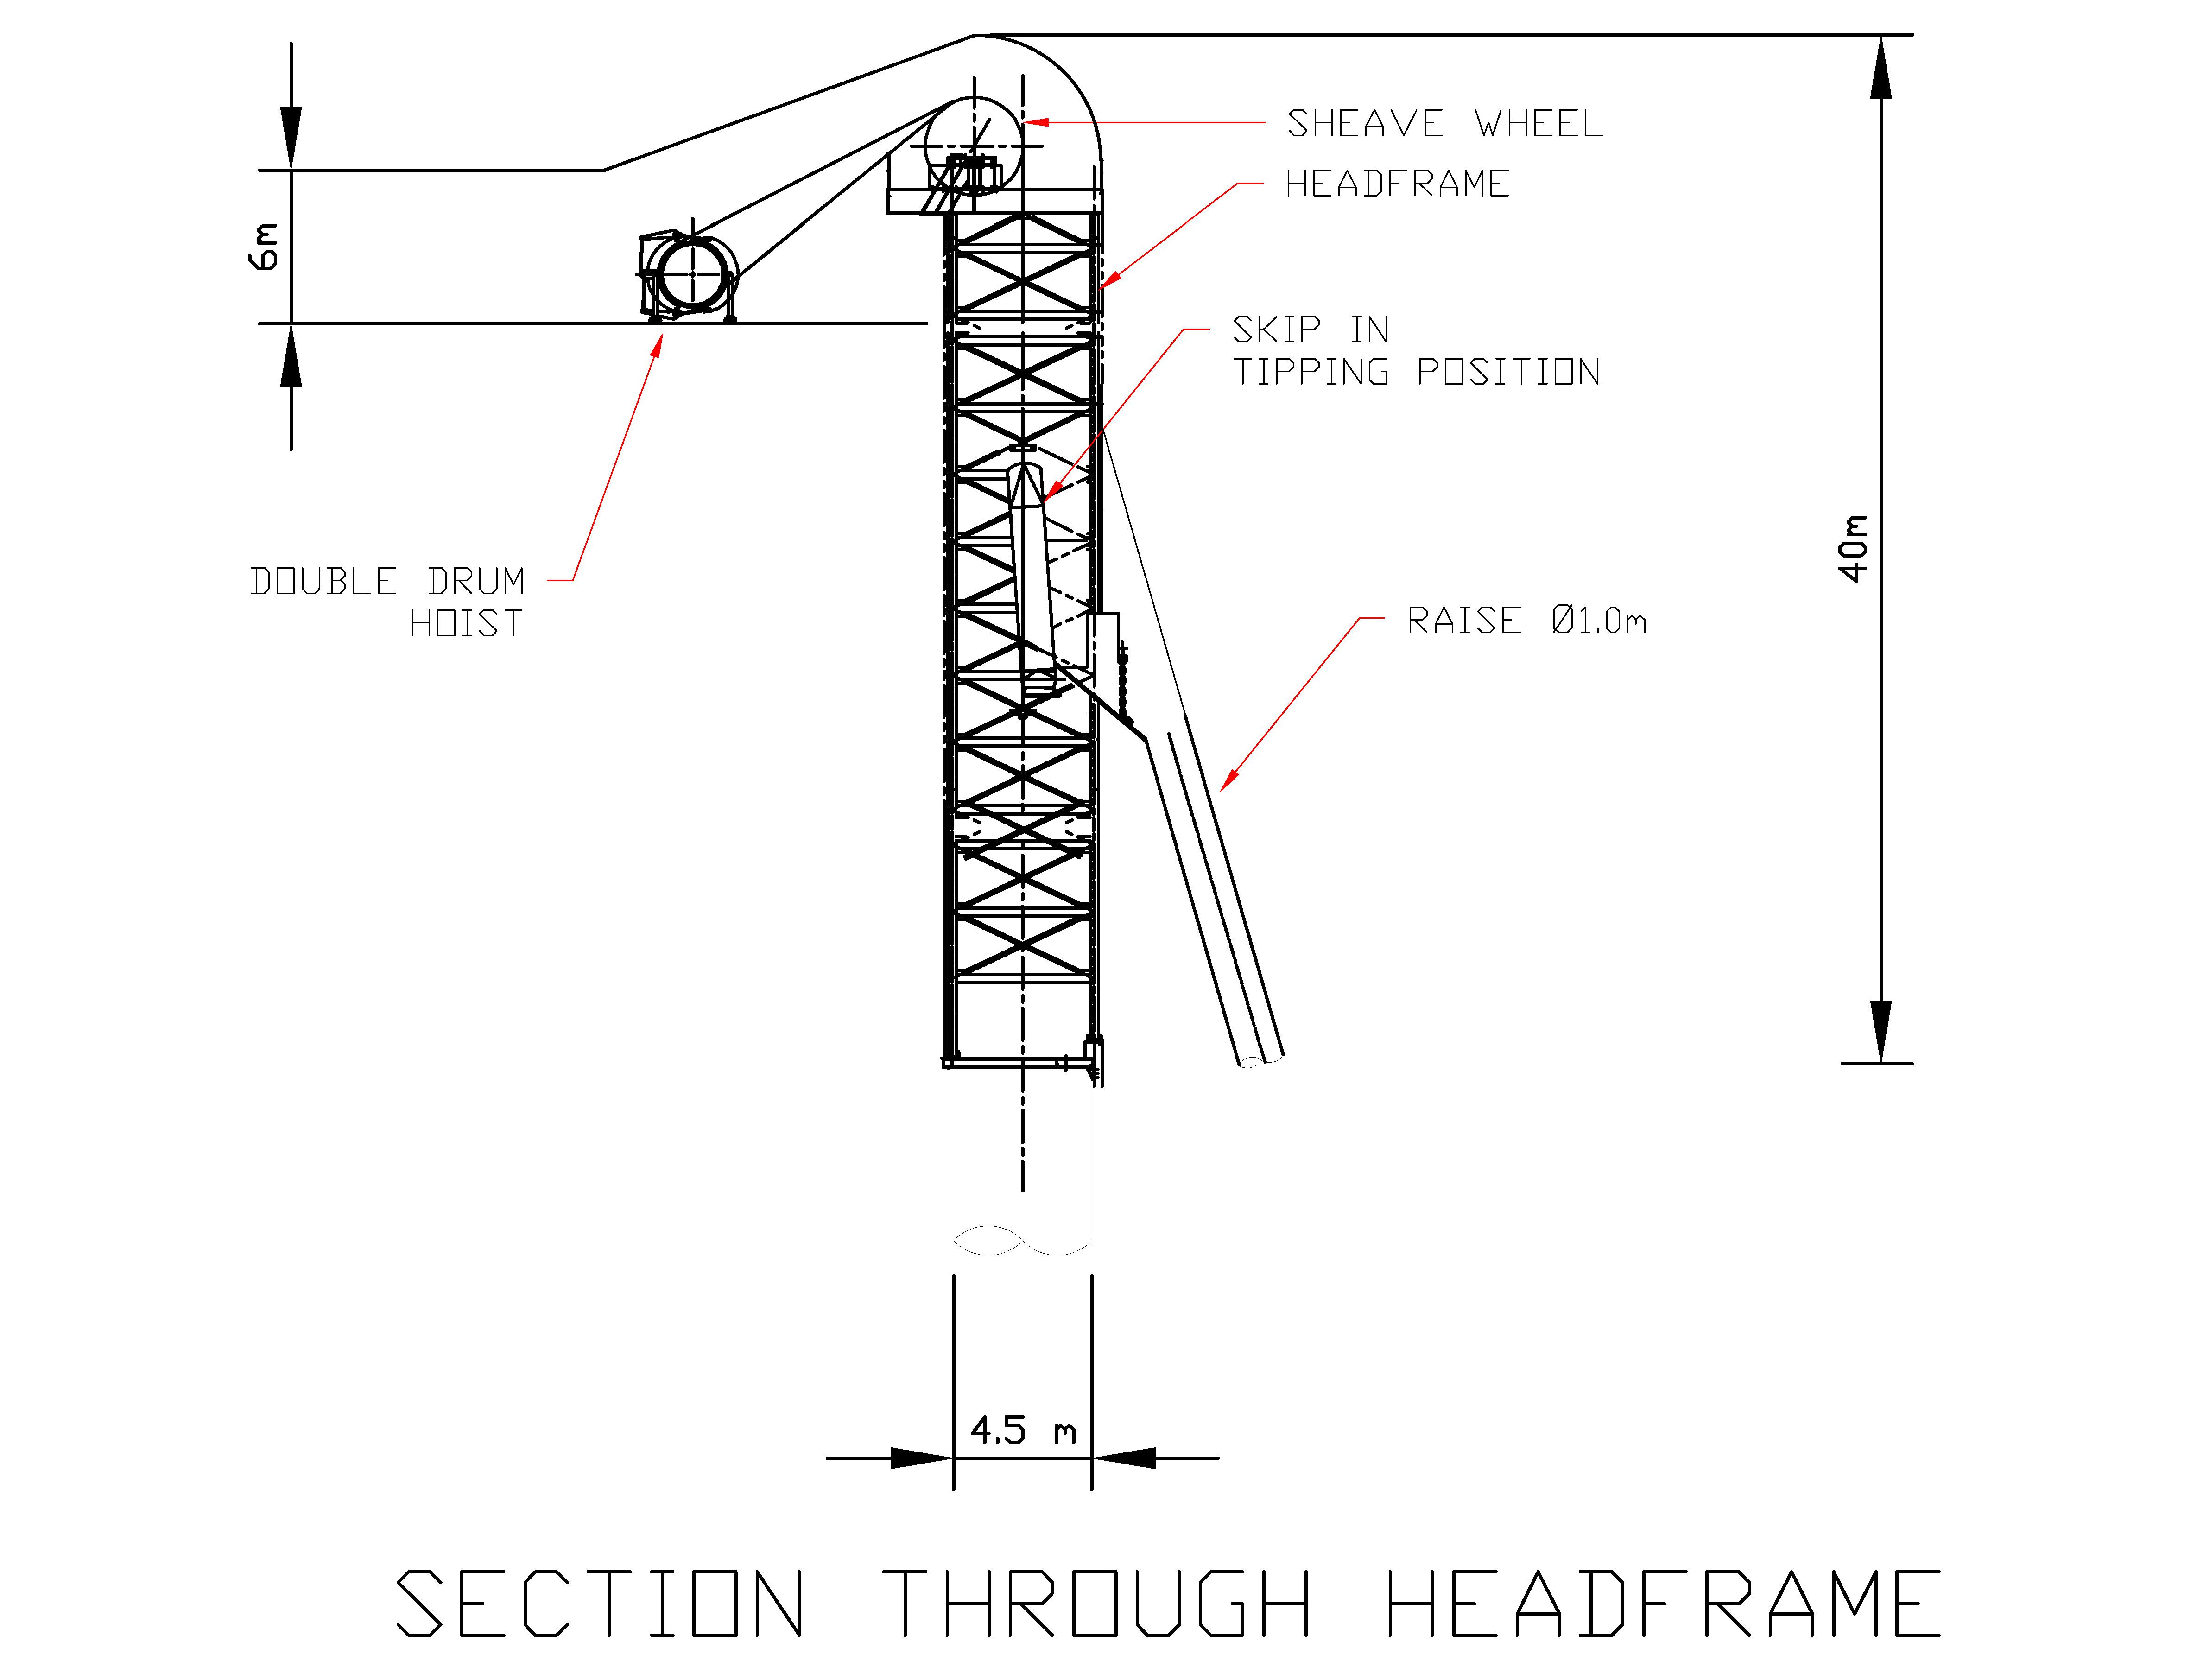
| 18.9.3 | Crusher and conveyor belt mineralized material handling |
The crusher system is capable of handling trucked mineralized material as well as hoisted material from the winze.
Mineralization in the upper sections of the mine is trucked to the upper dump located above the crusher. The truck dump has a grizzly positioned above a 500 t storage bin that is served by a vibratory feeder. The storage bin is also fed by the winze via a raise and the truck dump is isolated and protected from the raise.
Mineralized material is discharged from the storage bin and is fed into the crusher by means of a vibratory scalping feeder. The scalping feeder reduces feed loads on the crusher. Crushed material and undersize are then delivered to the main decline conveying system.
Figure 18.10 shows the general arrangement for the upper truck dump and crusher set-up.
| MAG Silver Juanicipio NI 43-101 Technical Report | |
| MAG Silver Corp. | 717002 |
| Figure 18.10 | Schematic of upper dump |
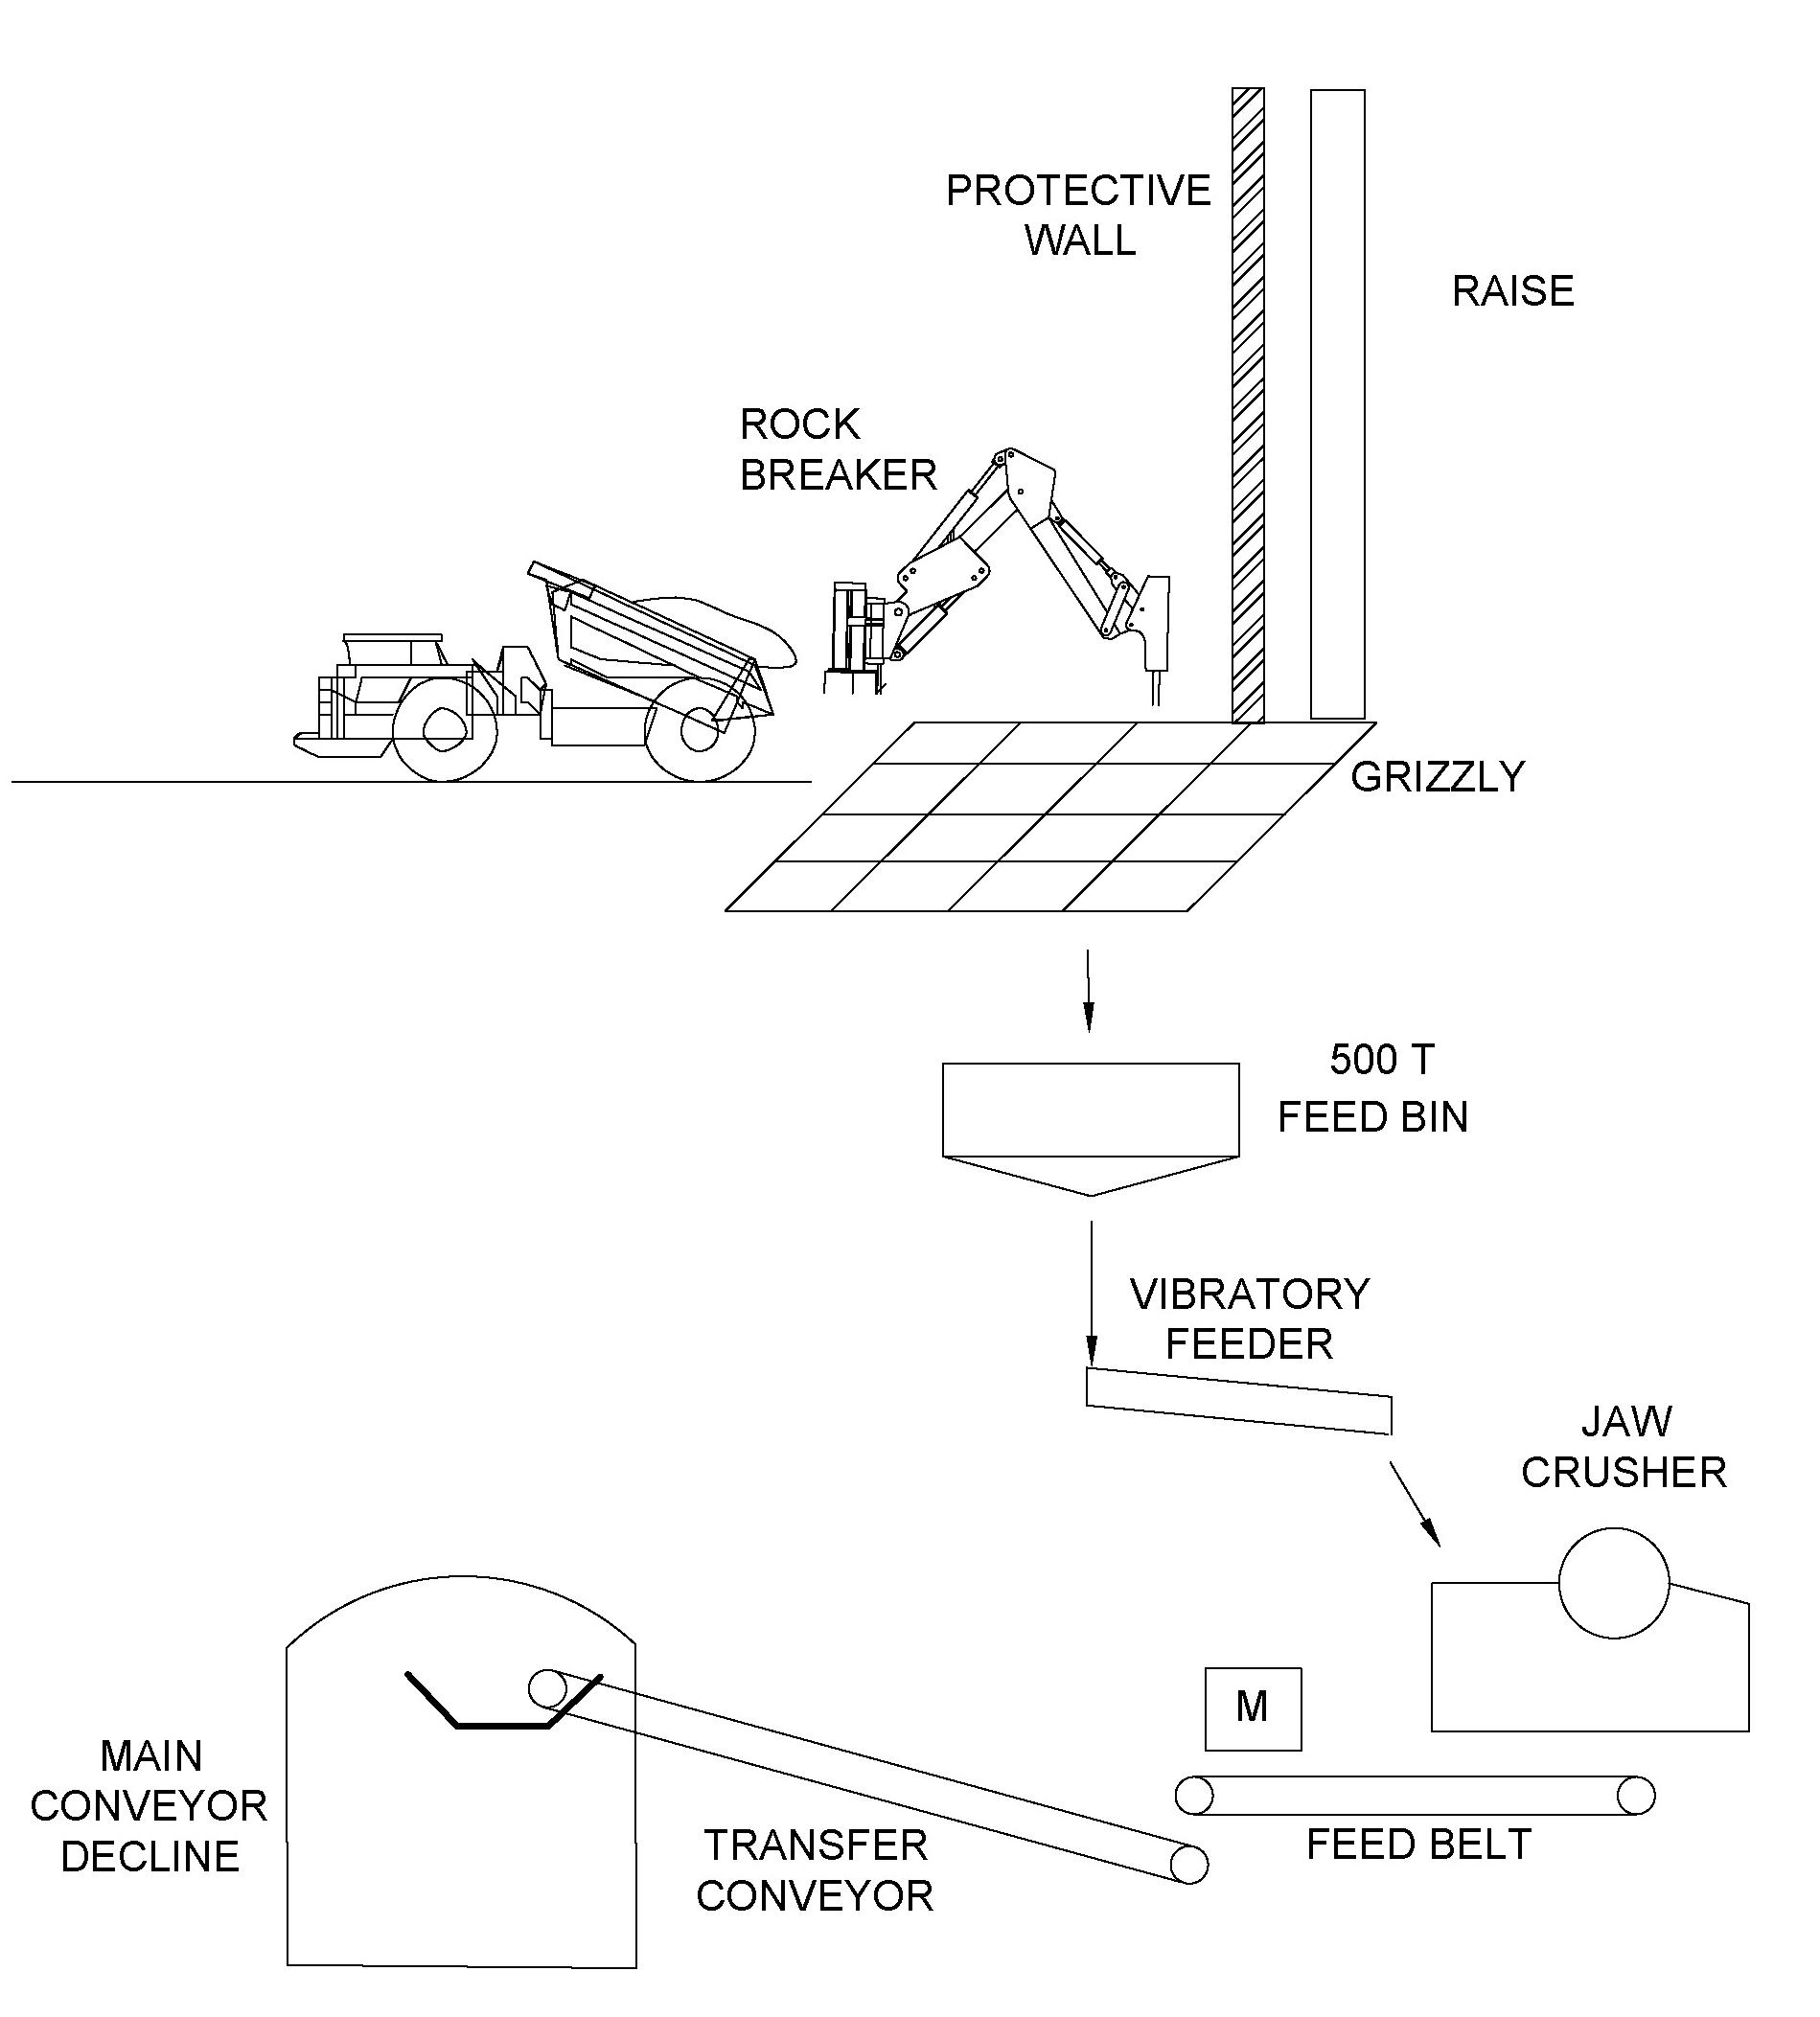
The grizzly consists of a steel girder grid with 200 mm openings and is served by a hydraulic rock breaker to handle oversize. A grizzly operator is responsible for managing the oversize, operating the rock breaker, and keeping the storage bin full.
The 500 t bin consists of steel plate liners over concrete mounted in structural steel beneath the grizzly. The mineralized material entering the bin has been sized by the grizzly to 100% passing 200 mm. The bin also includes a rock box as part of its design to help manage wear on the liners.
An inclined vibrating scalping feeder is mounted beneath the storage bin to control the discharge of material into the jaw crusher. The feeder consists of a pan section and a parallel bar section. The bars are tapered to provide a scalping action so that undersize passes through a chute to the feeder belt beneath. Oversize stays above the bars and tips into the jaw crusher. This feature ensures sufficient space within the jaw crusher to allow mineralized material to be crushed efficiently and ensures that power provided to the motor is spent only crushing oversize rock. A representative schematic of the feeder is provided in Figure 18.11.
| MAG Silver Juanicipio NI 43-101 Technical Report | |
| MAG Silver Corp. | 717002 |
| Figure 18.11 | Feeder schematic |
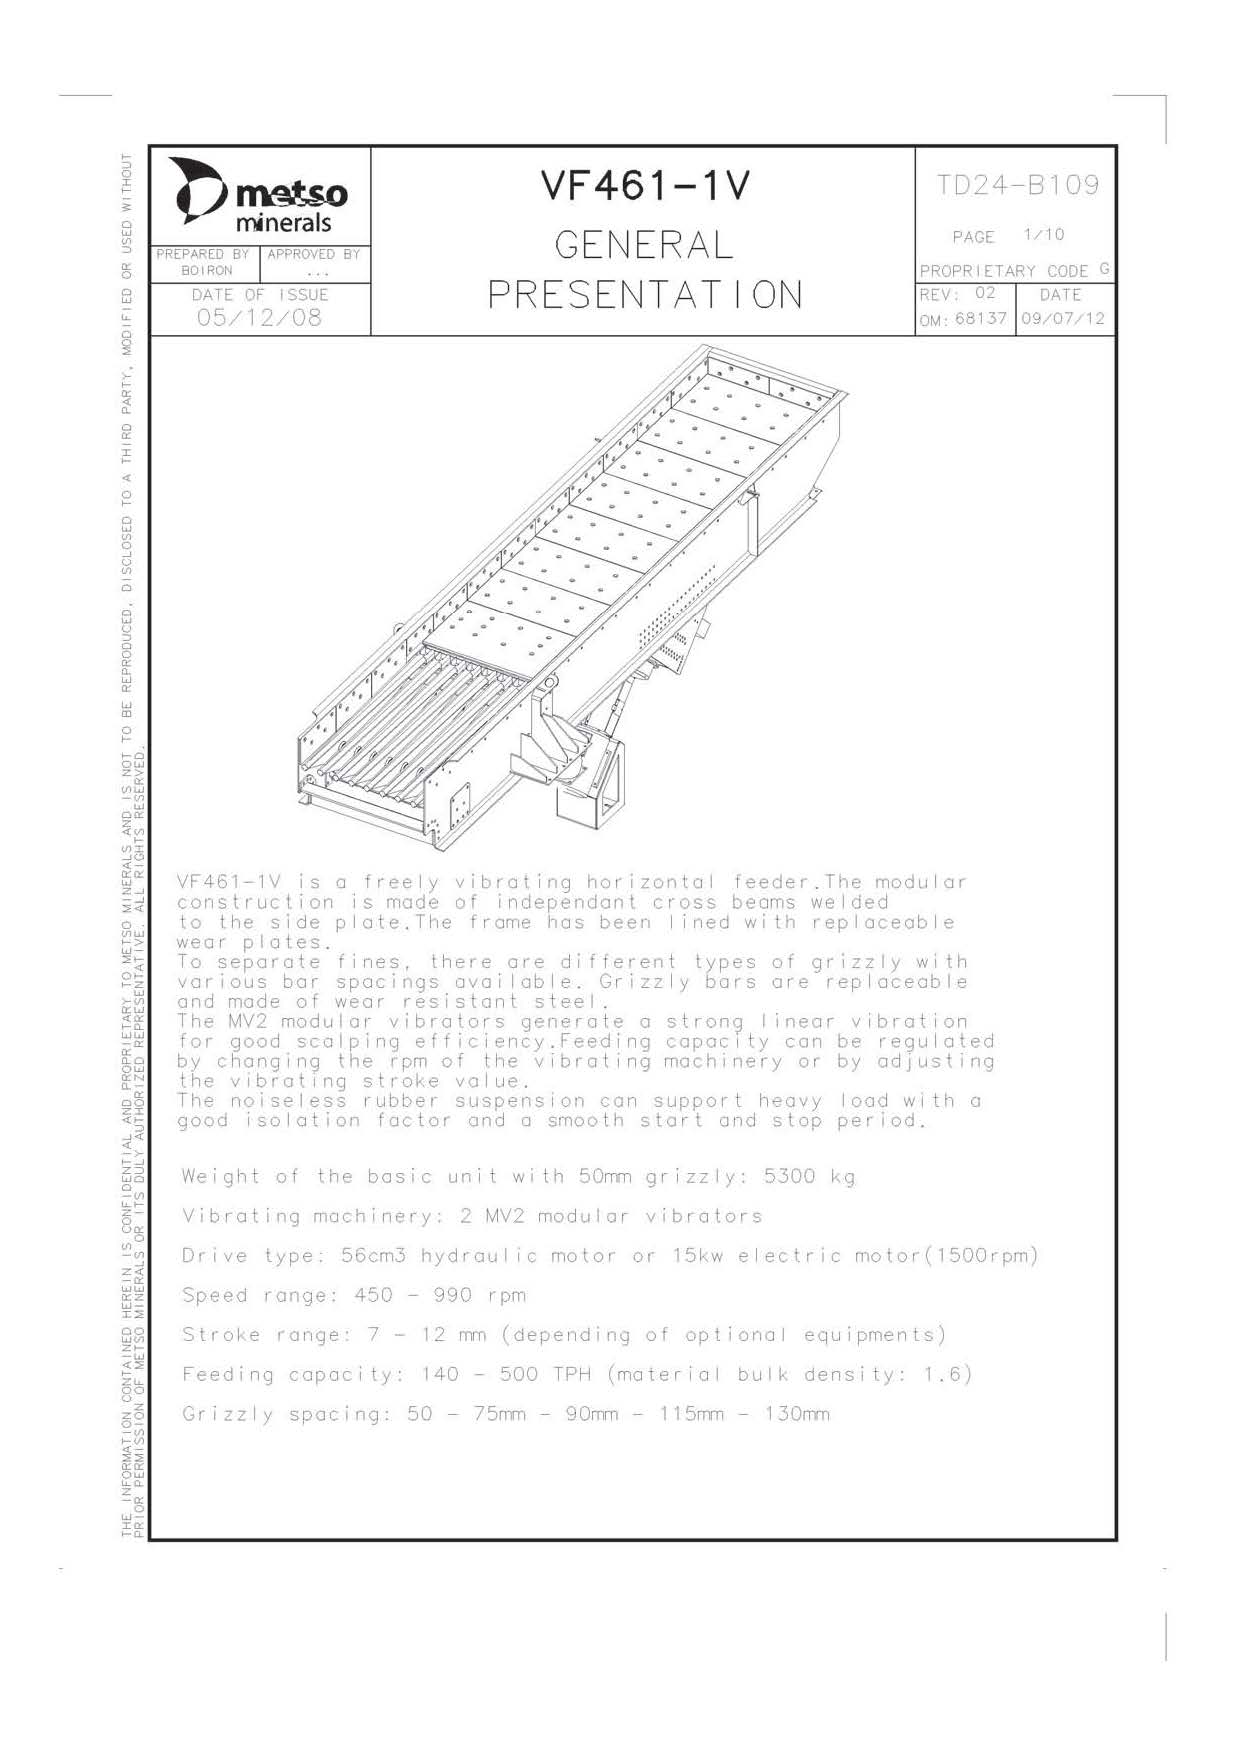
| MAG Silver Juanicipio NI 43-101 Technical Report | |
| MAG Silver Corp. | 717002 |
The jaw crusher is designed with a steel frame, weighted drive sheave, and eccentric driven jaw. Momentum in the drive sheave is used when the jaws compress an oversize piece of mineralized material. Shear forces induced in the mineralized material shatter it. The lower throat opening of the jaw is set to 100 mm to ensure that the material is appropriately sized for the conveyor system. Plan and section views of a proposed suitable jaw crusher to meet the PEA production rate are provided in Figure 18.12.
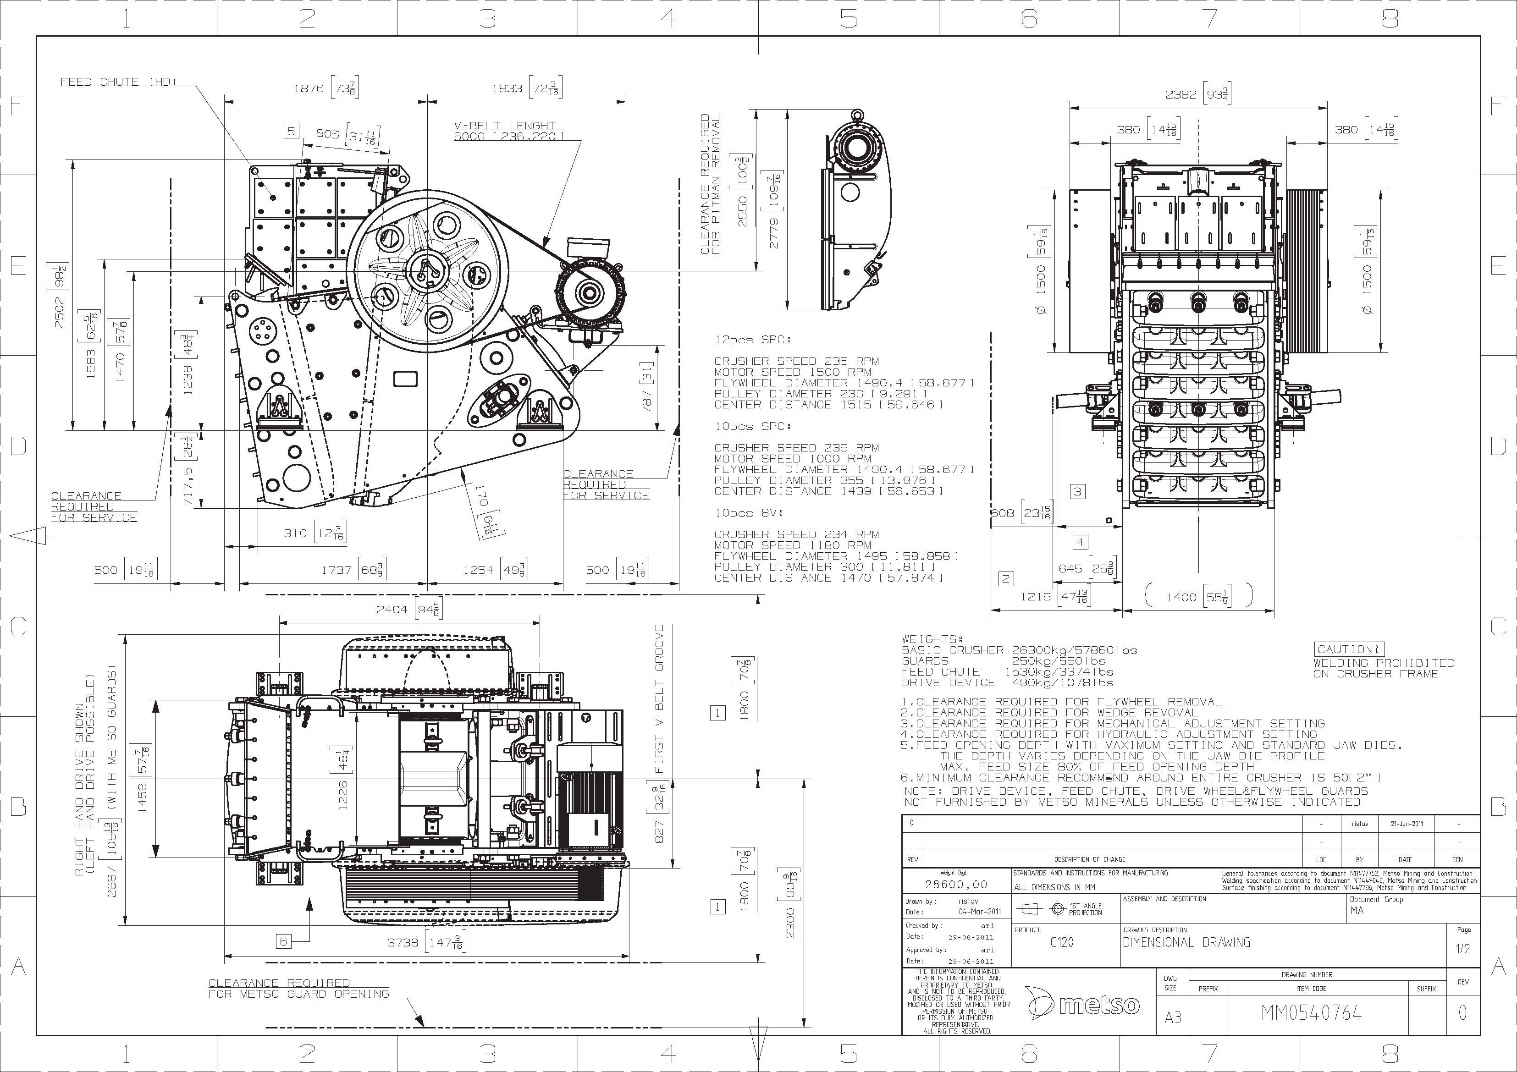
| 18.9.3.5 | Feed belt and magnet |
The scalping feeder and the jaw crusher discharge onto the feed belt. As with the feed belt for the winze loading pocket, this belt is wider, slower moving, and has many carry idlers to handle the impact and static loads imposed by the mineralized material. Fully enclosed hoods coupled with a ventilation system control dust generated by the process.
The feed belt is fitted with a self-cleaning belt magnet that picks up tramp steel such as bucket teeth or ground support steel. The feed belt is again considered a sacrificial piece of equipment in that it can be quickly changed or repaired at a lower cost than a main conveyor belt, should it be damaged or degraded by foreign objects in the mineralized material. The feed belt discharges onto a short transfer conveyor belt, which then discharges onto the first of two long conveyor belts that bring the mineralized material out of the mine.
| 18.10 | Underground conveyor system |
A composite plan view of the proposed underground conveyor system is shown in Figure 18.13.
| MAG Silver Juanicipio NI 43-101 Technical Report | |
| MAG Silver Corp. | 717002 |
| Figure 18.13 | Underground conveyor arrangement |

The conveyor belts are proposed to be 800 mm wide and to travel at 1.25 m/s. This width and speed ensures that some spare capacity is available, mitigates the generation of dust, and helps control wear on the belt.
Sections of conveyor truss consisting of back-to-back channel steel are hung from chains connected to rock bolts in the back of the decline. Carry and return idlers span the truss forming a ridged structure. Careful adjustments and shims in the hangers allow the sections to be lined up so that the belt tracks along the idlers.
The belt will be constructed of fire-resistant material and sprinklers will be provided along the length of the belt. The conveyor will be hung so that mobile service equipment can travel alongside the belt. Fire protection monitoring will be provided so that the belt can be stopped to prevent any spread of a potential fire.
The first and second underground conveyors will transport, in series, mineralized material out of the mine and onto a third conveyor that is located on the surface. The 920 m long surface conveyor will then transport mineralized material to the 8,000 t capacity surface stockpile. The surface conveyor will be mounted on steel support structures and will be provided with a cover to prevent fine mineralization loss due to wind.
The conveyor drives are proposed to be conventional S-type reversing belt drives using rubber-lagged pulleys. Low overhead transfer stations at the intersections are used to keep excavation sizes down. An active take-up system will be used at the drive end of each conveyor to provide the required functionality, while keeping the equipment in one location. A typical cross-section through an underground conveyor decline is shown in Figure 18.14. AMC notes that the conveyor decline is sized to accommodate a haul truck, this allows for suitable emergency capacity in case of conveyor downtime.
| MAG Silver Juanicipio NI 43-101 Technical Report | |
| MAG Silver Corp. | 717002 |
| Figure 18.14 | Cross section of the conveyor decline |
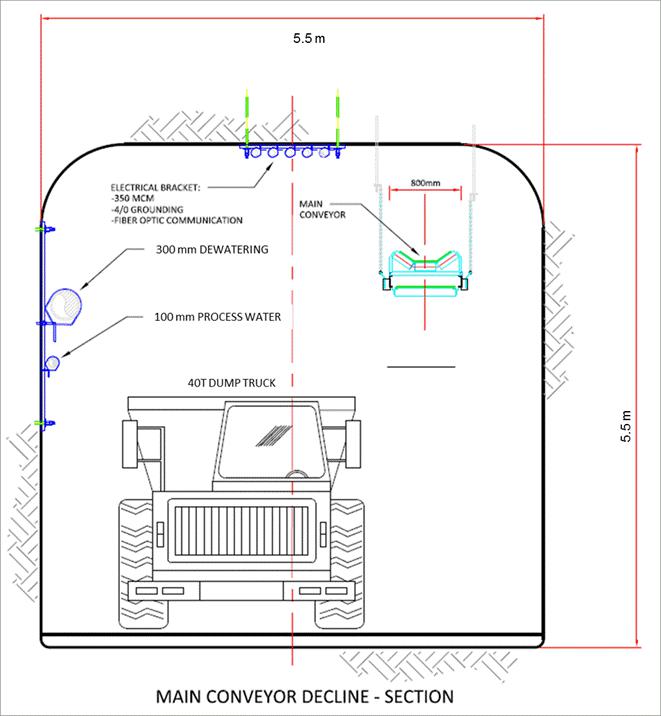
Two bays will be provided for the storage of bulk emulsion, each containing one 24,000 L storage tank and a storage area. The entrance to the bays will be controlled with a roll-up door and a man-door. The length of each bay is approximately 12.8 m.
| MAG Silver Juanicipio NI 43-101 Technical Report | |
| MAG Silver Corp. | 717002 |
A third bay will be designated for the storage of detonators on wooden shelves. A concrete wall with a steel door will separate this bay from the rest of the mine workings.
A powder bay will be designated for the storage of all other explosive products on wooden shelves. A concrete wall with a steel door will separate this bay from the rest of the mine workings.
All explosives bays are to be located on 1920 RL. The proposed bulk emulsion storage bay arrangement is shown in Figure 18.15.
| MAG Silver Juanicipio NI 43-101 Technical Report | |
| MAG Silver Corp. | 717002 |
| Figure 18.15 | Bulk emulsion storage - plan and sections |

| MAG Silver Juanicipio NI 43-101 Technical Report | |
| MAG Silver Corp. | 717002 |
| 18.12 | Underground workshops and warehouse |
The main maintenance area is proposed to be located on surface. All major scheduled planned maintenance and rebuilds will take place in the surface workshop. Two small service bays will be located underground in a dedicated service area to complete low-level maintenance such as lubrication and small repairs. The service bays will have finished concrete floors, monorail hoists, tire storage, lube storage and the capacity to make hydraulic hoses.
The service area will be equipped with a stationary compressor and airlines to power air tools and provide compressed air as needed. A welding plug will also be sited in this area. A warehouse and small office will be located near the underground service bay area.
As shown in Figure 18.16, the warehouse, a wash bay, offices, electrical substation and a refuge station will also be located near the underground workshop area. The workshop area will be ventilated by receiving fresh air from the ramp at 1850 RL and exhausting it via a dedicated exhaust drift to the return air raise that connects to the main ventilation return air drive and then to surface.
| Figure 18.16 | Underground workshop and related services |
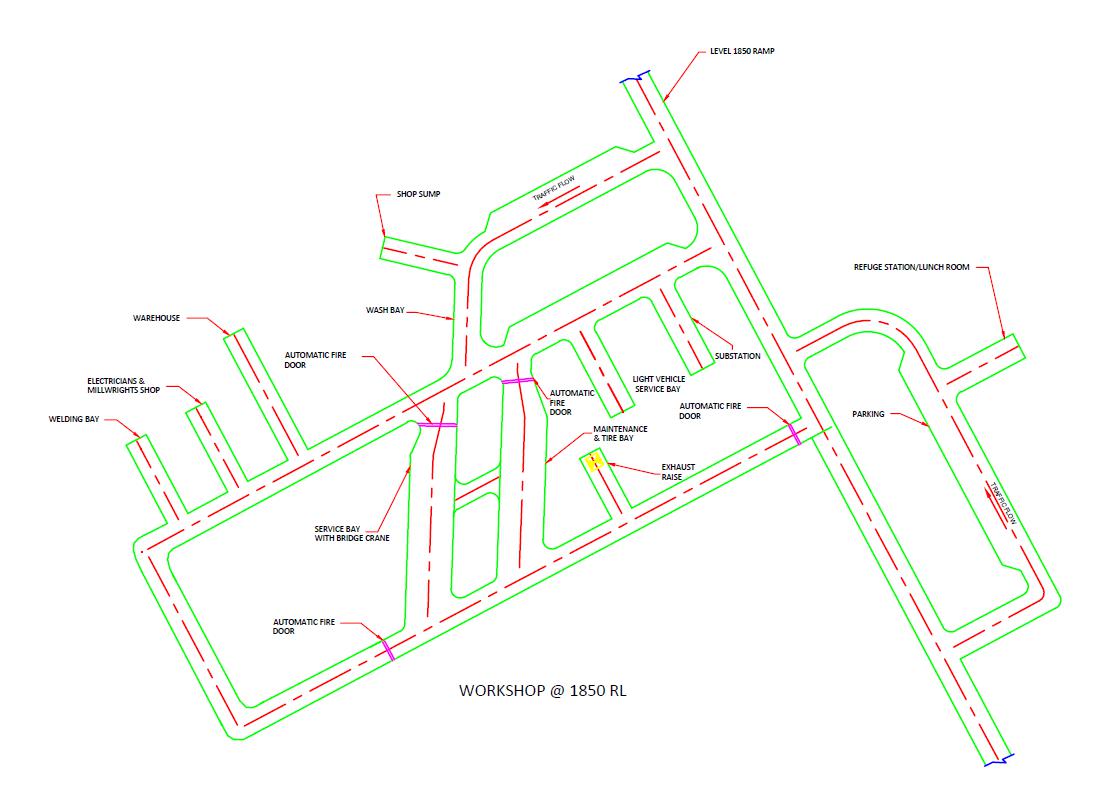
To reduce the quantity of fuel and oils stored underground, it is envisaged that the truck fleet and most utility vehicles will be fuelled on surface and maintained in a surface heavy equipment workshop. Only vehicles and equipment not travelling to surface as part of their daily routine will be fuelled underground. Fuel will be delivered underground from the surface fuel tanks in 2.5 kL modules. Refuelling or oil and greasing will be undertaken in the service bay.
| MAG Silver Juanicipio NI 43-101 Technical Report | |
| MAG Silver Corp. | 717002 |
| 18.14 | Compressed air requirements |
In consideration of the generally inefficient nature of mine-wide compressed air systems, local area compressors will supply compressed air. The underground maintenance and service bay area will have a dedicated compressor permanently installed, with compressed air lines from the air receiver routed to convenient locations in the area.
All mobile drilling equipment, including jumbos, longhole drills, bolters and cable bolters will be equipped with on-board compressors. ITH drills will have portable adjacent compressors to meet their elevated pressure requirements. Two units are required for this purpose.
Two smaller, portable compressors will be available to provide compressed air for any other activity that may require it. The portable compressors will be sized from 0.17 m3/sec to 0.42 m3/sec. They will also be electrically powered using the same jumbo plugs and jumbo boxes as other mobile equipment such as the jumbos and electric scoops. It may be advisable to have different sized compressors available depending on the task required.
These compressors will be used for activities such as blowing over benches or spot bolting with jacklegs (for activities such as small rehabilitation work). As most compressed air work will be done utilizing on-board compressors, the portable compressors will not be highly utilized.
| 18.15 | Refuge stations, emergency egress, and other emergency provisions |
In development of the ventilation strategy, consideration has been given to the potential for mine emergencies to occur. As such, the following criteria have been established:
| · | In general, ramps will be in fresh air following their initial development. |
| · | On almost all levels, escape can be made either up or down the ramp or across to the adjacent ramp system via connecting footwall drives at regular vertical intervals. |
30-person refuge station chambers will be used for emergencies; these chambers will be portable for flexibility of location at the most appropriate areas of the mine.
Whilst the primary means of communication will be by radio, a back-up stench system is proposed to be in place for the concurrent introduction of ethyl mercaptan into the twin access declines and into the conveyor decline.
Fire doors will be in accordance with legislated requirements and located to isolate areas of high fire potential to minimize possibility for noxious gases to be distributed through the mine workings.
A variety of incidents will trigger the emergency response plan and / or evacuation plan. The events listed below do not represent every possible emergency occurrence, but the responses to these events will be typical for most emergency situations. In the subsequent phases of engineering, detailed risk reviews are recommended to be conducted to identify and mitigate all foreseeable incidents.
Emergency events may be grouped into the following categories:
| · | Fire – This will cover any fire event, as well as the detection of explosive gases near or above the lower explosive limit (LEL), and the detection of carbon monoxide. |
| · | Rock fall – This will include any rock fall incident underground that results in personnel injury or blocks a worker escape route. |
| · | Injured personnel – This will cover any major personnel injury, requiring transport of the casualty to a hospital. |
| · | Major plant breakdown – This will cover any unplanned event that results in the inoperability of the ventilation system underground. |
Emergency coordination will occur from the mill control room where all information and communications can be monitored.
| MAG Silver Juanicipio NI 43-101 Technical Report | |
| MAG Silver Corp. | 717002 |
After production commences, secondary egress will be by one of the three portal declines and, in each zone, either up or down the zone declines (one of three) and then across to either of the other declines via the footwall drives which are inter-connected between the zones at regularly spaced vertical intervals.
As indicated above, an automatic stench gas warning system is proposed to be installed on the supply side of the twin access decline portals and the conveyor portal. When fired, this system will release stench gas into the main fresh air system allowing the gas to permeate rapidly throughout the mine workings.
If the automatic system fails to release, two back-up measures will be in place. Back-up measures include manual firing of the system at the unit allowing the stench gas to be distributed as above, and release of a gas cylinder by hand into the fresh air intake.
Once stench is released, underground mine personnel would report immediately to the nearest mine refuge station or surface, whichever is closer.
The primary purpose of fire doors is to prevent noxious gases from reaching workers should they be trapped underground and to prevent a fire from spreading as much as possible.
In accordance with the concepts of best safety practice, fire doors will have at least a one-hour fire resistance rating, will be maintained in proper order, kept clear of obstructions and be equipped with a self-closing man- door.
Fire doors are required to isolate the following areas:
| · | Workshop - doors are activated manually by an operator within the workshop upon detection of a fire. |
| · | Fuel bay - doors are activated automatically by a fusible link once a fire has reached a particular temperature or manually at the door by an operator. |
| · | Conveyor decline isolation doors - doors are activated either manually or remotely from surface. |
All fire doors have been specified as ‘roll-up’ style doors with appropriate pressure ratings and remote (surface) and manual activation capabilities. An internal man-door is included for escape, if needed.
| 18.16.1 | Mine water inflow estimate |
The ground water inflow into the mine is estimated using information from nearby mines and is not based on a hydrogeological model. The hydrology data available at the time of this report is not sufficiently detailed to fully understand the likely magnitude of water inflow into the mine along faults or other geological features. A hydrogeological study would help to determine, in more detail, the potential impact of ground water on the project and could lead to an opportunity to reduce the projected capital cost for underground pumping. Additionally, other mines in the region have encountered inflows at high temperatures which, if encountered at Juanicipio, could have an impact on necessary ventilation air quantities and the productive capacity of the workforce.
Other mine experience in the area has seen steady mine inflows of the order of 190 L/s in similar geological structures and lithologies to those that will be encountered at Juanicipio. Relating the strike length of the Juanicipio mineralization to other mineralization strike lengths in the areas has allowed a design criterion for long term steady state inflow of 95 L/s to be projected. The mine dewatering system will be sized to handle twice this amount as the peak outflow.
| MAG Silver Juanicipio NI 43-101 Technical Report | |
| MAG Silver Corp. | 717002 |
| 18.16.2 | Existing structures and hydrogeology |
There have been no detailed investigations carried out on the hydrogeology of the Juanicipio area. However, considering mine experience in the area, there is a potential to intersect large underground aquifers. The main risk associated with ground water is flooding or delays in production. Given the potential for captured aquifers and structural ground water, it is recommended that a detailed investigation be carried out on the hydrogeology of the Juanicipio area.
| 18.16.3 | Overall dewatering strategy |
The overall dewatering strategy largely depends on accessing levels of the mine well ahead of stope production from those levels. This early development approach provides a means for installing a series of dewatering sumps, which will dewater sections of the mine prior to production mining. The risk of flooding will be partially mitigated by this early development strategy and by the provision of spare pumping capacity (100% redundancy over currently projected maximum inflow expectations).
The dewatering strategy is based on a dirty water system. All ground water encountered will flow into the development drives and be channelled into sumps and then pumped to surface. During development of the main declines and conveyor decline, a pumping system will be installed to handle the development ground water in-flow. This system will not be removed once the mine is in production; rather, it will form part of the overall dewatering system. After settlement in the sumps, some ground water will be re-used for local activities such as watering down.
A simplified schematic of the final arrangement of the overall mine dewatering system is shown in Figure 18.17. Water would flow along the levels to the sumps at the declines. These sumps would either transfer the water up to the next sump via pumps or transfer down to the next sump via gravity.
A main sump at the bottom of Zone 2 will collect water from Zones 1, 2, and 3 and use high head and high efficiency stacked impeller pumps to pump clear water from the sump via boreholes, and pipes in ventilation raises, to the intermediate sump located on 1730 RL. Pumps at the intermediate sump will transfer the water up to the 1940 level, along the conveyor decline, and out of the mine to the mill for reuse during processing.
| MAG Silver Juanicipio NI 43-101 Technical Report | |
| MAG Silver Corp. | 717002 |
| Figure 18.17 | Overall mine dewatering schematic |

| 18.16.4 | Zones 1, 2, and 3 dewatering system |
As the declines for each zone are developed, dirty water sumps will be constructed on 60 m vertical intervals. These sumps will each be equipped with a pair of 38 kW submersible pumps. Each pump can transfer 32 L/s of water up to the next sump along the decline via a 150 mm HDPE flanged pipe. Upper sumps at or near the 1730 level will transfer ground water over to the intermediate sump.
This staged sump system will remain in place throughout the mine life, although the amount of water made is expected to reduce as the mine workings reach greater depths in Zones 1, 2, and 3. Two pumps are placed in each of the sumps to provide redundancy.
When the mine development reaches the bottom of each zone, the lower permanent sump will be developed. This sump will then receive water from dirty water sumps in the lower sections of Zones 1, 2, and 3.
As shown in Figure 18.17 above, with few exceptions, most of the dirty water sumps in Zones 1, 2, and 3 will be eventually vertically interconnected to the next sump below. Dirty water will flow downwards from one sump to the next without requiring the use of pumps. At this point the submersible pumps in these sumps are redundant and could be relocated to support further dewatering elsewhere.
| MAG Silver Juanicipio NI 43-101 Technical Report | |
| MAG Silver Corp. | 717002 |
| 18.16.5 | Twin access decline dewatering system |
The twin access declines will continue to use the existing staged submersible pumps, along with clean water boost pumps, until the 1730 level intermediate sump is developed. At that time, the water collected in the declines will be routed to the intermediate sump and removed from the mine using that system.
| 18.16.6 | Dirty water sump arrangement |
The dirty water sumps will consist of three rounds driven at right angles to the decline and down at 15%. The submersible pumps will both be hung from a monorail for ease of access and maintenance. 440 V power will be distributed to the pumps via locally mounted switchgear, with simple float switches controlling the pumps themselves. The solids reporting to the sump will remain in the sump for clean-up via an LHD as required. The pumps will be hung at least 600 mm off the bottom of the sump. A general arrangement drawing of the dirty water sump is provided in Figure 18.18.
| Figure 18.18 | Dirty water sump arrangement |
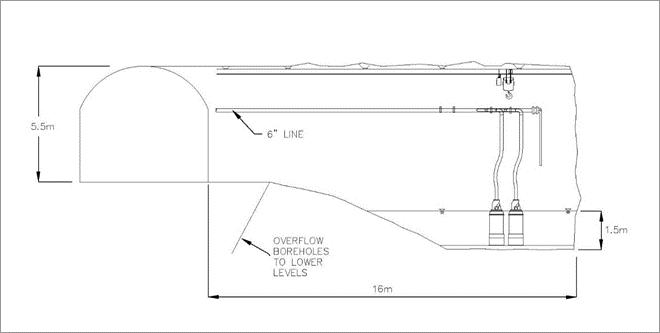
Many of the sumps that are required later in the mine life will be connected by a borehole to the next lower sump. Again, this is done to allow the bulk of the solids to remain in the sump. The sumps will need to be cleaned while active mining is going on at the levels immediately above the sump but, as the mine progresses to new areas, the need to regularly clean the sump will decrease. Solids removed from the sumps will be deposited in nearby stopes as backfill.
| 18.16.7 | 1730 level intermediate sump arrangement |
The intermediate sump will consist of a dirty water sump driven down at 15%. The far end of the sump will interconnect via a weir with a flat decant sump. Water will flow over the weir and into the sump leaving the solids behind. The decanted water sump is sized to have a 284 m3 live capacity.
The retaining dam at the end of the sump separates it from the pump room. The pump room is flat lying and leads back to the main decline and joins it at the same elevation.
Three independent drains mounted 300 mm off the floor of the sump will penetrate the retaining dam. Two of these drains are equipped with basket strainers. The three drains lead into a suction header that feeds the four main dewatering pumps. Figure 18.19 shows the proposed intermediate sump arrangement.
| MAG Silver Juanicipio NI 43-101 Technical Report | |
| MAG Silver Corp. | 717002 |
| Figure 18.19 | Intermediate sump arrangement |

Each of the main dewatering pumps is sized at 63 L/s capability and a nominal power capacity of 600 kW. They will be a stacked impeller, high efficiency type of pump and will be equipped with isolating valves at both ends and check valves on the discharge.
The outlet of each pump is tied into the 200 mm discharge header, which then leads to the 300 mm SCH 80 seamless grade B welded steel pipe that comprises the main dewatering discharge line up the conveyor decline toward the mill. The discharge header will be equipped with water hammer suppression bladders to protect the equipment and pipeline.
Switchgear for the pump station will be sited in a nearby chamber located up the decline at least at the same level as the dirty water sump. Unplanned releases of water will flow down and away from the electrical switchgear.
The pump chamber will be equipped with an overhead crane, servicing area, monitoring equipment, and an area to store tools and supplies.
| 18.16.8 | 1270 elevation lower sump arrangement |
The lower sump arrangement is very similar to the intermediate sump arrangement. Pumps and motors are common between the two to minimize spares and maintenance working capital. The clean water discharge will be routed through a 200 mm welded steel line up a system of boreholes and ventilation raises. Water hammer will be less of a concern so the compensators will be somewhat smaller. Maintenance facilities and provisions will also be less.
| MAG Silver Juanicipio NI 43-101 Technical Report | |
| MAG Silver Corp. | 717002 |
A small sump pump at the very bottom of the decline and at the bottom of the winze will be required to transfer water to the dirty water side of the lower sump.
| 18.16.9 | Dewatering pipelines |
The conveyor decline dewatering pipe is selected as 300 mm steel welded line due to the high pressure, durability and reliability requirements. On surface, the line will be changed to 300 mm HDPE for the 920 m distance to the water collection dam. Pumping velocities are to be kept low to conserve power and the water is ‘clean’ having been through two sets of decanting sumps by the time it reaches this stage of the system.
The vertical dewatering pipeline from the lower sump to the intermediate sump is selected as 200 mm steel welded line due to the high pressure expected for the vertical routing planned. High velocities are recommended to ensure that suspended solids are not settled within the vertical pipeline.
| 18.16.10 | Main dewatering pumps |
The main dewatering pumps specified for installation at the intermediate and lower sumps are 600 kW 63 L/s stacked impeller, high efficiency pumps. There are four pumps in each of the sumps to provide redundancy and the ability to take a pump out of service for maintenance while retaining nominal capacity.
The control system for the pumps will ensure even wear across all the pumps, even the standby pump, as this is important to have peak flow capability when required. Since the pumps are operated in parallel, a pump with higher wear than its partners would be unable to contribute as effectively to the discharge flow rate.
The clean water sump will activate a pump when the water level reaches one third of its capacity. A second pump will be activated when the water level reaches two thirds of its capacity. Once the water level returns to a third of its capacity the first pump will be deactivated. When the sump reaches two thirds of its capacity again, the third pump will be activated. Each pump will be used in turn, thereby keeping a constant wear rate on all the pumps.
Figure 18.20 shows a representative stacked impeller mine dewatering pump.
| MAG Silver Juanicipio NI 43-101 Technical Report | |
| MAG Silver Corp. | 717002 |
| Figure 18.20 | Stacked impeller mine dewatering pump |
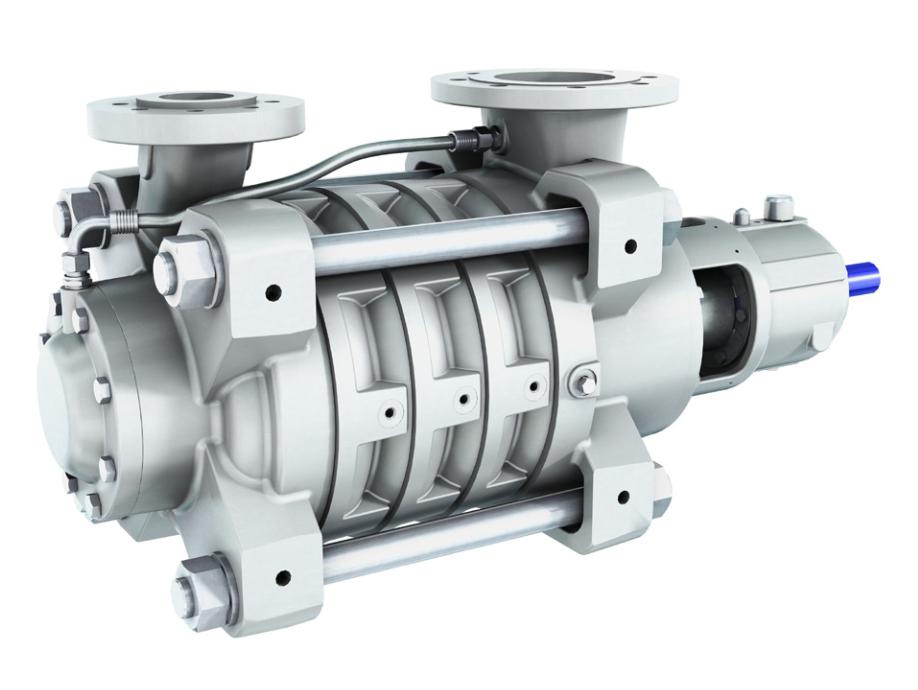
Should the full capacity of the sump be reached, then three pumps will be activated. This will retain a 300 mm freeboard on the sump. If the sump overflows, then all available pumps will be activated (although the gain associated with the fourth pump will be minimal).
The pump impellers are common across the set, so that individual spare impellers can be kept in stock instead of entire pumps. Should one or more impellers fail, the spare impellers can be used to return a pump to service quickly. Other wear parts such as bearings, packing glands, couplings, and thrust plates should also be stocked.
Clean water for use in mine activities will be recycled from the clean water sumps in the mine. A distribution system consisting of 100 mm HDPE pipe will be spread throughout the declines and along the operating levels and to the service bay area. Clean water will be collected from the intermediate sump and routed through pressure reducing valves to ensure that a consistent and safe pressure is maintained.
Some of the operating areas in the mine are above the intermediate sump. In this case, a small pressure-activated boost pump will be used to lift clean water to those areas.
The decline conveyor transfer stations will require clean service water for clean-up and other maintenance purposes. 100 mm HDPE will be routed down the conveyor decline, and pressure reducing valves will maintain the water pressure at a safe level.
The main and second development declines will pump clean water to the surface portal using a series of booster pumps and the pipe system already in place.
| MAG Silver Juanicipio NI 43-101 Technical Report | |
| MAG Silver Corp. | 717002 |
| 19 | Market studies and contracts |
Project economics have been assessed using the following metal prices, which were selected after discussion with MAG Silver and referencing current market and recent historical prices, values used in other recent projects, and forecasts in the public domain
| · | Silver price = $17.90/oz |
No detailed market studies have been undertaken at this stage of the project. Lead and zinc concentrates are commonly sold as part of the world’s mining and metals industries. At this stage in the project no marketing contracts have been entered into.
It is envisaged that silver-rich zinc concentrate may be sold to smelters in the Asian region. Lead concentrate could potentially be sold to a smelter in Mexico or exported to offshore smelters. If sold to a local smelter, transport costs could be reduced.
Treatment and other terms for lead and zinc concentrates suggested by Neil S. Seldon & Associates Ltd. (NSA, 2016) were referenced in estimating revenue and are shown in Table 19.1 and Table 19.2. Both lead and zinc concentrates are projected to incur minor treatment penalties for impurities. The Qualified Person responsible for Section 19 has reviewed the advice and the supporting assessment by NSA and accepts responsibility for use in this report of the treatment and other terms set out in Table 19.1 and Table 19.2. Preliminary assumptions for the pyrite concentrate are summarized in Table 19.3. The pyrite concentrate is expected to be of high value and it is assumed that it will be sold to a Mexican smelter, but other alternatives are expected to be available.
| Table 19.1 | Lead concentrate treatment terms |
| Treatment terms | Value |
| Gold payment terms (% of contained metal in concentrate) | 95% |
| Minimum deduction from gold grade | 1.0 g |
| Silver payment terms (% of contained metal in concentrate) | 95% |
| Minimum deduction from silver grade | 50 g |
| Lead payment terms (% of contained metal in concentrate) | 95% |
| Minimum deduction from lead concentrate grade | 3 units (%) |
| Lead concentrate treatment charge | $235/dmt |
| Gold refining charge applied to payable gold metal | $5.00/oz |
| Silver refining charge applied to payable silver metal | 4% of the per oz silver price |
| Table 19.2 | Zinc concentrate treatment terms |
| Treatment terms | Value |
| Gold payment terms (% of contained metal in concentrate) after deduction below | 65% |
| Deduct from gold grade | 1.0 g |
| Silver payment terms (% of contained metal in concentrate) after deduction below | 70% |
| Deduct from contained silver in concentrate | 3 oz |
| Zinc payment terms (% of contained metal in concentrate) | 85% |
| Minimum deduction from zinc concentrate grade | 8 units (%) |
| Zinc concentrate treatment charge | $235/dmt |
| MAG Silver Juanicipio NI 43-101 Technical Report | |
| MAG Silver Corp. | 717002 |
| Table 19.3 | Pyrite concentrate treatment terms |
| Treatment terms | Value |
| Gold payment terms (% of contained metal in concentrate) | 97.5% |
| Silver payment terms (% of contained metal in concentrate) | 97.5% |
Assumed concentrate transport costs and moisture content are shown in Table 19.4.
| Table 19.4 | Concentrate transport costs |
| Transport cost | Value |
| All concentrates | $115/wmt |
| Moisture content for all concentrates | 10% |
| MAG Silver Juanicipio NI 43-101 Technical Report | |
| MAG Silver Corp. | 717002 |
| 20 | Environmental studies, permitting, and social or community impact |
Environmental investigations have been initiated on the areas likely to be disturbed by the proposed project. These include baseline environmental assessments and initial studies required under Mexican Environmental Laws for the proposed plant site. A mine closure plan has not yet been developed.
The project area is in a region that hosts several significant mining operations where the community is accustomed to mining activities. AMC is not aware of any environmental permitting or licensing requirements to which the Property will be subject other than the normal permitting and licensing requirements as set forth by the Mexican Government prior to undertaking mine development and operations.
The key permits and licences likely to be required by the project are:
| · | Land Purchasing agreements by Minera Juanicipio. |
| · | Environmental Impact Assessment Report required by the Environmental Authority. |
| · | Land Use Change Authorization by the Environmental Authority. |
| | |
| · | Justifying Technical Study required by the Environmental Authority. |
MAG Silver reports that the operator, Fresnillo, has obtained all the required licences and permits needed for the ramp, access roads and mill site preparation, and is in the process of applying for any additional licences and permits required for production and milling.
| MAG Silver Juanicipio NI 43-101 Technical Report | |
| MAG Silver Corp. | 717002 |
| 21 | Capital and operating costs |
The AMC estimation of project capital costs has included mobile equipment, underground conveyor, winze, mine dewatering, ventilation, twin access declines, and underground power supply and distribution. Capital cost estimates from the 2012 PEA study, with suitable cost escalation applied, were referenced in the estimation process.
The following assumptions were made for the pre-production and sustaining capital cost estimate:
| · | Lateral and vertical development unit costs per metre were estimated with particular reference to projected advance rates (100 m/month in the case of single-face lateral development advance). |
| · | Pre-production assumption to use contractors for trucking based on contractor rates for varying haulage distances of approximately $0.54/t-km. |
| · | Full ownership fleet trucking unit costs for production period were estimated at $1.45/t-km. |
| · | Project capital for milling (grinding, flotation, reagents, tails, services, infrastructure and equipment) was escalated by the 6 / 10 power rule from estimates generated in the 2012 PEA. The scaling factor of 0.6 is representative of estimating costs for changes in capacity:Cost A / Cost B = (Capacity A / Capacity B)0.6. |
| · | Project capital requirements for infrastructure (surface equipment, water supply, power supply, technical services, earthworks, tailings dam and pipeline) were updated using 2012 PEA estimates as a reference. |
| · | Fixed sustaining capital amounts ($/year) for ventilation, milling, and infrastructure were updated while referencing the 2012 PEA estimates. |
| · | Most indirect capital costs remained the same as for the 2012 PEA study; some were updated to reflect changes to the infrastructure including the addition of the winze and underground conveyor. |
| · | Capital costs of the pastefill plant (included in the 2012 PEA study) were excluded from this study because of the change to a waste rock fill system. |
| · | No allowance has been made for closure costs at this stage in the project. Closure costs are generally considered to be realized at the end of the mine life (21 years of operations projected in the PEA) and, due to currency value depreciation over time, are expected to have little impact on the Net Present Value of the project. At this level of study, it is assumed that the resale value of the plant, infrastructure and fixed and mobile equipment and any earnings through reclamation of mine services material and equipment will be sufficient to cover the closure costs. |
| · | Sunk costs are based on all development completed as of September 2017, with these quantities being captured in as-built wireframes. The assumption has also been made that development will continue at the single-face advance rate of 100 m/month between 1 October 2017 and 31 December 2017. |
All costs, unless otherwise stated, are in US dollars ($).
| 21.1.1 | Total capital cost estimate for the mine |
The total estimated capital cost for the project over the LOM is summarized in Table 21.1
The major adjustments to the project capital estimate since the 2012 PEA are the inclusion of capital for the winze, underground conveyor decline and conveyor system, additional underground equipment, as well as adjustments for scale to accommodate the increase in production rate from 2,650 tpd to 4,000 tpd.
| MAG Silver Juanicipio NI 43-101 Technical Report | |
| MAG Silver Corp. | 717002 |
| Table 21.1 | Total capital cost estimate |
| | Pre-production capital ($) |
| Item | Total ($) | 2018 | 2019 | 2020* |
| Underground development | 226,272,930 | 25,243,270 | 32,209,310 | 5,241,840 |
| Mine equipment | 161,878,000 | | 7,284,510 | 4,249,300 |
| Winze | 64,044,740 | | | |
| Material movement - trucking development waste | 46,949,770 | 1,778,840 | 2,082,660 | 1,414,330 |
| Road and powerline to portal | 5,914,000 | 5,914,000 | | |
| Process plant | 91,877,700 | 23,902,690 | 38,244,310 | 9,561,080 |
| Surface infrastructure | 68,138,330 | 13,865,330 | 13,865,330 | 13,865,330 |
| UG infrastructure (including sustaining capital) | 65,830,930 | 19,276,980 | 19,276,980 | 19,276,980 |
| Capitalized Opex | 22,770,790 | 5,149,800 | 14,096,800 | 3,524,200 |
| EPCM | 24,956,260 | 8,318,750 | 8,318,750 | 8,318,750 |
| Owners cost | 16,377,420 | 5,459,140 | 5,459,140 | 5,459,140 |
| Contingency | 45,157,810 | 15,052,600 | 15,052,600 | 9,572,230 |
| Total | 840,168,680 | 123,961,400 | 155,890,390 | 80,483,180 |
| Pre-production capital | 360,334,970 | | | |
| Sustaining capital | 479,833,710 | | | |
Totals do not necessarily equal the sum of the components due to rounding adjustments.
* Q1 2020
The projected annual capital expenditure is summarized in Table 21.2.
| Table 21.2 | Annual capital expenditure |
| Year | Date | Capital $M |
| Year 1 | 2018 | 123.96 |
| Year 2 | 2019 | 155.89 |
| Year 3 | 2020 | 124.54* |
| Year 4 | 2021 | 87.77 |
| Year 5 | 2022 | 42.37 |
| Year 6 | 2023 | 42.17 |
| Year 7 | 2024 | 44.48 |
| Year 8 | 2025 | 35.42 |
| Year 9 | 2026 | 24.61 |
| Year 10 | 2027 | 34.27 |
| Year 11 | 2028 | 21.11 |
| Year 12 | 2029 | 26.77 |
| Year 13 | 2030 | 30.09 |
| Year 14 | 2031 | 9.64 |
| Year 15 | 2032 | 9.19 |
| Year 16 | 2033 | 6.30 |
| Year 17 | 2034 | 5.75 |
| Year 18 | 2035 | 3.93 |
| Year 19 | 2036 | 6.52 |
| Year 20 | 2037 | 2.78 |
| Year 21 | 2038 | 2.60 |
| Total | | 840.17 |
Totals do not necessarily equal the sum of the components due to rounding adjustments.
* $80.48 M of this value is included in pre-production capital (Q1 Year 3) and $44.06 M in sustaining capital (Q2- Q4 Year 3).
| MAG Silver Juanicipio NI 43-101 Technical Report | |
| MAG Silver Corp. | 717002 |
| 21.1.2 | Underground mine capital cost estimate |
Key capital cost areas for underground include development, mining equipment and related infrastructure. The capital cost estimate includes an underground conveyor to move mineralized material from the 1950 RL crusher to the processing facility and an internal winze for mineralized material handling below the 1950 RL. Development waste is assumed to be hauled to surface or placed directly into stopes as backfill.
The 2012 PEA study (2,650 tpd production rate) was used as a reference for this cost estimate. To account for the higher production rate, some of the capital costs previously estimated were factored upwards using the six tenths rule for increases in production throughput and allowances for inflation, and then further checked for reasonableness.
Adjustments to the mine design and infrastructure required some new cost estimates for both capital and operating costs, and these were determined from first principles. The cost estimate as a whole is based on the equipment and infrastructure needed for a 4,000 tpd production and development scenario, with a significant proportion of mineralized material mined in the latter stages of mine life assumed to be mined at depths beyond those envisaged in the 2012 PEA.
The total underground mine capital cost estimate is provided in Table 21.3. Pre-production capital (capital spent prior to Q2 in Year 3) as well as sustaining capital is shown.
| Table 21.3 | Underground capital costs |
| Capital cost | Total capital ($M) | Pre-production capital (Year 1 to Q1 Year 3 - $M) | Sustaining capital ($M) |
| Underground development | 226 | 63 | 163 |
| Mine equipment | 162 | 12 | 150 |
| Winze | 64 | | 64 |
| Material movement - trucking of capital waste | 47 | 5 | 42 |
| Underground infrastructure | 66 | 58 | 8 |
| Capitalized opex (UG mine) | 15 | 15 | |
| EPCM | 12 | 12 | |
| Owner’s cost | 2 | 2 | |
| Contingency | 20 | 20 | |
| Total | 615 | 187 | 428 |
Totals do not necessarily equal the sum of the components due to rounding adjustments.
| 21.1.2.1 | Underground development capital costs |
Lateral development unit cost rates based on 100 m/month single-face advance rate are summarized in Table 21.4, along with those for vertical development. These development rates are based on current contractor pricing information.
| MAG Silver Juanicipio NI 43-101 Technical Report | |
| MAG Silver Corp. | 717002 |
| Table 21.4 | Capital mine development unit rates |
| Capital development costs | $/m |
| Access decline | 2,657 |
| Conveyor decline | 3,254 |
| Sub-level access | 2,762 |
| Footwall drive | 2,360 |
| Fresh air drive | 2,794 |
| Return air drive | 2,735 |
| Remuck bays | 3,254 |
| Longhole raise | 1,445 |
| Raise bore | 1,415 |
| Ore pass | 1,415 |
| 21.1.2.2 | Underground mobile equipment capital costs |
The underground capital cost estimate for mobile equipment is $162M; the split by pre-production and sustaining capital is shown in Table 21.5.
| Table 21.5 | Underground mobile equipment capital costs |
| Description | $M |
| Equipment pre-production capital* | 11.5 |
| Sustaining capital | 150.5 |
| Total capital | 162 |
* Year 1 to Q1 Year 3, inclusive.
The estimate for mobile equipment includes the following:
| · | Longhole production drill (4) |
| · | 2-boom development jumbo (9) |
| · | 17-tonne LHDs (4 production, 9 development) |
| · | 40-tonne trucks (4 production, 6 waste) |
| 21.1.2.3 | Winze capital costs |
The winze capital cost estimate is $78M and is summarized in Table 21.6.
| Table 21.6 | Winze capital costs |
| Description | $M |
| Winze sinking and furnishings | 59.5 |
| Sustaining capital | 4.5 |
| EPCM, owner’s costs, and contingency | 14 |
| Total | 78 |
Note: Totals do not necessarily equal the sum of the components due to rounding adjustments.
| 21.1.2.4 | Underground infrastructure capital costs |
The underground infrastructure capital cost estimate is $84 M - see Table 21.7. Costs are based upon supplier quotations and unit rates from past experience with similar projects. The underground infrastructure costs largely consist of electrical distribution, crushing, conveying, ventilation, and dewatering system costs.
| MAG Silver Juanicipio NI 43-101 Technical Report | |
| MAG Silver Corp. | 717002 |
| Table 21.7 | Underground infrastructure capital costs |
| Description | $M |
| Mine dewatering | 9 |
| Conveyors | 28 |
| Crushing plant | 3 |
| Electrical distribution | 10 |
| Workshop, magazine, and refuge stations | 3 |
| Primary fans and facilities | 5 |
| Sustaining capital | 8 |
| Indirect costs and contingency | 18 |
| Total | 84 |
Note: Totals do not necessarily equal the sum of the components due to rounding adjustments.
| 21.1.3 | Process plant capital costs |
Process plant capital costs are based on those from the 2012 PEA study and have been escalated by the 6 / 10 power rule, with suitable cost escalation and checking applied. Table 21.8 shows a breakdown of the direct capital costs estimated for the process plant.
| Table 21.8 | Process plant capital costs |
| Description | Total $M | Project $M | Sustaining $M |
| Crushing* | | | |
| Grinding | 20 | 16 | 4 |
| Flotation | 50 | 39 | 11 |
| First fill costs | 2 | 1 | 1 |
| Tailings | 6 | 3 | 2 |
| Services | 6 | 5 | 1 |
| Infrastructure | 7 | 6 | 2 |
| Mobile equipment | 2 | 2 | |
| Total | 92 | 71 | 21 |
* Included in UG infrastructure capital costs.
Totals do not necessarily equal the sum of the components due to rounding adjustments.
| 21.1.4 | Surface infrastructure capital costs |
Surface infrastructure capital costs are based on those from the 2012 PEA study and, with the exception of the tailings dam and pipeline, have been escalated by the 6 / 10 power rule. All costs have had suitable cost inflation applied and have been checked for reasonableness. Table 21.9 shows a breakdown of the direct capital costs.
| Table 21.9 | Surface infrastructure capital costs |
| Description | Total $M | Pre-production $M | Sustaining $M |
| Surface mobile equipment | 6 | 2 | 4 |
| Surface buildings and infrastructure | 12 | 8 | 5 |
| Water supply | 10 | 7 | 3 |
| Power supply and site distribution | 7 | 5 | 2 |
| Technical services | 3 | 0 | 2 |
| Earthworks | 4 | 4 | 0 |
| Tailings dam and pipeline | 26 | 16 | 10 |
| Total | 68 | 42 | 26 |
Note: Totals do not necessarily equal the sum of the components due to rounding adjustments.
| MAG Silver Juanicipio NI 43-101 Technical Report | |
| MAG Silver Corp. | 717002 |
| 21.1.4.1 | Access road and powerline capital costs |
Relative to the 2012 PEA, the proposed process plant location has been changed, resulting in the need for an access road to be built to connect the highway to the process plant (1.5 km) and the plant to the main decline portal (6.5 km). A powerline will also be built adjacent to the access roads. Capital costs are based on calculations using first principles and known material and construction costs from other studies. The capital cost for the roads are estimated at $4.1M and for the power line $1.8M.
| 21.1.5 | Indirect capital costs |
Indirect costs are those relating to engineering, procurement, and construction management (EPCM), the costs associated with servicing and maintaining the mine during the construction period, and operating costs incurred prior to first concentrate production. Indirect capital costs are based on those from the 2012 PEA study and where applicable, have been scaled and suitable inflation has been applied.
Table 21.10 shows the split of the indirect capital cost estimate into Owner’s costs and EPCM.
| Table 21.10 | Indirect capital costs |
| Indirect costs | $M |
| Owner’s costs | 16.4 |
| EPCM | 24.9 |
| Total | 41.3 |
Totals do not necessarily equal the sum of the components due to rounding adjustments.
Details of the Owner’s Costs and EPCM costs are shown in Table 21.11.
| Table 21.11 | Owner’s and EPCM capital cost details |
| Description | $M |
| Process plant | 14.1 |
| Access road and powerline | 0.2 |
| UG winze | 0.3 |
| UG infrastructure | 1.8 |
| Total owner’s costs | 16.4 |
| Process plant | 12.2 |
| Access road and powerline | 0.5 |
| UG winze | 5.0 |
| UG infrastructure | 7.2 |
| Total EPCM costs | 24.9 |
Note: Totals do not necessarily equal the sum of the components due to rounding adjustments.
| 21.1.6 | Capital contingency |
Capital contingency amounts are shown in Table 21.12. The amounts are based on percentages applied to individual detailed line items.
| MAG Silver Juanicipio NI 43-101 Technical Report | |
| MAG Silver Corp. | 717002 |
| Table 21.12 | Capital contingency |
| Contingency | $M |
| Mine | 19.9 |
| Process plant | 14.4 |
| Surface infrastructure | 10.9 |
| Total | 45.2 |
Totals do not necessarily equal the sum of the components due to rounding adjustments.
Key factors related to the operating cost estimate are:
| · | Some unit mine operating costs from the 2012 PEA were updated for inflation. |
| · | Revised costs were estimated for trucking, conveying and hoisting activities. Costs relating to labour, equipment and power were also updated to reflect the current production schedule. |
| · | Power costs were estimated based on updated infrastructure requirements and a unit cost of $0.0834/kWh. |
| · | A waste rock backfill operating cost of $0.87/t mineralized material for imported waste rock fill from surface was estimated from first principles. |
| · | Ore drift development unit costs per metre were based on the single-face average advance rate of 100 m/month. The labour component (~30%) of unit costs was scaled-up from the 2012 PEA to reflect this (the 2012 PEA assumed a single-face advance rate of 120 m/month). Unit ore development costs are also projected to be 10% higher for 100 m/month compared to the 2012 PEA. Unit development rates reflect current contractor development rates. |
| · | Variable processing unit costs ($/t milled) remained the same as for the 2012 PEA to reflect inflation but also taking account of the savings due to economies of scale. Fixed processing costs ($/year) for items such as salaries, mill maintenance and other fixed costs, were escalated by the 6 / 10 power rule to account for the higher mill throughput rate, and suitable cost inflation was also applied. |
| · | Fixed general and administration (G&A) costs ($/year) for items including site administration, human resources, finance and purchasing, general maintenance, safety and environment, were escalated by the 6 / 10 power rule to account for the higher production rate, and suitable cost inflation was also applied. |
| · | Operating costs were estimated for the underground conveyor at $0.59/t and for the winze and crusher at $1.22/t. These costs include labour, energy, and maintenance. |
| 21.2.1 | Mine site operating costs |
A summary of life of mine site operating costs is shown in Table 21.13 and by year in Table 21.14.
| Table 21.13 | Summary of life of mine site operating costs |
| Department | $M |
| Mine | 808 |
| Process plant | 471 |
| General and administration | 77 |
| Total | 1,357 |
Note: Totals do not necessarily equal the sum of the components due to rounding adjustments.
| MAG Silver Juanicipio NI 43-101 Technical Report | |
| MAG Silver Corp. | 717002 |
| Table 21.14 | Summary of life of mine site operating costs |
| Year | Date | Operating cost $M |
| Year 1 | 2018 | |
| Year 2 | 2019 | |
| Year 3 | 2020 | 48 |
| Year 4 | 2021 | 79 |
| Year 5 | 2022 | 83 |
| Year 6 | 2023 | 85 |
| Year 7 | 2024 | 84 |
| Year 8 | 2025 | 87 |
| Year 9 | 2026 | 85 |
| Year 10 | 2027 | 85 |
| Year 11 | 2028 | 87 |
| Year 12 | 2029 | 89 |
| Year 13 | 2030 | 80 |
| Year 14 | 2031 | 78 |
| Year 15 | 2032 | 74 |
| Year 16 | 2033 | 74 |
| Year 17 | 2034 | 73 |
| Year 18 | 2035 | 57 |
| Year 19 | 2036 | 48 |
| Year 20 | 2037 | 34 |
| Year 21 | 2038 | 29 |
| Total | | 1,357 |
Note: Totals do not necessarily equal the sum of the components due to rounding adjustments.
Unit site operating costs have been estimated at $58.67/t milled. The summary cost breakdown is shown in Table 21.15.
| Table 21.15 | Unit site operating costs |
| Area | $/t milled |
| Mine | 34.95 |
| Process plant | 20.37 |
| General and administration | 3.34 |
| Total | 58.67 |
Note: Totals do not necessarily equal the sum of the components due to rounding adjustments.
| 21.2.2 | Underground mine operating costs |
Underground mine operating cost estimates are summarized in Table 21.16.
These estimates are lower (approximately 20%) than the 2012 PEA estimates, driven largely by economies of scale and the projected reduction in trucking and backfill costs.
| MAG Silver Juanicipio NI 43-101 Technical Report | |
| MAG Silver Corp. | 717002 |
| Table 21.16 | Life of mine underground mine operating costs |
| Operating costs | $M | $/t milled |
| Ore development | 142 | 6.14 |
| Stoping - drill and blast | 131 | 5.66 |
| Production mucking | 43 | 1.85 |
| Trucking - development ore + stope ore | 50 | 2.17 |
| Conveyor (not including power) | 12 | 0.50 |
| Winze (not including power) | 17 | 0.74 |
| Crushing (not including power) | 8 | 0.36 |
| Imported backfill | 20 | 0.87 |
| Ground support | 39 | 1.67 |
| Mine general | 141 | 6.08 |
| Power* | 94 | 4.05 |
| Mine management and tech services | 113 | 4.87 |
| Total | 808 | 34.95 |
* Energy cost for conveying and hoisting included in total power cost.
Totals do not necessarily equal the sum of the components due to rounding adjustments.
| 21.2.3 | Process plant operating costs |
Variable process plant operating costs are based on those from the 2012 PEA study and, where applicable, have been escalated by the 6 / 10 power rule. Fixed operating costs have also had suitable cost escalation applied. Table 21.17 shows a breakdown of the variable and fixed operating costs for the process plant.
| Table 21.17 | Life of mine process plant operating costs (variable and fixed) |
| Category | $M | $/t milled |
| Variable | | |
| Stockpile reclaim | 18.4 | 0.8 |
| Power | 130.1 | 5.6 |
| Steel liners and media | 50.5 | 2.2 |
| Reagents | 149.7 | 6.5 |
| Fixed | | |
| Other fixed costs | 15.7 | 0.7 |
| Wages and salaries | 69.1 | 3.0 |
| Mill maintenance | 37.5 | 1.6 |
| Total | 471.0 | 20.4 |
Note: Totals do not necessarily equal the sum of the components due to rounding adjustments.
| 21.2.4 | General and administration operating cost |
General and administration (G&A) costs have been estimated at $3.34/t milled using the following methodology:
| · | Site administration, safety and environment, human resources, financing, and purchasing have been estimated by developing a labour schedule and applying the appropriate unit labour costs. An allowance has been made to cover materials and consumables used by these departments. |
| · | General services and maintenance costs have been estimated by applying a factor to the cost of capital purchases for infrastructure. |
| · | Power consumption has been estimated based on the installed power capacity of the electrical equipment. |
Table 21.18 shows the life of mine General and Administration operating costs.
| MAG Silver Juanicipio NI 43-101 Technical Report | |
| MAG Silver Corp. | 717002 |
| Table 21.18 | Annual and life of mine general and administration operating costs |
| G&A | Life of mine $M | $/t milled |
| Site administration | 7.5 | 0.32 |
| Safety and environment | 8.5 | 0.37 |
| Human resources | 7.5 | 0.33 |
| Finance and purchasing | 24.3 | 1.05 |
| General services and maintenance | 25.6 | 1.11 |
| Power - (G&A) | 3.9 | 0.17 |
| Total | 77.3 | 3.34 |
Note: Totals do not necessarily equal the sum of the components due to rounding adjustments.
| 21.2.5 | Estimated annual power costs |
Life of mine power costs as well as unit cost/t milled for each of the major activities during steady state production are summarized in Table 21.19. Costs have been based on an assumed unit cost of $0.0834/kWh. Annual cost of power is approximately 16.8% of the annual total site operating cost.
| Table 21.19 | Estimated life of mine and annual power costs at steady state production |
| Area | Life of mine $M | $/t milled |
| Mine | 94.0 | 4.05 |
| Processing | 130.1 | 5.61 |
| General and administration | 3.9 | 0.17 |
| Total | 228.0 | 9.83 |
| MAG Silver Juanicipio NI 43-101 Technical Report | |
| MAG Silver Corp. | 717002 |
All currency is in US dollars ($) unless otherwise stated. The cost estimate was prepared with a base date of Year 1 and uses constant Year 1 dollars (no inflation). For Net Present Value (NPV) estimation, all costs and revenues are discounted at 5% from the base date. Metal prices were selected after discussion with MAG Silver and referencing current market and recent historical prices, values used in other recent projects, and forecasts in the public domain. An exchange rate of MXP18.46:US$1 and a corporate tax rate of 30%, special mining duty of 7.5% and a 0.5% gross gold and silver revenue royalty, have been assumed.
AMC conducted a high level economic assessment of the conceptual underground operation of the Juanicipio project. The mine is projected to generate approximately $1,860M pre-tax NPV and $1,138M post-tax NPV at 5% discount rate, pre-tax IRR of 64.5% and post-tax IRR of 44.5%. Project capital is estimated at $840M with a payback period of 3.4 years (undiscounted pre-tax cash flow from Project Year 1) (1.8 years from plant start-up). Key assumptions and results of the underground mine economic assessment are provided in Table 22.1. The life of mine (LOM) production schedule, average metal grades, recovered metal, and cash flow forecast are shown in Table 22.7.
An operating cash cost of (negative) $3.94 per oz of silver was calculated by taking the operating costs less by-product revenues for gold, lead and zinc, and dividing this value by the payable ounces of silver. All-in sustaining (AISC) cost of $5.02/oz Ag was calculated by summing operating costs, taxes, duties and royalties, and sustaining capital, and dividing by the total payable ounces of silver.
The 2017 PEA is preliminary in nature. It includes Inferred Mineral Resources that are considered too speculative geologically to have the economic considerations applied to them that would enable them to be categorized as Mineral Reserves. There is no certainty that the PEA will be realized.
| Table 22.1 | Key economic assumptions and results |
| Juanicipio project | Unit | Value |
| Total mineralized rock | tonnes | 23,123,706 |
| Total waste production | tonnes | 6,758,008 |
| Production tonnage silver grade(1) | g/t | 282 |
| Production tonnage gold grade(1) | g/t | 1.37 |
| Production tonnage zinc grade(1) | % | 3.43 |
| Production tonnage lead grade(1) | % | 1.84 |
| Silver recovery(1) | % | 94.8 |
| Gold recovery(1) | % | 81.6 |
| Zinc recovery(1) | % | 89.8 |
| Lead recovery(1) | % | 92.8 |
| Silver price | $/oz | $17.90 |
| Gold price | $/oz | $1,250 |
| Zinc price | $/lb | $0.95 |
| Lead price | $/lb | $1.00 |
| Silver payable(2) | % | 87 |
| Gold payable(2) | % | 73 |
| Zinc payable(2) | % | 76 |
| Lead payable(2) | % | 86 |
| Payable silver metal | oz | 182,789,511 |
| Payable gold metal | oz | 747,417 |
| MAG Silver Juanicipio NI 43-101 Technical Report | |
| MAG Silver Corp. | 717002 |
| Juanicipio project | Unit | Value |
| Payable zinc metal | lb | 1,326,904,724 |
| Payable lead metal | lb | 811,923,951 |
| Revenue split by commodity | Silver | 51.90% |
| Revenue split by commodity | Gold | 14.82% |
| Revenue split by commodity | Zinc | 21.05% |
| Revenue split by commodity | Lead | 12.23% |
| Gross revenue | $ (M) | $6,304 |
| Capital costs | $ (M) | 840 |
| Operating costs (total)(3) | $ (M) | 1,357 |
| Mine operating costs(4) | $/t | 34.95 |
| Processing costs | $/t | 20.37 |
| General and administration | $/t | 3.34 |
| Operating costs (total)(3) | $/t | 58.67 |
| Operating cash cost (Ag) | $/oz Ag | (3.94) |
| Total all-in sustaining cost (Ag) | $/oz Ag | 5.02 |
| Payback period from plant start-up(5) | Years | 1.8 |
| Cumulative net cash flow(6) | $ (M) | 3,152 |
| Pre-tax NPV @5% discount rate | $ (M) | 1,860 |
| Pre-tax IRR | % | 64.5 |
| Post-tax NPV @5% discount rate | $ (M) | 1,138 |
| Post-tax IRR | % | 44.5 |
1. LOM average.
2. Overall payable % includes recoveries, treatment, transport, refining costs, and selling costs.
3. Includes mine operating costs, milling, and mine G&A.
4. Underground mining costs only.
5. Values are post-tax from projected plant start-up.
6. Pre-tax and undiscounted.
| MAG Silver Juanicipio NI 43-101 Technical Report | |
| MAG Silver Corp. | 717002 |
Table 22.2 below illustrates the effect of various price levels on key economic measures.
| Table 22.2 | Metal price sensitivity analysis |
| Discount Rate (5%) | | Base Case | | | 2012 Metal Prices(1) |
| Metal Prices: | | | | | | |
| Silver ($/oz) | 14.50 | 17.90 | 19.50 | 23.00 | 23.39 |
| Gold ($/oz) | 1,000 | 1,250 | 1,300 | 1,450 | 1,257 |
| Lead ($/lb) | 0.75 | 0.95 | 0.95 | 1.15 | 0.95 |
| Zinc ($/lb) | 0.75 | 1.00 | 1.05 | 1.20 | 0.91 |
| Copper ($/lb) | N/A – Copper excluded for purposes of PEA(2) | | |
| Economics: | | | | | 2017 | 2012(3)(7) |
| Pre-Tax NPV (M) | $1,080 | $1,860 | $2,104 | $2,776 | $2,427 | $1,762 |
| After-Tax NPV (M) | $635 | $1,138 | $1,295 | $1,729 | $1,503 | $1,233 |
| Pre-Tax IRR | 45% | 64% | 71% | 86% | 83% | 54% |
| After-Tax IRR | 30% | 44% | 49% | 61% | 58% | 43% |
| Undiscounted life of mine (“LOM”) after tax cash flow(M) | $1,170 | $1,995 | $2,243 | $2,945 | $2,542 | $2,162 |
| Cash cost $/oz Ag (net of credits)(4) | (0.35) | (3.94) | (4.45) | (6.90) | (3.11) | (0.03) |
| Total Cash cost $/oz Ag(5) | 3.50 | 2.39 | 2.63 | 2.29 | 4.89 | N/A(1) |
| AISC $/oz Ag(6) | 6.13 | 5.02 | 5.25 | 4.92 | 7.51 | N/A(1) |
| Payback (Years) From Plant Start up | 2.6 | 1.8 | 1.6 | 1.2 | 1.3 | 2.1 |
1. Based on metal prices used in the previous 2012 Juanicipio PEA, this column has been provided in order to demonstrate the economic effect on the project given the expanded resource and enhanced project scope – and compares PEA economics. Corporate tax rate in 2012 used was 28% (with no special mining duty or gold/silver royalties).
2. Although the resource for the Deep Zone includes copper (see below), no copper circuit has been included in the PEA as no metallurgical testing and recovery assessment has yet been completed on copper.
3. See Press Release June 14, 2012. Total Cash cost and AISC per oz. of silver were not calculated for the 2012 report.
4. Cash costs include all operating costs, smelter, refining and transportation charges, net of by-product (gold, lead and zinc) revenues.
5. Total cash costs include cash costs and all corporate taxes, special mining duties, and precious metals royalties.
6. All in sustaining costs (“AISC”) include total cash costs and all sustaining capital expenditures.
7. In the 2012 study, the exchange rate for the Mexican Peso was fixed at 12.86 pesos to one US dollar.
Table 22.2 above highlights how the project generates very positive economics across a range of metal-price scenarios, with the greatest sensitivity being in relation to silver price and grade, and to a lesser extent, in relation to exchange rate and zinc price. Silver and zinc account for 52% and 21%, respectively, of the gross revenue under the Base Case scenario. The impact of varying silver and zinc prices on the after-tax NPV and IRR is outlined in Table 22.3.
| Table 22.3 | Impact of varying silver and zinc pricing on after-tax NPV and IRR(1) |
| Zinc price ($/lb.) | | After-tax NPV 5% (M US$) / After-tax IRR (%) |
| $1.75 | $768 / 26% | $1,065 / 36% | $1,361 / 45% | $1,657 / 55% | $1,953 / 65% | $2,249 / 74% |
| $1.50 | $647 / 24% | $943 / 33% | $1,240 / 44% | $1,536 / 54% | $1,832 / 63% | $2,128 / 73% |
| $1.25 | $526 / 21% | $822 / 31% | $1,118 / 42% | $1,415 / 52% | $1,711 / 62% | $2,007 / 71% |
| $1.00 | $405 / 18% | $701 / 29% | $997 / 40% | $1,293 / 50% | $1,590 / 60% | $1,886 / 70% |
| $0.75 | $284 / 15% | $580 / 26% | $876 / 37% | $1,172 / 48% | $1,469 / 58% | $1,765 / 68% |
| | $8.00 | $12.00 | $16.00 | $20.00 | $24.00 | $28.00 |
| | | Silver price ($/oz) |
1. Gold at $1,250/oz and lead at $0.95/lb.
| MAG Silver Juanicipio NI 43-101 Technical Report | |
| MAG Silver Corp. | 717002 |
Payable production for each metal is based on processing recoveries less smelter deductions and losses during third party treatment of the lead, zinc and pyrite concentrates, as shown in Table 22.4.
| Table 22.4 | Estimated LOM payable production by metal including silver equivalent ounces (AgEq. oz.) |
| Metals from concentrates(1) | Total payable metal production LOM | Average 1st6 years (2020-2025) | LOM annual average | Peak annual production (year) |
| Silver (M oz.) | 183 | 16.5 | 9.6 | 20.1 (2021) |
| Gold (K oz.) | 747 | 43.8 | 39.3 | 50.6 (2025) |
| Lead (M lb.) | 812 | 30.6 | 42.7 | 63.0 (2031) |
| Zinc (M lb.) | 1,327 | 54.3 | 69.8 | 95.9 (2031) |
| Silver equivalent ounces payable (M)2 | 352 | 24.2 | 18.5 | 26.5 (2023) |
1. Lead, zinc, and pyrite concentrates produced.
2. Silver equivalent calculated using the NSR assumptions of the PEA and base case metal prices of $17.90 silver; $1250 gold; $0.95 lead and $1.00 zinc.
Income and other taxes presented in the PEA are based on Mexican legislated tax rates and do not reflect any tax planning opportunities. The tax provisions include a conventional profit based tax using the 30% corporate tax rate currently in effect, a 7.5% special mining duty applied on earnings before amortization and taxes, and a 0.5% gross revenue royalty on all gold and silver revenues. Employee profit sharing (PTU) is not included in the financial estimates and the net present value (NPV) and internal rate of return (IRR) of the project may fluctuate depending on how the project is structured once it is in operation.
Specific rates used are outlined in Table 22.5, and result in total combined taxes of $1,157 M in the base case scenario.
| 22.5 | Overall cash operating cost (on-site and off-site costs) |
LOM combined on-site ($58.67/t) and off-site ($41.32/t) operating costs are $99.99/t of mill feed, or $2,313 M. As shown in Table 22.5, the LOM Cash Cost (on-site and off-site, less by-product credits) is negative $3.94/oz Ag, and Total Cash Cost (including taxes) is $2.39/oz Ag. All-In Sustaining Costs (AISC) total $5.02/oz Ag, and include total cash costs plus sustaining capital.
| Table 22.5 | Cash costs, total cash costs and AISC per oz of silver (base case) |
| Item | Total $M | Cost per oz of silver(1) |
| Operating costs | 1,357 | |
| Offsite costs | 956 |
| Less: by-product credits(2) | (3,033) |
| Cash cost | (720) | $ (3.94) |
| Corporate tax (30%) | 837 | |
| Special mining duty (7.5%) | 299 |
| Gold and silver gross revenue duty (0.5%) | 21 |
| Total cash cost | 437 | $ 2.39 |
| Sustaining capital | 480 | |
| AISC | 917 | $ 5.02 |
1. Based on 183 M ounces of payable silver production.
2. By-product revenue credits: gold $934 million, lead $771 million, zinc $1.327 billion.
Table 22.6 shows the life of mine (LOM) gross revenues, offsite and operating costs, initial and sustaining capital, taxes and undiscounted cash flow, in total dollars and as a cost per tonne of ore processed by the mill.
| MAG Silver Juanicipio NI 43-101 Technical Report | |
| MAG Silver Corp. | 717002 |
| Table 22.6 | LOM undiscounted cash flow, revenue and cost summary |
| | Total $M | $/tonne mill feed |
| Gross revenue | 6,304 | 272.64 |
| Offsite costs | 956 | 41.32 |
| Operating costs | 1,357 | 58.67 |
| Initial capital | 360 | 15.58 |
| Sustaining capital | 480 | 20.75 |
| Taxes | 1,157 | 50.05 |
| LOM undiscounted cash flow: | 1,995 | 86.27 |
Totals do not necessarily equal the sum of the components due to rounding adjustments.
Table 22.7 shows the LOM development, and production and cash flow forecast for the PEA.
| MAG Silver Juanicipio NI 43-101 Technical Report | |
| MAG Silver Corp. | 717002 |
| Table 22.7 | Juanicipio PEA LOM production and cash flow forecast |
| Item | Unit | Total | 2018 | 2019 | 2020 | 2021 | 2022 | 2023 | 2024 | 2025 | 2026 | 2027 | 2028 | 2029 | 2030 | 2031 | 2032 | 2033 | 2034 | 2035 | 2036 | 2037 | 2038 |
| Mineralization mined | kt | 23,124 | 15 | 199 | 652 | 1,291 | 1,400 | 1,400 | 1,400 | 1,400 | 1,400 | 1,400 | 1,400 | 1,400 | 1,400 | 1,397 | 1,400 | 1,400 | 1,400 | 1,050 | 796 | 515 | 407 |
| Development - lateral | m | 143,775 | 8,034 | 12,895 | 11,153 | 11,431 | 10,815 | 10,895 | 11,260 | 10,800 | 10,800 | 10,800 | 10,796 | 10,556 | 6,783 | 2,741 | 1,200 | 707 | - | 99 | 1,759 | 251 | - |
| Development - vertical | m | 7,889 | 2,232 | 1,014 | 367 | 491 | 127 | 511 | 1,030 | 903 | 106 | 683 | 154 | 229 | 30 | - | - | - | - | - | 15 | - | - |
| Waste mined | kt | 6,758 | 913 | 843 | 683 | 557 | 560 | 517 | 579 | 426 | 363 | 331 | 317 | 249 | 259 | 37 | 39 | - | - | 8 | 72 | 5 | - |
| Mill feed | kt | 23,124 | - | - | 867 | 1,291 | 1,400 | 1,400 | 1,400 | 1,400 | 1,400 | 1,400 | 1,400 | 1,400 | 1,400 | 1,397 | 1,400 | 1,400 | 1,400 | 1,050 | 796 | 515 | 407 |
| Gold grade - ROM | g/t | 1.37 | 1.67 | 2.25 | 1.71 | 1.30 | 1.38 | 1.28 | 1.32 | 1.52 | 1.50 | 1.34 | 1.29 | 1.26 | 1.23 | 1.25 | 1.15 | 1.20 | 1.30 | 1.58 | 1.65 | 1.60 | 1.85 |
| Silver grade - ROM | g/t | 282 | 369.74 | 800.46 | 636.44 | 550.13 | 447.57 | 468.17 | 354.27 | 300.67 | 280.38 | 201.93 | 194.94 | 180.96 | 198.00 | 153.72 | 155.59 | 180.86 | 195.85 | 185.53 | 202.99 | 178.44 | 350.00 |
| Lead grade - ROM | % | 1.84 | 0.17% | 0.43% | 0.73% | 0.89% | 1.21% | 1.15% | 1.52% | 1.77% | 1.72% | 1.99% | 2.09% | 2.14% | 1.84% | 2.37% | 2.17% | 2.26% | 2.15% | 2.50% | 2.47% | 2.63% | 2.13% |
| Zinc grade - ROM | % | 3.43 | 0.18% | 0.75% | 1.62% | 1.90% | 2.42% | 2.55% | 2.99% | 3.31% | 3.46% | 3.77% | 3.87% | 3.82% | 3.31% | 4.10% | 4.02% | 4.07% | 3.98% | 4.28% | 4.26% | 4.51% | 3.53% |
| Overall gold recovery | % | | - | - | 82% | 82% | 82% | 82% | 82% | 82% | 82% | 82% | 82% | 82% | 82% | 82% | 82% | 82% | 82% | 82% | 82% | 82% | 82% |
| Overall silver recovery | % | | - | - | 95% | 95% | 95% | 95% | 95% | 95% | 95% | 95% | 95% | 95% | 95% | 95% | 95% | 95% | 95% | 95% | 95% | 95% | 95% |
| Overall lead recovery | % | | - | - | 93% | 93% | 93% | 93% | 93% | 93% | 93% | 93% | 93% | 93% | 93% | 93% | 93% | 93% | 93% | 93% | 93% | 93% | 93% |
| Overall zinc recovery | % | | - | - | 90% | 90% | 90% | 90% | 90% | 90% | 90% | 90% | 90% | 90% | 90% | 90% | 90% | 90% | 90% | 90% | 90% | 90% | 90% |
| Gold metal | k oz | 747 | - | - | 39 | 40 | 46 | 43 | 44 | 51 | 50 | 44 | 42 | 41 | 40 | 41 | 37 | 39 | 43 | 39 | 31 | 19 | 18 |
| Silver metal | M oz | 183 | - | - | 16 | 20 | 18 | 19 | 14 | 12 | 11 | 8 | 8 | 7 | 8 | 6 | 6 | 7 | 8 | 5 | 4 | 3 | 4 |
| Lead metal | M lb | 812 | - | - | 11 | 22 | 32 | 31 | 40 | 47 | 46 | 53 | 56 | 57 | 49 | 63 | 58 | 60 | 57 | 50 | 37 | 26 | 16 |
| Zinc metal | M lb | 1,327 | - | - | 20 | 41 | 57 | 60 | 70 | 78 | 81 | 88 | 91 | 90 | 78 | 96 | 94 | 96 | 93 | 75 | 57 | 39 | 24 |
| Total gross revenue | $M | $6,304 | - | - | 374.56 | 472.66 | 462.27 | 473.93 | 413.66 | 397.41 | 383.70 | 334.68 | 332.13 | 320.90 | 312.89 | 312.12 | 303.32 | 326.98 | 337.14 | 267.82 | 211.35 | 132.94 | 133.98 |
| Total net revenue | $M | $5,349 | - | - | 354.09 | 434.38 | 415.53 | 426.11 | 361.04 | 340.60 | 326.73 | 274.26 | 269.89 | 258.96 | 258.26 | 246.13 | 239.97 | 261.56 | 273.32 | 215.26 | 171.50 | 105.94 | 115.37 |
| Operating costs | | | | | | | | | | | | | | | | | | | | | | | |
| Underground mining | $M | $808 | | | 26.39 | 48.77 | 51.43 | 52.78 | 51.88 | 54.99 | 53.05 | 53.71 | 55.34 | 57.05 | 48.19 | 45.83 | 42.52 | 42.50 | 41.09 | 30.44 | 24.93 | 15.41 | 11.94 |
| Processing | $M | $471 | | | 18.24 | 25.98 | 27.63 | 27.63 | 27.63 | 27.63 | 27.63 | 27.63 | 27.63 | 27.63 | 27.63 | 27.58 | 27.63 | 27.63 | 27.63 | 22.34 | 18.50 | 14.25 | 12.62 |
| General and administration | $M | $77 | | | 3.81 | 4.08 | 4.08 | 4.08 | 4.08 | 4.08 | 4.08 | 4.08 | 4.08 | 4.08 | 4.08 | 4.08 | 4.08 | 4.08 | 4.08 | 4.08 | 4.08 | 4.08 | 4.08 |
| Total operating cost | $M | $1,357 | | | 48.44 | 78.83 | 83.15 | 84.50 | 83.59 | 86.70 | 84.76 | 85.43 | 87.06 | 88.76 | 79.91 | 77.49 | 74.23 | 74.22 | 72.80 | 56.86 | 47.51 | 33.75 | 28.65 |
| Capital costs | | | | | | | | | | | | | | | | | | | | | | | |
| Project capital | $M | $360 | 123.96 | 155.89 | 80.48 | - | - | - | - | - | - | - | - | - | - | - | - | - | - | - | - | - | - |
| Sustaining capital | $M | $480 | - | - | 44.06 | 87.77 | 42.37 | 42.17 | 44.48 | 35.42 | 24.61 | 34.27 | 21.11 | 26.77 | 30.09 | 9.64 | 9.19 | 6.30 | 5.75 | 3.93 | 6.52 | 2.78 | 2.60 |
| Total capital cost | $M | $840 | 123.96 | 155.89 | 124.54 | 87.77 | 42.37 | 42.17 | 44.48 | 35.42 | 24.61 | 34.27 | 21.11 | 26.77 | 30.09 | 9.64 | 9.19 | 6.30 | 5.75 | 3.93 | 6.52 | 2.78 | 2.60 |
| Undiscounted cash flows (pre-tax) | $M | $3,152 | (123.96) | (155.89) | 181.11 | 267.78 | 290.02 | 299.44 | 232.97 | 218.47 | 217.36 | 154.56 | 161.72 | 143.43 | 148.26 | 159.00 | 156.54 | 181.05 | 194.78 | 154.46 | 117.46 | 69.41 | 84.13 |
| Undiscounted cash flows (post tax) | $M | $1,995 | (123.96) | (155.89) | 121.82 | 155.09 | 186.89 | 194.29 | 152.05 | 147.02 | 150.91 | 108.10 | 114.46 | 97.21 | 96.40 | 108.34 | 105.92 | 121.66 | 129.52 | 103.27 | 77.95 | 47.39 | 56.34 |
| Discount rate | % real | 5% | 5% | 5% | 5% | 5% | 5% | 5% | 5% | 5% | 5% | 5% | 5% | 5% | 5% | 5% | 5% | 5% | 5% | 5% | 5% | 5% | 5% |
| Discounted cash flows (pre-tax) | $M | $1,860 | (118.06) | (141.40) | 156.45 | 220.30 | 227.24 | 223.44 | 165.57 | 147.87 | 140.11 | 94.89 | 94.55 | 79.87 | 78.63 | 80.31 | 75.30 | 82.94 | 84.98 | 64.18 | 46.48 | 26.16 | 30.20 |
| Discounted cash flows (post-tax) | $M | $1,138 | (118.06) | (141.40) | 105.24 | 127.60 | 146.44 | 144.98 | 108.06 | 99.51 | 97.28 | 66.36 | 66.92 | 54.13 | 51.13 | 54.72 | 50.95 | 55.73 | 56.51 | 42.91 | 30.85 | 17.86 | 20.22 |
| MAG Silver Juanicipio NI 43-101 Technical Report | |
| MAG Silver Corp. | 717002 |
| Item | Unit | Total | 2018 | 2019 | 2020 | 2021 | 2022 | 2023 | 2024 | 2025 | 2026 | 2027 | 2028 | 2029 | 2030 | 2031 | 2032 | 2033 | 2034 | 2035 | 2036 | 2037 | 2038 |
| Cumulative pre-tax NPV @ 5% | $M | $1,860 | (118.06) | (259.46) | (103.01) | 117.29 | 344.53 | 567.98 | 733.54 | 881.41 | 1,021.52 | 1,116.41 | 1,210.96 | 1,290.83 | 1,369.45 | 1,449.76 | 1,525.06 | 1,608.00 | 1,692.98 | 1,757.16 | 1,803.65 | 1,829.81 | 1,860.01 |
| Cumulative post-tax NPV @ 5% | $M | $1,138 | (118.06) | (259.46) | (154.22) | (26.62) | 119.81 | 264.79 | 372.85 | 472.37 | 569.64 | 636.01 | 702.93 | 757.06 | 808.18 | 862.90 | 913.85 | 969.58 | 1,026.09 | 1,069.00 | 1,099.85 | 1,117.71 | 1,137.93 |
| MAG Silver Juanicipio NI 43-101 Technical Report | |
| MAG Silver Corp. | 717002 |
| 22.6 | Economic sensitivity analysis |
AMC has carried out a sensitivity analysis of the projection for Juanicipio project economics. The sensitivity analysis examined the impact on post-tax NPV (at 5% discount rate) of a 30% positive or negative change in metal prices, operating costs, capital costs, corporate tax rate, foreign exchange rate (MXN Peso:$) and the discount rate. The results of the sensitivity analysis are summarized in Table 22.8 and Figure 22.1.
The results show that the post-tax NPV is very positive and remains so for the range of sensitivities evaluated.
Post-tax NPV is most sensitive to changes in the silver grade and price, and to a fall in the foreign exchange rate. The NPV is moderately sensitive to corporate tax, discount rates, capital costs, a rise in the foreign exchange rate and the price of zinc. Changes in the price of lead and gold, gold grade, and mine operating costs and processing operating costs, have the least impact on NPV.
| Table 22.8 | Economic sensitivity analysis (post-tax) |
| Item | Value | Unit | Post-tax NPV ($M) | Post-tax IRR % |
| Base case (NPV @ 5%) | | | 1,138 | 44.5 |
| Silver price - fall of 30% | 12.53 | $/oz | 724.3 | 30 |
| Silver price - increase of 30% | 23.27 | $/oz | 1,551.6 | 59 |
| Gold price - fall of 30% | 875.00 | $/oz | 1,030.3 | 42 |
| Gold price - increase of 30% | 1625.00 | $/oz | 1,245.6 | 47 |
| Zinc price - fall of 30% | 0.70 | $/lb | 992.5 | 42 |
| Zinc price - increase of 30% | 1.30 | $/lb | 1,283.3 | 47 |
| Lead price - fall of 30% | 0.67 | $/ton | 1,054.5 | 43 |
| Lead price - increase of 30% | 1.24 | $/ton | 1,221.4 | 46 |
| Silver grade - fall of 30% | 197.35 | g/t | 734.7 | 30 |
| Silver grade - increase of 30% | 366.49 | g/t | 1,541.2 | 58 |
| Gold grade - fall of 30% | 0.958 | g/t | 1,026.7 | 42 |
| Gold grade - increase of 30% | 1.780 | g/t | 1,249.3 | 47 |
| Mine operating cost - fall 30% | 24.47 | $/t | 1,235.1 | 47 |
| Mine operating cost - increase of 30% | 45.44 | $/t | 1,040.8 | 42 |
| Process operating cost - fall of 30% | 14.26 | $/t | 1,192 | 46 |
| Process operating cost - increase of 30% | 26.48 | $/t | 1,083.9 | 43 |
| Total capital cost - fall of 30% | 588 | $M | 1,284.1 | 65 |
| Total capital cost - increase of 30% | 1,092 | $M | 991.8 | 32 |
| Exchange rate - fall of 30% | 12.92 | US : MXN Peso | 929.3 | 37 |
| Exchange rate - increase of 30% | 24.00 | US : MXN Peso | 1,346.5 | 53 |
| Discount rate - fall of 30% | 3.5 | % | 1,337.8 | 44.5 |
| Discount rate - increase of 30% | 6.5 | % | 972.6 | 44.5 |
| Corporate tax rate - fall of 30% | 21.00 | % | 1,293.9 | 49 |
| Corporate tax rate - increase of 30% | 39.00 | % | 982 | 40 |
| MAG Silver Juanicipio NI 43-101 Technical Report | |
| MAG Silver Corp. | 717002 |
| Figure 22.1 | Sensitivity analysis – post-tax NPV at 5% discount rate |
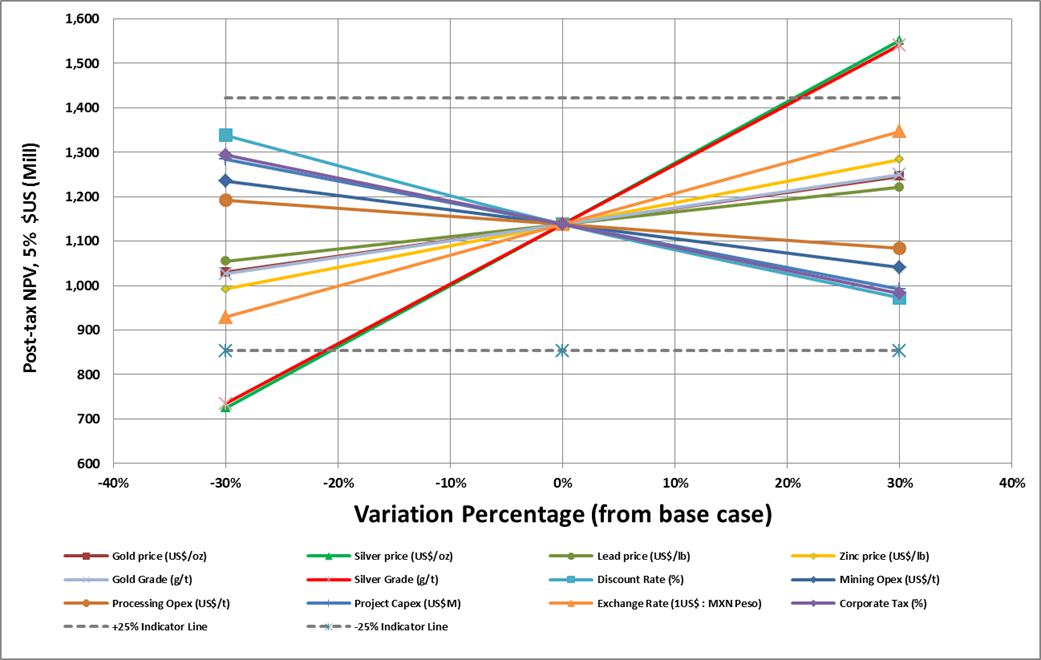
| MAG Silver Juanicipio NI 43-101 Technical Report | |
| MAG Silver Corp. | 717002 |
Fresnillo holds the mining concessions surrounding the Property. For many years, Fresnillo focused exploration activity on tracing the San Carlos vein to the west from the known Fresnillo mining centre and on exploration for parallel veins, both to the north and south of San Carlos (Figure 23.1). It has been successful in following the San Carlos vein for over six kilometres and in discovering several parallel veins lying between the San Carlos and Saucito veins to the south. This includes the Jarillas vein, which was traced eastward from the Valdecañas vein and now appears to be the eastern extension of the Valdecañas vein. Fresnillo initially referred to the veins to the south of San Carlos, including the Juanicipio Joint Venture area as its Fresnillo II development project (Fresnillo, 2009), but since mid-2009, has referred to their 100% owned properties as the Saucito project, separate from the Juanicipio Joint Venture.
The Saucito project lies west of the Fresnillo Mine and east of the Property (Figure 23.1). The project is made up of three main vein structures: El Saucito, Jarillas, and Santa Natalia. Smaller veins include Madroño and Mesquite. Fresnillo (Fresnillo, 2016) reports Proven plus Probable Reserves for Saucito to be 15.63 Mt grading 245 g/t Ag, 1.72 g/t Au, 1.37% Pb, and 2.50% Zn. Measured plus Indicated Resources for Saucito are reported to be 16.31 Mt grading 297 g/t Ag, 2.12 g/t Au, 1.56% Pb, and 2.86% Zn. Inferred Resources are reported to be 32.75 Mt grading 253 g/t Ag, 0.91 g/t Au, 1.21% Pb, and 2.26% Zn. The Saucito operation consists of an underground mine and two flotation plants with a combined production rate of 7,800 tpd or 2,600,000 tpa. Fresnillo is currently building a circuit to produce pyrite concentrates, which will be processed to increase recovery rates of gold and silver.
The Qualified Person has not independently verified the information above. The information above may not necessarily be indicative of the mineralization on the Property that is the subject of this Technical Report.
| MAG Silver Juanicipio NI 43-101 Technical Report | |
| MAG Silver Corp. | 717002 |
| Figure 23.1 | Adjacent properties |
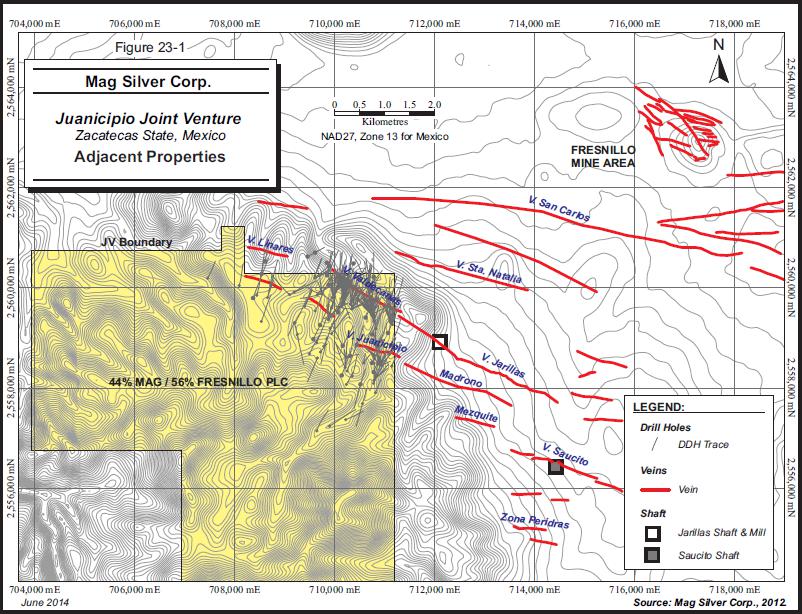
| MAG Silver Juanicipio NI 43-101 Technical Report | |
| MAG Silver Corp. | 717002 |
24 Other relevant data and information
There is no additional information or explanation to add at this time to make the Technical Report more understandable and not misleading.
| MAG Silver Juanicipio NI 43-101 Technical Report | |
| MAG Silver Corp. | 717002 |
| 25 | Interpretation and conclusions |
| 25.1 | Mineral Resource estimate |
AMC makes the following observations and conclusions:
Since the previous 2014 RPA Mineral Resource estimate:
| · | Indicated tonnes have increased by 27%, while Inferred tonnes have increased by 138%. |
| · | Both average Indicated and Inferred Resource grades have decreased for silver and increased for base metals. |
| · | Average gold grades have increased in the Indicated category and decreased in Inferred category. |
| · | The net result in the Indicated category has been an increase in contained silver of 6% and an increase in contained gold of 59%. The increases in contained lead and zinc are 43% and 34% respectively. |
| · | The net result in the Inferred category has been an increase in contained silver of 48% and an increase in contained gold of 76%. Contained lead and zinc show increases of 226% and 295% respectively. |
| · | Although not a significant part of the total Mineral Resource, copper is quoted for the first time as a result of high copper values being intercepted at depth in the new drilling. |
Reasons for the differences in grade, tonnes and contained metal include Mineral Resource addition down-dip and conversion to higher categories arising from the new drilling. The most significant change from the previous estimate is the increase in extent of the Deep Zone mineralization as a result of the new drilling. This is reflected in the increase in tonnes seen in the 2017 AMC estimate. Also, the decrease in average precious metal grades and increase in average base metal grades reflects the new drilling targeting the deeper base metal rich zones.
| · | The mine will be accessed by twin declines and a conveyor decline. |
| · | Mechanized longhole stoping with waste backfill has been selected as the mining method. This offers good productivity while maintaining selectivity. |
| · | Trade-off studies have identified that conveying the mineralized rock directly to the relocated process plant from underground is economically and operationally advantageous compared to other arrangements. |
| · | Evaluation of the planned production rate and scheduling indicates that the deposit supports 1.4 Mtpa (4,000 tpd). |
| · | All waste will be tipped directly into stopes or trucked to surface. There will be a deficit in the amount of waste required for backfilling in Year 11. It is assumed that waste will be mined from a small surface pit and dropped down a waste pass for distribution to the stopes. |
| · | A 780 m long winze will be developed to handle the mineralized material at depth. The winze will commence hoisting in Year 8. |
| · | A 1.5 km access road to the mill from the closest main highway and, from the mill, a 6.5 km access road, mostly over hilly terrain, will be required from the main decline portal site to the plant and tailing storage facility. A two-lane sealed road suitable for use by heavy vehicles is proposed. |
| · | Power would be supplied to a main substation at the plant site via a 115 kV overhead power line from an existing power line located to the north of the Property. The line would have a length of approximately 2 km to the main processing plant sub-station. |
| · | It is anticipated that during pre-production, water will be provided via a pipeline from a neighbouring mine that has excess water from ground water inflow. This water will be supplemented by any water from dewatering the underground workings at Juanicipio. |
| · | It is envisaged that all mill tailings will be discharged to a tailings storage facility (TSF) with a total volume of approximately 18 Mm3. |
| · | No detailed environmental or geotechnical studies have been carried out on suitable sites for the TSF. |
| · | Extensive ground water is anticipated at Juanicipio. Currently there has not been a detailed hydrogeological study for the mine; this is considered a potential risk. |
| MAG Silver Juanicipio NI 43-101 Technical Report | |
| MAG Silver Corp. | 717002 |
| · | A third metallurgical test program was undertaken during 2013, building on the two previous programs. Locked cycle flotation tests confirmed that the flotation circuit will be viable and recoveries of silver (80.1%), lead (92.8%), and copper (38.4%) to the lead concentrate were achieved. Similarly, recoveries to zinc concentrate were 4.9% for gold, 6.8% for silver, 43.9% for copper and 89.8% for zinc. Gold recoveries of 22.1% to pyrite concentrate were also achieved, along with 9.9% for silver and 58.1% for iron. Losses to final tails were reasonable with metal grades observed in the final tails stream of 0.2 g/t gold, 24 g/t silver, 0.11% lead, 0.01% copper, and 0.11% zinc. Cyanidation of the pyrite concentrate has demonstrated good gold and silver recoveries of 52% and 80% respectively. |
| · | The proposed process plant will be designed to treat a nominal 4,000 tpd of feed and consists of a comminution circuit with underground primary crushing and secondary crushing and milling on surface, followed by sequential flotation to produce a silver-rich lead concentrate, followed by a zinc concentrate and a gold-containing pyrite concentrate. The flowsheet is conventional for lead-zinc operations, with the pyrite flotation circuit providing a variation to the most commonly used circuits. Test work supports the selection and design of the flotation circuits. |
| · | The location of the processing plant has changed from previous studies to a large flat area suitable for construction and of sufficient size to accommodate the processing plant and tailings facility. |
| · | No consideration of the copper mineralization is taken into account when determining the project economics. |
The preliminary economic assessment clearly indicates that the Juanicipio Project has strong potential to be developed into an economically viable, high-grade underground silver project. Further drilling and investigation work aimed at upgrading Inferred Mineral Resources and increasing the geotechnical and hydrogeological understanding of the deposit is recommended to consolidate the design basis for the project.
There is a degree of uncertainty attributable to the estimation of Mineral Resources. Until resources are actually mined and processed, the quantity of mineralization and grades must be considered as estimates only. Any material change in quantity of resources, mineralization, or grade may affect the economic viability of the project.
| 25.4.2 | Opportunities for further consideration currently excluded from project scope |
Potential opportunities for the project include:
| · | Significant exploration potential within a large land package and a number of high priority drill targets. |
| · | The Valdecañas vein system, including the new Anticipada Vein, is largely open at depth. |
| · | Deep zone is open to the east and west boundaries of the joint venture property. |
| · | Juanicipio vein open to the west and to depth for further exploration. |
| · | This 2017 PEA only considers the identified Mineral Resources within the Valdecañas vein system, the Juanicipio vein is not considered at this time. |
| · | Further analysis to determine the metal grade of the diluting material from the Hangingwall and Footwall over blast. |
| · | A characterization study of the planned dilution and dilution grade. |
| · | Lease versus purchase analysis of equipment, considering equipment availability and tax benefits of leasing. |
| · | Assess the ability to increase the recoverability and payability of Ag and Au with a gravity circuit. |
| · | Potential recoverability of copper to be considered and assessed. |
| · | An opportunity exists to commence negotiations with potential smelters to possibly capitalize on lower lead and zinc treatment charges, and possibilities to reduce transportcosts ofconcentrate. |
| MAG Silver Juanicipio NI 43-101 Technical Report | |
| MAG Silver Corp. | 717002 |
AMC recommends the following additional work:
| · | In-fill drilling to convert Inferred Mineral Resources to Indicated Mineral Resources in the Valdecañas vein system. |
| · | Step-out drilling to expand the Deep Zone in the Valdecañas vein system and to delineate the western extent and depth of the Juanicipio vein. |
| · | Undertake surface exploration and drilling programs on targets outside of the existing Mineral Resource area, as only 5% to 10% of the overall property has been drill tested and numerous targets for drill-based exploration have been identified. |
| · | Continue with relevant mapping, sampling and geophysical surveys to assist in identification of new drill targets. |
| · | Undertake a hydrogeological study to reduce risks associated with ground water and better define the dewatering strategy. |
| · | Undertake a geotechnical data collection program to include an appropriate number of laboratory-conducted rock strength tests on all lithological units that are expected to be intersected by underground mining. |
| · | Geotechnically log the centreline of the planned winze and conduct a geophysical survey of the proposed shaft centreline using an optical and acoustic televiewer. |
| · | Create a more detailed cost estimate and life of mine production plan for the next phase of the project. Assess potential to optimize lateral and vertical development quantities. The depth of the winze may need to be re-evaluated if the Mineral Resource extends further at depth. |
| · | Optimization of the lead flotation circuit should be investigated to improve the lead grade of the concentrate without compromising recoveries. It has been shown that up to 37% of the gold and 28% of the silver in feed could be recovered to a gravity concentrate, which could improve project economics and potentially eliminate the requirement for a pyrite flotation circuit. More test work will be required to demonstrate the viability of including a gravity circuit in the final process design. An overall cost benefit study of the pyrite flotation circuit should be undertaken. |
| · | The potential impact of variability within the ore body has not been demonstrated and more variability work may be required to ensure that projected grades and recoveries can be reasonably assumed to be consistently achievable over the life of the operation. |
| · | Detailed mass and water balances should be generated to confirm metal deportment throughout the processing circuit, process water requirements and, as necessary, water discharge requirements. Similarly, energy requirements for processing operations should be further evaluated. |
| · | Discussions with potential customers are recommended to better define likely concentrate payment terms. The discussions should be directed towards establishing provisional concentrate off-take agreements. |
| | |
| · | Undertake further work to identify and establish firm contracts for water supply either with a neighbouring mine or from an alternative source. Further understanding of the likely quantity of ground water will be gained from a hydrogeological study; this together with catchment dams could be an alternative solution. |
It is recommended that further work be carried out as part of a structured program that includes completion of a more detailed project feasibility study (FS). The estimated cost of this program is outlined in Table 26.1.
| Table 26.1 | Cost breakdown of recommended further work for the FS |
| Recommended work program | ($M) |
| Geological investigations including infill, step-out, and exploration drilling | 10.1 |
| Geotechnical and hydrogeology program | 1.5 |
| Mine design optimization studies | 0.6 |
| Metallurgical and mill design studies | 1.1 |
| Infrastructure studies | 1.0 |
| Permitting and environmental work | 0.9 |
| Total | 15.2 |
| MAG Silver Juanicipio NI 43-101 Technical Report | |
| MAG Silver Corp. | 717002 |
Albinson, 1988: Geologic Reconstruction of Paleosurfaces in the Sombrerete, Colorada and Fresnillo Districts, Zacatecas State Mexico. Economic Geology, v. 83, no. 8, pp. 1647-1667.
Buchanan, L.J., 1981. Precious Metals Deposits, Associated with Volcanic Environments in the Southwest: in Dickinson, W.R., and Payne, W.D., eds., Arizona Geological Society Digest Vol. 14., pp. 237-262.
Chartier, D., Cole, G., and Couture, J-F., 2008: Mineral Resource Estimation, Valdecañas Silver-Gold Project, Zacatecas State, Mexico. Technical report prepared for MAG Silver Corp. by SRK Consulting.
Fresnillo Plc. 2016. Fresnillo plc Annual Report 2016 “Dedicated to meeting our commitments” 256 pages.
The June 2009 Final Report (Proyecto Juanicipio, 2009) describes additional tests from a more representative suite of samples from the G, H+I+J, K+L+M+N+O, and Q+R+S+T+U sections of the Valdecañas Vein.
Lang, B., Steinitz, G., Sawkins, F.J., and Simmons, S.F., 1988, K-Ar age studies in the Fresnillo silver district, Zacatecas: Economic Geology, v. 83, pp. 1642-1646.
The May 2008 Interim Report (Proyecto Juanicipio, 2008) describes the initial tests on samples from the G, I+K, and M sections of the Valdecañas Vein.
Megaw, P.K.M, 2010: Discovery of the Silver-Rich Juanicipio-Valdecañas Vein Zone, Western Fresnillo District, Zacatecas, Mexico. Society of Economic Geologists, Inc. Special Publication 15, pp. 119-132.
Megaw, P.K.M., and Ramirez, R.L., 2001: Report on Phase 1 data compilation and geological, geochemical and geophysical study of the Juanicipio Claim, Fresnillo District, Zacatecas, Mexico. Report prepared for Minera Sunshine de Mexico S.A. de C.V.
October 2013 - Project Juanicipio 0023-OT10-015-13 Recovery of gold, silver, lead and zinc.
Robertson, J., Siepka, A., & Wells, P. 20 August 2009. Valdecañas Project – Scoping Study. NI 43-101 Technical Report. Report prepared for Minera Juanicipio S.A. de C.V. by Wardrop Engineering. Available on SEDAR.
Ross, D., Cox, J. Krutzelmann, H., 2014. Technical Report on the Mineral Resource Update for the Juanicipio Joint Venture, Zacatecas State, Mexico. Prepared by RPA for MAG Silver Corp. Effective date 30 June 2014. Available on SEDAR.
RPA, 2014. Technical Report on the Mineral Resource Update for the Juanicipio Joint Venture, Zacatecas State, Mexico. Prepared by RPA for MAG Silver Corp. Effective date 30 June 2014.
Ruvalcaba-Ruiz, D.C., and Thompson, T.B., 1988: Ore deposits at the Fresnillo Mine, Zacatecas, Mexico. Economic Geology, v. 83, no.8, pp. 1583-1596.
Simmons, S.F., 1991: Hydrologic implications of alteration and fluid inclusion studies in the Fresnillo District, Mexico; evidence for a brine reservoir and a descending water table during the formation of hydrothermal Ag-Pb-Zn ore bodies. Economic Geology, v. 86, no. 8, pp. 1579-1601.
Starling, T.S., 2004, Structural review of the Juanicipio Project Area, Zacatecas, Mexico: Vancouver, Canada, Telluris Consulting Proprietary report 07-04 to MAG Silver, pp. 20.
Tarnokai, C., 2004, Short Wave Infrared Spectral study of core and surface alteration at the Juanicipio Project Area, Fresnillo District, Zacatecas, Mexico: Vancouver, Canada, Proprietary report to MAG Silver, 17 May 2004, pp. 10.
| MAG Silver Juanicipio NI 43-101 Technical Report | |
| MAG Silver Corp. | 717002 |
Thalenhorst, H. November 2011. “Minera Resource Estimate, Minera Juanicipio, S.A. de C.V., Zacatecas, Mexico”. Available Strathcona Mineral Services Limited, 20 Toronto Street, Toronto, Canada.
Thomas, M., Thalenhorst, H., Riles, A. 1 July 2012. “Minera Juanicipio Property Zacatecas State, Mexico” Technical Report for Minera Juanicipio S.A. de C.V. Report by AMC Mining Consultants (Canada) Ltd. Available on SEDAR.
Velador, J.M., Heizler, M.T., and Campbell, A.R., 2010: Timing of magmatic activity and evidence of a long-lived hydrothermal system in the Fresnillo Silver District, Mexico: Economic Geology, v. 105, pp. 1335-1349.
Wendt, C.J., 2002: The Geology and Exploration Potential of the Juanicipio Property, Fresnillo District, Zacatecas, Mexico. Technical report prepared for Mega Capital Investments.
Wetherup, S., 2006: Independent Technical Report, Juanicipio Silver Project, Zacatecas State, Mexico. Report prepared for MAG Silver Corp. by Caracle Creek International Consulting Inc.
| MAG Silver Juanicipio NI 43-101 Technical Report | |
| MAG Silver Corp. | 717002 |
| MAG Silver Juanicipio NI 43-101 Technical Report | |
| MAG Silver Corp. | 717002 |
CERTIFICATE OF AUTHOR
I, Adrienne Ross, Ph.D., P.Geo., P.Geol., of Vancouver, British Columbia, do hereby certify that:
| 1. | I am currently employed as the Geology Manager and a Principal Geologist with AMC Mining Consultants (Canada) Ltd., with an office at Suite 202, 200 Granville Street, Vancouver British Columbia, V6C 1S4; |
| | |
| 2. | This certificate applies to the technical report titled “Juanicipio NI 43-101 Technical Report” in Zacatecas State, Mexico with an effective date of 21 October 2017, (the “Technical Report”) prepared for MAG Silver Corp. (“the Issuer”); |
| | |
| 3. | I am a graduate of the University of Alberta in Edmonton, Canada (Bachelors of Science (Hons) in Geology in 1991). I am a graduate of the University of Western Australia in Perth, Australia (Ph.D. in Geology). I am a registered member in good standing of the Association of Professional Engineers and Geoscientists of British Columbia (License #37418) and Alberta (Reg. #52751). I have practiced my profession for a total of 23 years since my graduation and have relevant experience in precious and base metal deposits; |
| | |
| | I have read the definition of "qualified person" set out in National Instrument 43-101 (NI 43-101) and certify that by reason of my education, affiliation with a professional association (as defined in NI 43-101) and past relevant work experience, I fulfill the requirements to be a "qualified person" for the purposes of NI 43-101; |
| | |
| 4. | I have not visited the Property; |
| | |
| 5. | I am responsible for Sections 3-12, 14, 23 and parts of 1, 25, 26, and 27 of the Technical Report; |
| | |
| 6. | I am independent of the Issuer and related companies applying all of the tests in Section 1.5 of the NI 43-101; |
| | |
| 7. | I have not had prior involvement with the property that is the subject of the Technical Report; |
| | |
| 8. | I have read NI 43-101, and the Technical Report has been prepared in compliance with NI 43-101 and Form 43-101F1; |
| | |
| 9. | As of the effective date of the Technical Report and the date of this certificate, to the best of my knowledge, information and belief, this Technical Report contains all scientific and technical information that is required to be disclosed to make the Technical Report not misleading. |
| | | |
Effective Date: 21 October 2017
Signing Date: 24 November 2017
(original signed by) Adrienne Ross, Ph.D., P.Geo., P.Geol.

Adrienne Ross, Ph.D., P.Geo., P.Geol.
Geology Manager and Principal Geologist
AMC Mining Consultants (Canada) Ltd.
| MAG Silver Juanicipio NI 43-101 Technical Report | |
| MAG Silver Corp. | 717002 |
CERTIFICATE OF AUTHOR
I, Gary Methven, P.Eng., of Vancouver, British Columbia, do hereby certify that:
| 1. | I am currently employed as the Underground Manager and Principal Mining Engineer with AMC Mining Consultants (Canada) Ltd. with an office located at Suite 202, 200 Granville Street, Vancouver, British Columbia, V6C 1S4; |
| | |
| 2. | This certificate applies to the technical report titled “Juanicipio NI 43-101 Technical Report” in Zacatecas State, Mexico with an effective date of 21 October 2017, (the “Technical Report”) prepared for MAG Silver Corp. (“the Issuer”); |
| | |
| 3. | I graduated from the University of Witwatersrand in Johannesburg, South Africa with a Bachelor of Science degree in Mining Engineering in 1993. I am a member in good standing of the Association of Professional Engineers and Geoscientists of British Columbia (License #180019), a member of Registered Professional Engineers of Queensland (License #06839), and a member of the Australian Institute of Mining and Metallurgy (CP). I have relevant experience precious and base metal deposits, mine infrastructure, design and planning, mine production and financial evaluation, reserve estimation, technical reviews and technical studies. |
| | |
| | I have read the definition of "qualified person" set out in National Instrument 43-101 (NI 43-101) and certify that by reason of my education, affiliation with a professional association (as defined in NI 43-101) and past relevant work experience, I fulfil the requirements to be a "qualified person" for the purposes of NI 43-101; |
| | |
| 4. | I have visited the Property from March 14 to 19, 2016 for 5 days; |
| | |
| 5. | I am responsible for Sections 2, 15, 16, 20, 24 and parts of 1, 25, and 26 of the Technical Report; |
| | |
| 6. | I am independent of the Issuer and related companies applying all of the tests in Section 1.5 of the NI 43-101; |
| | |
| 7. | I have had prior involvement with the property that is the subject of the Technical Report; in the form of previous technical and trade-off studies in 2016 and 2015. |
| | |
| 8. | I have read NI 43-101, and the Technical Report has been prepared in compliance with NI 43-101 and Form 43-101F1; |
| | |
| 9. | As of the effective date of the Technical Report and the date of this certificate, to the best of my knowledge, information and belief, this Technical Report contains all scientific and technical information that is required to be disclosed to make the Technical Report not misleading. |
| | | |
Effective Date: 21 October 2017
Signing Date: 24 November 2017
(original signed by) Gary Methven, P.Eng.
Gary Methven, P.Eng.
Underground Manager and Principal Mining Engineer
AMC Mining Consultants (Canada) Ltd.
| MAG Silver Juanicipio NI 43-101 Technical Report | |
| MAG Silver Corp. | 717002 |
CERTIFICATE OF AUTHOR
I, Harald Muller, FAusIMM of Brisbane, Queensland, do hereby certify that:
| 1. | I was employed as a Principal Consultant with AMC Consultants Pty Ltd, with an office at Level 21, 179 Turbot Street, Brisbane, Queensland, 4000, Australia; |
| | |
| 2. | This certificate applies to the technical report titled “Juanicipio NI 43-101 Technical Report” in Zacatecas State, Mexico with an effective date of 21 October 2017, (the “Technical Report”) prepared for MAG Silver Corp. (“the Issuer”); |
| | |
| 3. | I am a graduate of the Pretoria University in South Africa (Bachelors of Engineering (Chemical) in 1983). I am a registered Fellow in good standing of the Australasian Institute of Mining and Metallurgy (Membership No. 303667), the Institute of Chemcial Engineers (British) (Membership No. 2052 3858) and the South African Institution of Chemical Engineering (Membership No.001979). I have practiced my profession for a total of 30 years since my graduation and have relevant experience in minerals processing and extractive metallurgy, including process engineering, technical process design and auditing, project evaluation and development, process plant operations management and maintenance planning, plant start-up and commissioning, technical review, and audits. My experience includes gold, platinum group metals, copper, zinc, lead, nickel, antimony, vanadium, uranium, tungsten, graphite, iron ore, rare earth elements, phosphate, potash and barite; |
| | |
| | I have read the definition of "qualified person" set out in National Instrument 43-101 (NI 43-101) and certify that by reason of my education, affiliation with a professional association (as defined in NI 43-101) and past relevant work experience, I fulfill the requirements to be a "qualified person" for the purposes of NI 43-101; |
| | |
| 4. | I have not visited the Property; |
| | |
| 5. | I am responsible for Sections 13, 17, 19, and parts of 1, 25 and 26 of the Technical Report; |
| | |
| 6. | I am independent of the Issuer and related companies applying all of the tests in Section 1.5 of the NI 43-101; |
| | |
| 7. | I have not had prior involvement with the property that is the subject of the Technical Report; list other involvement; |
| | |
| 8. | I have read NI 43-101, and the Technical Report has been prepared in compliance with NI 43-101 and Form 43-101F1; |
| | |
| 9. | As of the effective date of the Technical Report and the date of this certificate, to the best of my knowledge, information and belief, this Technical Report contains all scientific and technical information that is required to be disclosed to make the Technical Report not misleading. |
| | | |
Effective Date: 21 October 2017
Signing Date: 27 November 2017
(original signed by) Harald Muller, FAusIMM
Harald Muller, FAusIMM
Principal Consultant
AMC Consultants Pty Ltd
| MAG Silver Juanicipio NI 43-101 Technical Report | |
| MAG Silver Corp. | 717002 |
CERTIFICATE OF AUTHOR
I, Carl Kottmeier, P.Eng., of Vancouver, British Columbia, do hereby certify that:
| 1. | I am currently employed as a Principal Mining Engineer with AMC Mining Consultants (Canada) Ltd. with an office located at Suite 202, 200 Granville Street, Vancouver, British Columbia, V6C 1S4; |
| | |
| 2. | This certificate applies to the technical report titled “Juanicipio NI 43-101 Technical Report” in Zacatecas State, Mexico with an effective date of 21 October 2017, (the “Technical Report”) prepared for MAG Silver Corp. (“the Issuer”); |
| | |
| 3. | I am a graduate of the University of British Columbia in Vancouver, British Columbia, Canada (Applied Science – Mining and Mineral Process Engineering, 1989). I am a member in good standing of the Association of Professional Engineers and Geoscientists of British Columbia (License #18702), and a member of the Canadian Institute of Mining, Metallurgy and Petroleum. I have practiced my profession continuously since 1989, and have been involved in mine engineering for a total of 28 years since my graduation from university. This has involved working primarily in Canada and in the United States. My experience is principally in coal, base metals, gold and silver. |
| | |
| | I have read the definition of "qualified person" set out in National Instrument 43-101 (NI 43-101) and certify that by reason of my education, affiliation with a professional association (as defined in NI 43-101) and past relevant work experience, I fulfill the requirements to be a "qualified person" for the purposes of NI 43-101. |
| | |
| 4. | I have not visited the Property; |
| | |
| 5. | I am responsible for Sections 18, 21, 22 and parts of 1, 25, and 26 of the Technical Report; |
| | |
| 6. | I am independent of the Issuer and related companies applying all of the tests in Section 1.5 of the NI 43-101; |
| | |
| 7. | I have not had prior involvement with the property that is the subject of the Technical Report. |
| | |
| 8. | I have read NI 43-101, and the Technical Report has been prepared in compliance with NI 43-101 and Form 43-101F1. |
| | |
| 9. | As of the effective date of the Technical Report and the date of this certificate, to the best of my knowledge, information and belief, this Technical Report contains all scientific and technical information that is required to be disclosed to make the Technical Report not misleading. |
| | | |
Effective Date: 21 October 2017
Signing Date: 24 November 2017
(original signed by) Carl Kottmeier, P.Eng.
Carl Kottmeier, P.Eng.
Principal Mining Engineer
AMC Mining Consultants (Canada) Ltd.
| MAG Silver Juanicipio NI 43-101 Technical Report | |
| MAG Silver Corp. | 717002 |
Our offices
| Australia | | |
Adelaide Level 1, 4 Greenhill Road Wayville SA 5034, Australia T +61 8 8201 1800 E adelaide@amcconsultants.com | | Brisbane Level 21, 179 Turbot Street Brisbane Qld 4000 Australia T +61 7 3230 9000 E brisbane@amcconsultants.com |
Melbourne Level 19, 114 William Street Melbourne Vic 3000 Australia T +61 3 8601 3300 E melbourne@amcconsultants.com | | Perth 9 Havelock Street West Perth WA 6005 Australia T +61 8 6330 1100 E perth@amcconsultants.com |
| Canada | | |
Toronto TD Canada Trust Tower 161 Bay Street, 27th Floor Toronto, Ontario, M5J 2S1, Canada T +1 416 640 1212 E toronto@amcconsultants.com | | Vancouver Suite 202, 200 Granville Street Vancouver BC V6C 1S4 Canada T +1 604 669 0044 E vancouver@amcconsultants.com |
| Singapore | | United Kingdom |
Singapore Registered Office 16 Raffles Quay, #33-03 Hong Leong Building Singapore 048581 T +65 8620 9268 E singapore@amcconsultants.com | | Maidenhead Registered in England and Wales Company No. 3688365 Level 7, Nicholsons House Nicholsons Walk, Maidenhead Berkshire SL6 1LD United Kingdom T +44 1628 778 256 E maidenhead@amcconsultants.com Registered Office: Monument House, 1st Floor, 215 Marsh Road, Pinner, Greater London, HA5 5NE, United Kingdom |

amcconsultants.com