Seabridge focused on its KSM Project in 2008 and 2009 but in 2010 resumed work at Courageous Lake, completing 49 diamond core drill holes totalling about 22,000 meters. In February 2011, RMI completed a new resource estimate incorporating the 2010 drilling. In its updated report dated March 15, 2011, RMI calculated a measured resource at a 0.83 gram per tonne cut-off grade of 12.584 million tonnes grading 2.52 grams of gold per tonne (1,020,000 ounces of gold) and an indicated resource of 77.582 million tonnes grading 2.31 (5,762,000 ounces) for a total measured and indicated gold resource of 6,782,000 ounces. In the inferred category, RMI estimates the project contains an additional 63.053 million tonnes of material grading 2.24 grams of gold per tonne (4,541,000 ounces).
The Issuer engaged a group of independent consultants to undertake a Preliminary Economic Assessment for the Courageous Lake Project to update the earlier studies and incorporate the 2011 resource estimate. The details of the 2011 Preliminary Economic Assessment are presented below and the Issuer has now engaged its independent consultants with the goal of preparing the first Preliminary Feasibility Study for the Courageous Lake Project.
The Issuer estimates its annual holding costs of the Courageous Lake Project to be approximately $240,000.
The quality of the information, conclusions and estimates contained in the 2011 Courageous Lake PEA are based on industry standards for engineering and evaluation of a mineral project and is consistent with the intended level of accuracy. The study is preliminary in nature and includes inferred mineral resources that are considered too speculative geologically to have economic considerations applied to them that would enable them to be categorized as mineral reserves, and there is no certainty that this preliminary economic assessment will be realized. The following material (up to the heading “Subsequent Information”) on the Courageous Lake Project summarizes information from the 2011 Courageous Lake PEA.
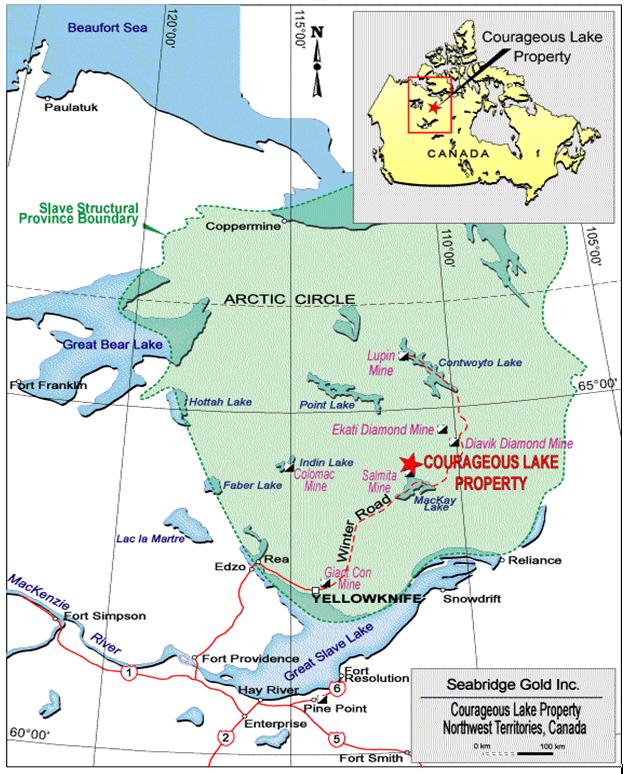
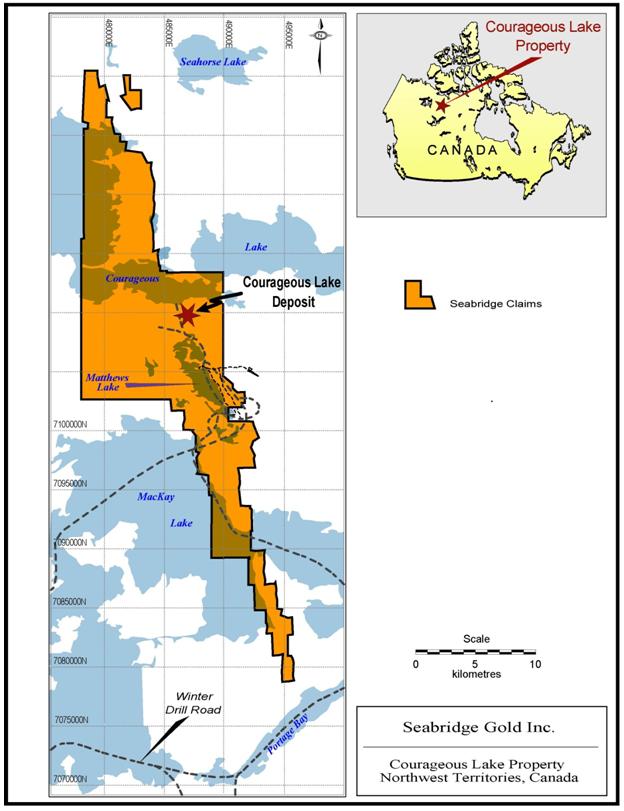
The project is located approximately 240 kilometers northeast of Yellowknife in the Northwest Territories (see Figure 3). The property lies in a historic mining district and includes 2 past producing gold mines. Year round access is available by air, either by helicopter or fixed wing aircraft to the airstrip at the former Salmita mine 6 kilometers to the south or via float-equipped aircraft to several adjacent lakes. During mid-winter, access is available via a winter road which branches from the main Tibbitt to Contwoyto winter road. There are about 10 kilometers of gravel roads located on the property which served as access routes to and from the former shaft used to conduct exploration.
The property is relatively flat, with the maximum change in elevation only about 30 meters. Vegetation is tundra with low scrub brush in places. The altitude of the project is about 450 meters, and the average temperatures range from about -31 to 18 degrees C. Average precipitation is about 160 mm per year.
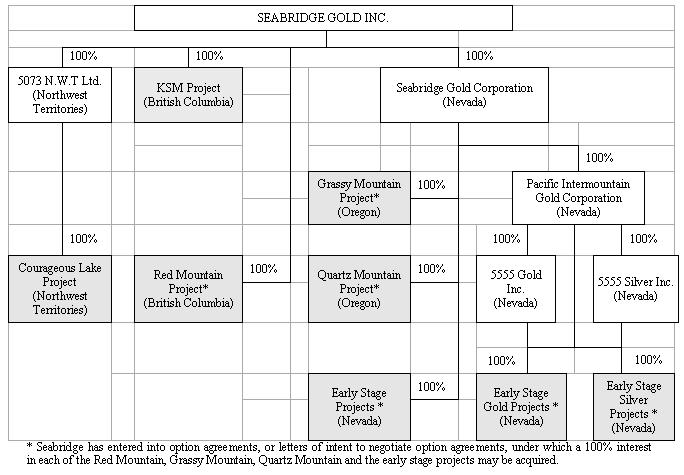
The property is comprised of 59 federal mining leases and 11 federal mining claims having a combined area of 33,051.56 hectares (see Figure 4). The property is currently registered/recorded to a wholly owned subsidiary of Seabridge Gold Inc., 5073 NWT Ltd.
Gold was first discovered in the CourageousLake area in the early 1940’s by Dr. W. Brown, who was working for Territorial Exploration Limited. The Tundra deposit was discovered in 1944 and the Salmita deposit in 1947. The Geological Society of Canada carried out regional geological mapping in the area from 1944 to 1980. The Tundra Gold Mine went into production in 1964 and operated about four years. During the 1990’s, Royal Oak Mines briefly reopened the Tundra Mine. Total reported production from the Tundra Mine was 122,000 ounces of gold. During 1984 to 1989, the nearby Salmita Mine produced 209,000 tonnes averaging 27.2 grams per metric tonne (183,000 ounces).
In 1980, Noranda Exploration Limited carried out a drilling program to evaluate a frost heaved felsic volcanic unit that was discovered by prospectors working for Noranda. This activity resulted in the discovery of two gold deposits, the Tundra Deposit (Main Zone) or FAT Deposit, and the Carbonate Zone. In 1982, Noranda entered into a joint venture agreement enabling Getty Canadian Metals Ltd. to earn a 49% interest in the Courageous Lake property by funding exploration and development with Noranda as the operator. In 1987, Total Energold purchased Getty Canadian Metals Ltd. and thereby acquired its 49% interest in the Tundra Joint Venture.
In 1988, Noranda sank a 475-meter shaft on the Main Tundra Deposit with the objective of testing the continuity and grade of gold mineralization within the previously identified deposit. The results of this program did not meet Noranda’s expectations, and no further work was done on the underground development. Noranda estimated a global gold resource of about 3.6 million ounces and an underground resource of about 737,000 ounces. In 1992, Noranda consolidated its Hemlo Gold unit with Battle Mountain Gold and began operating the Tundra Joint Venture as Battle Mountain Gold.
In 1996, Battle Mountain Gold merged with Newmont Gold Corporation thereby transferring 51% ownership of the Tundra Joint Venture to Newmont. In 1997, Placer Dome Exploration (PDX) optioned this 51% interest from Newmont with the concept of developing a bulk mineable surface deposit. PDX completed 13,345 meters of drilling and other basic exploration work. Based on their work along with the previous data collected by Noranda, PDX estimated a global resource for the Courageous Lake property of 5.9 million ounces of gold.
During 2003, the Issuer designed and executed a work program on the Courageous Lake property with the goal of evaluating and prioritizing potential gold targets. Four targets were developed: South FAT Extension; Olsen Lake Target; Walsh Lake Target; and Salmita Mine Target. These targets were selected as those that represented the highest probability to develop new resources for the project.
In 2004, drill testing of selected priority targets was undertaken by the Issuer. The program was conceived in 2 stages: initial testing for strataform gold concentrations similar to the FAT deposit; and sectional drilling for potential resource additions. The initial program was intended to test 3 target areas: Olsen Lake; Walsh Lake; and the South FAT Extension. Ground conditions precluded a test of the Walsh Lake target, but the other targets were tested. Results from the initial stage of the program led Seabridge to initiate sectional drilling on the South FAT Extension. The South FAT Extension was a projection of the previous resource model into an area where little work had been completed. Surface and initial drilling results indicated that 300 meters of strike could be added to the FAT deposit with the completion of sectional drilling. The second stage of the 2004 program completed the sectional drilling on 50-meter section lines across these 300 meters of strike.
During 2005 and 2006, the Issuer completed an additional 15,400 meters of core drilling at Courageous Lake, designed to identify new gold resources to the west of the main mineralized deposits and to the north.The core collected from these drill holes was systematically logged, sawn, and shipped to ACME Labs in Yellowknife, NWT and Vancouver B.C. for sample preparation and fire assay.
In 2010, Seabridge drilled 49 diamond core holes and 10 shallow core holes (for geotechnical purposes) totalling about 22,400 meters. The core collected from these drillholes was logged, sawn, shipped to ACME Labs in Yellowknife, NWT (sample preparation), and then sent to ACME Labs in Vancouver, BC for analysis.
Geology
Regional Geology
The Courageous-Mackay Lake Belt is characterized by a series of north to northwest trending Archean metavolcanic and metasedimentary rocks that form a portion of the Slave Structural Province. These rocks are within the Yellowknife Supergroup and are locally referred to as the Courageous Lake Greenstone Belt ("CLGB"). The CLGB is approximately 70 kilometers long, with a maximum east-west width of 3-7 kilometers. Regional mapping demonstrates that the rock sequences are not overturned and stratigraphic tops are to the east. The CLGB is bounded to the west by a sodic granite pluton referred to as the Courageous Lake Batholith, and to the east by conformably overlying turbidite metasedimentary rocks. Dynamothermal regional metamorphismwithin the CLGB has created mineral assemblages indicative of mid-greenschist facies metamorphic grade. Lower-amphibolite facies metamorphic grade have been identified at the north and south limits of the CLGB. Four discrete deformational events are recorded in these rocks.
The CLGB has been described as consisting of two mafic to felsic cycles of volcanism. The basal cycle comprises mainly mafic to intermediate flow and pyroclastic rocks, which have been largely assimilated by the Courageous Lake Batholith to the west. The basal cycle of basalt and andesite is capped by a narrowband of rhyolite flow and tuff, which locally reaches a thickness of 60 m.The second cycle contains mafic to felsic flow and pyroclastic rocks. The felsic rocksare much more extensive in cycle 2, attaining a thickness of 1800 m near Matthews Lake, and a lateral extent of 25 to 30 km. They are composed of massive to porphyritic flow, tuff and coarse pyroclastic units. Felsic volcanic rocks of cycle 2 are conformably overlain by the Yellowknife Group sedimentary rocks. The upper part of cycle 2 interfingers with the overlying sedimentary rocks and is host to nearly all known gold occurrences in the belt.
An alternative interpretation of the volcanic stratigraphy is proposed based on work conducted by Seabridge. This interpretation calls for a single evolving volcanic succession rather than two distinct cycles. This modification is based on the observations that the “second cycle” is preserved only in the central part of the greenstone belt, and is intimately associated with dome-like rhyolite intrusions. On the margins of the CLGB, only a single cycle of mafic to felsic eruptive rocks arepresent. Seabridge has developed an alternate interpretation in which the original basin was filled with basaltic and andesitic lavas. As the basin evolved, rhyolitic volcanic rocks began to be deposited with the mafic rocks. There are indications of bimodal volcanism throughout the volcanic succession. In the central part of the basin, the volume of rhyolitic volcanic rocks swamp out the contribution of mafic volcanic rocks, leading to a thick sequence of “cycle 2” volcanic rocks. Only locally in the central part of the basin are mafic rocks preserved once the rhyolitic volcanism began. As the rhyolitic volcanism waned up-section, sedimentation became more common until it completely overtook volcanism, giving way to the turbidite sequence.
Property Geology
The Courageous Lake property consists of a sequence of northerly trending, steeply dipping metasedimentary and metavolcanic rocks, with tops to the east. All of the currently recognized gold occurrences on the property are within or near the top of the felsic cycle of volcanism of the CLGB. The thickest part of this felsic volcanic cycle is located between north shore of Matthews Lake and the south shore of Courageous Lake. The FAT deposit comprises the better part of this sequence. It is made up of at least 13 discrete, steep east-dipping, elongate lenticular zones that vary in thickness from 20 to 125 meters wide. The continuity of these 13 zones has been demonstrated to be at least 1900 meters long (between UTM 7,108,700N and 7,110,600N), 800 meters wide (between UTM 486,000E and 486,800E) and, although open at depth, at least 1200 meters deep.
The mineral domains or zones of the FAT deposit are defined by a discrete suite of hydrothermal alteration assemblages. The lateral continuity and stratigraphic thickness of the hydrothermal system indicates that the FAT deposit is robust in volume and durations. The predominant hydrothermal alteration minerals in the FATdeposit are illite group sheet silicates, referred to as “sericite”. Silicic alteration of varying intensity is ubiquitous throughout the defined mineralized zones and is represented by silica flooding of groundmass material in volcanic rock. Generally the most intense zones of silica alteration are not indicative of higher gold concentrations. Carbonate alteration is also quite ubiquitous and occurs as calcite, ankerite, and siderite.
Sulfide mineralogy in the FAT deposit is relatively simple and consists of pyrite, pyrrhotite, arsenopyrite, sphalerite, and chalcopyrite in decreasing order of abundance. While all of these minerals can be found in the mineralized zones, on lyarsenopyrite has a consistent correlative relationship to gold concentrations. Arsenopyrite occurs in three distinct habits: acicular disseminated crystals, anhedral disseminated clots, and euhedral crystals in fractures. The acicular variety tends to have the clearest association with higher-grade gold mineralization.
Mineral Resources
Over the period of previous exploration at Courageous Lake, several resource estimates have been prepared. The most detailed historic estimates were conducted by Noranda in 1990 at the conclusion of its underground exploration program, by Placer Dome in 1999 at the conclusion of its exploration program and by RMI in July 2002, December 2004 and January 2007.
In January 2011, RMI completed a new resource model incorporating the results from the Issuer’s 2010 exploration program. This estimate was prepared in accordance with NI 43-101 and United States investors should see the “Cautionary Note to United States Investors Regarding Resource Estimates” in the Preliminary Notes to this Annual Information Form. The resource estimate presented resource estimates at various cut-off grades. In September 2005, a Preliminary Assessment was completed for the project which indicated that a 0.83 gram per tonne cut-off grade was appropriate for the deposit. (This was determined at the time using a total processing and administration cost of $12.80 per tonne processed, arecovery rate of 90% and a gold price of US$400 per ounce.) Using its own estimation parameters and a cut-off grade of 0.83 grams of gold per tonne, RMI calculated a measured resource of 12.584 million tonnes grading 2.52 grams of gold per tonne (1,020,000 ounces of gold) and an indicated resource of 77.582 million tonnes grading 2.31grams of gold per tonne (5,762,000 ounces) for a total measured and indicated gold resource of 6,782,000 ounces. In the inferred category, RMI estimated the project contains an additional 63.053 million tonnes of material grading 2.24 grams of gold per tonne (4,541,000 ounces). Mineral resources which are not mineral reserves do not have demonstrated economic viability.
The resource model constructed for the Courageous Lake deposit incorporates data from a total of 560 holes drilled by Seabridge, Noranda and Placer Dome totalling 131,338 meters. RMI determined that exploration data from Seabridge’s 2004-2006 campaigns and data from historical programs were collected and analyzed by reputable drilling and analytical firms and were suitable to be used for estimating mineral resources. RMI was able to verify a significant proportion of Seabridge’s 2010 drill hole assay database by comparing signed ACME assay certificates against the assay records stored in the drill hole database. RMI selected six 2010 drill holes totaling 1,628 assay records for verification, representing approximately 10% of the 2010 drilling, and only discovered two minor rounding errors. Based on previous and current database audits, it is RMI’s opinion that Seabridge’s electronic assay database is accurate and suitable for the estimation of Mineral Resources.
Similar to the 2007 estimate (also completed by RMI), block model gold grades for this latest Courageous Lake model were estimated using a series of nested inverse distance cubed interpolation runs within mineral zone wireframe boundaries. Additional constraints were implemented for the updated model using indicator probabilities and a more selective search strategy. The estimated block grades were classified into Measured, Indicated, and Inferred categories using a combination of distance to drilling data and the number of drillholes used to estimate block grades.The nearest neighbour model grade compares well with the mean grade of the inverse distance model for the key Measured and Indicated resources indicating that the estimate is globally unbiased. Several mineral zones show a slight high bias for Inferred material (i.e. zones 3, 6, and 8).
The following table provides global resource estimates from the new model at various gold cutoff grades:
Comparison of Courageous Lake Resources at Various Cutoff Grades
Cutoff Grade (g/T) | Measured | Indicated | Inferred |
| Tonnes (000) | Grade (g/T) | Ounces (000) | Tonnes (000) | Grade (g/T) | Ounces (000) | Tonnes (000) | Grade (g/t) | Ounces (000) |
| | | | | | | | | |
| 0.70 | 13,605 | 2.39 | 1,045 | 84,547 | 2.19 | 5,953 | 70,214 | 2.09 | 4,718 |
| 0.80 | 12,825 | 2.49 | 1,027 | 79,182 | 2.28 | 5,804 | 64,822 | 2.20 | 4,585 |
| 0.83 | 12,584 | 2.52 | 1,020 | 77,582 | 2.31 | 5,762 | 63,053 | 2.24 | 4,541 |
| 0.90 | 12,017 | 2.60 | 1,005 | 73,996 | 2.38 | 5,662 | 59,521 | 2.32 | 4,440 |
| 1.00 | 11,308 | 2.71 | 985 | 69,156 | 2.48 | 5,514 | 54,525 | 2.45 | 4,295 |
Note: The resource estimate has been prepared in accordance with NI 43-101. See “Cautionary Note to United States Investors Regarding Resource Estimates”in the Preliminary Notes.
The cutoff grade for resource tabulation was set at 0.83 grams per tonne, consistent with cut-off grade used for previous Courageous Lake resource estimates. The cutoff grade used in the 2011 Courageous Lake PEA was 0.67 grams per tonne, based on a gold price of $990.
Proposed Mining Operation
The independent consultants have concluded that an open-pit mining operation, with on-site processing, is the most suitable development scenario. At 17,500 tonnes per day, 365 operating days per year and a 92% plant availability, annual throughput for the mill is estimated at 6.4 million tonnes. With 101.1 million tonnes of in-pit mineralized material above cut-off, Courageous Lake’s mine life is estimated at approximately 16 years. Overall gold recovery is estimated at 89.9% resulting in 6.05 million ounces of gold production over the project’s life averaging 383,000 ounces per year.
Mine Planning
Lerchs-Grossman (“LG”) pit shell optimizations were used to define the mine plans in the 2011 Courageous Lake PEA. Because of the difficulty in predicting relevant metal prices over such a long project life, the ultimate LG pit limits were set at the point where an incremental increase in pit size did not significantly increase the pit resource (an incremental increase in the pit resource resulted in only marginal economic return). Waste to mineralized material cut-offs were determined using a gold price of US$990 per ounce gold. Estimated in-pit diluted resources including mining dilution within the ultimate pit limit based on a Cdn$20.50 per tonne cut-off are as follows:
Courageous Lake In-Pit Diluted Resources
| Resource Category | Tonnes (000’s) | Diluted Grade (g/t) |
| Measured | 12,000 | 2.26 |
| Indicated | 67,300 | 2.07 |
| Inferred | 21,800 | 1.97 |
Seabridge notes that the 2011 Courageous Lake PEA incorporates inferred mineral resources which are considered too geologically speculative to have the economic considerations applied to them that would enable them to be categorized as mineral reserves. Therefore, Seabridge advises that there can be no certainty that the estimates contained in the 2011 Courageous Lake PEA will be realized.
Mining operations, methods, and equipment will be typical of open-pit mining innorthern Canada. The Project will be a large-capacity operation that utilizes large scale equipment for the major operating areas in order to generate high productivities, and reduce unit and overall mining costs. The maximum size of the large mining equipment will be constrained by the maximum loads which can be delivered along the winter road.
The mine rock storage facility (“RSF”) for Courageous Lake is situated east of the pitarea, and is constructed using a combination of bottom-up and top-down methods. Foundation preparation is completed, as required. The RSF construction enables flotation tailings to be placed inside the RSF and to be contained by surrounding mine rock. Allowances are made to address reclamation and post-closure requirements.
Metallurgy, Mineral Process and Plant
SGS-Lakefield Research Ltd. (Lakefield) conducted metallurgical testing programs in 2003-2004, in 2007 and in 2010-2011. Grindability test results indicated that the sample is moderately hard for grinding by ball mills but is very hard for milling by semi-autogenous grinding (“SAG”) mills. The mineralization responded well to flotation concentration. Gold recovery by flotation was high, ranging from 85 to 95%. The pressure oxidation and cyanidation tests by Lakefield indicated a significant improvement in gold extraction when the flotation concentrate underwent a high degree of pressure oxidation. The testing programs by Lakefield showed that over 98% of the sulfide sulfurcan be oxidized with the standard conditions practiced in the pressure oxidization industry. The test work indicated that gold extraction improved substantially with increasing sulfur oxidation. The Lakefield test results showed that the gold extractions from the pressure oxidation (“POX”) residues varied from 94 to 99%.
Based on the testing results it is estimated that the average annual metallurgical performances under the proposed mining plan are as follows:
Metallurgical Performance Projection
| Year | Tonnage (kt) | Feed Grade (Au g/t) | Recovery (Au %) | Annual Gold Production |
| kg | oz |
| 1 | 6,398 | 2.112 | 89.9 | 12,151 | 390,650 |
| 2 | 6,398 | 2.170 | 89.9 | 12,482 | 401,293 |
| 3 | 6,398 | 2.004 | 89.9 | 11,524 | 370,497 |
| 4 | 6,398 | 2.434 | 89.9 | 14,002 | 450,163 |
| 5 | 6,398 | 1.738 | 89.9 | 9,997 | 321,426 |
| 6 | 6,398 | 1.808 | 89.9 | 10,399 | 334,343 |
| 7 | 6,398 | 1.878 | 89.9 | 10,803 | 347,311 |
| 8 | 6,398 | 3.309 | 90.4 | 19,138 | 615,309 |
| 9 | 6,398 | 2.119 | 89.9 | 12,190 | 391,921 |
| 10 | 6,398 | 2.023 | 89.9 | 11,638 | 374,184 |
| 11 | 6,398 | 1.534 | 89.9 | 8,826 | 283,762 |
| 12 | 6,398 | 1.394 | 88.9 | 7,928 | 254,906 |
| 13 | 6,398 | 2.767 | 89.9 | 15,915 | 511,682 |
| 14 | 6,398 | 3.255 | 90.4 | 18,825 | 605,243 |
| 15 | 6,398 | 1.380 | 88.9 | 7,851 | 252,405 |
| 16 | 5,113 | 0.995 | 87.9 | 4,471 | 143,759 |
| Total | 101,083 | 2.071 | 89.9 | 188,140 | 6,048,854 |
The proposed process plant will process 17,500 tonnes per day of mineralization. The plant will be operated 365 days per year at an availability of 92%. The updated process includes HPGR/grinding comminution, conventional flotation, flotation concentrate POX, cyanidation, and gold recovery/refining circuits. The comminution will consist of primary crushing by gyratory crusher, secondary crushing by cone crusher, and tertiary crushing by HPGR followed by ball mill grinding. The conventional flotation will include rougher flotation, scavenger flotation and cleaner flotation on scavenger flotation concentrate. The rougher flotation concentrate together with the scavenger cleaner concentrate will be subjected to POX after being reground and acid pre-leached. A portion of the slurry and acid-bearing solution from the POX circuit will be recycled back to the POX pre-leaching. The slurry and the acid-bearing solution of the POX discharge will be separately neutralized. The POX residues or oxidized concentrate will be leached in a carbon-in-leach (CIL) circuit; the cleaner flotation tailings will be reground and cyanide leached with the POX residue.
Gold recovery will be completed by stripping the loaded carbon from the CIL circuit, followed by electrowinning to produce gold doré as a final product. The flotation tailings and the cyanide residues will be thickened and disposed of separately. The residual cyanide in the leach residue will be destroyed by a sulphur dioxide (SO2)/airoxidation procedure prior to disposal to the lined leach residue storage facility.
Infrastructure
Due to the remote location, the Courageous Lake Project requires its own power generation, a permanent camp, access by air and warehousing and storage at site. Site logistics include freight delivery over winter roads and air services for personnel and smaller freight components. The project’s electrical running load of 31.5 MW can be supplied entirely by diesel generation which can be supplemented with capacity of wind power generation (estimated to average 10.4 MW of power demand over a yearly time period). Control systems are available for handling the variable output of the wind generation units. An airport with a 2,000 m runway, apron and hangar have been incorporated into the 2011 Courageous Lake PEA together with local minesite access roads.
Environmental Considerations
The formal environmental assessment of the Project will commence with preliminary screening of an application to the Mackenzie Valley Land and Water Board (MVLWB) for a Class A Water License, issued in terms of the Mackenzie Valley Resource Management Act (MVRMA 1998, c. 25). After preliminary screening, the Project will be referred to the Mackenzie Valley Environmental Impact Review Board (MVEIRB)— an independent body set up in terms of the MVRMA to conduct environmental assessments of projects in the NWT referred to it by the MVLWB — or any other regulatory agencies involved. The environmental assessment is conducted in a number of phases and documentation is submitted to Aboriginal Affairs and NorthernDevelopment Canada (AANDC) for decision making.
On-site baseline environmental work was initiated by EBA in 2004 and restarted by Rescan in the spring of 2010. Environmental baseline work continues in 2011 withthe second year of a planned two-year baseline program. The results of this work were integrated into mine planning for the 2011 Courageous Lake PEA.
Seabridge and its team are involved with consultation meetings with local communities, regulatory agencies, regional and municipal governments, TreatyNations, and the First Nations to advance the proposed Project through the review processes.
Tailings Management
Mine rock and run-of-mine (ROM) waste products from the mining operations will comprise approximately:
| | · | 926 million tonnes (Mt) of mine rock |
| | · | 20 Mt of neutralized leach residue tailings, including the flotation tailings that is used for neutralizing the POX residue |
| | · | 80 Mt of flotation tailings. |
The tailings, residue, and mine rock will be stored in a tailings/mine rock management facility on a flat open area, east of the open pit and south of Courageous Lake.
The neutralized leach residue tailings comprise approximately 20% of the full tailings stream leaving the process plant. The neutralized leach residue tailings management facility will provide acapacity of 19 million cubic metres (Mm³) and have a final crest elevation of 457 m, which equates to a dam height ofapproximately 31 m.
The flotation tailings comprise approximately 80% of the full tailings stream leaving the process plant. The flotation tailings will be stored within the mine rock storage facility. Approximately 58.8 Mm³ of flotation tailings will be disposed of in the tailings storage facility during the life of the mining operations. Mine rock represents the largest waste stream from the mining operations with an estimated volume of 421 Mm³. The mine rock management facility will be located to the east of the pit, will occupy an area of 497 ha and will attain a final elevation of 565 m, which is equivalent to a height of approximately 130 m.
Project Operating Costs
Average mine, process and general/administrative operating costs over the project’s life (including waste mining) are estimated at US$34.22 per tonne milled. A breakdown of estimated unit operating costs is as follows:
Unit Operating Costs
| Cost Category | US$s (Per Tonne Milled) |
| Mining Costs | 16.89 |
| Milling Costs | 13.62 |
| Site Services | 1.04 |
| G&A | 2.67 |
| Total | 34.22 |
Project Capital Costs
Start-up capital costs (including contingencies of US$192 million) are estimated at US$1.26 billion and are summarized as follows:
Start-up Capital Costs
| Description | US$'000 |
| Overall Site | 62,651 |
| Open Pit Mining | 76,558 |
| Crushing and Stockpiles | 67,005 |
| Grinding and Flotation | 105,702 |
| Pressure Oxidation | 86,208 |
| Thickening, Neutralization & Cyanide Leaching | 12,949 |
| Gold ADR Circuit, Cyanide Handling &Electrowinning | 7,185 |
| Reagents and Consumables | 12,475 |
| Plant Control System | 1,906 |
| Tailings Management Facility | 44,422 |
| Water Treatment Plant | 1,116 |
| Site Services and Utilities | 23,516 |
| Ancillary Buildings | 62,833 |
| Airstrip & Loading/Unloading Facilities | 18,724 |
| Plant Mobile Equipment | 2,894 |
| Temporary Services | 37,900 |
| Electrical Power Supply | 155,555 |
| Yellowknife & Edmonton Facilities | 8,874 |
| Sub-total | 788,473 |
| Project Indirects | 242,678 |
| Owner's Costs | 40,376 |
| Contingencies | 191,925 |
| Total | 1,263,452 |
Economic Analysis
A base case economic evaluation was undertaken incorporating historical three-year trailing averages for gold prices and currency exchange rates as of May 24, 2011. A spot price case was also prepared using May 24, 2011 spot metal prices and currency exchange rates. The pre-tax economic results in for both cases are as follows:
Projected Economic Results (US$)
| | Base Case | Spot Price Case |
| Gold Price Per Ounce | $1,089 | $1,527 |
| Net Cash Flow | $1,446 million | $3,527 million |
| NPV @ 5% Discount Rate | $427 million | $1,616 million |
| Internal Rate of Return | 9.3% | 18.1% |
| Payback Period | 7.7 years | 4.2 years |
| Operating Costs Per Ounce of Gold Produced (years 1 to 5) | $536 | $598 |
| Operating Costs Per Ounce of Gold Produced (life of mine) | $599 | $668 |
| Total Costs Per Ounce of Gold Produced (includes all capital) | $850 | $944 |
| US$/Cdn$ Exchange Rate | 0.93 | 1.025 |
Both the Project NPV and internal rate of returnare most sensitive to gold price and exchange rate followed by operating costs, with initial capital having the least impact.
Project Opportunities and Recommendations
There are hydro power options for the project power supply. The opportunities represent a reliable, sustainable, and clean energy source that would significantly reduce the requirement for diesel fuel at the site. Assessment of this option has already started, but the concept was not advanced to the stage where it could be considered as definite part of the project at this time. However, the next stage of the project should fully investigate this potentially attractive alternative.
Under the current design, access to the Project is by winter ice road, which is limited to less than three months per year. The construction of an all-weather road in close proximity to the site could have a large positive impact on the Project’s capital and operating costs. Site access improvements would significantly reduce on-site storage requirements, especially fuel oil and reagents such as lime.
Based on the work carried out in the 2011 Courageous Lake PEA and the resultant economic evaluation, this study should be followed by a Prefeasibility Study in order to further assess the economic viability of the Project.
Subsequent Information
After completion of the 2011 Courageous Lake PEA the Issuer undertook further exploration and development work at the Courageous Lake Project, which work included 15,000 m of diamond core drilling. On January 10, 2012 the Issuer announced, after its successful drilling program in 2011, an updated resource estimate for the Courageous Lake Project that increased estimated measured and indicated gold resources by 18% to nearly 8.0 million ounces. This updated gold resource estimate was prepared by Resource Modeling Inc. under the supervision of Michael Lechner, who is independent of Seabridge and a Qualified Person as defined by National Instrument 43-101.
The updated resource estimate for the Issuer’s 100% owned Courageous Lake Project at a 0.83 g/t gold cutoff grade, effective as of January 9, 2012, is as follows:
Courageous Lake Gold Resources at 0.83 gram per tonne cutoff
| MEASURED | INDICATED |
Tonnes (000’s) | Grade (g/T) | Ounces (000’s) | Tonnes (000’s) | Grade (g/T) | Ounces (000’s) |
| 13,401 | 2.53 | 1,090 | 93,914 | 2.28 | 6,884 |
| MEASURED PLUS INDICATED | INFERRED |
Tonnes (000’s) | Grade (g/T) | Ounces (000’s) | Tonnes (000’s) | Grade (g/T) | Ounces (000’s) |
| 107,315 | 2.31 | 7,974 | 48,963 | 2.18 | 3,432 |
| | | | | | |
| Note: | The resource estimate has been prepared in accordance with NI 43-101. See “Cautionary Note to United States Investors Regarding Resource Estimates” in the Preliminary Notes. |
The updated resource model constructed for the Courageous Lake deposit now incorporates data from a total of 589 holes drilled by Seabridge, Noranda and Placer Dome totaling approximately 169,000 meters. About 122,260 meters of the total have been assayed for gold, 53% of it by Seabridge. Gold mineralization within the Courageous Lake deposit is hosted in the upper part of an assemblage of Archean age felsic pyroclastic rocks just below a transition zone to sedimentary rocks.
Similar to the 2010 estimate (also completed by RMI), block model gold grades for this updated Courageous Lake model were estimated using a multiple pass inverse distance weighting interpolation procedure. In addition to using mineral zone wireframes to constrain the estimate of block grades, a dynamic anisotropic search strategy was used to select eligible composites. The search ellipse was allowed to dynamically conform to the hanging and footwall contacts of the key mineral zones, providing for a more geologically consistent and realistic distribution of in situ block gold grades. Individual assay grades were capped for each zone prior to compositing the assay data and interpolating block grades. The estimated block grades were classified into Measured, Indicated, and Inferred Mineral Resource categories using distance to drilling data and the number of drill holes used to estimate the block grades. For the principal mineral zones (3-5) Measured Resources were defined for blocks estimated by one or more drill holes within 7.5 meters of the block. For mineral zones 3 and 4 within the heart of the deposit (section 4400 to 5000 north), Indicated Resources were defined by blocks estimated by two or more drill holes with at least one sample within 40 meters of the block. Indicated Resources were defined for other zones based on distances from drill data ranging from 15 to 30m. For the primary mineralized zones, Inferred Mineral Resources were defined by blocks estimated by at least one drill hole with a maximum allowable assay projection distance of 65 meters. Inferred Resources were assigned to secondary mineralized zones up to 40m from drilling data. It is RMI’s opinion that the new resource model is globally unbiased and locally reflects the grade of nearby drill hole composites.
The following table provides global resource estimates from the new model at various gold cutoff grades:
Comparison of Courageous Lake Resources at Various Cutoff Grades
Cutoff Grade (g/T) | Measured | Indicated | Inferred |
| Tonnes (000) | Grade (g/T) | Ounces (000) | Tonnes (000) | Grade (g/T) | Ounces (000) | Tonnes (000) | Grade (g/t) | Ounces (000) |
| | | | | | | | | |
| 0.70 | 14,566 | 2.39 | 1,119 | 102,664 | 2.16 | 7,097 | 55,206 | 2.02 | 3,585 |
| 0.80 | 13,678 | 2.49 | 1,095 | 95,890 | 2.25 | 6,937 | 50,657 | 2.14 | 3,485 |
| 0.83 | 13,401 | 2.53 | 1,090 | 93,914 | 2.28 | 6,884 | 48,963 | 2.18 | 3,432 |
| 0.90 | 12,850 | 2.60 | 1,074 | 89,363 | 2.36 | 6,780 | 46,044 | 2.27 | 3,360 |
| 1.00 | 12,029 | 2.71 | 1,048 | 83,482 | 2.46 | 6,603 | 42,779 | 2.37 | 3,260 |
The cutoff grade for resource tabulation was set at 0.83 grams per tonne, consistent with the cut-off grade used for previous Courageous Lake resource estimates (2007 and 2010). The cutoff grade used in the 2011 Courageous Lake PEA was 0.67 grams per tonne, based on a gold price of $990. New mine plans will now be generated from this updated resource model in anticipation of being able to report the project’s first proven and probable reserves in the preliminary feasibility study scheduled for completion in June, 2012.
Glossary of Technical Terms
In this Annual Information Form, the following technical terms have the following meanings:
alteration –Any change in the mineral composition of a rock brought about by physical or chemical means.
batholith – A very large intrusive mass of igneous rock.
biotite -A common rock-forming mineral in crystalline rocks, either as an original crystal in igneous rocks or as a metamorphic product in gneisses and schists.
breccia - A rock in which angular fragments are surrounded by a mass of fine-grained minerals.
carbonate – A sediment formed by the organic or inorganic precipitation from aqueous solution of carbonates of calcium, magnesium, or iron; e.g., limestone and dolomite
chalcopyrite - A sulphide mineral of copper and iron.
clastic - Fragments of minerals and rocks that have been moved individually from their places of origin.
core samples - The cylindrical form of rock called "core" that is extracted from a diamond drill hole. Mineralized sections are separated and these samples are sent to a laboratory for analysis.
cut-off grade -The lowest grade of mineralized material that qualifies as reserve in a deposit. i.e.: contributing material of the lowest assay that is included in a reserve estimate.
diorite - An intrusive igneous rock.
dip – The angle that a structural surface, a bedding or fault plan, makes with the horizontal, measured perpendicular to the strike of the structure.
disseminated – Where minerals occur as scattered particles in the rock.
drift - A horizontal underground opening that follows along the length of a vein or rock formation.
facies – The character and composition of sedimentary deposits.
fault – A fracture or break in rock along which there has been movement.
feasibility study – Is a definitive study of the viability of a mineral project by a qualified professional which defines: (1) mining methods, pit configuration, mine scheduling, mine equipment and all related costing, (2) method of mineral processing and all related plant, equipment and costing, (3) necessary determination of all infrastructure required and relevant costs and (4) all requirements of government and markets for mine operation. A definitive financial analysis of the mineral project taking into consideration all relevant factors, which will establish the presence of a Mineral Reserve and the details of its economic viability.
felsic – An adjective describing an igneous rock having mostly light coloured minerals and rich in silica, potassium and sodium.
fracture – A break or crack in rock.
gabbro – A coarse-grained, crystalline, dark igneous rock.
geochemistry - The study of the chemical properties of rocks.
gneiss - A layered or banded crystalline metamorphic rock, the grains of which are aligned or elongated into a roughly parallel arrangement.
gossan - A rust-coloured capping or staining of a mineral deposit, generally formed by the oxidation or alteration of iron sulphides.
grade – The metal content of rock with precious metals, grade can be expressed as troy ounces or grams per tonne of rock.
granite - Any holocrystalline, quartz-bearing plutonic rock.
granitic - Pertaining to or composed of granite.
greenschist - A schistose metamorphic rock whose green colour is due to the presence of chlorite, epidote, or actinolite.
greywacke -A dark grey, firmly indurated, coarse-grained sandstone that consists of poorly sorted, angular to subangular grains of quartz and feldspar, with a variety of dark rock and mineral fragments embedded.
hydrothermal – The products or the actions of heated waters in a rock mass such as a mineral deposit precipitating from a hot solution.
hydrothermal alteration - The process by which heated or superheated water/solutions alter the chemistry of the rocks they circulate through.
igneous– A primary type of rock formed by the cooling of molten material.
indicated resource - That part of a resource for which quantity, grade or quality, densities, shape and physical characteristics, can be estimated with a level of confidence sufficient to allow the appropriate application of technical and economic parameters, to support mine planning and evaluation of the economic viability of the deposit. The estimate is based on detailed and reliable exploration and testing information gathered through appropriate techniques from locations such as outcrops, trenches, pits, workings and drill holes that are spaced closely enough for geological and grade continuity to be reasonably assumed.
inferred resource - That part of a resource for which quantity and grade or quality can be estimated on the basis of geological evidence and limited sampling and reasonably assumed, but not verified, geological and grade continuity. The estimate is based on limited information and sampling gathered through appropriate techniques from locations such as outcrops, trenches, pits, workings and drill holes.
intrusion; intrusive – Molten rock that is intruded (injected) into spaces that are created by a combination of melting and displacement.
mafic - Igneous rocks composed mostly of dark, iron-and magnesium-rich minerals.
measured resource - That part of a resource for which quantity, grade or quality, densities, shape, physical characteristics are so well established that they can be estimated with confidence sufficient to allow the appropriate application of technical and economic parameters, to support production planning and evaluation of the economic viability of the deposit. The estimate is based on detailed and reliable exploration, sampling and testing information gathered through appropriate techniques from locations such as outcrops, trenches, pits, workings and drill holes that are spaced closely enough to confirm both geological and grade continuity.
mineral– A naturally formed chemical element or compound having a definitive chemical composition and, usually a characteristic crystal form.
mineralization– A natural concentration in rocks or soil of one or more metalliferous minerals.
monzonite - A granular plutonic rock containing approx. equal amounts of orthoclase and plagioclase, and thus intermediate between syenite and diorite. Quartz is minor or absent.
net smelter return royalty/ NSR – A phrase used to describe a royalty payment made by a producer of metals based on gross metal production from the property, less deduction of certain limited costs including smelting, refining, transportation and insurance costs.
outcrop - The part of a rock formation that appears at the surface of the ground.
phenocryst - A term for large crystals or mineral grains floating in the matrix or groundmass of a porphyry.
placer - A deposit of sand or gravel that contains particles of gold, ilmenite, gemstones, or other heavy minerals of value. The common types are stream gravels and beach sands.
porphyritic - The texture of an igneous rock in which larger crystals (phenocrysts) are set in a finer-grained groundmass, which may be crystalline or glassy or both.
porphyry - Any igneous rock in which relatively large crystals are set in a fine-grained matrix of rock.
prefeasibility study or preliminary feasibility study –Is a comprehensive study of the viability of a mineral project that has advanced to a stage where the mining method, in the case of underground mining, or the pit configuration, in the case of an open pit, has been established, and where an effective method of mineral processing had been determined. This Study must include a financial analysis based on reasonable assumptions of technical engineering, operating, and economic factors, which are sufficient for a Qualified Person acting reasonably, to determine if all or part of the Mineral Resource may be classified as a Mineral Reserve.
preliminary assessment –A study that includes an economic analysis of the potential viability of mineral resources taken at an early stage of the project prior to completion of a preliminary feasibility study.
pyrite- An iron sulphide mineral (FeS2), the most common naturally occurring sulphide mineral.
pyroclastic- Produced by explosive or aerial ejection of ash, fragments, and glassy material from a volcanic vent. Applied to the rocks and rock layers as well as to the textures so formed.
quartz– Crystalline silica; often forming veins in fractures and faults within older rocks.
reclamation - Restoration of mined land to original contour, use, or condition.
reserve - The economically mineable part of a measured or indicated resource demonstrated by at least a preliminary feasibility study. This study must include adequate information on mining, processing, metallurgical, economic and other relevant factors that demonstrate, at the time of reporting, that economic extraction can be justified. A mineral reserve includes diluting materials and allowances for losses that may occur when the material is mined.
resource - A concentration or occurrence of natural, solid, inorganic or fossilized organic material in or on the Earth's crust in such form and quantity and of such a grade or quality that it has reasonable prospects for economic extraction. The location, quantity, grade, geological characteristics and continuity of a resource are known, estimated or interpreted from specific geological evidence and knowledge. Resources are subdivided, in order of increasing geological confidence, into inferred, indicated and measured categories.
rhyolite - A group of extrusive igneous rocks, typically porphyritic and commonly exhibiting flow texture, with phenocrysts of quartz and alkali feldspar in a glassy to cryptocrystalline groundmass; also, any rock in that group; the extrusive equivalent of granite.
sedimentary - Formed by the deposition of sediment or pertaining to the process of sedimentation.
sediments - Solid fragmental material that originates from weathering of rocks and is transported or deposited by air, water, or ice, or that accumulates by other natural agents, such as chemical precipitation from solution or secretion by organisms, and that forms in layers on the Earth's surface at ordinary temperatures in a loose, unconsolidated form; e.g., sand, gravel, silt, mud, alluvium.
sericite – A fine-grained potassium mica found in various metamorphic rocks.
vein– A thin, sheet-like, crosscutting body of hydrothermal mineralization, principally quartz.
waste – Barren rock in a mine, or mineralized material that is too low in grade to be mined and milled at a profit.
ITEM 4: RISK FACTORS
Investing in the Common shares is speculative and involves a high degree of risk due to the nature of the Issuer’s business and the present stage of exploration and development of its mineral properties. The following risk factors, as well as risks currently unknown to the Issuer, could materially adversely affect the Issuer’s future business, operations and financial condition and could cause them to differ materially from the estimates described in forward-looking statements relating to the Issuer, or its business, property or financial results, each of which could cause investors to lose part or all of their investment. Before deciding to invest in any Common shares, investors should carefully consider the risks included herein.
Risks Related to the Issuer and its Industry
The Issuer has a history of net losses and expects losses to continue for the foreseeable future.
The Issuer has a history of net losses and, although the Issuer achieved a net profit of $10,290,000 for the fiscal year ended December 31, 2008 and a net profit of $3,540,000 in 2010 primarily as a result the sale of assets of the Company, the Issuer expects to incur net losses for the foreseeable future. As of December 31, 2011, the Issuer’s historical net losses totalled approximately $40.8 million. None of the Issuer’s properties has advanced to the commercial production stage and the Issuer has no history of earnings or cash flow from operations.
The Issuer expects to continue to incur net losses unless and until such time as one or more of its projects enters into commercial production and generates sufficient revenues to fund continuing operations or until such time as the Issuer is able to offset its expenses against the sale of one or more of its projects, if applicable. The development of the Issuer’s projects to achieve production will require the commitment of substantial financial resources. The amount and timing of expenditures will depend on a number of factors, including the progress of ongoing exploration and development, the results of consultant analysis and recommendations, the rate at which operating losses are incurred and the execution of any sale or joint venture agreements with strategic partners, some of which are beyond the Issuer’s control. There is no assurance that the Issuer will be profitable in the future.
The Issuer’s ability to continue its exploration activities and any future development activities, and to continue as a going concern, will depend in part on its abilityto sell property interests, enter into joint ventures or obtain suitable financing.
The Issuer has financial resources to sustain operations for more than the next year. However, the Issuer requires capital to maintain title to and undertake exploration and development of the Issuer’s principal exploration properties and to cover corporate expenses and presently has no ongoing source of revenue. Accordingly, additional financing will be required to continue to undertake development of the Issuer’s mineral properties after its cash on hand has been spent. The maintenance of and further exploration and development of the Issuer’s mineral properties is, therefore, dependent upon the Issuer’s ability to obtain financing through the sale of projects, joint venturing of projects or equity or debt financing. Such sources of financing may not be available on terms acceptable to the Issuer, or at all. Recent disruptions in the current credit and financial markets has limited access to capital and credit for many companies, which may make it more difficult for the Issuer to obtain, or increase its cost of obtaining, capital and financing for its operations. Failure to obtain such financing may result in delay or indefinite postponement of exploration and development work on the Issuer’s mineral properties, or the possible loss of such properties. Satisfying financing requirements through the sale of projects or establishment of one or more joint ventures would reduce the Issuer’s gold ownership per share and therefore its leverage to the gold price.
The Issuer has reserves at its KSM Project but the KSM Project may not be brought into production.
There is no certainty that the reserves estimated at the KSM Project will actually be mined or, if mined, processed profitably. The Issuer does not intend to bring the KSM Project into production on its own and intends to either enter into a joint venture with an experienced operator or to sell the KSM Project. Given the size of the KSM Project and its estimated capital costs, there is likely a limited number of mining companies with the ability to raise the necessary capital and to put the KSM Project into production, which limits the options available to the Company for such a joint venture or sale. The commercial viability of the KSM Project is also dependent on a number of factors, including metal prices, government policy and regulation and environmental protection, which are beyond the control of the Issuer.
The Issuer has reserves only at its KSM Project and has no known reserves on its other properties and economic reserves may not exist on its other properties.
Despite considerable work on its Courageous Lake project, no known reserves have been established on the Courageous Lake Project or any of the Issuer’s mineral properties other than the KSM Project. Additional work will be required in order to determine if an economic deposit exists on these other properties. There is no certainty that exploration of theseother mineral properties will result in the identification of commercially recoverable quantities of reserves or that, if delineated, reserves will actually be mined or processed profitably. Finding mineral deposits is dependent on a number of factors, including the technical skill of the exploration personnel involved. The Issuer has relied and will continue to rely upon consultants for development and operating expertise. The commercial viability of a mineral deposit once discovered is also dependent on a number of factors, including the particular attributes of the deposit, such as size, grade and proximity to infrastructure, as well as metal prices, government policy and regulation and environmental protection. Most of these factors are beyond the control of the Issuer.
The figures for the Issuer’s resources are estimates based on interpretation and assumptions and may yield less mineral production under actual conditions than is currently estimated.
Unless otherwise indicated, resource figures presented in this Annual Information Form and in the Issuer’s other filings with securities regulatory authorities, press releases and other public statements that may be made from time to time are based upon estimates made by Issuer personnel and independent geologists. These estimates are imprecise and depend upon geologic interpretation and statistical inferences drawn from drilling and sampling analysis, which may prove to be inaccurate. There can be no assurance that resource or other mineralization figures will be accurate or this mineralization could be mined or processed profitably.
Because the Issuer has not commenced commercial production at any of its properties, resource estimates for the Issuer’s properties may require adjustments or downward revisions based upon further exploration or development work or actual production experience. In addition, the grade of ore ultimately mined, if any, may differ from that indicated by drilling results. There can be no assurance that recovery of minerals in small-scale tests will be duplicated in large-scale tests under on-site conditions or in production scale.
The resource estimates contained in this Annual Information Form have been determined based on assumed future prices, cut-off grades and operating costs that may prove to be inaccurate. Substantial declines in market prices for gold and other metals or increases in costs may eliminate the potential profitability of the Issuer’s deposits, require increases in cut-off gradesand result in reduced reported resources. Any material reductions in estimates of resources, or of the Issuer’s ability to extract these resources, could have a material adverse effect on the Issuer’s prospects and could restrict the Issuer’s ability to successfully implement its strategies for long-term growth.
Actual capital costs, operating costs, production and economic returns may differ significantly from those Seabridge has anticipated and there are no assurances future development activities by Seabridge, if any, will lead to profitable mining operations.
The capital costs to take the Issuer’s projects into production may be significantly higher than anticipated. None of the Issuer’s mineral properties have an operating history upon which the Issuer can base estimates of future operating costs. Decisions about the development of these and other mineral properties will ultimately be based upon feasibility studies. Feasibility studies derive estimates of cash operating costs based upon, among other things:
| | · | anticipated tonnage, grades and metallurgical characteristics of the reserves to be mined and processed; |
| | · | anticipated recovery rates of gold and other metals from the reserves; |
| | · | cash operating costs of comparable facilities and equipment; and |
| | · | anticipated climatic conditions. |
Cash operating costs, production and economic returns, and other estimates contained in studies or estimates prepared by or for the Issuer may differ significantly from those anticipated by Seabridge’s current studies and estimates, and there can be no assurance that the Issuer’s actual operating costs will not be higher than currently anticipated.
Seabridge has no history of commercially producing precious metals from its mineral exploration properties and there can be no assurance that it will successfully establish mining operations or profitably produce precious metals.
Seabridge has no history of commercially producing precious metals from its current portfolio of mineral exploration properties and the Issuer has no ongoing mining operations or revenue from mining operations. Mineral exploration and development involves a high degree of risk and few properties that are explored are ultimately developed into producing mines. The Issuer has defined reserves at its KSM Project, but only defined or delineated resources at its other projects. None of the Issuer’s properties are currently under construction. The future development of properties estimated to be economically feasible will require obtaining permits and financing and the construction and operation of mines, processing plants and related infrastructure. Although Seabridge has disclosed that it will not undertake production activities by itself, it may be involved in commencement of production at one of its properties if it enters into a joint venture or other arrangement with a third party regarding production. As a result, Seabridge may be subject to all of the risks associated with establishing new mining operations and business enterprises, including:
| | · | timing and cost, which can be considerable, of the construction of mining and processing facilities; |
| | · | availability and costs of skilled labour and mining equipment; |
| | · | availability and cost of appropriate smelting and/or refining arrangements; |
| | · | need to obtain necessary environmental and other governmental approvals and permits, and the timing of those approvals and permits; |
| | · | availability of funds to finance construction and development activities; |
| | · | potential opposition from non-governmental organizations, environmental groups, First Nations groups or local groups which may delay or prevent development activities; and |
| | · | potential increases in construction and operating costs due to changes in the cost of fuel, power, materials and supplies and foreign exchange rates. |
The costs, timing and complexities of mine construction and development are increased by the remote location of the Issuer’s mining properties. It is common in new mining operations to experience unexpected problems and delays during development, construction and mine start-up. In addition, delays in the commencement of mineral production often occur. Accordingly, there are no assurances that, if the Issuer decides to be involved in mining activities, the Issuer will successfully establish mining operations or profitably produce precious metals at any of its properties.
Changes in the market price of gold, copper and other metals, which in the past have fluctuated widely, affect the potential profitability of the Issuer’s projects.
The potential profitability of the Issuer’s projects depends, in large part, upon the market price of gold, copper and other metals and minerals to be produced. The market price of gold, copper and other metals is volatile and is impacted by numerous factors beyond the Issuer’s control, including:
| | · | expectations with respect to the rate of inflation; |
| | · | the relative strength of the U.S. dollar and certain other currencies; |
| | · | global or regional political or economic conditions; |
| | · | supply and demand for jewellery and industrial products containing metals; |
| | · | faith in paper currencies; |
| | · | changes in global or regional investment or consumption patterns; |
| | · | global production levels; |
| | · | speculative activities; and |
| | · | sales by central banks and other holders, speculators and producers of gold, copper and other metals in response to any of the above factors. |
There can be no assurance that the market price of gold, copper and other metals will remain at current levels or that such prices will improve. A decrease in the market price of gold and copper could adversely affect the Issuer’s ability to finance the exploration and development of the Issuer’s properties and to enter into joint ventures with strategic partners relating to the Issuer’s properties, which would have a material adverse effect on the Issuer’s financial condition and results of operations. There is no assurance that if commercial quantities of gold, copper and other metals are discovered on the Issuer’s properties, that a profitable market will exist or continue to exist for a production decision to be made or for the ultimate sale of the metals. As the Issuer has a high ratio of gold resources per Common share, fluctuations in gold prices have tended to have a greater impact on the price of the Common shares.
The Issuer may be adversely affected by future fluctuations of foreign exchange rates.
The potential profitability of the Issuer is exposed to the financial risk related to the fluctuation of foreign exchange rates. The minerals that could be produced from the Issuer’s projects are priced in U.S. dollars but, since the Issuer’s principal projects are located in Canada, the majority of its estimated expenditures will be in Canadian dollars. A significant change in the currency exchange rates between the Canadian dollar relative to the U.S. dollar will have an effect on the potential profitability of the Issuer’s projects and therefore its ability to continue to finance its operations. To the extent the actual Canadian dollar to U.S. dollar exchange rate is less than or more than the exchange rate used in the preliminary economic assessments summarized in this Annual Information Form, the profitability of the projects will be more than or less than that estimated (if the other assumptions are realized). Accordingly, the Issuer’s prospects may suffer due to adverse currency fluctuations.
The Issuer’s activities and proposed business are inherently dangerous and contain significant uninsured risks that could negatively impact the Issuer.
The Issuer’s exploration and development of its mineral properties involves a number of risks and hazards. In addition, the business of mining is subject to various risks and hazards including:
| | · | metallurgical and other processing problems; |
| | · | unusual or unexpected rock formations; |
| | · | structural cave-ins or slides; |
| | · | periodic interruptions due to inclement or hazardous weather conditions. |
These risks could result in damage to, or destruction of, mineral properties, plant and equipment, personal injury or death, environmental damage, delays in mining, monetary losses and possible legal liability.
The Issuer currently maintains insurance against risks relating to its exploration activities in an amount which it believes to be reasonable. If the Issuer commences mining activities with a partner, it will be subject to mining risks, including those listed above. The Issuer anticipates that it will obtain the insurance it feels is reasonable for any mining activities it undertakes, however, such insurance contains exclusions and limitations on coverage and insurance for all risks is not likely available. There can be no assurance that the insurance the Issuer desires will continue to be available, will be available at economically acceptable premiums or will be adequate to cover any resulting liability. The Issuer might also be subject to liability for environmental damage or other hazards which may be uninsurable or for which it may elect not to insure because of premium costs or commercial impracticability. The payment of such liabilities would reduce funds available for the acquisition of mineral properties or exploration and development and would have a negative effect on the Issuer’s ability to generate revenues, profits and cash flows.
The Issuer is subject to substantial government regulatory requirements, which could cause a restriction or suspension of the Issuer’s operations.
The exploration and development activities of the Issuer and the potential for profitable operation of the Issuer’s mineral properties is affected to varying degrees by government regulations relating to exploration, development and mining activities, the acquisition of land, royalties, taxes, labour standards, pollution control, environmental protection, health and safety and expropriation of property. Changes in these regulations or in their application are beyond the control of the Issuer and may adversely affect its operations, business and the potential of its projects. Failure to comply with the conditions set out in any permit or failure to comply with applicable statutes and regulations may result in orders to cease or curtail further exploration or development or reduce or eliminate the potential profitability of a project. The Issuer may be required to compensate those suffering loss or damage by reason of its exploration activities or operations.
At the federal, state and provincial level, the Issuer must comply with exploration permitting requirements which require sound operating and reclamation plans to be approved by the applicable government body prior to the start of exploration. At the local level, regulations deal primarily with zoning, land use and specific building permits, as well as taxation and the impact of the Issuer’s operations on the existing population and services. There can be no assurance that all required approvals and permits will be able to be obtained.
Depending upon the type and extent of the exploration activities, the Issuer may be required to post reclamation bonds and/or assurances that the affected areas will be reclaimed. Currently, the Issuer has estimated CDN$1,963,000 in reclamation liabilities for its properties. As at December 31, 2011, CDN$1,588,000 has been deposited for the benefit of the various government agencies until released or applied to reclamation costs. If the reclamation requires funds in addition to those already estimated or allocated, the Issuer could be forced to pay for the extra work, which could have a material adverse effect on the Issuer’s financial position and operations. In addition, unidentified environmental deficiencies may exist on other of the Issuer’s properties. The discovery of and any required reclamation of any additional properties would likely have an adverse effect on the Issuer’s operations and financial position.
The Issuer is subject to substantial environmental requirements which could cause a restriction or suspension of the Issuer’s operations.
In connection with its operations and properties, the Issuer is subject to extensive and changing environmental legislation, regulations and actions. The Issuer cannot predict what environmental legislation, regulations or policy will be enacted or adopted in the future or how current or future laws and regulations will be administered or interpreted. The recent trend in environmental legislation and regulation generally is toward stricter standards and this trend is likely to continue in the future. The recent trends include, without limitation, laws and regulations relating to air and water quality, mine reclamation, waste handling and disposal, the protection of certain species and the preservation of certain lands. These regulations may require that the Issuer obtain permits or other authorizations for certain activities. These laws and regulations may also limit or prohibit activities on certain lands lying within wetland areas, areas providing habitat for certain species or other protected areas. The land claims process in Canada has recently resulted in many First Nations groups taking over administration of lands subject to the land claims settlement, and First Nations groups may look to impose additional requirements over land they administer. Compliance with more stringent laws and regulations, as well as potentially more vigorous enforcement policies or stricter interpretation of existing laws, may necessitate significant capital outlays, which may adversely affect the Issuer’s results of operations and business, or may cause material changes or delays in the Issuer’s intended activities.
At the federal, state and provincial level, regulations deal with environmental quality and impacts upon air, water, soil, vegetation and wildlife, as well as historical and cultural resources. Approval must be received from the applicable bureau and/or department before exploration can begin, and ongoing monitoring of operations is common. If the Issuer’s operations result in negative effects upon the environment, government agencies will usually require the Issuer to provide remedial actions to correct the negative effects.
Title to the Issuer’s mineral properties cannot be guaranteed and may be subject to prior unregistered agreements, transfers or claims and other defects.
The Issuer cannot guarantee that title to its properties will not be challenged. Title insurance is not available for mineral properties in Canada and the Issuer’s ability to ensure that it has obtained a secure claim to individual mineral properties or mining concessions may be severely constrained. The Issuer’s mineral properties may be subject to prior unregistered agreements, transfers or claims, and title may be affected by, among other things, undetected defects. To date, the Issuer has only done a preliminary legal survey of the boundaries of its properties and has not obtained formal title reports on any of its properties, and therefore, in accordance with the laws of the jurisdictions in which these properties are situated, their existence and area could be in doubt. If title is challenged, the Issuer will have to defend its ownership through the courts. A successful challenge to the precise area and location of these claims could result in the Issuer being unable to operate on its properties or being unable to enforce its rights with respect to its properties.
Securing a right of way to permit construction and operation of the proposed tunnels for the KSM Project are subject to governmental and third party approvals and consents which are not guaranteed.
The present development plans at the KSM Project include the construction of twin 23 kilometer parallel tunnels through Crown land. The proposed route passes through approximately 15 kilometers of Crown land subject to mineral claims held by third parties. The grant of a right of way for the tunnels is subject to the discretion of the relevant Minister in British Columbia. It is not clear whether the relevant Minister has the authority to grant the required right of way without the consent of the third party mineral rights holders and, accordingly, Seabridge is assuming that obtaining the right of way will require the consent of the third party rights holders. Seabridge has not been able to secure rights to drive the tunnels through this land and expects to have to pay appropriate compensation to secure a right of way through such mineral claims. Seabridge holds no right to drive the tunnels through such land and may be unable to secure such rights at all. There can be no assurance that a right of way can be obtained.
There is uncertainty related to unsettled First Nations rights and title in British Columbia and the Northwest Territories and this may create delays in project approval or interruptions in project progress.
The nature and extent of First Nation rights and title remains the subject of active debate, claims and litigation in Canada, including in British Columbia and the Northwest Territories. The KSM Project lies within a traditional First Nation territory and no comprehensive treaty or land claims settlement has been concluded regarding these traditional territories. There can be no guarantee that the unsettled nature of land claims in British Columbia and the Northwest Territories will not create delays in project approval or unexpected interruptions in project progress, or result in additional costs to advance the Issuer’s projects. In many cases mine construction and commencement of mining activities is only possible with the consent of the local First Nations group and many companies have secured such consent by committing to take measures to limit the adverse impact to, and ensure some of the economic benefits of the construction and mining activity will be enjoyed by, the local First Nations group.
High metal prices in recent years have encouraged increased mining exploration, development and construction activity, which has increased demand for, and cost of, exploration, development and construction services and equipment.
The relative strength of metal prices over the past eight years has encouraged increases in mining exploration, development and construction activities around the world, which has resulted in increased demand for, and cost of, exploration, development and construction services and equipment. While recent market conditions have had a moderating effect on the costs of such services and equipment, increases in such costs may continue due to the recent resumption of an upward trend in metal prices. Increased demand for services and equipment could result in delays if services or equipment cannot be obtained in a timely manner due to inadequate availability, and may cause scheduling difficulties due to the need to coordinate the availability of services or equipment, any of which could materially increase project exploration, development and/or construction costs.
Increased competition could adversely affect the Issuer’s ability to acquire suitable properties for mineral exploration in the future.
The mining industry is intensely competitive. Significant competition exists for the acquisition of properties producing or capable of producing gold or other metals. The Issuer may be at a competitive disadvantage in acquiring additional mining properties because it must compete with other companies, many of which have greater financial resources, operational experience and technical capabilities than the Issuer. Competition for exploration resources at all levels is currently very intense, particularly affecting the availability of manpower, drill rigs and helicopters. Increased competition could adversely affect the Issuer’s ability to acquire suitable properties for mineral exploration in the future.
The Issuer has a dependence upon key management employees, the absence of which would have a negative effect on the Issuer’s operations.
The Issuer strongly depends on the business and technical expertise of its management and key personnel, including Rudi Fronk, President and Chief Executive Officer. There is little possibility that this dependence will decrease in the near term. If the Issuer’s operations expand, additional general management resources will be required. The Issuer may not be able to attract and retain additional qualified personnel and this would have a negative effect on the Issuer’s operations. The Issuer does not carry any formal services agreements between itself and its officers or directors. The Issuer does not carry any “key man” life insurance.
Certain of the Issuer’s directors and officers serve in similar positions with other natural resource companies, which put them in conflict of interest positions from time to time.
Certain of the directors and officers of the Issuer are also directors, officers or shareholders of other natural resource or mining-related companies. Such associations may give rise to conflicts of interest from time to time. The directors of the Issuer are required by law to act honestly and in good faith with a view to the best interests of the Issuer and to disclose any interest that they may have in any project or opportunity of the Issuer. If a conflict of interest arises in a matter to be discussed at a meeting of the board of directors, any director in a conflict must disclose his interest and abstain from voting on such matter. In determining whether or not the Issuer will participate in any project or opportunity, the directors will primarily consider the degree of risk to which the Issuer may be exposed and its financial position at the time.
Risks Related to the Common Shares
The market for the Common shares has been subject to volume and price volatility which could negatively effect a shareholder’s ability to buy or sell the Common shares.
The market for the Common shares may be highly volatile for reasons both related to the performance of the Issuer or events pertaining to the industry (i.e., mineral price fluctuation, high production costs) as well as factors unrelated to the Issuer or its industry. In particular, the price for gold has recently been at an all time high and may not sustain such levels. In addition, market demand for products incorporating minerals fluctuates from one business cycle to the next, resulting in a change of demand for the mineral and an attendant change in the price for the mineral. The Common shares can be expected to be subject to volatility in both price and volume arising from market expectations, announcements and press releases regarding the Issuer’s business, and changes in estimates and evaluations by securities analysts or other events or factors. In recent years the securities markets in the United States and Canada have experienced a high level of price and volume volatility, and the market price of securities of many companies, particularly small-capitalization companies such as the Issuer, have experienced wide fluctuations that have not necessarily been related to the operations, performance, underlying asset values or prospects of such companies. For these reasons, the Common shares can also be expected to be subject to volatility resulting from market forces over which the Issuer will have no control. Further, despite the existence of markets for trading the Common shares in Canada and the United States, shareholders of the Issuer may be unable to sell significant quantities of Common shares in the public trading markets without a significant reduction in the price of the shares.
The Common Shares are publicly traded and are subject to various factors that have historically made the Common Share price volatile.
The market price of the Common shares has been, and may continue to be, subject to large fluctuations, which may result in losses to investors. The market price of the Common shares may increase or decrease in response to a number of events and factors, including: the Issuer’s operating performance and the performance of competitors and other similar companies; volatility in metal prices; the public’s reaction to the Issuer’s press releases, material change reports, other public announcements and the Issuer’s filings with the various securities regulatory authorities; changes in earnings estimates or recommendations by research analysts who track the Common shares or the shares of other companies in the resource sector; changes in general economic and/or political conditions; the number of Common shares to be publicly traded after an offering of Common shares; the arrival or departure of key personnel; acquisitions, strategic alliances or joint ventures involving the Issueror its competitors; and the factors listed under the heading “Description of the Issuer’s Business - Cautionary Statement Regarding Forward-Looking Information and Statements.”
The market price of the Common shares is affected by many other variables that are not directly related to the Issuer’s success and are, therefore, not within its control, including other developments that affect the market for all resource sector securities, the breadth of the public market for the Common shares and the attractiveness of alternative investments. The effect of these and other factors on the market price of the Common shares on the exchanges on which they trade has historically made the trading price of theCommon shares volatile and suggests that the trading price of the Common shares will continue to be volatile in the future.
The Issuer has never declared or paid any dividends on the Common Shares.
The Issuer has never declared or paid any dividends on the Common shares. The Issuer intends to retain earnings, if any, to finance the growth and development of the business and does not intend to pay cash dividends on the Common shares in the foreseeable future. Any return on an investment in the Common shares will come from the appreciation, if any, in their value. The payment of future cash dividends, if any, will be reviewed periodically by the Issuer’s Board of Directors and will depend upon, among other things, conditions then existing including earnings, financial condition and capital requirements, restrictions in financing agreements, business opportunities and conditions and other factors. See “Dividend Policy.”
Shareholders’ interests may be diluted in the future.
The Issuer may require additional funds for exploration and development programs or potential acquisitions. If it raises additional funding by issuing additional equity securities or other securities that are convertible into equity securities, such financings may substantially dilute the interests of existing or future shareholders. Sales or issuances of a substantial number of securities, or the perception that such sales could occur, may adversely affect the prevailing market price for the Common shares. With any additional sale or issuance of equity securities, investors will suffer dilution of their voting power and may experience dilution in the Issuer’s earnings per share.
The Issuer could be deemed a passive foreign investment company which could have negative consequences for U.S. investors.
Depending upon the composition of the Issuer’s gross income or its assets, the Issuer could be classified as a passive foreign investment company (“PFIC”) under the United States tax code. If the Issuer is declared a PFIC, then owners of the Common shares who are U.S. taxpayers generally will be required to treat any “excess distribution” received on their Common shares, or any gain realized upon a disposition of Common shares, as ordinary income and to pay an interest charge on a portion of such distribution or gain, unless the taxpayer makes a qualified electing fund (“QEF”) election or a mark-to-market election with respect to the Common shares. A U.S. taxpayer who makes a QEF election generally must report on a current basis its share of the Issuer’s net capital gain and ordinary earnings for any year in which the Issuer is classified as a PFIC, whether or not the Issuer distributes any amounts to its shareholders. U.S. investors should consult with their tax advisors for advice as to the U.S. tax consequences of an investment in the Common shares.
ITEM 5: DIVIDENDS
The Issuer has not paid any dividends since incorporation. Payment of dividends in the future is dependent upon the earnings and financial condition of the Issuer and other factors which the directors may deem appropriate at the time. However, the Issuer is not limited in any way in its ability to pay dividends on its Common shares other than to comply with solvency tests that apply to it under its governing corporate legislation.
ITEM 6: GENERAL DESCRIPTION OF CAPITAL STRUCTURE
The Issuer is authorized to issue an unlimited number of Common shares without par value and an unlimited number of Preferred shares, issuable in series, of which at March 28, 2012, 43,451,885 Common shares were issued and outstanding and no Preferred shares were issued and outstanding.
The holders of the Common shares are entitled to receive notice of and to attend and vote at all meetings of the shareholders of the Issuer and each Common share confers the right to one vote in person or by proxy at all meetings of the shareholders of the Issuer. The holders of the Common shares, subject to the prior rights, if any, of the holders of any other class of shares of the Issuer, are entitled to receive such dividends in any financial year as the board of directors of the Issuer may by resolution determine. In the event of the liquidation, dissolution or winding-up of the Issuer, whether voluntary or involuntary, the holders of the Common shares are entitled to receive, subject to the prior rights, if any, of the holders of any other class of shares of the Issuer, the remaining property and assets of the Issuer.
The directors of the Issuer are authorized to create series of Preferred shares in such number and having such rights and restrictions with respect to dividends, rights of redemption, conversion or repurchase and voting rights as may be determined by the directors and shall have priority over the Common shares to the property and assets of the Issuer in the event of liquidation, dissolution or winding-up of the Issuer.
ITEM 7: MARKET FOR SECURITIES
Trading Price and Volume
The Issuer's Common shares are listed for trading through the facilities of the TSXunder the symbol "SEA", and on the AMEX under the symbol "SA". During the Issuer's most recently completed financial year, the high and low trading prices and trading volume (rounded up or down to the nearest 100) of the Issuer's Common shares on the TSX and on the AMEX was as follows:
| | TSX | AMEX |
| Month | Volume | High(1) | Low(1) | Volume | High(1) | Low(1) |
| January 2011 | 713,781 | $31.19 | $27.17 | 1,373,712 | $31.64 | $27.25 |
| February 2011 | 709,049 | $35.00 | $27.90 | 1,071,092 | $35.66 | $28.00 |
| March 2011 | 750,414 | $34.99 | $29.53 | 1,195,284 | $35.88 | $30.00 |
| April 2011 | 485,074 | $33.30 | $30.04 | 829,014 | $34.93 | $31.55 |
| May 2011 | 497,300 | $32.55 | $27.12 | 976,579 | $34.39 | $27.72 |
| June 2011 | 781,785 | $28.86 | $23.50 | 1,816,103 | $29.70 | $24.15 |
| July 2011 | 420,284 | $29.75 | $26.39 | 743,576 | $30.97 | $26.84 |
| August 2011 | 597,262 | $30.81 | $24.80 | 1,227,732 | $31.23 | $25.34 |
| September 2011 | 517,355 | $30.26 | $22.38 | 1,187,814 | $30.71 | $21.50 |
| October 2011 | 339,771 | $25.14 | $21.14 | 1,223,036 | $25.15 | $19.84 |
| November 2011 | 345,876 | $26.39 | $20.75 | 1,092,859 | $25.92 | $20.09 |
| December 2011 | 295,064 | $23.35 | $15.63 | 1,418,835 | $23.04 | $15.23 |
| | (1) | Values include intra-day lows and highs. |
ITEM 8: DIRECTORS AND OFFICERS
The By-Laws of the Issuer provide for the election and retirement of directors. At each annual general meeting, all the directors retire and the Issuer elects a Board of Directors consisting of the number of directors fixed from time to time by the shareholders, subject to the Issuer’s Articles. If the election of directors is not held at the proper time, the incumbent directors shall continue in office until their successors are elected. The Issuer has a 3 member Audit Committee, a 5 member Corporate Governance and Nominating Committee, a 3 member Compensation Committee and a 3 member Technical Committee.
The names and municipalities of residence of the directors and officers of the Issuer, the positions held by them with the Issuer, their principal occupations for the past five years and their share holdings in the Issuer are as follows:
| Name, Municipality of Residence and Position | Principal Occupation or employment and, if not a previously elected director, occupation during the past 5 years | Previous Service as a Director/Officer | Number of Common Shares beneficially owned or, directly or indirectly, Controlled(5) |
James S. Anthony Toronto, Ontario, Canada Chairman of the Board | President, Suma Investments Inc., a private investment company since 1986. | Since October 1999 | 779,791 directly 530,334 indirectly |
A. Frederick Banfield(1), (3), (4) Tucson, Arizona, USA Director | Chairman, Mintec Inc., a consulting and software company providing services to the mining industry, since 1970. | Since October 1999 | 245,000 |
Douglass “Scott” Barr(2), (3), (4) Centennial, Colorado, USA Director | Executive, Value Assurance, Newmont Mining Corporation since Dec. 2011, Technical Advisor to, and previously Executive VP and COO of, Golden Star Resources Ltd., since 2008. With Newmont Mining Corporation from 1995 to 2008, finishing as VP – Technical Strategy and Development | Since June 2011 | 0 |
Thomas C. Dawson (1), (3) Toronto, Ontario, Canada Director | Retired as Senior Audit and Accounting Partner, Deloitte Touche LLP in 1999 | Since January 2006 | 35,700 directly 2,000 indirectly |
Louis J. Fox(1), (2), (3) Ft. Lauderdale, Florida, USA Director | Private Businessman. From 1984 to 1999, a Senior Vice President of Gerald Metals, Inc. | Since January, 2000 | 300,750 |
Rudi P. Fronk Toronto, Ontario, Canada Director, President & CEO | President and CEO, Seabridge Gold Inc. | Since October 1999 | 1,150,000 directly 20,000 indirectly |
Eliseo Gonzalez-Urien(2), (3), (4) Ashland, Oregon ,USA Director | Senior Technical Advisor, Seabridge Gold Inc. since 2003. Retired as Senior Vice President, Placer Dome Inc. in 2001. | Since January 2006 | 58,000 |
Jay Layman Breckenridge, Colorado, USA Executive Vice President and Chief Operating Officer | Executive Vice President and Chief Operating Officer, Seabridge Gold since March 2011; Independent Consultant (President of Tactical and Strategic Advisory Services LLC, August 2010 to February 2011, Vice President Solutions and Innovation, Newmont Mining Company from May 2007 to August 2010; Vice President Corporate Development, Hecla Mining Company, 2006 to April 2007 | Since March 2011 | 0 |
Christopher Reynolds Oakville, Ontario, Canada Vice President, Finance and CFO | Vice President, Financeand Chief Financial Officer, Seabridge Gold since May 2011; Director of Paramount Gold and Silver Corp., since December 2009; October 2007 – April 2011 Vice President Finance and Chief Financial Officer, Norsemont Mining Inc.; January 2001 – October 2007 various positions - resigned as Senior Vice President, Chief Financial Officer and Corporate Secretary, SouthernEra Diamonds Inc. | Since May 2011 | 10,000 |
William E. Threlkeld Morrison, Colorado, USA Senior Vice President | Senior V.P., Seabridge Gold Inc. since 2001, consultant to Seabridge; 1997-2001 | Since November 2001 | 265,000 |
R. Brent Murphy Yellowknife, NWT, Canada Vice President, Environmental Affairs | Vice President, Environmental Affairs, Seabridge Gold Inc. since December 2010, Manager, Environmental Affairs to Seabridge; March 2008 to December 2010, Environment and Sustainability Manager, Alaska Gold Company, June 2007 to March 2008, Chief Environmental Officer, EKATI Diamond Mine, BHP Billiton Diamonds Inc., January 2006 to June 2007 | Since March 2008 | 1,000 |
| Name, Municipality of Residence and Position | Principal Occupation or employment and, if not a previously elected director, occupation during the past 5 years | Previous Service as a Director/Officer | Number of Common Shares beneficially owned or, directly or indirectly, Controlled(5) |
C. Bruce Scott West Vancouver, BC, Canada Vice President, Corporate Affairs and Corporate Secretary | President of CBCS Law Corporation, counsel to the Issuer, Partner, DuMoulin Black LLP January 1998-December 2011 | Since Jan. 2012 | 9,000 |
Gloria M. Trujillo Toronto, Ontario, Canada Assistant Secretary | Assistant Corporate Secretary, Seabridge Gold since 2003; Manager of Administration and Webmaster, Seabridge Gold since 2000 | Since June 2003 | 28,000 |
| (1) | Member of the Audit Committee. |
| (2) | Member of the Compensation Committee |
| (3) | Member of the Corporate Governance and Nominating Committee |
| (4) | Member of the Technical Committee |
| (5) | Shares beneficially owned, directly or indirectly, or over which control or direction is exercised, as at March 28, 2012, based upon information furnished to the Corporation by individual directors. Unless otherwise indicated, such shares are held directly. |
As of March 28, 2012, the directors and executive officers of the Issuer, as a group, hold 3,434,575Common shares of the Issuer (excluding Common shares which may be acquired upon exercise of stock options held by them), representing 7.9% of the Issuer’s issued and outstanding shares. Each director holds office until the next general meeting of the Issuer at which directors are elected.
Other than as set forth below, none of the Issuer's directors or executive officers is, as at the date of this Annual Information Form, or has been, within ten years before the date of this Annual Information Form, a director, chief executive officer or chief financial officer of any company (including the Issuer) that:
| (a) | was subject to an Order (as defined below) that was issued while the director or executive officer was acting in the capacity as director, chief executive officer or chief financial officer; or |
| (b) | was subject to an Order that was issued after the director or executive officer ceased to be a director, chief executive officer or chief financial officer and which resulted from an event that occurred while that person was acting in the capacity as director, chief executive officer or chief financial officer. |
"Order" means a cease trade order, an order similar to a cease trade order, or an order that denied the relevant company access to any exemption under securities legislation and, in each case, that was in effect for a period of more than 30 consecutive days.
None of the Issuer's directors or executive officers or any shareholder holding a sufficient number of securities of the Issuer to affect materially the control of the Issuer:
| | (a) | is, as at the date of this Annual Information Form or has been, within the ten years before the date of this Annual Information Form, a director or executive officer of any company, that while that person was acting in that capacity, or within a year of that person ceasing to act in that capacity, became bankrupt, made a proposal under any legislation relating to bankruptcy or insolvency or was subject to or instituted any proceedings, arrangement or compromise with creditors or had a receiver, receiver manager or trustee appointed to hold its assets; or |
| | (b) | has, within the ten years before the date of this Annual Information Form, become bankrupt, made a proposal under any legislation relating to bankruptcy or insolvency, or become subject to or instituted any proceedings, arrangement or compromise with creditors, or had a receiver, receiver manager or trustee appointed to hold the assets of the director, officer or shareholder. |
ITEM 9: AUDIT COMMITTEE INFORMATION
Audit Committee Charter
The Issuer's audit committee has a charter (the "Audit Committee Charter") in the form attached to this Annual Information Form as Schedule "A".
Composition of the Audit Committee
Each of the members of the Issuer's Audit Committee is independent and financially literate, as those terms are defined in Multilateral Instrument 52-110 ("MI 52-110").
Relevant Education and Experience
A description of the education and experience of each audit committee member that is relevant to the performance of his or her responsibilities as an audit committee member is set out below.
Thomas C. Dawson (Chairman of the Audit Committee) –Mr. Dawson has been a Chartered Accountant since 1961. He is a retired senior audit and accounting partner with 40 years of experience at Deloitte &Touche LLP, Chartered Accountants. He received his B.Comm. from Loyola College (now Concordia University), Canada, in 1959. Mr. Dawson is also a director of Water Furnace Renewable Energy Inc., a Canadian public company.
Louis Fox – Mr. Fox holds a B.A. from the University of Pittsburgh and a J.D. from the Boston University Law School. Mr. Fox has served on several public company boards and their respective audit committees. He has more than 25 years of experience in precious metals trading, merchanting and merchant banking activities. From 1984 to 1999, Mr. Fox was a Senior Vice President of Gerald Metals, Inc., an internationally recognized commodity trading, refining and merchant banking firm. Prior to Gerald Metals, from 1974 to 1981, Mr. Fox was a Vice President of J. Aron& Co., and Vice President of Goldman Sachs from 1981through 1984.
A. Frederick Banfield – Mr. Banfield is the Founder and Chairman of Mintec, Inc., Mr. Banfield was one of the original developers of MineSight™, recognized as the pre-eminent reserves modeling and mine design software system with more than 300 installations worldwide. Mr. Banfield has also been an independent reserves auditor and mine planning advisor to some of the world's leading gold mining organizations with respect to projects in the United States, Canada, Africa, Australia and Latin America. Mr. Banfield holds an Engineer of Mines degree from the Colorado School of Mines.
External Auditor Service Fees (by Category)
The aggregate fees billed by the Issuer's external auditors in the following categories for the 12 months ended December 31, 2011 and 2010 are as follows:
| | 2011 | 2010 |
| Audit Fees | $196,500 | $136,500 |
Audit Related Fees(1) | $75,000 | $195,500 |
| Tax Fees | 5,425 | $5,500 |
| All Other Fees | 7,500 | - |
| Total | $284,425 | $337,500 |
| | | |
| (1) For review of quarterly financial statements. |
Pre-Approval of Audit and Non-Audit Services Provided by Independent Auditors
The Audit Committee nominates, for election by the Issuer's shareholders at the Issuer's annual general meeting, the Issuer's independent auditors to audit the Issuer's financial statements. The Audit Committee is authorized by the Issuer's Board of Directors to review the performance of the Issuer's external auditors, to approve in advance the provisions of services by the independent auditors and to consider the independence of the external auditors.
ITEM 10: CONFLICTS OF INTEREST
Certain of the Issuer's directors and officers serve or may agree to serve as directors or officers of other reporting companies or have significant shareholdings in other reporting companies and, to the extent that such other companies may pursue business objectives similar to those which the Issuer may pursue, the directors of the Issuer may have a conflict of interest respecting such pursuits. Under the corporate laws applicable to the Issuer, the directors of the Issuer are required to act honestly, in good faith and in the best interests of the Issuer and to disclose all conflicts to the directors so that appropriate procedures may be established for the circumstances, including abstaining from voting or the establishment of special committees.
ITEM 11: LEGAL PROCEEDINGS AND REGULATORY ACTIONS
Legal Proceedings
The Issuer is not a party to any legal proceedings and does not knowof any such proceedings that are contemplated.
Regulatory Actions
There are no: (a) penalties or sanctions imposed against the Issuer by a court relating to securities legislation or by a securities regulatory authority during the Issuer's most recently completed financial year and up to the date of this Annual Information Form; (b) other penalties or sanctions imposed by a court or regulatory body against the Issuer that would likely be considered important to a reasonable investor in making an investment decision; or (c) settlement agreements the Issuer entered into with a court relating to securities legislation or with a securities regulatory authority during the Issuer's most recently completed financial year and up to the date of this Annual Information Form.
ITEM 12: INTEREST OF MANAGEMENT AND OTHERS IN MATERIAL TRANSACTIONS
No director, executive officer or person or company that beneficially owns, or controls or directs, directly or indirectly, more than 10% of the Issuer’s outstanding Common shares, or any associate or affiliate of the foregoing, has had any material interest, direct or indirect, in any transaction within the three most recently completed financial years or during the current financial year prior to the date of this Annual Information Form that has materially affected or is reasonably expected to materially affect the Issuer.
ITEM 13: TRANSFER AGENTS AND REGISTRARS
The registrar and transfer agent for the Common shares is Computershare Investor Services Inc. at its principal office at 100 University Ave., 9th Floor, Toronto, Ontario, Canada M5J 2Y1 and co-transfer points at 510 Burrard Street, Vancouver, British Columbia, Canada V6C 3B9 and Computershare Trust Company, N.A., at 350 Indiana Street, Suite 800, Golden, Colorado, USA 80401.
ITEM 14: MATERIAL CONTRACTS
The Issuer is not a party to a material contract that was not entered into in the ordinary course of its business or that is otherwise required to be filed under section 12.2 of National Instrument 51-102 ("NI 51-102") at the time this Annual Information Form is filed or would be required to be filed under section 12.2 of NI 51-102 at the time this Annual Information Form is filed but for the fact that it was previously filed, other than the Option Agreement between Seabridge Gold Inc. and RGLD Gold Canada, Inc. dated June 16, 2011 and described under “Description of the Issuer’s Business – KSM Project – Royalty Option”.
ITEM 15: INTERESTS OF EXPERTS
Michael Lechner, Dr. John Huang, Hassan Ghaffari, Jim Gray, W.N. Brazier, Greg McKillop, Harold Bosche, Graham Parkinson, Darby Kreitz, Robert Parolin, Warren Newcomen, Kevin Jones, Adrian Bodolan, Tysen Hantelmann, Pierre Pelletier, Cameron Clayton, Nigel Goldup and Dr. Adrian Chantler, each being companies or persons who have been named as having prepared or participated in preparing reports relating to the Issuer’s mineral properties referred to in this Annual Information Form or otherwise filed under NI 51-102 by the Issuer during, or relating to, the Issuer's most recently completed financial year or during the period thereafter to the date of this Annual Information Form, or any director, officer, employee or partner thereof, as applicable, received or has received a direct or indirect interest in the property of the Issuer or of any associate or affiliate of the Issuer. To the Issuer’s knowledge, as at the dates of their respective reports, the aforementioned persons, and the directors, officers, employees and partners, as applicable, of each of the aforementioned companies and partnerships beneficially own, directly or indirectly, in total, less than one percent of the securities of the Issuer and none of them have received securities of the Issuer from the Issuer since such dates.
Neither the aforementioned persons, nor any director, officer, employee or partner, as applicable, of the aforementioned companies or partnerships, is currently expected to be elected, appointed or employed as a director, officer or employee of the Issuer or of any associate or affiliate of the Issuer.
The auditors of the Issuer are KPMG LLP, Chartered Accountants, of Toronto, Ontario. KPMG LLP, Chartered Accountants, is independent within the meaning of the Rules of Professional Conduct of the Ontario Institute of Chartered Accountants. KPMG LLP is registered with the Public Company Accounting Oversight Board (United States).
ITEM 16: ADDITIONAL INFORMATION
Additional information relating to the Issuer may be found on SEDAR at www.sedar.com. The information available at www.sedar.com includes copies of the full text of all of the technical reports prepared for the Issuer in respect of the Issuer's properties described herein.
Additional information, including directors’ and officers’ remuneration and indebtedness, principal holders of the Issuer’s securities, and securities authorized for issuance under equity compensation plans, where applicable, is contained in the Issuer’s Information Circular for its most recent annual general meeting of securityholders that involved the election of directors.
Additional financial information is provided in the Issuer’s consolidated financial statements and management's discussion and analysis for the Issuer's most recent completed financial year.
SCHEDULE A
AUDIT COMMITTEE CHARTER
The Audit Committee of Seabridge is a committee of the Board composed entirely of three outside and unrelated directors. Its overall goal is to ensure that the Issuer adopts and follows a policy of full, plain, true and timely disclosure of material financial information to its stakeholders. It reviews all material matters affecting the risks and financial well being of the Issuer and is a key part of the Corporate Governance system. The Committee is mandated to satisfy the requirements of the Canada Business Corporations Act.
The Audit Committee meets at a minimum, quarterly and on such other occasions as required. The auditors are invited to attend the meetings called to discuss the annual audit plan and the final review of the year-end financial statements. At least annually, the Committee meets with the auditors to review management’s performance relating to financial reporting matters.
Specifically, the Committee:
| (a) | reviews the annual statements of the Issuer and makes recommendations to the Board with respect to these statements, |
| (b) | reviews the quarterly financial statements and makes recommendations to the Board regarding these financial statements, |
| (c) | reviews and approves financial information in all prospectuses, offering circulars, and similar documents, |
| (d) | oversees the adequacy and accuracy of the Issuer’s financial disclosure policies and obligations, |
| (e) | reviews significant accounting policies and estimates, |
| (f) | monitors the Issuer’s internal controls, financial systems and procedures, and management information systems, |
| (g) | oversees management’s reporting on internal control, |
| (h) | meets with the Issuer’s auditors to review management’s financial stewardship and to review their recommendations to management, and |
| (i) | recommends the appointment of auditors and reviews the terms of the audit engagement and the appropriateness of the proposed fee, |
| (j) | reviews through discussions or by way of a formal document the plan followed for the annual audit with the auditors and management, |
| (k) | evaluates the performance of the auditors, |
| (l) | confirms the independence of auditors, |
| (m) | establishes procedures for the receipt, retention and treatment of complaints received regarding accounting, internal accounting controls or auditing matters, and |
| (n) | establishes procedures for the confidential, anonymous submission by employees of concerns regarding questionable accounting or auditing matters. |