Management's discussion and analysis
February 10, 2016
This management's discussion and analysis (MD&A) contains information to help the reader make investment decisions about TransCanada Corporation. It discusses our business, operations, financial position, risks and other factors for the year ended December 31, 2015.
This MD&A should be read with our accompanying December 31, 2015 audited comparative consolidated financial statements and notes for the same period, which have been prepared in accordance with U.S. generally accepted accounting principles (GAAP).
Contents
|
| | | |
| ABOUT THIS DOCUMENT | 8 |
|
| ABOUT OUR BUSINESS | 12 |
|
| | • Three core businesses | 12 |
|
| | • Our strategy | 16 |
|
| | • Capital program | 17 |
|
| | • 2015 financial highlights | 19 |
|
| | • Outlook | 27 |
|
| NATURAL GAS PIPELINES | 29 |
|
| LIQUIDS PIPELINES | 47 |
|
| ENERGY | 57 |
|
| CORPORATE | 78 |
|
| FINANCIAL CONDITION | 82 |
|
| OTHER INFORMATION | 94 |
|
| | • Risks and risk management | 94 |
|
| | • Controls and procedures | 100 |
|
| | • Critical accounting estimates | 101 |
|
| | • Financial instruments | 104 |
|
| | • Accounting changes | 106 |
|
| | • Reconciliation of non-GAAP measures | 108 |
|
| | • Quarterly results | 111 |
|
| GLOSSARY | 118 |
|
|
| | |
| | | |
| | TransCanada Management's discussion and analysis 2015 7
|
About this document
Throughout this MD&A, the terms, we, us, our and TransCanada mean TransCanada Corporation and its subsidiaries. Abbreviations and acronyms that are not defined in the document are defined in the glossary on page 118. All information is as of February 10, 2016 and all amounts are in Canadian dollars, unless noted otherwise.
FORWARD-LOOKING INFORMATION
We disclose forward-looking information to help current and potential investors understand management's assessment of our future plans and financial outlook, and our future prospects overall.
Statements that are forward-looking are based on certain assumptions and on what we know and expect today and generally include words like anticipate, expect, believe, may, will, should, estimate or other similar words.
Forward-looking statements in this MD&A may include information about the following, among other things:
| |
| • | anticipated business prospects |
| |
| • | our financial and operational performance, including the performance of our subsidiaries |
| |
| • | expectations or projections about strategies and goals for growth and expansion |
| |
| • | expected cash flows and future financing options available to us |
| |
| • | expected costs for planned projects, including projects under construction and in development |
| |
| • | expected schedules for planned projects (including anticipated construction and completion dates) |
| |
| • | expected regulatory processes and outcomes |
| |
| • | expected common share purchases under our normal course issuer bid |
| |
| • | expected impact of regulatory outcomes |
| |
| • | expected outcomes with respect to legal proceedings, including arbitration and insurance claims |
| |
| • | expected capital expenditures and contractual obligations |
| |
| • | expected operating and financial results |
| |
| • | the expected impact of future accounting changes, commitments and contingent liabilities |
| |
| • | expected industry, market and economic conditions. |
Forward-looking statements do not guarantee future performance. Actual events and results could be significantly different because of assumptions, risks or uncertainties related to our business or events that happen after the date of this MD&A.
Our forward-looking information is based on the following key assumptions, and subject to the following risks and uncertainties:
Assumptions
| |
| • | inflation rates, commodity prices and capacity prices |
| |
| • | timing of financings and hedging |
| |
| • | regulatory decisions and outcomes |
| |
| • | planned and unplanned outages and the use of our pipeline and energy assets |
| |
| • | integrity and reliability of our assets |
| |
| • | access to capital markets |
| |
| • | anticipated construction costs, schedules and completion dates |
| |
| • | acquisitions and divestitures. |
|
| | |
| | | |
8 TransCanada Management's discussion and analysis 2015 | | |
Risks and uncertainties
| |
| • | our ability to successfully implement our strategic initiatives |
| |
| • | whether our strategic initiatives will yield the expected benefits |
| |
| • | the operating performance of our pipeline and energy assets |
| |
| • | amount of capacity sold and rates achieved in our pipeline businesses |
| |
| • | the availability and price of energy commodities |
| |
| • | the amount of capacity payments and revenues we receive from our energy business |
| |
| • | regulatory decisions and outcomes |
| |
| • | outcomes of legal proceedings, including arbitration and insurance claims |
| |
| • | performance and credit risk of our counterparties |
| |
| • | changes in market commodity prices |
| |
| • | changes in the political environment |
| |
| • | changes in environmental and other laws and regulations |
| |
| • | competitive factors in the pipeline and energy sectors |
| |
| • | construction and completion of capital projects |
| |
| • | costs for labour, equipment and materials |
| |
| • | access to capital markets |
| |
| • | interest, tax and foreign exchange rates |
| |
| • | technological developments |
| |
| • | economic conditions in North America as well as globally. |
You can read more about these factors and others in reports we have filed with Canadian securities regulators and the U.S. Securities and Exchange Commission (SEC).
As actual results could vary significantly from the forward-looking information, you should not put undue reliance on forward-looking information and should not use future-oriented information or financial outlooks for anything other than their intended purpose. We do not update our forward-looking statements due to new information or future events, unless we are required to by law.
FOR MORE INFORMATION
See Supplementary information beginning on page 184 for other consolidated financial information on TransCanada for the last five years.
You can also find more information about TransCanada in our annual information form and other disclosure documents, which are available on SEDAR (www.sedar.com).
|
| | |
| | | |
| | TransCanada Management's discussion and analysis 2015 9
|
NON-GAAP MEASURES
We use the following non-GAAP measures:
| |
| • | funds generated from operations |
| |
| • | distributable cash flow per common share |
| |
| • | comparable earnings per common share |
| |
| • | comparable distributable cash flow |
| |
| • | comparable distributable cash flow per common share |
| |
| • | comparable income from equity investments |
| |
| • | comparable depreciation and amortization |
| |
| • | comparable interest expense |
| |
| • | comparable interest income and other |
| |
| • | comparable income tax expense |
| |
| • | comparable income attributable to non-controlling interests. |
These measures do not have any standardized meaning as prescribed by U.S. GAAP and therefore may not be similar to measures presented by other entities.
EBITDA and EBIT
We use EBITDA as an approximate measure of our pre-tax operating cash flow. It measures our earnings before deducting financial charges, income tax, depreciation and amortization, net income attributable to non-controlling interests and preferred share dividends, and includes income from equity investments. EBIT measures our earnings from ongoing operations and is a useful measure of our performance and an effective tool for evaluating trends in each segment as it is equivalent to our segmented earnings.
Funds generated from operations
Funds generated from operations includes net cash provided by operations before changes in operating working capital. We believe it is a useful measure of our consolidated operating cash flow because it does not include fluctuations from working capital balances, which do not necessarily reflect underlying operations in the same period, and is used to provide a consistent measure of the cash generating performance of our assets. See the Financial condition section for a reconciliation to net cash provided by operations.
Distributable cash flow
Distributable cash flow is defined as funds generated from operations plus distributions in excess of equity earnings less preferred share dividends, distributions to non-controlling interests and maintenance capital expenditures. Maintenance capital expenditures represent costs which are necessary to preserve the operating ability of our assets and investments. We believe it is a useful supplemental measure of performance that defines cash available to common shareholders before capital allocation. See the Financial condition section for a reconciliation to net cash provided by operations.
|
| | |
| | | |
10 TransCanada Management's discussion and analysis 2015 | | |
Comparable measures
We calculate the comparable measures by adjusting certain GAAP and non-GAAP measures for specific items we believe are significant but not reflective of our underlying operations in the period. These comparable measures are calculated on a consistent basis from period to period and are adjusted for specific items in each period, as applicable.
|
| |
| Comparable measure | Original measure |
| | |
| comparable earnings | net income attributable to common shares |
| comparable earnings per common share | net income per common share |
| comparable EBITDA | EBITDA |
| comparable EBIT | segmented earnings |
| comparable distributable cash flow | distributable cash flow |
| comparable distributable cash flow per common share | distributable cash flow per common share |
| comparable income from equity investments | income from equity investments |
| comparable depreciation and amortization | depreciation and amortization |
| comparable interest expense | interest expense |
| comparable interest income and other | interest income and other |
| comparable income tax expense | income tax expense |
| comparable net income attributable to non-controlling interests | net income attributable to non-controlling interests |
Our decision not to adjust for a specific item is subjective and made after careful consideration. Specific items may include:
| |
| • | certain fair value adjustments relating to risk management activities |
| |
| • | income tax refunds and adjustments |
| |
| • | gains or losses on sales of assets |
| |
| • | legal, contractual and bankruptcy settlements |
| |
| • | impact of regulatory or arbitration decisions relating to prior year earnings |
| |
| • | impairment of assets and investments. |
In calculating comparable earnings and other comparable measures we exclude the unrealized gains and losses from changes in the fair value of certain derivatives used to reduce our exposure to certain financial and commodity price risks. These derivatives provide effective economic hedges, but do not meet the criteria for hedge accounting. As a result, the changes in fair value are recorded in net income. As these unrealized changes in fair value do not accurately reflect the gains and losses that will be realized at settlement, we do not consider them part of our underlying operations.
|
| | |
| | | |
| | TransCanada Management's discussion and analysis 2015 11
|
About our business
With over 65 years of experience, TransCanada is a leader in the responsible development and reliable operation of North American energy infrastructure including natural gas and liquids pipelines, power generation and natural gas storage facilities.
THREE CORE BUSINESSES
We operate our business in three segments – Natural Gas Pipelines, Liquids Pipelines and Energy. We also have a non-operational Corporate segment consisting of corporate and administrative functions that provide support and governance to our operational business segments.
Our $64 billion portfolio of energy infrastructure assets meets the needs of people who rely on us to deliver their energy safely and reliably every day. We operate in seven Canadian provinces, 36 U.S. states and Mexico.
|
| | |
| | | |
12 TransCanada Management's discussion and analysis 2015 | | |
|
| | |
| | | |
| | TransCanada Management's discussion and analysis 2015 13
|
Year at a glance
|
| | | | | | |
| at December 31 | | | | |
| (millions of $) | 2015 |
| | 2014 |
|
| | | | | |
| Total assets | | | | |
| Natural Gas Pipelines | | 31,072 |
| | 27,103 |
|
| Liquids Pipelines | | 16,046 |
| | 16,116 |
|
| Energy | | 15,558 |
| | 14,197 |
|
| Corporate | | 1,807 |
| | 1,109 |
|
| | | 64,483 |
| | 58,525 |
|

|
| | | | | | |
| year ended December 31 | | | | |
| (millions of $) | 2015 |
| | 2014 |
|
| | | | | |
| Total revenues | | | | |
| Natural Gas Pipelines | | 5,383 |
| | 4,913 |
|
| Liquids Pipelines | | 1,879 |
| | 1,547 |
|
| Energy | | 4,038 |
| | 3,725 |
|
| | | 11,300 |
| | 10,185 |
|
| | | | | |

|
| | | | | | |
| year ended December 31 | | | | |
| (millions of $) | 2015 |
| | 2014 |
|
| | | | | |
| Comparable EBIT | | | | |
| Natural Gas Pipelines | | 2,345 |
| | 2,178 |
|
| Liquids Pipelines | | 1,056 |
| | 843 |
|
| Energy | | 944 |
| | 1,039 |
|
| Corporate | | (202 | ) | | (150 | ) |
| | | 4,143 |
| | 3,910 |
|

|
| | | | |
| Common share price | Common shares outstanding – average |
| at December 31 | | | |
| (millions) | |
| |
| | | |
| 2015 | 709 |
| |
| 2014 | 708 |
| |
| 2013 | 707 |
| |
| | | |
|
| | |
| | | |
14 TransCanada Management's discussion and analysis 2015 | | |
|
| | | | |
| as at February 5, 2016 | issued and outstanding |
| |
|
| Common shares |
| | | |
| | 702 | million | |
|
| | | |
| Preferred shares | issued and outstanding |
| convertible to |
|
| | | |
| Series 1 | 9.5 | million | Series 2 preferred shares |
|
| Series 2 | 12.5 | million | Series 1 preferred shares |
|
| Series 3 | 8.5 | million | Series 4 preferred shares |
|
| Series 4 | 5.5 | million | Series 3 preferred shares |
|
| Series 5 | 12.7 | million | Series 6 preferred shares |
|
| Series 6 | 1.3 | million | Series 5 preferred shares |
|
| Series 7 | 24 | million | Series 8 preferred shares |
|
| Series 9 | 18 | million | Series 10 preferred shares |
|
| Series 11 | 10 | million | Series 12 preferred shares |
|
| | | |
| options to buy common shares | outstanding |
| exercisable |
|
| | | |
| | 10 | million | 6 | million |
|
| | |
| | | |
| | TransCanada Management's discussion and analysis 2015 15
|
OUR STRATEGY
Our energy infrastructure business is made up of pipeline and power generation assets that gather, transport, produce, store or deliver natural gas, crude oil and other petroleum products and electricity to support businesses and communities in North America.
Our vision is to be the leading energy infrastructure company in North America, focusing on pipeline and power generation opportunities in regions where we have or can develop a significant competitive advantage.
Key components of our strategy at a glance
|
| |
| 1 | Maximize the full-life value of our infrastructure assets and commercial positions |
| |
| | • Long-life infrastructure assets and long-term commercial arrangements are the cornerstones of our low-risk business model. • Our pipeline assets include large-scale natural gas and crude oil pipelines that connect long-life supply basins with stable and growing markets, generating predictable and sustainable cash flow and earnings. • In Energy, long-term power sale agreements and shorter-term power sales to wholesale and load customers are used to manage and optimize our portfolio and to manage price volatility. |
| 2 | Commercially develop and build new asset investment programs |
| |
| | • We are developing high quality, long-life assets under our current $58 billion capital program, comprised of $13 billion in near-term projects and $45 billion in medium to long-term projects. These will contribute incremental earnings over the near, medium and long terms as our investments are placed in service. • Our expertise in managing construction risks and maximizing capital productivity ensures a disciplined approach to reliability, cost and schedule, resulting in superior service for our customers and returns to shareholders. • As part of our growth strategy, we rely on this experience and our regulatory, commercial, financial, legal and operational expertise to successfully build and integrate new energy and pipeline facilities. • Our growing investment in natural gas, nuclear, wind, hydro and solar generating facilities demonstrates our commitment to clean, sustainable energy. |
| 3 | Cultivate a focused portfolio of high quality development and investment options |
| |
| | • We assess opportunities to acquire and develop energy infrastructure that complements our existing portfolio and diversifies access to attractive supply and market regions. • We focus on pipelines and energy growth initiatives in core regions of North America and prudently manage development costs, minimizing capital-at-risk in early stages of projects. • We will advance selected opportunities to full development and construction when market conditions are appropriate and project risks and returns are acceptable. |
| 4 | Maximize our competitive strengths |
| |
| | • We are continually developing core competencies in areas such as operational excellence, supply chain management, project execution and stakeholder management to ensure we provide maximum shareholder value over the short, medium and long terms. |
|
| | |
| | A competitive advantage | |
| | Years of experience in the energy infrastructure business and a disciplined approach to project and operational management and capital investment give us our competitive edge. • Strong leadership: scale, presence, operating capabilities and strategy development; expertise in regulatory, legal, commercial and financing support. • High quality portfolio: a low-risk and enduring business model that maximizes the full-life value of our long-life assets and commercial positions throughout all business cycles. • Disciplined operations: highly skilled in designing, building and operating energy infrastructure; focus on operational excellence; and a commitment to health, safety and the environment are paramount parts of our core values. • Financial positioning: excellent reputation for consistent financial performance and long-term financial stability and profitability; disciplined approach to capital investment; ability to access sizable amounts of competitively priced capital to support our growth; ability to balance an increasing dividend on our common shares while preserving financial flexibility to fund our industry-leading capital program in all market conditions. • Long-term relationships: long-term, transparent relationships with key customers and stakeholders; clear communication of our value to equity and debt investors – both the upside and the risks – to build trust and support. | |
|
| | |
| | | |
16 TransCanada Management's discussion and analysis 2015 | | |
CAPITAL PROGRAM
We are developing quality projects under our long-term capital program. These long-life infrastructure assets are supported by long-term commercial arrangements with creditworthy counterparties or regulated business models and are expected to generate significant growth in earnings and cash flow.
Our capital program consists of $13 billion of near-term projects and $45 billion of commercially secured medium and longer-term projects. Amounts presented exclude the impact of foreign exchange, capitalized interest and AFUDC.
All projects are subject to cost adjustments due to market conditions, route refinement, permitting conditions, scheduling and timing of regulatory permits.
|
| | | | | | |
| at December 31, 2015 | | Estimated project cost |
| | Carrying value |
|
| (billions of $) |
| Summary | | | | |
| Near-term | | 13.4 |
| | 3.9 |
|
| Medium to longer-term | | 45.2 |
| | 2.1 |
|
| Total capital program | | 58.6 |
| | 6.0 |
|
| | | | | |
Foreign exchange impact on Capital Program1 | | 4.5 |
| | 0.8 |
|
| |
1 | Reflects U.S. foreign exchange rate of $1.38 at December 31, 2015. |
Near-term projects |
| | | | | | | | | | |
| at December 31, 2015 | | Segment | | Expected
in-service date | | Estimated project cost |
| | Carrying value |
|
| (billions of $) |
| | | | | | | | | |
| Ironwood Acquisition | | Energy | | 2016 | | US 0.7 |
| | — |
|
| Houston Lateral and Terminal | | Liquids Pipelines | | 2016 | | US 0.6 |
| | US 0.5 |
|
| Topolobampo | | Natural Gas Pipelines | | 2016 | | US 1.0 |
| | US 0.9 |
|
| Mazatlan | | Natural Gas Pipelines | | 2016 | | US 0.4 |
| | US 0.3 |
|
Grand Rapids Phase 11 | | Liquids Pipelines | | 2017 | | 0.9 |
| | 0.5 |
|
| Northern Courier | | Liquids Pipelines | | 2017 | | 1.0 |
| | 0.6 |
|
| Tuxpan-Tula | | Natural Gas Pipelines | | 2017 | | US 0.5 |
| | — |
|
Canadian Mainline – Other | | Natural Gas Pipelines | | 2016–2017 | | 0.7 |
| | 0.1 |
|
NGTL System – North Montney | | Natural Gas Pipelines | | 2017 | | 1.7 |
| | 0.3 |
|
– 2016/17 Facilities | | Natural Gas Pipelines | | 2016–2018 | | 2.7 |
| | 0.3 |
|
– 2018 Facilities | | Natural Gas Pipelines | | 2018 | | 0.6 |
| | — |
|
– Other | | Natural Gas Pipelines | | 2016–2017 | | 0.4 |
| | 0.1 |
|
| Napanee | | Energy | | 2017 or 2018 | | 1.0 |
| | 0.3 |
|
Bruce Power – life extension1 | | Energy | | 2016–2020 | | 1.2 |
| | — |
|
| Total near-term projects | | | | | | 13.4 |
| | 3.9 |
|
| |
1 | Our proportionate share. |
|
| | |
| | | |
| | TransCanada Management's discussion and analysis 2015 17
|
Medium to longer-term projects
The medium to longer-term projects have greater uncertainty with respect to timing and estimated project costs. The expected in-service dates of these projects are 2019 and beyond, and costs provided in the schedule below reflect the most recent costs for each project as filed with the various regulatory authorities or otherwise disclosed. These projects have all been commercially secured but are subject to approvals that include sponsor FID and/or complex regulatory processes. Please refer to the Significant events section in each Business Segment for further information on each of these projects.
|
| | | | | | | | |
| at December 31, 2015 | | Segment | | Estimated project cost |
| | Carrying value |
|
| (billions of $) |
| | | | | | | |
| Heartland and TC Terminals | | Liquids Pipelines | | 0.9 |
| | 0.1 |
|
| Upland | | Liquids Pipelines | | US 0.6 |
| | — |
|
Grand Rapids Phase 21 | | Liquids Pipelines | | 0.7 |
| | — |
|
Bruce Power – life extension1 | | Energy | | 5.3 |
| | — |
|
| Keystone projects | | | | | | |
Keystone XL2 | | Liquids Pipelines | | US 8.0 |
| | US 0.4 |
|
Keystone Hardisty Terminal2 | | Liquids Pipelines | | 0.3 |
| | 0.1 |
|
| Energy East projects | | | | | | |
Energy East3 | | Liquids Pipelines | | 15.7 |
| | 0.7 |
|
| Eastern Mainline Project | | Natural Gas Pipelines | | 2.0 |
| | 0.1 |
|
| BC west coast LNG-related projects | | | | | | |
| Coastal GasLink | | Natural Gas Pipelines | | 4.8 |
| | 0.3 |
|
| Prince Rupert Gas Transmission | | Natural Gas Pipelines | | 5.0 |
| | 0.4 |
|
| NGTL System – Merrick | | Natural Gas Pipelines | | 1.9 |
| | — |
|
| Total medium to longer-term projects | | | | 45.2 |
| | 2.1 |
|
| |
1 | Our proportionate share. |
| |
2 | Carrying value reflects amount remaining after impairment charge. |
| |
3 | Excludes transfer of Canadian Mainline natural gas assets. |
|
| | |
| | | |
18 TransCanada Management's discussion and analysis 2015 | | |
2015 FINANCIAL HIGHLIGHTS
We use certain financial measures that do not have a standardized meaning under GAAP because we believe they improve our ability to compare results between reporting periods and enhance understanding of our operating performance. Known as non-GAAP measures, they may not be similar to measures provided by other companies.
Comparable EBITDA (comparable earnings before interest, taxes, depreciation and amortization), comparable EBIT (comparable earnings before interest and taxes), comparable earnings, comparable earnings per common share, funds generated from operations, comparable distributable cash flow and comparable distributable cash flow per common share are all non-GAAP measures. See page 10 for more information about the non-GAAP measures we use and pages 84 and 108 for a reconciliation to their GAAP equivalents.
|
| | | | | | | | | | | | |
| year ended December 31 | | | | | | |
| (millions of $, except per share amounts) | | 2015 |
| | 2014 |
| | 2013 |
|
| | | | | | | |
| Income | | | | | | |
| Revenues | | 11,300 |
| | 10,185 |
| | 8,797 |
|
| Net (loss)/income attributable to common shares | | (1,240 | ) | | 1,743 |
| | 1,712 |
|
| per common share – basic & diluted | |
| ($1.75 | ) | |
| $2.46 |
| |
| $2.42 |
|
| Comparable EBITDA | | 5,908 |
| | 5,521 |
| | 4,859 |
|
| Comparable earnings | | 1,755 |
| | 1,715 |
| | 1,584 |
|
| per common share | |
| $2.48 |
| |
| $2.42 |
| |
| $2.24 |
|
| | | | | | | |
| Cash flows | | | | | | |
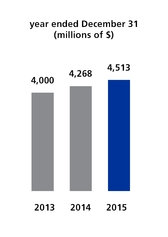
| Funds generated from operations | | 4,513 |
| | 4,268 |
| | 4,000 |
|
| Increase in working capital | | (398 | ) | | (189 | ) | | (326 | ) |
| Net cash provided by operations | | 4,115 |
| | 4,079 |
| | 3,674 |
|
| | | | | | | |
| Comparable distributable cash flow | | 3,546 |
| | 3,406 |
| | 3,234 |
|
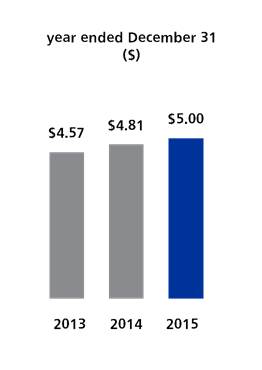
| per common share | | $5.00 | | $4.81 | | $4.57 |
| | | | | | | |
| Capital spending – capital expenditures | | 3,918 |
| | 3,489 |
| | 4,264 |
|
| Capital spending – projects in development | | 511 |
| | 848 |
| | 488 |
|
| Contributions to equity investments | | 493 |
| | 256 |
| | 163 |
|
| Acquisitions, net of cash acquired | | 236 |
| | 241 |
| | 216 |
|
| Proceeds from sale of assets, net of transaction costs | | — |
| | 196 |
| | — |
|
| | | | | | | |
| Balance sheet | | | | | | |
| Total assets | | 64,483 |
| | 58,525 |
| | 53,898 |
|
| Long-term debt | | 31,584 |
| | 24,757 |
| | 22,865 |
|
| Junior subordinated notes | | 2,422 |
| | 1,160 |
| | 1,063 |
|
| Preferred shares | | 2,499 |
| | 2,255 |
| | 1,813 |
|
| Non-controlling interests | | 1,717 |
| | 1,583 |
| | 1,611 |
|
| Common shareholders' equity | | 13,939 |
| | 16,815 |
| | 16,712 |
|
| | | | | | | |
| Dividends declared | | | | | | |
| per common share | |
| $2.08 |
| |
| $1.92 |
| |
| $1.84 |
|
| per Series 1 preferred share | |
| $0.8165 |
| |
| $1.15 |
| |
| $1.15 |
|
per Series 2 preferred share1 | |
| $0.6299 |
| | — |
| | — |
|
| per Series 3 preferred share | |
| $0.769 |
| |
| $1.00 |
| |
| $1.00 |
|
per Series 4 preferred share2 | |
| $0.2269 |
| | — |
| | — |
|
| per Series 5 preferred share | |
| $1.10 |
| |
| $1.10 |
| |
| $1.10 |
|
| per Series 7 preferred share | |
| $1.00 |
| |
| $1.00 |
| | $0.91 |
per Series 9 preferred share3 | |
| $1.0625 |
| | $1.09 | | — |
|
per Series 11 preferred share4 | |
| $0.704 |
| | — |
| | — |
|
| |
1 | Issued December 2014 upon conversion of Series 1 preferred shares. |
| |
2 | Issued June 2015 upon conversion of Series 3 preferred shares. |
|
| | |
| | | |
| | TransCanada Management's discussion and analysis 2015 19
|
Consolidated results
|
| | | | | | | | | | | | |
| year ended December 31 | | | | | | |
| (millions of $, except per share amounts) | | 2015 |
| | 2014 |
| | 2013 |
|
| | | | | | | |
| Segmented earnings/(losses) | | | | | | |
| Natural Gas Pipelines | | 2,220 |
| | 2,187 |
| | 1,881 |
|
| Liquids Pipelines | | (2,630 | ) | | 843 |
| | 603 |
|
| Energy | | 812 |
| | 1,051 |
| | 1,113 |
|
| Corporate | | (301 | ) | | (150 | ) | | (124 | ) |
| Total segmented earnings | | 101 |
| | 3,931 |
| | 3,473 |
|
| Interest expense | | (1,370 | ) | | (1,198 | ) | | (985 | ) |
| Interest income and other | | 163 |
| | 91 |
| | 34 |
|
| (Loss)/income before income taxes | | (1,106 | ) | | 2,824 |
| | 2,522 |
|
| Income tax expense | | (34 | ) | | (831 | ) | | (611 | ) |
| Net (loss)/income | | (1,140 | ) | | 1,993 |
| | 1,911 |
|
| Net income attributable to non-controlling interests | | (6 | ) | | (153 | ) | | (125 | ) |
| Net (loss)/income attributable to controlling interests | | (1,146 | ) | | 1,840 |
| | 1,786 |
|
| Preferred share dividends | | (94 | ) | | (97 | ) | | (74 | ) |
| Net (loss)/income attributable to common shares | | (1,240 | ) | | 1,743 |
| | 1,712 |
|
| Net (loss)/income per common share - basic and diluted | |
| ($1.75 | ) | |
| $2.46 |
| |
| $2.42 |
|
|
| | | |
| Net (loss)/income attributable to common shares | | Net (loss)/income per share | |
| | | |
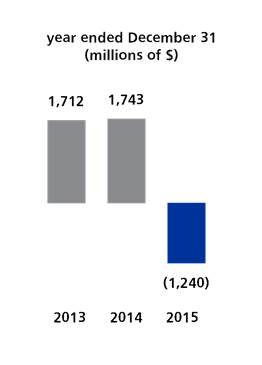
Net (loss)/income attributable to common shares in 2015 was a loss of $1,240 million (2014 – income of $1,743 million; 2013 –income of $1,712 million). The following specific items were recognized in net (loss)/income attributable to common shares in 2013 to 2015 and were excluded from comparable earnings for the relevant periods:
2015
| |
| • | a $2,891 million after-tax impairment charge on the carrying value of our investment in Keystone XL and related projects |
| |
| • | an $86 million after-tax loss provision related to the sale of TC Offshore expected to close in early 2016 |
| |
| • | a net charge of $74 million after tax for restructuring charges comprised of $42 million mainly related to 2015 severance costs and a provision of $32 million for 2016 planned severance costs and expected future losses under lease commitments. These charges form part of a restructuring initiative, which commenced in 2015 to maximize the effectiveness and efficiency of our existing operations and reduce overall costs |
| |
| • | a $43 million after-tax charge relating to an impairment in value on turbine equipment held for future use in our Energy business |
|
| | |
| | | |
20 TransCanada Management's discussion and analysis 2015 | | |
| |
| • | a $34 million adjustment to income tax expense due to the enactment of a two per cent increase in the Alberta corporate income tax rate in June 2015 |
| |
| • | a charge of $27 million after tax related to Bruce Power's retirement of debt in conjunction with the merger of the Bruce A and Bruce B partnerships |
| |
| • | a $199 million positive income adjustment related to the impact on our net income from non-controlling interests of TC PipeLines, LP's impairment of their equity investment in Great Lakes. |
2014
| |
| • | a gain of $99 million after tax on the sale of Cancarb Limited and its related power generation business |
| |
| • | a net loss of $32 million after tax resulting from a termination payment to Niska Gas Storage for contract restructuring |
| |
| • | a gain of $8 million after tax on the sale of our 30 per cent interest in Gas Pacifico/INNERGY. |
2013
| |
| • | net income of $84 million recorded in 2013 related to 2012 from the NEB 2013 decision on the Canadian Restructuring Proposal (NEB 2013 Decision) |
| |
| • | a favourable tax adjustment of $25 million due to the enactment of Canadian Federal tax legislation relating to Part VI.I tax. |
Certain unrealized fair value adjustments relating to risk management activities are also excluded from comparable earnings. The remainder of net (loss)/income is equivalent to comparable earnings. A reconciliation of net (loss)/income attributable to common shares to comparable earnings is shown in the following table.
Refer to the Results section in each business segment and the Financial condition section of this MD&A for further discussion of these highlights.
|
| | |
| | | |
| | TransCanada Management's discussion and analysis 2015 21
|
Reconciliation of net (loss)/income to comparable earnings
|
| | | | | | | | | | |
| year ended December 31 | | | | | | |
| (millions of $, except per share amounts) | | 2015 |
| | 2014 |
| | 2013 |
|
| | | | | | | |
| Net (loss)/income attributable to common shares | | (1,240 | ) | | 1,743 |
| | 1,712 |
|
| Specific items (net of tax): | | | | | | |
| Keystone XL impairment charge | | 2,891 |
| | — |
| | — |
|
| TC Offshore loss on sale | | 86 |
| | — |
| | — |
|
| Restructuring costs | | 74 |
| | — |
| | — |
|
| Turbine equipment impairment charge | | 43 |
| | — |
| | — |
|
| Alberta corporate income tax rate increase | | 34 |
| | — |
| | — |
|
| Bruce Power merger – debt retirement charge | | 27 |
| | — |
| | — |
|
| Non-controlling interests (TC PipeLines, LP – Great Lakes impairment) | | (199 | ) | | — |
| | — |
|
| Cancarb gain on sale | | — |
| | (99 | ) | | — |
|
| Niska contract termination | | — |
| | 32 |
| | — |
|
| Gas Pacifico/ INNERGY gain on sale | | — |
| | (8 | ) | | — |
|
| NEB 2013 Decision – 2012 | | — |
| | — |
| | (84 | ) |
| Part VI.I income tax adjustment | | — |
| | — |
| | (25 | ) |
Risk management activities1 | | 39 |
| | 47 |
| | (19 | ) |
| Comparable earnings | | 1,755 |
| | 1,715 |
| | 1,584 |
|
| | | | | | | |
| Net (loss)/income per common share | |
| ($1.75 | ) | | $2.46 | | $2.42 |
| Specific items (net of tax): | | | | | | |
| Keystone XL impairment charge | | 4.08 |
| | — |
| | — |
|
| TC Offshore loss on sale | | 0.12 |
| | — |
| | — |
|
| Restructuring costs | | 0.10 |
| | — |
| | — |
|
| Turbine equipment impairment charge | | 0.06 |
| | — |
| | — |
|
| Alberta corporate income tax rate increase | | 0.05 |
| | — |
| | — |
|
| Bruce Power merger – debt retirement charge | | 0.04 |
| | — |
| | — |
|
| Non-controlling interests (TC PipeLines, LP – Great Lakes impairment) | | (0.28 | ) | | — |
| | — |
|
| Cancarb gain on sale | | — |
| | (0.14 | ) | | — |
|
| Niska contract termination | | — |
| | 0.04 |
| | — |
|
| Gas Pacifico/ INNERGY gain on sale | | — |
| | (0.01 | ) | | — |
|
| NEB 2013 Decision – 2012 | | — |
| | — |
| | (0.12 | ) |
| Part VI.I income tax adjustment | | — |
| | — |
| | (0.04 | ) |
| Risk management activities | | 0.06 |
| | 0.07 |
| | (0.02 | ) |
| Comparable earnings per common share | | $2.48 | | $2.42 | | $2.24 |
|
| | | | | | | | | | | |
1 | | year ended December 31 | | | | | | |
| | | (millions of $) | | 2015 |
| | 2014 |
| | 2013 |
|
| | | | | | | | | |
| | | Canadian Power | | (8 | ) | | (11 | ) | | (4 | ) |
| | | U.S. Power | | (30 | ) | | (55 | ) | | 50 |
|
| | | Natural Gas Storage | | 1 |
| | 13 |
| | (2 | ) |
| | | Foreign exchange | | (21 | ) | | (21 | ) | | (9 | ) |
| | | Income tax attributable to risk management activities | | 19 |
| | 27 |
| | (16 | ) |
| | | Total (losses)/gains from risk management activities | | (39 | ) | | (47 | ) | | 19 |
|
|
| | |
| | | |
22 TransCanada Management's discussion and analysis 2015 | | |
|
| | | |
| Comparable earnings | | Comparable earnings per share | |
| | | |
Comparable earnings in 2015 were $40 million higher than in 2014, an increase of $0.06 per common share.
The increase in comparable earnings was primarily the net result of:
| |
| • | higher earnings from Liquids Pipelines due to higher volumes on the Keystone Pipeline System |
| |
| • | lower earnings from Western Power as a result of lower realized power prices and lower PPA volumes |
| |
| • | higher interest expense as a result of long term debt issuances net of maturities |
| |
| • | higher interest income and other as a result of increased AFUDC related to our rate-regulated pipeline projects including Energy East Pipeline and our Mexico pipelines |
| |
| • | higher earnings from U.S. Power due to increased margins and sales volumes to wholesale, commercial and industrial customers, partially offset by lower capacity revenue in New York and lower realized prices at our northeastern U.S. Power facilities |
| |
| • | higher earnings from U.S. Natural Gas Pipelines due to higher ANR, Great Lakes and GTN transportation revenues |
| |
| • | higher earnings from Eastern Power primarily due to four solar facilities acquired in 2014 |
| |
| • | higher earnings from the Tamazunchale Extension which was placed in service in 2014. |
The stronger U.S. dollar in 2015 compared to 2014 positively impacted the translated results in our U.S. businesses, however, this impact was partially offset by a corresponding increase in interest expense on U.S. dollar-denominated debt as well as realized losses on foreign exchange hedges used to manage our exposure.
Comparable earnings in 2014 were $131 million higher than 2013, an increase of $0.18 per common share.
The increase in comparable earnings was primarily the net result of:
| |
| • | incremental earnings from the Gulf Coast extension of the Keystone Pipeline System which was placed in service in January 2014 |
| |
| • | higher interest expense from debt issuances and lower capitalized interest due to projects placed in service |
| |
| • | lower earnings from Western Power as a result of lower realized power prices |
| |
| • | higher earnings from the Tamazunchale Extension which was placed in service in 2014 |
| |
| • | higher earnings from U.S. Natural Gas Pipelines due to higher transportation revenues at Great Lakes reflecting colder winter weather and increased demand, partially offset by lower contributions from GTN and Bison following the reductions in our effective ownership in July 2013 (GTN and Bison) and October 2014 (Bison) |
| |
| • | higher earnings from U.S. Power mainly because of higher realized capacity prices in New York and higher realized power prices at our New York and New England facilities |
| |
| • | higher earnings from the Canadian Mainline due to higher incentive earnings |
| |
| • | incremental earnings from Eastern Power primarily due to solar facilities acquired in 2013 and 2014. |
|
| | |
| | | |
| | TransCanada Management's discussion and analysis 2015 23
|
Cash flows
Funds generated from operations
Funds generated from operations were six per cent higher in 2015 compared to 2014 primarily due to higher comparable earnings, as described above.
|
| | | |
| Comparable distributable cash flow | | Comparable distributable cash flow per share | |
| | | |
Comparable distributable cash flow and comparable distributable cash flow per common share increased in 2015 compared to 2014 primarily due to higher comparable earnings, as described above. See the Financial condition section for more information on the calculation of comparable distributable cash flow.
|
| | |
| | | |
24 TransCanada Management's discussion and analysis 2015 | | |
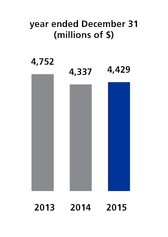
Funds used in investing activities
Capital spending1
|
| | | | | | | | | |
| year ended December 31 | | | | | | |
| (millions of $) | | 2015 |
| | 2014 |
| | 2013 |
|
| | | | | | | |
| Natural Gas Pipelines | | 2,699 |
| | 2,136 |
| | 2,021 |
|
| Liquids Pipelines | | 1,290 |
| | 1,949 |
| | 2,529 |
|
| Energy | | 376 |
| | 206 |
| | 152 |
|
| Corporate | | 64 |
| | 46 |
| | 50 |
|
| | | 4,429 |
| | 4,337 |
| | 4,752 |
|
Capital spending
We invested $4.4 billion in capital projects in 2015 as part of our ongoing growth program which is a key part of our strategy to optimize the value of our existing assets and develop new, complementary assets in high demand areas that are expected to generate stable, predictable earnings and cash flow and to maximize returns to shareholders for years to come.
Contributions to equity investments and acquisitions
In 2015, we made contributions of $493 million to our equity investments primarily related to the construction of Grand Rapids and we spent $236 million to increase our ownership in Bruce Power.
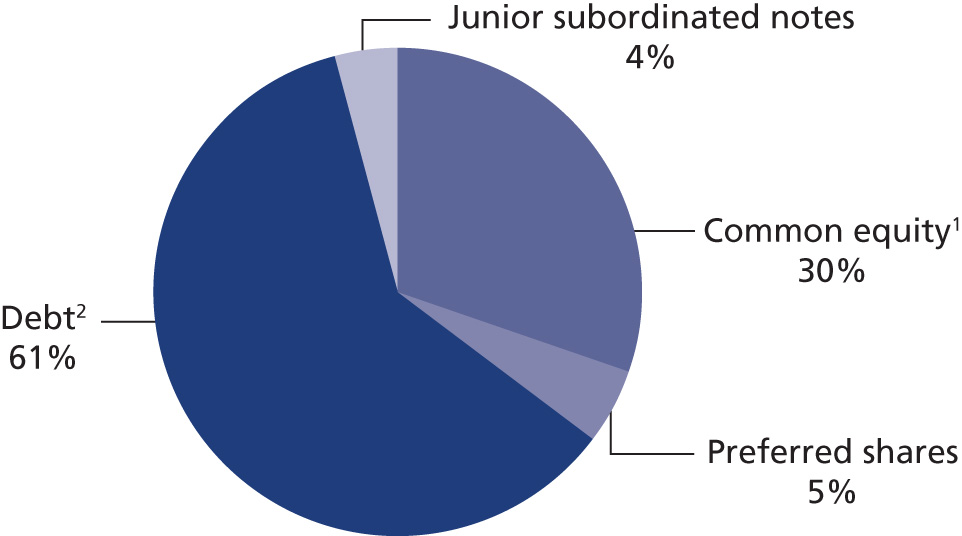
Balance sheet
We continue to maintain a solid balance sheet while growing our total assets by $10.6 billion since 2013. At December 31, 2015, common equity represented 30 per cent (38 per cent in 2014) of our capital structure, after giving effect to the various 2015 specific items outlined on pages 20 and 21. See page 83 for more information about our capital structure.
Common shares repurchased
On November 19, 2015, we announced that the Toronto Stock Exchange (TSX) approved our normal course issuer bid (NCIB), which allows for the repurchase and cancellation of up to 21.3 million of our common shares, representing three per cent of our issued and outstanding common shares, between November 23, 2015 and November 22, 2016, at prevailing market prices plus brokerage fees, or such other prices as may be permitted by the TSX.
As of February 10, 2016, we repurchased 7.1 million common shares at an weighted-average price per common share of $43.36 for a total cost of $307 million.
|
| | |
| | | |
| | TransCanada Management's discussion and analysis 2015 25
|
Dividends
We increased the quarterly dividend on our outstanding common shares by nine per cent to $0.565 per common share for the quarter ending March 31, 2016 which equates to an annual dividend of $2.26 per common share and reflects our commitment to grow our common share dividend at an average annual rate of eight to ten per cent through 2020. This is the 16th consecutive year we have increased the dividend on our common shares.
Dividends declared per common share
Dividend reinvestment plan
Under our dividend reinvestment plan (DRP), eligible holders of TransCanada common or preferred shares can reinvest their dividends and make optional cash payments to buy additional TransCanada common shares on the open market.
Quarterly dividend on our common shares
$0.565 per common share (for the quarter ending March 31, 2016)
Annual dividends on our preferred shares1
Series 1 $0.81652
Series 2 $0.60453
Series 3 $0.5384
Series 4 $0.44453
Series 5 $0.565755
Series 6 $0.509256
Series 7 $1.00
Series 9 $1.0625
Series 11 $0.95
| |
1 | Annual dividend based on applicable annual or quarterly floating rate as of February 10, 2016. |
| |
2 | Dividend rate changed in December 2014. |
| |
3 | Floating quarterly dividend rate resets each quarter. See the Financial condition section for more information. |
| |
4 | Series 3 preferred shares dividend rate changed in June 2015. |
| |
5 | Series 5 preferred shares dividend rate changed in February 2016. |
| |
6 | Series 6 preferred shares were issued February 1, 2016. |
Cash dividends
|
| | | | | | | | | |
| year ended December 31 | | | | | | |
| (millions of $) | | 2015 |
| | 2014 |
| | 2013 |
|
| | | | | | | |
| Common shares | | 1,446 |
| | 1,345 |
| | 1,285 |
|
| Preferred shares | | 92 |
| | 94 |
| | 71 |
|
|
| | |
| | | |
26 TransCanada Management's discussion and analysis 2015 | | |
OUTLOOK
Earnings
We anticipate our 2016 earnings, after excluding specific items, to be higher than 2015 mainly due to the following:
| |
| • | Expected earnings from Topolobampo and Mazatlan Pipeline projects coming into service |
| |
| • | Positive impact of a stronger U.S. dollar on U.S. denominated earnings |
| |
| • | Increase in the average investment base for the NGTL System |
| |
| • | Higher earnings associated with incremental contracts from ANR |
| |
| • | Cost savings achieved as a result of corporate restructuring |
| |
| • | Consistent earnings in Energy with higher earnings in U.S. Power, relatively consistent earnings in Western Power and Bruce Power and slightly lower earnings in Eastern Power. |
Partially offset by:
| |
| • | Reduced capitalized interest due to the Keystone XL Pipeline project Presidential permit denial |
| |
| • | Lower anticipated earnings from the Keystone Pipeline System based on expiring short-term contracts for Cushing Marketlink. |
Natural Gas Pipelines
Earnings from the Natural Gas Pipelines segment are affected by regulatory decisions and the timing of these decisions. Earnings are also impacted by market conditions, which drive the level of demand and the rates we secure for our services.
Canadian Mainline earnings are anticipated to be lower in 2016 due to a declining investment base. These lower earnings are expected to be largely offset by growth in the NGTL System investment base as we continue to invest in connecting new natural gas supply and respond to growing demand in the northeastern B.C. and Alberta markets.
U.S. and International Gas Pipelines earnings in 2016 are expected to be higher than 2015 as we pursue opportunities for continued growth in end use markets for natural gas and evaluate our commercial and operational positions in ANR and Great Lakes in response to positive developments in supply fundamentals in those market areas. On January 29th, 2016, ANR filed a Section 4 Rate Case with the FERC to increase its base rates. We anticipate that the proposed rates, which are subject to customer refund and pending final FERC approval, will take effect in third quarter 2016.
Mexico Pipeline earnings are expected to be higher in 2016 as the Topolobampo and Mazatlan Pipeline projects come into service in late 2016.
Liquids Pipelines
With the exception of the Keystone XL impairment impact, our 2016 earnings are expected to be slightly lower than our 2015 earnings due to short term contract expiration and market conditions related to the lower crude oil price environment.
Energy
Earnings in the Energy segment are generally maximized by maintaining and optimizing the operations of our power plants and through various marketing activities. Although a significant portion of Energy’s output is sold under long-term contracts, output that is sold under shorter-term arrangements or at spot prices will continue to be affected by fluctuations in commodity prices. Overall we expect Energy earnings in 2016 to be consistent with 2015.
Western Power earnings in 2016 are anticipated to be consistent with 2015 as a result of a well-supplied Alberta power market, slower demand growth and lower natural gas prices. Negative pressure on earnings in 2016 is expected due to the increase in the government imposed emissions reductions targets and higher per tonne GHG emissions costs.
Eastern Power earnings in 2016 are expected to be slightly lower as a result of the lower contractual earnings at Bécancour and reduced earnings from the sale of unused natural gas transportation.
Bruce Power equity income in 2016 is expected to be consistent with 2015 results. The net impact of the additional ownership interest obtained in Bruce Power in 2015 is anticipated to be largely offset by the increased planned maintenance activity in 2016.
U.S. Power results in 2016 are expected to be higher than 2015 due to the net impact of the additional earnings from the acquisition of the Ironwood natural gas fired, combined cycle power plant and lower marketing margins reflecting the return to normalized levels of costs and decreased volatility of forward natural gas and power prices in the New England market.
Natural Gas Storage earnings are expected to be higher as a modest recovery of seasonal spreads is expected to occur in 2016.
|
| | |
| | | |
| | TransCanada Management's discussion and analysis 2015 27
|
Consolidated capital spending, equity investments and acquisition
We expect to spend approximately $6 billion in 2016 on new and existing capital projects. Capital spending includes capital expenditures on growth projects, maintenance capital expenditures and contributions to equity investments. The 2016 capital spending relates to Natural Gas Pipelines projects including NGTL System expansion, the Canadian Mainline, Tuxpan-Tula and Topolobampo; Liquids Pipelines projects including Grand Rapids, Northern Courier and Energy East; and Energy projects including Bruce Power and Napanee. Additionally, on February 1, 2016 we acquired Ironwood Power Plant for approximately US$657 million before post closing adjustments.
|
| | |
| | | |
28 TransCanada Management's discussion and analysis 2015 | | |
Natural Gas Pipelines
Our natural gas pipeline network transports natural gas to local distribution companies, power generation facilities and other businesses across Canada, the U.S. and Mexico. We serve more than 80 per cent of the Canadian demand and approximately 15 per cent of the U.S. demand on a daily basis by connecting major natural gas supply basins and markets through:
| |
| • | wholly-owned natural gas pipelines – 56,600 km (35,200 miles) |
| |
| • | partially-owned natural gas pipelines – 10,700 km (6,700 miles). |
We also have regulated natural gas storage facilities in Michigan with a total capacity of 250 Bcf, making us one of the largest providers of natural gas storage and related services in North America.
|
|
| Strategy at a glance |
| Optimizing the value of our existing natural gas pipelines systems, while responding to the changing flow patterns of natural gas in North America, is a top priority. |
| We are also pursuing new pipeline opportunities to add incremental value to our business. Our key areas of focus include: |
• greenfield development projects, such as infrastructure for liquefied natural gas (LNG) exports from the west coast of Canada and the Gulf of Mexico • additional new pipeline developments within Mexico |
| • connections to emerging Canadian and U.S. shale gas and other supplies |
| • connections to new and growing markets |
| all of which play a critical role in meeting the transportation requirements for supply and demand for natural gas in North America. |
Highlights from 2015
| |
| • | We were awarded the contract to build, own and operate the 36-inch diameter Tuxpan-Tula pipeline in Mexico which is approximately 250 km (155 miles) long and has a contracted capacity of 866 MMcf/d. The pipeline is expected to begin construction in 2016 and be in-service in fourth quarter 2017. |
| |
| • | The NEB approved the NGTL System’s $1.7 billion North Montney Mainline Project on June 11, 2015. Construction remains subject to a positive FID on the proposed Pacific Northwest LNG Project. |
| |
| • | The NEB approved the Canadian Mainline's compliance filing on the NEB 2014 Decision as applied for. The approval was the last step in getting the NEB 2014 Decision implemented and allowing the Canadian Mainline to recognize incentive earnings. |
| |
| • | The NEB approved the Kings North Connection project on the Canadian Mainline which will increase gas transmission capacity into the greater Toronto area and provide shippers with the flexibility to source growing supplies of Marcellus gas from the U.S. Northeast. |
| |
| • | An agreement was reached with eastern LDCs that resolves their issues with Energy East and the Eastern Mainline Project. The agreement honours our previously stated commitment to ensure that Energy East and the Canadian Mainline's Eastern Mainline Project will provide gas consumers in Eastern Canada with sufficient natural gas transmission capacity and reduced natural gas transmission costs. |
| |
| • | We continued the drop down of U.S. natural gas pipeline assets into TC PipeLines, LP, with the sale of the remaining 30% of GTN in April 2015 and 49.9% of PNGTS on January 1, 2016. |
| |
| • | NGTL signed contracts for an additional 2.7 Bcf/d of new firm natural gas transportation service that will require a further $600 million expansion of the System for its 2018 Facilities program. |
|
| | |
| | | |
| | TransCanada Management's discussion and analysis 2015 29
|
|
| | |
| | | |
30 TransCanada Management's discussion and analysis 2015 | | |
We are the operator of all of the following natural gas pipelines and regulated natural gas storage assets except for Iroquois.
|
| | | | | | | | |
| | | | length | | description | | effective ownership |
|
| |
| | Canadian pipelines | | | | | | |
|
| |
| 1 | NGTL System | | 24,544 km (15,251 miles) | | Receives, transports and delivers natural gas within Alberta and B.C., and connects with the Canadian Mainline, Foothills system and third-party pipelines | | 100 | % |
| |
| 2 | Canadian Mainline | | 14,114 km (8,770 miles) | | Transports natural gas from the Alberta/Saskatchewan border and the Ontario/U.S. border to serve eastern Canada and interconnects to the U.S. | | 100 | % |
| |
| 3 | Foothills | | 1,241 km (771 miles) | | Transports natural gas from central Alberta to the U.S. border for export to the U.S. Midwest, Pacific northwest, California and Nevada | | 100 | % |
| |
| 4 | Trans Québec & Maritimes (TQM) | | 572 km (355 miles) | | Connects with Canadian Mainline near the Ontario/Québec border to transport natural gas to the Montréal to Québec City corridor, and connects with the Portland pipeline system that serves the northeast U.S. | | 50 | % |
| |
| | U.S. pipelines | | | | | | |
|
| |
| 5 | ANR Pipeline | | 15,109 km (9,388 miles) | | Transports natural gas from supply basins to markets throughout the mid-west and south to the Gulf of Mexico. | | 100 | % |
| 5a | ANR Storage | | 250 Bcf | | Provides regulated underground natural gas storage service from facilities located in Michigan | | |
|
| |
| 6 | Bison | | 488 km (303 miles) | | Transports natural gas from the Powder River Basin in Wyoming to Northern Border in North Dakota. We effectively own 28 per cent of the system through our interest in TC PipeLines, LP | | 28 | % |
| |
| 7 | Gas Transmission Northwest (GTN) | | 2,216 km (1,377 miles) | | Transports natural gas from the WCSB and the Rocky Mountains to Washington, Oregon and California. Connects with Tuscarora and Foothills. We effectively own 28 per cent of the system through our interest in TC PipeLines, LP | | 28 | % |
| |
| 8 | Great Lakes | | 3,404 km (2,115 miles) | | Connects with the Canadian Mainline near Emerson, Manitoba and St Clair, Ontario, plus interconnects with ANR at Crystal Falls and Farwell in Michigan, to transport natural gas to eastern Canada and the U.S. upper Midwest. We effectively own 66.6 per cent of the system through the combination of our 53.6 per cent direct ownership interest and our 28 per cent interest in TC PipeLines, LP | | 66.6 | % |
| |
| 9 | Iroquois | | 669 km (416 miles) | | Connects with Canadian Mainline near Waddington, New York to deliver natural gas to customers in the U.S. northeast | | 44.5 | % |
| |
| 10 | North Baja | | 138 km (86 miles) | | Transports natural gas between Arizona and California, and connects with a third-party pipeline on the California/Mexico border. We effectively own 28 per cent of the system through our interest in TC PipeLines, LP | | 28 | % |
| | | | | | | | |
| 11 | Northern Border | | 2,264 km (1,407 miles) | | Transports WCSB and Rockies natural gas with connections to Foothills and Bison to U.S. Midwest markets. We effectively own 14 per cent of the system through our 28 per cent interest in TC PipeLines, LP | | 14 | % |
| | | | | | | | |
| 12 | Portland (PNGTS) | | 475 km
(295 miles) | | Connects with TQM near East Hereford, Québec to deliver natural gas to customers in the U.S. northeast. We effectively own 25.8 per cent of the system through the combination of 11.8 per cent direct ownership and our 28 per cent interest in TC PipeLines, LP. Prior to January 1, 2016 we had direct ownership of 61.7 per cent. | | 25.8 | % |
| | | | | | | | |
| 13 | Tuscarora | | 491 km
(305 miles) | | Transports natural gas from GTN at Malin, Oregon to markets in northeastern California and northwestern Nevada. We effectively own 28 per cent of the system through our interest in TC PipeLines, LP | | 28 | % |
|
| | |
| | | |
| | TransCanada Management's discussion and analysis 2015 31
|
|
| | | | | | | | |
| | | | length | | description | | effective
ownership |
|
| |
| | U.S. pipelines | | | | | | |
| |
| 14 | TC Offshore1 | | 958 km (595 miles) | | Gathers and transports natural gas within the Gulf of Mexico with subsea pipeline and seven offshore platforms to connect in Louisiana with our ANR Pipeline system. | | 100% |
|
| | | | | | | | |
| | Mexican pipelines | | | | | | |
|
| |
| 15 | Guadalajara | | 315 km (196 miles) | | Transports natural gas from Manzanillo, Colima to Guadalajara, Jalisco | | 100 | % |
| |
| 16 | Tamazunchale | | 365 km (227 miles) | | Transports natural gas from Naranjos, Veracruz in east central Mexico to Tamazunchale, San Luis Potosi and on to El Sauz, Queretaro | | 100 | % |
| |
| | Under construction | | | | | | |
|
| |
| 17 | Mazatlan Pipeline | | 413 km* (257 miles) | | To deliver natural gas from El Oro to Mazatlan, Sinaloa in Mexico. Will connect to the Topolobampo Pipeline at El Oro | | 100 | % |
| |
| 18 | Topolobampo Pipeline | | 530 km* (329 miles) | | To deliver natural gas to Topolobampo, Sinaloa, from interconnects with third-party pipelines in El Oro, Sinaloa and El Encino, Chihuahua in Mexico | | 100 | % |
| | | | | | | | |
| 19 | Tuxpan-Tula Pipeline | | 250 km* (155 miles) | | The pipeline will originate in Tuxpan in the state of Veracruz and extend through the states of Puebla and Hidalgo, supplying natural gas to CFE combined-cycle power generating facilities in each of those jurisdictions as well as to the central and western regions of Mexico. | | 100% |
|
| | | | | | | | |
| | NGTL 2016/17 Facilities** | | 540 km* (336 miles) | | An expansion program comprised of 21 integrated projects of pipes, compression and metering to meet new incremental firm service requests received in 2014 on the NGTL System and expected to be completed between 2016 and 2018. | | 100% |
|
| | | | | | | | |
| | In development | | | | | | |
|
| |
| 20 | Coastal GasLink | | 670 km* (416 miles) | | To deliver natural gas from the Montney gas producing region at an expected interconnect on NGTL near Dawson Creek, B.C. to LNG Canada's proposed LNG facility near Kitimat, B.C. | | 100% |
|
| |
| 21 | Prince Rupert Gas Transmission | | 900 km* (559 miles) | | To deliver natural gas from the North Montney gas producing region at an expected interconnect on NGTL near Fort St. John, B.C. to the proposed Pacific Northwest LNG facility near Prince Rupert, B.C. | | 100% |
|
| | | | | | | | |
| 22 | North Montney Mainline | | 301 km*
(187 miles) | | An extension of the NGTL System to receive natural gas from the North Montney gas producing region and connect to NGTL's existing Groundbirch Mainline and the proposed Prince Rupert Gas Transmission project | | 100% |
|
| | | | | | | | |
| 23 | Merrick Mainline | | 260 km* (161 miles) | | To deliver natural gas from NGTL's existing Groundbirch Mainline near Dawson Creek, B.C. to its end point near the community of Summit Lake, B.C. | | 100% |
|
| | | | | | | | |
| 24 | Eastern Mainline Project | | 279 km* (173 miles) | | Pipeline and compression facilities expected to be added in the Eastern Triangle of the Canadian Mainline to meet the requirements of the existing shippers as well as new firm service requirements following the conversion of components of the Mainline to facilitate the Energy East project. | | 100% |
|
| | | | | | | | |
| | NGTL 2018 Facilities** | | 88 km* (55 miles) | | An expansion program comprised of multiple projects of 20- to 48-inch diameter pipelines, one new compressor unit and multiple meter stations to meet new incremental firm service requests received in 2015 on the NGTL System and expected to be completed in 2018. | | 100% |
|
| | | | | | | | |
* ** | Final pipe lengths are subject to changes during construction and/or final design considerations. Facilities are not shown on the map | | |
| |
1 | As at December 31, 2015, TC Offshore was classified as Assets held for sale. See Significant Events for further information. |
|
| | |
| | | |
32 TransCanada Management's discussion and analysis 2015 | | |
RESULTS
The following is a reconciliation of comparable EBITDA and comparable EBIT (our non-GAAP measures) to segmented earnings (the equivalent GAAP measure). Comparable depreciation and amortization is also a non-GAAP measure. See page 10 for more information on non-GAAP measures we use and page 108 for reconciliation to its GAAP equivalent.
|
| | | | | | | | | |
| year ended December 31 | | | | | | |
| (millions of $) | | 2015 |
| | 2014 |
| | 2013 |
|
| | | | | | | |
| Comparable EBITDA | | 3,477 |
| | 3,241 |
| | 2,852 |
|
| Comparable depreciation and amortization | | (1,132 | ) | | (1,063 | ) | | (1,013 | ) |
| Comparable EBIT | | 2,345 |
| | 2,178 |
| | 1,839 |
|
| Specific items: | | | | | | |
| TC Offshore loss on sale | | (125 | ) | | — |
| | — |
|
| Gas Pacifico/INNERGY gain on sale | | — |
| | 9 |
| | — |
|
| NEB 2013 Decision – 2012 | | — |
| | — |
| | 42 |
|
| Segmented earnings | | 2,220 |
| | 2,187 |
| | 1,881 |
|
Natural Gas Pipelines segmented earnings in 2015 increased by $33 million compared to 2014 and included a $125 million before tax loss provision ($86 million after tax) as a result of a December 2015 agreement to sell TC Offshore, which is expected to close in early 2016. See Significant Events for more information. Segmented earnings in 2014 included $9 million related to the gain on sale of Gas Pacifico/INNERGY in November 2014 and, in 2013, included $42 million related to the 2012 impact of the NEB 2013 Decision. These amounts have been excluded from our calculation of comparable EBIT. Comparable EBIT and comparable EBITDA are discussed below.
|
| | |
| | | |
| | TransCanada Management's discussion and analysis 2015 33
|
|
| | | | | | | | | |
| year ended December 31 | | | | | | |
| (millions of $) | | 2015 |
| | 2014 |
| | 2013 |
|
| | | | | | | |
| Canadian Pipelines | | | | | | |
| Canadian Mainline | | 1,230 |
| | 1,334 |
| | 1,121 |
|
| NGTL System | | 934 |
| | 856 |
| | 846 |
|
| Foothills | | 107 |
| | 106 |
| | 114 |
|
Other Canadian pipelines1 | | 27 |
| | 22 |
| | 26 |
|
| Canadian Pipelines – comparable EBITDA | | 2,298 |
| | 2,318 |
| | 2,107 |
|
| Comparable depreciation and amortization | | (845 | ) | | (821 | ) | | (790 | ) |
| Canadian Pipelines – comparable EBIT | | 1,453 |
| | 1,497 |
| | 1,317 |
|
U.S. and International Pipelines (US$) | | | | | | |
| ANR | | 232 |
| | 189 |
| | 188 |
|
TC PipeLines, LP1,2 | | 106 |
| | 88 |
| | 72 |
|
Great Lakes3 | | 63 |
| | 49 |
| | 34 |
|
Other U.S. pipelines (Bison4, GTN5, Iroquois1, Portland6) | | 84 |
| | 132 |
| | 183 |
|
| Mexico (Guadalajara, Tamazunchale) | | 181 |
| | 160 |
| | 100 |
|
International and other1,7 | | 4 |
| | (10 | ) | | (4 | ) |
Non-controlling interests8 | | 292 |
| | 241 |
| | 186 |
|
| U.S. and International Pipelines – comparable EBITDA | | 962 |
| | 849 |
| | 759 |
|
| Comparable depreciation and amortization | | (224 | ) | | (219 | ) | | (217 | ) |
| U.S. and International Pipelines – comparable EBIT | | 738 |
| | 630 |
| | 542 |
|
| Foreign exchange impact | | 206 |
| | 68 |
| | 15 |
|
U.S. and International Pipelines – comparable EBIT (Cdn$) | | 944 |
| | 698 |
| | 557 |
|
| Business Development comparable EBITDA and comparable EBIT | | (52 | ) | | (17 | ) | | (35 | ) |
| Natural Gas Pipelines – comparable EBIT | | 2,345 |
| | 2,178 |
| | 1,839 |
|
| Summary | | | | | | |
| Natural Gas Pipelines – comparable EBITDA | | 3,477 |
| | 3,241 |
| | 2,852 |
|
| Comparable depreciation and amortization | | (1,132 | ) | | (1,063 | ) | | (1,013 | ) |
| Natural Gas Pipelines – comparable EBIT | | 2,345 |
| | 2,178 |
| | 1,839 |
|
| |
1 | Results from TQM, Northern Border, Iroquois, TransGas and Gas Pacifico/INNERGY reflect our share of equity income from these investments. In November 2014, we sold our interest in Gas Pacifico/INNERGY. |
| |
2 | Beginning in August 2014, TC PipeLines, LP began its at-the-market equity issuance program which, when utilized, decreases our ownership interest in TC PipeLines, LP. On October 1, 2014, we sold our remaining 30 per cent direct interest in Bison to TC PipeLines, LP. On April 1, 2015, we sold our remaining 30 per cent direct interest in GTN to TC PipeLines, LP. Effective May 22, 2013 our ownership interest in TC PipeLines, LP decreased from 33.3 per cent to 28.9 per cent. On July 1, 2013, we sold 45 per cent of GTN and Bison to TC PipeLines, LP. The following shows our ownership interest in TC PipeLines, LP and our effective ownership interest of GTN, Bison and Great Lakes through our ownership interest in TC PipeLines, LP for the periods presented. |
|
| | | | | | | | | | | | | |
| | | | Ownership percentage as of | |
| | | | December 31, 2015 | | April 1, 2015 | | October 1, 2014 | | January 1, 2014 | | July 1, 2013 | | May 22, 2013 |
| | | | | | | | | | | | | | |
| | TC PipeLines, LP | | 28.0 | | 28.3 | | 28.3 | | 28.9 | | 28.9 | | 28.9 |
| | Effective ownership through TC PipeLines, LP: | | | | | | | | | | | | |
| | Bison | | 28.0 | | 28.3 | | 28.3 | | 20.2 | | 20.2 | | 7.2 |
| | GTN | | 28.0 | | 28.3 | | 19.8 | | 20.2 | | 20.2 | | 7.2 |
| | Great Lakes | | 13.0 | | 13.1 | | 13.1 | | 13.4 | | 13.4 | | 13.4 |
| |
3 | Represents our 53.6 per cent direct ownership interest. The remaining 46.4 per cent is held by TC PipeLines, LP. |
| |
4 | Effective October 1, 2014 we have no direct ownership in Bison. Prior to that our direct ownership interest was 30 per cent effective July 1, 2013. |
| |
5 | Effective April 1, 2015 we have no direct ownership in GTN. Prior to that our direct ownership was 30 per cent effective July 1, 2013. |
| |
6 | Represents our 61.7 per cent ownership interest. |
| |
7 | Includes our share of the equity income from TransGas and Gas Pacifico/INNERGY as well as general and administration costs relating to our U.S. and International |
|
| | |
| | | |
34 TransCanada Management's discussion and analysis 2015 | | |
Pipelines. In November 2014, we sold our interest in Gas Pacifico/INNERGY.
| |
8 | Comparable EBITDA for the portions of TC PipeLines, LP and Portland we do not own. |
Canadian Pipelines |
| | | | | | | | | |
| year ended December 31 | | | | | | |
| (millions of $) | | 2015 |
| | 2014 |
| | 2013 |
|
| | | | | | | |
| Net income | | | | | | |
| Canadian Mainline – net income | | 213 |
| | 300 |
| | 361 |
|
| Canadian Mainline – comparable earnings | | 213 |
| | 300 |
| | 277 |
|
| NGTL System | | 269 |
| | 241 |
| | 243 |
|
| Average investment base | | | | | | |
| Canadian Mainline | | 4,784 |
| | 5,690 |
| | 5,841 |
|
| NGTL System | | 6,698 |
| | 6,236 |
| | 5,938 |
|
Net income and comparable EBITDA for our rate-regulated Canadian Pipelines are primarily affected by our approved ROE, our investment base, the level of deemed common equity and incentive earnings. Changes in depreciation, financial charges and income taxes also impact comparable EBITDA but do not have a significant impact on net income as they are almost entirely recovered in revenue on a flow-through basis.
In 2014, the Canadian Mainline operated under the NEB 2013 Decision for the years 2013-2017, which included an approved ROE of 11.5 per cent on deemed common equity of 40 per cent and an incentive mechanism based on total net revenues.
In 2015, the Canadian Mainline began operating under the NEB 2014 Decision which was approved by the NEB in November 2014 and superseded the NEB 2013 Decision. The NEB 2014 Decision included an approved ROE of 10.1 per cent with a possible range of achieved ROE outcomes between 8.7 per cent to 11.5 per cent. This decision also included an incentive mechanism that has both upside and downside risk and a $20 million annual after-tax contribution from us. Toll stabilization is achieved through the continued use of deferral accounts to capture the surplus or shortfall between our revenues and cost of service for each year over the six-year fixed toll term.
Canadian Mainline’s comparable earnings in 2015 decreased by $87 million compared to 2014 mainly due to a lower approved ROE on a lower average investment base, lower incentive earnings and a $20 million after-tax contribution from us resulting in a lower realized ROE of 11.15 per cent compared to the realized ROE of 13.18 per cent in 2014. The lower average investment base in 2015 was mainly due to the deferral of the 2014 net revenue surplus in the 2015 investment base.
Comparable earnings in 2014 were $23 million higher than 2013 because of higher incentive earnings partially offset by a lower average investment base. Net income of $361 million recorded in 2013 included $84 million related to the 2012 impact of the NEB 2013 Decision, which was excluded from comparable earnings.
Net income for the NGTL System was $28 million higher in 2015 compared to 2014 mainly due to a higher average investment base and OM&A incentive losses realized in 2014. Net income in 2014 was $2 million lower than 2013 due to the 2014 OM&A incentive losses realized partially offset by a higher average investment base. The 2015 NGTL Settlement included an ROE of 10.1 per cent on deemed common equity of 40 per cent and an annual cost-sharing mechanism for cost variances between actual and fixed OM&A costs. The 2013-2014 NGTL Settlement included an ROE of 10.1 per cent on deemed common equity of 40 per cent and fixed annual OM&A costs with any variance between actual and fixed OM&A accruing to us.
Comparable EBITDA and EBIT for the Canadian pipelines reflect the variances discussed above as well as variances in depreciation, financial charges and income tax which are substantially recovered in revenue on a flow-through basis and, therefore, do not have a significant impact on net income.
|
| | |
| | | |
| | TransCanada Management's discussion and analysis 2015 35
|
U.S. and International Pipelines
EBITDA for our U.S. operations is affected by contracted volume levels, actual volumes delivered and the rates charged, and the total cost of providing services.
ANR earnings are also affected by the level of contracting and the determination of rates driven by the market value of its storage capacity, storage related transportation services, and incidental commodity sales. ANR's pipeline and storage volumes and revenues are generally higher in the winter months because of the seasonal nature of its business.
Comparable EBITDA for the U.S. and International Pipelines was US$113 million higher in 2015 than 2014. This was due to the net effect of:
| |
| • | higher ANR Southeast Mainline transportation revenue, incidental commodity sales and ANR's first quarter 2015 settlement with an owner of adjacent facilities for commercial interruption of ANR's service, partially offset by increased spending on ANR pipeline integrity work |
| |
| • | higher earnings from the Tamazunchale Extension which was placed in service in 2014 |
| |
| • | lower contributions from other U.S. Pipelines due to ownership interests in GTN and Bison sold to TC PipeLines, LP in April 2015 and October 2014, respectively. These drop downs increased EBITDA from TC PipeLines, LP and also increased the partially offsetting non-controlling interests |
| |
| • | a stronger U.S. dollar had a positive impact on the Canadian dollar equivalent comparable earnings from our U.S. and International operations. |
Comparable EBITDA for the U.S. and International Pipelines was US$90 million higher in 2014 than 2013. This was due to the net effect of:
| |
| • | higher earnings from the Tamazunchale Extension which was placed in service in 2014 |
| |
| • | higher transportation revenue at Great Lakes mainly due to colder winter weather and increased demand |
| |
| • | lower contributions from GTN and Bison following the reductions in our effective ownership in each pipeline in July 2013 (GTN and Bison) and October 2014 (Bison) |
| |
| • | a stronger U.S. dollar had a positive impact on the Canadian dollar equivalent comparable earnings from our U.S. and International operations. |
Comparable depreciation and amortization
Comparable depreciation and amortization was $69 million higher in 2015 compared to 2014 mainly because of a higher investment base for the NGTL System, depreciation for the completed Tamazunchale Extension and the effect of a stronger U.S. dollar. Depreciation and amortization was $50 million higher in 2014 than in 2013 mainly because of a higher investment base for the NGTL System, as well as the impact of the Mainline NEB 2013 Decision.
Business development
In 2015, business development expenses were $35 million higher than 2014 primarily due to increased business development activity related to our Mexico projects. Also in third quarter 2014, we recovered amounts from partners for 2013 Alaska Gasline Inducement Act costs. Business development expenses were $18 million lower in 2014 compared to 2013 mainly due to a change in scope on the Alaska project as well as the recovery discussed above. See page 44 for further discussion on Alaska.
|
| | |
| | | |
36 TransCanada Management's discussion and analysis 2015 | | |
OUTLOOK
Earnings
Canadian Pipelines
Net income for rate-regulated pipelines is affected by changes in investment base, ROE and regulated capital structure, and also by the terms of toll settlements or other toll proposals approved by the NEB.
In 2016, the Canadian Mainline will continue to operate under the terms of the NEB 2014 Decision. We expect Canadian Mainline 2016 earnings to be slightly lower than 2015 due to a declining investment base.
We expect the NGTL System investment base to continue to grow as we connect new natural gas supply in northeastern B.C. and western Alberta and respond to continued growth in market demand and that this will continue to have a positive impact on NGTL System earnings in 2016. The terms of the recently negotiated NGTL 2016-2017 Revenue Requirement Settlement generally include a continuation of the ROE, depreciation rates and incentive sharing mechanism as those established in the 2015 Revenue Requirement Settlement.
We also anticipate a modest level of investment in our other Canadian rate-regulated natural gas pipelines, but expect the average investment bases of these pipelines to continue to decline as annual depreciation outpaces capital investment, reducing their year-over-year earnings.
Under the current regulatory model, earnings from Canadian rate-regulated natural gas pipelines are not materially affected by short-term fluctuations in the commodity price of natural gas, changes in throughput volumes or changes in contracted capacity levels.
U.S. Pipelines
U.S. Pipeline earnings are affected by the level of contracted capacity and the rates charged to customers. Our ability to recontract or sell capacity at favourable rates is influenced by prevailing market conditions and competitive factors, including alternatives available to end use customers in the form of competing natural gas pipelines and supply sources, in addition to broader conditions that might impact demand from certain customers or market segments. Earnings are also affected by the level of OM&A and other costs, which includes the impact of safety, environmental and other regulators' decisions.
Many of our U.S. natural gas pipelines are backed by long-term take-or-pay contracts that are expected to deliver stable and consistent financial performance.
ANR has secured new long term contracts and extended terms at maximum recourse rates for significant volumes originating from the Utica/Marcellus shale plays with contract start dates through late 2015 that resulted in increased revenues. On January 29th, 2016, ANR submitted a filing with the FERC under Section 4 of the Natural Gas Act seeking to increase its base rates. We anticipate that the proposed rates will take effect in third quarter 2016. These rates are subject to customer refund as a result of the rates ultimately approved by FERC, which is based on the outcome of the regulatory process or settlement negotiations with ANR's customers.
Also, Great Lakes, Northern Border and GTN have benefited from recent market conditions that increased the value of their services. We continue to seek opportunities to expand upon this success along with those opportunities associated with continued growth in end use markets for natural gas as we examine commercial, regulatory and operational changes to continue to optimize our pipelines' positions in response to positive developments in supply fundamentals.
Mexican Pipelines
Overall earnings from our Mexican pipelines are expected to increase in 2016 due to the addition of two new pipelines, Topolobampo and Mazatlan, which are expected to be placed in service in fourth quarter 2016. The 2016 earnings for our current operating assets in Mexico are expected to be consistent with 2015 earnings due to the nature of the long-term contracts underpinning our Mexican pipeline systems.
Capital spending
We spent a total of $2.7 billion in 2015 for our natural gas pipelines in Canada, the U.S. and Mexico, and expect to spend approximately $4 billion in 2016 primarily on the NGTL System expansion projects, ANR maintenance capital, the Tuxpan-Tula and Topolobampo pipelines in Mexico and Canadian Mainline capacity projects.
|
| | |
| | | |
| | TransCanada Management's discussion and analysis 2015 37
|
UNDERSTANDING THE NATURAL GAS PIPELINES BUSINESS
Natural gas pipelines move natural gas from major sources of supply to locations or markets that use natural gas to meet their energy needs.
Our natural gas pipeline business builds, owns and operates a network of natural gas pipelines in North America that connects gas production to end use markets. The network includes pipelines that are buried underground and transport natural gas under high pressure, compressor stations that act like pumps to move the large volumes of natural gas along the pipeline and meter stations that record the amount of natural gas coming on the network at receipt locations and leaving the network at delivery locations.
Our Major Pipeline Systems
The Natural Gas Pipelines map on page 30 shows our extensive pipeline network in North America that connects major supply sources and markets. Three major pipeline systems account for approximately 80 per cent of the total owned and operated pipe length. These systems are:
NGTL System: This is the major natural gas gathering and transportation system for the WCSB, connecting most of the natural gas production in western Canada to domestic and export markets. We believe we are very well positioned to connect growing supply in northeast B.C. and northwest Alberta and it is these two supply areas, along with growing demand for firm transportation in the oil sands area, that is driving our large capital program for new pipeline facilities on the NGTL System. The NGTL System is also very well positioned to connect WCSB supply to potential LNG export facilities on the Canadian west coast.
Canadian Mainline: This is a major pipeline that was originally designed as a long haul delivery system transporting supply from the WCSB basin across Canada to Ontario and Québec to deliver gas to downstream Canadian and U.S. markets. The Canadian Mainline continues this role, but is also transitioning to accommodate additional supply connections that are closer to the market served by this pipeline.
ANR System: This is the largest US-based gas pipeline asset we own and operate and is comparable in length to the Canadian Mainline. This pipeline system was originally designed predominantly to transport natural gas supply from the Gulf Coast and northern Texas areas northward to serve markets in the U.S. Midwest. With the large increase of supply from the U.S. Northeast region, the southeast leg of ANR is transitioning from a predominantly south to north system to a bi-directional system with more gas moving north to south.
Regulation of tolls and cost recovery
Our natural gas pipelines are generally regulated by the NEB in Canada, by the FERC in the U.S. and by the CRE in Mexico. The regulators approve construction of new pipeline facilities and ongoing operations of the infrastructure.
Regulators in Canada, the U.S. and Mexico allow us to recover costs to operate the network by collecting tolls, or payments, for services. Costs of operating the systems include a return on our capital invested in the assets or rate base, as well as the recovery of the rate base over time through depreciation. Other costs recovered include OM&A costs, income and property taxes and interest on debt. The regulator reviews our costs to ensure they are reasonable and prudently incurred and approves tolls that provide us a reasonable opportunity to recover them.
Within their respective jurisdictions, the FERC and CRE approve maximum transportation rates. These rates are cost based and are designed to recover the pipeline's investment, operating expenses and a reasonable return for our investors. As the pipeline operator within these jurisdictions, we may negotiate lower rates with shippers.
Sometimes we enter into agreements or settlements with our shippers for tolls and cost recovery, which may include mutually beneficial performance incentives. The regulator must approve a settlement, including any performance incentives, for it to be put into effect.
Generally, Canadian natural gas pipelines request the NEB to approve the pipeline's cost of service and tolls once a year and recover or refund the variance between actual and expected revenues and costs in future years. The Canadian Mainline, however, operates under a fixed toll arrangement for its longer-term firm transportation services and has the flexibility to price its shorter-term and interruptible services in order to maximize its revenue. In addition, the NGTL System has recently reached a two-year revenue requirement settlement for 2016 and 2017 that remains subject to NEB approval.
The FERC does not require U.S. interstate pipelines to calculate rates annually, nor do they allow for the collection or refund of the variance between actual and expected revenue and costs into future years. This difference in U.S. regulation puts our U.S. pipelines
|
| | |
| | | |
38 TransCanada Management's discussion and analysis 2015 | | |
at risk for the difference in expected and actual costs and revenues between rate cases. If revenues no longer provide a reasonable opportunity to recover costs, we can file with the FERC for a new determination of rates, subject to any moratorium in effect. Similarly, the FERC may institute proceedings to lower tolls if they consider the return on the capital invested to be too high.
Our Mexican pipelines have approved tariffs, services and related rates. However, most of the contracts underpinning the construction and operation of the facilities in Mexico are long-term, fixed-rate contracts designed to recover the cost of our service.
Business environment and strategic priorities
The North American natural gas pipeline network has developed to connect supply to market. Use and growth of this infrastructure is affected by changes in the location and relative cost of natural gas supplies as well as changes in the location of markets and level of demand.
We have a significant pipeline footprint in the WCSB and transport approximately 75 per cent of total WCSB production to markets within and outside of the basin. Our pipelines also source natural gas, to a lesser degree, from the other major basins including the Appalachian (Utica and Marcellus), Rockies, Williston, Haynesville, Fayetteville and Anadarko as well as the Gulf of Mexico.
North American Natural Gas Basins
Increasing supply
The WCSB spans almost all of Alberta and extends into B.C., Saskatchewan, Yukon and Northwest Territories and is Canada's primary source of natural gas supply. The WCSB is currently estimated to have 150 trillion cubic feet of remaining conventional resources and a technically accessible unconventional resource base of over 700 trillion cubic feet. The total recoverable WCSB resource base has recently more than quadrupled with the advent of technology that can economically access unconventional gas areas in the basin. After decreasing every year since 2007, production from the WCSB increased slightly in 2014 and 2015 to 14.7 Bcf/d. The Montney and Horn River shale play formations and the Liard basin in northeastern B.C. are part of the WCSB and have recently become a significant source of natural gas. We expect production from the Montney play that is currently 3 Bcf/d to grow to approximately 6 Bcf/d by 2020, depending on the economics of exploration and production compared to other, mainly U.S., sources and the progress of proposed B.C. west coast LNG exports.
|
| | |
| | | |
| | TransCanada Management's discussion and analysis 2015 39
|
The primary sources of natural gas in the U.S. are the U.S. shale areas, Gulf of Mexico and the Rockies. The U.S. shales are the biggest area of growth which we estimate will meet almost 50 per cent of the overall North American gas demand by 2020. The largest shale developments for natural gas are the Utica/Marcellus basins in the northeast U.S. These basins have grown from essentially no production prior to 2008 to over 18 Bcf/d at the end of 2015. They are forecast to grow to 25 Bcf/d by 2020. Other natural gas supply from shale in the U.S. includes the Haynesville, Barnett, Eagle Ford and Fayetteville plays.
The overall supply of natural gas in North America is forecast to increase significantly over the next decade (by almost 20 Bcf/d or 22 per cent by 2020) and is expected to continue to increase over the long term for several reasons:
| |
| • | continued technological progress with horizontal drilling and multi-stage hydraulic fracturing or fracking. This is increasing the technically accessible resource base of existing basins and emerging regions, such as the Marcellus and Utica in the U.S. northeast and the Montney and Horn River areas in northeastern B.C. |
| |
| • | these technologies are also being applied to existing oil fields where further recovery of the resource is now possible. There is often associated gas discovered in the exploration and production of liquids-rich hydrocarbon basins (for example, the Bakken oil fields) which also contributes to an increase in the overall gas supply for North America. |
The development of shale gas basins that are located close to existing markets, particularly in the northeast U.S., has led to an increase in the number of supply choices and is changing historical gas pipeline flow patterns, generally from long-haul to shorter haul pipelines. Along with our competitors, we have and continue to assess further opportunities to restructure our tolls and service offerings to capture this growing northeast supply and North American demand.
Growing northeast supply has had a positive impact for both the Mainline, with new proposed facilities in eastern Canada, and our ANR pipeline assets, with significant new long-term contracts for service. The increase in supply in northeastern B.C. and northwest Alberta has created opportunities for us to plan and build, subject to regulatory approval and positive final investment decisions (FID), new large pipeline infrastructure on the NGTL System to move the natural gas to markets, including proposed LNG exports and growing Alberta market demand.
Changing demand
The growing supply of natural gas has resulted in relatively low natural gas prices in North America, which has supported increased demand for natural gas particularly in the following areas:
| |
| • | natural gas-fired power generation |
| |
| • | petrochemical and industrial facilities |
| |
| • | the production of Alberta oil sands, although new greenfield projects that have not begun construction may be delayed in the current low oil price environment |
| |
| • | exports to Mexico to fuel new power generation facilities. |
Natural gas producers continue to progress opportunities to sell natural gas to global markets, which involves connecting natural gas supplies to new LNG export terminals which are proposed primarily along the west coast of B.C. and the U.S. Gulf of Mexico. Assuming the receipt of all necessary regulatory and other approvals, the proposed facilities along the west coast of B.C. are expected to become operational later this decade. The U.S. Gulf Coast also has several LNG export facilities in various stages of development or construction. LNG exports are expected to ramp up from this area, including one facility being commissioned to accommodate full deliveries in early 2016. The demand created by the addition of these new markets creates opportunities for us to build new pipeline infrastructure and to increase throughput on our existing pipelines.
Commodity Prices
In general, the profitability of our gas pipelines business is not directly tied to commodity prices given we are a transporter of the commodity and the transportation costs are not tied to the price of natural gas. However, the cyclical supply and demand nature of commodities and related pricing can have an indirect impact on our business where our shippers may choose to accelerate or delay certain projects. This can impact the timing for the demand of transportation services and/or new gas pipeline infrastructure. There is also a relationship between other fuel sources and their prices, including LNG export contracts which have historically been tied to the price of oil. In this current low oil price environment, the ability of gas producers to advance LNG projects that are tied to oil prices will be more challenging. On the other hand, low natural gas prices compete extremely well with coal-fired electric generation. In 2015, we have seen record levels of power generation with natural gas as the fuel source, particularly in the U.S.
|
| | |
| | | |
40 TransCanada Management's discussion and analysis 2015 | | |
More competition
Changes in supply and demand levels and locations have resulted in increased competition for transportation services throughout North America. Development of technology for shale gas supply basins that are closer to markets historically served by long-haul pipelines has resulted in changes to flow patterns of existing natural gas pipeline infrastructure that includes reversing direction of flow and different distances of haul, particularly with the large development of U.S. northeast supply. Along with other pipelines, we have and continue to assess further opportunities to restructure our tolls and service offerings to capture this growing northeast supply and North American demand.
Strategic priorities
We are focused on capturing opportunities resulting from growing natural gas supply, and connecting new markets, while satisfying increasing demand for natural gas within existing markets. We are also focused on adapting our existing assets to the changing gas flow dynamics.
In 2016, we will continue to advance the planned conversion of portions of the Canadian Mainline from natural gas service to crude oil service. The Energy East Pipeline is a planned project, subject to regulatory approval, to convert approximately 3,000 km (1,864 miles) of the Canadian Mainline from the Alberta border to a point in eastern Ontario, southeast of Ottawa, to crude oil service. We announced in August 2015 that we had reached an agreement with eastern LDCs that ensures the net result of the pipeline asset transfer to Energy East and Eastern Mainline Project will provide gas consumers in Eastern Canada with sufficient natural gas transmission capacity and reduced natural gas transmission costs. We are also advancing new facilities in Eastern Canada to enable more supply into our system from sources that are closer to the end market.
We will continue to advance the previously announced 2016/2017 Facilities project on our NGTL System that is driven by contracts for approximately 4 Bcf/d of new firm service transportation requests as well as our new 2018 program that is underpinned by an additional 2.7 Bcf/d of new firm transportation service on the System.
Our ANR Pipeline has operated under the existing rate settlement for nearly 20 years. As a result of changes to traditional supply sources and markets, necessary operational changes, needed infrastructure updates, and evolving regulatory requirements that are driving required investment in facility maintenance, reliability and system integrity, along with an increase in operating costs, we are seeking to restate our transportation rates to appropriately recover our cost of providing service. Our preferred process to restate our rates is to reach a mutually beneficial outcome with our shippers through a settlement negotiation and that will be a focus area for us in 2016. In parallel to the settlement process, on January 29, 2016 ANR filed a Section 4 rate case with FERC.
We will also continue to pursue further connections to growth in supply and markets for our U.S. assets.
The drop down of our remaining U.S. natural gas pipeline assets into TC PipeLines, LP remains an important financing lever for us as we execute our capital growth program, subject to actual funding needs, market conditions, the relative attractiveness of alternate capital sources and the approvals of TC PipeLines LP’s board and our board.
Our focus in Mexico in 2016 is to complete construction and bring into service the Mazatlan and Topolobampo pipelines and to begin permitting and construction of our recently awarded Tuxpan-Tula pipeline. We also remain focused on continuing to operate our existing facilities safely and reliably. We continue to be very interested in the further development of natural gas infrastructure in Mexico and will work to secure future projects that align with our strategic priorities.
|
| | |
| | | |
| | TransCanada Management's discussion and analysis 2015 41
|
SIGNIFICANT EVENTS
Canadian Regulated Pipelines
NGTL System
In 2015, we placed approximately $350 million of facilities in service. For 2016, the NGTL System continues to develop a further approximately $7.3 billion of new supply and demand facilities. We have approximately $2.3 billion of facilities that have received regulatory approval with approximately $450 million currently under construction. We have filed for approval for a further approximately $2.0 billion of facilities which are currently under regulatory review. Applications for approval to construct and operate an additional $3.0 billion of facilities have yet to be filed.
Included in our capital program described above is the recently announced 2018 expansion of a further $600 million of facilities required on the NGTL System. The 2018 expansion includes multiple projects totaling approximately 88 km (55 miles) of 20- to 48-inch diameter pipeline, one new compressor, approximately 35 new and expanded meter stations and other associated facilities. Applications to construct and operate the various components of the 2018 expansion program will be filed with the NEB between second quarter and fourth quarter 2016. Subject to regulatory approvals, construction is expected to start in 2017, with all facilities expected to be in service in 2018.
North Montney Mainline
The North Montney Mainline is a pipeline project that will provide substantial new capacity on the NGTL System to meet the transportation requirements associated with rapidly increasing development of natural gas resources in the Montney supply basin in northeastern B.C. The project will connect Montney and other WCSB supply to both existing and new natural gas markets, including LNG markets.
The North Montney Mainline project will consist of two large diameter 42-inch pipeline sections, Aitken Creek and Kahta, totaling approximately 301 km (187 miles) in length, and associated metering facilities, valve sites and compression facilities. The project will also include an interconnection with our proposed Prince Rupert Gas Transmission Project (PRGT) to provide natural gas supply to the proposed Pacific NorthWest (PNW) LNG liquefaction and export facility near Prince Rupert, B.C. We expect to have the Aitken Creek and Kahta sections in service in 2017.
The NEB approved the $1.7 billion project in June 2015 subject to certain terms and conditions. Under one of these conditions, construction on the North Montney Mainline project can only begin after a positive FID has been made on the proposed PNW LNG project.
Merrick Mainline
The proposed Merrick Mainline pipeline project that will transport natural gas sourced through the NGTL System to the inlet of the proposed Pacific Trail Pipeline terminating at the Kitimat LNG Terminal near Kitimat, B.C. has been delayed. In late 2015, the Kitimat LNG partners advised us that they are re-phasing the pace of Kitimat LNG facility development. Since the Merrick Mainline is dependent upon the construction of the downstream infrastructure, the in-service date of the Merrick Mainline will be no earlier than 2021.
The Merrick Mainline is a $1.9 billion project that will consist of approximately 260 kilometres (161 miles) of 48-inch diameter pipe.
Canadian Mainline
Energy East and the Eastern Mainline Project
In October 2014, an application was filed with the NEB for the Energy East project and to transfer a portion of the Canadian Mainline from natural gas service to crude oil service. An application was also filed for the Eastern Mainline Project, consisting of new gas facilities in southeastern Ontario required as a result of the proposed transfer of Canadian Mainline assets to crude oil service for the Energy East project.
Application amendments were filed in December 2015 that reflect the agreement we announced in August 2015 with eastern LDCs resolving their issues with Energy East and the Eastern Mainline Project. The agreement provides gas consumers in eastern Canada with sufficient natural gas transmission capacity and provides for reduced natural gas transmission costs.
The Eastern Mainline Project capital cost is now estimated to be $2.0 billion with the increase in the cost estimate due to the revised project scope resulting from the LDC agreement and updated cost estimates.
|
| | |
| | | |
42 TransCanada Management's discussion and analysis 2015 | | |
The Eastern Mainline Project is conditioned on the approval and construction of the Energy East pipeline. On January 27, 2016, the Canadian federal government announced interim measures for its review of the Energy East pipeline project. The government announced it will undertake additional consultations with aboriginal groups, help facilitate expanded public input into the NEB, and assess upstream GHG emissions associated with the project. The government will seek a six month extension to the NEB’s legislative review and a three month extension to the legislative time limit for the government’s decision. We are reviewing these changes and will assess the impacts to the Eastern Mainline Project.
Other Canadian Mainline Expansions
In addition to the Eastern Mainline Project, new facilities investments totaling approximately $700 million over the 2016 to 2017 period in the Eastern Triangle portion of the Canadian Mainline are required to meet contractual commitments from shippers.
U.S. Pipelines
ANR Section 4 Rate Case
ANR Pipeline filed a Section 4 Rate Case on January 29, 2016 that requests an increase to ANR's maximum transportation rates. Shifts in ANR’s traditional supply sources and markets, necessary operational changes, needed infrastructure updates, and evolving regulatory requirements are driving required investment in facility maintenance, reliability and system integrity as well as an increase in operating costs that have resulted in the current tariff rates not providing a reasonable return on our investment. We will also pursue a collaborative process to find a mutually beneficial outcome with our customers through settlement negotiations. ANR's last rate case filing was more than 20 years ago.
Sale of GTN and PNGTS to TC PipeLines, LP
In April 2015, we closed the sale of our remaining 30 per cent interest in GTN to TC PipeLines, LP, for an aggregate purchase price of US$457 million. Proceeds were comprised of US$264 million in cash, the assumption of US$98 million in proportional GTN debt and US$95 million of new Class B units of TC PipeLines, LP.
On January 1, 2016, we closed the sale of a 49.9 per cent interest of our total 61.7 per cent interest in PNGTS to TC PipeLines, LP for US$223 million including the assumption of US$35 million of proportional PNGTS debt.
TC Offshore
On December 18, 2015, we entered into an agreement to sell TC Offshore to a third party and expect the sale to close in early 2016. As a result, at December 31, 2015, the related assets and liabilities were classified as held for sale and were recorded at their fair values less costs to sell. This resulted in a pre-tax loss provision of $125 million recorded in 2015.
Mexican Pipelines
Topolobampo and Mazatlan Pipelines
The Topolobampo project is a 530 km (329 miles), 30-inch pipeline with a capacity of 670 MMcf/d and a cost of US$1 billion that will deliver gas to Topolobampo, Sinaloa from interconnects with third party pipelines in El Oro, Sinaloa and El Encino, Chihuahua in Mexico. The Mazatlan project is a 413 km (257 miles), 24-inch pipeline running from El Oro to Mazatlan within the state of Sinaloa with a capacity of 200 MMcf/d and an estimated cost of US$400 million. Both projects are supported by 25-year contracts with the CFE and are in their final construction stages with expected in-service dates in late 2016.
Tuxpan-Tula Pipeline
In November 2015, we were awarded the contract to build, own and operate the US$500 million, 36 inch, 250 km (155 mile) Tuxpan-Tula pipeline with a contracted capacity of 886 MMcf/d for 25 years with the CFE. The pipeline will originate in Tuxpan in the state of Veracruz and extend through the states of Puebla and Hidalgo, supplying natural gas to each of those jurisdictions as well as the central region of Mexico. The pipeline will serve new power generating facilities as well as existing power plants that plan to switch from fuel oil to natural gas as their base fuel. Physical construction is expected to begin in 2016 with a planned in-service date in fourth quarter 2017.
|
| | |
| | | |
| | TransCanada Management's discussion and analysis 2015 43
|
LNG Pipeline Projects
Prince Rupert Gas Transmission
In June 2015, PNW LNG announced a positive FID for its proposed liquefaction and export facility, subject to two conditions. The first condition, approval by the Legislative Assembly of B.C. of a Project Development Agreement between PNW LNG and the Province of B.C., was satisfied in July 2015. The second condition is a positive regulatory decision on PNW LNG’s environmental assessment by the Government of Canada, which has not yet been received.
In third quarter 2015, we received all remaining permits from the B.C. Oil and Gas Commission (BC OGC) which completes the eleven permits required to build and operate PRGT. Environmental permits for the project were received in November 2014 from the B.C. Environmental Assessment Office (BC EAO). With these permits, PRGT has all of the primary regulatory permits required for the project.
We remain on target to begin construction following confirmation of a FID by PNW LNG. The in-service date for PRGT is estimated to be 2020 but will be aligned with PNW LNG’s liquefaction facility timeline.
We are continuing our engagement with Aboriginal groups and have now signed project agreements with ten First Nation groups along the pipeline route. Project agreements outline financial and other benefits and commitments that will be provided to each First Nation for as long as the project is in service.
PRGT is a 900 km (559 mile) natural gas pipeline that will deliver gas from the Montney producing region at an expected interconnect on the NGTL System near Fort St. John, B.C. to PNW LNG's proposed LNG facility near Prince Rupert, B.C. Should the project not proceed, our project costs (including carrying charges) are fully recoverable.
Coastal GasLink
We are continuing our engagement with Aboriginal groups along our pipeline route and have now announced long-term project agreements with eleven First Nations. These project agreements outline financial and other benefits and commitments that will be provided to each First Nation for as long as the pipeline remains in service.
We also continue to engage with stakeholders along the pipeline route and are progressing detailed engineering and construction planning work to refine the capital cost estimate. In response to feedback received, we have applied for a minor route amendment to the BC EAO in order to provide an option in the area of concern. It is anticipated that approval for this route amendment will be received in first quarter 2016. We have received eight of ten pipeline and facilities permits from the BC OGC and anticipate receiving the remaining two permits in first quarter 2016. With these permits, Coastal GasLink will hold all of the required primary regulatory permits for the project.
Pending the receipt of regulatory approvals and a positive FID from the LNG Canada joint venture participants in 2016, we will begin construction. Our pipeline in-service date will be scheduled to coincide with the operational requirements of the LNG Canada facility to be built in Kitimat, B.C. Should the project not proceed, our project costs (including carrying charges) are fully recoverable.
Coastal GasLink is a 670 km (416 mile) pipeline that will deliver natural gas from the Dawson Creek, BC area, to the LNG Canada's proposed gas liquefaction facility near Kitimat, BC.
Alaska LNG Project
On November 24, 2015, we sold our interest in the Alaska LNG project to the State of Alaska. The proceeds of US$65 million from this sale provide a full recovery of costs incurred to advance the project since January 1, 2014 including a carrying charge. With this sale, our involvement in developing a pipeline system for commercializing Alaska North Slope natural gas ceases.
|
| | |
| | | |
44 TransCanada Management's discussion and analysis 2015 | | |
BUSINESS RISKS
The following are risks specific to our natural gas pipelines business. See page 94 for information about general risks that affect the company as a whole, including other operational risks, health, safety and environment (HSE) risks and financial risks.
WCSB supply for downstream connecting pipelines
Many of our North American natural gas pipelines and transmission infrastructure assets depend largely on supply from the WCSB. We continue to monitor any changes in our customer’s gas production plans and how these changes may impact our existing assets and new project schedules. There is competition for this supply from several pipelines within the basin. An overall decrease in production and/or competing demand for supply could impact throughput on WCSB connected pipelines that, in turn, could impact overall revenues generated. The WCSB has considerable reserves, but the amount actually produced depends on many variables, including the price of natural gas, basin-on-basin competition, downstream pipeline tolls, demand within the basin and the overall value of the reserves, including liquids content.
Market access
We compete for market share with other natural gas pipelines. New supply basins being developed closer to markets we have historically served may reduce the throughput and/or distance of haul on our existing pipelines and impact revenue. The long-term competitiveness of our pipeline systems and the avoidance of bypass pipelines will depend on our ability to adapt to changing flow patterns by offering alternative transportation services at prices that are acceptable to the market.
Competition for greenfield expansion
We face competition from other pipeline companies seeking opportunities to invest in greenfield natural gas pipeline development opportunities. This competition could result in fewer projects being available that meet our investment hurdles or projects that proceed with lower overall financial returns.
Demand for pipeline capacity
Demand for pipeline capacity is ultimately the key driver that enables pipeline transportation services to be sold. Demand for pipeline capacity is created by supply and market competition, variations in economic activity, weather variability, natural gas pipeline and storage competition and pricing of alternative fuels. Renewal of expiring contracts and the opportunity to charge and collect a toll that the market accepts depends on the overall demand for transportation service. A change in the level of demand for our pipeline transportation services could impact revenues.
Commodity Prices
The cyclical supply and demand nature of commodities and related pricing can have a secondary impact on our business where our shippers may choose to accelerate or delay certain projects. This can impact the timing for the demand of transportation services and/or new gas pipeline infrastructure. As well, sustained low gas prices could impact our shippers' financial situation and their ability to meet their transportation service cost obligations.
|
| | |
| | | |
| | TransCanada Management's discussion and analysis 2015 45
|
Regulatory risk
Decisions by regulators can have an impact on the approval, timing, construction, operation and financial performance of our natural gas pipelines. There is a risk that decisions are delayed or are not favourable and therefore could impact revenues and the opportunity to further invest capital in our systems. There is also risk of a regulator disallowing a portion of our prudently incurred costs, now or at some point in the future.
The regulatory approval process for larger infrastructure projects, including the time it takes to receive a decision, could be slowed or unfavorable due to the influence from the evolving role of activists and their impact on public opinion and government policy related to natural gas pipeline infrastructure development.
Increased scrutiny of operating processes by the regulator or other enforcing agencies has the potential to increase operating costs. There is a risk of an impact to income if these costs are not fully recoverable.
We continuously monitor regulatory developments and decisions to determine the possible impact on our gas pipelines business. We also work closely with our stakeholders in the development of rate, facility and tariff applications and negotiated settlements, where possible.
Construction and Operations
Constructing and operating our pipelines to ensure transportation services are provided safely and reliably is essential to the success of our business. Interruptions in our pipeline operations impacting our throughput capacity and may result in reduced revenue and can affect corporate reputation as well as customer and public confidence in our operations. We manage this by investing in a highly skilled workforce, hiring third party inspectors during construction, operating prudently, using risk-based preventive maintenance programs and making effective capital investments. We use pipeline inspection equipment to regularly check the integrity of our pipelines, and repair or replace sections whenever necessary. We also calibrate the meters regularly to ensure accuracy, and continuously maintain compression equipment to ensure safe and reliable operation.
|
| | |
| | | |
46 TransCanada Management's discussion and analysis 2015 | | |
Liquids Pipelines
Our existing liquids pipeline infrastructure connects Alberta and U.S. crude oil supplies to U.S. refining markets in Illinois, Oklahoma and Texas, as well as connecting U.S. crude oil supplies from the Cushing, Oklahoma hub to refining markets in the U.S Gulf Coast. Our proposed future pipeline infrastructure would also connect Canadian and U.S. crude oil supplies to refining markets in eastern Canada and overseas export markets, and expand capacity for Canadian and U.S. crude oil to access U.S. markets. We will also pursue enhancing our transportation service offerings to other areas of the liquids pipelines business value chain.
|
|
| Strategy at a glance |
| Our focus is on accessing and delivering growing North American liquids supply to key markets by expanding our liquids pipelines infrastructure to deliver directly from supply regions seamlessly along a contiguous path to the market. |
| Although crude oil production growth is currently slowing as a result of slow demand growth, we are focused on maximizing the value from our current operating assets, securing organic growth around these assets, identifying acquisition opportunities in the current lower crude oil price environment and positioning our business development activities to capture opportunities when the environment recovers. |
| We are also expanding transportation service offerings to other areas of the liquids pipelines business value chain such as condensate transportation or ancillary services such as short and long term storage of liquids and liquids marketing, which complement our pipeline transportation infrastructure. |
| Continued development and construction of our proposed infrastructure projects will provide North America with a crucial liquids transportation network to transport growing supply directly to key markets and provide opportunities for us to further expand our liquids pipelines business. |
Highlights from 2015
| |
| • | Increased average throughput on Keystone Pipeline by 30,000 Bbl/d and increased long term contracts to 545,000 Bbl/d |
| |
| • | Finalized definitive agreements with Magellan Midstream Partners L.P. (Magellan), to jointly develop a connection between our Houston Tank Terminal and the Magellan delivery system enhancing our crude oil infrastructure connectivity to Houston and Texas City area refineries and terminals |
| |
| • | Finalized definitive agreements between Keyera Corp. and our Grand Rapids pipeline to enable Alberta oil sands producers to gain access to a reliable and cost effective source of diluent |
| |
| • | Created a liquids marketing business to expand our service offerings to other areas of the liquids pipelines business value chain. Marketing transactions will commence in 2016 |
| |
| • | Throughout 2015, the Keystone XL cross border permit application experienced multiple delays from the DOS and was ultimately denied. We have launched legal and NAFTA challenges in response to the denial. We remain supportive of Keystone XL and are reviewing our options which include filing a new U.S. Presidential permit application |
| |
| • | Achieved significant construction progress on our regional Alberta projects, the Grand Rapids and Northern Courier pipeline systems |
| |
| • | Filed an amendment to Energy East’s existing application with the NEB that adjusts the proposed route, scope and capital cost of the Energy East pipeline project based on extensive landowner, environmental, community and customer input |
|
| | |
| | | |
| | TransCanada Management's discussion and analysis 2015 47
|
|
| | |
| | | |
48 TransCanada Management's discussion and analysis 2015 | | |
We are the operator of all of the following pipelines and properties.
|
| | | | | | | | |
| | | | length | | description | | ownership |
|
| |
| | Liquids pipelines | | | | | | |
| |
| 25 | Keystone Pipeline System | | 4,247 km (2,639 miles) | | Transports crude oil from Hardisty, Alberta, to U.S. markets at Wood River and Patoka Illinois, Cushing, Oklahoma, and Port Arthur, Texas | | 100 | % |
| | | | | | | | |
| 26 | Cushing Marketlink and Terminal | | | | Terminal and pipeline facilities to transport crude oil from the market hub at Cushing, Oklahoma to the Port Arthur, Texas refining market on facilities that form part of the Keystone Pipeline System | | 100 | % |
| |
| | Under construction | | | | | | |
| |
27 28 | Houston Lateral and Houston Terminal | | 77 km (48 miles) | | To extend the Keystone Pipeline System to the Houston, Texas refining market | | 100 | % |
| | | | | | | | |
| 29 | Grand Rapids Pipeline | | 460 km
(287 miles) | | To transport crude oil and diluent between the producing area northwest of Fort McMurray, Alberta and the Edmonton/Heartland, Alberta market region | | 50 | % |
| | | | | | | | |
| 30 | Northern Courier Pipeline | | 90 km
(56 miles) | | To transport bitumen and diluent between the Fort Hills mine site and Suncor Energy's terminal located north of Fort McMurray, Alberta | | 100 | % |
| |
| | In development | | | | | | |
| |
| 31 | Bakken Marketlink | | | | To transport crude oil from the Williston Basin producing region in North Dakota and Montana to Cushing, Oklahoma on facilities that form part of Keystone XL | | 100 | % |
| | | | | | | | |
| 32 | Keystone Hardisty Terminal | | | | Crude oil terminal located at Hardisty, Alberta, providing western Canadian producers with crude oil batch accumulation tankage and access to the Keystone Pipeline System | | 100 | % |
| | | | | | | | |
| 33 | Keystone XL | | 1,897 km
(1,179 miles) | | To transport crude oil from Hardisty, Alberta to Steele City, Nebraska to expand capacity of the Keystone Pipeline System | | 100 | % |
| | | | | | | | |
34 35 | Heartland Pipeline and TC Terminals | | 200 km (125 miles) | | Terminal and pipeline facilities to transport crude oil from the Edmonton/Heartland, Alberta region to facilities in Hardisty, Alberta | | 100 | % |
| | | | | | | | |
| 36 | Energy East Pipeline | | 4,600 km
(2,850 miles) | | To transport crude oil from western Canada to eastern Canadian refineries and export markets | | 100 | % |
| | | | | | | | |
| 37 | Upland Pipeline | | 460 km
(285 miles) | | To transport crude oil from, and between, multiple points in North Dakota and interconnect with the Energy East Pipeline at Moosomin, Saskatchewan | | 100 | % |
|
| | |
| | | |
| | TransCanada Management's discussion and analysis 2015 49
|
RESULTS
The following is a reconciliation of comparable EBITDA and comparable EBIT (our non-GAAP measures) to segmented earnings (the equivalent GAAP measure). Comparable depreciation and amortization is also a non-GAAP measure. See page 10 for more information on non-GAAP measures we use and page 108 for reconciliation to its GAAP equivalent.
|
| | | | | | | | | |
| year ended December 31 | | | | | | |
| (millions of $) | | 2015 |
| | 2014 |
| | 2013 |
|
| | | | | | | |
| Comparable EBITDA | | 1,322 |
| | 1,059 |
| | 752 |
|
| Comparable depreciation and amortization | | (266 | ) | | (216 | ) | | (149 | ) |
| Comparable EBIT | | 1,056 |
| | 843 |
| | 603 |
|
| Specific item: | | | | | |
|
|
| Keystone XL impairment charge | | (3,686 | ) | | — |
| | — |
|
| Segmented (loss)/earnings | | (2,630 | ) | | 843 |
| | 603 |
|
Liquids Pipelines segmented earnings decreased by $3,473 million to a segmented loss of $2,630 million in 2015 compared to 2014. The segmented loss included a $3,686 million pre-tax impairment charge related to Keystone XL and related projects. See Significant Events on page 54 and Critical accounting estimates on page 101 for more information. This amount has been excluded from our calculation of comparable EBIT. The remainder of the Liquids Pipelines segmented earnings are equivalent to comparable EBIT, which, along with comparable EBITDA, are discussed below.
|
| | | | | | | | | |
year ended December 31 | | | | | | |
| (millions of $) | | 2015 |
| | 2014 |
| | 2013 |
|
| | | | | | | |
| Keystone Pipeline System | | 1,345 |
| | 1,073 |
| | 766 |
|
| Liquids Pipelines Business Development | | (23 | ) | | (14 | ) | | (14 | ) |
| Liquids Pipelines – comparable EBITDA | | 1,322 |
| | 1,059 |
| | 752 |
|
| Comparable depreciation and amortization | | (266 | ) | | (216 | ) | | (149 | ) |
| Liquids Pipelines – comparable EBIT | | 1,056 |
| | 843 |
| | 603 |
|
| Comparable EBIT denominated as follows: | | | | | | |
| Canadian dollars | | 236 |
| | 215 |
| | 201 |
|
| U.S. dollars | | 640 |
| | 570 |
| | 389 |
|
| Foreign exchange impact | | 180 |
| | 58 |
| | 13 |
|
| Liquids Pipelines – comparable EBIT | | 1,056 |
| | 843 |
| | 603 |
|
Comparable EBITDA
Comparable EBITDA for the Keystone Pipeline System was $272 million higher this year than in 2014. This increase was primarily due to:
| |
| • | incremental earnings from the Keystone Gulf Coast extension which was placed in service in January 2014 |
| |
| • | a stronger U.S. dollar which had a positive impact on the Canadian dollar equivalent comparable earnings |
from our U.S. operations.
Comparable EBITDA for the Keystone Pipeline System was $307 million higher in 2014 than in 2013. This increase was primarily due to:
| |
| • | incremental earnings from the Keystone Gulf Coast extension which was placed in service in January 2014 |
| |
| • | a stronger U.S. dollar which had a positive impact on the Canadian dollar equivalent comparable earnings |
from our U.S. operations.
|
| | |
| | | |
50 TransCanada Management's discussion and analysis 2015 | | |
Comparable depreciation and amortization
Comparable depreciation and amortization was $50 million higher in 2015 than in 2014 mainly due to the effect of a stronger U.S. dollar. Comparable depreciation and amortization was $67 million higher in 2014 than in 2013 mainly due to the Keystone Gulf Coast extension being placed in service.
OUTLOOK
Earnings
Excluding specified items, our 2016 earnings are expected to be slightly lower than our 2015 earnings due to short-term contracts expiring on Cushing Marketlink and weakened market conditions related to the lower crude oil price environment. Following our Keystone XL impairment charge, future expenditures on the project will be expensed pending further advancement of this project and we have ceased capitalizing interest on the project effective November 6, 2015, the date of the Presidential permit denial.
Over time, we expect Liquids Pipelines' earnings to increase as projects currently under construction and in development are placed in service.
Capital spending
We spent a total of $1.3 billion in 2015 on capital spending in Liquids Pipelines. We expect to spend approximately $1.2 billion on capital spending and equity investments in 2016, primarily on Grand Rapids Phase 1, Northern Courier and Energy East.
UNDERSTANDING THE LIQUIDS PIPELINES BUSINESS
Our liquids business currently consists of pipelines which efficiently move crude oil from major supply sources to markets where crude oil can be refined into various petroleum products and ancillary services such as short and long term storage of liquids. We have established a liquids marketing business to expand into other areas of the liquids business value chain. The Keystone Pipeline System, our largest liquids pipelines asset, moves approximately 20 per cent of western Canadian crude oil exports to key refining markets in the U.S. Mid-West and the Gulf Coast and has transported over 1.1 billion barrels of crude oil since operations began in 2010.
We generate earnings from our liquids business mainly by providing pipeline capacity to shippers supported by long term contracts with fixed monthly payments that are not linked to actual throughput volumes or to the price of the commodity. Uncontracted capacity is offered to the market on a spot basis which provides opportunities to generate incremental earnings.
The terms of service and fixed monthly payments are determined by transportation service arrangements negotiated with shippers. These long term arrangements provide for the recovery of costs we incur to construct and operate the system.
Business environment and strategic priorities
Over the past decade, North American crude oil production has increased significantly. However, slowing global demand combined with OPEC's market share strategy of increased production has resulted in a current global oversupply situation, which continues to put downward pressure on crude oil prices. Supply from high cost producers is expected to decrease in this lower price environment throughout the course of the year while supply and demand are expected to evolve to a more balanced position towards the end of the year.
Our liquids pipelines business is well positioned to endure the impact of short term commodity price fluctuations and supply adjustments. Our existing operations and development projects are supported by long term contracts where we have agreed to provide pipeline capacity to our customers in exchange for fixed monthly payments. The cyclical supply and demand nature of commodities and their price movements can have a secondary impact on our business where our shippers may choose to accelerate or delay certain new projects. This can impact the timing for the demand of transportation services and/or new liquids infrastructure.
We continue to advance a number of growth opportunities in the near term and will closely monitor the market place for strategic asset acquisition opportunities. Commodity price fluctuations are a normal part of the business cycle. Longer-term, we expect global demand for crude oil will continue to grow, ultimately resulting in continued growth in North American crude oil supply production and demand for new pipeline infrastructure. Our growing position in the liquids transportation business is creating a significant platform to capture these future growth opportunities.
|
| | |
| | | |
| | TransCanada Management's discussion and analysis 2015 51
|
Supply outlook
Canada
Alberta produces the majority of the crude oil in the WCSB which is the primary source of crude oil supply for the Keystone Pipeline System. In its 2015 Crude Oil Forecast, Markets and Transportation report, the Canadian Association of Petroleum Producers (CAPP) estimates 2016 WCSB crude oil production will reach 1.3 million Bbl/d of conventional crude oil and condensate and 2.5 million Bbl/d of oil sands crude oil, for a total of approximately 3.8 million Bbl/d. The report forecasts WCSB crude oil production will increase to 4.4 million Bbl/d by 2020 and to 5.2 million Bbl/d by 2030. Even in the current challenging price environment, CAPP estimates current projects that are either in advanced stages of development or construction will add nearly 720,000 Bbl/d of WCSB supply between 2016 and 2020.
According to the May 2015 Alberta’s Energy Reserves 2014 and Supply/Demand Outlook 2015-2024, the Alberta Energy Regulator (AER) estimates there is approximately 166 billion barrels of economically and technically recoverable conventional and oil sands reserves in Alberta. Oil sands projects have a long reserve life. In its 2014 Responsible Canadian Energy report, CAPP estimates a typical oil sands mine has a 25 to 50 year lifespan, while an in-situ operation will run 10 to 15 years on average. This longevity aligns with the producer's desire to secure long term connectivity of their reserves to market. The Keystone Pipeline System, as well as projects under development such as the proposed Energy East Pipeline, are underpinned by long term contracts.
In November 2015, the Alberta Government developed a Climate Leadership Plan which includes phasing out of coal-generated electricity, implementing a new carbon price on GHG emissions, capping oil sands emissions at a maximum of 100 Megatonnes per year and reducing methane emissions. While details on this plan are forthcoming, it is anticipated that this plan would still allow for significant oil sands supply growth and would support future development of pipeline infrastructure to connect WCSB crude oil supply to markets.
U.S.
The U.S. Energy Information Administration (EIA) forecasts over 1.0 million Bbl/d of U.S. production growth from 2015 to 2020, peaking at 10.6 million Bbl/d by 2020. Higher production volumes result mainly from technological advancements in the development of shale oil production. EIA forecasts shale oil production peaking at approximately 5.6 million Bbl/d by 2020 and declining after 2022.
North American Liquids Basins
|
| | |
| | | |
52 TransCanada Management's discussion and analysis 2015 | | |
U.S. shale oil supply growth originates primarily from the Williston basin in North Dakota and Montana, the Permian basin in south Texas and Woodford shale area of the Arkoma basin in Oklahoma. These shale production areas also represent some of the sources of crude oil supply for our Cushing Marketlink system.
The growth in U.S. production has contributed to increased crude oil supply at the Cushing, Oklahoma market hub and has resulted in increased demand for additional pipeline capacity between Cushing, Oklahoma and the U.S. Gulf Coast refining market. Our Cushing Marketlink system, with connectivity to Houston and Port Arthur, Texas and Lake Charles, Louisiana refining markets, is well positioned to transport this growing supply.
Even with growth in U.S. crude oil production, which displaced foreign light imports from countries such as Nigeria and Saudi Arabia, the EIA report predicts the U.S. will remain a net importer of crude oil, importing 7.6 million Bbl/d into 2040. U.S. Gulf Coast refineries are mainly configured to process heavy and medium crude oil and cannot easily switch to processing light shale oil in large quantities without significant capital investments. U.S. Gulf Coast refineries currently require approximately 3.2 million Bbl/d of heavy and medium crude oil, and the level of demand is not expected to change significantly in the near or longer term. The Keystone Pipeline System is well positioned to deliver Canadian crude oil to this significant market.
The U.S. government recently lifted the 40 year ban on crude oil exports in December 2015 which removed the Federal Government restrictions on the export of crude oil. The decision is expected to help draw the supply from U.S. producing regions, including Cushing, Oklahoma, to tidewater and we anticipate seeing an increase in demand for coastal storage and export terminal facilities. Our Houston Lateral and Terminal is well positioned to capture the growing demand in this market.
Strategic priorities
We are focused on advancing our current portfolio of commercially secured projects to connect growing Canadian and U.S. crude oil supply to key markets, maximizing the value from our current operating assets, identifying acquisition opportunities and expanding across our liquids pipelines business value chain.
We continue to extend our Keystone Pipeline System’s access in the U.S. Gulf Coast market to over 4.5 million Bbl/d of regional refinery centres in Houston and Port Arthur, Texas and Lake Charles, Louisiana. Expanding the Keystone Pipeline System’s market access reach is expected to enhance both short and long haul volumes. Our joint venture with Magellan Midstream Partners, a connection between our Houston Lateral and Terminal and Magellan's Houston and Texas City, Texas delivery system, will enhance our crude oil connectivity in the Houston area. In 2015, we agreed to build a lateral to the CITGO Petroleum (CITGO) Sour Lake, Texas terminal which supplies the Lake Charles, Louisiana marketplace.
Securing regulatory approval for our $15.7 billion Energy East pipeline remains a key priority. In late 2015, we filed an amendment to the existing project application with the NEB that adjusts the proposed route, scope and capital cost of the project reflecting refinements and scope changes including the removal of the port in Québec. The project will continue to serve the three eastern Canadian refineries along the route in Montréal and Québec City, Québec and Saint John, New Brunswick.
Within Alberta, we are leveraging our extensive natural gas pipeline footprint and experience to develop a regional liquids pipelines business. Growth in oil sands production is driving the need for new intra-Alberta pipelines, like our 50 per cent interest in the Grand Rapids Pipeline, that can move crude oil production from the source to market hubs at Edmonton/Heartland and Hardisty, Alberta as well as diluent from Edmonton/Heartland region to the production area in northern Alberta. Our joint venture with Keyera Corp. will enhance our ability to access a reliable and cost effective source of diluent for the Grand Rapids Pipeline. In addition, our Northern Courier Pipeline will facilitate movements from new oil sands mine supply to market. When supported by market conditions, the Heartland Pipeline and TC Terminals and Keystone Hardisty Terminal projects will support these market hubs which will allow shippers to connect with the Keystone Pipeline System, Energy East Pipeline and other pipelines that transport crude oil outside of Alberta and ultimately provide our customers with a contiguous seamless path from production to market.
We have created a liquids marketing business which will provide incremental revenue by entering into short- or long-term pipeline or storage terminal capacity contracts, primarily on our assets, increasing the utilization of those assets and earning the market value of the capacity.
In this challenging crude oil price environment, we will closely monitor the market place for strategic asset acquisitions to enhance our system connectivity or expand our footprint within North America. We remain disciplined in our approach and will position our business development activities strategically to capture the opportunities as the business environment recovers.
|
| | |
| | | |
| | TransCanada Management's discussion and analysis 2015 53
|
SIGNIFICANT EVENTS
Keystone Pipeline System
In fourth quarter 2015, we secured additional long term contracts bringing our total contract position up to 545,000 Bbl/d. By the end of 2015, the Keystone Pipeline System had delivered more than 1.1 billion barrels of crude oil to U.S. markets since it began operating in 2010.
CITGO Sour Lake Pipeline
In 2015, we entered into an agreement with CITGO to construct a US$65 million pipeline connection between the Keystone Pipeline System to provide access to CITGO’s Sour Lake, Texas terminal, which supplies their 425,000 Bbl/d Lake Charles, Louisiana refinery. The connection is targeted to be operational in fourth quarter 2016.
Houston Lateral and Terminal
Construction continues on the Houston Lateral pipeline and tank terminal which will extend the Keystone Pipeline System to Houston, Texas. The terminal is expected to have initial storage capacity for 700,000 barrels of crude oil. The pipeline and terminal are expected to be completed in second quarter 2016.
On January 13, 2016, we entered into an agreement with Magellan to connect our Houston Terminal to Magellan's Houston and Texas City, Texas delivery system. We will own 50 per cent of this US$50 million pipeline project which will enhance connections for our Keystone Pipeline System to the Houston market. The pipeline is expected to be operational during the first half of 2017, subject to the receipt of all necessary rights-of-way, permits and regulatory approvals.
Keystone XL
The decision on the Keystone XL permit application was delayed throughout 2015 by the DOS and was ultimately denied in November 2015.
At December 31, 2015, as a result of the denial of the Presidential permit, we evaluated our investment in Keystone XL and related projects, including Keystone Hardisty Terminal, for impairment. As a result of our analysis, we determined that the carrying amount of these assets was no longer recoverable, and recognized a total non-cash impairment charge of $3.7 billion ($2.9 billion after-tax). The impairment charge was based on the excess of the carrying value of $4.3 billion over the fair value of $621 million, which includes $93 million fair value for Keystone Hardisty Terminal. The Keystone Hardisty Terminal remains on hold with an estimated in-service date to be driven by market need. The calculation of this impairment is discussed further in the Critical accounting estimates section on page 101.
In November 2015, we withdrew our application to the Nebraska Public Service Commission for approval of the route for Keystone XL in the state. The application was initially filed in October 2015. The withdrawal was made without prejudice to potentially refile if we elect to pursue the project.
On January 5, 2016, the South Dakota Public Utility Commission accepted Keystone’s certification that it continues to comply with the conditions in its existing 2010 permit authority in the state.
On January 6, 2016, we filed a Notice of Intent to initiate a claim under Chapter 11 of the NAFTA in response to the U.S. Administration’s decision to deny a Presidential permit for the Keystone XL Pipeline on the basis that the denial was arbitrary and unjustified. Through the NAFTA claim, we are seeking to recover more than US$15 billion in costs and damages that we estimated to have suffered as a result of the U.S. Administration’s breach of its NAFTA obligations. This litigation is in a preliminary stage and the likelihood of success and resulting impact on our financial position or results of operation is unknown at this time.
On the same day, we filed a lawsuit in the U.S. Federal Court in Houston, Texas, asserting that the U.S. President’s decision to deny construction of Keystone XL exceeded his power under the U.S. Constitution. The federal court lawsuit does not seek damages, but rather a declaration that the permit denial is without legal merit and that no further Presidential action is required before construction of the pipeline can proceed.
We remain supportive of Keystone XL and continue to review our options, including filing a new application for a cross-border permit.
|
| | |
| | | |
54 TransCanada Management's discussion and analysis 2015 | | |
Energy East Pipeline
In April 2015, we announced that the proposed marine terminal and associated tank terminal in Cacouna, Québec will not be built as a result of the recommended reclassification of the beluga whale, indigenous to the site, as an endangered species. Following consultation of stakeholders and shippers, we announced in November 2015 the intention to amend the Energy East application to remove a port in Québec and proceed with a single marine terminal in Saint John, New Brunswick. On December 17, 2015, we filed an amendment to the existing project application with the NEB that adjusted the proposed route, scope and capital cost of the project reflecting refinement and scope change including the removal of the port in Québec. The project will continue to serve the three eastern Canadian refineries along the route in Montréal and Québec City, Québec and Saint John, New Brunswick.
Changes to the project schedule and scope, as reflected in the amendment, have contributed to a new project capital cost of $15.7 billion, excluding the transfer of Canadian Mainline natural gas assets. Of the total long-term shipping commitments for the project of 995,000 bbl/d, with an average term of 19 years, 725,000 bbl/d designate the Québec refineries or Saint John, New Brunswick as delivery points. A total of 270,000 bbl/d remains under contract for delivery to the Québec market, including a Québec based marine terminal, and without a Saint John, New Brunswick delivery point. Discussions are ongoing with those shippers to remove the Québec marine terminal from the terms of their shipping contracts.
Subject to regulatory approvals, the pipeline is anticipated to commence deliveries by the end of 2020. However, on January 27, 2016, the Canadian federal government announced interim measures for pipeline reviews, including of the Energy East project. The government announced it will undertake additional consultations with aboriginal groups, help facilitate expanded public input into the NEB and assess Energy East's impact on upstream GHG emissions. The government will seek a six month extension to the NEB’s legislative review and a three month extension to the legislative time limit for the government’s decision which will extend the total review time to 27 months. We are reviewing these changes and will assess the impact to the project.
Northern Courier Pipeline
Construction continues on the pipeline system to transport bitumen and diluent between the Fort Hills mine site and Suncor Energy’s terminal located north of Fort McMurray, Alberta. The project is fully underpinned by long term contracts with the Fort Hills partnership. We expect the pipeline system to be ready for service in 2017.
Heartland Pipeline and TC Terminals
The Heartland Pipeline is a crude oil pipeline connecting the Edmonton/Heartland, Alberta market region to facilities in Hardisty, Alberta. TC Terminals is a terminal facility in the Heartland industrial area north of Edmonton, Alberta located at the start of the Heartland Pipeline. Construction has been delayed and the in-service date for the projects will be determined and aligned with industry and our customer's requirements.
Grand Rapids Pipeline
Grand Rapids Pipeline is a dual 36-inch/20-inch crude oil and diluent pipeline system connecting producing areas northwest of Fort McMurray, Alberta to terminals in the Edmonton/Heartland, Alberta region. We have a joint partnership with Brion Energy to develop the Grand Rapids Pipeline with each owning 50 per cent of the pipeline project. We are constructing the project and will operate Grand Rapids once complete.
Construction is progressing on phase one, which includes a 20-inch pipeline from northern Alberta to Edmonton, Alberta and a 36-inch pipeline between Edmonton and Fort Saskatchewan, Alberta. We anticipate phase one to begin crude oil transportation service in 2017. The construction of phase two, the larger 36-inch pipeline, is currently delayed and the in-service date will be subject to sufficient market demand.
In August 2015, we announced a joint venture between Grand Rapids and Keyera Corp. for provision of diluent transportation service on the 20-inch pipeline between Edmonton and Fort Saskatchewan, Alberta, which is anticipated to be in service in the second half of 2017. The joint venture will be incorporated into phase one of Grand Rapids and it will provide enhanced diluent supply alternatives to our shippers.
Upland Pipeline
In April 2015, we filed an application to obtain a U.S. Presidential permit for the Upland Pipeline. The pipeline will provide crude oil transportation from and between multiple points in North Dakota and interconnect with the Energy East Pipeline System at Moosomin, Saskatchewan. Subject to regulatory approvals, we anticipate the Upland Pipeline to be in service in 2020. The commercial contracts we have executed for Upland Pipeline are conditioned on the Energy East project proceeding. We are reviewing the Canadian federal government's interim measures for pipeline reviews and will assess the impact to Upland Pipeline.
|
| | |
| | | |
| | TransCanada Management's discussion and analysis 2015 55
|
BUSINESS RISKS
The following are risks specific to our liquids pipelines business. See page 94 for information about general risks that affect the company as a whole, including other operational risks, health, safety and environment (HSE) risks, and financial risks.
Operational
Optimizing and maintaining availability of our liquids pipelines is essential to the success of our Liquids Pipelines business. Interruptions in our pipeline operations impact our throughput capacity and may result in reduced fixed payment revenues and spot volume opportunities. We manage this by investing in a highly skilled workforce, operating prudently, using risk-based preventive maintenance programs and making effective capital investments. We use internal inspection equipment to check our pipelines regularly and repair them whenever necessary.
While the majority of the power costs to operate the Keystone Pipeline System are passed through to our shippers, a portion of our volume is moved under an all-in fixed toll structure where we are exposed to changing power costs which may impact our earnings.
Regulatory and Government
Decisions by Canadian and U.S. regulators can have a significant impact on the approval, construction, operation and financial performance of our liquids pipelines. Public opinion about crude oil development and production may also have an adverse impact on the regulatory process. In conjunction with this, there are some individuals and interest groups that are expressing their opposition to crude oil production by lobbying against the construction of liquids pipelines. Lastly, changing environmental requirements or revisions to current regulatory process may impact the timing to obtain permit approvals for our liquids pipelines. We manage these risks by continuously monitoring regulatory and government developments and decisions to determine their possible impact on our liquids pipelines business and by working closely with our stakeholders in the development and operation of the assets.
Execution, capital costs and permitting
We make substantial capital commitments in large infrastructure projects based on the assumption that the new assets will offer an attractive return on investment in the future. Under some contracts, we share the cost of these risks with customers and while we carefully consider the expected cost of our capital projects, under some contracts we bear greater capital cost risk which may impact our return on these projects. Our capital projects are also subject to permitting risk which may result in construction delays, increased capital cost and, potentially, reduced investment returns.
Crude oil supply and demand for pipeline capacity
A decrease in demand for refined crude oil products could adversely impact the price that crude oil producers receive for their product. Lower crude oil prices could mean producers may curtail their investment in the further development of crude oil supplies. Depending on the severity, these factors would negatively impact opportunities to expand our liquids pipelines infrastructure and, in the longer term, to re-contract with shippers as current agreements expire.
Competition
As we continue to develop a competitive position in the North American liquids transportation market to transport growing crude oil and condensate supplies between key North American producing regions and refining and export markets, we face competition from other midstream companies which also seek to transport these crude oil and condensate supplies to the same markets. Our success is dependent on our ability to offer and contract transportation services on terms that are market competitive.
Liquids marketing
The liquids marketing business will generate revenue by capitalizing on asset utilization opportunities by entering into short-term or long-term pipeline or storage terminal capacity contracts.
Volatility in commodity prices and changing market conditions could impact the value of those capacity contracts. Availability of alternative pipeline systems that can deliver into the same areas can also impact contract value. The liquids marketing business complies with our risk management polices which are described in Other information - Risks and risk management.
|
| | |
| | | |
56 TransCanada Management's discussion and analysis 2015 | | |
Energy
Our Energy business includes a portfolio of power generation assets in Canada and the U.S., and unregulated natural gas storage assets in Alberta.
We own, control or are developing approximately 13,100 MW of generation capacity powered by natural gas, nuclear, coal, hydro, wind and solar. Our power business in Canada is mainly located in Alberta, Ontario and Québec. Our power business in the U.S. is located in New York, New England, Pennsylvania and Arizona. The assets are largely supported by long-term contracts and some represent low-cost baseload generation, while others are essential to providing capacity to the area in which they are located.
We conduct wholesale and retail electricity marketing and trading throughout North America from our offices in Alberta, Ontario and Massachusetts to actively manage our commodity exposure and provide higher returns.
We own and operate approximately 118 Bcf of unregulated natural gas storage capacity in Alberta and hold a contract with a third party for additional storage, in total accounting for approximately one-third of all storage capacity in the province. When combined with the regulated natural gas storage in Michigan (part of the Natural Gas Pipelines segment), we provide over 350 Bcf of natural gas storage and related services.
|
|
| Strategy at a glance |
| Build upon our diverse portfolio of contracted and low cost power generation assets located in core North American markets, while maximizing the value of our existing investments through safe and reliable operations |
• Leverage our experience building, operating and investing in a diverse set of generation technologies, fuel types and commercial structures to replace aging infrastructure and participate in the shift from higher carbon emitting electricity sources to natural gas-fired, renewables and non-emitting resources |
• Pursue organic growth and repowering opportunities at our existing sites to capture more value from our current investments |
• Maximize the value of our existing unregulated Alberta natural gas storage assets. Natural gas storage's role in balancing and providing flexibility to the natural gas system is expected to grow as the market expands and becomes more dynamic as a result of the electric grid’s increased reliance on natural gas-fired capacity and from the addition of LNG export terminals |
Highlights from 2015
| |
| • | Organic growth at Bruce Power: executed agreement with the IESO to extend the operating life of the Bruce Power facility to 2064 and acquired an additional ownership interest in this facility, a primary source of emission-less generation for Ontario underpinned by a long-term contract |
| |
| • | Acquisition of Ironwood power plant: strategically located natural gas-fired investment in proximity to the Marcellus shale gas play with energy and capacity revenues in the PJM power market, North America’s largest and most liquid energy region. Facility is well positioned in a market that is transitioning away from coal-fired to natural gas generation and complements our existing wholesale marketing business |
| |
| • | Amendment to Bécancour contract: executed agreement with Hydro Québec allowing for dispatch of up to 570 MW of firm peak winter capacity for a term of 20 years beginning December 2016. Annual payments are incremental to existing capacity payments |
| |
| • | Began construction of the Napanee 900 MW natural gas-fired power plant |
|
| | |
| | | |
| | TransCanada Management's discussion and analysis 2015 57
|
|
| | |
| | | |
58 TransCanada Management's discussion and analysis 2015 | | |
We are the operator of all of our Energy assets, except for the Sheerness, Sundance A and Sundance B PPAs, Cartier Wind, Bruce and Portlands Energy.
|
| | | | | | | | | | | | | | | |
| | | generating
capacity (MW) | | | type of fuel | | description | | location | | ownership |
| | | |
| | | Canadian Power 8,571 MW of power generation capacity (including facilities under construction) |
| | | Western Power 2,609 MW of power supply in Alberta and the western U.S. |
| 38 |
| | Bear Creek | | 80 |
| | natural gas | | Cogeneration plant | | Grande Prairie, Alberta | | 100 | % |
| 39 |
| | Carseland | | 80 |
| | natural gas | | Cogeneration plant | | Carseland, Alberta | | 100 | % |
| 40 |
| | Coolidge | | 575 |
| | natural gas | | Simple-cycle peaking facility | | Coolidge, Arizona | | 100 | % |
| 41 |
| | Mackay River | | 165 |
| | natural gas | | Cogeneration plant | | Fort McMurray, Alberta | | 100 | % |
| 42 |
| | Redwater | | 40 |
| | natural gas | | Cogeneration plant | | Redwater, Alberta | | 100 | % |
| 43 |
| | Sheerness PPA | | 756 |
| | coal | | Output contracted under PPA | | Hanna, Alberta | | 100 | % |
| 44 |
| | Sundance A PPA | | 560 |
| | coal | | Output contracted under PPA | | Wabamun, Alberta | | 100 | % |
| 44 |
| | Sundance B PPA
(Owned by ASTC Power Partnership1) | | 3532 |
| | coal | | Output contracted under PPA | | Wabamun, Alberta | | 50 | % |
| | | Eastern Power 2,939 MW of power generation capacity (including facilities under construction) |
| 45 |
| | Bécancour | | 550 |
| | natural gas | | Cogeneration plant | | Trois-Rivières, Québec | | 100 | % |
| 46 |
| | Cartier Wind | | 3652 |
| | wind | | Five wind power projects | | Gaspésie, Québec | | 62 | % |
| 47 |
| | Grandview | | 90 |
| | natural gas | | Cogeneration plant | | Saint John, New Brunswick | | 100 | % |
| 48 |
| | Halton Hills | | 683 |
| | natural gas | | Combined-cycle plant | | Halton Hills, Ontario | | 100 | % |
| 49 |
| | Portlands Energy | | 2752 |
| | natural gas | | Combined-cycle plant | | Toronto, Ontario | | 50 | % |
| 50 |
| | Ontario Solar | | 76 |
| | solar | | Eight solar facilities | | Southern Ontario and New Liskeard, Ontario | | 100 | % |
| | | Bruce Power 3,023 MW of power generation capacity |
| 51 |
| | Bruce Power | | 3,0232 |
| | nuclear | | Eight operating reactors | | Tiverton, Ontario | | 48.5 | % |
|
| | |
| | | |
| | TransCanada Management's discussion and analysis 2015 59
|
|
| | | | | | | | | | | | | | | |
| | | generating
capacity (MW) | | | type of fuel | | description | | location | | ownership |
| | | |
| | | U.S. Power 4,533 MW of power generation capacity |
| 52 |
| | Kibby Wind | | 132 |
| | wind | | Wind farm | | Kibby and Skinner Townships, Maine | | 100 | % |
| 53 |
| | Ocean State Power | | 560 |
| | natural gas | | Combined-cycle plant | | Burrillville, Rhode Island | | 100 | % |
| 54 |
| | Ravenswood | | 2,480 |
| | natural gas and oil | | Multiple-unit generating facility using dual fuel-capable steam turbine, combined-cycle and combustion turbine technology | | Queens, New York | | 100 | % |
| 55 |
| | TC Hydro | | 583 |
| | hydro | | 13 hydroelectric facilities, including stations and associated dams and reservoirs | | New Hampshire, Vermont and Massachusetts (on the Connecticut and Deerfield rivers) | | 100 | % |
| 56 |
| | Ironwood3 | | 778 |
| | natural gas | | Combined-cycle plant | | Lebanon, Pennsylvania | | 100 | % |
| | | Unregulated natural gas storage 118 Bcf of non-regulated natural gas storage capacity |
| 57 |
| | CrossAlta | | 68 Bcf |
| | | | Underground facility connected to the NGTL System | | Crossfield, Alberta | | 100 | % |
| 58 |
| | Edson | | 50 Bcf |
| | | | Underground facility connected to the NGTL System | | Edson, Alberta | | 100 | % |
| | | Under construction | | | | | | | | | | |
| 59 |
| | Napanee | | 900 |
| | natural gas | | Combined-cycle plant | | Greater Napanee, Ontario | | 100 | % |
| |
1 | We have a 50 per cent interest in ASTC Power Partnership, which has a PPA for production from the Sundance B power generating facilities. |
| |
2 | Our share of power generation capacity. |
| |
3 | Acquired February 1, 2016. |
|
| | |
| | | |
60 TransCanada Management's discussion and analysis 2015 | | |
RESULTS
The following is a reconciliation of comparable EBITDA and comparable EBIT (our non-GAAP measures) to segmented earnings (the equivalent GAAP measure). Comparable depreciation and amortization is also a non-GAAP measure. See page 10 for more information on non-GAAP measures we use and page 108 for reconciliation to its GAAP equivalent.
|
| | | | | | | | | |
| year ended December 31 | | | | | | |
| (millions of $) | | 2015 |
| | 2014 |
| | 2013 |
|
| | | | | | | |
| Comparable EBITDA | | 1,280 |
| | 1,348 |
| | 1,363 |
|
| Comparable depreciation and amortization | | (336 | ) | | (309 | ) | | (294 | ) |
| Comparable EBIT | | 944 |
| | 1,039 |
| | 1,069 |
|
| Specific items (pre-tax): | | | | | | |
| Turbine equipment impairment charge | | (59 | ) | | — |
| | — |
|
| Bruce Power merger – debt retirement charge | | (36 | ) | | — |
| | — |
|
| Cancarb gain on sale | | — |
| | 108 |
| | — |
|
| Niska contract termination | | — |
| | (43 | ) | | — |
|
| Risk management activities | | (37 | ) | | (53 | ) | | 44 |
|
| Segmented earnings | | 812 |
| | 1,051 |
| | 1,113 |
|
Energy segmented earnings were $239 million lower in 2015 than in 2014 and $62 million lower in 2014 than in 2013 and included the following specific items that have been excluded from comparable EBIT:
| |
| • | a $59 million pre-tax charge relating to an impairment in value on turbine equipment previously purchased for a new power development project that did not proceed. Various other projects have recently been evaluated for possible use of this equipment and those evaluations support the impairment of the carrying value. See Critical accounting estimates on page 101 for further information |
| |
| • | a $36 million pre-tax charge related to Bruce Power's retirement of debt in conjunction with the merger of the Bruce A and Bruce B partnerships |
| |
| • | a gain in 2014 of $108 million on the sale of Cancarb Limited and its related power generation business, which closed in April 2014 |
| |
| • | a net loss in 2014 of $43 million resulting from the contract termination payment to Niska Gas Storage effective April 30, 2014 |
| |
| • | unrealized gains and losses from changes in the fair value of certain derivatives used to reduce our exposure to certain commodity price risks as follows: |
|
| | | | | | | | | |
| Risk management activities | | | | | | |
| (millions of $, pre-tax) | | 2015 |
| | 2014 |
| | 2013 |
|
| | | | | | | |
| Canadian Power | | (8 | ) | | (11 | ) | | (4 | ) |
| U.S. Power | | (30 | ) | | (55 | ) | | 50 |
|
| Natural Gas Storage | | 1 |
| | 13 |
| | (2 | ) |
| Total (losses)/gains from risk management activities | | (37 | ) | | (53 | ) | | 44 |
|
The year-over-year variances in these unrealized gains and losses reflect the impact of changes in forward natural gas and power prices and the volume of our positions for these particular derivatives over a certain period of time; however, they do not accurately reflect the gains and losses that will be realized on settlement, or the offsetting impact of other derivative and non-derivative transactions that make up our business as a whole. As a result, we do not consider them representative of our underlying operations.
The specific items noted above have been excluded in our calculation of comparable EBIT. The remainder of the Energy segmented earnings are equivalent to comparable EBIT which, along with comparable EBITDA, are discussed below.
|
| | |
| | | |
| | TransCanada Management's discussion and analysis 2015 61
|
|
| | | | | | | | | |
| year ended December 31 | | | | | | |
| (millions of $) | | 2015 |
| | 2014 |
| | 2013 |
|
| | | | | | | |
| Canadian Power | | |
| | | | |
| Western Power | | 72 |
| | 252 |
| | 355 |
|
Eastern Power1 | | 394 |
| | 350 |
| | 322 |
|
| Bruce Power | | 285 |
| | 314 |
| | 310 |
|
Canadian Power – comparable EBITDA2 | | 751 |
| | 916 |
| | 987 |
|
| Comparable depreciation and amortization | | (190 | ) | | (179 | ) | | (172 | ) |
Canadian Power – comparable EBIT2 | | 561 |
| | 737 |
| | 815 |
|
U.S. Power (US$) | | | | | | |
| U.S. Power – comparable EBITDA | | 418 |
| | 376 |
| | 323 |
|
| Comparable depreciation and amortization | | (105 | ) | | (107 | ) | | (107 | ) |
| U.S. Power – comparable EBIT | | 313 |
| | 269 |
| | 216 |
|
| Foreign exchange impact | | 87 |
| | 27 |
| | 7 |
|
U.S. Power – comparable EBIT (Cdn$) | | 400 |
| | 296 |
| | 223 |
|
| Natural Gas Storage and other | | | | | | |
| Natural Gas Storage and other – comparable EBITDA | | 15 |
| | 44 |
| | 63 |
|
| Comparable depreciation and amortization | | (12 | ) | | (12 | ) | | (12 | ) |
| Natural Gas Storage and other – comparable EBIT | | 3 |
| | 32 |
| | 51 |
|
| Business Development comparable EBITDA and EBIT | | (20 | ) | | (26 | ) | | (20 | ) |
Energy – comparable EBIT2 | | 944 |
| | 1,039 |
| | 1,069 |
|
| Summary | | | | | | |
Energy – comparable EBITDA2 | | 1,280 |
| | 1,348 |
| | 1,363 |
|
| Comparable depreciation and amortization | | (336 | ) | | (309 | ) | | (294 | ) |
Energy – comparable EBIT2 | | 944 |
| | 1,039 |
| | 1,069 |
|
| |
1 | Includes four solar facilities acquired between June and December 2013, three solar facilities acquired in September 2014 and one solar facility acquired in December 2014. |
| |
2 | Includes our share of equity income from our investments in ASTC Power Partnership and Portlands Energy, and our share of comparable income from equity investments from Bruce Power. |
Comparable EBITDA for Energy was $68 million lower in 2015 than in 2014. The decrease was the net effect of:
| |
| • | lower earnings from Western Power as a result of lower realized prices and lower PPA volumes |
| |
| • | higher earnings from U.S. Power due to increased margins and sales volumes to wholesale, commercial and industrial customers, partially offset by lower capacity revenue in New York and lower realized prices at our northeastern U.S. Power facilities |
| |
| • | higher earnings from Eastern Power primarily due to four solar facilities acquired in 2014 |
| |
| • | lower earnings from Bruce Power due to higher operating expenses mostly offset by fewer unplanned outage days at Bruce A, as well as higher operating expenses and lower gains from contracting activities, partially offset by lower lease expense at Bruce B |
| |
| • | lower earnings from Natural Gas Storage due to lower realized natural gas storage price spreads |
| |
| • | a stronger U.S. dollar and its positive effect on the foreign exchange impact. |
Comparable EBITDA for Energy was $15 million lower in 2014 compared to 2013. This decrease was the net effect of:
| |
| • | lower earnings from Western Power due to lower realized prices |
| |
| • | higher earnings from U.S. Power mainly because of higher realized capacity prices in New York and higher realized power prices at our New York and New England facilities |
| |
| • | incremental earnings from Eastern Power primarily due to four solar facilities acquired in each of 2013 and 2014 |
| |
| • | lower earnings from Natural Gas Storage due to lower realized natural gas storage price spreads. |
|
| | |
| | | |
62 TransCanada Management's discussion and analysis 2015 | | |
OUTLOOK
Earnings
We expect 2016 earnings from the Energy segment to be similar to 2015, assuming the net effect of the following expectations:
| |
| • | acquisition of the Ironwood power plant in Pennsylvania |
| |
| • | increased ownership interest in Bruce Power |
| |
| • | increased planned maintenance activity at Bruce Power |
| |
| • | lower U.S. Power marketing contribution |
| |
| • | lower realized capacity prices in New York |
| |
| • | lower contributions from our power operations in Eastern Canada |
| |
| • | lower North American energy commodity prices |
| |
| • | higher GHG emissions costs in Alberta. |
Although a significant portion of Energy's output is sold under long-term contracts, revenue from power that is sold under shorter-term forward arrangements or at spot prices will continue to be impacted by fluctuations in commodity prices and changes in seasonal natural gas storage price spreads will impact Natural Gas Storage earnings.
Weather, unplanned outages and unforeseen regulatory changes can play a role in spot markets and can drive fluctuations in our Energy results.
Western Power
Western Power earnings in 2016 are expected to be consistent with 2015. A well-supplied Alberta power market with slower demand growth and low natural gas prices is anticipated in 2016. Low average spot power prices are expected to continue in the near term, with average spot power prices in 2016 remaining similar to 2015 prices. Average spot market power prices in 2015 ($33/MWh) were materially lower than in 2014 ($50/MWh) primarily due to increased supply and low natural gas prices.
In 2015, the Alberta government renewed and initiated certain GHG policies that impact the electricity sector. GHG compliance costs associated with our PPAs are expected to increase in 2016. The Alberta government’s renewal and change to the SGER increases the emissions reduction target to 15% and increases the carbon levy to $20 per tonne in 2016, up from 12% and $15 per tonne in 2015. See the Significant events section for more information.
A new climate change policy was announced by the Alberta government in the fall of 2015 that positions the provincial economy to be less carbon intensive. According to this plan, Alberta will have an economy-wide carbon tax beginning in 2017, retire coal facilities by 2030 and add significant renewable electricity sources. The future Alberta electricity sector supply mix will feature significant levels of renewables and gas-fired capacity. We have expertise in building, operating and investing in a diverse set of generation technologies and are well positioned to participate in the Alberta electric supply transformation.
Eastern Power
All of our energy assets in eastern Canada are fully contracted. The Ontario assets are contracted with the IESO and are largely sheltered from spot market pricing. Eastern Power earnings in 2016 are expected to be slightly lower as a result of lower contractual earnings at Bécancour and reduced earnings from the sale of unused natural gas transportation. Beginning in December 2016, the Eastern Power earnings will be positively impacted from an agreement executed with Hydro Québec (HQ) to amend Bécancour’s electricity supply contract allowing HQ to dispatch up to 570 MW of firm peak winter capacity from the Bécancour facility.
Bruce Power
We expect 2016 equity income from Bruce Power to be consistent with 2015 results. The positive impact from the additional ownership interest acquired in Bruce Power effective December 3, 2015 is expected to be offset by increased planned maintenance activity in 2016.
During second quarter 2016, Bruce units 1 to 4 are expected to be removed from service for approximately one month to facilitate a station containment outage. This work program inspects and maintains key safety systems including containment structures, and is required to be completed approximately once every decade. Additional planned maintenance is scheduled for first and fourth quarters of 2016. The overall average plant availability percentages in 2016 are expected to be in the low 80s.
|
| | |
| | | |
| | TransCanada Management's discussion and analysis 2015 63
|
Bruce Power’s new agreement with the IESO to extend the operating life of the Bruce Power facility to 2064 along with our acquisition of an additional ownership interest in the facility is expected to provide long-term growth in earnings. See Significant events for more information.
U.S. Power
U.S. Power results are expected to be higher in 2016 compared to 2015 due to our acquisition of the Ironwood power plant in Lebanon, Pennsylvania on February 1, 2016, partially offset by lower marketing margins and lower commodity prices.
U.S. northeast power markets are currently well supplied and we expect prices to remain at lower levels in 2016 along with more normalized levels of volatility.
In recent years, gas pipeline constraints in New England resulted in significant winter price volatility contributing to increased seasonal margins earned by our power marketing business in 2015. The market's response to this increased volatility and the implementation of winter reliability programs has mitigated the impact of constrained gas supply reducing power price volatility. This reduced price volatility also contributes to lower expected earnings in 2016.
Our northeastern U.S. power facilities, particularly Ravenswood in New York, also earn significant revenues through participation in regional capacity markets. New York Spot capacity prices are on average expected to be lower in 2016 than 2015 primarily due to a reduction to the locational requirement used in the capacity pricing structure.
Natural Gas Storage
A modest recovery of seasonal spreads is expected to occur in 2016. Additionally, the resolution of Alberta natural gas pipeline outages that occurred in 2015 is expected to have a positive impact on revenue in 2016. As a result, the 2016 segment contribution is expected to be slightly higher compared to 2015 results.
Capital spending
We spent a total of $0.4 billion in 2015 and expect to spend approximately $0.6 billion on capital projects in Energy in 2016.
Equity investments and acquisitions
In 2015, we acquired an additional 14.89 per cent ownership interest in Bruce B for $236 million and invested $0.2 billion in Bruce Power for capital projects. We expect to invest approximately $0.3 billion in Bruce Power in 2016.
Our acquisition of the Ironwood power plant in Lebanon, Pennsylvania closed on February 1, 2016 for US$657 million before post closing adjustments.
|
| | |
| | | |
64 TransCanada Management's discussion and analysis 2015 | | |
UNDERSTANDING THE ENERGY BUSINESS
Our Energy business is made up of three groups:
Energy comparable EBIT – contribution by group, excluding business development expenses
year ended December 31, 2015
Power generation capacity – contribution by group
year ended December 31, 2015 (includes facilities in development/acquired)
Canadian Power
Western Power
We own or have the rights to approximately 2,600 MW of power supply in Alberta and Arizona through three long-term PPAs, four natural gas-fired cogeneration facilities, and through Coolidge, a simple-cycle, natural gas peaking facility in Arizona.
Power purchased under long-term contracts is as follows:
|
| | | | | | |
| | | Type of contract | | With | | Expires |
| | | | | | | |
| Sheerness PPA | | Power purchased under a 20-year PPA | | ATCO Power and TransAlta Utilities Corporation | | 2020 |
| Sundance A PPA | | Power purchased under a 20-year PPA | | TransAlta Utilities Corporation | | 2017 |
| Sundance B PPA | | Power purchased under a 20-year PPA (own 50 per cent through the ASTC Power Partnership) | | TransAlta Utilities Corporation | | 2020 |
Power sold under long-term contracts is as follows:
|
| | | | | | |
| | | Type of contract | | With | | Expires |
| |
| Coolidge | | Power sold under a 20-year PPA | | Salt River Project Agricultural Improvements & Power District | | 2031 |
Earnings in our Western Power business are maximized by maintaining and optimizing the operations of our power plants, and through various marketing activities.
|
| | |
| | | |
| | TransCanada Management's discussion and analysis 2015 65
|
A disciplined operational strategy is critical to maximizing output and revenue at our cogeneration facilities and maximizing Coolidge earnings, where revenue is based on plant availability, and is not a function of market price.
The marketing function is critical for optimizing returns and managing risk through direct sales to medium and large industrial and commercial companies and other market participants. Our marketing group sells power sourced through the PPAs, markets uncommitted volumes from the cogeneration plants, and buys and sells power and natural gas to maximize earnings from our assets. To reduce exposure associated with uncontracted volumes, we sell a portion of our power in forward sales markets when acceptable contract terms are available.
A portion of our power is retained to be sold in the spot market or under shorter-term forward arrangements. This ensures we have adequate power supply to fulfill our sales obligations if we have unexpected plant outages and provides the opportunity to increase earnings in periods of high spot prices.
The amount sold forward will vary depending on market conditions and market liquidity and has historically ranged between 25 to 75 per cent of expected future production with a higher proportion being hedged in the near term periods. Such forward sales may be completed with medium to large industrial and commercial companies as well as other market participants and will affect our average realized price (versus spot price) in future periods.
Eastern Power
We own or are developing approximately 3,000 MW of power generation capacity in eastern Canada. All of the power produced by these assets is sold under long-term contracts.
Disciplined maintenance of plant operations is critical to the results of our Eastern Power assets, where earnings are based on plant availability and performance.
Assets currently operating under long-term contracts are as follows:
|
| | | | | | |
| | | Type of contract | | With | | Expires |
| |
Bécancour1,2 | | 20-year PPA and tolling agreement Steam sold to an industrial customer | | Hydro-Québec | | 2036 |
| Cartier Wind | | 20-year PPA | | Hydro-Québec | | 2026–2032 |
| Grandview | | 20-year tolling agreement to buy 100 per cent of heat and electricity output | | Irving Oil | | 2024 |
| Halton Hills | | 20-year Clean Energy Supply contract | | IESO | | 2030 |
| Portlands Energy | | 20-year Clean Energy Supply contract | | IESO | | 2029 |
Ontario Solar3 | | 20-year Feed-in Tariff (FIT) contracts | | IESO | | 2032–2034 |
| |
1 | Power generation has been suspended since 2008. We continue to receive capacity payments while generation is suspended. |
| |
2 | In August 2015, we executed an agreement with HQ to amend Bécancour's electricity supply contract. The amendment allows HQ to dispatch up to 570 MW of firm peak winter capacity from the Bécancour facility for a term of 20 years commencing in December 2016. Annual tolling payments received for this new service will be incremental to existing capacity payments earned under the agreement and will expire in 2036. The existing capacity payments terminate in 2026. |
| |
3 | We acquired four facilities in 2013 and an additional four facilities in 2014. |
Assets currently under construction are as follows: |
| | | | | | |
| | | Type of contract | | With | | Expires |
| |
Napanee1 | | 20-year Clean Energy Supply contract | | IESO | | 20 years from in-service date |
| |
1 | Expected in-service date is between late 2017 and early 2018 |
|
| | |
| | | |
66 TransCanada Management's discussion and analysis 2015 | | |
Western and Eastern Power results
Comparable EBITDA and comparable EBIT are non-GAAP measures. See page 10 for more information.
|
| | | | | | | | | |
| year ended December 31 | | | | | | |
| (millions of $) | | 2015 |
| | 2014 |
| | 2013 |
|
| | | | | | | |
Revenue1 | | | | | | |
| Western Power | | 534 |
| | 736 |
| | 605 |
|
Eastern Power2 | | 455 |
| | 428 |
| | 400 |
|
Other3 | | 62 |
| | 85 |
| | 108 |
|
| | | 1,051 |
| | 1,249 |
| | 1,113 |
|
Income from equity investments4 | | 8 |
| | 45 |
| | 141 |
|
| Commodity purchases resold | | (353 | ) | | (404 | ) | | (283 | ) |
| Plant operating costs and other | | (248 | ) | | (299 | ) | | (298 | ) |
Exclude risk management activities1 | | 8 |
| | 11 |
| | 4 |
|
| Comparable EBITDA | | 466 |
| | 602 |
| | 677 |
|
| Comparable depreciation and amortization | | (190 | ) | | (179 | ) | | (172 | ) |
| Comparable EBIT | | 276 |
| | 423 |
| | 505 |
|
| | | | | | | |
| Breakdown of comparable EBITDA | | | | | | |
| Western Power | | 72 |
| | 252 |
| | 355 |
|
| Eastern Power | | 394 |
| | 350 |
| | 322 |
|
| Comparable EBITDA | | 466 |
| | 602 |
| | 677 |
|
| |
1 | The realized and unrealized gains and losses from financial derivatives used to manage Canadian Power’s assets are presented on a net basis in Western and Eastern Power revenues. The unrealized gains and losses from financial derivatives included in Revenue are excluded to arrive at Comparable EBITDA. |
| |
2 | Includes four solar facilities acquired between June and December 2013, three solar facilities acquired in September 2014 and one solar facility acquired in December 2014. |
| |
3 | Includes Revenue from the sale of unused natural gas transportation, sale of excess natural gas purchased for generation and Cancarb sales of thermal carbon black up to April 15, 2014 when it was sold. |
| |
4 | Includes our share of equity income from our investments in ASTC Power Partnership, which holds the Sundance B PPA, and Portlands Energy. Equity income does not include any earnings related to our risk management activities. |
|
| | |
| | | |
| | TransCanada Management's discussion and analysis 2015 67
|
Sales volumes and plant availability
Includes our share of volumes from our equity investments.
|
| | | | | | | | | |
| year ended December 31 | | 2015 |
| | 2014 |
| | 2013 |
|
| | | | | | | |
| Sales volumes (GWh) | | | | | | |
| Supply | | | | | | |
| Generation | | | | | | |
| Western Power | | 2,519 |
| | 2,517 |
| | 2,728 |
|
Eastern Power1 | | 3,911 |
| | 3,080 |
| | 3,822 |
|
| Purchased | | |
| | |
| | |
|
Sundance A & B and Sheerness PPAs and other2 | | 10,617 |
| | 11,472 |
| | 8,223 |
|
| Other purchases | | 154 |
| | 16 |
| | 13 |
|
| | | 17,201 |
| | 17,085 |
| | 14,786 |
|
| Sales | | |
| | |
| | |
|
| Contracted | | |
| | |
| | |
|
| Western Power | | 7,707 |
| | 10,484 |
| | 7,864 |
|
Eastern Power1 | | 3,911 |
| | 3,080 |
| | 3,822 |
|
| Spot | | |
| | |
| | |
|
| Western Power | | 5,583 |
| | 3,521 |
| | 3,100 |
|
| | | 17,201 |
| | 17,085 |
| | 14,786 |
|
Plant availability3 | | |
| | |
| | |
|
Western Power4 | | 97 | % | | 96 | % | | 95 | % |
Eastern Power1,5 | | 97 | % | | 91 | % | | 90 | % |
| |
1 | Includes four solar facilities acquired between June and December 2013, three solar facilities acquired in September 2014, and one solar facility acquired in December 2014. |
| |
2 | Includes our 50 per cent ownership interest of Sundance B volumes through the ASTC Power Partnership. Sundance A Unit 1 returned to service in September 2013 and Unit 2 returned to service in October 2013 after extended outages. |
| |
3 | The percentage of time the plant was available to generate power, regardless of whether it was running. |
| |
4 | Does not include facilities that provide power to us under PPAs. |
| |
5 | Does not include Bécancour because power generation has been suspended since 2008. |
Western Power
Western Power's comparable EBITDA in 2015 was $180 million lower than in 2014. The decrease was due to lower realized power prices and lower PPA volumes.
Average spot market power prices in Alberta decreased by 34 per cent from approximately $50/MWh in 2014 to approximately $33/MWh in 2015. The addition of new natural gas-fired and wind plants over the last year-and-a-half have contributed to a well supplied market and very few higher priced hours were observed. While we manage spot market power price volatility through the use of forward contracts, this significant decrease in spot market prices also reduced our realized power prices in 2015 compared to 2014.
The decrease in equity earnings of $37 million in 2015 compared to 2014 was primarily due to the impact of lower Alberta spot market prices on earnings from the ASTC Power Partnership which holds our 50 per cent ownership interest in the Sundance B PPA. Equity earnings does not include the impact of related contracting activities.
In 2014, Western Power’s comparable EBITDA was $103 million lower than 2013, due to the net effect of:
| |
| • | lower realized power prices |
| |
| • | incremental earnings from the return to service of the Sundance A PPA Unit 1 in September 2013 and Unit 2 in October 2013 which also resulted in increased volume purchases |
| |
| • | sale of Cancarb in April 2014. |
|
| | |
| | | |
68 TransCanada Management's discussion and analysis 2015 | | |
Average spot market power prices in Alberta decreased by 38 per cent from approximately $80/MWh in 2013 to approximately $50/MWh in 2014.
Realized power prices on power sales can be higher or lower than spot market power prices in any given period as a result of contracting activities. Approximately 58 per cent of Western Power sales volumes were sold under contract in 2015 compared to 75 per cent in 2014 and 72 per cent in 2013.
Eastern Power
Eastern Power’s comparable EBITDA in 2015 was $44 million higher than 2014 due to the net effect of incremental earnings from solar facilities acquired in 2014, higher contractual earnings at Bécancour and lower earnings on the sale of unused natural gas transportation.
In 2014, Eastern Power's comparable EBITDA was $28 million higher than 2013 due to the net effect of incremental earnings from the four solar facilities acquired in 2013, the additional four facilities acquired in late 2014 and higher contractual earnings at Bécancour.
Bruce Power
Bruce Power is a nuclear power generation facility located near Tiverton, Ontario and is comprised of eight nuclear units with a combined capacity of approximately 6,300 MW. Bruce Power leases the eight nuclear facilities from Ontario Power Generation (OPG).
Results from Bruce Power fluctuate primarily due to the frequency, scope and duration of planned and unplanned outages.
On December 3, 2015, Bruce Power entered into an agreement with the IESO to extend the operating life of the Bruce Power facility to 2064. This new agreement represents an extension and material amendment to the earlier agreement that led to the refurbishment of Units 1 and 2 at the site.
The amended agreement, which took economic effect on January 1, 2016, allows Bruce Power to immediately invest in life extension activities for Units 3 through 8 to support the long-term refurbishment program. This early investment in the Asset Management program will result in near-term life extension, allowing later investment in the Major Component Replacement work that is expected to begin in 2020.
As part of the life extension and refurbishment agreement, Bruce Power began receiving a uniform price of $65.73 per MWh for all units in January 2016. Over time, the price will be subject to adjustments for the return of and on capital invested under the Asset Management and Major Component Replacement capital programs, along with various other pricing adjustments that allow for a better matching of revenues and costs over the long term.
Our estimated share of investment related to the Asset Management program to be completed over the life of the agreement is approximately $2.5 billion (2014 dollars). Our estimated share of investment in the Major Component Replacement work for Units 3 through 8 over the 2020 to 2033 timeframe is approximately a further $4 billion (2014 dollars).
Under certain conditions, Bruce Power and the IESO can elect to not proceed with the remaining Major Component Replacement investments should the cost exceed certain thresholds or prove to not provide sufficient economic benefits. The agreement has been structured to account for changing cost inputs over time, including ongoing operating costs and larger capital investments.
On December 3, 2015, we exercised our option to acquire an additional 14.89 per cent ownership interest in Bruce B for $236 million from the Ontario Municipal Employees Retirement System (OMERS). On December 4, 2015, Bruce B and Bruce A were merged to form a single partnership structure through Bruce Power LP with us now owning a 48.5 per cent ownership interest. Prior to the acquisition of additional Bruce B ownership and the merger, we owned 48.9 per cent of Bruce A and 31.6 per cent of Bruce B.
|
| | |
| | | |
| | TransCanada Management's discussion and analysis 2015 69
|
Prior to the amended agreement with the IESO, all of the output from Bruce A Units 1 to 4 was sold at a fixed price/MWh which was adjusted annually on April 1 for inflation and other provisions under the contract. Bruce A also recovered fuel costs from the IESO.
|
| | | |
| Bruce A fixed price | Per MWh |
|
| |
| April 1, 2015 – December 31, 2015 |
| $73.42 |
|
| April 1, 2014 – March 31, 2015 |
| $71.70 |
|
| April 1, 2013 – March 31, 2014 |
| $70.99 |
|
Prior to the amended agreement with the IESO, all output from Bruce B Units 5 to 8 was subject to a floor price adjusted annually for inflation on April 1.
|
| | | |
| Bruce B floor price | Per MWh |
|
| |
| April 1, 2015 – December 31, 2015 |
| $54.13 |
|
| April 1, 2014 – March 31, 2015 |
| $52.86 |
|
| April 1, 2013 – March 31, 2014 |
| $52.34 |
|
Amounts received under the Bruce B Units 5 to 8 floor price mechanism within a calendar year were subject to repayment if the average spot price in a month exceeded the floor price. The average spot power price in each month of 2015 was less than the floor price and therefore no amounts received under the floor price mechanism in 2015 are subject to repayment. Amounts received above the floor price in first quarter 2014 were repaid to the IESO in January 2015.
Bruce B also enters into fixed-price contracts under which it receives or pays the difference between the contract price and the spot price.
The contract also provides for payment if the IESO reduces Bruce Power’s generation to balance the supply of and demand for electricity and/or manage other operating conditions of the Ontario power grid. The amount of the reduction is considered “deemed generation”, for which Bruce Power is paid the contract price.
|
| | |
| | | |
70 TransCanada Management's discussion and analysis 2015 | | |
Bruce Power results
Results reflect our proportionate share. Beginning in 2016, results from Bruce Power will be reported on a combined basis to reflect the merged entity. Comparable income from equity investments is a non-GAAP measure. See page 10 for more information on non-GAAP measures we use.
|
| | | | | | | | | | | | |
| year ended December 31 | | | | | | |
| (millions of $, unless noted otherwise) | | 2015 |
| | 2014 |
| | 2013 |
|
| | | | | | | |
Comparable income from equity investments1 | | | | | | |
| Bruce A | | 205 |
| | 209 |
| | 202 |
|
| Bruce B | | 80 |
| | 105 |
| | 108 |
|
| | | 285 |
| | 314 |
| | 310 |
|
| | | | | | | |
| Comprised of: | | | | | | |
| Revenues | | 1,301 |
| | 1,256 |
| | 1,258 |
|
| Operating expenses | | (691 | ) | | (623 | ) | | (618 | ) |
| Depreciation and other | | (325 | ) | | (319 | ) | | (330 | ) |
Comparable income from equity investments1 | | 285 |
| | 314 |
| | 310 |
|
| Bruce Power merger – debt retirement charge | | (36 | ) | | — |
| | — |
|
Income from equity investments1 | | 249 |
| | 314 |
| | 310 |
|
| | | | | | | |
| Bruce Power – other information | | | | | | |
Plant availability2 | | | | | | |
| Bruce A | | 87 | % | | 82 | % | | 82 | % |
| Bruce B | | 87 | % | | 90 | % | | 89 | % |
| Combined Bruce Power | | 87 | % | | 86 | % | | 86 | % |
| Planned outage days | | | | | | |
| Bruce A | | 164 |
| | 118 |
| | 123 |
|
| Bruce B | | 163 |
| | 127 |
| | 140 |
|
| Unplanned outage days | | | | | | |
| Bruce A | | 28 |
| | 123 |
| | 63 |
|
| Bruce B | | 17 |
| | 4 |
| | 20 |
|
Sales volumes (GWh)1 | | | | | | |
| Bruce A | | 11,148 |
| | 10,526 |
| | 10,458 |
|
| Bruce B | | 8,210 |
| | 8,197 |
| | 8,010 |
|
| | | 19,358 |
| | 18,723 |
| | 18,468 |
|
Realized sales price per MWh3 | | | | | | |
| Bruce A | |
| $71 |
| |
| $72 |
| |
| $70 |
|
| Bruce B | |
| $55 |
| |
| $56 |
| |
| $54 |
|
| Combined Bruce Power | |
| $63 |
| |
| $63 |
| |
| $62 |
|
| |
1 | Represents our 48.9 per cent ownership interest in Bruce A and 31.6 per cent ownership interest in Bruce B up to December 3, 2015 when we increased our ownership percentage in Bruce B, and Bruce A and B were merged. Sales volumes include deemed generation. |
| |
2 | The percentage of time in a year the plant is available to generate power, regardless of whether it is running. |
| |
3 | Calculation based on actual and deemed generation. Bruce B realized sales price per MWh includes revenues under the floor price mechanism and revenues from contract settlements. |
Comparable income from equity investments from Bruce A in 2015 was $4 million lower than 2014. The decrease was mainly due to higher operating expenses, partially offset by higher volumes resulting from fewer unplanned outage days.
|
| | |
| | | |
| | TransCanada Management's discussion and analysis 2015 71
|
Comparable income from equity investments from Bruce B in 2015 was $25 million lower than 2014. The decrease was mainly due to higher operating expenses and lower gains from contracting activities, partially offset by lower lease expense based on the terms of the lease agreement with OPG. All Bruce B units were removed from service in April 2015 to allow for inspection of the Bruce B vacuum building as mandated by the Canadian Nuclear Safety Commission to occur approximately once every decade. The outage, along with additional planned maintenance on Unit 6, was completed successfully during second quarter 2015.
Comparable income from equity investments from Bruce A in 2014 was $7 million higher than 2013. The increase was mainly due to lower depreciation and operating expenses and higher volumes, partially offset by recognition of an insurance recovery of approximately $40 million in the first quarter 2013. The negative impact of increased outage days in 2014 was offset by higher generation levels while operating.
Comparable income from equity investments from Bruce B in 2014 was $3 million lower than 2013. The decrease was mainly due to higher lease expense recognized based on the terms of the lease agreement with OPG, partially offset by higher volumes and lower operating costs resulting from lower outage days.
U.S. Power
We own approximately 4,500 MW of power generation capacity in New York, New England and Pennsylvania, including plants powered by natural gas, oil, hydro and wind. We have recently acquired the 778 MW Ironwood natural gas fired, combined cycle power plant in Lebanon, Pennsylvania, which delivers energy into the PJM power market.
We earn revenues in New York, PJM and New England by providing generation capacity and by selling energy. Capacity markets compensate power suppliers for being available to provide power, and are intended to promote investment in new and existing power resources needed to meet customer demand and maintain a reliable power system. The energy markets compensate power providers for the actual energy they supply.
Providing capacity
Capacity revenue in New York, PJM and New England are a function of two factors, capacity prices and plant availability. It is important for us to keep our plant availability high to maximize the amount of capacity for which we get paid.
The price required for capacity in all of the three U.S. Northeast capacity markets where we have assets is determined by annual competitive auctions. Auction results are impacted by actual power supply and projected power demand levels within demand curve price setting processes. Each U.S. Northeast capacity market is similar in design, however, each has unique features. For example, the price paid for capacity in both the PJM and New England Power Pools is determined by annual competitive auctions that are held three years in advance of the applicable capacity year, while the New York capacity market does not have a three year advance attribute.
Selling energy
We focus on selling power under short- and long-term contracts to wholesale, commercial and industrial customers in the following power markets:
| |
| • | New York, operated by the New York ISO |
| |
| • | New England, operated by the New England ISO |
| |
| • | PJM Interconnection area (PJM). |
We also earn additional revenues by bundling power sales with other energy services.
We meet our power sales commitments using power we generate ourselves or acquire at fixed prices, thereby reducing our exposure to changes in commodity prices.
The timing of recognizing earnings from our U.S. power marketing business is impacted by different pricing profiles between the prices we charge our customers and the prices we pay for volumes purchased to fulfill our sales obligations over the term of the contracts. The costs on volumes purchased to fulfill power sales commitments to wholesale, commercial and industrial customers includes the impact of certain contracts to purchase power over multiple periods at a flat price. Because the price we charge our customers is typically shaped to the market, the impact of these two contract pricing profiles has generally resulted in higher earnings in December to February, offset by lower earnings between March and November, with overall positive margins over the term of the contracts.
|
| | |
| | | |
72 TransCanada Management's discussion and analysis 2015 | | |
U.S. Power results
Comparable EBITDA and comparable EBIT are non-GAAP measures. See page 10 for more information.
|
| | | | | | | | | |
| year ended December 31 | | | | | | |
| (millions of US$) | | 2015 |
| | 2014 |
| | 2013 |
|
| | | | | | | |
| Revenue | | | | | | |
Power1 | | 1,975 |
| | 1,794 |
| | 1,587 |
|
| Capacity | | 317 |
| | 362 |
| | 295 |
|
| | | 2,292 |
| | 2,156 |
| | 1,882 |
|
| Commodity purchases resold | | (1,474 | ) | | (1,297 | ) | | (1,003 | ) |
Plant operating costs and other2 | | (422 | ) | | (529 | ) | | (509 | ) |
Exclude risk management activities1 | | 22 |
| | 46 |
| | (47 | ) |
| Comparable EBITDA | | 418 |
| | 376 |
| | 323 |
|
| Comparable depreciation and amortization | | (105 | ) | | (107 | ) | | (107 | ) |
| Comparable EBIT | | 313 |
| | 269 |
| | 216 |
|
| |
1 | The realized and unrealized gains and losses from financial derivatives used to manage U.S. Power's assets are presented on a net basis in power revenues. The unrealized gains and losses from financial derivatives included in Revenue are excluded to arrive at Comparable EBITDA. |
| |
2 | Includes the costs of fuel consumed in generation. |
Sales volumes and plant availability
|
| | | | | | | | | |
| year ended December 31 | | 2015 |
| | 2014 |
| | 2013 |
|
| | | | | | | |
| Physical sales volumes (GWh) | | | | | | |
| Supply | | | | | | |
| Generation | | 7,849 |
| | 7,742 |
| | 6,173 |
|
| Purchased | | 20,937 |
| | 13,798 |
| | 12,050 |
|
| | | 28,786 |
| | 21,540 |
| | 18,223 |
|
Plant availability1, 2 | | 78 | % | | 82 | % | | 84 | % |
| |
1 | The percentage of time the plant was available to generate power, regardless of whether it is running. |
| |
2 | Plant availability was lower in 2015 due to an unplanned outage at the Ravenswood facility. The unit returned to service in May 2015. |
U.S. Power - other information
|
| | | | | | | |
| year ended December 31 | | 2015 |
| | 2014 | | 2013 |
| | | | | | | |
| Average Spot Power Prices (US$ per MWh) | | | | | | |
| New England¹ | | 42 |
| | 65 | | 57 |
| New York² | | 39 |
| | 61 | | 53 |
| | | | | | | |
Average New York2 Zone J Spot Capacity Prices (US$ per KW-M) | | 11.44 |
| | 13.96 | | 11.31 |
| |
1 | New England ISO all hours Mass Hub price. |
| |
2 | Zone J market in New York City where the Ravenswood plant operates. |
U.S. Power's comparable EBITDA in 2015 was US$42 million higher than 2014. This reflected the net effect of:
| |
| • | higher margins and higher sales to wholesale, commercial and industrial customers in both the PJM and New England markets |
| |
| • | lower realized power prices at our facilities in New York and New England, partially offset by lower fuel costs |
| |
| • | lower capacity revenue at Ravenswood due to lower realized capacity prices in New York and the impact of lower availability at the facility. |
In 2014, U.S. Power’s comparable EBITDA was US$53 million higher than 2013. This reflected the net effect of:
| |
| • | higher realized capacity prices primarily in New York |
| |
| • | higher realized power prices for the New England and New York facilities |
| |
| • | higher generation volumes primarily at the Ravenswood facility |
|
| | |
| | | |
| | TransCanada Management's discussion and analysis 2015 73
|
| |
| • | higher prices and related costs on increased volumes purchased to fulfill power sales commitments to wholesale, commercial and industrial customers. |
Higher margins and higher sales volumes to wholesale, commercial and industrial customers in both PJM and New England markets resulted in significantly higher earnings during 2015 compared to 2014. The expansion of our customer base in these markets combined with lower and less volatile prices on volumes purchased to fulfill our sale obligations in 2015, provided the opportunity for higher earnings.
Wholesale electricity prices in New York and New England were lower in 2015 compared to 2014. Reductions in fuel oil prices and increased availability of liquefied natural gas in winter 2015 helped to mitigate the impact of pipeline constraints and keep peak price excursions limited compared to winter 2014. Average spot power prices in 2015 in New England decreased approximately 35 per cent and in New York spot power prices decreased approximately 36 per cent compared to 2014.
Average New York Zone J spot capacity prices were approximately 18 per cent lower in 2015 than in 2014. The decrease in spot prices and the impact of hedging activities, resulted in lower realized capacity prices in New York in 2015. The lower spot capacity prices were primarily due to increased available operational supply in New York City's Zone J market.
Capacity revenues were also negatively impacted by a unit outage from September 2014 to May 2015 at Ravenswood. The calculation used by the NYISO to determine the capacity volume which a generator is compensated utilizes a rolling average forced outage rate. As a result of this methodology, outages impact capacity volumes and associated revenues on a lagged basis. Accordingly, capacity revenues during 2015 were negatively impacted compared to the same period in 2014. The outage continues to be included in the rolling average forced outage rate.
Physical sales volumes and purchased volumes sold to wholesale, commercial and industrial customers were higher in 2015 compared to 2014 as we have expanded our customer base in both PJM and New England markets.
As at December 31, 2015, approximately 6,600 GWh or 70 per cent of U.S. Power's planned generation is contracted for 2016, and 3,000 GWh or 33 per cent for 2017. Planned generation fluctuates depending on hydrology, wind conditions, commodity prices and the resulting dispatch of the assets. Power sales fluctuate based on customer usage.
Natural Gas Storage
We own and operate 118 Bcf of non-regulated natural gas storage capacity in Alberta. This business operates independently from our regulated natural gas transmission business and from ANR's regulated storage business, which are included in our Natural Gas Pipelines segment.
Storage capacity
|
| | | | | | |
| year ended December 31, 2015 | | Working gas storage capacity (Bcf) |
| | Maximum injection/ withdrawal capacity (MMcf/d) |
|
| | | | | |
| Edson | | 50 |
| | 725 |
|
| CrossAlta | | 68 |
| | 550 |
|
| | | 118 |
| | 1,275 |
|
We also hold a contract for additional Alberta-based storage capacity with a third party.
Our natural gas storage business helps balance seasonal and short-term supply and demand, and adds flexibility to the delivery of natural gas to markets in Alberta and the rest of North America. Market volatility creates arbitrage opportunities and our natural gas storage facilities also give customers the ability to capture value from short-term price movements. The natural gas storage business is affected by the change in seasonal natural gas price spreads which are generally determined by the differential in natural gas prices between the traditional summer injection and winter withdrawal seasons.
Our gas storage business contracts with third parties, typically participants in the Alberta and interconnected gas markets, for a fixed fee to provide gas storage services on a short, medium, and/or long term basis.
We also enter into proprietary natural gas storage transactions, which include a forward purchase of our own natural gas to be injected into storage and a simultaneous forward sale of natural gas for withdrawal at a later period, typically during the winter
|
| | |
| | | |
74 TransCanada Management's discussion and analysis 2015 | | |
withdrawal season. By matching purchase and sales volumes on a back-to-back basis, we lock in future positive margins, effectively eliminating our exposure to changes in gas prices.
Natural Gas Storage and other results
Comparable EBITDA in 2015 was $29 million lower than 2014, mainly due to decreased proprietary and third party storage revenue as a result of lower realized natural gas storage price spreads as well as extreme natural gas price volatility experienced in first quarter 2014.
In 2014, comparable EBITDA was $19 million lower than 2013, mainly due to decreased third party storage revenue as a result of lower realized natural gas storage price spreads.
SIGNIFICANT EVENTS
Canadian Power
Alberta Greenhouse Gas Emissions
In 2015, the Alberta government announced a renewal and change to the SGER in Alberta. Since 2007, under the SGER, established industrial facilities with GHG emissions above a certain threshold are required to reduce their emissions by 12 per cent below an average intensity baseline and a carbon levy of $15 per tonne is placed on emissions above this target.
The changed regulations include an increase in the emissions reductions target to 15 per cent in 2016 and 20 per cent in 2017, along with an increase in the carbon levy to $20 per tonne in 2016 and $30 per tonne in 2017. Starting in 2018, coal-fired generators will pay $30 per tonne of CO2 on emissions above what Alberta’s cleanest natural gas-fired plant would emit to produce an equivalent amount of electricity. While our Sundance and Sheerness PPAs are subject to this regulation, our inventory of carbon offset credits will mitigate some of these increased costs. The remaining compliance costs are expected to be somewhat recovered through increased market pricing but the full extent is not known at this time.
Napanee
In January 2015, we began construction activities on a 900 MW natural gas-fired power plant at Ontario Power Generation’s Lennox site in eastern Ontario in the town of Greater Napanee. We expect to invest approximately $1.0 billion in the Napanee facility during construction and commercial operations are expected to begin in late-2017 or early-2018. Production from the facility is fully contracted with the IESO.
Bécancour
In August 2015, we executed an agreement with HQ to amend Bécancour's electricity supply contract. The amendment allows HQ to dispatch up to 570 MW of firm peak winter capacity from the Bécancour facility for a term of 20 years commencing in December 2016. Annual payments received for this new service will be incremental to existing capacity payments earned under the agreement. In October 2015, the Régie de l’énergie approved the amended contract.
Bruce Power
In December 2015, Bruce Power entered into an agreement with the IESO to extend the operating life of the facility to the end of 2064. This new agreement represents an extension and material amendment to the earlier agreement that led to the refurbishment of Units 1 and 2 at the site.
The amended agreement is effective January 1, 2016 and allows Bruce Power to immediately invest in life extension activities for Units 3 through 8. Our share of investment in the Asset Management program to be completed over the life of the agreement is approximately $2.5 billion (2014 dollars). Our share of investment in the Major Component Replacement work that is expected to begin in 2020 is approximately $4 billion (2014 dollars). Under certain conditions, Bruce Power and the IESO can elect to not proceed with the remaining Major Component Replacement investments should the cost exceed certain thresholds or prove to not provide sufficient economic benefits. The agreement has been structured to account for changing cost inputs over time, including ongoing operating costs and additional capital investments. Beginning in 2016, Bruce Power receives a uniform price of $65.73 per MWh for all units. This price will be adjusted over the term of the agreement to incorporate incremental capital investment and cost changes.
|
| | |
| | | |
| | TransCanada Management's discussion and analysis 2015 75
|
In connection with this opportunity, we exercised our option to acquire an additional 14.89 per cent ownership interest in Bruce B for $236 million from OMERS. Subsequent to this acquisition, Bruce A and Bruce B were merged to form a single partnership structure. In 2015, we recognized a $36 million charge, representing our proportionate share, on the retirement of Bruce Power debt in conjunction with this merger. Each partner now holds a 48.5 per cent interest in this newly merged partnership structure.
U.S. Power
Ravenswood
In late May 2015, the 972 MW Unit 30 at the Ravenswood Generating Station returned to service after a September 2014 unplanned outage which resulted from a problem with the generator associated with the high pressure turbine. Insurance recoveries for this event are expected to be received in 2016. As a result of the expected insurance recoveries, net of deductibles, the Unit 30 unplanned outage is not expected to have a significant impact on our earnings although the recording of earnings will not coincide with lost revenues due to timing of the insurance proceeds.
Ironwood
On February 1, 2016, we acquired the 778 MW Ironwood natural gas fired, combined cycle power plant located in Lebanon, Pennsylvania from Talen Energy Corporation for US$657 million before post closing adjustments. The Ironwood power plant delivers energy into the PJM power market and will provide us with a solid platform from which to continue to grow our wholesale, commercial and industrial customer base in this market area.
BUSINESS RISKS
The following are risks specific to our Energy business. See page 94 for information about general risks that affect the company as a whole, including other operational risks, health, safety and environment (HSE) risks, and financial risks.
Fluctuating power and natural gas market prices
Power and natural gas prices are affected by fluctuations in supply and demand, weather, and by general economic conditions. The power generation facilities in our Western Power operations in Alberta, and in our U.S. Northeast Power operations are exposed to commodity price volatility.
Earnings from these businesses are generally correlated to the prevailing power supply and demand conditions. In the U.S. Northeast, the price of natural gas also has a significant impact on power prices, as energy prices in these markets are usually set by gas-fired power supplies. Extended periods of low gas prices will generally exert downward pressure on power prices and therefore on earnings from our U.S. Northeast facilities.
Our portfolio of assets in eastern Canada and our Coolidge Generating Station in Arizona are fully contracted, and are therefore not materially impacted by fluctuating commodity prices. As these contracts expire in the long term, it is uncertain if we will be able to re-contract on similar terms.
To mitigate the impact of power price volatility in Alberta and the U.S. Northeast, we sell a portion of our supply under medium to long-term sales contracts where contract terms are acceptable. A portion of our power is retained to be sold in the spot market or under shorter-term forward arrangements to ensure we have adequate power supply to fulfill sales obligations if unexpected plant outages occur. This unsold supply is exposed to fluctuating power and natural gas market prices. As power sales contracts expire, new forward contracts are entered into at prevailing market prices.
Our natural gas storage business is subject to fluctuating seasonal natural gas price spreads which are generally determined by the differential in natural gas prices between the traditional summer injection and winter withdrawal seasons.
Alberta Power Purchase Arrangements
As the Alberta power market conforms to the new climate change policies announced in 2015, the full extent of the impact to the economics of the PPAs is not known at this time. However, change of law provisions exist in the arrangements that afford PPA buyers an option to turn back PPAs to the Alberta Balancing Pool in the event that holding a PPA is deemed to be no longer economic.
|
| | |
| | | |
76 TransCanada Management's discussion and analysis 2015 | | |
U.S. Power capacity payments
A significant portion of revenues earned by our U.S. Northeast operations come from capacity payments where prices are determined in various competitive auctions. Fluctuations in capacity prices can have a material impact on these businesses. Auction pricing results are impacted by the prevailing supply and demand conditions for capacity and other factors. All three U.S. Northeast capacity markets where we have assets feature demand curve price setting processes driven by a number of established parameters and other rules that are subject to periodic review and revisions by the respective ISOs and FERC.
Plant availability
Optimizing and maintaining plant availability is essential to the continued success of our Energy business. Unexpected outages or extended planned outages at our power plants can increase maintenance costs, lower plant output and sales revenue, and lower capacity payments and margins. We may also have to buy power or natural gas on the spot market to meet our delivery obligations.
We manage this risk by investing in a highly skilled workforce, operating prudently, running comprehensive, risk-based preventive maintenance programs and making effective capital investments.
For facilities we do not operate, our purchase agreements include a financial remedy if a plant owner does not deliver as agreed. The Sundance and Sheerness PPAs, for example, require the producers to pay us market-based penalties if they cannot supply the amount of power we have agreed to purchase.
Execution and capital costs
We make substantial capital commitments developing power generation infrastructure based on the assumption that these assets will deliver an attractive return on investment. While we carefully consider the scope and expected costs of our capital projects, we are exposed to execution and capital cost overrun risk which may impact our return on these projects. We mitigate this risk by implementing comprehensive project governance and oversight processes and through the structuring of commercial arrangements where certain execution and capital cost risks may be shared with counterparties.
Regulatory
We operate in both regulated and deregulated power markets in both the United States and Canada. These markets are subject to various federal, state and provincial regulations in both countries. As power markets evolve across North America, there is the potential for regulatory bodies to implement new rules that could negatively affect us as a generator and marketer of electricity. These may be in the form of market rule changes, changes in the interpretation and application of market rules by regulators, price caps, emission controls, emissions costs, cost allocations to generators and out-of-market actions taken by others to build excess generation, all of which negatively affect the price of power or capacity, or both. In addition, our development projects rely on an orderly permitting process and any disruption to that process can have negative effects on project schedules and costs. We are an active participant in formal and informal regulatory proceedings and take legal action where required.
Weather
Significant changes in temperature and other weather events have many effects on our business, ranging from the impact on demand, availability and commodity prices, to efficiency and output capability. Extreme temperature and weather can affect market demand for power and natural gas and can lead to significant price volatility. Extreme weather can also restrict the availability of natural gas and power if demand is higher than supply. Seasonal changes in temperature can reduce the efficiency of our natural gas-fired power plants, and the amount of power they produce. Variable wind speeds affect earnings from our wind assets, and sun-light hours and intensity affects earnings from our solar assets.
Hydrology
Our hydroelectric power generation facilities in the U.S. Northeast are subject to hydrology risks that can impact the volume of water available for generation at these facilities including weather changes and events, local river management and potential dam failures at these plants or upstream facilities.
Competition
We face various competitive forces that impact our existing assets and prospects for growth. For instance, our existing power plants in deregulated markets will compete over time with new power capacity. New supply could come in several forms including supply that employs more efficient power generation technologies, additional supply from regional power transmission interconnections and new supply in the form of distributed generation. We also face competition from other power companies in the greenfield power plant development arena.
|
| | |
| | | |
| | TransCanada Management's discussion and analysis 2015 77
|
Corporate
The following is a reconciliation of comparable EBITDA and comparable EBIT (our non-GAAP measures) to segmented losses (the equivalent GAAP measure). Comparable depreciation and amortization is also a non-GAAP measure. See page 10 for more information on non-GAAP measures we use and page 108 for reconciliation to its GAAP equivalent.
|
| | | | | | | | | |
| year ended December 31 | | | | | | |
| (millions of $) | | 2015 |
| | 2014 |
| | 2013 |
|
| | | | | | | |
| Comparable EBITDA | | (171 | ) | | (127 | ) | | (108 | ) |
| Comparable depreciation and amortization | | (31 | ) | | (23 | ) | | (16 | ) |
| Comparable EBIT | | (202 | ) | | (150 | ) | | (124 | ) |
| Specific item: | | | | | | |
| Restructuring costs | | (99 | ) | | — |
| | — |
|
| Segmented losses | | (301 | ) | | (150 | ) | | (124 | ) |
Corporate segmented losses in 2015 increased by $151 million compared to 2014 and included a charge of $99 million before tax for restructuring charges comprised of $56 million mainly related to 2015 severance costs and a provision of $43 million for 2016 planned severance costs and expected future losses under lease commitments. See below for more information on our corporate restructuring and business transformation. This amount has been excluded from our calculation of comparable EBIT.
Corporate restructuring and business transformation
In mid-2015, we commenced a business restructuring and transformation initiative. While there is no change to our corporate strategy, we have undertaken this initiative to reduce overall costs and maximize the effectiveness and efficiency of our existing operations.
At December 31, 2015, we had incurred $122 million before tax of 2015 corporate restructuring charges primarily related to severance, and recorded a provision of $87 million before tax related to planned severance costs in 2016 and expected future losses under lease commitments.
Of the total corporate restructuring charges of $209 million, $157 million was recorded in plant operating costs and other in the consolidated statement of income which was partially offset by $58 million recorded in revenues in the consolidated statement of income related to costs that were recoverable through current year regulatory and tolling structures. In addition, $44 million was recorded as a regulatory asset on the consolidated balance sheet, as it is expected to be recovered in future periods' regulatory and tolling structures, and $8 million was capitalized to projects impacted by the corporate restructuring.
We continue to progress our restructuring and business transformation initiative with further work to be completed in 2016. Benefits, in the form of enhanced business efficiencies and effectiveness, will be reflected in savings related to the execution of our capital programs, flow-through amounts to customers under established regulatory and commercial arrangements, and increased earnings. Determination of the amount and allocation of these benefits is predicated on completing additional phases of the initiative either underway or in the planning stage.
|
| | |
| | | |
78 TransCanada Management's discussion and analysis 2015 | | |
OTHER INCOME STATEMENT ITEMS
The following are reconciliations and related analyses of our non-GAAP measures to the equivalent GAAP measures. See page 10 for more information on non-GAAP measures we use and page 108 for reconciliation to its GAAP equivalent.
Interest Expense
|
| | | | | | | | |
| year ended December 31 | | | | | |
| (millions of $) | 2015 |
| | 2014 |
| | 2013 |
|
| | | | | | |
Comparable interest on long-term debt (including interest on junior subordinated notes) | | | | | |
| Canadian dollar-denominated | (437 | ) | | (443 | ) | | (495 | ) |
| U.S. dollar-denominated | (911 | ) | | (854 | ) | | (766 | ) |
| Foreign exchange | (255 | ) | | (90 | ) | | (20 | ) |
| | (1,603 | ) | | (1,387 | ) | | (1,281 | ) |
| Other interest and amortization expense | (47 | ) | | (70 | ) | | 10 |
|
| Capitalized interest | 280 |
| | 259 |
| | 287 |
|
| Comparable interest expense | (1,370 | ) | | (1,198 | ) | | (984 | ) |
| Specific item: | | | | | |
| NEB 2013 Decision – 2012 | — |
| | — |
| | (1 | ) |
| Interest expense | (1,370 | ) | | (1,198 | ) | | (985 | ) |
Comparable interest expense in 2015 was $172 million higher than in 2014 due to the net effect of:
| |
| • | higher interest expense as a result of long term debt issuances partially offset by Canadian and U.S. dollar-denominated debt maturities. See the Financial condition section on page 82 for details on long term debt |
| |
| • | a stronger U.S dollar and its effect on the foreign exchange impact on interest expense related to U.S. dollar-denominated debt |
| |
| • | lower carrying charges to shippers in 2015 on the net revenue variance for the Canadian Mainline |
| |
| • | higher capitalized interest primarily due to capital spending on Liquids Pipelines projects, LNG projects and the Napanee power generating facility, partially offset by lower capitalized interest on the completion of the Gulf Coast extension of the Keystone Pipeline System in first quarter 2014. |
Comparable interest expense in 2014 was $214 million higher than 2013 due to the net effect of:
| |
| • | higher interest expense as a result of long term debt issuances partially offset by Canadian and U.S. dollar-denominated debt maturities |
| |
| • | a stronger U.S dollar and its effect on the foreign exchange impact on interest expense related to U.S. dollar-denominated debt |
| |
| • | higher carrying charges to shippers in 2014 on the net revenue variance for Canadian Mainline |
| |
| • | lower capitalized interest due to the completion of the Gulf Coast extension of the Keystone Pipeline System in first quarter 2014, partially offset by higher capitalized interest primarily for Keystone XL. |
|
| | |
| | | |
| | TransCanada Management's discussion and analysis 2015 79
|
Interest income and other
|
| | | | | | | | | |
| year ended December 31 | | | | | | |
| (millions of $) | | 2015 |
| | 2014 |
| | 2013 |
|
| | | | | | | |
| Comparable interest income and other | | 184 |
| | 112 |
| | 42 |
|
| Specific items (pre-tax): | | | | | | |
| NEB 2013 Decision – 2012 | | — |
| | — |
| | 1 |
|
| Risk management activities | | (21 | ) | | (21 | ) | | (9 | ) |
| Interest income and other | | 163 |
| | 91 |
| | 34 |
|
In 2015 comparable interest income and other was $72 million higher than 2014. In 2014, comparable interest income and other was $70 million higher than 2013. These variances were the net result of:
| |
| • | increased AFUDC related to our rate-regulated projects, including Energy East Pipeline and our Mexico pipeline projects |
| |
| • | higher realized losses in 2015 compared to 2014 and 2014 compared to 2013 on derivatives used to manage our net exposure to foreign exchange rate fluctuations on U.S. dollar-denominated income |
| |
| • | the impact of a fluctuating U.S. dollar on the translation of foreign currency denominated working capital. |
Income tax expense
|
| | | | | | | | | |
| year ended December 31 | | | | | | |
| (millions of $) | | 2015 |
| | 2014 |
| | 2013 |
|
| | | | | | | |
| Comparable income tax expense | | (903 | ) | | (859 | ) | | (662 | ) |
| Specific items: | | | | | | |
| Keystone XL impairment charge | | 795 |
| | — |
| | — |
|
| TC Offshore loss on sale | | 39 |
| | — |
| | — |
|
| Restructuring costs | | 25 |
| | — |
| | — |
|
| Turbine equipment impairment charge | | 16 |
| | — |
| | — |
|
| Bruce Power merger – debt retirement charge | | 9 |
| | — |
| | — |
|
| Alberta corporate income tax rate increase | | (34 | ) | | — |
| | — |
|
| Cancarb gain on sale | | — |
| | (9 | ) | | — |
|
| Niska contract termination | | — |
| | 11 |
| | — |
|
| Gas Pacifico/INNERGY gain on sale | | — |
| | (1 | ) | | — |
|
| NEB 2013 Decision – 2012 | | — |
| | — |
| | 42 |
|
| Part VI.I income tax adjustment | | — |
| | — |
| | 25 |
|
| Risk management activities | | 19 |
| | 27 |
| | (16 | ) |
| Income tax expense | | (34 | ) | | (831 | ) | | (611 | ) |
Comparable income tax expense increased $44 million in 2015 compared to 2014 mainly because of higher pre-tax earnings in 2015 compared to 2014 and changes in the proportion of income earned between Canadian and foreign jurisdictions.
Comparable income tax expense increased $197 million in 2014 compared to 2013 because of higher pre-tax earnings in 2014, changes in the proportion of income earned between Canadian and foreign jurisdictions as well as higher flow-through taxes in 2014 on Canadian regulated pipelines.
|
| | |
| | | |
80 TransCanada Management's discussion and analysis 2015 | | |
Net income attributable to non-controlling interests
Comparable net income attributable to non-controlling interests is a non-GAAP measure. See page 10 for more information on non-GAAP measures we use.
|
| | | | | | | | | |
| year ended December 31 | | | | | | |
| (millions of $) | | 2015 |
| | 2014 |
| | 2013 |
|
| | | | | | | |
| Comparable net income attributable to non-controlling interests | | (205 | ) | | (153 | ) | | (125 | ) |
| Specific item: | | | | | | |
| TC PipeLines, LP – Great Lakes impairment | | 199 |
| | — |
| | — |
|
| Net income attributable to non-controlling interests | | (6 | ) | | (153 | ) | | (125 | ) |
Net income attributable to non-controlling interests decreased by $147 million in 2015 compared to 2014 due to an impairment charge recorded by TC PipeLines, LP related to their equity investment goodwill in Great Lakes. At December 31, 2015, TC PipeLines, LP recorded an impairment of US$199 million. On consolidation, we recorded the non-controlling interests' 72 per cent of this TC PipeLines, LP impairment charge, which was US$143 million, or $199 million (in Canadian dollars). TC PipeLines, LP's impairment charge is not recognized at the TransCanada consolidation level as a result of our lower carrying value of Great Lakes. This $199 million positive impact to net income attributable to non-controlling interests is excluded from comparable net income attributable to non-controlling interests. See Critical accounting estimates section on page 101 for more information on our goodwill impairment testing.
Comparable net income attributable to non-controlling interests increased by $52 million in 2015 compared to 2014 due to higher earnings resulting from the sale of our remaining 30 per cent direct interests in GTN in April 2015 and Bison in October 2014 to TC PipeLines, LP along with the impact of a stronger U.S. dollar on the Canadian dollar equivalent earnings from TC PipeLines, LP.
Comparable net income attributable to non-controlling interest increased $28 million in 2014 compared to 2013 primarily due to the sale of a 45 per cent interest in each of GTN and Bison to TC PipeLines, LP in July 2013 and the remaining 30 per cent of Bison in October 2014. This was partially offset by the redemption of TCPL Series U preferred shares in October 2013 and TCPL Series Y preferred shares in March 2014.
Preferred share dividends
|
| | | | | | | | | |
| year ended December 31 | | | | | | |
| (millions of $) | | 2015 |
| | 2014 |
| | 2013 |
|
| | | | | | | |
| Preferred share dividends | | (94 | ) | | (97 | ) | | (74 | ) |
Preferred share dividends were $94 million for 2015. See Financial condition section on page 82 for more information. Preferred share dividends increased $23 million to $97 million in 2014 compared to $74 million in 2013 due to the issuance of Series 7 preferred shares in March 2013.
|
| | |
| | | |
| | TransCanada Management's discussion and analysis 2015 81
|
Financial condition
We strive to maintain strong financial capacity and flexibility in all parts of the economic cycle. We rely on our operating cash flow to sustain our business, pay dividends and fund a portion of our growth. In addition, we access capital markets to meet our financing needs, manage our capital structure and to preserve our credit ratings.
We believe we have the financial capacity to fund our existing capital program through our predictable cash flow from our operations, access to capital markets, portfolio management including proceeds from the sale of natural gas pipeline assets to TC PipeLines, LP, cash on hand and substantial committed credit facilities.
Balance sheet analysis
As of December 31, 2015, assets increased by $6.0 billion, liabilities increased by $8.5 billion and equity decreased by $2.5 billion compared to December 31, 2014.
The effect of the strengthened U.S. dollar in 2015 resulted in increases to the Canadian dollar equivalent of our U.S. dollar assets, liabilities and non-controlling interests. Also impacting the increase to assets were:
| |
| • | investments in property, plant and equipment on the NGTL System, Mexico pipeline construction, ANR, Northern Courier and Napanee |
| |
| • | equity investments in Bruce Power and Grand Rapids |
| |
| • | capital investment in projects under development including Energy East. |
These increases to assets were partially offset by the impairment of Keystone XL and related projects.
Aside from the foreign exchange impact, the increase in liabilities was mainly due to the issuance in 2015 of long-term debt and junior subordinated debt exceeding repayment and increased regulatory liabilities for the Canadian Mainline.
|
| | |
| | | |
82 TransCanada Management's discussion and analysis 2015 | | |
The decrease in equity in 2015 was mainly due to the net loss attributable to controlling interests of $1,146 million and the dividends declared on common and preferred shares in the year.
Consolidated capital structure
at December 31, 2015
| |
1 | Includes non-controlling interests in TC PipeLines, LP and Portland |
| |
2 | Net of cash and excluding junior subordinated notes |
As at December 31, 2015, we had unused capacity of $2.0 billion, $2.0 billion and US$4.0 billion under our equity, Canadian debt and U.S. debt shelf prospectuses, respectively, to facilitate future access to the North American debt and equity markets.
We were in compliance with all of our financial covenants at December 31, 2015. Provisions of various trust indentures and credit arrangements with certain of our subsidiaries can restrict those subsidiaries' ability to declare and pay dividends or make distributions under certain circumstances. If such restrictions apply, they may, in turn, have an impact on our ability to declare and pay dividends on our common and preferred shares. In the opinion of management, these provisions do not currently restrict or alter our ability to declare or pay dividends. These trust indentures and credit arrangements also require us to comply with various affirmative and negative covenants and maintain certain financial ratios.
Cash flow
The following tables summarize the consolidated cash flow of our business.
|
| | | | | | | | | |
| year ended December 31 | | | | | | |
| (millions of $) | | 2015 |
| | 2014 |
| | 2013 |
|
| | | | | | | |
| Net cash provided by operations | | 4,115 |
| | 4,079 |
| | 3,674 |
|
| Net cash used in investing activities | | (4,610 | ) | | (4,144 | ) | | (5,120 | ) |
| Deficiency | | (495 | ) | | (65 | ) | | (1,446 | ) |
| Net cash provided by/(used in) financing activities | | 744 |
| | (373 | ) | | 1,794 |
|
| | | 249 |
| | (438 | ) | | 348 |
|
| Effect of foreign exchange rate changes on Cash and Cash Equivalents | | 112 |
| | — |
| | 28 |
|
| Net change in Cash and Cash Equivalents | | 361 |
| | (438 | ) | | 376 |
|
We continue to fund our capital program through cash flow from operations, capital market financing activities and the sale of our U.S. natural gas pipeline assets to TC PipeLines, LP.
Liquidity will continue to be comprised of predictable cash flow generated from operations, committed credit facilities, our ability to access debt and equity markets in both Canada and the U.S., portfolio management including additional drop downs of our U.S. natural gas pipeline assets into TC PipeLines, LP and cash on hand.
The drop down of our remaining U.S. natural gas pipeline assets into TC PipeLines, LP remains an important financing lever for us as it executes our capital growth program, subject to actual funding needs, market conditions, the relative attractiveness of alternate capital sources and the approvals of TC PipeLines LP’s board and our board.
|
| | |
| | | |
| | TransCanada Management's discussion and analysis 2015 83
|
Net cash provided by operations
|
| | | | | | | | | |
| year ended December 31 | | | | | | |
| (millions of $) | | 2015 |
| | 2014 |
| | 2013 |
|
| | | | | | | |
| Funds generated from operations | | 4,513 |
| | 4,268 |
| | 4,000 |
|
| Increase in operating working capital | | (398 | ) | | (189 | ) | | (326 | ) |
| Net cash provided by operations | | 4,115 |
| | 4,079 |
| | 3,674 |
|
Funds generated from operations, a non-GAAP measure, helps us assess the cash generating ability of our operations excluding the timing effects of working capital changes. See page 10 for more information about non-GAAP measures. The increase in 2015 compared to 2014 was driven by the increase in comparable earnings (as discussed in Financial highlights on page 19) adjusted for the following non-cash items: decreased deferred income tax expense, increased depreciation, higher equity AFUDC income and lower equity earnings. Funds generated from operations also reflected higher distributed earnings from equity investments, primarily from Bruce Power and our U.S. natural gas pipelines.
At December 31, 2015, our current liabilities were higher than our current assets, leaving us with a working capital deficit of $3.4 billion. This short-term deficiency is considered to be in the normal course of a growing business and is managed through:
| |
| • | our ability to generate predictable and growing cash flow from operations |
| |
| • | our access to capital markets |
| |
| • | approximately $7 billion of unutilized unsecured credit facilities. |
Comparable distributable cash flow
|
| | | | | | | | | |
| year ended December 31 | | | | | | |
| (millions of $) | | 2015 |
| | 2014 |
| | 2013 |
|
| | | | | | | |
| Net cash provided by operations | | 4,115 |
| | 4,079 |
| | 3,674 |
|
| Increase in operating working capital | | 398 |
| | 189 |
| | 326 |
|
| Funds generated from operations | | 4,513 |
| | 4,268 |
| | 4,000 |
|
| Distributions in excess of equity earnings | | 226 |
| | 159 |
| | 128 |
|
| Preferred share dividends paid | | (92 | ) | | (94 | ) | | (71 | ) |
| Distributions paid to non-controlling interests | | (224 | ) | | (178 | ) | | (166 | ) |
| Maintenance capital expenditures including equity investments | | (937 | ) | | (781 | ) | | (573 | ) |
| Distributable cash flow | | 3,486 |
| | 3,374 |
| | 3,318 |
|
| Specific items impacting distributable cash flow (net of tax): | | | | | | |
| Restructuring costs | | 60 |
| | — |
| | — |
|
| Niska contract termination | | — |
| | 32 |
| | — |
|
| NEB 2013 Decision – 2012 | | — |
| | — |
| | (84 | ) |
| Comparable distributable cash flow | | 3,546 |
| | 3,406 |
| | 3,234 |
|
| Comparable distributable cash flow per common share | | $5.00 | | $4.81 | | $4.57 |
Comparable distributable cash flow, a non-GAAP measure, helps us assess the cash available to common shareholders before capital allocation. The increases from 2014 to 2015 as well as 2013 to 2014 were driven by increases in funds generated from operations, as described above, partially offset by higher maintenance capital expenditures primarily on ANR in 2015, and the Canadian Mainline and the NGTL System in 2014 and 2013. See page 10 for more information on non-GAAP measures we use.
Maintenance capital expenditures on our Canadian regulated natural gas pipelines was $347 million in 2015, $355 million in 2014 and $236 million in 2013 which contributed to their respective rate bases and net income.
|
| | |
| | | |
84 TransCanada Management's discussion and analysis 2015 | | |
Net cash used in investing activities
|
| | | | | | | | | |
| year ended December 31 | | | | | | |
| (millions of $) | | 2015 |
| | 2014 |
| | 2013 |
|
| | | | | | | |
| Capital spending | | | | | | |
| Capital expenditures | | (3,918 | ) | | (3,489 | ) | | (4,264 | ) |
| Capital projects in development | | (511 | ) | | (848 | ) | | (488 | ) |
| | | (4,429 | ) | | (4,337 | ) | | (4,752 | ) |
| Contributions to equity investments | | (493 | ) | | (256 | ) | | (163 | ) |
| Acquisitions, net of cash acquired | | (236 | ) | | (241 | ) | | (216 | ) |
| Proceeds from sale of assets, net of transaction costs | | — |
| | 196 |
| | — |
|
| Distributions in excess of equity earnings | | 226 |
| | 159 |
| | 128 |
|
| Deferred amounts and other | | 322 |
| | 335 |
| | (117 | ) |
| Net cash used in investing activities | | (4,610 | ) | | (4,144 | ) | | (5,120 | ) |
Our 2015 capital expenditures were incurred primarily for:
| |
| • | the expansion of the NGTL System |
| |
| • | construction of Mexico pipelines |
| |
| • | capital additions to our ANR pipeline |
| |
| • | construction of the Northern Courier pipeline |
| |
| • | expansion of the Canadian Mainline |
| |
| • | construction of the Napanee power generating facility. |
Our 2014 capital expenditures were incurred primarily for expanding our NGTL System, construction of our Mexican pipelines, construction of the Houston Lateral and Tank Terminal and expansion of the ANR pipeline.
Our 2013 capital expenditures were incurred primarily for construction of the Gulf Coast project, expanding our NGTL System and construction of our Mexican pipelines.
Costs incurred on capital projects in development in 2015, 2014 and 2013 primarily related to the Energy East Pipeline and LNG pipeline projects.
Contributions to equity investments increased in 2015 compared to 2014 and 2014 compared to 2013 primarily due to our investments in Bruce Power and in Grand Rapids Phase 1 pipeline.
In 2015, we acquired an additional ownership interest in Bruce Power. See Significant events in the Energy section for more information. In 2014, we acquired an additional four solar facilities in Ontario and sold Cancarb and its related power generation facilities. In 2013, we acquired our first four solar facilities.
The increases from 2014 to 2015 and 2013 to 2014 in distributions in excess of equity earnings are primarily due to distributions from Bruce A.
|
| | |
| | | |
| | TransCanada Management's discussion and analysis 2015 85
|
Net cash provided by/(used in) financing activities
|
| | | | | | | | | |
| year ended December 31 | | | | | | |
| (millions of $) | | 2015 |
| | 2014 |
| | 2013 |
|
| | | | | | | |
| Notes payable (repaid)/issued, net | | (1,382 | ) | | 544 |
| | (492 | ) |
| Long-term debt issued, net of issue costs | | 5,045 |
| | 1,403 |
| | 4,253 |
|
| Long-term debt repaid | | (2,105 | ) | | (1,069 | ) | | (1,286 | ) |
| Junior subordinated notes issued, net of issue costs | | 917 |
| | — |
| | — |
|
| Dividends and distributions paid | | (1,762 | ) | | (1,617 | ) | | (1,522 | ) |
| Common shares issued | | 27 |
| | 47 |
| | 72 |
|
| Common shares repurchased | | (294 | ) | | — |
| | — |
|
| Preferred shares issued, net of issue costs | | 243 |
| | 440 |
| | 585 |
|
| Partnership units of subsidiary issued, net of issue costs | | 55 |
| | 79 |
| | 384 |
|
| Preferred shares of subsidiary redeemed | | — |
| | (200 | ) | | (200 | ) |
| Net cash provided by/(used in) financing activities | | 744 |
| | (373 | ) | | 1,794 |
|
Long-term debt issued
|
| | | | | | | | | | | |
| (millions of $) | | | | | | | | | | |
| Entity | | Issue date | | Type | | Maturity date | | Amount | | Interest rate |
|
| | | | | | | | | | | |
| TCPL | | January 2016 | | Senior Unsecured Notes | | January 2026 | | US$850 | | 4.875 | % |
| | | January 2016 | | Senior Unsecured Notes | | January 2019 | | US$400 | | 3.125 | % |
| | | November 2015 | | Senior Unsecured Notes | | November 2017 | | US$1,000 | | 1.625 | % |
| | | October 2015 | | Medium-Term Notes | | November 2041 | | $400 | | 4.55 | % |
| | | July 2015 | | Medium-Term Notes | | July 2025 | | $750 | | 3.30 | % |
| | | March 2015 | | Senior Unsecured Notes | | March 2045 | | US$750 | | 4.60 | % |
| | | January 2015 | | Senior Unsecured Notes | | January 2018 | | US$500 | | 1.875 | % |
| | | January 2015 | | Senior Unsecured Notes | | January 2018 | | US$250 | | Floating |
|
| | | February 2014 | | Senior Unsecured Notes | | March 2034 | | US$1,250 | | 4.63 | % |
| | | October 2013 | | Senior Unsecured Notes | | October 2023 | | US$625 | | 3.75 | % |
| | | October 2013 | | Senior Unsecured Notes | | October 2043 | | US$625 | | 5.00 | % |
| | | July 2013 | | Senior Unsecured Notes | | June 2016 | | US$500 | | Floating |
|
| | | July 2013 | | Medium-Term Notes | | July 2023 | | $450 | | 3.69 | % |
| | | July 2013 | | Medium-Term Notes | | November 2041 | | $300 | | 4.55 | % |
| | | January 2013 | | Senior Unsecured Notes | | January 2016 | | US$750 | | 0.75 | % |
| | | | | | | | | | | |
| TC PipeLines, LP | | September 2015 | | Unsecured Term Loan | | October 2018 | | US$170 | | Floating |
|
| | | March 2015 | | Senior Unsecured Notes | | March 2025 | | US$350 | | 4.375 | % |
| | | July 2013 | | Unsecured Term Loan Facility | | July 2018 | | US$500 | | Floating |
|
| | | | | | | | | | | |
| Gas Transmission Northwest LLC | | June 2015 | | Unsecured Term Loan | | June 2019 | | US$75 | | Floating |
|
|
| | |
| | | |
86 TransCanada Management's discussion and analysis 2015 | | |
Junior subordinated notes issued
|
| | | | | | | | | | |
(millions of $) Entity | | Issue date | | Type | | Maturity date | | Amount | | Interest rate |
| | | | | | | | | | | |
| TCPL | | May 2015 | | Junior subordinated notes1 | | May 2075 | | US$750 | | 5.875%2 |
| |
1 | The Junior subordinated notes are subordinated in right of payment to existing and future senior indebtedness or other obligations of TCPL and are callable at TCPL's option at any time on or after May 20, 2025 at 100 per cent of the principal amount plus accrued and unpaid interest to the date of redemption. |
| |
2 | The Junior subordinated notes were issued to TransCanada Trust. The interest rate is fixed at 5.875 per cent per annum and will reset starting May 2025 until May 2045 to the three month LIBOR plus 3.778 per cent per annum; from May 2045 to May 2075 the interest rate will reset to the three month LIBOR plus 4.528 per cent per annum. |
TransCanada Trust (the Trust), a financing trust subsidiary wholly owned by TCPL, issued US$750 million Trust Notes - Series 2015-A (Trust Notes) to third party investors with a fixed interest rate of 5.625 per cent for the first ten years converting to a floating rate thereafter. All of the proceeds of the issuance by the Trust were loaned to us in US$750 million junior subordinated notes of TCPL at a rate of 5.875 per cent which includes a 0.25 per cent administration charge. While the obligations of the Trust are fully and unconditionally guaranteed by TCPL on a subordinated basis, the Trust is not consolidated in our financial statements as TCPL does not have a variable interest in the Trust and the only substantive assets of the Trust are receivables from TCPL.
Pursuant to the terms of the Trust Notes and related agreements, in certain circumstances, (1) TCPL may issue deferral preferred shares to holders of the Trust Notes in lieu of interest; and (2) TransCanada and TCPL would be prohibited from declaring or paying dividends on or redeeming their outstanding preferred shares (or, if none are outstanding, their respective common shares) until all deferral preferred shares are redeemed by TCPL. The Trust Notes may also be automatically exchanged for preferred shares of TCPL upon certain kinds of bankruptcy and insolvency events. All of these preferred shares would rank equally with other outstanding first preferred shares of TCPL. Further details regarding the terms of the Trust Notes and the related agreements entered into by TransCanada and TCPL can be found in the prospectus in respect of the Trust Notes and other documents filed under the Trust's profile on SEDAR at www.sedar.com.
Long-term debt retired |
| | | | | | | | | | | |
| (millions of $) | | Retirement date | | | | | | |
| Entity | | | Type | | Amount |
| | Interest rate |
|
| | | | | | | | | |
| TCPL | | January 2016 | | Senior Unsecured Notes | | US$750 | | 0.75 | % |
| | | August 2015 | | Debentures | |
| $150 |
| | 11.90 | % |
| | | June 2015 | | Senior Unsecured Notes | |
| US$500 |
| | 3.40 | % |
| | | March 2015 | | Senior Unsecured Notes | |
| US$500 |
| | 0.875 | % |
| | | January 2015 | | Senior Unsecured Notes | |
| US$300 |
| | 4.875 | % |
| | | June 2014 | | Debentures | |
| $125 |
| | 11.10 | % |
| | | February 2014 | | Medium-Term Notes | |
| $300 |
| | 5.05 | % |
| | | January 2014 | | Medium-Term Notes | |
| $450 |
| | 5.65 | % |
| | | August 2013 | | Senior Unsecured Notes | | US$500 | | 5.05 | % |
| | | June 2013 | | Senior Unsecured Notes | | US$350 | | 4.00 | % |
| | | | | | | | | |
| Gas Transmission Northwest LLC | | June 2015 | | Senior Unsecured Notes | | US$75 | | 5.09 | % |
| | | | | | | | | |
| Nova Gas Transmission Ltd. | | June 2014 | | Debentures | |
| $53 |
| | 11.20 | % |
|
| | |
| | | |
| | TransCanada Management's discussion and analysis 2015 87
|
Preferred share issuance, redemption and conversion
On February 1, 2016, holders of 1.3 million Series 5 cumulative redeemable first preferred shares exercised their option to convert to Series 6 cumulative redeemable first preferred shares and receive quarterly floating rate cumulative dividends at an annual rate equal to the applicable 90-day Government of Canada treasury bill rate plus 1.54 per cent which will reset every quarter going forward. The fixed dividend rate on the remaining Series 5 preferred shares was reset for five years at 2.263 per cent per annum Such rate will reset every five years.
In June 2015, holders of 5.5 million Series 3 cumulative redeemable first preferred shares exercised their option to convert to Series 4 cumulative redeemable first preferred shares and receive quarterly floating rate cumulative dividends at an annual rate equal to the applicable 90-day Government of Canada treasury bill rate plus 1.28 per cent which will reset every quarter going forward. The fixed dividend rate on the remaining Series 3 preferred shares was reset for five years at 2.152 per cent per annum representing the sum of the applicable Government of Canada five year bond rate plus 1.28 per cent. Such rate will reset every five years.
In March 2015, we completed a public offering of 10 million Series 11 cumulative redeemable first preferred shares at $25 per share resulting in gross proceeds of $250 million. The Series 11 preferred shareholders will have the right to convert their Series 11 preferred shares into Series 12 cumulative redeemable first preferred shares on November 30, 2020 and on November 30 of every fifth year thereafter. The holders of Series 12 preferred shares will be entitled to receive quarterly floating rate cumulative dividends at an annual rate equal to the applicable 90-day Government of Canada treasury bill rate plus 2.96 per cent. The fixed dividend rate on the Series 11 preferred shares was set for five years at 3.8 per cent per annum or $0.95 per share.
The following table summarizes the impact of the above issuance and conversion of preferred shares discussed above:
|
| | | | | | | | | | | | | | | | | | |
| (millions of Canadian $, unless noted otherwise) | | Number of shares issued and outstanding (thousands) | | Current yield1 | | Annual dividend per share1 | | Redemption price per share2 | | Redemption and conversion option date | | Right to convert into |
| | | | | | | | | | | | | |
| Cumulative first preferred shares | | | | | | | | | | |
| Series 3 | | 8,533 |
| | 2.152 | % | |
| $0.538 |
| |
| $25.00 |
| | June 30, 2020 | | Series 4 |
| Series 4 | | 5,467 |
| | Floating3 |
| | Floating |
| |
| $25.00 |
| | June 30, 2020 | | Series 3 |
| Series 5 | | 12,715 |
| | 2.263 | % | |
| $0.56575 |
| |
| $25.00 |
| | January 30, 2021 | | Series 6 |
| Series 6 | | 1,285 |
| | Floating4 |
| | Floating |
| |
| $25.00 |
| | January 30, 2021 | | Series 5 |
| Series 11 | | 10,000 |
| | 3.8 | % | |
| $0.95 |
| |
| $25.00 |
| | November 30, 2020 | | Series 12 |
| |
1 | Holders of the cumulative redeemable first preferred shares set out in this table are entitled to receive a fixed cumulative quarterly preferred dividend, as and when declared by the Board with the exception of Series 4 and Series 6 preferred shares. The holders of Series 4 and Series 6 preferred shares are entitled to receive a quarterly floating rate cumulative preferred dividend as and when declared by the Board. |
| |
2 | We may, at our option, redeem all or a portion of the outstanding preferred shares for the redemption price per share, plus all accrued and unpaid dividends on the redemption option date and on every fifth anniversary date thereafter. In addition, Series 2 and Series 4 preferred shares are redeemable by us at any time other than on a designated date for $25.50 per share plus all accrued and unpaid dividends on such redemption date, in which case they are redeemable at $25.00 per share plus all accrued and unpaid dividends. |
| |
3 | Commencing December 31, 2015, the floating quarterly dividend rate for the Series 4 preferred shares is 1.778 per cent and will reset every quarter going forward. |
| |
4 | Commencing February 1, 2016, the floating quarterly dividend rate for the Series 6 preferred shares is 2.037 per cent and will reset every quarter going forward. |
|
| | |
| | | |
88 TransCanada Management's discussion and analysis 2015 | | |
In December 2014, Series 1 shareholders elected to convert 12.5 million of our 22 million outstanding Series 1 cumulative redeemable first preferred shares, on a one-for-one basis into Series 2 floating-rate cumulative redeemable first preferred shares. The Series 1 shares will yield an annual fixed dividend rate of 3.266 per cent, paid on a quarterly basis, for the five-year period which began on December 31, 2014. The Series 2 shares will pay a floating quarterly dividend at an annualized rate equal to the sum of the 90-day Government of Canada treasury bill rate and 1.92 per cent for the five-year period which began on December 31, 2014.
In March 2014, TCPL redeemed all four million of its Series Y preferred shares at a price of $50 per share plus $0.2455 representing accrued and unpaid dividends. The total face value of the outstanding Series Y shares was $200 million and they carried an aggregate of $11 million in annualized dividends.
In January 2014, we completed a public offering of 18 million Series 9 cumulative redeemable first preferred shares at $25 per share resulting in gross proceeds of $450 million. Investors are entitled to receive fixed cumulative dividends at an annual rate of $1.0625 per share, payable quarterly. The dividend rate will reset on October 30, 2019 and every five years thereafter to a yield per annum equal to the sum of the then five-year Government of Canada bond yield and 2.35 per cent. The preferred shares are redeemable by us on or after October 30, 2019 and on October 30 of every fifth year thereafter at a price of $25 per share plus accrued and unpaid dividends. Investors will have the right to convert their shares into Series 10 cumulative redeemable first preferred shares on October 30, 2019 and on October 30 of every fifth year thereafter. The holders of Series 10 preferred shares will be entitled to receive quarterly floating rate cumulative dividends at an annualized rate equal to the sum of the then 90-day Government of Canada treasury bill rate and 2.35 per cent.
The net proceeds of the above debt and preferred share offerings were used for general corporate purposes and to reduce short-term indebtedness.
Common shares repurchased
On November 19, 2015, we announced that the TSX approved our NCIB, which allows for the repurchase and cancellation of up to 21.3 million of our common shares, representing three per cent of our issued and outstanding common shares, between November 23, 2015 and November 22, 2016, at prevailing market prices plus brokerage fees, or such other prices as may be permitted by the TSX.
The following table provides the information related to shares repurchased to date under the NCIB:
|
| | | | |
| at February 10, 2016 | | |
| (millions of $, except per share data) | | |
| | | |
Number of common shares repurchased1 | | 7.1 |
|
Weighted-average price per common share2 | |
| $43.36 |
|
| Amount of repurchase | |
| $307 |
|
| |
1 | Includes repurchases of common shares pursuant to private agreements between us and third-parties. |
| |
2 | Includes brokerage fees. |
TC PipeLines, LP
At-the-market equity issuance program
In August 2014, TC PipeLines, LP initiated its at-the-market equity issuance program (ATM program) under which it is authorized to offer and sell common units having an aggregate offering price of up to US$200 million. Our ownership interest in TC PipeLines, LP will decrease as a result of equity issuances under the ATM program.
From January 1 to December 31, 2015, 0.7 million common units were issued under the TC PipeLines, LP ATM program generating net proceeds of approximately US$44 million.
From August 2014 until December 31, 2014, 1.3 million common units were issued under the ATM program generating net proceeds of approximately US$73 million.
|
| | |
| | | |
| | TransCanada Management's discussion and analysis 2015 89
|
Asset drop downs
On January 1, 2016, we closed the sale of a 49.9 per cent interest of our total 61.7 per cent interest in PNGTS to TC PipeLines, LP for US$223 million including the assumption of US$35 million of proportional PNGTS debt.
In April 2015, we closed the sale of our remaining 30 per cent interest in GTN to TC PipeLines, LP, for an aggregate purchase price of US$457 million. Proceeds were comprised of US$264 million in cash, the assumption of US$98 million in proportional GTN debt and US$95 million of new Class B units of TC PipeLines, LP.
In October 2014, we closed the sale of our remaining 30 per cent interest in Bison to TC PipeLines, LP, for cash proceeds of US$215 million.
In July 2013, we closed the sale of a 45 per cent interest in each of GTN and Bison to TC PipeLines, LP for an aggregate purchase price of US$1.05 billion, which included US$146 million representing 45 per cent of GTN's debt.
Credit facilities
We have committed, revolving credit facilities that primarily support our commercial paper programs. In addition, we have demand credit facilities that are used for general corporate purposes, including issuing letters of credit and providing additional liquidity.
At December 31, 2015, we had $8.9 billion (2014 - $6.7 billion) in unsecured credit facilities, including:
|
| | | | | | | | |
| Amount | | Unused capacity | | Subsidiary | | Description | | Matures |
| | | | | | | | | |
| $3 billion | | $3 billion | | TCPL | | Committed, syndicated, revolving, extendible TCPL credit facility that supports TCPL's Canadian commercial paper program | | December 2020 |
| US$1 billion | | US$1 billion | | TCPL | | Committed, syndicated, revolving, extendible TCPL credit facility that supports TCPL's U.S. commercial paper program | | December 2016 |
| US$0.5 billion | | US$0.5 billion | | TCPL USA | | Committed, syndicated, revolving, extendible TCPL USA credit facility that is used for TCPL USA general corporate purposes | | December 2016 |
| US$1.5 billion | | US$1.5 billion | | TAIL/TCPM | | Committed, syndicated, revolving, extendible credit facility that supports the joint TAIL/TCPM commercial paper program in the U.S. | | December 2016 |
| $1.7 billion | | $0.7 billion | | TCPL/TCPL USA | | Supports the issuance of letters of credit and provides additional liquidity | | Demand |
At December 31, 2015, our operated affiliates had an additional $0.6 billion (2014 - $0.4 billion) of undrawn capacity on committed credit facilities.
Contractual obligations
Our contractual obligations include our long-term debt, operating leases, purchase obligations and other liabilities incurred in our business such as environmental liability funds and employee retirement and post-retirement benefit plans.
Payments due (by period)
|
| | | | | | | | | | | | | | |
| at December 31, 2015 | Total |
| | less than 12 months |
| | 12 – 36 months |
| | 37 – 60 months |
| | more than 60 months |
|
| (millions of $) |
| | | | | | | | | | |
| Notes payable | 1,218 |
| | 1,218 |
| | — |
| | — |
| | — |
|
Long-term debt
(includes junior subordinated notes) | 34,061 |
| | 2,547 |
| | 5,529 |
| | 3,029 |
| | 22,956 |
|
Operating leases
(future payments for various premises, services and equipment, less sub-lease receipts) | 1,561 |
| | 308 |
| | 554 |
| | 389 |
| | 310 |
|
| Purchase obligations | 3,759 |
| | 2,397 |
| | 853 |
| | 150 |
| | 359 |
|
| Other long-term liabilities reflected on the balance sheet | 96 |
| | 8 |
| | 18 |
| | 19 |
| | 51 |
|
| | 40,695 |
| | 6,478 |
| | 6,954 |
| | 3,587 |
| | 23,676 |
|
|
| | |
| | | |
90 TransCanada Management's discussion and analysis 2015 | | |
Long-term debt
At the end of 2015, we had $31.6 billion of long-term debt and $2.4 billion of junior subordinated notes outstanding, compared to $24.8 billion of long-term debt and $1.2 billion of junior subordinated notes at December 31, 2014.
Total notes payable were $1.2 billion at the end of 2015 compared to $2.5 billion at the end of 2014.
We attempt to spread out the maturity profile of our debt. The weighted-average maturity of our long-term debt is 16 years, with the majority maturing beyond five years.
Interest payments
At December 31, 2015, scheduled interest payments related to our long-term debt and junior subordinated notes were as follows:
|
| | | | | | | | | | | | | | |
| at December 31, 2015 | Total |
| | less than 12 months |
| | 12 – 36 months |
| | 37 – 60 months |
| | more than 60 months |
|
| (millions of $) |
| | | | | | | | | | |
| Long-term debt | 21,786 |
| | 1,612 |
| | 3,022 |
| | 2,625 |
| | 14,527 |
|
| Junior subordinated notes | 8,229 |
| | 149 |
| | 298 |
| | 298 |
| | 7,484 |
|
| | 30,015 |
| | 1,761 |
| | 3,320 |
| | 2,923 |
| | 22,011 |
|
Operating leases
Our operating leases for premises, services and equipment expire at different times between now and 2052. Some of our operating leases include the option to renew the agreement for one to 25 years.
Our commitments under the Alberta PPAs are considered operating leases and a portion of these PPAs have been subleased to third parties under similar terms and conditions. Fixed payments under these PPAs have been included in our summary of future obligations. Variable payments have been excluded as these payments are dependent upon plant availability and other factors. Our share of power purchased under the PPAs in 2015 was $348 million (2014 – $391 million; 2013 – $242 million).
Purchase obligations
We have purchase obligations that are transacted at market prices and in the normal course of business, including long-term natural gas transportation and purchase arrangements.
Capital expenditure commitments include obligations related to the construction of growth projects and are based on the projects proceeding as planned. Changes to these projects, including cancellation, would reduce or possibly eliminate these commitments as a result of cost mitigation efforts.
|
| | |
| | | |
| | TransCanada Management's discussion and analysis 2015 91
|
Payments due (by period)1
|
| | | | | | | | | | | | | | |
| at December 31, 2015 | Total |
| | less than 12 months |
| | 12 – 36 months |
| | 37 – 60 months |
| | more than 60 months |
|
| (millions of $) |
| | | | | | | | | | |
| Natural Gas Pipelines | | | | | | | | | |
Transportation by others2 | 286 |
| | 91 |
| | 153 |
| | 24 |
| | 18 |
|
Capital spending3 | 901 |
| | 887 |
| | 14 |
| | — |
| | — |
|
| Other | 4 |
| | 2 |
| | 2 |
| | — |
| | — |
|
| Liquids Pipelines | | | | | | | | | |
Capital spending3 | 765 |
| | 563 |
| | 201 |
| | 1 |
| | — |
|
| Other | 38 |
| | 6 |
| | 12 |
| | 9 |
| | 11 |
|
| Energy | | | | | | | | | |
| Commodity purchases | 460 |
| | 262 |
| | 188 |
| | 10 |
| | — |
|
Capital spending3 | 644 |
| | 489 |
| | 155 |
| | — |
| | — |
|
Other4 | 594 |
| | 69 |
| | 99 |
| | 97 |
| | 329 |
|
| Corporate | | | | | | | | | |
| Information technology and other | 67 |
| | 28 |
| | 29 |
| | 9 |
| | 1 |
|
| | 3,759 |
| | 2,397 |
| | 853 |
| | 150 |
| | 359 |
|
| |
1 | The amounts in this table exclude funding contributions to our pension plans. |
| |
2 | Demand rates are subject to change. The contractual obligations in the table are based on demand volumes only and exclude commodity charges incurred when volumes flow. |
| |
3 | Amounts include capital expenditures and capital projects under development, are estimates and are subject to variability based on timing of construction and project enhancements. |
| |
4 | Includes estimates of certain amounts which are subject to change depending on plant-fired hours, use of natural gas storage facilities, the consumer price index, actual plant maintenance costs, plant salaries as well as changes in regulated rates for transportation. |
Outlook
We are developing quality projects under our long-term $58.6 billion capital program. These long-life infrastructure assets are supported by long-term commercial arrangements, and once completed, are expected to generate significant growth in earnings and cash flow.
Our $58.6 billion capital program is comprised of $13.4 billion of near-term projects and $45.2 billion of commercially secured medium and longer-term projects, each of which are subject to key commercial or regulatory approvals. The portfolio is expected to be financed through our growing internally generated cash flow and a combination of funding options including:
| |
| • | additional drop downs of our U.S. natural gas pipeline assets to TC PipeLines, LP |
| |
| • | potential involvement of strategic or financial partners |
Additional financing alternatives available include common equity through DRP or, lastly, discrete equity issuances.
|
| | |
| | | |
92 TransCanada Management's discussion and analysis 2015 | | |
GUARANTEES
Bruce Power
We and our partner, OMERS, have each severally guaranteed some of Bruce Power contingent financial obligations related to a lease agreement and contractor and supplier services. The Bruce Power guarantees have terms to 2018 except for one guarantee with no termination date that has no exposure associated with it.
At December 31, 2015, our share of the potential exposure under the Bruce Power guarantees was estimated to be $88 million. The carrying amount of these guarantees was estimated to be $2 million. Our exposure under certain of these guarantees is unlimited.
Other jointly owned entities
We and our partners in certain other jointly owned entities have also guaranteed (jointly, severally, or jointly and severally) the financial performance of these entities relating mainly to redelivery of natural gas, PPA payments and the payment of liabilities. The guarantees have terms ranging to 2040.
Our share of the potential exposure under these assurances was estimated at December 31, 2015 to be a maximum of $139 million. The carrying amount of these guarantees was $24 million, and is included in other long-term liabilities. In some cases, if we make a payment that exceeds our ownership interest, the additional amount must be reimbursed by our partners.
OBLIGATIONS – PENSION AND OTHER POST-RETIREMENT PLANS
In 2016, we expect to make funding contributions of approximately $70 million for the defined benefit pension plans, approximately $7 million for the other post-retirement benefit plans and approximately $37 million for the savings plan and defined contribution pension plans. In addition, we expect to provide a $33 million letter of credit to the Canadian defined benefit plan for the funding of solvency requirements.
In 2015, we made funding contributions of $96 million to our defined benefit pension plans, $6 million for the other post-retirement benefit plans and $41 million for the savings plan and defined contribution pension plans. We also provided a $33 million letter of credit to a defined benefit plan in lieu of cash funding.
Outlook
The next actuarial valuation for our pension and other post-retirement benefit plans will be carried out as at January 1, 2016. Based on current market conditions, we expect funding requirements for these plans to approximate 2015 levels for several years. This will allow us to amortize solvency deficiencies in the plans, in addition to normal funding costs.
Our net benefit cost for our defined benefit and other post-retirement plans increased to $146 million in 2015 from $115 million in 2014, mainly due to a lower discount rate used to measure the benefit obligation.
Future net benefit costs and the amount we will need to contribute to fund our plans will depend on a range of factors, including:
| |
| • | actual returns on plan assets |
| |
| • | changes to actuarial assumptions and plan design |
| |
| • | actual plan experience versus projections |
| |
| • | amendments to pension plan regulations and legislation. |
We do not expect future increases in the level of funding needed to maintain our plans to have a material impact on our liquidity.
|
| | |
| | | |
| | TransCanada Management's discussion and analysis 2015 93
|
Other information
RISKS AND RISK MANAGEMENT
The following is a summary of general risks that affect our company. You can find risks specific to each operating business segment in the business segment discussions.
Risk management is integral to the successful operation of our business. Our strategy is to ensure that our risks and related exposures are in line with our business objectives and risk tolerance.
We build risk assessment into our decision-making processes at all levels.
The Board's Governance Committee oversees our risk management activities, which includes ensuring that there are appropriate management systems in place to manage our risks, including adequate Board oversight of our risk management policies, programs and practices. Other Board committees oversee specific types of risk: the Audit Committee oversees management's role in monitoring financial risk, the Human Resources Committee oversees executive resourcing and compensation, organizational capabilities and compensation risk, and the Health, Safety and Environment Committee oversees operational, safety and environmental risk through regular reporting from management.
Our executive leadership team is accountable for developing and implementing risk management plans and actions, and effective risk management is reflected in their compensation.
Operational risks
|
| | |
| Risk and Description | Impact | Monitoring and Mitigation |
| Business interruption | | |
| Operational risks, including labour disputes, equipment malfunctions or breakdowns, acts of terror, or natural disasters and other catastrophic events. | Decrease in revenues, increase in operating costs or legal proceedings or other expenses all of which could reduce our earnings. Losses not covered by insurance could have an adverse effect on operations, cash flow and financial position. | We have incident, emergency and crisis management systems to ensure an effective response to minimize further loss or injuries and to enhance our ability to resume operations. We also have a Business Continuity Program that determines critical business processes and develops resumption plans to ensure process continuity. We have comprehensive insurance to mitigate certain of these risks, but insurance does not cover all events in all circumstances. |
| Reputation and relationships | |
| Our reputation and relationship with Indigenous communities and our stakeholders including other communities, landowners, governments and government agencies, and environmental non-governmental organizations is very important. | These Indigenous communities and stakeholders can have a significant impact on our operations, infrastructure development and overall reputation. | Our Stakeholder Engagement Framework is our formal commitment to stakeholder engagement. Our four core values – integrity, collaboration, responsibility and innovation – are at the heart of our commitment to stakeholder engagement, and guide us in our interactions with stakeholders. Additionally, our Aboriginal Relations and Native American Relations Policies guide our engagement with Indigenous communities. |
| Execution and capital costs | |
| Investing in large infrastructure projects involves substantial capital commitments and associated execution risks based on the assumption that these assets will deliver an attractive return on investment in the future. | While we carefully consider the expected cost of our capital projects, under some contracts we bear capital cost overrun and schedule risk which may decrease our return on these projects. | Under some contracts, we share the cost of execution risks with customers, in exchange for the potential benefit they will realize when the project is finished. |
|
| | |
| | | |
94 TransCanada Management's discussion and analysis 2015 | | |
|
| | |
| Risk and Description | Impact | Monitoring and Mitigation |
| | | |
| Cyber security | | |
| We rely on our information technology to process, transmit and store electronic information, including information we use to safely operate our assets. | A breach in the security of our information technology could expose our business to a risk of loss, misuse or interruption of critical information and functions. This could affect our operations, damage our assets, result in safety incidents, damage to the environment, reputational harm, competitive disadvantage, regulatory enforcement actions and potential litigation, which could have a material adverse effect on our operations, financial position and results of operations. | We have a comprehensive cyber security strategy which aligns with industry and recognized standards for cyber security. This strategy includes cyber security risk assessments, continuous monitoring of networks and other information sources for threats to the organization, comprehensive incident response plans/processes and a cyber security awareness program for employees.
|
Pipeline abandonment costs
The NEB's LMCI is an NEB-approved initiative that requires all Canadian pipeline companies regulated by the NEB to set aside funds to cover future pipeline abandonment costs.
Effective January 2015, funds to cover future abandonment costs are collected through an abandonment surcharge applied to monthly tolls set-aside and invested in a Government of Canada fixed income portfolio. A status report for each trust fund disclosing the 2015 year-end balance and audited financial statements will be filed with the NEB in April 2016.
Health, safety and environment
The Health, Safety and Environment committee of TransCanada’s Board of Directors (the Board) monitors compliance with our HSE corporate commitment statement through regular reporting from management. We have an integrated HSE Management System that is used to capture, organize, document, monitor and improve our related policies, programs and procedures.
The HSE Management System is modeled after international standards, conforms to external industry consensus standards and voluntary programs, and complies with applicable legislative requirements and other internal management systems. It follows a continuous improvement cycle.
The committee reviews HSE performance including risk management three times a year. It receives detailed reports on:
| |
| • | overall HSE corporate governance and performance |
| |
| • | operational performance and preventive maintenance metrics |
| |
| • | asset integrity programs |
| |
| • | security and emergency preparedness, incident response and evaluation |
| |
| • | people and process safety performance metrics |
| |
| • | developments in and compliance with applicable legislation and regulations. |
The committee also receives updates on any specific areas of operational and construction risk management review being conducted by management and the results and corrective action plans emanating from internal and third party audits.
The safety and integrity of our existing and newly-developed infrastructure is a top priority. All assets are designed, constructed and commissioned with full consideration given to safety and integrity, and are brought in service only after all necessary requirements have been satisfied. In 2015, we spent $803 million for pipeline integrity on the natural gas and liquids pipelines we operate, an increase of $253 million over 2014 primarily due to an increase of in-line pipeline inspections and related maintenance projects on all systems as well as an increased amount of pipe replacement required due to population encroachment on the pipelines. Under the approved regulatory models in Canada, non-capital pipeline integrity expenditures on NEB-regulated pipelines are generally treated on a flow-through basis and, as a result, these expenditures have minimal impact on our earnings. Under the Keystone Pipeline System contracts, pipeline integrity expenditures are recovered through the tolling mechanism and, as a result, these expenditures generally have no impact on our earnings. We continue to have industry leading safety performance in 2015.
|
| | |
| | | |
| | TransCanada Management's discussion and analysis 2015 95
|
Our Energy operations spending associated with process safety and our various integrity programs is used to minimize risk to employees and the public, process equipment, the surrounding environment, and to prevent disruptions to serving the electrical needs of our customers, within the footprint of each facility.
Spending associated with public safety on Energy assets is focused primarily on our hydro dams and associated equipment.
Our main environmental risks are:
| |
| • | product releases, including crude oil and natural gas, into the environment (land, water and air) |
| |
| • | use, storage and disposal of chemicals and hazardous materials |
| |
| • | compliance with corporate and regulatory policies and requirements and new regulations. |
As described in the Business interruption section, above, we have a set of procedures in place to manage our response to natural disasters which include catastrophic events such as forest fires, tornadoes, earthquakes, floods, volcanic eruptions and hurricanes. The procedures, which are included in our Emergency Preparedness and Response Program, are designed to help protect the health and safety of our employees, minimize risk to the public and limit any operational impacts on the environment.
Environmental compliance and liabilities
Our facilities are subject to federal, state, provincial and local environmental statutes and regulations governing environmental protection, including air and GHG emissions, water quality, wastewater discharges and waste management. Our facilities are required to obtain and comply with a wide variety of environmental registrations, licenses, permits and other approvals and requirements. Failure to comply could result in administrative, civil or criminal penalties, remedial requirements or orders affecting future operations.
Through our Environmental Management Program we continually monitor our facilities to ensure compliance with all environmental requirements. We routinely monitor proposed changes in environmental policy, legislation and regulation, and where the risks are potentially large or uncertain, we comment on proposals independently or through industry associations.
We are not aware of any material outstanding orders, claims or lawsuits against us related to releasing or discharging any material into the environment or in connection with environmental protection.
Compliance obligations can result in significant costs associated with installing and maintaining pollution controls, fines and penalties resulting from any failure to comply, and potential limitations on operations.
Remediation obligations can result in significant costs associated with the investigation and remediation of contaminated properties, and with damage claims arising from the contamination of properties.
It is not possible to estimate the amount and timing of all our future expenditures related to environmental matters because:
| |
| • | environmental laws and regulations (and interpretation and enforcement of them) change |
| |
| • | new claims can be brought against our existing or discontinued assets |
| |
| • | our pollution control and clean up cost estimates may change, especially when our current estimates are based on preliminary site investigation or agreements |
| |
| • | we may find new contaminated sites, or what we know about existing sites could change |
| |
| • | where there is potentially more than one responsible party involved in litigation, we cannot estimate our joint and several liability with certainty. |
At December 31, 2015, we had accrued approximately $32 million related to these obligations (2014 - $31 million). This represents the amount that we have estimated that we will need to manage our currently known environmental liabilities. We believe that we have considered all necessary contingencies and established appropriate reserves for environmental liabilities; however, there is the risk that unforeseen matters may arise requiring us to set aside additional amounts. We adjust this reserve quarterly to account for changes in liabilities.
|
| | |
| | | |
96 TransCanada Management's discussion and analysis 2015 | | |
Greenhouse gas emissions regulation risk
We own assets and have business interests in a number of regions where there are regulations to address industrial GHG emissions. We have procedures in place to comply with these regulations, including:
| |
| • | under the SGER in Alberta, established industrial facilities with GHG emissions above a certain threshold have to reduce their emissions below an intensity baseline. Our Sundance and Sheerness PPA facilities and NGTL System facilities are subject to this regulation. We recover compliance costs on the NGTL System through the tolls our customers pay. A portion of the compliance costs for Sundance and Sheerness are recovered through market pricing and hedging activities. A new climate change policy, the Climate Leadership Plan (CLP), was announced by the Alberta government in the fall of 2015 that has the objective of positioning the provincial economy to be less carbon intensive. Our internal processes and procedures for managing changing regulations such as the CLP are mature. The potential new costs and business opportunities that come with the Alberta CLP are within the bounds of our previously expected changes to GHG regulation. We have been actively managing its exposure to the existing and newly-announced Alberta carbon pricing policies to minimize the impact. |
| |
| • | B.C. has a tax on GHG emissions from fossil fuel combustion. We recover the compliance costs for our compressor and meter stations through the tolls our customers pay. |
| |
| • | U.S. northeastern states that are members of the RGGI have implemented a CO2 cap-and-trade program for electricity generators. This program applies to both the Ravenswood and Ocean State Power generation facilities. |
| |
| • | Québec’s Regulation Respecting a Cap-and-Trade System for Greenhouse Gas Emission Allowances came into force in 2011. Bécancour has been required to cover its GHG emissions since 2013. As per the regulations, the government allocates free emission units for the majority of Bécancour's compliance requirements. The remaining requirements were met with GHG instruments purchased at auctions or secondary markets. The costs of these emissions units were recovered through commercial contracts. The pipeline facilities in Québec are also covered under this regulation and have purchased compliance instruments. |
| |
| • | in 2013, California implemented a cap-and-trade program for industrial emitters of GHGs, including electricity importers. We have costs associated with the program from our power marketing activities. |
We recorded $59 million of expenses under these programs in 2015 (2014 - $54 million). There are federal, regional, state and provincial initiatives currently in development. While economic events may continue to affect the scope and timing of new regulations, we anticipate that most of our facilities will be subject to future regulations to manage industrial GHG emissions.
Financial risks
We are exposed to market risk, counterparty credit risk and liquidity risk, and have strategies, policies and limits in place to mitigate their impact on our earnings, cash flow and, ultimately, shareholder value.
These strategies, policies and limits are designed to ensure our risks and related exposures are in line with our business objectives and risk tolerance. We manage market risk and counterparty credit risk within limits that are ultimately established by the Board, implemented by senior management and monitored by our risk management and internal audit groups. Management monitors compliance with market and counterparty risk management policies and procedures, and reviews the adequacy of the risk management framework, overseen by the Audit Committee. Our internal audit group assists the Audit Committee by carrying out regular and ad-hoc reviews of risk management controls and procedures, and reporting up to the Audit Committee.
Market risk
We build and invest in energy infrastructure projects, buy and sell energy commodities, issue short-term and long-term debt (including amounts in foreign currencies) and invest in foreign operations. Certain of these activities expose us to market risk from changes in commodity prices and foreign exchange and interest rates which may affect our earnings and the value of the financial instruments we hold.
We use derivative contracts to assist in managing our exposure to market risk, including:
| |
| • | forwards and futures contracts – agreements to buy or sell a financial instrument or commodity at a specified price and date in the future. We use foreign exchange and commodity forwards and futures to manage the impact of changes in foreign exchange rates and commodity prices |
| |
| • | swaps – agreements between two parties to exchange streams of payments over time according to specified terms. We use interest rate, cross-currency and commodity swaps to manage the impact of changes in interest rates, foreign exchange rates and commodity prices |
|
| | |
| | | |
| | TransCanada Management's discussion and analysis 2015 97
|
| |
| • | options – agreements that give the purchaser the right (but not the obligation) to buy or sell a specific amount of a financial instrument or commodity at a fixed price, either at a fixed date or at any time within a specified period. We use option agreements to manage the impact of changes in interest rates, foreign exchange rates and commodity prices. |
We assess contracts we use to manage market risk to determine whether all, or a portion of it, meets the definition of a derivative.
Commodity price risk
We are exposed to changes in commodity prices which may affect our earnings. We use several strategies to reduce this exposure, including:
| |
| • | committing a portion of expected power supply to fixed price sales contracts of varying terms while reserving a portion of our unsold power supply to mitigate operational and price risk in our asset portfolio |
| |
| • | purchasing a portion of the natural gas we need to fuel our natural gas-fired power plants in advance or entering into contracts that base the sale price of our electricity on the cost of the natural gas, effectively locking in a margin |
| |
| • | meeting our power sales commitments using power we generate ourselves or with power we buy at fixed prices, reducing our exposure to changes in commodity prices |
| |
| • | using derivative instruments to enter into offsetting or back-to-back positions to manage commodity price risk created by certain fixed and variable prices in arrangements for different pricing indices and delivery points. |
Foreign exchange and interest rate risk
Certain of our businesses generate income in U.S. dollars, but since we report in Canadian dollars, changes in the value of the U.S. dollar against the Canadian dollar can affect our net income. As our U.S. dollar-denominated operations continue to grow, this exposure increases. The majority of this risk is offset by interest expense on U.S. dollar-denominated debt of our foreign operations and by using foreign exchange derivatives.
We have floating interest rate debt which subjects us to interest rate cash flow risk. We manage this using a combination of interest rate swaps and options.
Average exchange rate – U.S. to Canadian dollars
|
| | | |
| 2015 | | 1.28 |
|
| 2014 | | 1.10 |
|
| 2013 | | 1.03 |
|
The impact of changes in the value of the U.S. dollar on our U.S. operations is significantly offset by interest on U.S. dollar-denominated long-term debt, as set out in the table below. Comparable EBIT is a non-GAAP measure. See page 10 for more information.
Significant U.S. dollar-denominated amounts
|
| | | | | | | | | |
| year ended December 31 | | | | | | |
| (millions of US$) | | 2015 |
| | 2014 |
| | 2013 |
|
| | | | | | | |
| U.S. and International Natural Gas Pipelines comparable EBIT | | 738 |
| | 630 |
| | 542 |
|
| U.S. Liquids Pipelines comparable EBIT | | 640 |
| | 570 |
| | 389 |
|
| U.S. Power comparable EBIT | | 313 |
| | 269 |
| | 216 |
|
| Interest on U.S. dollar-denominated long-term debt | | (911 | ) | | (854 | ) | | (766 | ) |
| Capitalized interest on U.S. dollar-denominated capital expenditures | | 109 |
| | 154 |
| | 219 |
|
| U.S. non-controlling interests and other | | 231 |
| | (234 | ) | | (196 | ) |
| | | 1,120 |
| | 535 |
| | 404 |
|
|
| | |
| | | |
98 TransCanada Management's discussion and analysis 2015 | | |
Derivatives designated as a net investment hedge
We hedge our net investment in foreign operations (on an after-tax basis) with U.S. dollar-denominated debt, cross-currency interest rate swaps, foreign exchange forward contracts and foreign exchange options.
The fair values and notional or principal amounts for the derivatives designated as a net investment hedge were as follows:
|
| | | | | | | | | | | | |
| | | 2015 | | 2014 |
| at December 31 | | Fair value1 |
| | Notional or principal amount |
| | Fair value1 |
| | Notional or principal amount |
|
| (millions of $) |
U.S. dollar cross-currency interest rate swaps (maturing 2016 to 2019)2 | | (730 | ) | | US 3,150 |
| | (431 | ) | | US 2,900 |
|
U.S. dollar foreign exchange forward contracts (maturing 2016 to 2017) | | 50 |
| | US 1,800 |
| | (28 | ) | | US 1,400 |
|
| | | (680 | ) | | US 4,950 |
| | (459 | ) | | US 4,300 |
|
| |
1 | Fair values equal carrying values. |
| |
2 | Consolidated net income in 2015 included net realized gains of $8 million (2014 – gains of $21 million) related to the interest component of cross-currency swap settlements. |
U.S. dollar-denominated debt designated as a net investment hedge
|
| | | | |
| at December 31 | | | | |
| (millions of $) | | 2015 | | 2014 |
| | | | | |
| Carrying value | | 23,000 (US 16,600) | | 17,000 (US 14,700) |
| Fair value | | 23,800 (US 17,200) | | 19,000 (US 16,400) |
Counterparty credit risk
We have exposure to counterparty credit risk in the following areas:
| |
| • | the fair value of derivative assets |
| |
| • | cash and notes receivable. |
If a counterparty fails to meet its financial obligations to us according to the terms and conditions of the financial instrument, we could experience a financial loss. We manage our exposure to this potential loss using recognized credit management techniques, including:
| |
| • | dealing with creditworthy counterparties – a significant amount of our credit exposure is with investment grade counterparties or, if not, is generally partially supported by financial assurances from investment grade parties |
| |
| • | setting limits on the amount we can transact with any one counterparty – we monitor and manage the concentration of risk exposure with any one counterparty, and reduce our exposure when we feel we need to and when it is allowed under the terms of our contracts |
| |
| • | using contract netting arrangements and obtaining financial assurances, such as guarantees and letters of credit or cash, when we believe it is necessary. |
There is no guarantee that these techniques will protect us from material losses.
We review our accounts receivable regularly and record allowances for doubtful accounts using the specific identification method. We had no significant credit losses in 2015 and no significant amounts past due or impaired at year end. We had a credit risk concentration of $248 million (US$179 million) at December 31, 2015 with one counterparty (2014 - $258 million (US$222 million)). This amount is secured by a guarantee from the counterparty's parent company and is expected to be fully collectible.
We have significant credit and performance exposure to financial institutions because they hold cash deposits and provide committed credit lines and letters of credit that help manage our exposure to counterparties and provide liquidity in commodity, foreign exchange and interest rate derivative markets.
|
| | |
| | | |
| | TransCanada Management's discussion and analysis 2015 99
|
For our Canadian regulated gas pipeline assets, counterparty credit risk is managed through application of tariff provisions as approved by the NEB.
Liquidity risk
Liquidity risk is the risk that we will not be able to meet our financial obligations as they come due. We manage our liquidity by continuously forecasting our cash flow for a 12 month period and making sure we have adequate cash balances, cash flow from operations, committed and demand credit facilities and access to capital markets to meet our operating, financing and capital expenditure obligations under both normal and stressed economic conditions.
See page 82 Financial condition for more information about our liquidity.
Dealing with legal proceedings
Legal proceedings, arbitrations and actions are part of doing business. While we cannot predict the final outcomes of proceedings and actions with certainty, management does not expect any current proceeding or action to have a material impact on our consolidated financial position, results of operations or liquidity. Other than the Keystone XL legal proceedings described on page 54, we are not aware of any potential legal proceeding or action that would have a material impact on our consolidated financial position, results of operations or liquidity.
CONTROLS AND PROCEDURES
We meet Canadian and U.S. regulatory requirements for disclosure controls and procedures, internal control over financial reporting and related CEO and CFO certifications.
Disclosure controls and procedures
Under the supervision and with the participation of management, including our President and CEO and our CFO, we carried out quarterly evaluations of the effectiveness of our disclosure controls and procedures, including for the period ended December 31, 2015, as required by the Canadian securities regulatory authorities and by the SEC. Based on this evaluation, our President and CEO and our CFO have concluded that the disclosure controls and procedures are effective in that they are designed to ensure that the information we are required to disclose in reports we file with or send to securities regulatory authorities is recorded, processed, summarized and reported within the time periods specified under Canadian and U.S. securities laws.
Management’s annual report on internal control over financial reporting
We are responsible for establishing and maintaining adequate internal control over financial reporting, which is a process designed by, or under the supervision of, our President and CEO and our CFO, and effected by our board of directors, management and other personnel, to provide reasonable assurance regarding the reliability of financial reporting and the preparation of financial statements for external purposes in accordance with GAAP.
Under the supervision and with the participation of management, including our President and CEO and our CFO, an evaluation of the effectiveness of the internal control over financial reporting was conducted as of December 31, 2015 based on the criteria described in “Internal Control - Integrated Framework” issued in 2013 by the Committee of Sponsoring Organizations of the Treadway Commission. Based on this assessment, management determined that, as of December 31, 2015, the internal control over financial reporting was effective.
Our internal control over financial reporting as of December 31, 2015 has been audited by KPMG LLP, an independent registered public accounting firm, as stated in their attestation report which is included in this document.
CEO and CFO Certifications
Our President and CEO and our CFO have attested to the quality of the public disclosure in our fiscal 2015 reports filed with Canadian securities regulators and the SEC, and have filed certifications with them.
Changes in internal control over financial reporting
There has been no change in our internal control over financial reporting that occurred during the year covered by this annual report that has materially affected, or is reasonably likely to materially affect, our internal control over financial reporting.
|
| | |
| | | |
100 TransCanada Management's discussion and analysis 2015 | | |
CRITICAL ACCOUNTING ESTIMATES
When we prepare financial statements that conform with GAAP, we are required to make certain estimates and assumptions that affect the timing and amount we record for our assets, liabilities, revenues and expenses because these items may be affected by future events. We base the estimates and assumptions on the most current information available, using our best judgment. We also regularly assess the assets and liabilities themselves.
The following accounting estimates require us to make the most significant assumptions when preparing our financial statements and changes in these assumptions could have a material impact on the financial statements from those estimates.
Rate-regulated accounting
Under GAAP, an asset qualifies to use RRA when it meets three criteria:
| |
| • | a regulator must establish or approve the rates for the regulated services or activities |
| |
| • | the regulated rates must be designed to recover the cost of providing the services or products |
| |
| • | it is reasonable to assume that rates set at levels to recover the cost can be charged to (and collected from) customers because of the demand for services or products and the level of direct and indirect competition. |
We believe that the regulated natural gas pipelines and certain liquids pipelines projects we account for using RRA meet these criteria. The most significant impact of using these principles is the timing of when we recognize certain expenses and revenues, which is based on the economic impact of the regulators' decisions about our revenues and tolls, and may be different from what would otherwise be expected under GAAP. Regulatory assets represent costs that are expected to be recovered in customer rates in future periods. Regulatory liabilities are amounts that are expected to be refunded through customer rates in future periods.
Regulatory assets and liabilities
|
| | | | | | |
| at December 31 | | | | |
| (millions of $) | | 2015 |
| | 2014 |
|
| | | | | |
| Regulatory assets | | | | |
| Long-term assets | | 1,184 |
| | 1,297 |
|
| Short-term assets (included in Other current assets) | | 85 |
| | 16 |
|
| Regulatory liabilities | | | | |
| Long-term liabilities | | 1,159 |
| | 263 |
|
| Short-term liabilities (included in Accounts payable and other) | | 44 |
| | 30 |
|
Impairment of long-lived assets and goodwill
We review long-lived assets (such as plant, property and equipment) and intangible assets for impairment whenever events or changes in circumstances lead us to believe we might not be able to recover an asset's carrying value. If the total of the undiscounted future cash flows we estimate for an asset is less than its carrying value, we consider its fair value to be less than its carrying value and we calculate and record an impairment loss to recognize this.
In 2015, the following impairments were recorded:
| |
| • | a $2,891 million after-tax charge on the carrying value of our investment in the Keystone XL project |
| |
| • | a loss of $43 million after tax relating to certain Energy turbine equipment. |
|
| | |
| | | |
| | TransCanada Management's discussion and analysis 2015 101
|
Keystone XL impairment
At December 31, 2015, in connection with the denial of the U.S. Presidential permit, we evaluated our $4.3 billion investment in Keystone XL and related projects, including Keystone Hardisty Terminal, for impairment. As a result of our analysis, we determined that the carrying amount of these assets was no longer recoverable, and recognized a total non-cash impairment charge of $3.7 billion ($2.9 billion after tax). The impairment charge was based on the excess of the carrying value over the estimated fair value of$621 million.
|
| | | | | | | | | |
| at December 31, 2015 | | Estimated |
| | Impairment charge |
| (millions of $) | | fair value |
| | Pre-tax |
| | After-tax |
|
| | | | | | | |
| Plant and equipment | | 463 |
| | 1,460 |
| | 1,391 |
|
| Terminals, including Keystone Hardisty Terminal | | 158 |
| | 274 |
| | 219 |
|
| Intangible assets | | — |
| | 1,150 |
| | 737 |
|
| Capitalized interest | | — |
| | 725 |
| | 488 |
|
| Future cancellation costs | | — |
| | 77 |
| | 56 |
|
| | | 621 |
| | 3,686 |
| | 2,891 |
|
The estimated fair value of $463 million on plant and equipment was based on an expected price that would be received to sell the assets in their current condition. An independent third party evaluation was utilized in the assessment of the fair value of these assets. Key assumptions used in the determination of selling price included an estimated two year disposal period and the current weak energy market conditions. Various outcomes were also considered, including alternate uses for the remaining assets. Depending on the outcomes of sales and alternate uses for the assets, the value realized may be different than what has been estimated. The $158 million fair value of the terminals was estimated using a risk-adjusted discounted cash flow approach as a measure of fair value and considered alternative independent utility of these assets. We recorded a full impairment charge on capitalized interest and other intangible assets as these costs are no longer probable to be recovered. The impairment charge also included certain cancellation fees that will be incurred in the future if the project is ultimately abandoned.
Energy Turbine Impairment
Following the evaluation of specific capital project opportunities in 2015, it was determined that the carrying value of certain Energy turbine equipment was not fully recoverable. These turbines had been previously purchased for a power development project that did not proceed. Various other projects have recently been evaluated for possible use of this equipment and we have determined there is not an appropriate operation or project in which we currently expect to economically utilize this asset. As a result, at December 31, 2015, we recognized a non-cash impairment charge of $59 million ($43 million after tax) on the excess of the carrying value over the fair value of the turbines, which was determined using a third party valuation based on a comparison to similar assets available for sale in the market.
Goodwill
We test goodwill for impairment annually or more frequently if events or changes in circumstances lead us to believe it might be impaired. We first assess qualitative factors to determine whether events or changes in circumstances indicate that goodwill might be impaired, and if we conclude that it is not more likely than not that the fair value of the reporting unit is greater than its carrying value, we use a two-step process to test for impairment:
| |
| 1. | First, we compare the fair value of the reporting unit to its book value, including its goodwill. If fair value is less than book value, we consider our goodwill to be impaired. |
| |
| 2. | Next, we measure the amount of the impairment by calculating the implied fair value of the reporting unit's goodwill. We do this by deducting the fair value of the tangible and intangible net assets of the reporting unit from the fair value we calculated in the first step. If the goodwill's carrying value exceeds its implied fair value, we record an impairment charge. |
|
| | |
| | | |
102 TransCanada Management's discussion and analysis 2015 | | |
We base these valuations on our projections of future cash flows, which involves making estimates and assumptions about:
| |
| • | commodity and capacity prices |
| |
| • | market supply and demand assumptions |
| |
| • | competition from other companies |
If our assumptions change significantly, our requirement to record an impairment charge could also change.
The estimated fair value of Great Lakes natural gas transportation business exceeded its carrying value by less than 10 per cent using a discounted cash flow analysis. Despite the recent improvement in income from Great Lakes, its long term value has been adversely impacted by the changing natural gas flows in its market region as well as a change in our view of the strategic alternatives to increase utilization of Great Lakes. As a result, we reduced forecasted cash flows from the reporting unit for the next ten years as compared to those utilized in previous impairment tests. There is a risk that continued reductions in future cash flow forecasts and adverse changes in key assumptions could result in a future impairment of a portion of the goodwill balance relating to Great Lakes.
Our share of the goodwill related to Great Lakes, net of non-controlling interests, was US$386 million at December 31, 2015 (2014 – US$243 million). The increase in our share of goodwill is a result of the impairment charge of US$199 million recorded at the TC PipeLines, LP level on its equity method goodwill related to Great Lakes. On a consolidated basis, our carrying value of our investment in Great Lakes is proportionately lower compared to the 46.45 per cent owned through TC PipeLines, LP. As a result, the estimated fair value of Great Lakes exceeded our consolidated carrying value and no impairment was recorded in 2015.
Our assumptions of ANR’s projected future cash flows would be impacted should ANR not reach a new settlement or other positive outcome through its Section 4 rate case proceeding. An adverse outcome could result in future impairment of a portion of the
goodwill balance relating to ANR. The goodwill balance related to ANR was US$1.9 billion at December 31, 2015 (2014 - US$1.9 billion).
Asset retirement obligations
When there is a legal obligation to set aside funds to cover future abandonment costs, and we can reasonably estimate them, we recognize the fair value of the ARO in our financial statements.
We cannot determine when we will retire many of our hydro-electric power plants, oil pipelines, natural gas pipelines and transportation facilities and regulated natural gas storage systems because we intend to operate them as long as there is supply and demand, and so we have not recorded obligations for them.
For those we do record, we use the following assumptions:
| |
| • | when we expect to retire the asset |
| |
| • | the scope of abandonment and reclamation activities that are required |
| |
| • | inflation and discount rates. |
The ARO is initially recorded when the obligation exists and is subsequently accreted through charges to operating expenses.
We continue to evaluate our future abandonment obligations and costs and monitor developments that could affect the amounts we record.
|
| | |
| | | |
| | TransCanada Management's discussion and analysis 2015 103
|
FINANCIAL INSTRUMENTS
All financial instruments, including both derivative and non-derivative instruments, are recorded on the balance sheet at fair value unless they were entered into and continue to be held for the purpose of receipt or delivery in accordance with our normal purchase and normal sales exemptions and are documented as such. In addition, fair value accounting is not required for other financial instruments that qualify for certain accounting exemptions.
Non-derivative financial instruments
Fair value of non-derivative financial instruments
The fair value of our notes receivable is calculated by discounting future payments of interest and principal using forward interest rates. The fair value of long-term debt and junior subordinated notes has been estimated using an income approach based on quoted market prices for the same or similar debt instruments from external data service providers.
Available for sale assets are recorded at fair value which is calculated using quoted market prices where available. Certain non-derivative financial instruments including cash and cash equivalents, accounts receivable, intangibles and other assets, notes payable, accounts payable and other, accrued interest and other long-term liabilities have carrying amounts that equal their fair value due to the nature of the item or the short time to maturity and would be classified in Level II of the fair value hierarchy.
Credit risk has been taken into consideration when calculating the fair value of non-derivative financial instruments.
Derivative instruments
We use derivative instruments to reduce volatility associated with fluctuations in commodity prices, interest rates and foreign exchange rates. We apply hedge accounting to derivative instruments that qualify and are designated for hedge accounting treatment. The effective portion of the change in the fair value of hedging derivatives for cash flow hedges and hedges of our net investment in foreign operations are recorded in OCI in the period of change. Any ineffective portion is recognized in net income in the same financial category as the underlying transaction. The change in the fair value of derivative instruments that have been designated as fair value hedges are recorded in net income in interest income and other and interest expense.
The majority of derivative instruments that are not designated or do not qualify for hedge accounting treatment have been entered into as economic hedges to manage our exposure to market risk (held for trading). Changes in the fair value of held for trading derivative instruments are recorded in net income in the period of change. This may expose us to increased variability in reported operating results since the fair value of the held for trading derivative instruments can fluctuate significantly from period to period.
The recognition of gains and losses on derivatives for Canadian natural gas regulated pipelines exposures is determined through the regulatory process. Gains and losses arising from changes in the fair value of derivatives accounted for as part of RRA, including those that qualify for hedge accounting treatment, can be recovered or refunded through the tolls charged by us. As a result, these gains and losses are deferred as regulatory assets or regulatory liabilities and are refunded to or collected from the ratepayers in subsequent years when the derivative settles.
Fair value of derivative instruments
The fair value of foreign exchange and interest rate derivatives has been calculated using the income approach which uses year-end market rates and applies a discounted cash flow valuation model. The fair value of commodity derivatives has been calculated using quoted market prices where available. In the absence of quoted market prices, third-party broker quotes or other valuation techniques have been used. Credit risk has been taken into consideration when calculating the fair value of derivative instruments.
|
| | |
| | | |
104 TransCanada Management's discussion and analysis 2015 | | |
Balance sheet presentation of derivative instruments
The balance sheet classification of the fair value of derivative instruments is as follows:
|
| | | | | | |
| at December 31 | | | | |
| (millions of $) | | 2015 |
| | 2014 |
|
| | | | | |
| Other current assets | | 442 |
| | 409 |
|
| Intangible and other assets | | 168 |
| | 93 |
|
| Accounts payable and other | | (926 | ) | | (749 | ) |
| Other long-term liabilities | | (625 | ) | | (411 | ) |
| | | (941 | ) | | (658 | ) |
Anticipated timing of settlement – derivative instruments
The anticipated timing of settlement for derivative instruments assumes constant commodity prices, interest rates and foreign exchange rates. Settlements will vary based on the actual value of these factors at the date of settlement.
|
| | | | | | | | | | | | |
| at December 31, 2015 | | Total fair value |
| | 2016 |
| | 2017 and 2018 |
| | 2019 and 2020 |
|
| (millions of $) | |
| | | | | | | | | |
| Derivative instruments held for trading | | | | | | | | |
| Assets | | 456 |
| | 330 |
| | 113 |
| | 13 |
|
| Liabilities | | (630 | ) | | (499 | ) | | (124 | ) | | (7 | ) |
| Derivative instruments in hedging relationships | | | | | | | | |
| Assets | | 154 |
| | 112 |
| | 28 |
| | 14 |
|
| Liabilities | | (921 | ) | | (427 | ) | | (435 | ) | | (59 | ) |
| | | (941 | ) | | (484 | ) | | (418 | ) | | (39 | ) |
Unrealized and realized (losses)/gains of derivative instruments
The following summary does not include hedges of our net investment in foreign operations.
|
| | | | | | |
| year ended December 31 | | | | |
| (millions of $) | | 2015 |
| | 2014 |
|
| | | | | |
Derivative instruments held for trading1 | | | | |
| Amount of unrealized losses in the year | | | | |
| Commodities | | (37 | ) | | (40 | ) |
| Foreign exchange | | (21 | ) | | (20 | ) |
| Amount of realized losses in the year | | | | |
| Commodities | | (151 | ) | | (28 | ) |
| Foreign exchange | | (112 | ) | | (28 | ) |
Derivative instruments in hedging relationships2,3 | | | | |
| Amount of realized (losses)/gains in the year | | | | |
| Commodities | | (179 | ) | | 130 |
|
| Interest rate | | 8 |
| | 4 |
|
| |
1 | Realized and unrealized gains and losses on held for trading derivative instruments used to purchase and sell commodities are included net in revenues. Realized and unrealized gains and losses on interest rate and foreign exchange held for trading derivative instruments are included net in interest expense and interest income and other, respectively. |
| |
2 | In 2015, net realized gains on fair value hedges were $11 million (2014 - $7 million) and were included in interest expense. |
| |
3 | In 2015 and 2014, there were no gains or losses included in net income relating to discontinued cash flow hedges where it was probable that the anticipated transaction would not occur. |
|
| | |
| | | |
| | TransCanada Management's discussion and analysis 2015 105
|
Derivatives in cash flow hedging relationships
The components of the consolidated statement of OCI related to derivatives in cash flow hedging relationships is as follows:
|
| | | | | | |
| year ended December 31 | | | | |
| (millions of $, pre-tax) | | 2015 |
| | 2014 |
|
| | | | | |
Change in fair value of derivative instruments recognized in OCI (effective portion)1 | | | | |
| Commodities | | (92 | ) | | (128 | ) |
| Foreign exchange | | — |
| | 10 |
|
| | | (92 | ) | | (118 | ) |
Reclassification of gains/(losses) on derivative instruments from AOCI to net income (effective portion)1 | | | | |
Commodities2 | | 128 |
| | (111 | ) |
Interest rate3 | | 16 |
| | 16 |
|
| | | 144 |
| | (95 | ) |
| Losses on derivative instruments recognized in net income (ineffective portion) | | | | |
Commodities2 | | — |
| | (13 | ) |
| | | — |
| | (13 | ) |
| |
1 | No amounts have been excluded from the assessment of hedge effectiveness. Amounts in parentheses indicate losses recorded to OCI. |
| |
2 | Reported within revenues on the consolidated statement of income. |
| |
3 | Reported within interest expense on the consolidated statement of income. |
Credit risk related contingent features of derivative instruments
Derivatives often contain financial assurance provisions that may require us to provide collateral if a credit risk-related contingent event occurs (for example, if our credit rating is downgraded to non-investment grade). We may also need to provide collateral if the fair value of our derivative financial instruments exceeds pre-defined exposure limits.
Based on contracts in place and market prices at December 31, 2015, the aggregate fair value of all derivative contracts with credit-risk-related contingent features that were in a net liability position was $32 million (2014 – $15 million), with collateral provided in the normal course of business of nil (2014 – nil). If the credit-risk-related contingent features in these agreements were triggered on December 31, 2015, we would have been required to provide additional collateral of $32 million (2014 – $15 million) to our counterparties. We have sufficient liquidity in the form of cash and undrawn committed revolving bank lines to meet these contingent obligations should they arise.
ACCOUNTING CHANGES
Changes in accounting policies for 2015
Derivatives and Hedging
In August 2015, the FASB issued new guidance on the application of the normal purchases and normal sales scope exception to certain electricity contracts within nodal energy markets. The amendments in this update apply to entities that enter into contracts for the purchase or sale of electricity on a forward basis and arrange for transmission through or delivery to a location within a nodal energy market whereby one of the contracting parties incurs charges (or credits) for the transmission of that electricity based in part on locational marginal pricing differences payable to (or receivable from) an independent system operator. This new guidance was effective upon issuance, was applied prospectively and did not have a material impact on our consolidated financial statements.
Balance Sheet Classification of Deferred Taxes
In November 2015, the FASB issued new guidance which requires that deferred tax assets and liabilities classified as non-current on the balance sheet. The new guidance is effective January 1, 2017, however, since early application is permitted, we elected to retrospectively apply this guidance on January 1, 2015. Application of this new guidance simplified our process in determining deferred tax amounts and our presentation. The application of this amendment resulted in a reclassification of deferred tax assets previously recorded in other current assets and deferred tax liabilities previously recorded in accounts payable and other to non-current deferred income tax assets and liabilities. Prior year amounts have been reclassified to conform to current year presentation.
|
| | |
| | | |
106 TransCanada Management's discussion and analysis 2015 | | |
Reporting discontinued operations
In April 2014, the FASB issued amended guidance on the reporting of discontinued operations. The criteria of what qualifies as a discontinued operation has changed and there are expanded disclosures required. This new guidance was applied prospectively from January 1, 2015 and there was no impact on our consolidated financial statements as a result of applying this new standard.
Future accounting changes
Revenue from contracts with customers
In 2014, the FASB issued new guidance on revenue from contracts with customers. This guidance supersedes the current revenue recognition requirements and most industry-specific guidance. This new guidance requires that an entity recognize revenue to depict the transfer of promised goods or services to customers in an amount that reflects the consideration to which the company expects to be entitled in exchange for those goods or services. In July 2015, the FASB deferred the effective date of this new standard to January 1, 2018, with early adoption not permitted before January 1, 2017. There are two methods in which the amendment can be applied: (1) retrospectively to each prior reporting period presented, or (2) retrospectively with the cumulative effect recognized at the date of initial application.
We are currently evaluating the impact of the adoption of this guidance and have not yet determined the effect on our consolidated financial statements.
Extraordinary and unusual income statement items
In January 2015, the FASB issued new guidance on extraordinary and unusual income statement items. This update eliminates from GAAP the concept of extraordinary items. This new guidance is effective from January 1, 2016 and will be applied prospectively. We do not expect the adoption of this new standard to have a material impact on our consolidated financial statements.
Consolidation
In February 2015, the FASB issued new guidance on consolidation analysis. This update requires that entities reevaluate whether they should consolidate certain legal entities and eliminates the presumption that a general partner should consolidate a limited partnership. This new guidance is effective from January 1, 2016 and will be applied retrospectively. We are currently evaluating the impact of the adoption of this guidance and have not yet determined the effect on our consolidated financial statements.
Imputation of interest
In April 2015, the FASB issued new guidance on simplifying the accounting for debt issuance costs. The amendments in this update require that debt issuance costs be presented in the balance sheet as a direct deduction from the carrying amount of the debt liability consistent with debt discounts or premiums. This new guidance is effective January 1, 2016 and will be applied retrospectively. The application of this amendment will result in a reclassification of debt issuance costs currently recorded in Intangible and other assets to an offset of their respective debt liabilities.
Inventory
In July 2015, the FASB issued new guidance on simplifying the measurement of inventory. The amendments in this update specify
that an entity should measure inventory within the scope of this update at the lower of cost and net realizable value. Net realizable
value is the estimated selling price in the ordinary course of business, less reasonably predictable costs of completion, disposal and
transportation. This new guidance is effective January 1, 2017 and will be applied prospectively. We do not expect the adoption of this new standard to have a material impact on our consolidated financial statements.
Business Combinations
In September 2015, the FASB issued guidance which replaces the requirement that an acquirer in a business combination account for measurement period adjustments retrospectively with a requirement that an acquirer recognize adjustments to the provisional amounts that are identified during the measurement period in the reporting period in which the adjustment amounts are determined. The amended guidance requires that the acquirer record, in the same period’s financial statements as the adjustment was determined, the effect on earnings of changes in depreciation, amortization, or other income effects, if any, as a result of the change to the provisional amounts, calculated as if the accounting had been completed at the acquisition date. The new guidance is effective January 1, 2016 and will be applied prospectively. We do not expect the adoption of this new standard to have a material impact on our consolidated financial statements.
|
| | |
| | | |
| | TransCanada Management's discussion and analysis 2015 107
|
RECONCILITATION OF NON-GAAP MEASURES
|
| | | | | | | | |
| year ended December 31 | | | | | |
| (millions of $, except per share amounts) | 2015 |
| | 2014 |
| | 2013 |
|
| | | | | | |
| EBITDA | 1,866 |
| | 5,542 |
| | 4,958 |
|
| Specific items: | | | | | |
| Keystone XL impairment charge | 3,686 |
| | — |
| | — |
|
| TC Offshore loss on sale | 125 |
| | — |
| | — |
|
| Restructuring costs | 99 |
| | — |
| | — |
|
| Turbine equipment impairment charge | 59 |
| | — |
| | — |
|
| Bruce Power merger – debt retirement charge | 36 |
| | — |
| | — |
|
| Cancarb gain on sale | — |
| | (108 | ) | | — |
|
| Niska contract termination | — |
| | 43 |
| | — |
|
| Gas Pacifico/ INNERGY gain on sale | — |
| | (9 | ) | | — |
|
| NEB 2013 Decision – 2012 | — |
| | — |
| | (55 | ) |
Risk management activities1 | 37 |
| | 53 |
| | (44 | ) |
| Comparable EBITDA | 5,908 |
| | 5,521 |
| | 4,859 |
|
| Comparable depreciation and amortization | (1,765 | ) | | (1,611 | ) | | (1,472 | ) |
| Comparable EBIT | 4,143 |
| | 3,910 |
| | 3,387 |
|
| Other income statement items | | | | | |
| Comparable interest expense | (1,370 | ) | | (1,198 | ) | | (984 | ) |
| Comparable interest income and other | 184 |
| | 112 |
| | 42 |
|
| Comparable income taxes | (903 | ) | | (859 | ) | | (662 | ) |
| Comparable net income attributable to non-controlling interests | (205 | ) | | (153 | ) | | (125 | ) |
| Preferred share dividends | (94 | ) | | (97 | ) | | (74 | ) |
| Comparable earnings | 1,755 |
| | 1,715 |
| | 1,584 |
|
| Specific items (net of tax): | | | | | |
| Keystone XL impairment charge | (2,891 | ) | | — |
| | — |
|
| TC Offshore loss on sale | (86 | ) | | — |
| | — |
|
| Restructuring costs | (74 | ) | | — |
| | — |
|
| Turbine equipment impairment charge | (43 | ) | | — |
| | — |
|
| Alberta corporate income tax rate increase | (34 | ) | | — |
| | — |
|
| Bruce Power merger – debt retirement charge | (27 | ) | | — |
| | — |
|
| Non-controlling interests (TC PipeLines, LP – Great Lakes impairment) | 199 |
| | — |
| | — |
|
| Cancarb gain on sale | — |
| | 99 |
| | — |
|
| Niska contract termination | — |
| | (32 | ) | | — |
|
| Gas Pacifico/ INNERGY gain on sale | — |
| | 8 |
| | — |
|
| NEB 2013 Decision – 2012 | — |
| | — |
| | 84 |
|
| Part VI.I income tax adjustment | — |
| | — |
| | 25 |
|
Risk management activities1 | (39 | ) | | (47 | ) | | 19 |
|
| Net (loss)/income attributable to common shares | (1,240 | ) | | 1,743 |
| | 1,712 |
|
| Comparable depreciation and amortization | (1,765 | ) | | (1,611 | ) | | (1,472 | ) |
| Specific item: | | | | | |
| NEB 2013 Decision – 2012 | — |
| | — |
| | (13 | ) |
| Depreciation and amortization | (1,765 | ) | | (1,611 | ) | | (1,485 | ) |
|
| | |
| | | |
108 TransCanada Management's discussion and analysis 2015 | | |
|
| | | | | | | | | | | |
| year ended December 31 | | | | | |
| (millions of $, except per share amounts) | 2015 |
| | 2014 |
| | 2013 |
|
| | | | | | |
| Comparable interest expense | (1,370 | ) | | (1,198 | ) | | (984 | ) |
| Specific item: | | | | | |
| NEB 2013 Decision – 2012 | — |
| | — |
| | (1 | ) |
| Interest expense | (1,370 | ) | | (1,198 | ) | | (985 | ) |
| | | | | | |
| Comparable interest income and other | 184 |
| | 112 |
| | 42 |
|
| Specific items: | | | | | |
| NEB 2013 Decision – 2012 | — |
| | — |
| | 1 |
|
Risk management activities1 | (21 | ) | | (21 | ) | | (9 | ) |
| Interest income and other | 163 |
| | 91 |
| | 34 |
|
| | | | | | |
| Comparable income tax expense | (903 | ) | | (859 | ) | | (662 | ) |
| Specific items: | | | | | |
| Keystone XL impairment charge | 795 |
| | — |
| | — |
|
| TC Offshore loss on sale | 39 |
| | — |
| | — |
|
| Restructuring costs | 25 |
| | — |
| | — |
|
| Turbine equipment impairment charge | 16 |
| | — |
| | — |
|
| Bruce Power merger – debt retirement charge | 9 |
| | — |
| | — |
|
| Alberta corporate income tax rate increase | (34 | ) | | — |
| | — |
|
| Cancarb gain on sale | — |
| | (9 | ) | | — |
|
| Niska contract termination | — |
| | 11 |
| | — |
|
| Gas Pacifico/ INNERGY gain on sale | — |
| | (1 | ) | | — |
|
| NEB 2013 Decision – 2012 | — |
| | — |
| | 42 |
|
| Part VI.I income tax adjustment | — |
| | — |
| | 25 |
|
Risk management activities1 | 19 |
| | 27 |
| | (16 | ) |
| Income tax expense | (34 | ) | | (831 | ) | | (611 | ) |
| | | | | | |
| Comparable earnings per common share |
| $2.48 |
| |
| $2.42 |
| |
| $2.24 |
|
| Specific items (net of tax): | | | | | |
| Keystone XL impairment charge | (4.08 | ) | | — |
| | — |
|
| TC Offshore loss on sale | (0.12 | ) | | — |
| | — |
|
| Restructuring costs | (0.10 | ) | | — |
| | — |
|
| Turbine equipment impairment charge | (0.06 | ) | | — |
| | — |
|
| Alberta corporate income tax rate increase | (0.05 | ) | | — |
| | — |
|
| Bruce Power merger – debt retirement charge | (0.04 | ) | | — |
| | — |
|
| Non-controlling interests (TC PipeLines, LP – Great Lakes impairment) | 0.28 |
| | — |
| | — |
|
| Cancarb gain on sale | — |
| | 0.14 |
| | — |
|
| Niska contract termination | — |
| | (0.04 | ) | | — |
|
| Gas Pacifico/ INNERGY gain on sale | — |
| | 0.01 |
| | — |
|
| NEB 2013 Decision – 2012 | — |
| | — |
| | 0.12 |
|
| Part VI.I Income tax adjustment | — |
| | — |
| | 0.04 |
|
Risk management activities1 | (0.06 | ) | | (0.07 | ) | | 0.02 |
|
| Net (loss)/income per common share |
| ($1.75 | ) | |
| $2.46 |
| |
| $2.42 |
|
|
| | |
| | | |
| | TransCanada Management's discussion and analysis 2015 109
|
|
| | | | | | | | | | | |
1 | | year ended December 31 | | | | | | |
| | | (millions of $) | | 2015 |
| | 2014 |
| | 2013 |
|
| | | | | | | | | |
| | | Canadian Power | | (8 | ) | | (11 | ) | | (4 | ) |
| | | U.S. Power | | (30 | ) | | (55 | ) | | 50 |
|
| | | Natural Gas Storage | | 1 |
| | 13 |
| | (2 | ) |
| | | Foreign exchange | | (21 | ) | | (21 | ) | | (9 | ) |
| | | Income taxes attributable to risk management activities | | 19 |
| | 27 |
| | (16 | ) |
| | | Total (losses)/gains from risk management activities | | (39 | ) | | (47 | ) | | 19 |
|
Comparable EBITDA and comparable EBIT by business segment
|
| | | | | | | | | | | | | | |
| year ended December 31, 2015 | Natural Gas
Pipelines |
| | Liquids Pipelines |
| | Energy |
| | Corporate |
| | Total |
|
| (millions of $) |
| | | | | | | | | | |
| EBITDA | 3,352 |
| | (2,364 | ) | | 1,148 |
| | (270 | ) | | 1,866 |
|
| Keystone XL impairment charge | — |
| | 3,686 |
| | — |
| | — |
| | 3,686 |
|
| TC Offshore loss on sale | 125 |
| | — |
| | — |
| | — |
| | 125 |
|
| Restructuring costs | — |
| | — |
| | — |
| | 99 |
| | 99 |
|
| Turbine equipment impairment charge | — |
| | — |
| | 59 |
| | — |
| | 59 |
|
| Bruce Power merger – debt retirement charge | — |
| | — |
| | 36 |
| | — |
| | 36 |
|
| Risk management activities | — |
| | — |
| | 37 |
| | — |
| | 37 |
|
| Comparable EBITDA | 3,477 |
| | 1,322 |
| | 1,280 |
| | (171 | ) | | 5,908 |
|
| Comparable depreciation and amortization | (1,132 | ) | | (266 | ) | | (336 | ) | | (31 | ) | | (1,765 | ) |
| Comparable EBIT | 2,345 |
| | 1,056 |
| | 944 |
| | (202 | ) | | 4,143 |
|
| | | | | | | | | | |
| year ended December 31, 2014 | Natural Gas
Pipelines |
| | Liquids Pipelines |
| | Energy |
| | Corporate |
| | Total |
|
| (millions of $) |
| | | | | | | | | | |
| EBITDA | 3,250 |
| | 1,059 |
| | 1,360 |
| | (127 | ) | | 5,542 |
|
| Cancarb gain on sale | — |
| | — |
| | (108 | ) | | — |
| | (108 | ) |
| Niska contract termination | — |
| | — |
| | 43 |
| | — |
| | 43 |
|
| Gas Pacifico/ INNERGY gain on sale | (9 | ) | | — |
| | — |
| | — |
| | (9 | ) |
| Risk management activities | — |
| | — |
| | 53 |
| | — |
| | 53 |
|
| Comparable EBITDA | 3,241 |
| | 1,059 |
| | 1,348 |
| | (127 | ) | | 5,521 |
|
| Comparable depreciation and amortization | (1,063 | ) | | (216 | ) | | (309 | ) | | (23 | ) | | (1,611 | ) |
| Comparable EBIT | 2,178 |
| | 843 |
| | 1,039 |
| | (150 | ) | | 3,910 |
|
| | | | | | | | | | |
| year ended December 31, 2013 | Natural Gas
Pipelines |
| | Liquids Pipelines |
| | Energy |
| | Corporate |
| | Total |
|
| (millions of $) |
| | | | | | | | | | |
| EBITDA | 2,907 |
| | 752 |
| | 1,407 |
| | (108 | ) | | 4,958 |
|
| NEB 2013 Decision – 2012 | (55 | ) | | — |
| | — |
| | — |
| | (55 | ) |
| Risk management activities | — |
| | — |
| | (44 | ) | | — |
| | (44 | ) |
| Comparable EBITDA | 2,852 |
| | 752 |
| | 1,363 |
| | (108 | ) | | 4,859 |
|
| Comparable depreciation and amortization | (1,013 | ) | | (149 | ) | | (294 | ) | | (16 | ) | | (1,472 | ) |
| Comparable EBIT | 1,839 |
| | 603 |
| | 1,069 |
| | (124 | ) | | 3,387 |
|
|
| | |
| | | |
110 TransCanada Management's discussion and analysis 2015 | | |
QUARTERLY RESULTS
Selected quarterly consolidated financial data
(unaudited, millions of $, except per share amounts)
|
| | | | | | | | | | | | | | | | |
| 2015 | | Fourth |
| | Third |
| | Second |
| | First |
|
| | | | | | | | | |
| Revenues | | 2,851 |
| | 2,944 |
| | 2,631 |
| | 2,874 |
|
| Net (loss)/income attributable to common shares | | (2,458 | ) | | 402 |
| | 429 |
| | 387 |
|
| Comparable earnings | | 453 |
| | 440 |
| | 397 |
| | 465 |
|
| Comparable earnings per common share | |
| $0.64 |
| |
| $0.62 |
| |
| $0.56 |
| |
| $0.66 |
|
| Share statistics | | | | | | | | |
| Net (loss)/income per common share – basic and diluted | |
| ($3.47 | ) | |
| $0.57 |
| |
| $0.60 |
| |
| $0.55 |
|
| Dividends declared per common share | |
| $0.52 |
| |
| $0.52 |
| |
| $0.52 |
| |
| $0.52 |
|
|
| | | | | | | | | | | | | | | | |
| 2014 | | Fourth |
| | Third |
| | Second |
| | First |
|
| | | | | | | | | |
| Revenues | | 2,616 |
| | 2,451 |
| | 2,234 |
| | 2,884 |
|
| Net income attributable to common shares | | 458 |
| | 457 |
| | 416 |
| | 412 |
|
| Comparable earnings | | 511 |
| | 450 |
| | 332 |
| | 422 |
|
| Comparable earnings per common share | |
| $0.72 |
| |
| $0.63 |
| |
| $0.47 |
| |
| $0.60 |
|
| Share statistics | | | | | | | | |
| Net income per common share – basic and diluted | |
| $0.65 |
| |
| $0.64 |
| |
| $0.59 |
| |
| $0.58 |
|
| Dividends declared per common share | |
| $0.48 |
| |
| $0.48 |
| |
| $0.48 |
| |
| $0.48 |
|
Factors affecting quarterly financial information by business segment
Quarter-over-quarter revenues and net income fluctuate for reasons that vary across our business segments.
In Natural Gas Pipelines, except for seasonal fluctuations in short-term throughput volumes on U.S. pipelines, quarter-over-quarter revenues and net income generally remain relatively stable during any fiscal year. Over the long term, however, they fluctuate because of:
| |
| • | negotiated settlements with shippers |
| |
| • | acquisitions and divestitures |
| |
| • | developments outside of the normal course of operations |
| |
| • | newly constructed assets being placed in service. |
In Liquids Pipelines, annual revenues and net income are based on contracted crude oil transportation and uncommitted spot transportation. Quarter-over-quarter revenues and net income are affected by:
| |
| • | developments outside of the normal course of operations |
| |
| • | newly constructed assets being placed in service |
|
| | |
| | | |
| | TransCanada Management's discussion and analysis 2015 111
|
In Energy, quarter-over-quarter revenues and net income are affected by:
| |
| • | market prices for natural gas and power |
| |
| • | capacity prices and payments |
| |
| • | planned and unplanned plant outages |
| |
| • | acquisitions and divestitures |
| |
| • | certain fair value adjustments |
| |
| • | developments outside of the normal course of operations |
| |
| • | newly constructed assets being placed in service. |
Factors affecting financial information by quarter
We calculate comparable measures by adjusting certain GAAP and non-GAAP measures for specific items we believe are significant but not reflective of our underlying operations in the period.
Comparable earnings exclude the unrealized gains and losses from changes in the fair value of certain derivatives used to reduce our exposure to certain financial and commodity price risks. These derivatives provide effective economic hedges, but do not meet the criteria for hedge accounting. As a result, the changes in fair value are recorded in net income. As these amounts do not accurately reflect the gains and losses that will be realized at settlement, we do not consider them part of our underlying operations.
In fourth quarter 2015, comparable earnings excluded:
| |
| • | a $2,891 million after-tax impairment charge on the carrying value of our investment in Keystone XL and related projects |
| |
| • | an $86 million after-tax loss provision related to the sale of TC Offshore expected to close in early 2016 |
| |
| • | a net charge of $60 million after tax for our business restructuring and transformation initiative comprised of $28 million mainly related to 2015 severance costs and a provision of $32 million for 2016 planned severance costs and expected future losses under lease commitments. These charges form part of a restructuring initiative, which commenced in 2015 to maximize the effectiveness and efficiency of our existing operations and reduce overall costs |
| |
| • | a $43 million after-tax charge relating to an impairment in value of turbine equipment held for future use in our Energy business |
| |
| • | a charge of $27 million after tax related to Bruce Power's retirement of debt in conjunction with the merger of the Bruce A and Bruce B partnerships |
| |
| • | a $199 million positive income adjustment related to the impact on our net income from non-controlling interests of TC PipeLines, LP's impairment of their equity investment in Great Lakes. |
In third quarter 2015, comparable earnings excluded a charge of $6 million after-tax for severance costs as part of a restructuring initiative to maximize the effectiveness and efficiency of our existing operations.
In second quarter 2015, comparable earnings excluded a $34 million adjustment to income tax expense due to the enactment of an increase in the Alberta corporate income tax rate in June 2015 and a charge of $8 million after-tax for severance costs primarily as a result of the restructuring of our major projects group in response to delayed timelines on certain of our major projects along with a continued focus on enhancing the efficiency and effectiveness of our operations.
In fourth quarter 2014, comparable earnings excluded an $8 million after-tax gain on the sale of Gas Pacifico/INNERGY.
In second quarter 2014, comparable earnings excluded a $99 million after-tax gain on the sale of Cancarb Limited and a $32 million after-tax loss related to the termination of the Niska Gas Storage contract.
|
| | |
| | | |
112 TransCanada Management's discussion and analysis 2015 | | |
FOURTH QUARTER 2015 HIGHLIGHTS
Consolidated results |
| | | | | | | |
| three months ended December 31 | | 2015 |
| | 2014 |
|
| (millions of $, except per share amounts) | |
| | | | | |
| Natural Gas Pipelines | | 572 |
| | 621 |
|
| Liquids Pipelines | | (3,413 | ) | | 230 |
|
| Energy | | 82 |
| | 219 |
|
| Corporate | | (161 | ) | | (43 | ) |
| Total segmented (losses)/earnings | | (2,920 | ) | | 1,027 |
|
| Interest expense | | (380 | ) | | (323 | ) |
| Interest income and other | | 80 |
| | 28 |
|
| (Loss)/Income before income taxes | | (3,220 | ) | | 732 |
|
| Income tax recovery/(expense) | | 646 |
| | (206 | ) |
| Net (loss)/income | | (2,574 | ) | | 526 |
|
| Net income/(loss) attributable to non-controlling interests | | 139 |
| | (43 | ) |
| Net (loss)/income attributable to controlling interests | | (2,435 | ) | | 483 |
|
| Preferred share dividends | | (23 | ) | | (25 | ) |
| Net (loss)/income attributable to common shares | | (2,458 | ) | | 458 |
|
| | | | | |
| Net (loss)/income per common share – basic and diluted | |
| ($3.47 | ) | | $0.65 |
Net income attributable to common shares decreased by $2,916 million to a net loss of $2,458 million for the three months ended December 31, 2015 compared to the same period in 2014. The 2015 results included:
| |
| • | a $2,891 million after-tax impairment charge on the carrying value of our investment in Keystone XL and related projects |
| |
| • | an $86 million after-tax loss provision related to the sale of TC Offshore expected to close in early 2016 |
| |
| • | a net charge of $60 million after tax for our business restructuring and transformation initiative comprised of $28 million mainly related to 2015 severance costs and a provision of $32 million for 2016 planned severance costs and expected future losses under lease commitments. These charges form part of a restructuring initiative, which commenced in 2015 to maximize the effectiveness and efficiency of our existing operations and reduce overall costs |
| |
| • | a $43 million after-tax charge relating to an impairment in value on turbine equipment held for future use in our Energy business |
| |
| • | a charge of $27 million after tax related to Bruce Power's retirement of debt in conjunction with the merger of the Bruce A and Bruce B partnerships |
| |
| • | a $199 million positive income adjustment related to the impact on our net income from non-controlling interests of TC PipeLines, LP's impairment of their equity investment in Great Lakes. |
The 2014 results included:
| |
| • | an $8 million after-tax gain on sale of our 30 per cent interest in Gas Pacifico/INNERGY. |
Net income in both periods included unrealized gains and losses from changes in risk management activities which we exclude, along with the above-noted items, to arrive at comparable earnings.
Comparable earnings decreased by $58 million for the three months ended December 31, 2015 compared to the same period in 2014 as discussed below in the reconciliation of net income to comparable earnings.
|
| | |
| | | |
| | TransCanada Management's discussion and analysis 2015 113
|
Reconciliation of net income to comparable earnings |
| | | | | | | |
| three months ended December 31 | | 2015 |
| | 2014 |
|
| (millions of $, except per share amounts) | |
| | | | | |
| Net (loss)/income attributable to common shares | | (2,458 | ) | | 458 |
|
| Specific items (net of tax): | | | | |
| Keystone XL impairment charge | | 2,891 |
| | — |
|
| TC Offshore loss on sale | | 86 |
| | — |
|
| Restructuring costs | | 60 |
| | — |
|
| Turbine equipment impairment charge | | 43 |
| | — |
|
| Bruce Power merger – debt retirement charge | | 27 |
| | — |
|
| Non-controlling interests (TC PipeLines, LP – Great Lakes impairment) | | (199 | ) | | — |
|
| Gas Pacifico/ INNERGY gain on sale | | — |
| | (8 | ) |
Risk management activities1 | | 3 |
| | 61 |
|
| Comparable earnings | | 453 |
| | 511 |
|
| | | | | |
| Net (loss)/income per common share | |
| ($3.47 | ) | | $0.65 |
| Specific items (net of tax): | | | | |
| Keystone XL impairment charge | | 4.08 |
| | — |
|
| TC Offshore loss on sale | | 0.12 |
| | — |
|
| Restructuring costs | | 0.08 |
| | — |
|
| Turbine equipment impairment charge | | 0.06 |
| | — |
|
| Bruce Power merger – debt retirement charge | | 0.04 |
| | — |
|
| Non-controlling interests (TC PipeLines, LP – Great Lakes impairment) | | (0.28 | ) | | — |
|
| Gas Pacifico/ INNERGY gain on sale | | — |
| | (0.01 | ) |
Risk management activities1 | | 0.01 |
| | 0.08 |
|
| Comparable earnings per common share | |
| $0.64 |
| | $0.72 |
|
| | | | | | | | |
1 | | three months ended December 31 | | | | |
| | | (millions of $) | | 2015 |
| | 2014 |
|
| | | | | | | |
| | | Canadian Power | | (1 | ) | | (11 | ) |
| | | U.S. Power | | (8 | ) | | (85 | ) |
| | | Natural Gas Storage | | (1 | ) | | 9 |
|
| | | Foreign exchange | | 4 |
| | (12 | ) |
| | | Income tax attributable to risk management activities | | 3 |
| | 38 |
|
| | | Total losses from risk management activities | | (3 | ) | | (61 | ) |
|
| | |
| | | |
114 TransCanada Management's discussion and analysis 2015 | | |
Comparable EBITDA and comparable EBIT by business segment
|
| | | | | | | | | | | | | | | |
| three months ended December 31, 2015 | | Natural Gas
Pipelines |
| | Liquids Pipelines |
| | Energy |
| | Corporate |
| | Total |
|
| (millions of $) |
| | | | | | | | | | | |
| Comparable EBITDA | | 984 |
| | 342 |
| | 275 |
| | (74 | ) | | 1,527 |
|
| Depreciation and amortization | | (287 | ) | | (69 | ) | | (88 | ) | | (8 | ) | | (452 | ) |
| Comparable EBIT | | 697 |
| | 273 |
| | 187 |
| | (82 | ) | | 1,075 |
|
|
| | | | | | | | | | | | | | | |
| three months ended December 31, 2014 | | Natural Gas
Pipelines |
| | Liquids Pipelines |
| | Energy |
| | Corporate |
| | Total |
|
| (millions of $) |
| | | | | | | | | | | |
| Comparable EBITDA | | 884 |
| | 288 |
| | 385 |
| | (36 | ) | | 1,521 |
|
| Depreciation and amortization | | (272 | ) | | (58 | ) | | (79 | ) | | (7 | ) | | (416 | ) |
| Comparable EBIT | | 612 |
| | 230 |
| | 306 |
| | (43 | ) | | 1,105 |
|
Comparable earnings
Comparable earnings decreased by $58 million for the three months ended December 31, 2015 compared to the same period in 2014. This was primarily the net effect of:
| |
| • | lower Canadian Mainline incentive earnings |
| |
| • | lower earnings from Canadian Power due to lower realized power prices and PPA volumes from Western Power, lower earnings from Bruce Power due to higher planned outage days and higher operating expenses at Bruce A, partially offset by fewer planned outage days and lower lease expense at Bruce B and lower earnings on sale of unused natural gas transportation from Eastern Power |
| |
| • | higher earnings from Liquids Pipelines due to higher contracted volumes |
| |
| • | higher interest expense due to long-term debt issuances and the ceasing of capitalized interest on Keystone XL and related projects following the November 6, 2015 denial of a U.S. Presidential permit. |
The stronger U.S. dollar in 2015 compared to 2014 positively impacted the translated results in our U.S. businesses, however, this impact was partially offset by a corresponding increase in interest expense on U.S. dollar-denominated debt as well as realized losses on foreign exchange hedges used to manage our exposure.
Highlights by business segment
Natural Gas Pipelines
Natural Gas Pipelines segmented earnings decreased by $49 million for the three months ended December 31, 2015 compared to the same period in 2014 and included a $125 million pre-tax loss provision recorded as a result of a December 2015 agreement to sell TC Offshore, which is expected to close in early 2016. Segmented earnings in 2014 included a $9 million pre-tax gain related to the sale of Gas Pacifico/INNERGY in November 2014. These amounts has been excluded from our calculation of comparable EBIT.
Depreciation and amortization increased by $15 million for the three months ended December 31, 2015 compared to the same period in 2014 mainly because of a higher investment base on the NGTL System, depreciation for the completed Tamazunchale Extension, and the effect of a stronger U.S. dollar.
Canadian Pipelines
Net income for the Canadian Mainline decreased by $63 million for the three months ended December 31, 2015 compared to the same period in 2014 primarily due to a lower average investment base in 2015 and a lower ROE of 10.1 per cent in 2015 compared to 11.5 per cent in 2014. Incentive earnings of $59 million for 2014 were recorded in the fourth quarter 2014 contributing to the higher net income in that period.
Net income for the NGTL System increased by $10 million for the three months ended December 31, 2015 compared to the same period in 2014 mainly due to a higher average investment base and OM&A incentive losses realized in 2014.
|
| | |
| | | |
| | TransCanada Management's discussion and analysis 2015 115
|
U.S. and International Pipelines
Comparable EBITDA for U.S. and International Pipelines increased by US$42 million for the three months ended December 31, 2015 compared to the same period in 2014. This increase was the net effect of higher ANR Southeast Mainline transportation revenue, partially offset by increased spending on ANR pipeline integrity work.
A stronger U.S. dollar had a positive impact on the Canadian dollar equivalent comparable earnings from our U.S. and International operations.
Liquids Pipelines
Liquids Pipelines segmented earnings decreased by $3,643 million to a segmented loss of $3,413 million for the three months ended December 31, 2015 compared to the same period in 2014. The segmented loss in 2015 included a $3,686 million pre-tax impairment charge related to Keystone XL and related projects in connection with the denial of the U.S. Presidential permit. This amount has been excluded from our calculation of comparable EBIT. The remainder of the Liquids Pipelines segmented earnings are equivalent to comparable EBIT which, along with comparable EBITDA, are discussed below.
Comparable EBITDA for the Keystone Pipeline System increased by $54 million for the three months ended December 31, 2015 compared to the same period in 2014 and was primarily due to higher contracted volumes and a stronger U.S. dollar and its positive effect on the foreign exchange impact.
Comparable depreciation and amortization increased by $11 million for the three months ended December 31, 2015 compared to the same period in 2014 primarily due to the effect of a stronger U.S. dollar.
Energy
Energy segmented earnings decreased by $137 million for the three months ended December 31, 2015 compared to the same period in 2014 and included the following specific items for the three months ended December 31, 2015 that are excluded from comparable earnings:
| |
| • | a $59 million pre-tax charge relating to an impairment in value on turbine equipment previously purchased for a new power development project that did not proceed. Various other projects have recently been evaluated for possible use of this equipment and those evaluations support the impairment of the carrying value. The evaluation included a comparison to similar assets available for sale on the market |
| |
| • | a pre-tax charge of $36 million related to Bruce Power's retirement of debt in conjunction with the merger of the Bruce A and Bruce B partnerships |
| |
| • | unrealized losses from changes in the fair value of certain derivatives used to reduce our exposure to certain commodity price risks as follows: |
|
| | | | | | |
| Risk management activities | | three months ended December 31 |
| (millions of $, pre-tax) | | 2015 |
| | 2014 |
|
| | | | | |
| Canadian Power | | (1 | ) | | (11 | ) |
| U.S. Power | | (8 | ) | | (85 | ) |
| Natural Gas Storage | | (1 | ) | | 9 |
|
| Total losses from risk management activities | | (10 | ) | | (87 | ) |
The period-over-period variances in these unrealized gains and losses reflect the impact of changes in forward natural gas and power prices and the volume of our positions for these particular derivatives over a certain period of time; however, they do not accurately reflect the gains and losses that will be realized on settlement, or the offsetting impact of other derivative and non-derivative transactions that make up our business as a whole. As a result, we do not consider them representative of our underlying operations.
|
| | |
| | | |
116 TransCanada Management's discussion and analysis 2015 | | |
Comparable EBITDA for Energy decreased by $110 million for the three months ended December 31, 2015 compared to the same period in 2014 due to the net effect of:
| |
| • | lower earnings from Western Power as a result of lower realized power prices and PPA volumes |
| |
| • | lower earnings from Bruce Power due to lower volumes resulting from higher planned outage days and higher operating expenses at Bruce A, partially offset by higher volumes resulting from fewer planned outage days and lower lease expense at Bruce B |
| |
| • | lower earnings from Eastern Power primarily due to lower earnings on the sale of unused natural gas transportation |
| |
| • | a stronger U.S. dollar and its positive effect on the foreign exchange impact. |
Comparable EBITDA for Western Power decreased by $60 million for the three months ended December 31, 2015 compared to the same period in 2014. The decrease was due to lower realized power prices and lower PPA volumes.
Comparable EBITDA for Eastern Power decreased by $26 million for the three months ended December 31, 2015 compared to the same period in 2014 due to lower earnings on the sale of unused natural gas transportation and lower contractual earnings at Bécancour.
Comparable income from equity investments from Bruce A decreased by $58 million for the three months ended December 31, 2015 compared to the same period in 2014 mainly due to lower volumes resulting from higher planned outage days and higher operating expenses.
Comparable income from equity investments from Bruce B increased by $26 million for the three months ended December 31, 2015 compared to the same period in 2014 mainly due to higher volumes resulting from lower planned outage days and lower lease expense based on the terms of the lease agreement with Ontario Power Generation.
Comparable EBITDA for U.S. Power decreased US$5 million for the three months ended December 31, 2015 compared to the same period in 2014 primarily due to the net effect of:
| |
| • | lower capacity revenue at Ravenswood due to lower realized capacity prices in New York and the impact of lower availability at the facility |
| |
| • | lower realized power prices at our New England facilities |
| |
| • | higher generation at our Ravenswood facility |
| |
| • | higher sales to wholesale, commercial and industrial customers in both the PJM and New England markets. |
Comparable EBITDA for Natural Gas Storage and Other decreased by $5 million for the three months ended December 31, 2015 compared to the same period in 2014 mainly due to decreased proprietary revenue as a result of lower realized natural gas storage price spreads.
|
| | |
| | | |
| | TransCanada Management's discussion and analysis 2015 117
|
Glossary
|
| | | | | | |
| Units of measure | | Accounting terms |
| Bbl/d | | Barrel(s) per day | | AFUDC | | Allowance for funds used during construction |
| Bcf | | Billion cubic feet | | AOCI | | Accumulated other comprehensive (loss)/income |
| Bcf/d | | Billion cubic feet per day | | ARO | | Asset retirement obligations |
| GWh | | Gigawatt hours | | ASU | | Accounting Standards Update |
| km | | Kilometres | | DRP | | Dividend reinvestment plan |
| KW-M | | Kilowatt month | | EBIT | | Earnings before interest and taxes |
| MMcf/d | | Million cubic feet per day | | EBITDA | | Earnings before interest, taxes, depreciation and amortization |
| MW | | Megawatt(s) | | GAAP | | U.S. generally accepted accounting principles |
| MWh | | Megawatt hours | | FASB | | Financial Accounting Standards Board (U.S.) |
| | | | | OCI | | Other comprehensive (loss)/income |
| | | | | RRA | | Rate-regulated accounting |
| General terms and terms related to our operations | | ROE | | Rate of return on common equity |
| bitumen | | A thick, heavy oil that must be diluted to flow (also see: diluent). One of the components of the oil sands, along with sand, water and clay | | Specific Item | | Items we believe are significant but not reflective of our underlying operations in the period |
| cogeneration facilities | | Facilities that produce both electricity and useful heat at the same time | | Government and regulatory bodies terms |
| diluent | | A thinning agent made up of organic compounds. Used to dilute bitumen so it can be transported through pipelines | | CFE | | Comisión Federal de Electricidad (Mexico) |
| Eastern Triangle | | Canadian Mainline region between North Bay, Toronto and Montréal | | CRE | | Comisión Reguladora de Energia, or Energy Regulatory Commission (Mexico) |
| FID | | Final investment decision | | DOS | | Department of State (U.S.) |
| FIT | | Feed-in tariff | | EPA | | Environmental Protection Agency (U.S.) |
| force majeure | | Unforeseeable circumstances that prevent a party to a contract from fulfilling it | | FERC | | Federal Energy Regulatory Commission (U.S.) |
| fracking | | Hydraulic fracturing. A method of extracting natural gas from shale rock | | IEA | | International Energy Agency |
| GHG | | Greenhouse gas | | IESO | | Independent Electricity System Operator |
| HSE | | Health, safety and environment | | ISO | | Independent System Operator |
| investment base | | Includes rate base as well as assets under construction | | LMCI | | Land Matters Consultation Initiative (Canada) |
| LNG | | Liquefied natural gas | | NAFTA | | North American Free Trade Agreement |
| NEB 2014 Decision | | In response to the RH-01-2014 Decision on the Canadian Mainline's 2015-2030 Tolls Application. | | NEB | | National Energy Board (Canada) |
| OM&A | | Operating, maintenance and administration | | OPA | | Ontario Power Authority (Canada) |
| PJM Interconnection area (PJM) | | A regional transmission organization that coordinates the movement of wholesale electricity in all or parts of 13 states and the District of Columbia | | OPEC | | Organization of the Petroleum Exporting Countries |
| PPA | | Power purchase arrangement | | RGGI | | Regional Greenhouse Gas Initiative (northeastern U.S.) |
| rate base | | Our annual average investment used | | SEC | | U.S. Securities and Exchange Commission |
| WCSB | | Western Canada Sedimentary Basin | | SGER | | Specified Gas Emitters Regulations |
|
| | |
| | | |
118 TransCanada Management's discussion and analysis 2015 | | |