- AHT Dashboard
- Financials
- Filings
-
Holdings
- Transcripts
- ETFs
- Insider
- Institutional
- Shorts
-
8-K Filing
Ashford Hospitality Trust (AHT) 8-KRegulation FD Disclosure
Filed: 11 May 11, 12:00am

| Analyst / Investor Day New York City May 11, 2011 |

| INTRODUCTION 2 J. Robison Hays III Senior Vice President - Corporate Finance & Strategy |

| Safe Harbor In keeping with the SEC's "Safe Harbor" guidelines, certain statements made during this presentation could be considered forward-looking and subject to certain risks and uncertainties that could cause results to differ materially from those projected. When we use the words "will likely result," "may," "anticipate," "estimate," "should," "expect," "believe," "intend," or similar expressions, we intend to identify forward-looking statements. Such forward-looking statements include, but are not limited to, our business and investment strategy, our understanding of our competition, current market trends and opportunities, projected operating results, and projected capital expenditures. These forward-looking statements are subject to known and unknown risks and uncertainties, which could cause actual results to differ materially from those anticipated including, without limitation: general volatility of the capital markets and the market price of our common stock; changes in our business or investment strategy; availability, terms and deployment of capital; availability of qualified personnel; changes in our industry and the market in which we operate, interest rates or the general economy, and the degree and nature of our competition. These and other risk factors are more fully discussed in the Company's filings with the Securities and Exchange Commission. EBITDA is defined as net income before interest, taxes, depreciation and amortization. EBITDA yield is defined as trailing twelve month EBITDA divided by the purchase price. EBITDA, FFO, AFFO, CAD and other terms are non-GAAP measures, reconciliations of which have been provided in prior earnings releases and filings with the SEC. This overview is for informational purposes only and is not an offer to sell, or a solicitation of an offer to buy or sell, any securities of Ashford Hospitality Trust, Inc. and may not be relied upon in connection with the purchase or sale of any such security. 3 |
| Ashford Overview Ashford Hospitality Trust, Inc. is a self-administered real estate investment trust listed on the NYSE (symbol: AHT) that invests in the hospitality industry across all segments and at all levels of the capital structure. Ashford differentiates itself from its peers in the hospitality REIT sector as a result of its unique perspective on hotel and capital markets, its broad investment philosophy, high levels of management ownership, and its depth of experience in asset management. Ashford believes these attributes enable it to successfully manage the impact of lodging cycles and deliver outsized shareholder value. 4 |
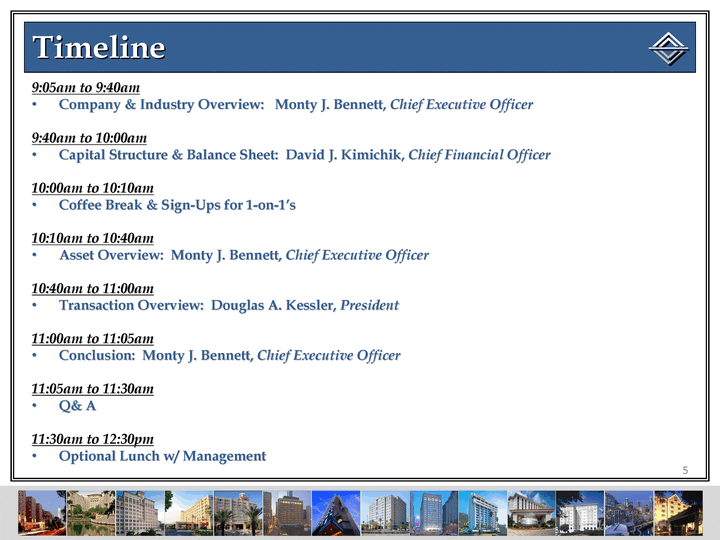
| Timeline 9:05am to 9:40am Company & Industry Overview: Monty J. Bennett, Chief Executive Officer 9:40am to 10:00am Capital Structure & Balance Sheet: David J. Kimichik, Chief Financial Officer 10:00am to 10:10am Coffee Break & Sign-Ups for 1-on-1's 10:10am to 10:40am Asset Overview: Monty J. Bennett, Chief Executive Officer 10:40am to 11:00am Transaction Overview: Douglas A. Kessler, President 11:00am to 11:05am Conclusion: Monty J. Bennett, Chief Executive Officer 11:05am to 11:30am Q& A 11:30am to 12:30pm Optional Lunch w/ Management 5 |

| COMPANY & INDUSTRY OVERVIEW 6 Monty J. Bennett Chief Executive Officer |

| Overview Based on historical cycles, now is the time to be investing in lodging - it's still early in the cycle Ashford is best positioned to take advantage of the up-cycle: Attractive capital structure Materially reduced share count Best-in-class asset management Reinstated common dividend with 3.3% yield and strong coverage Proven management team that has led to consistent outsized returns Highly-aligned management team Potential EBITDA multiple expansion 7 |

| Historical Occupancy 8 Source: Smith Travel Research (non-seasonally adjusted monthly figures) |
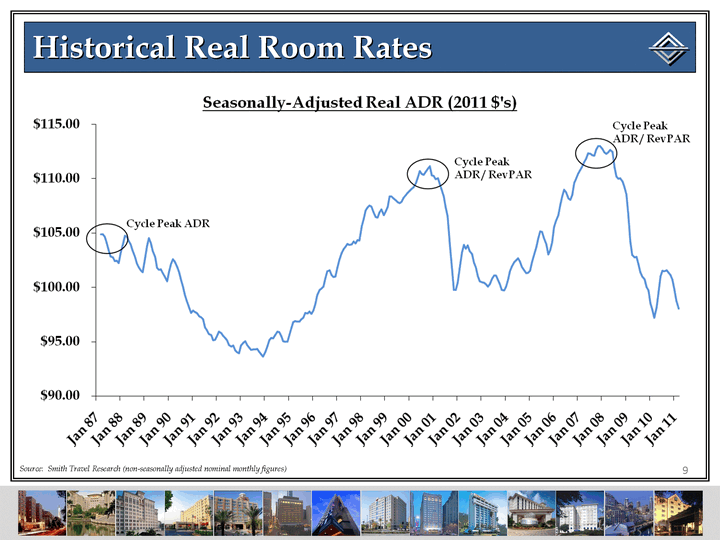
| Historical Real Room Rates 9 Source: Smith Travel Research (non-seasonally adjusted nominal monthly figures) |
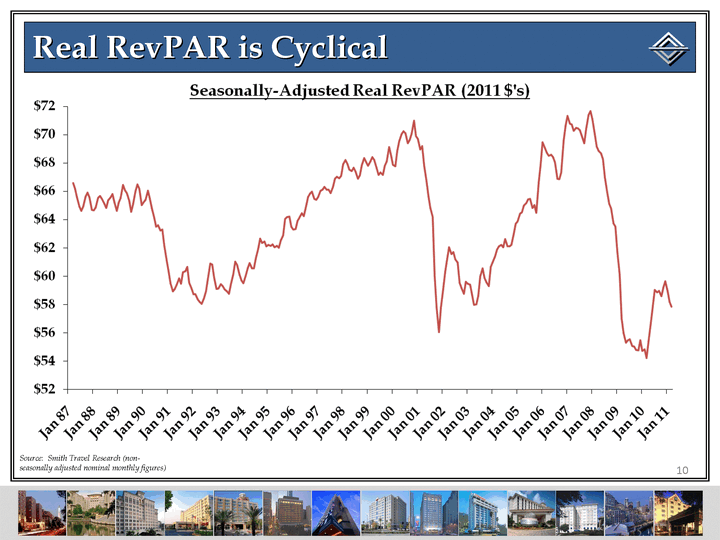
| Real RevPAR is Cyclical 10 Source: Smith Travel Research (non- seasonally adjusted nominal monthly figures) |

| Real RevPAR is Cyclical 11 * Assumes 2.4% CPI growth Source: Smith Travel Research (non-seasonally adjusted nominal monthly figures) |

| PKF's Nominal US RevPAR Forecast 12 5-Year RevPAR Growth CAGR: 7.0% Source: Smith Travel Research / PKF Research (forecast) |
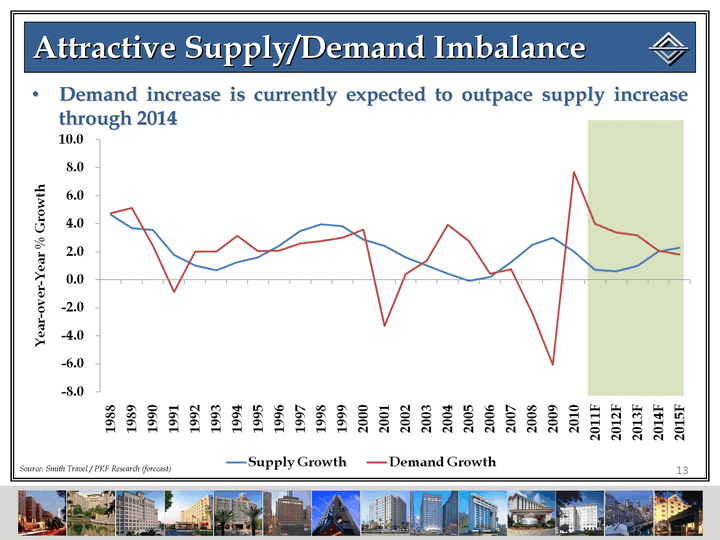
| Attractive Supply/Demand Imbalance Demand increase is currently expected to outpace supply increase through 2014 13 Source: Smith Travel / PKF Research (forecast) |

| Potential EBITDA Growth Rates 14 Given the strong potential RevPAR gains in the industry, those companies with high flow-throughs could experience significant EBITDA growth Note: Highlighted box represents PKF's 5-year projection, based on PKF's 5-year RevPAR CAGR and approximate 5-year EBITDA flow resulting from PKF's EBITDA change regression equation |
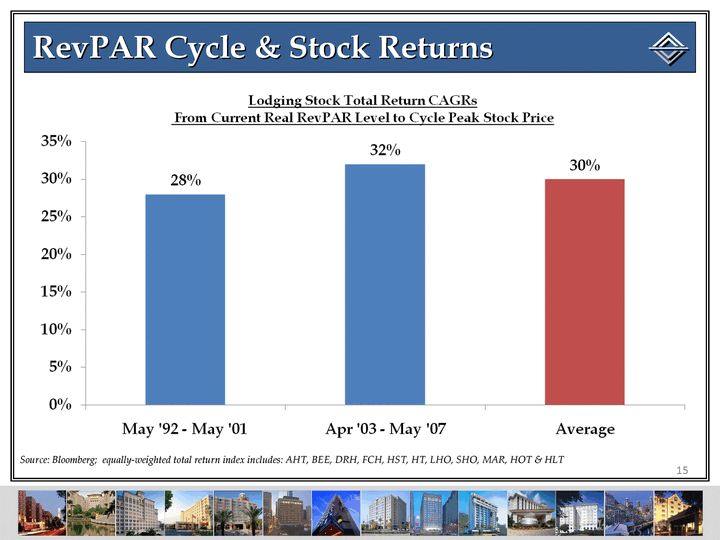
| RevPAR Cycle & Stock Returns 15 Source: Bloomberg; equally-weighted total return index includes: AHT, BEE, DRH, FCH, HST, HT, LHO, SHO, MAR, HOT & HLT |

| Industry Summary Now is the time to be investing in lodging Occupancy still has to grow by about 600 bps to get to previous peaks Real ADR is still well below its long-term average, much less its previous peaks Current forecasts are for nominal RevPAR to grow by 5% to 7% over the next 5 years+ The hotel demand / supply imbalance looks good at least through 2014 Strong, multi-year EBITDA growth is a real possibility with good flows Stock returns have been attractive when buying at this point in the RevPAR cycle 16 |
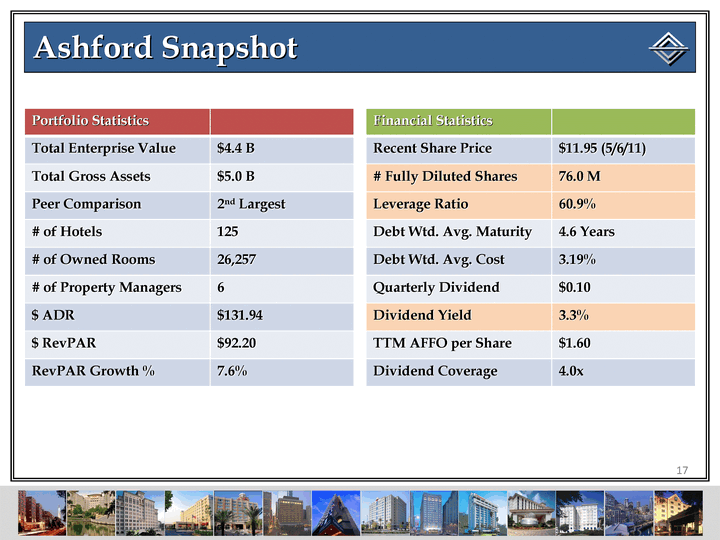
| Ashford Snapshot 17 Portfolio Statistics Total Enterprise Value $4.4 B Total Gross Assets $5.0 B Peer Comparison 2nd Largest # of Hotels 125 # of Owned Rooms 26,257 # of Property Managers 6 $ ADR $131.94 $ RevPAR $92.20 RevPAR Growth % 7.6% Financial Statistics Recent Share Price $11.95 (5/6/11) # Fully Diluted Shares 76.0 M Leverage Ratio 60.9% Debt Wtd. Avg. Maturity 4.6 Years Debt Wtd. Avg. Cost 3.19% Quarterly Dividend $0.10 Dividend Yield 3.3% TTM AFFO per Share $1.60 Dividend Coverage 4.0x |

| Significant Industry Dilution 18 Source: Bloomberg Peer Stock Price Index # of Common Shares Issued / (Repurchased) |

| Significant Shareholder Accretion 19 Source: Bloomberg AHT Stock Price # of Common Shares Issued / (Repurchased) |

| Significantly Reduced Share Count 20 Source: Company Filings & Street Research. |

| Common Stock Buybacks 21 $640M Gain If we were to reissue the 73.6 million shares repurchased, it would be a gain of nearly $640 million |
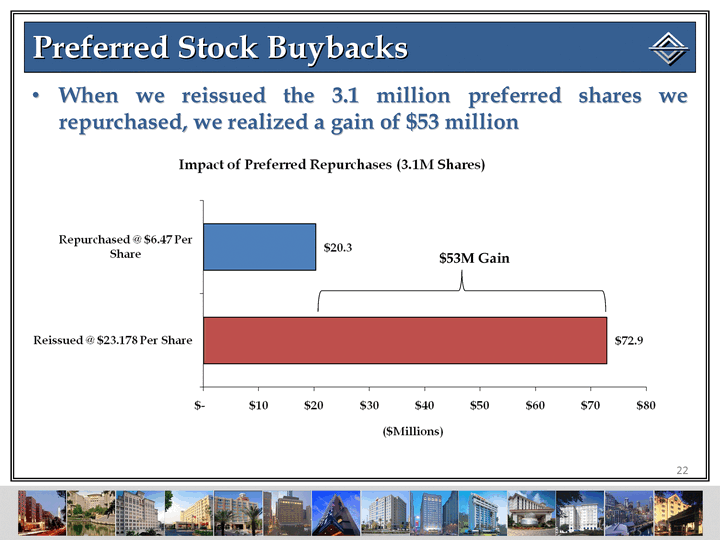
| Preferred Stock Buybacks 22 When we reissued the 3.1 million preferred shares we repurchased, we realized a gain of $53 million $53M Gain |
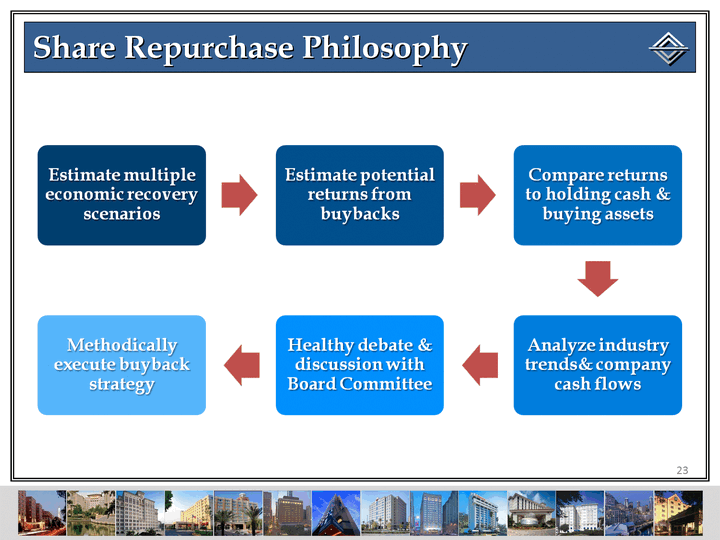
| Share Repurchase Philosophy 23 |

| Best-in-Class Asset Management 24 Revenues in line with peers despite larger select- service exposure Better EBITDA flows than peers Better EBITDA margin growth than peers EBITDA in line with peers, despite slightly lower revenue growth |

| Recently Reinstated Dividend Ashford reinstated its quarterly common dividend in the 1Q '10 at $0.10 per share, giving it a dividend yield a full 100 bps above the peer average Ashford has nearly the highest dividend yield of the legacy lodging REITs 25 Source: Company filings & Bloomberg. |
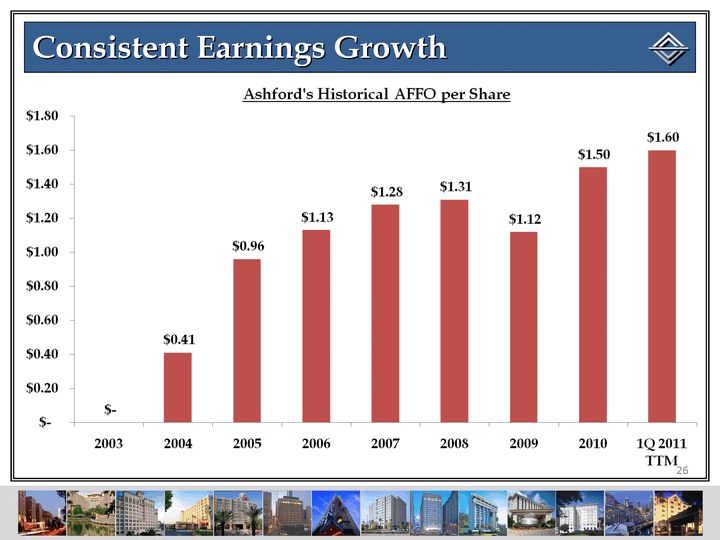
| Consistent Earnings Growth 26 |

| AFFO per Share Outperformance 27 +27% -73% |

| Total Shareholder Return - AHT Outperforms Peers 28 Source: Bloomberg, assumes dividend reinvestment |

| Total Shareholder Return - AHT Outperforms S&P 500 29 Source: Bloomberg, assumes dividend reinvestment |
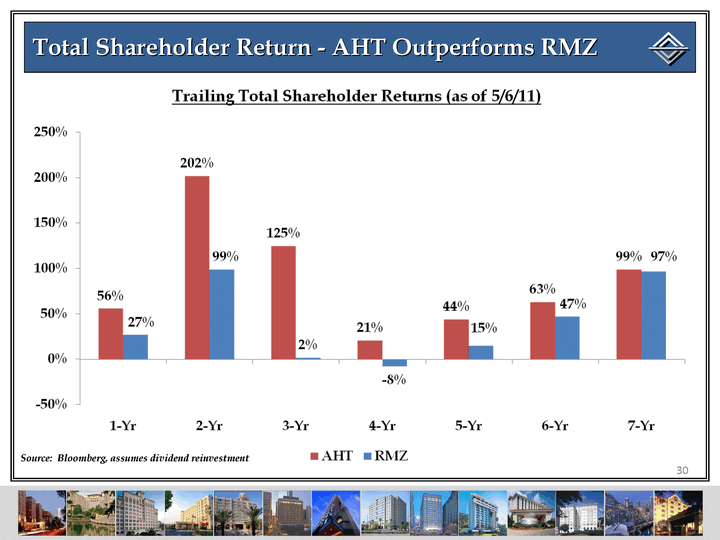
| Total Shareholder Return - AHT Outperforms RMZ 30 Source: Bloomberg, assumes dividend reinvestment |

| Total Shareholder Return - AHT Outperforms NAREIT 31 Source: Bloomberg, assumes dividend reinvestment |

| Most Highly-Aligned Management Team 32 Source: Company Filings |

| Accretive Highland Transaction 33 28 hotel portfolio (19 full-service, 9 select- service) with 8,084 rooms Total consideration of $1.3 billion ($158,000 per key) 2010 EBITDA multiple 13.4x Operational upside 2010 EBITDA flows of 18% vs. AHT's of 104% Remington took over management of 17 assets NOI 36% below peak |

| Hotel REIT EBITDA Multiples 34 Source: Company filings, Bloomberg and street research & First Call estimates Ashford currently trades at 13.8x 2012 EBITDA, slightly above the industry average (As of 5/6/11) |
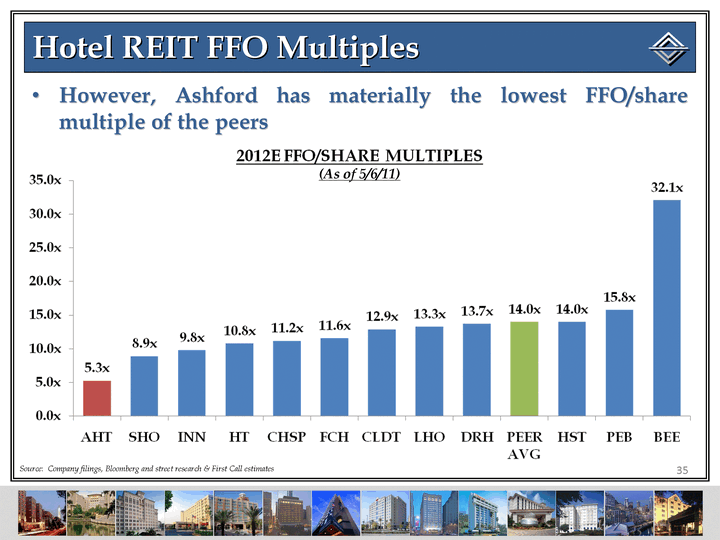
| Hotel REIT FFO Multiples 35 However, Ashford has materially the lowest FFO/share multiple of the peers Source: Company filings, Bloomberg and street research & First Call estimates (As of 5/6/11) |
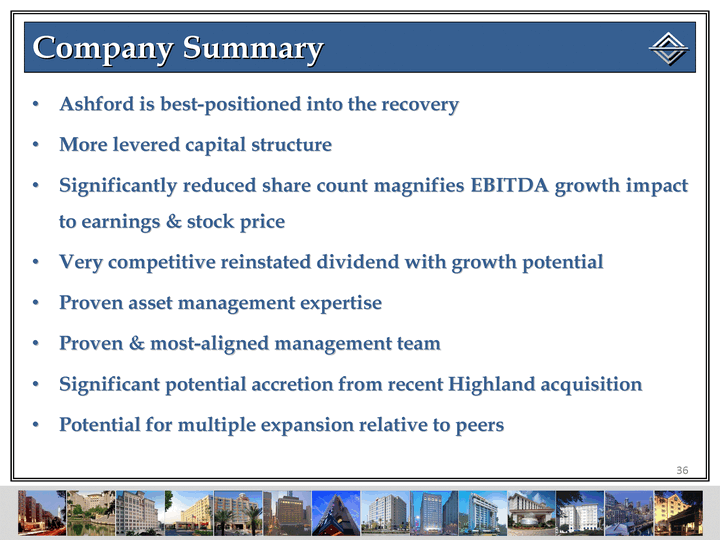
| Company Summary Ashford is best-positioned into the recovery More levered capital structure Significantly reduced share count magnifies EBITDA growth impact to earnings & stock price Very competitive reinstated dividend with growth potential Proven asset management expertise Proven & most-aligned management team Significant potential accretion from recent Highland acquisition Potential for multiple expansion relative to peers 36 |

| Analyst / Investor Day New York City May 11, 2011 |

| CAPITAL STRUCTURE & BALANCE SHEET 38 David J. Kimichik Chief Financial Officer |

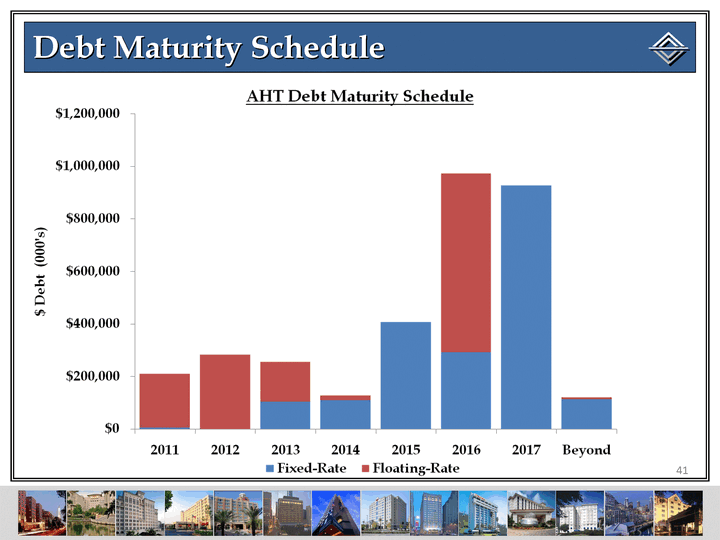
| Overview Ashford has a capital structure built for this part of the cycle: Well-laddered maturities Effectively no recourse debt Higher leverage than peers to maximize shareholder returns Continued benefit from interest rate hedges through March 2013 A management team that appreciates the expensive nature of issuing equity A recently reinstated dividend that is well-covered with potential to grow 39 |

| Current Capital Structure 40 Current ($ Millions) Current ($ Millions) Cash & Cash Equivalents $92.4 Total Debt (AHT Share) $3,186.6 Assets Hotel Gross Assets $4,595.8 Interest Rate Hedges $90.1 Mezz Book Value $3.0 Other $319.6 Total Gross Assets $5,008.5 Equity (# of shares) Common 61.0 OP Units 15.0 Total Diluted Shares 76.0 Preferred Series A,D & E (par value) $345.1 |
| Debt Maturity Schedule 41 |

| Impact of Interest Rate Hedges in 2011 42 Principal Interest Expense (est.) Interest Rate (est.) Total Debt $3.3 billion $176 million 5.3% Swap Impact ($31.5 million) Flooridor Impact (if Libor stays below 50 bps in 2011) ($40.5 million) TOTAL $3.3 billion $104 million 3.2% Note: Assumes 30-Day Libor of 25 bps |
| Interest Rate Hedging Strategy 43 In the summer of 2007 we began to explore various ways to hedge against a potential recession After months of thorough analysis, we determined that one of the most highly correlated economic data points to hotel revenues was 30-day LIBOR As a result, we made the decision in March 2008 to swap $1.8 billion of our fixed-rate debt from 5.84% to L+264 Though some thought that this was increasing our risk profile, we believed that it actually was more conservative since it was a better pairing of the cash flows of our assets and liabilities One of two things would have to happen for interest rates to dramatically increase, both of which are positives for the hotel business: 1) economic growth or 2) inflation |

| LIBOR / RevPAR Correlation (March 2008) 44 As of March 2008 |

| LIBOR / RevPAR Correlation (Current) 45 As of April 2011 |
| Expanding to Flooridors 46 Source: San Francisco Federal Reserve |

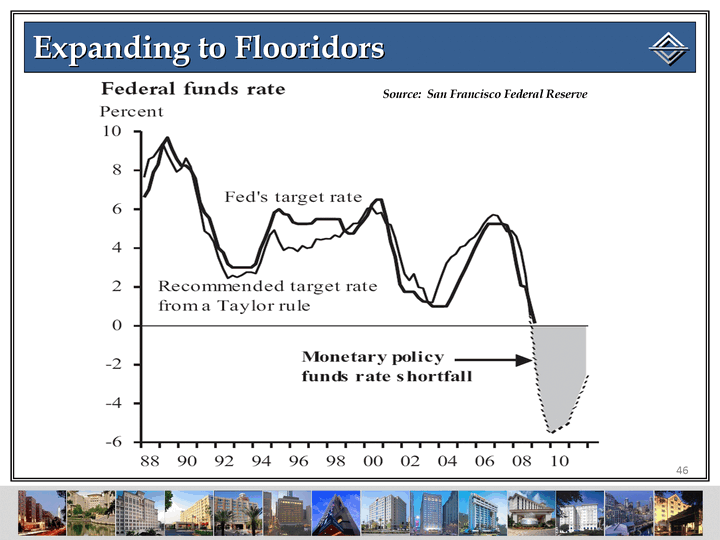
| Understanding Flooridor Strategy 47 Flooridor # Date Purchased Year Effective Notional Amount LIBOR Range Price Paid Theoretical Maximum Benefit Total Value Received* IRR 1 Dec '08 2009 $1.8B 0.75% - 1.25% $3.0M $9.0M $8.5M 582% 2 Mar '09 2010 $3.6B 0.75% - 1.25% $8.5M $18.0M $18.0M 81% 3 Jul '09 2010 $1.8B 1.25% - 1.75% $7.1M $9.0M $9.0M 29% 4 Jul '09 2011 $1.8B 0.50% - 2.75% $15.2M $40.5M $40.5M 92% 5 Oct '09 2009 $2.7B 1.00% - 2.00% $6.8M $6.9M $6.9M 3% TOTAL $40.6M $83.4M $82.9M 99% Flooridor Purchase History * Value is equal to income received + current market value |

| Interest Rate Hedge Update 48 |
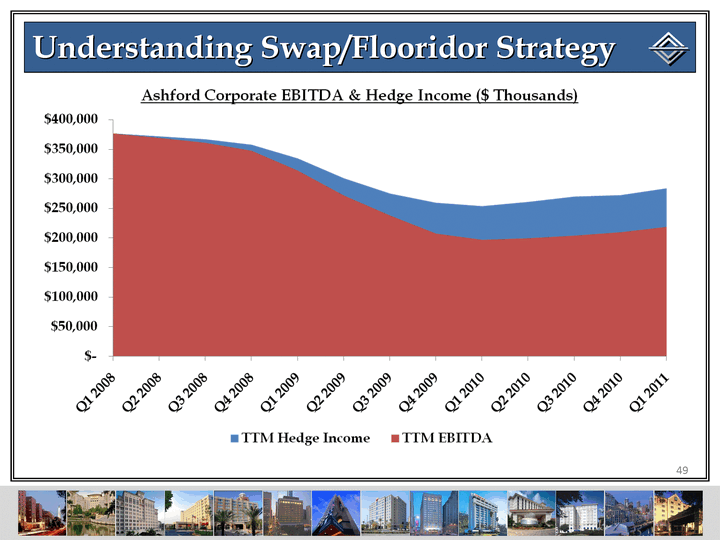
| Understanding Swap/Flooridor Strategy 49 |

| How We Manage Leverage / Risk Preference for longer duration 50 Maximize non-recourse Ashford is comfortable having leverage of 50% to 60% net debt to cost We believe the relatively higher leverage produces better long-term shareholder returns without adding material risk to the platform We focus on the following items in order to manage our leverage: Proactively ladder the maturities Proper mix of fixed vs. floating |
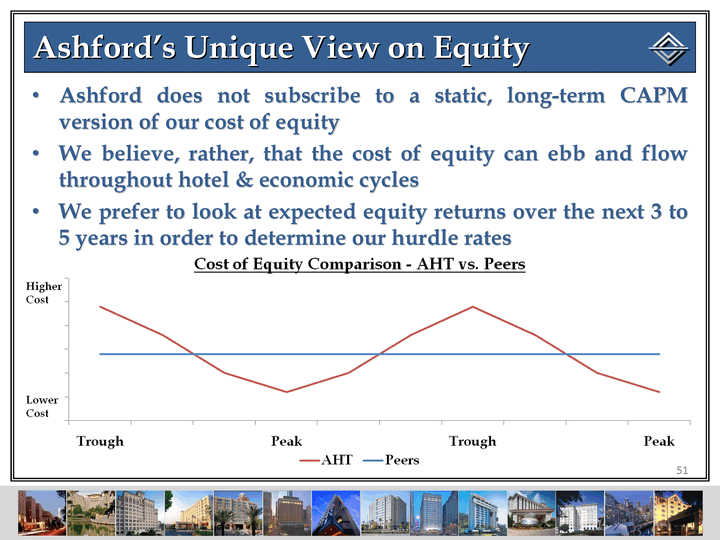
| Ashford's Unique View on Equity Ashford does not subscribe to a static, long-term CAPM version of our cost of equity We believe, rather, that the cost of equity can ebb and flow throughout hotel & economic cycles We prefer to look at expected equity returns over the next 3 to 5 years in order to determine our hurdle rates 51 |
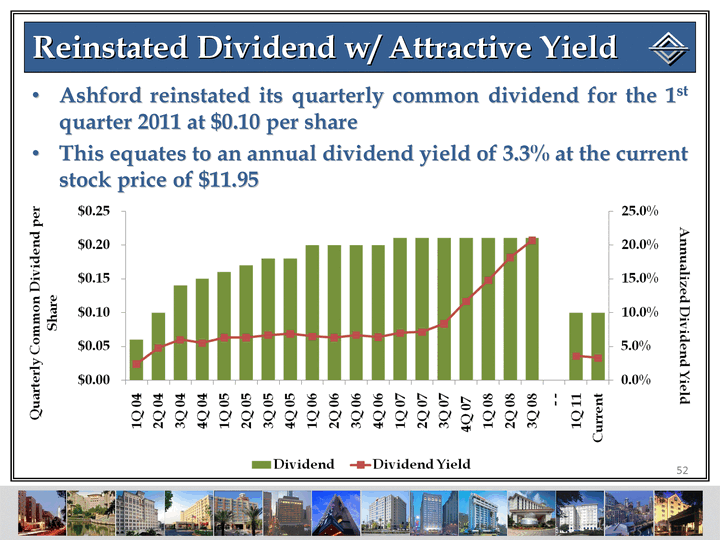
| Reinstated Dividend w/ Attractive Yield Ashford reinstated its quarterly common dividend for the 1st quarter 2011 at $0.10 per share This equates to an annual dividend yield of 3.3% at the current stock price of $11.95 52 |

| Reinstated Dividend w/ Growth Potential Given the material reduction in our common share count, Ashford is the best positioned lodging REIT to cover and potentially grow its dividend 53 Though Ashford didn't pay a dividend in 2009 & 2010, it could have covered its peak dividend at 1.3x in 2009 & 1.8x in 2010 |

| Summary 54 |

| Analyst / Investor Day New York City May 11, 2011 |
| ASSET OVERVIEW 56 Monty J. Bennett Chief Executive Officer |

| Overview Broadly diversified portfolio with a focus on: Top 25 markets Coastal locations Hilton & Marriott brand families Franchised properties Current valuation is materially lower than replacement cost Best-in-class asset management Remington property management affiliation is a strategic advantage Analytically rigorous capex management We continually reinvest significant capital into our hotels to maximize their returns 57 |

| Significant Growth Since IPO 58 |
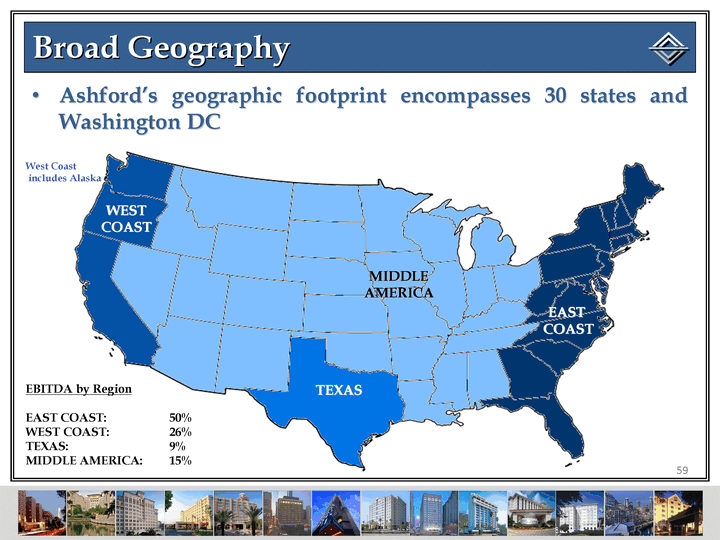
| Broad Geography Ashford's geographic footprint encompasses 30 states and Washington DC 59 WEST COAST MIDDLE AMERICA TEXAS EAST COAST West Coast includes Alaska EBITDA by Region EAST COAST: 50% WEST COAST: 26% TEXAS: 9% MIDDLE AMERICA: 15% |

| MSA The vast majority of Ashford's EBITDA comes from top 25 markets, with 90% coming from top 50 markets 60 |

| Chain Scale Approximately 60% of Ashford's EBITDA comes from luxury & upper upscale assets 61 |
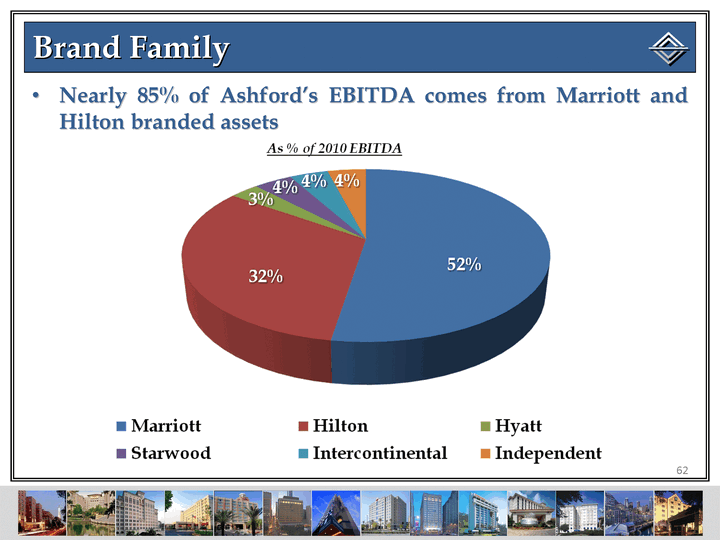
| Brand Family Nearly 85% of Ashford's EBITDA comes from Marriott and Hilton branded assets 62 |

| Transient vs. Group vs. Contract Our customers are predominantly transient, with a strong emphasis on corporate business 63 |

| Replacement Cost per Key 64 Source: Estimated based on JP Morgan Research Report Note: Total excludes recently purchased WorldQuest asset At current price of $11.95, AHT trades for approximately $167,000 per key - a 28% discount to replacement cost |

| Best-in-Class Asset Management What makes Ashford's asset management team different? 65 |
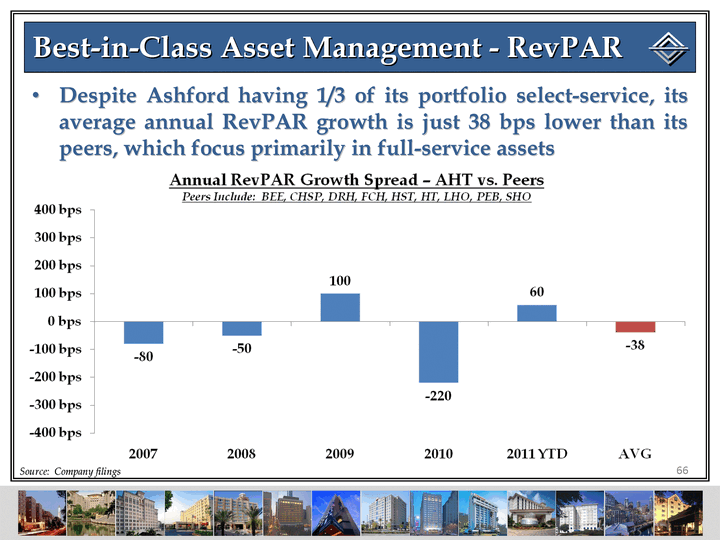
| Best-in-Class Asset Management - RevPAR Despite Ashford having 1/3 of its portfolio select-service, its average annual RevPAR growth is just 38 bps lower than its peers, which focus primarily in full-service assets 66 Source: Company filings |

| Best-in-Class Asset Management - RevPAR Yield Despite a weak year in 2010, Ashford has still been able to grow its market share over the past several years Better branded assets have a more difficult time maintaining share in the early stages of a recovery 67 Source: Company filings |

| Best-in-Class Asset Management - Flows Ashford consistently beats its peers in hotel EBITDA flow-throughs, and on average ranks #1 among peers over the past four years Ashford's affiliate manager, Remington, gives it a competitive advantage in managing costs over its peers 68 Source: Company filings |

| Best-in-Class Asset Management - Margins Ashford's EBITDA margin change consistently outperforms its peers, and on average ranks #1 among peers over the past four years Ashford is the only hotel REIT whose 2010 margins were higher than they were in 2006 69 Source: Company filings |
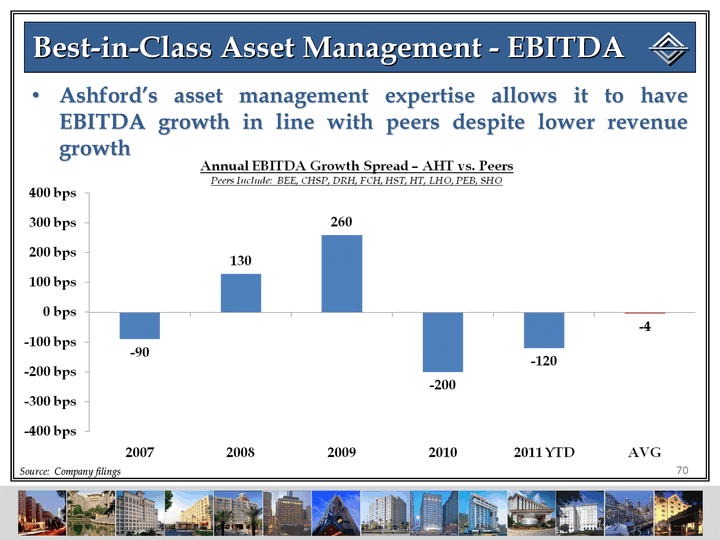
| Best-in-Class Asset Management - EBITDA Ashford's asset management expertise allows it to have EBITDA growth in line with peers despite lower revenue growth 70 Source: Company filings |
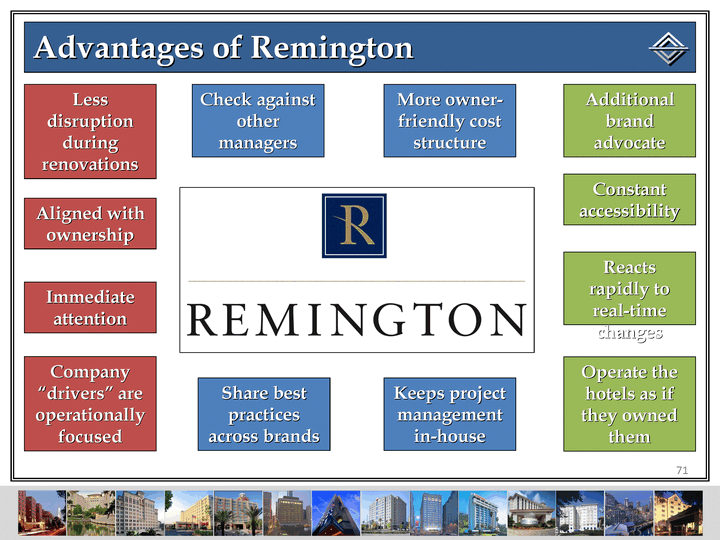
| Advantages of Remington 71 Share best practices across brands Reacts rapidly to real-time changes Aligned with ownership Immediate attention Keeps project management in-house Operate the hotels as if they owned them More owner- friendly cost structure Constant accessibility Additional brand advocate Less disruption during renovations Check against other managers Company "drivers" are operationally focused |

| Remington Company "Drivers" 72 |

| Remington Outperformance 73 |

| Capex Spend History 74 We consistently spend much more than the FF&E reserve to keep our properties in good shape, but refrain from spending any optional dollars which don't meet return hurdles * Estimate based on capex planned spend and PKF forecasted 2011 US RevPAR growth of 7.1% |

| Capital Management Strategy 75 |
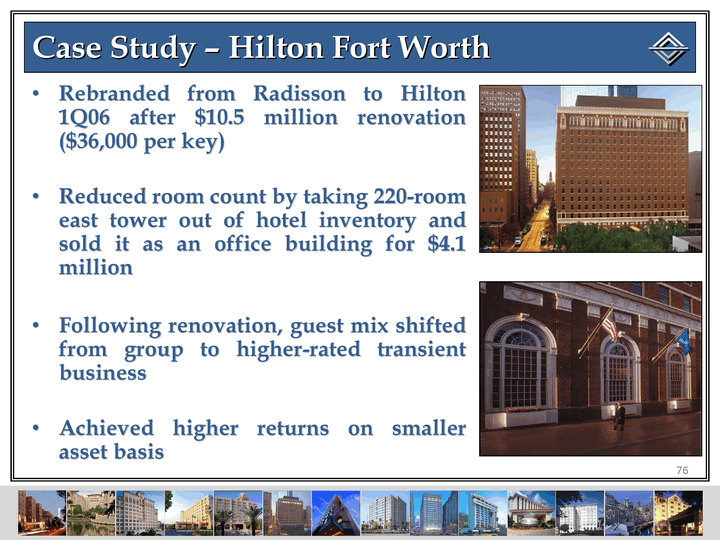
| Case Study - Hilton Fort Worth Rebranded from Radisson to Hilton 1Q06 after $10.5 million renovation ($36,000 per key) Reduced room count by taking 220-room east tower out of hotel inventory and sold it as an office building for $4.1 million Following renovation, guest mix shifted from group to higher-rated transient business Achieved higher returns on smaller asset basis 76 |

| Case Study - Hilton Fort Worth 77 Before T12 Apr '05 After T12 Apr '07 Current 2010 Total Revenue $15.0M $13.7M $14.8M NOI $2.6M $1.9M $3.1M RevPAR Index 84% 98% 127% NOI Margin 17.4% 13.8% 20.7% Before & After Renovation: |

| Highland Potential In 2010, the Highland portfolio achieved EBITDA flow of only 18%, compared to Ashford's flow of 104% Had Highland achieved Ashford's flow, an additional $8.7 million of EBITDA would have been realized Replacing Crestline management with Remington provides significant upside potential Repositioning opportunities for Melrose, Churchill, and Silversmith Opportunities to convert brand-managed assets to franchise Potential to increase RevPAR index with capex Courtyard Tremont ranked as one of the worst Courtyards in intent to return Opportunity to increase service scores at HGI Austin and other properties 78 |
| Summary Broadly diversified portfolio with a focus on: Top 25 markets Coastal locations Hilton & Marriott brand families Franchised properties Current valuation is materially lower than replacement cost Best-in-class asset management Remington property management affiliation is a strategic advantage Analytically rigorous capex management We continually reinvest significant capital into our hotels to maximize their returns Significant upside potential for Highland portfolio 79 |

| Analyst / Investor Day New York City May 11, 2011 |

| TRANSACTIONS OVERVIEW 81 Douglas A. Kessler President |

| Overview Ashford is disciplined and thorough in how it approaches its transactions Proactive in thinking about today's impact and the range of future possibilities Despite its size, Ashford is not just a property aggregator, but frequently trades out of assets, selling over a billion dollars of assets since inception Carefully monitor real-time trends in the capital and lodging markets Assess qualitative issues, but ultimate decisions are determined by quantitative analysis 82 |
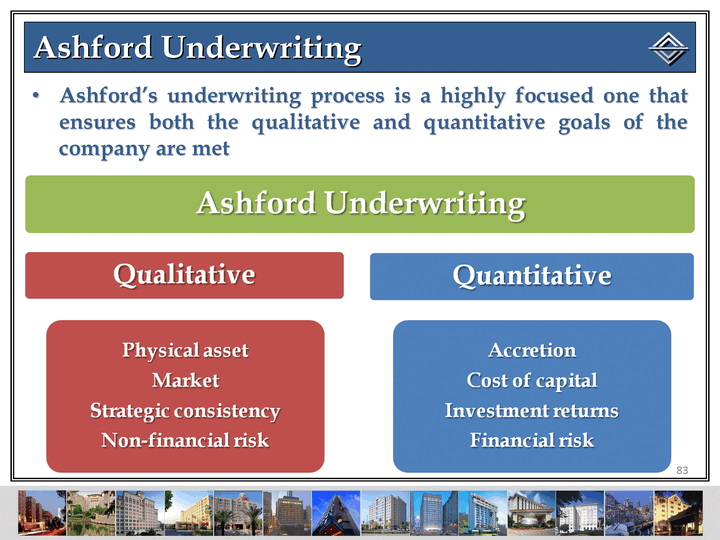
| Ashford Underwriting Ashford Underwriting 83 Ashford's underwriting process is a highly focused one that ensures both the qualitative and quantitative goals of the company are met |

| Qualitative Underwriting 84 |
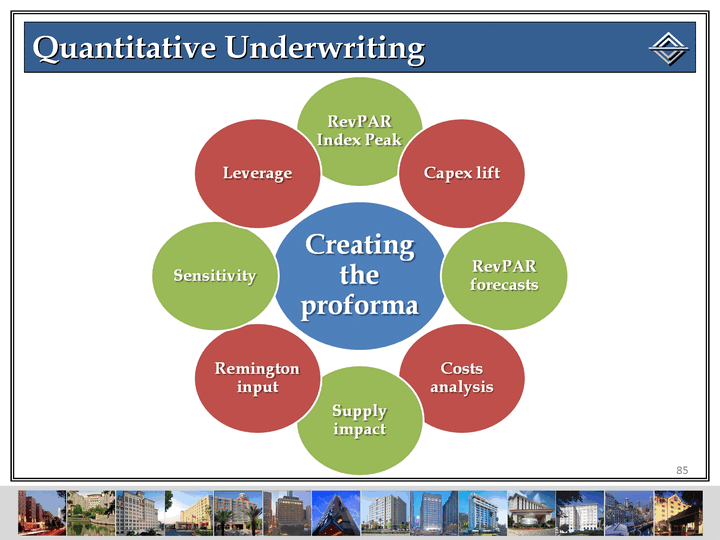
| Quantitative Underwriting 85 |

| Quantitative Underwriting 86 |
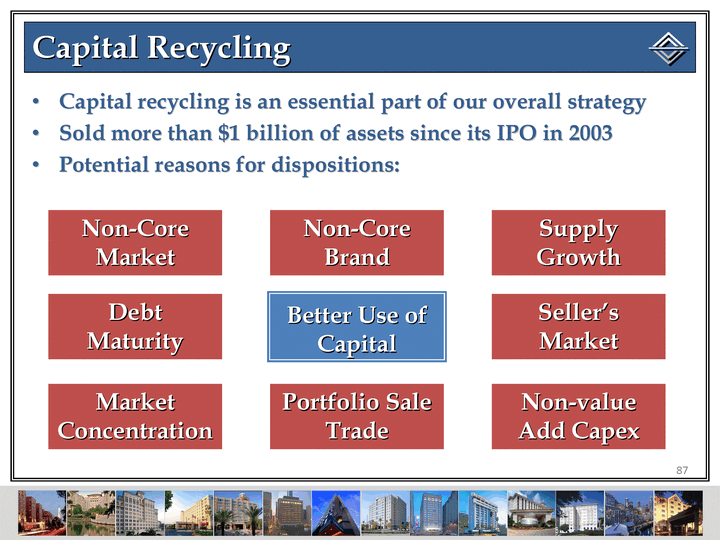
| Capital Recycling Capital recycling is an essential part of our overall strategy Sold more than $1 billion of assets since its IPO in 2003 Potential reasons for dispositions: 87 Non-Core Market Non-Core Brand Supply Growth Debt Maturity Better Use of Capital Seller's Market Market Concentration Portfolio Sale Trade Non-value Add Capex |
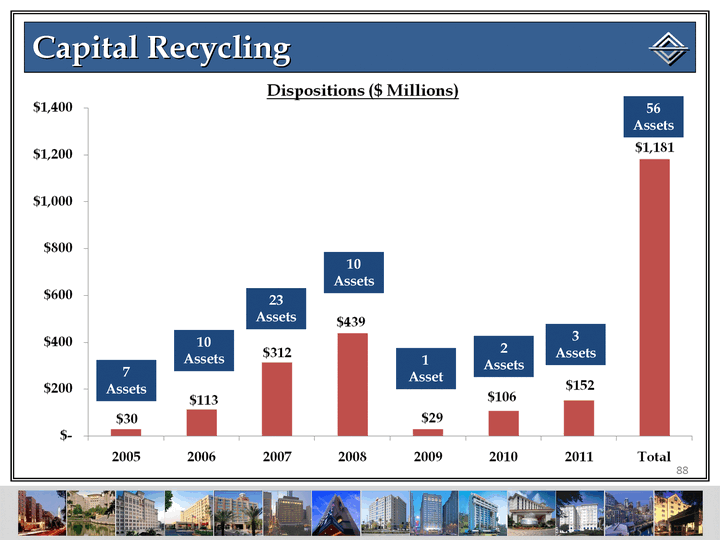
| Capital Recycling 88 7 Assets 10 Assets 23 Assets 10 Assets 2 Assets 3 Assets 56 Assets 1 Asset |

| Highland Transaction Background 89 Crowne Plaza Atlanta-Ravinia Hyatt Regency Long Island The Melrose (D.C.) Renaissance Palm Springs Sugar Land Marriott $2.2 billion privatization in 2007 Ashford $17.5 JV (25/75) with Prudential in mezz 6 tranche $1.5 billion debt senior, $172 million debt junior Borrower $440 million equity Acquired mezz 4 tranche participation at a discount with Pru Commenced consensual discussions with all involved parties Acquired portfolio in 72/28 JV with Pru - $150m equity and $1.1b debt restructure |

| Highland Transaction Summary 90 Hilton Boston Back Bay Nashville Renaissance Ritz-Carlton Atlanta Hyatt Savannah Plaza San Antonio Marriott The Churchill (D.C.) Transformational 28-hotel, $1.3 billion acquisition with 8,084 rooms Ashford had two competitive advantages in the deal: 1) existing mezz lender & 2) complex transaction skill set Primarily upper-upscale and luxury full- service assets Expands Ashford's presence in key markets (Washington D.C and NY/NJ) and into new markets (Boston and Nashville) Significant growth potential with affiliate manager Remington taking over management of 17 hotels |

| Highland Transaction Portfolio 91 Name Location Rooms Manager Renaissance Palm Springs Palm Springs, CA 410 Remington The Melrose Washington, DC 240 Remington The Churchill Washington, DC 173 Remington Hilton Tampa Westshore Tampa, FL 238 Remington Crowne Plaza Ravinia Atlanta, GA 495 Remington The Silversmith Chicago, IL 143 Remington Sheraton Annapolis Annapolis, MD 196 Remington HGI BWI Airport Baltimore, MD 158 Remington Omaha Marriott Omaha, NE 299 Remington Westin Princeton Princeton, NJ 296 Remington Hilton Parsippany New York, NY 354 Remington Hampton Inn Parsippany New York, NY 152 Remington Sugar Land Marriott Houston, TX 300 Remington Plaza San Antonio Marriott San Antonio, TX 252 Remington Portsmouth Renaissance Portsmouth, VA 249 Remington HGI Virginia Beach Virginia Beach, VA 176 Remington HGI Austin Austin, TX 254 Remington Hilton Boston Back Bay Boston, MA 390 Hilton Hyatt Regency Savannah Savannah, GA 351 Hyatt Hyatt Regency Long Island New York, NY 358 Hyatt Courtyard Denver Airport Denver, CO 202 Marriott Ritz-Carlton Atlanta Atlanta, GA 444 Marriott Courtyard Boston Tremont Boston, MA 315 Marriott Courtyard Gaithersburg Gaithersburg, MD 210 Marriott Nashville Renaissance Nashville, TN 673 Marriott DFW Airport Marriott Dallas, TX 491 Marriott Residence Inn Tampa Downtown Tampa, FL 109 McKibbon Courtyard Savannah Savannah, GA 156 McKibbon TOTAL 8,084 |

| Portfolio Upgrade 92 |

| Highland Transaction - Price Per Key Comparison 93 Source: Real Capital Analytics & company filings. |

| Replacement Cost per Key 94 Source: Estimated based on JP Morgan Research Report Highland was purchased for $158,000 per key - a 44% discount to replacement cost |

| Transaction Conclusions Disciplined and thorough in underwriting transactions Proactive in thinking about today's impact and longer range goals Capital recycling is an essential part of our strategy Carefully monitor real-time trends in the capital and lodging markets Assess qualitative issues, but ultimate decisions are determined by quantitative analysis The Highland transaction is transformational Improves overall portfolio quality Expands our presence into new markets There are significant operational efficiencies to be had Acquired at an outstanding price per key 95 |
| Analyst / Investor Day New York City May 11, 2011 |
| CONCLUSION 97 Monty J. Bennett Chief Executive Officer |

| Conclusion 98 |

| Conclusion 99 |
| Q&A SESSION 100 |

| Analyst / Investor Day New York City May 11, 2011 |