Exhibit 99.1
August 2006 |
In keeping with the SEC's "Safe Harbor" guidelines, certain statements made during this presentation could be considered forward-looking and subject to certain risks and uncertainties that could cause results to differ materially from those projected. When we use the words "will likely result," "may," "anticipate," "estimate," "should," "expect," "believe," "intend," or similar expressions, we intend to identify forward-looking statements. Such forward-looking statements include, but are not limited to, our business and investment strategy, our understanding of our competition, current market trends and opportunities, projected operating results, and projected capital expenditures. These forward-looking statements are subject to known and unknown risks and uncertainties, which could cause actual results to differ materially from those anticipated including, without limitation: general volatility of the capital markets and the market price of our common stock; changes in our business or investment strategy; availability, terms and deployment of capital; availability of qualified personnel; changes in our industry and the market in which we operate, interest rates or the general economy, and the degree and nature of our competition. These and other risk factors are more fully discussed in the Company's filings with the Securities and Exchange Commission. EBITDA is defined as net income before interest, taxes, depreciation and amortization. EBITDA yield is defined as trailing twelve month EBITDA divided by the purchase price. EBITDA, FFO, AFFO, CAD and other terms are non-GAAP measures, reconciliations of which have been provided in prior earnings releases and filings with the SEC. Safe Harbor |
Ashford Overview Portfolio Management and Internal Growth Strategies Lodging Overview and Peer Analysis Agenda |
Ashford Overview |
Portfolio Overview Hilton - Ft. Worth, TX Marriott RTP - Durham, NC JW Marriott - San Francisco, CA Embassy Suites - Phoenix, AZ Marriott - Arlington, VA Hyatt Dulles - Herndon, VA Hilton Nassau Bay - Houston, TX Hilton - Santa Fe, NM Hyatt - Anaheim, CA Residence Inn - Orlando, FL SpringHill Suites - Atlanta, GA Hilton - St. Petersburg, FL Crowne Plaza - Beverly Hills, CA Courtyard - Ft. Lauderdale, FL Embassy Suites - Dallas, TX Sea Turtle Inn - Jacksonville, FL |
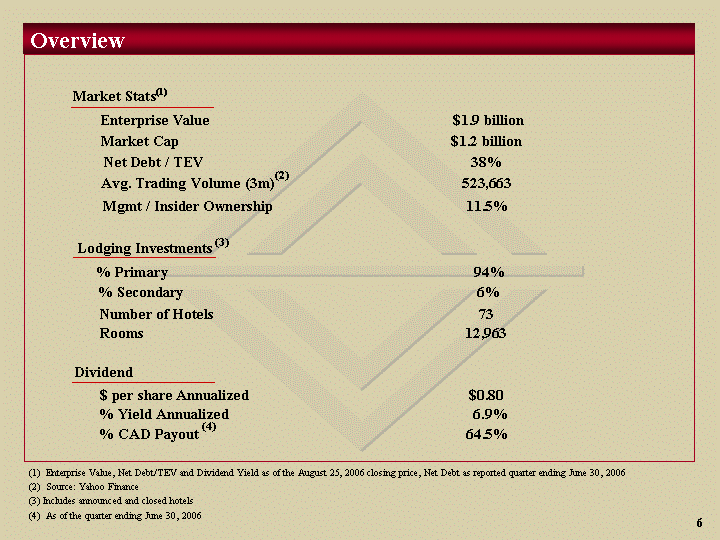
(1) Enterprise Value, Net Debt/TEV and Dividend Yield as of the August 25, 2006 closing price, Net Debt as reported quarter ending June 30, 2006 (2) Source: Yahoo Finance (3) Includes announced and closed hotels (4) As of the quarter ending June 30, 2006 Enterprise Value $1.9 billion Lodging Investments % Primary 94% % Secondary 6% Number of Hotels 73 Rooms 12,963 Dividend $ per share Annualized $0.80 % Yield Annualized 6.9% % CAD Payout 64.5% Market Cap $1.2 billion Net Debt / TEV 38% Avg. Trading Volume (3m) 523,663 (2) Mgmt / Insider Ownership 11.5% Overview (1) Market Stats (3) (4) |
RevPAR Growth Market Penetration Margin Improvement Higher Quality Assets Guest Satisfaction/Loyalty Value Creation Capital Appreciation Dividend Growth Investment Allocation Efficient Capital Structure Risk/Reward Balance Ashford's Strategies Internal Growth Strategy Portfolio Management Strategy |
Portfolio Management Strategy |
Investment Strategy Primary: Direct Hotel Ownership (94% of assets) Secondary: Mezzanine Loans, 1st Mortgages, Sale Leasebacks (6% of assets) Asset Mix Strategy Segment Brand Manager Geography Capital Strategy Minimize Cost of Capital Portfolio Management Strategy Ashford uses a portfolio management approach to maximize returns and reduce performance risk |
Investment Strategy PRIMARY STRATEGY: Direct Hotel Ownership (currently 94% of portfolio) Expansion Early Decline Late Decline Recovery SECONDARY STRATEGIES: Mezzanine Lending 1st Mortgages Sale Leasebacks (currently 6% of portfolio) Ashford's primary strategy is direct hotel investments, supplemented by secondary strategies throughout cycles to enhance returns |
Source: Smith Travel Research, PricewaterhouseCoopers Research and Ashford Hospitality Trust. Mgmt's Acquisitions / Debt Investments (1) Mgmt's Sales/Loan Payoffs % U.S. Supply Change '90 0.034 '91 0.017 '92 6700 0.009 '93 12174 311 0.006 '94 3876 821 0.013 '95 360 2589 0.016 '96 1247 0.024 '97 4917 0.035 '98 1552 495 0.04 '99 610 5626 0.038 '00 669 532 0.028 '01 284 221 0.024 '02 0.016 '03 2416.52 0.011 '04 3576.19 112.23 0.006 '05 8951.17 1211.15 0.003 '06 1723.76 1453.81 0.01 % Change U.S. Hotel Rooms Source: HVS International, Remington Hotel Corp. 1 Debt investments are calculated as total rooms x percent of capital structure Management Acquisitions and Loans % Change in U.S. Hotel Room Supply Trendline - % Change in U.S. Hotel Room Supply Management Sales and Listings Management has demonstrated market cycle judgment and discipline Ashford IPO Investment Timing |
Investment Strategy - Primary (Direct Hotel Ownership) Note: Trailing twelve month EBITDA yield at acquisition. (1) Assuming cost of debt of 5.6% and 60% market leverage to cost. (Average Yield - Cost of Debt * % Debt) / % Equity. |
(1) Assuming cost of debt of 1-month LIBOR (5.3%) + 200bps and 60% market leverage to cost. (Average Yield - Cost of Debt * % Debt) / % Equity. Investment Strategy - Secondary (Mezzanine Lending) |
Upper Upscale 42.58 Upscale 43.25 Midscale w/o F&B 11 Luxury 2.61 Hilton 28.06 Marriott 45.17 Hyatt 7.48 Radisson 10.45 Starwood 3.16 Other 5.69 Top 25 Markets 52.84 Top 50 Markets 20.41 Other 16.12 Secondary Investment Strategies 10.63 Segment Brand Portfolio EBITDA Property Management Note: Segment, Brand and Property Management charts represent breakdown by rooms for direct hotel investments as of August 23, 2006. EBITDA represents year to date ending June 30, 2006, pro forma for recent acquisitions and loans, sorted into Metropolitan Statistical Areas. Remington 0.4502 Marriott 0.3313 Hyatt 0.0748 Dunn 0.075 Other unaffiliated 0.0687 Asset Mix Strategy |
Asset Mix Strategy Hotels in top 25 markets Hotels in top 50 markets Note: Excludes mezzanine investments. Source: U.S. Census Bureau, Torto Wheaton Research and Wachovia Securities report dated February 24, 2006, except Louisville in which city April TTM RevPAR growth is used. Grouped by Metropolitan Statistical Areas and sorted by population size. Hotels in remaining markets 82% of EBITDA is located within the top 50 markets with expected RevPAR growth of 9.0% |
Source: SEC Filings, Ashford Hospitality Trust. Total Debt Fixed Debt Net Debt/TEV 4Q 03 50.2 6.4 -0.099 1Q 04 100 6.4 0.165 2Q 04 133.2 22 0.288 3Q 04 286.4 126.9 0.357 4Q 04 300.8 126.8 0.388 1Q 05 427.4 246.8 0.443 2Q 05 801.5 615 0.541 3Q 05 800.5 614.3 0.509 4Q 05 908.6 790.5 0.546 1Q 06 719.8 698.2 0.39 2Q 06 802.45 698.6 0.38 $ Millions Total Debt Net Debt / TEV Fixed Debt Capital Strategy Ashford has proactively managed its balance sheet to fix a high percentage of its debt at a low rate % Net Debt / TEV 5.3% 4.8% 5.0% 4.8% 5.1% 5.6% 5.6% 5.6% 5.6% 5.6% 12.7% 6.4% 16.5% 44.3% 42.2% 57.7% 76.7% 76.7% 87.0% 97.0% 5.7% 87.0% |
Internal Growth Strategy |
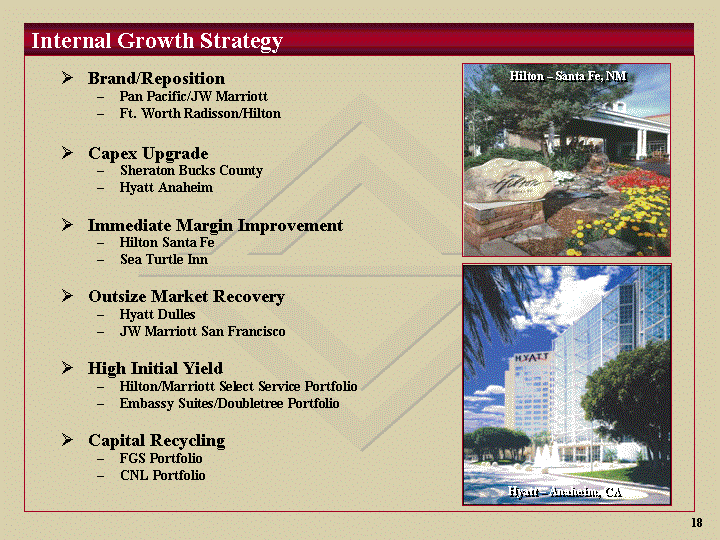
Internal Growth Strategy Brand/Reposition Pan Pacific/JW Marriott Ft. Worth Radisson/Hilton Capex Upgrade Sheraton Bucks County Hyatt Anaheim Immediate Margin Improvement Hilton Santa Fe Sea Turtle Inn Outsize Market Recovery Hyatt Dulles JW Marriott San Francisco High Initial Yield Hilton/Marriott Select Service Portfolio Embassy Suites/Doubletree Portfolio Capital Recycling FGS Portfolio CNL Portfolio Hilton - Santa Fe, NM Hyatt - Anaheim, CA |
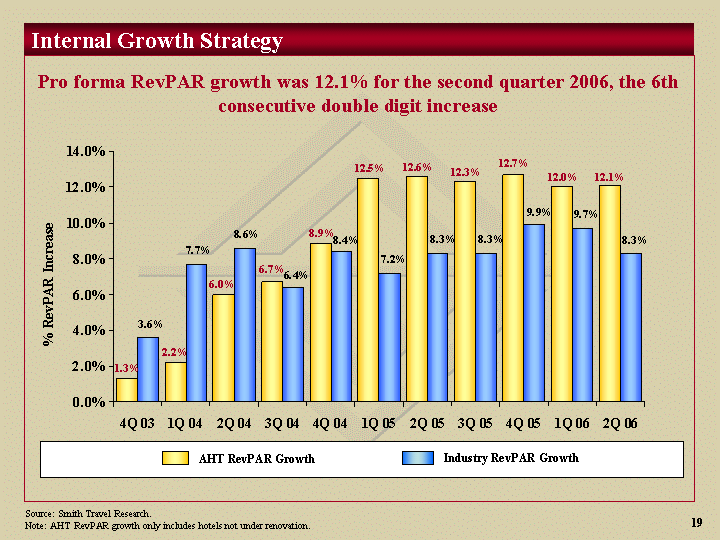
AHT RevPAR Growth Industry RevPAR Growth 4Q 03 0.013 0.036 1Q 04 0.022 0.077 2Q 04 0.06 0.086 3Q 04 0.067 0.064 4Q 04 0.089 0.084 1Q 05 0.125 0.072 2Q 05 0.126 0.083 3Q 05 0.123 0.083 4Q 05 0.127 0.099 1Q 06 0.12 0.097 2Q 06 0.121 0.083 Source: Smith Travel Research. Note: AHT RevPAR growth only includes hotels not under renovation. % RevPAR Increase AHT RevPAR Growth Industry RevPAR Growth Internal Growth Strategy Pro forma RevPAR growth was 12.1% for the second quarter 2006, the 6th consecutive double digit increase 12.0% 12.7% 12.3% 12.6% 12.5% 8.9% 6.7% 6.0% 2.2% 1.3% 12.1% |
Source: Internal Estimates. Total Capex Value Added Capex 2004 14.2 11.4 2005 38.3 30.6 2006-2007E 108 94.4 $ Capex Maintenance Capital Expenditures Value Added Capital Expenditures Internal Growth Strategy Value added capital expenditures to enhance RevPAR and margin growth $2.8 ($ in millions) $30.6 $11.4 $94.4 $23.6 $7.7 |
Internal Growth Strategy 18 Non-Core Properties Sold Since IPO Reasons we sell: Original investment strategy (portfolio acquisition) Property needs non-value add capex Shift in capital or hotel markets Supply/demand concerns Higher yielding alternatives FGS Portfolio Best Western - Dallas, TX Gull Wing Suites - S. Yarmouth, MA Holiday Inn - Coral Gables, FL Howard Johnson - Commack, NY Howard Johnson - Jericho, NY Inn on the Square - Falmouth, MA Ramada Inn - Hyannis, MA Ramada Inn - Warner Robins, GA CNL Portfolio Residence Inn - Sacramento, CA Residence Inn - Wilmington, DE Residence Inn - Orlando, FL Residence Inn - Ann Arbor, MI Residence Inn - Fishkill, NY Residence Inn - Providence, RI Residence Inn - Fort Worth, TX Residence Inn - Tyler, TX Office Buildings Bucks County, PA Fort Worth, TX (currently for sale) |
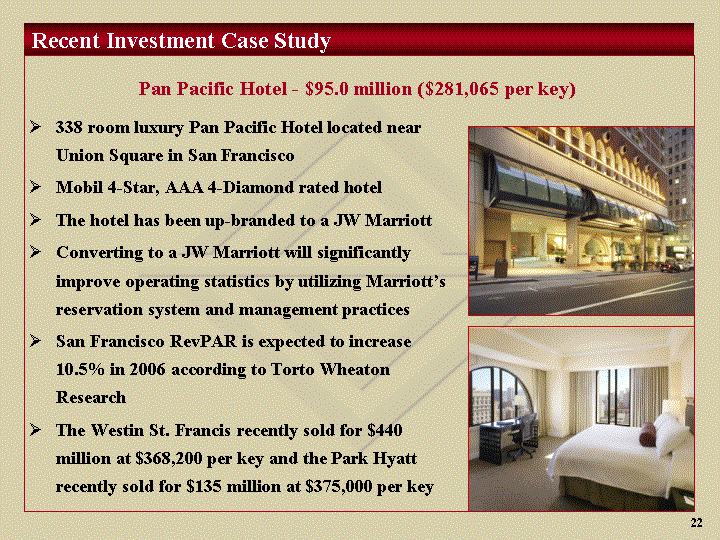
Recent Investment Case Study 338 room luxury Pan Pacific Hotel located near Union Square in San Francisco Mobil 4-Star, AAA 4-Diamond rated hotel The hotel has been up-branded to a JW Marriott Converting to a JW Marriott will significantly improve operating statistics by utilizing Marriott's reservation system and management practices San Francisco RevPAR is expected to increase 10.5% in 2006 according to Torto Wheaton Research The Westin St. Francis recently sold for $440 million at $368,200 per key and the Park Hyatt recently sold for $135 million at $375,000 per key Pan Pacific Hotel - $95.0 million ($281,065 per key) |
Recent Investment Case Study 697 room hotel with 33,000 square feet of meeting space located in Crystal City, VA Acquired at attractive yield of 9.0% on a trailing cap rate Seller accepted operating partnership units as payment Sourced through off market transaction The hotel completed a $9.5 million renovation in 2002 and Ashford expects to invest an additional $13 million in 2006 Marriott Crystal Gateway Hotel - $107.0 million ($153,515 per key) |
Lodging Overview and Peer Analysis |
Room Supply/Demand % Change RevPAR % Change % Change in RevPAR % Change in Room Supply % Change in Room Demand 1995 0.052 0.016 0.021 1996 0.062 0.024 0.021 1997 0.048 0.035 0.025 1998 0.034 0.039 0.027 1999 0.03 0.038 0.03 2000 0.061 0.028 0.035 2001 -0.07 0.024 -0.034 2002 -0.027 0.016 0.003 2003 0.005 0.011 0.014 2004 0.078 0.006 0.042 2005 0.085 0.003 0.032 2006 0.084 0.01 0.029 2007 0.056 0.021 0.024 Lodging fundamentals show strong RevPAR growth and favorable supply/demand Source: Smith Travel Research and PricewaterhouseCoopers report dated June 2006. % Change in RevPAR % Change in Room Supply % Change in Room Demand 1995 1996 1997 1998 1999 2000 2001 2002 2003 2004 2005 2006 2007 Lodging Overview |
Source: Freidman Billings Ramsey "Property Week" as of 8/21/06, except for Lodging and AHT. First Call estimates used for Lodging and AHT - stock price as of 8/25/06; Lodging composite represents median of DRH, EHP, ENN, FCH, HIH, HST, HPT, HT, KPA, LHO, SHO, BEE and WXH. Lodging Overview Despite strong fundamentals lodging trades at a discount 2007E FFO Multiple Dividend Yield 19.8x 17.8x 15.3x 15.5x 10.0x 9.0x 3.7% 3.5% 3.4% 4.1% 5.0% 6.9% 8.0x 10.0x 12.0x 14.0x 16.0x 18.0x 20.0x 22.0x Apartment Office Industrial Retail Lodging AHT 2006 Consensus 3.0% 3.5% 4.0% 4.5% 5.0% 5.5% 6.0% 6.5% 7.0% 7.5% 8.0% |
Conclusion Demonstrated ability to deploy capital in accretive investments Proven track record of increasing value and growing dividend Lodging sector is attractively priced and positioned for growth and Ashford is particularly well situated among its peers |
Addendum |
(1) Stock price as of the August 25, 2006 closing price. Net Debt as of the quarter ended June 30, 2006 (2) Based on actual TTM results as of June 30, 2006. Net Debt 0.4259 Perpetual Preferred 0.0343 Convertible Preferred 0.0535 Common Stock and Units 0.4863 Capital Structure Debt Summary ($ in millions) 2Q 2006 Long Term Debt $802.5 Cash Balance (87.7) Net Debt $714.7 Credit Facilities Availability $26.1 % Drawn 73.9% Credit Facilities Outstanding $73.9 Net Debt / TEV 38% Weighted Avg Maturity 9.3 Yrs Weighted Avg Cost 5.7% EBITDA / Interest (2) 2.5x Fixed Charge Coverage (2) 2.0x Summary Selected Financial Information (1) |
($ in millions, except per share data) 2005 2Q 2006 2Q 2005 EBITDA $79.3 $36.8 $22.6 FFO $32.7 $22.6 $12.2 Adjusted FFO $52.9 $25.0 $13.6 CAD $48.4 $22.7 $12.6 Diluted Weighted Average Shares (mm) 55.1 74.2 54.1 Dividends / Share $0.71 $0.20 $.17 Adjusted FFO Payout Ratio 74.0% 58.8% 68.0% CAD Payout Ratio 80.7% 64.5% 73.9% Summary Selected Financial Information (cont'd) |
August 2006 |