Exhibit 99.1
NAREIT Presentation November 2007 |
Safe Harbor In keeping with the SEC's "Safe Harbor" guidelines, certain statements made during this presentation could be considered forward-looking and subject to certain risks and uncertainties that could cause results to differ materially from those projected. When we use the words "will likely result," "may," "anticipate," "estimate," "should," "expect," "believe," "intend," or similar expressions, we intend to identify forward-looking statements. Such forward-looking statements include, but are not limited to, our business and investment strategy, our understanding of our competition, current market trends and opportunities, projected operating results, and projected capital expenditures. These forward-looking statements are subject to known and unknown risks and uncertainties, which could cause actual results to differ materially from those anticipated including, without limitation: general volatility of the capital markets and the market price of our common stock; changes in our business or investment strategy; availability, terms and deployment of capital; availability of qualified personnel; changes in our industry and the market in which we operate, interest rates or the general economy, and the degree and nature of our competition. These and other risk factors are more fully discussed in the Company's filings with the Securities and Exchange Commission. EBITDA is defined as net income before interest, taxes, depreciation and amortization. EBITDA yield is defined as trailing twelve month EBITDA divided by the purchase price. EBITDA, FFO, AFFO, CAD and other terms are non-GAAP measures, reconciliations of which have been provided in prior earnings releases and filings with the SEC. |
Ashford Overview |
Ashford Overview Ashford Hospitality Trust is a self-administered real estate investment trust focused on investing in the hospitality industry across all segments and at all levels of the capital structure, including direct hotel investments, first mortgages, mezzanine loans and sale-leaseback transactions. |
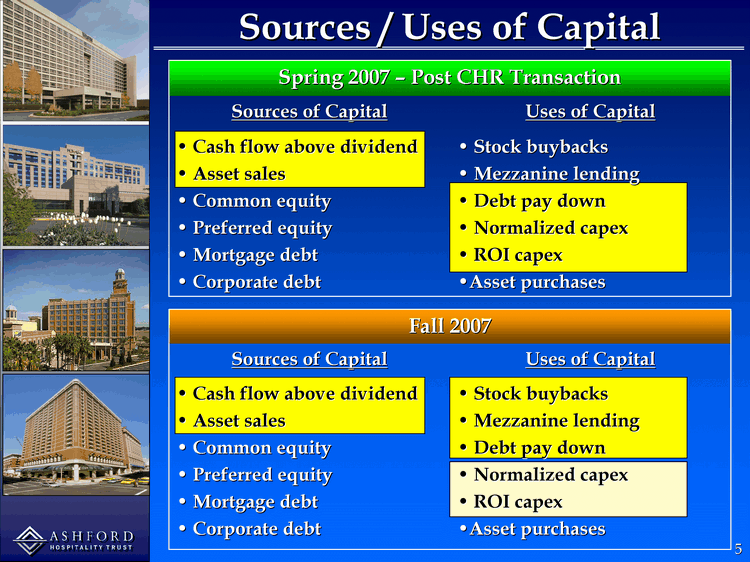
Sources / Uses of Capital Fall 2007 Fall 2007 Sources of Capital Uses of Capital Cash flow above dividend Asset sales Common equity Preferred equity Mortgage debt Corporate debt Stock buybacks Mezzanine lending Debt pay down Normalized capex ROI capex Asset purchases Spring 2007 - Post CHR Transaction Spring 2007 - Post CHR Transaction Sources of Capital Uses of Capital Cash flow above dividend Asset sales Common equity Preferred equity Mortgage debt Corporate debt Stock buybacks Mezzanine lending Debt pay down Normalized capex ROI capex Asset purchases |
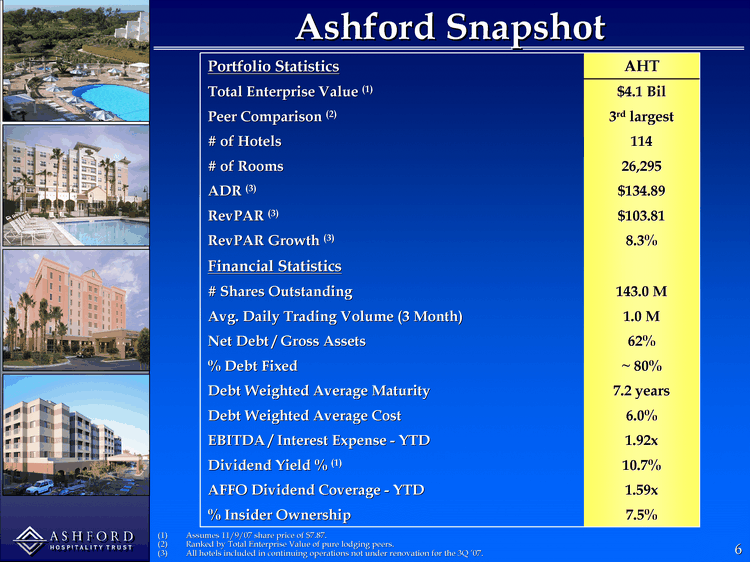
Ashford Snapshot Portfolio Statistics AHT Total Enterprise Value (1) $4.1 Bil Peer Comparison (2) 3rd largest # of Hotels 114 # of Rooms 26,295 ADR (3) $134.89 RevPAR (3) $103.81 RevPAR Growth (3) 8.3% Financial Statistics # Shares Outstanding 143.0 M Avg. Daily Trading Volume (3 Month) 1.0 M Net Debt / Gross Assets 62% % Debt Fixed ~ 80% Debt Weighted Average Maturity 7.2 years Debt Weighted Average Cost 6.0% EBITDA / Interest Expense - YTD 1.92x Dividend Yield % (1) 10.7% AFFO Dividend Coverage - YTD 1.59x % Insider Ownership 7.5% Assumes 11/9/07 share price of $7.87. Ranked by Total Enterprise Value of pure lodging peers. All hotels included in continuing operations not under renovation for the 3Q '07. |
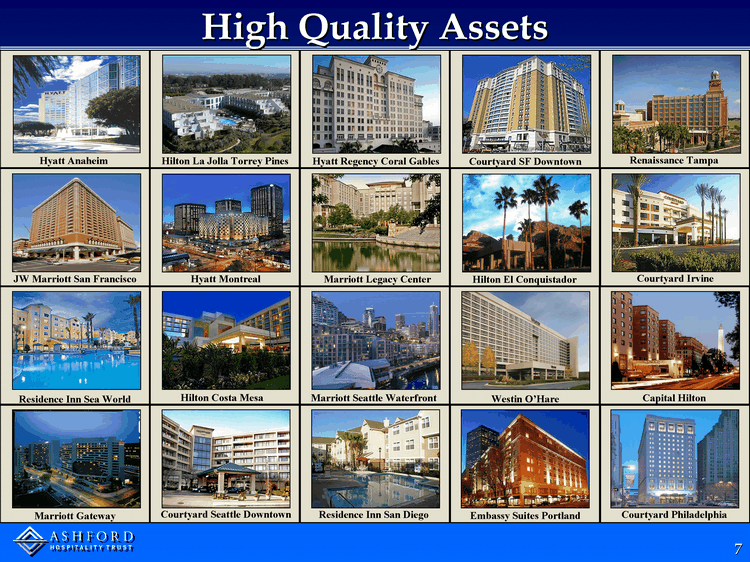
High Quality Assets Hyatt Anaheim JW Marriott San Francisco Courtyard SF Downtown Hilton El Conquistador Westin O'Hare Embassy Suites Portland Renaissance Tampa Courtyard Irvine Capital Hilton Courtyard Philadelphia Hyatt Regency Coral Gables Marriott Legacy Center Marriott Seattle Waterfront Residence Inn San Diego Hilton La Jolla Torrey Pines Hyatt Montreal Hilton Costa Mesa Courtyard Seattle Downtown Residence Inn Sea World Marriott Gateway |
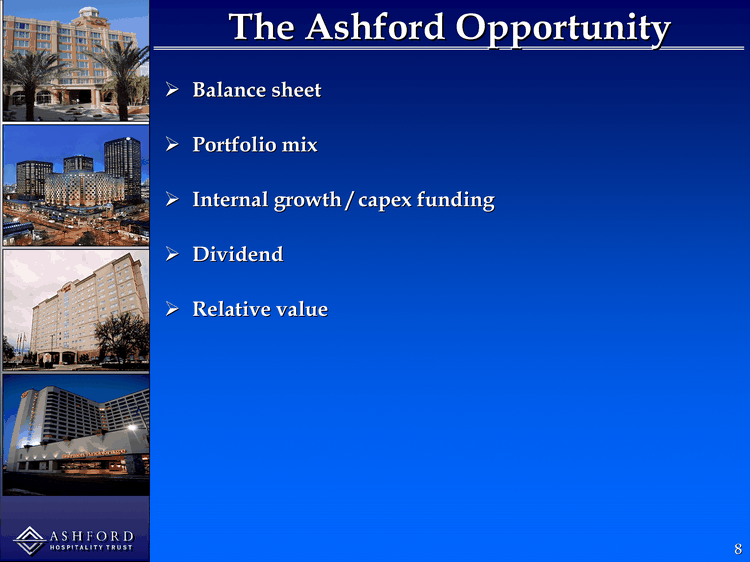
The Ashford Opportunity Balance sheet Portfolio mix Internal growth / capex funding Dividend Relative value |
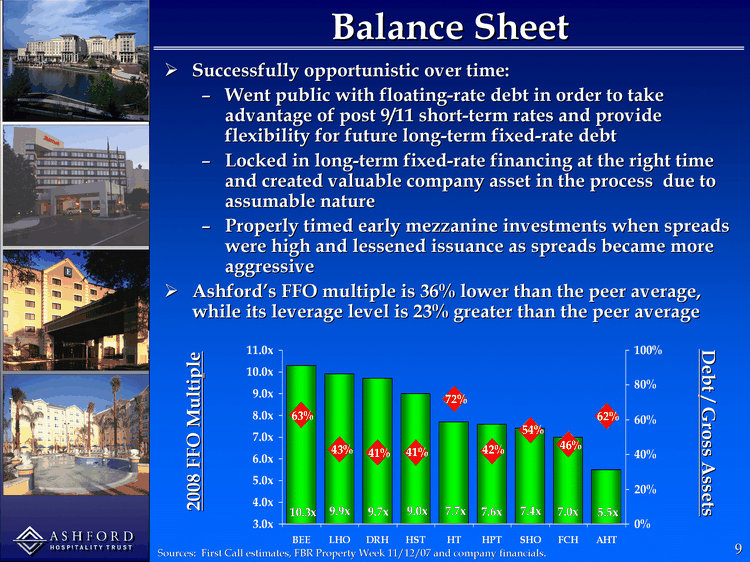
Balance Sheet Successfully opportunistic over time: Went public with floating-rate debt in order to take advantage of post 9/11 short-term rates and provide flexibility for future long-term fixed-rate debt Locked in long-term fixed-rate financing at the right time and created valuable company asset in the process due to assumable nature Properly timed early mezzanine investments when spreads were high and lessened issuance as spreads became more aggressive Ashford's FFO multiple is 36% lower than the peer average, while its leverage level is 23% greater than the peer average 2008 FFO Multiples Net Debt / Gross Assets BEE 10.3 0.63 LHO 9.9 0.43 DRH 9.7 0.41 HST 9 0.41 HT 7.7 0.72 HPT 7.6 0.42 SHO 7.4 0.54 FCH 7 0.46 AHT 5.5 0.62 2008 FFO Multiple Debt / Gross Assets Sources: First Call estimates, FBR Property Week 11/12/07 and company financials. |
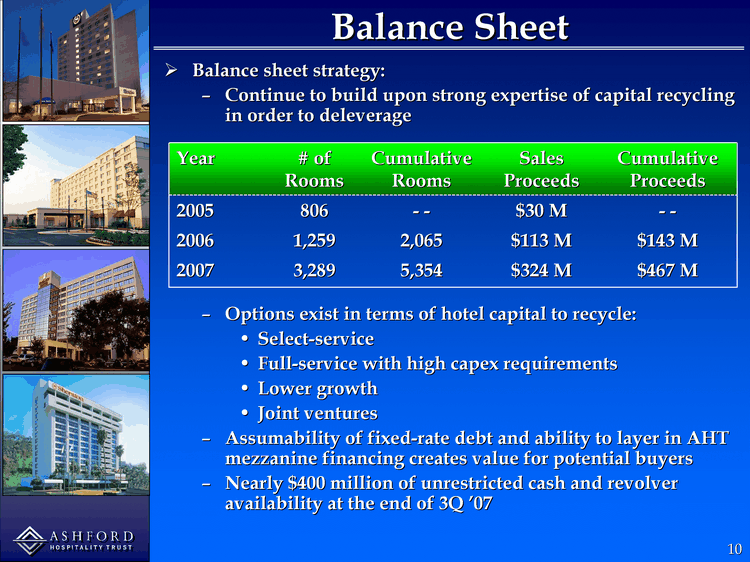
Balance Sheet Balance sheet strategy: Continue to build upon strong expertise of capital recycling in order to deleverage Options exist in terms of hotel capital to recycle: Select-service Full-service with high capex requirements Lower growth Joint ventures Assumability of fixed-rate debt and ability to layer in AHT mezzanine financing creates value for potential buyers Nearly $400 million of unrestricted cash and revolver availability at the end of 3Q '07 Year # of Rooms Cumulative Rooms Sales Proceeds Cumulative Proceeds 2005 806 - - $30 M - - 2006 1,259 2,065 $113 M $143 M 2007 3,289 5,354 $324 M $467 M |
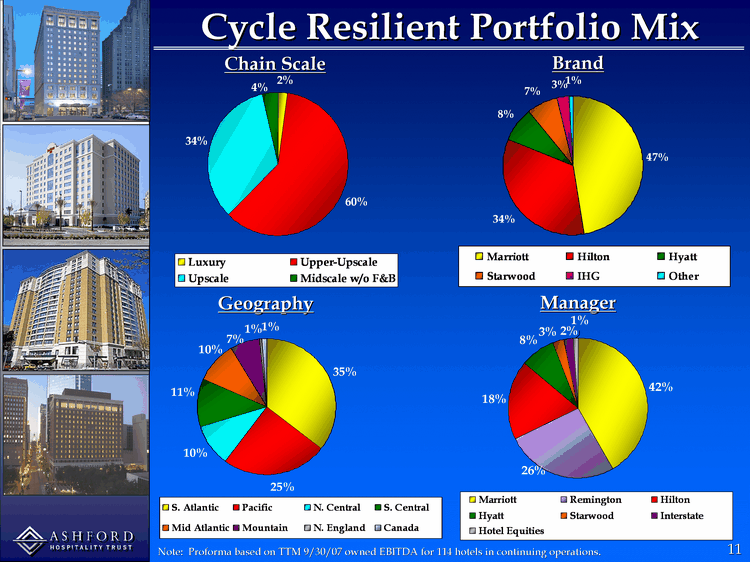
Cycle Resilient Portfolio Mix Marriott Hilton Hyatt Starwood IHG Other 0.474 0.337 0.08 0.073 0.027 0.009 Marriott Remington Hilton Hyatt Starwood Interstate Hotel Equities 0.416 0.26 0.184 0.08 0.027 0.02 0.012 Luxury Upper-Upscale Upscale Midscale w/o F&B 0.021 0.605 0.339 0.035 Chain Scale Brand Geography Manager Note: Proforma based on TTM 9/30/07 owned EBITDA for 114 hotels in continuing operations. S. Atlantic Pacific N. Central S. Central Mid Atlantic Mountain N. England Canada 0.356 0.247 0.101 0.113 0.098 0.067 0.008 0.01 |
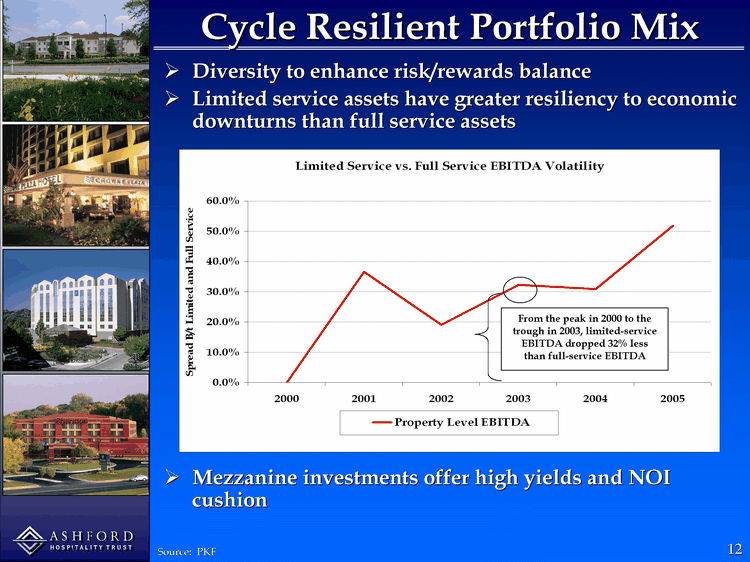
Diversity to enhance risk/rewards balance Limited service assets have greater resiliency to economic downturns than full service assets Mezzanine investments offer high yields and NOI cushion Cycle Resilient Portfolio Mix Source: PKF From the peak in 2000 to the trough in 2003, limited-service EBITDA dropped 32% less than full-service EBITDA |
Focus on value-added capex grows RevPAR and captures market share through higher RevPAR penetration Management will be prudent regarding the timing of future expenditures and the magnitude of ROI projects FF&E Owner Funded Total 2004 3.8 10.4 14.2 2005 11.4 26.9 38.3 2006 18.4 29.6 48 3Q 2007 - YTD 33.9 43.1 77 4Q 2007 - FY 2008 203 203 Internal Growth / Capex Funding 239 bps of '05 RevPAR Penetration Capex ($ millions) Source: Company estimates. FF&E Reserve Owner-Funded Capital Expenditures 240 bps of '06 RevPAR Penetration 37 bps of YTD RevPAR Penetration |
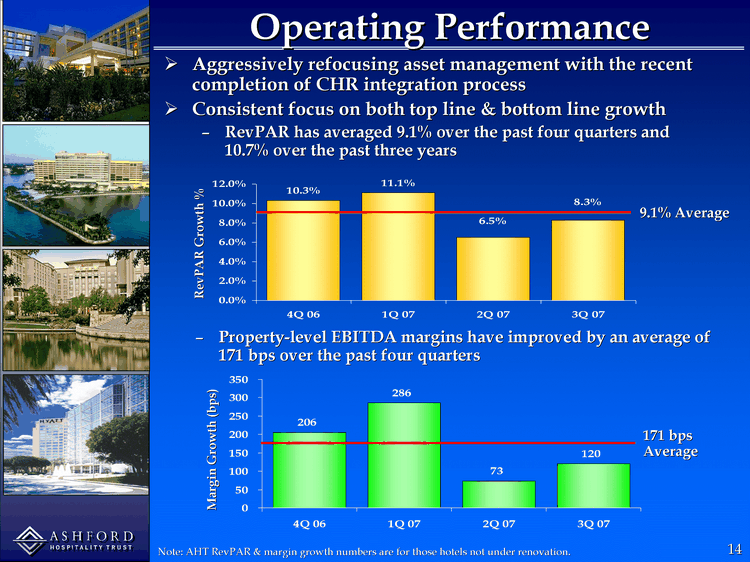
Operating Performance Property-level EBITDA margins have improved by an average of 171 bps over the past four quarters AHT RevPAR Growth 4Q 06 0.1033 1Q 07 0.111 2Q 07 0.065 3Q 07 0.083 RevPAR Growth % AHT RevPAR Growth 4Q 06 206 1Q 07 286 2Q 07 73 3Q 07 120 Margin Growth (bps) Note: AHT RevPAR & margin growth numbers are for those hotels not under renovation. 9.1% Average 171 bps Average Aggressively refocusing asset management with the recent completion of CHR integration process Consistent focus on both top line & bottom line growth RevPAR has averaged 9.1% over the past four quarters and 10.7% over the past three years |
High Dividend Dividend growth: 250% since 1Q 2004 Strong dividend CAD/AFFO coverage: 2007 YTD - 1.24x CAD coverage 2007 YTD - 1.59x AFFO coverage Highest in peer group with dividend yield of 10.7% (1) Assumes 11/9/07 stock price of $7.87. Note: Peers include BEE, DRH, FCH, HPT, HST, HT, LHO, SHO. Dividend Dividend Yield Dividend Yield - Peer Avg. 1Q 04 0.06 0.024 0.032 2Q 04 0.1 0.048 0.039 3Q 04 0.14 0.06 0.04 4Q 04 0.15 0.055 0.042 1Q 05 0.16 0.063 0.047 2Q 05 0.17 0.063 0.043 3Q 05 0.18 0.067 0.048 4Q 05 0.18 0.069 0.052 1Q 06 0.2 0.065 0.047 2Q 06 0.2 0.063 0.049 3Q 06 0.2 0.067 0.051 4Q 06 0.2 0.064 0.052 1Q 07 0.21 0.07 0.049 2Q 07 0.21 0.071 0.05 3Q 07 0.21 0.107 0.059 |
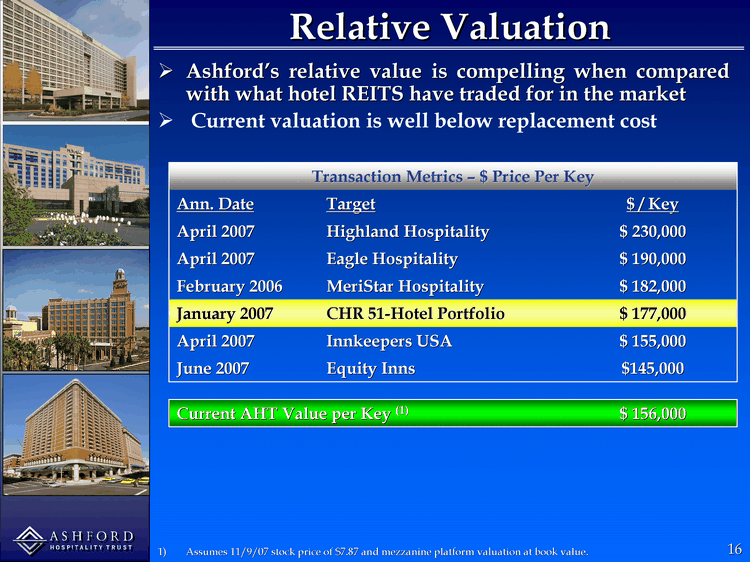
Relative Valuation Transaction Metrics - $ Price Per Key Transaction Metrics - $ Price Per Key Transaction Metrics - $ Price Per Key Transaction Metrics - $ Price Per Key Ann. Date Target $ / Key April 2007 Highland Hospitality $ 230,000 April 2007 Eagle Hospitality $ 190,000 February 2006 MeriStar Hospitality $ 182,000 January 2007 CHR 51-Hotel Portfolio $ 177,000 April 2007 Innkeepers USA $ 155,000 June 2007 Equity Inns $145,000 Assumes 11/9/07 stock price of $7.87 and mezzanine platform valuation at book value. Current AHT Value per Key (1) $ 156,000 Ashford's relative value is compelling when compared with what hotel REITS have traded for in the market Current valuation is well below replacement cost |
Current Lodging Cycle |
Lodging REITs vs. Other REITs Source: FBR Property Week - 11/12/07. Lodging REITs lag other multiples despite having one of the highest dividend yields and the highest projected 2008 FFO growth Office Apartment Retail Industrial Healthcare Lodging 2008 FFO Multiple 16.4 15.1 14.4 13.6 13.4 8.9 Dividend Yield 0.04 0.05 0.045 0.035 0.059 0.0504 2008 FFO Growth % 0.037 0.086 0.071 0.104 0.052 0.11 |
Supply Overview US supply growth is still below historical average of 2.2% and is projected to remain so for at least two years Estimates have been revised downward consistently over the past few years due to: High construction costs & land prices Financial market turmoil Expanding development timelines Residential / condo conversions Source: PricewaterhouseCoopers US Supply Growth - PWC US Supply Growth - PWC US Supply Growth - PWC US Supply Growth - PWC Date of Report 2007 2008 2009 2Q 2006 2.1% 2.2% - - 3Q 2006 2.0% 2.4% - - 4Q 2006 1.6% 2.2% - - 1Q 2007 1.6% 2.3% 2.3% 2Q 2007 1.3% 2.1% 2.2% |
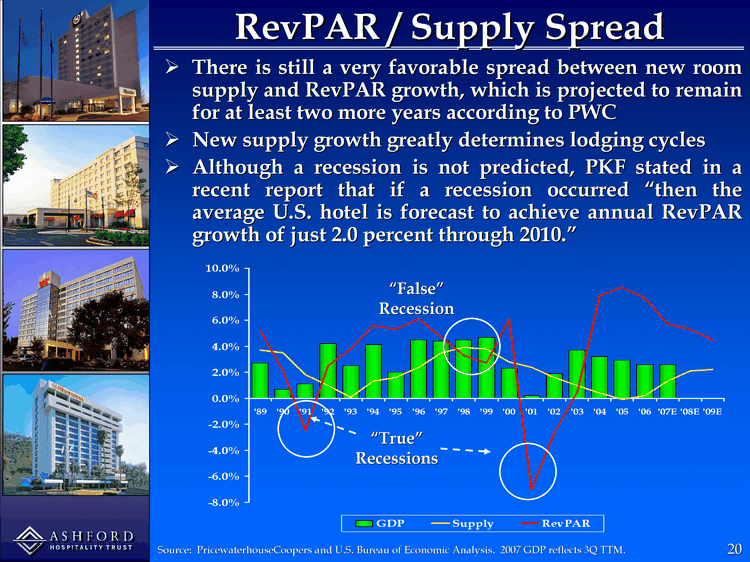
RevPAR / Supply Spread '89 '90 '91 '92 '93 '94 '95 '96 '97 '98 '99 '00 '01 '02 '03 '04 '05 '06 '07E '08E '09E Supply 0.037 0.035 0.018 0.01 0.0007 0.013 0.016 0.024 0.035 0.039 0.038 0.028 0.024 0.016 0.01 0.004 -0.001 0.002 0.013 0.021 0.022 RevPAR 0.052 0.021 -0.025 0.025 0.038 0.056 0.053 0.061 0.047 0.033 0.027 0.061 -0.07 -0.027 0.005 0.079 0.085 0.077 0.057 0.053 0.045 GDP 0.027 0.007 0.011 0.042 0.025 0.041 0.02 0.045 0.044 0.045 0.047 0.023 0.002 0.019 0.037 0.032 0.029 0.026 0.026 There is still a very favorable spread between new room supply and RevPAR growth, which is projected to remain for at least two more years according to PWC New supply growth greatly determines lodging cycles Although a recession is not predicted, PKF stated in a recent report that if a recession occurred "then the average U.S. hotel is forecast to achieve annual RevPAR growth of just 2.0 percent through 2010." Source: PricewaterhouseCoopers and U.S. Bureau of Economic Analysis. 2007 GDP reflects 3Q TTM. "True" Recessions "False" Recession |
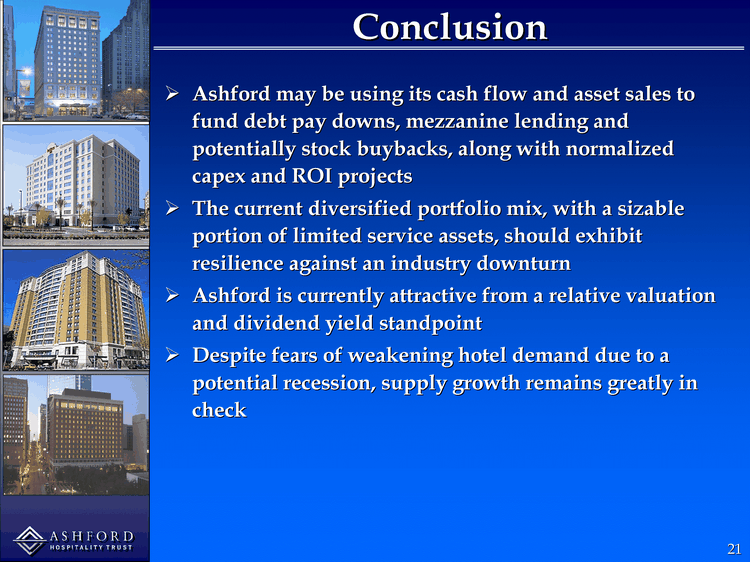
Conclusion Ashford may be using its cash flow and asset sales to fund debt pay downs, mezzanine lending and potentially stock buybacks, along with normalized capex and ROI projects The current diversified portfolio mix, with a sizable portion of limited service assets, should exhibit resilience against an industry downturn Ashford is currently attractive from a relative valuation and dividend yield standpoint Despite fears of weakening hotel demand due to a potential recession, supply growth remains greatly in check |
NAREIT Presentation November 2007 |