Exhibit 99.1
Oppenheimer Conference July 2008 |
Safe Harbor In keeping with the SEC's "Safe Harbor" guidelines, certain statements made during this presentation could be considered forward-looking and subject to certain risks and uncertainties that could cause results to differ materially from those projected. When we use the words "will likely result," "may," "anticipate," "estimate," "should," "expect," "believe," "intend," or similar expressions, we intend to identify forward-looking statements. Such forward-looking statements include, but are not limited to, our business and investment strategy, our understanding of our competition, current market trends and opportunities, projected operating results, and projected capital expenditures. These forward-looking statements are subject to known and unknown risks and uncertainties, which could cause actual results to differ materially from those anticipated including, without limitation: general volatility of the capital markets and the market price of our common stock; changes in our business or investment strategy; availability, terms and deployment of capital; availability of qualified personnel; changes in our industry and the market in which we operate, interest rates or the general economy, and the degree and nature of our competition. These and other risk factors are more fully discussed in the Company's filings with the Securities and Exchange Commission. EBITDA is defined as net income before interest, taxes, depreciation and amortization. EBITDA yield is defined as trailing twelve month EBITDA divided by the purchase price. EBITDA, FFO, AFFO, CAD and other terms are non-GAAP measures, reconciliations of which have been provided in prior earnings releases and filings with the SEC. 2 |
Ashford Advantage AHT's diversified platform should perform better in periods of economic uncertainty AHT's risk profile is mitigated by its capital recycling strategies AHT's strategies are designed to further secure the dividend AHT's dividend is covered by the operating business. Its capital recycling strategies are match funded through asset sales 3 |
Ashford Snapshot Portfolio Statistics AHT Total Enterprise Value (1) $3.4 Bil Peer Comparison (2) 2nd largest # of Hotels 105 # of Rooms 23,758 ADR (3) $145.53 RevPAR (3) $102.85 Financial Statistics # Shares Outstanding(4) 139.8 M Avg. Daily Trading Volume (3 Month) 1.2 M TTM FFO per Share / Y-o-Y % Growth(5) $1.28 / 9.4% Net Debt / Gross Assets 60% Debt Weighted Average Maturity 7 years Debt Weighted Average Cost(6) 4.99% EBITDA / Interest Expense - TTM(5) 2.4x Dividend Yield % (1) 18.2% CAD Dividend Coverage - TTM(5) 1.17x Price per Key(7) $133,000 Assumes 6/30/08 share price of $4.62. Ranked by Total Enterprise Value of pure lodging peers. All hotels included in continuing operations not under renovation for twelve months ended 3/31/08. Diluted shares as of 1Q '08. Through 3/31/08 Includes the effect of the interest rate swap, as of 6/13/08. Assumes 6/30/08 share price and mezzanine platform valuation at book value. 4 |
Despite economic uncertainty, AHT provides attractive risk adjusted returns: Diversified hotel portfolio yields less volatile income stream Chain scale Brand Geography Investment strategy Flexible capital recycling provides opportunities throughout the entire hotel cycle Mezz Stock buybacks ROI capex Attractive dividend yield and coverage Attractive stock price relative to per key values AHT Opportunity 5 |
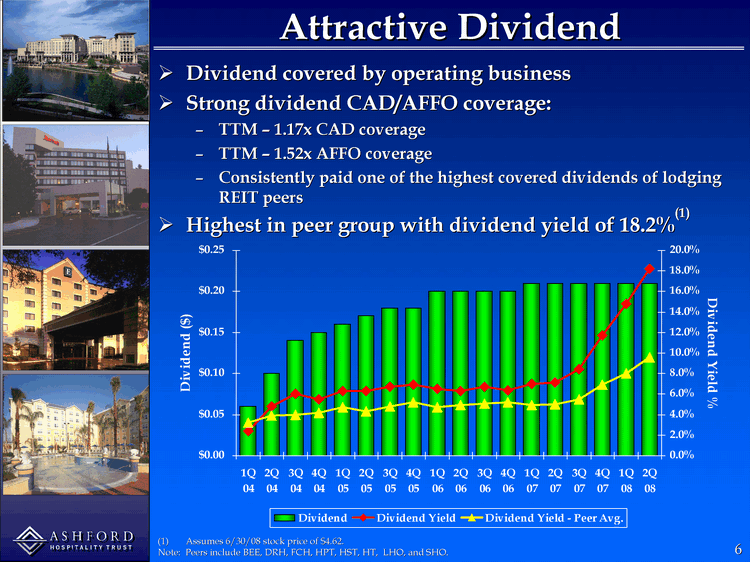
Attractive Dividend Dividend covered by operating business Strong dividend CAD/AFFO coverage: TTM - 1.17x CAD coverage TTM - 1.52x AFFO coverage Consistently paid one of the highest covered dividends of lodging REIT peers Highest in peer group with dividend yield of 18.2%(1) Assumes 6/30/08 stock price of $4.62. Note: Peers include BEE, DRH, FCH, HPT, HST, HT, LHO, and SHO. Dividend Dividend Yield Dividend Yield - Peer Avg. 1Q 04 0.06 0.024 0.032 2Q 04 0.1 0.048 0.039 3Q 04 0.14 0.06 0.04 4Q 04 0.15 0.055 0.042 1Q 05 0.16 0.063 0.047 2Q 05 0.17 0.063 0.043 3Q 05 0.18 0.067 0.048 4Q 05 0.18 0.069 0.052 1Q 06 0.2 0.065 0.047 2Q 06 0.2 0.063 0.049 3Q 06 0.2 0.067 0.051 4Q 06 0.2 0.064 0.052 1Q 07 0.21 0.07 0.049 2Q 07 0.21 0.071 0.05 3Q 07 0.21 0.084 0.055 4Q 07 0.21 0.117 0.069 1Q 08 0.21 0.148 0.08 2Q 08 0.21 0.182 0.096 6 |
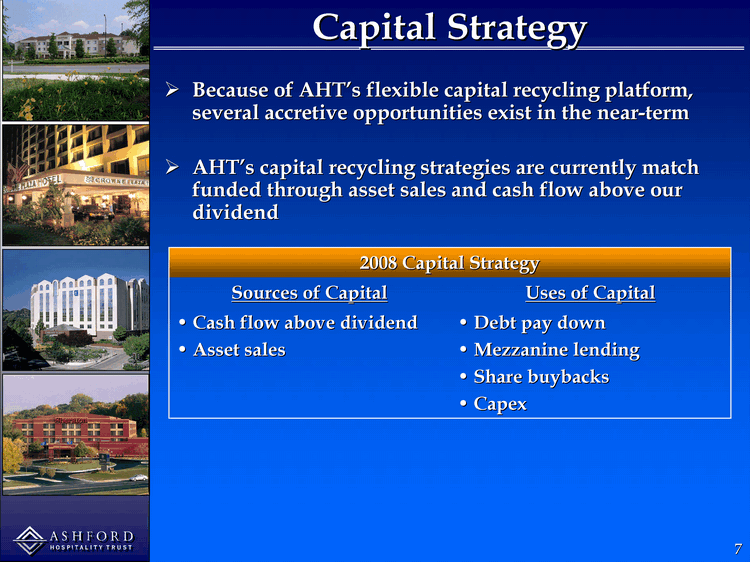
Capital Strategy Because of AHT's flexible capital recycling platform, several accretive opportunities exist in the near-term AHT's capital recycling strategies are currently match funded through asset sales and cash flow above our dividend 2008 Capital Strategy 2008 Capital Strategy Sources of Capital Uses of Capital Cash flow above dividend Asset sales Debt pay down Mezzanine lending Share buybacks Capex 7 |
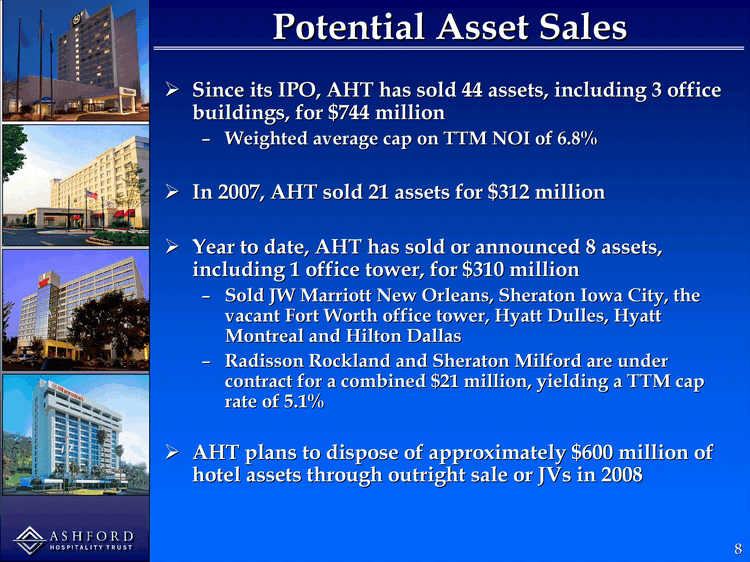
Potential Asset Sales Since its IPO, AHT has sold 44 assets, including 3 office buildings, for $744 million Weighted average cap on TTM NOI of 6.8% In 2007, AHT sold 21 assets for $312 million Year to date, AHT has sold or announced 8 assets, including 1 office tower, for $310 million Sold JW Marriott New Orleans, Sheraton Iowa City, the vacant Fort Worth office tower, Hyatt Dulles, Hyatt Montreal and Hilton Dallas Radisson Rockland and Sheraton Milford are under contract for a combined $21 million, yielding a TTM cap rate of 5.1% AHT plans to dispose of approximately $600 million of hotel assets through outright sale or JVs in 2008 8 |
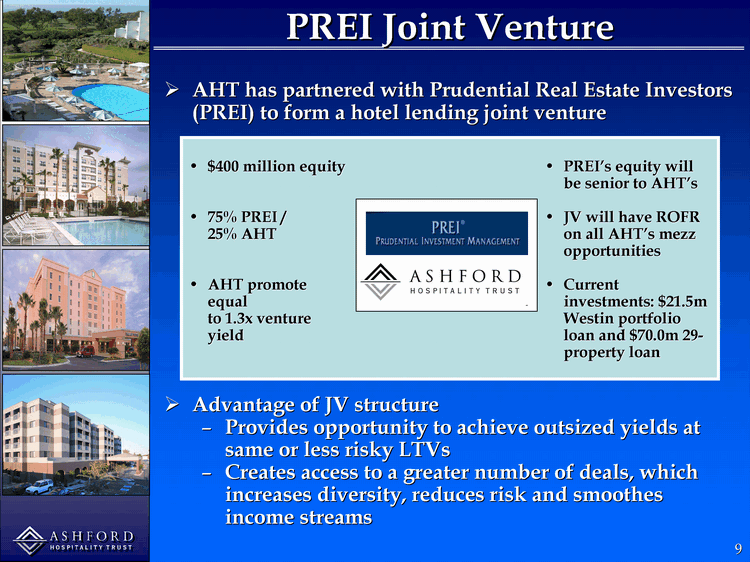
PREI Joint Venture AHT has partnered with Prudential Real Estate Investors (PREI) to form a hotel lending joint venture Advantage of JV structure Provides opportunity to achieve outsized yields at same or less risky LTVs Creates access to a greater number of deals, which increases diversity, reduces risk and smoothes income streams $400 million equity 75% PREI / 25% AHT AHT promote equal to 1.3x venture yield PREI's equity will be senior to AHT's JV will have ROFR on all AHT's mezz opportunities Current investments: $21.5m Westin portfolio loan and $70.0m 29- property loan 9 |
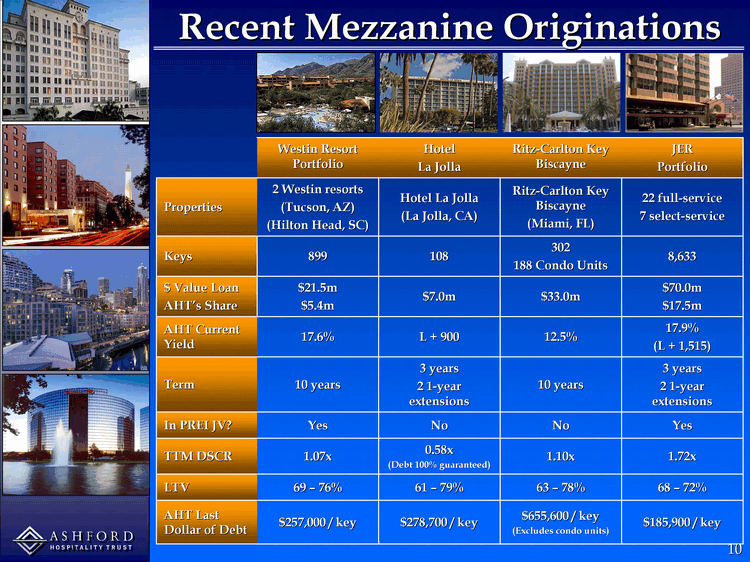
Recent Mezzanine Originations Westin Resort Portfolio Hotel La Jolla Ritz-Carlton Key Biscayne JER Portfolio Properties 2 Westin resorts (Tucson, AZ) (Hilton Head, SC) Hotel La Jolla (La Jolla, CA) Ritz-Carlton Key Biscayne (Miami, FL) 22 full-service 7 select-service Keys 899 108 302 188 Condo Units 8,633 $ Value Loan AHT's Share $21.5m $5.4m $7.0m $33.0m $70.0m $17.5m AHT Current Yield 17.6% L + 900 12.5% 17.9% (L + 1,515) Term 10 years 3 years 2 1-year extensions 10 years 3 years 2 1-year extensions In PREI JV? Yes No No Yes TTM DSCR 1.07x 0.58x (Debt 100% guaranteed) 1.10x 1.72x LTV 69 - 76% 61 - 79% 63 - 78% 68 - 72% AHT Last Dollar of Debt $257,000 / key $278,700 / key $655,600 / key (Excludes condo units) $185,900 / key 10 |
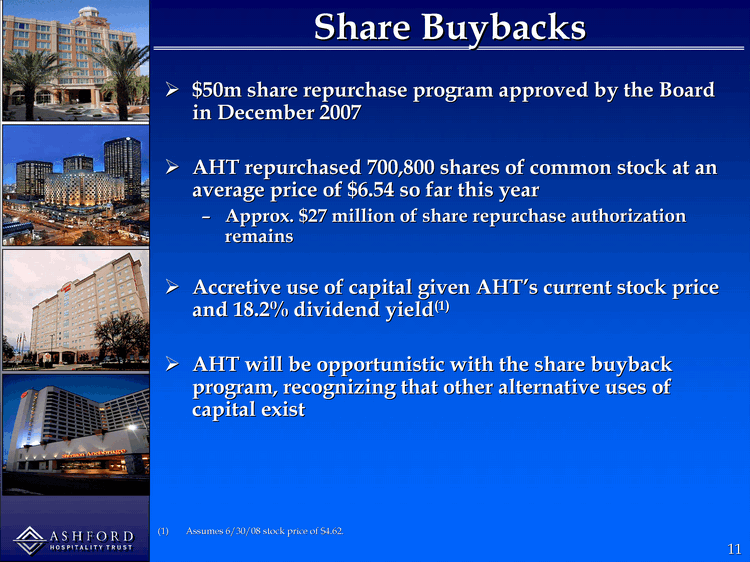
Share Buybacks $50m share repurchase program approved by the Board in December 2007 AHT repurchased 700,800 shares of common stock at an average price of $6.54 so far this year Approx. $27 million of share repurchase authorization remains Accretive use of capital given AHT's current stock price and 18.2% dividend yield(1) AHT will be opportunistic with the share buyback program, recognizing that other alternative uses of capital exist Assumes 6/30/08 stock price of $4.62. 11 |
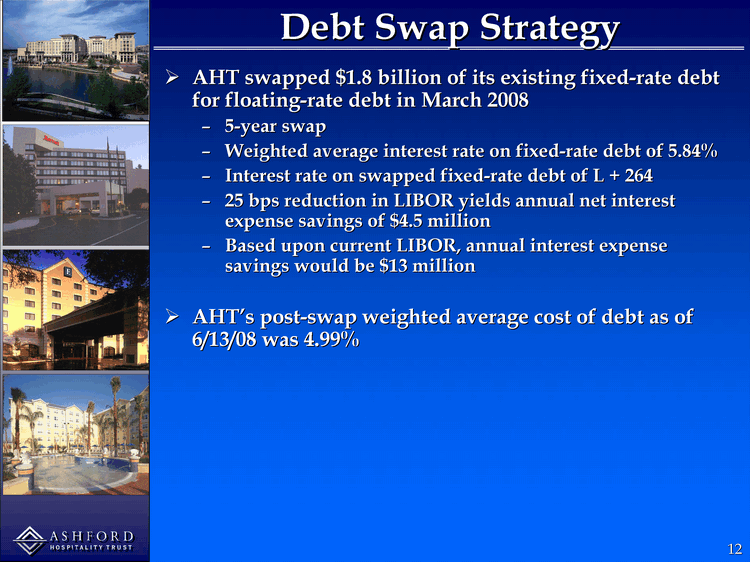
Debt Swap Strategy AHT swapped $1.8 billion of its existing fixed-rate debt for floating-rate debt in March 2008 5-year swap Weighted average interest rate on fixed-rate debt of 5.84% Interest rate on swapped fixed-rate debt of L + 264 25 bps reduction in LIBOR yields annual net interest expense savings of $4.5 million Based upon current LIBOR, annual interest expense savings would be $13 million AHT's post-swap weighted average cost of debt as of 6/13/08 was 4.99% 12 |
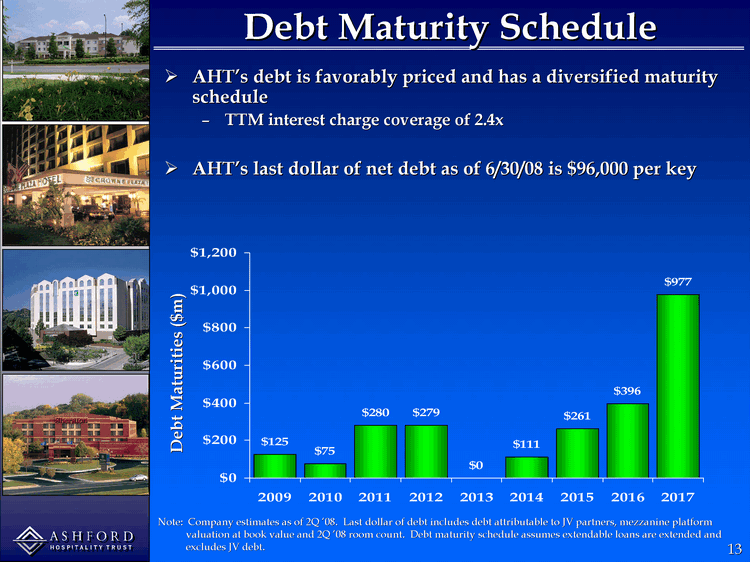
Debt Maturity Schedule 2009 2010 2011 2012 2013 2014 2015 2016 2017 Total 125 75 280 279 0 111 261 396 977 Clear 125 75 280 279 0 111 261 396 977 Debt Maturities ($m) Note: Company estimates as of 2Q '08. Last dollar of debt includes debt attributable to JV partners, mezzanine platform valuation at book value and 2Q '08 room count. Debt maturity schedule assumes extendable loans are extended and excludes JV debt. AHT's debt is favorably priced and has a diversified maturity schedule TTM interest charge coverage of 2.4x AHT's last dollar of net debt as of 6/30/08 is $96,000 per key 13 |
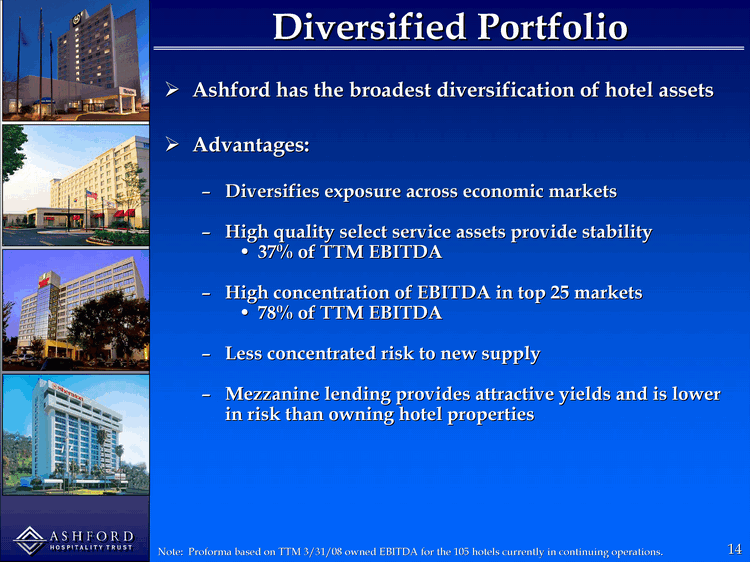
Ashford has the broadest diversification of hotel assets Advantages: Diversifies exposure across economic markets High quality select service assets provide stability 37% of TTM EBITDA High concentration of EBITDA in top 25 markets 78% of TTM EBITDA Less concentrated risk to new supply Mezzanine lending provides attractive yields and is lower in risk than owning hotel properties Diversified Portfolio Note: Proforma based on TTM 3/31/08 owned EBITDA for the 105 hotels currently in continuing operations. 14 |
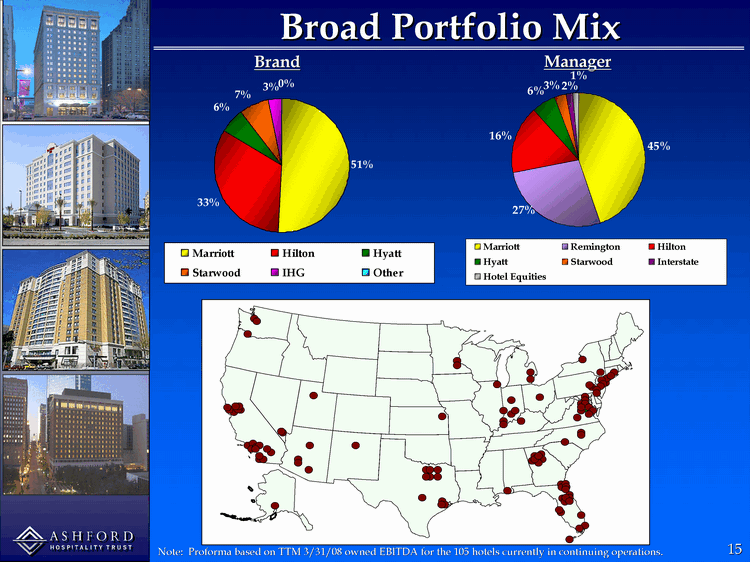
Broad Portfolio Mix Marriott Hilton Hyatt Starwood IHG Other 0.509 0.328 0.06 0.071 0.031 0.001 Marriott Remington Hilton Hyatt Starwood Interstate Hotel Equities 0.446 0.273 0.163 0.06 0.027 0.018 0.013 Brand Manager Note: Proforma based on TTM 3/31/08 owned EBITDA for the 105 hotels currently in continuing operations. 15 |
Ashford Advantage AHT's diversified platform should perform better in periods of economic uncertainty AHT's risk profile is mitigated by its capital recycling strategies AHT's strategies are designed to further secure the dividend AHT's dividend is covered by the operating business. Its capital recycling strategies are match funded through asset sales 16 |
Oppenheimer Conference July 2008 17 |