Issuer Free Writing Prospectus
Dated September 23, 2020
Filed Pursuant to Rule 433
Registration Statement No. 333-239961
 | Investor Presentation: Support the Preferred Stock Exchange Offer September 2020 |
 | F o r w a r d L o o k i n g S t a t e m e n t s a n d N o n - G A A P M e a s u r e s In keeping with the SEC's "Safe Harbor" guidelines, certain statements made during this presentation could be considered forward-looking and subject to certain risks and uncertainties that could cause results to differ materially from those projected. When we use the words "will likely result," "may," "anticipate," "estimate," "should," "expect," "believe," "intend," or similar expressions, we intend to identify forward-looking statements. Such forward-looking statements include, but are not limited to, our business and investment strategy, our understanding of our competition, current market trends and opportunities, projected operating results, and projected capital expenditures. These forward-looking statements are subject to known and unknown risks and uncertainties, which could cause actual results to differ materially from those anticipated including, without limitation: general volatility of the capital markets and the market price of our common stock; changes in our business or investment strategy; availability, terms and deployment of capital; availability of qualified personnel; changes in our industry and the market in which we operate, interest rates or the general economy, the degree and nature of our competition, legislative and regulatory changes, including changes to the Internal Revenue Code of 1986, as amended (the “Code”), and related rules, regulations and interpretations governing the taxation of REITs; limitations imposed on our business and our ability to satisfy complex rules in order for us to qualify as a REIT for federal income tax purposes. These and other risk factors are more fully discussed in the company's filings with the Securities and Exchange Commission. EBITDA is defined as net income before interest, taxes, depreciation and amortization. EBITDA yield is defined as trailing twelve month EBITDA divided by the purchase price or debt amount. Unless otherwise noted, capitalization rate is determined by dividing the property's net operating income by the purchase price. Unless otherwise noted, net operating income is the property's funds from operations minus a capital expense reserve of either 4% or 5% of gross revenues. Unless otherwise noted, hotel EBITDA flow-through is the change in Hotel EBITDA divided by the change in total revenues. EBITDA, FFO, AFFO, CAD and other terms are non-GAAP measures and, if used in this presentation, reconciliations have been provided in prior earnings releases and filings with the SEC or in the appendix to this presentation. The calculation of implied equity value is derived from an estimated blended capitalization rate (“Cap Rate”) for the entire portfolio using the capitalization rate method. The estimated Cap Rate is based on recent Cap Rates of publically traded peers involving a similar blend of asset types found in the portfolio, which is then applied to Net Operating Income (“NOI”) of the company’s assets to calculate a Total Enterprise Value (“TEV”) of the company. From the TEV, we deduct debt and preferred equity and then add back working capital and the company’s investment in Ashford Inc. to derive an equity value. The capitalization rate method is one of several valuation methods for estimating asset value and implied equity value. Among the limitations of using the capitalization rate method for determining an implied equity value are that it does not take into account the potential change or variability in future cash flows, potential significant future capital expenditures, the intended hold period of the asset, or a change in the future risk profile of an asset. This overview is for informational purposes only and is not an offer to sell, or a solicitation of an offer to buy or sell, any securities of Ashford Hospitality Trust Inc. or any of its respective affiliates, and may not be relied upon in connection with the purchase or sale of any such security. |
 | The Company has filed a registration statement (including a prospectus) with the SEC for the offering to which this communication relates. Before you invest, you should read the prospectus in that registration statement and other documents the issuer has filed with the SEC for more complete information about the issuer and this offering. You may get these documents for free by visiting EDGAR on the SEC web site at www.sec.gov. Alternatively, the issuer, the dealer manager or any dealer participating in the offering will arrange to send you the prospectus if you request it by calling toll-free 1-877-787-9239. Where You Can Find Additional Information Completion of the Exchange Offers and the Consent Solicitation are subject to certain conditions, which are set forth in more detail in the Company's registration statement on Form S-4 (as amended, the “Registration Statement”) filed with the Securities and Exchange Commission (“SEC”) for the purpose of registering the Common Stock issued pursuant to the Exchange Offers under the Securities Act of 1933, as amended. The Registration Statement was declared effective on September 9, 2020 at 4:00 p.m. ET. The Company has also filed with the SEC a Schedule TO for the Exchange Offers and a definitive proxy statement on Schedule 14A to solicit proxies from the holders of its Common Stock to approve the relevant items upon which the holders of the Common Stock will be entitled to vote (the “Proxy Statement”). The Proxy Statement was first mailed to stockholders on or about September 10, 2020. The Company may extend or terminate the Exchange Offers under certain circumstances as described in the Registration Statement. Additional information regarding these transactions can be found in the Company's investor presentation available at https://dealroadshow.finsight.com/retail-roadshows. Common stockholders who have questions about the Exchange Offers should contact: 1-877-787-9239 RBC Capital Markets, LLC, as Dealer Manager Tel: (212) 618-7843 Toll-free: (877) 381-2099 Email: liability.management@rbccm.com Certain Information Regarding Participants The Company, its directors and certain of its executive officers are participants in the solicitation of proxies from the Company's shareholders in connection with the Exchange Offer and Consent Solicitation. Information about the Company's executive officers and directors and their ownership of the Company's stock is set forth in the definitive proxy statement that was filed with the SEC on September 10, 2020. This does not constitute an offer of any securities for sale. Further, this communication is not a solicitation of a proxy from any security holder of the Company and shall not constitute the solicitation of an offer to buy securities. Investors should read the Registration Statement and the Schedule TO for the Exchange Offers as they contain important information about the Exchange Offers, the Company and the other proposed transactions. Holders of Common Stock should read the Proxy Statement and any other relevant documents because they contain important information about the Company and the proposed transactions. The Registration Statement, Schedule TO and Proxy Statement are available for free on the SEC's website, www.sec.gov. The prospectus included in the Registration Statement and additional copies of the Proxy Statement will be available for free from the Company for the applicable shareholders of the Company. |
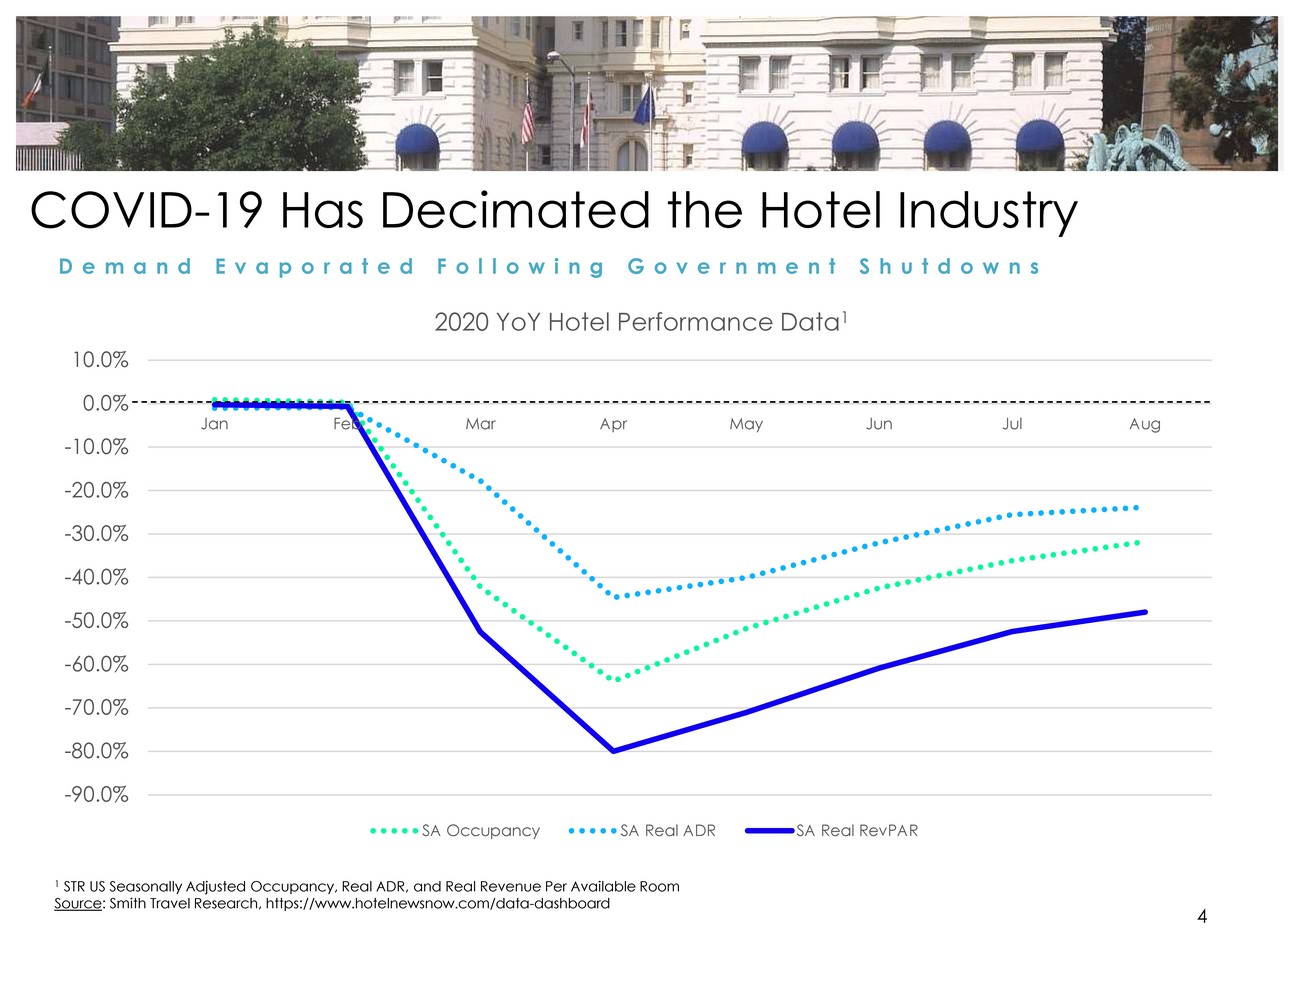 | COVID-19 Has Decimated the Hotel Industry D e m a n dE v a p o r a t e dF o l l o w i n gG o v e r n m e n t S h u t d o w n s 10.0% 2020 YoY Hotel Performance Data1 0.0% -10.0% Jan FebMarAprMayJun JulAug -20.0% -30.0% -40.0% -50.0% -60.0% -70.0% -80.0% -90.0% SA OccupancySA Real ADRSA Real RevPAR 1 STR US Seasonally Adjusted Occupancy, Real ADR, and Real Revenue Per Available Room Source: Smith Travel Research, https://www.hotelnewsnow.com/data-dashboard |
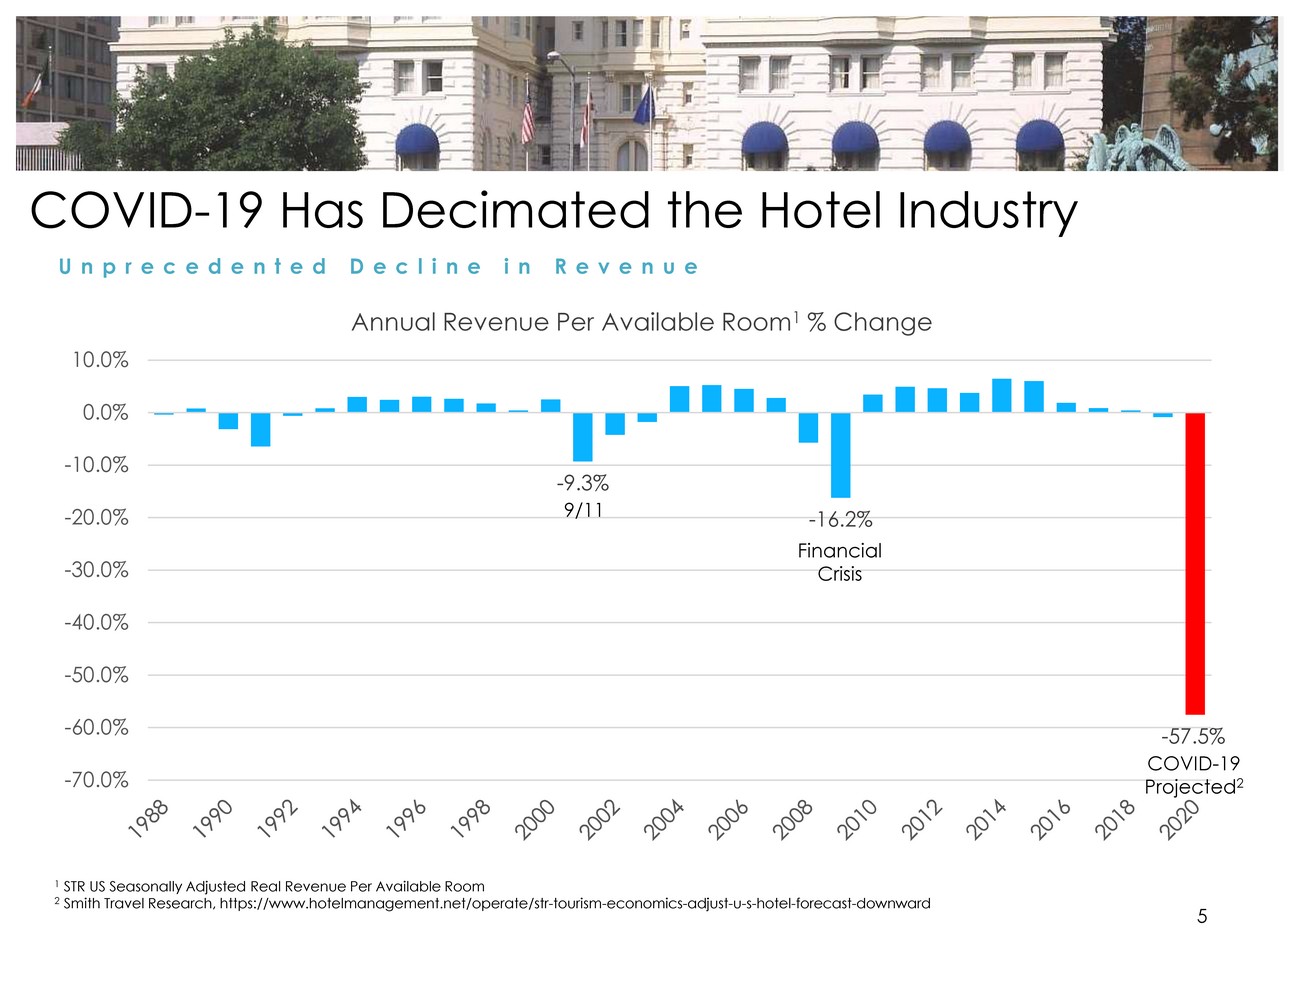 | COVID-19 Has Decimated the Hotel Industry U n p r e c e d e n t e dD e c l i n ei n R e v e n u e 10.0% Annual Revenue Per Available Room1 % Change 0.0% -10.0% -20.0% -30.0% -9.3% 9/11 -16.2% Financial Crisis -40.0% -50.0% -60.0% -70.0% -57.5% COVID-19 Projected2 1 STR US Seasonally Adjusted Real Revenue Per Available Room 2 Smith Travel Research, https://www.hotelmanagement.net/operate/str-tourism-economics-adjust-u-s-hotel-forecast-downward |
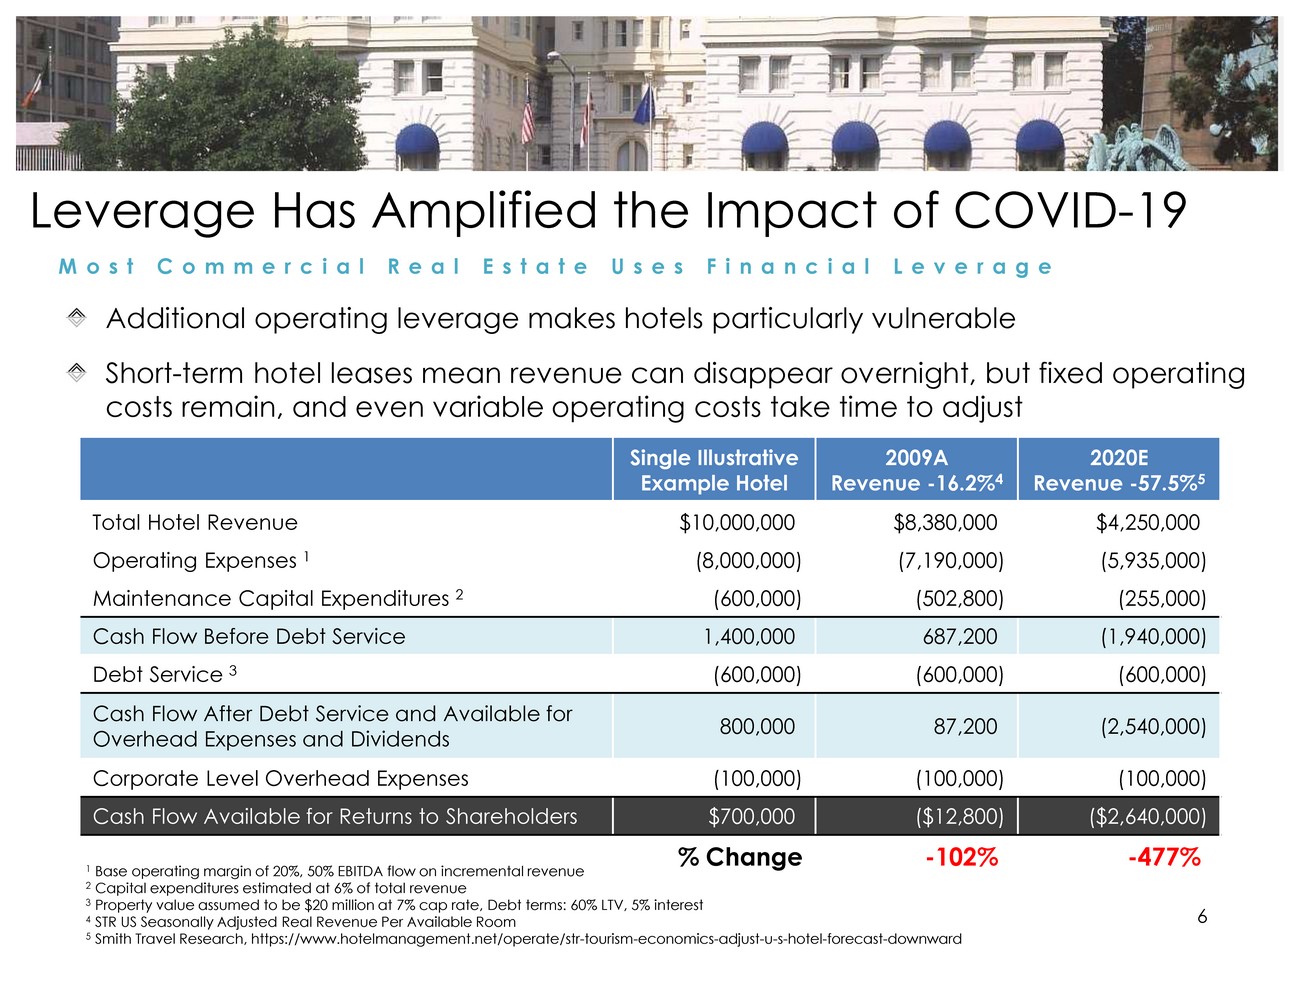 | Leverage Has Amplified the Impact of COVID-19 M o s t C o m m e r c i a lR e a lE s t a t eU s e s F i n a n c i a lL e v e r a g e Additional operating leverage makes hotels particularly vulnerable Short-term hotel leases mean revenue can disappear overnight, but fixed operating costs remain, and even variable operating costs take time to adjust Single Illustrative Example Hotel 2009A Revenue -16.2%4 2020E Revenue -57.5%5 Total Hotel Revenue $10,000,000) $8,380,000) $4,250,000) Operating Expenses 1 (8,000,000) (7,190,000) (5,935,000) Maintenance Capital Expenditures 2 (600,000) (502,800) (255,000) Cash Flow Before Debt Service 1,400,000) 687,200) (1,940,000) Debt Service 3 (600,000) (600,000) (600,000) Cash Flow After Debt Service and Available for Overhead Expenses and Dividends 800,000) 87,200) (2,540,000) Corporate Level Overhead Expenses (100,000) (100,000) (100,000) Cash Flow Available for Returns to Shareholders $700,000) ($12,800) ($2,640,000) % Change -102%-477% 1 Base operating margin of 20%, 50% EBITDA flow on incremental revenue 2 Capital expenditures estimated at 6% of total revenue 3 Property value assumed to be $20 million at 7% cap rate, Debt terms: 60% LTV, 5% interest 4 STR US Seasonally Adjusted Real Revenue Per Available Room6 5 Smith Travel Research, https://www.hotelmanagement.net/operate/str-tourism-economics-adjust-u-s-hotel-forecast-downward |
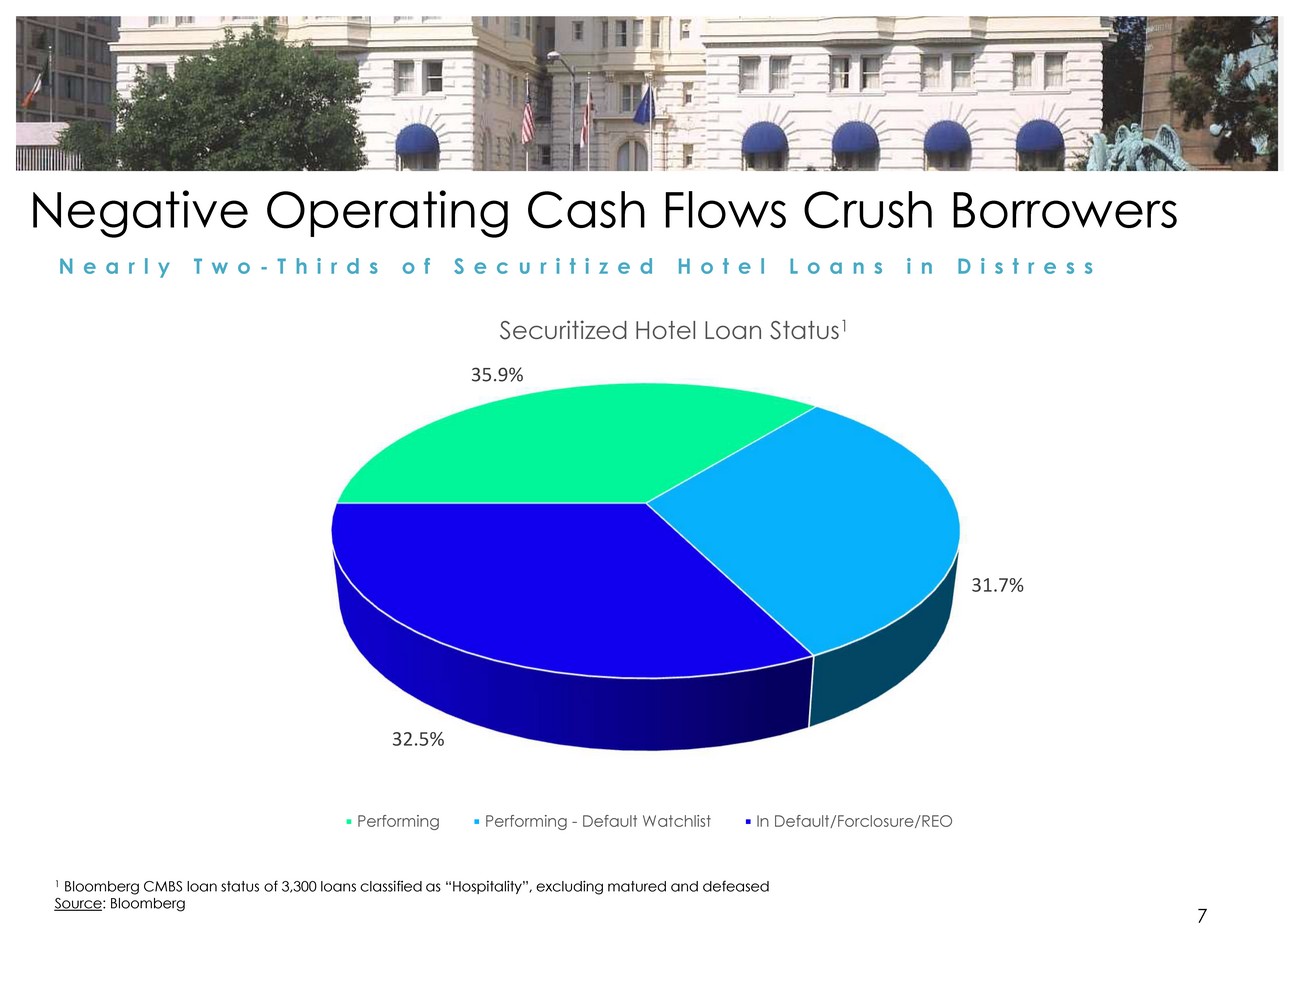 | Negative Operating Cash Flows Crush Borrowers N e a r l y T w o - T h i r d s o fS e c u r i t i z e dH o t e lL o a n s i n D i s t r e s s Securitized Hotel Loan Status1 35.9% 31.7% 32.5% PerformingPerforming - Default WatchlistIn Default/Forclosure/REO 1 Bloomberg CMBS loan status of 3,300 loans classified as “Hospitality”, excluding matured and defeased Source: Bloomberg 7 |
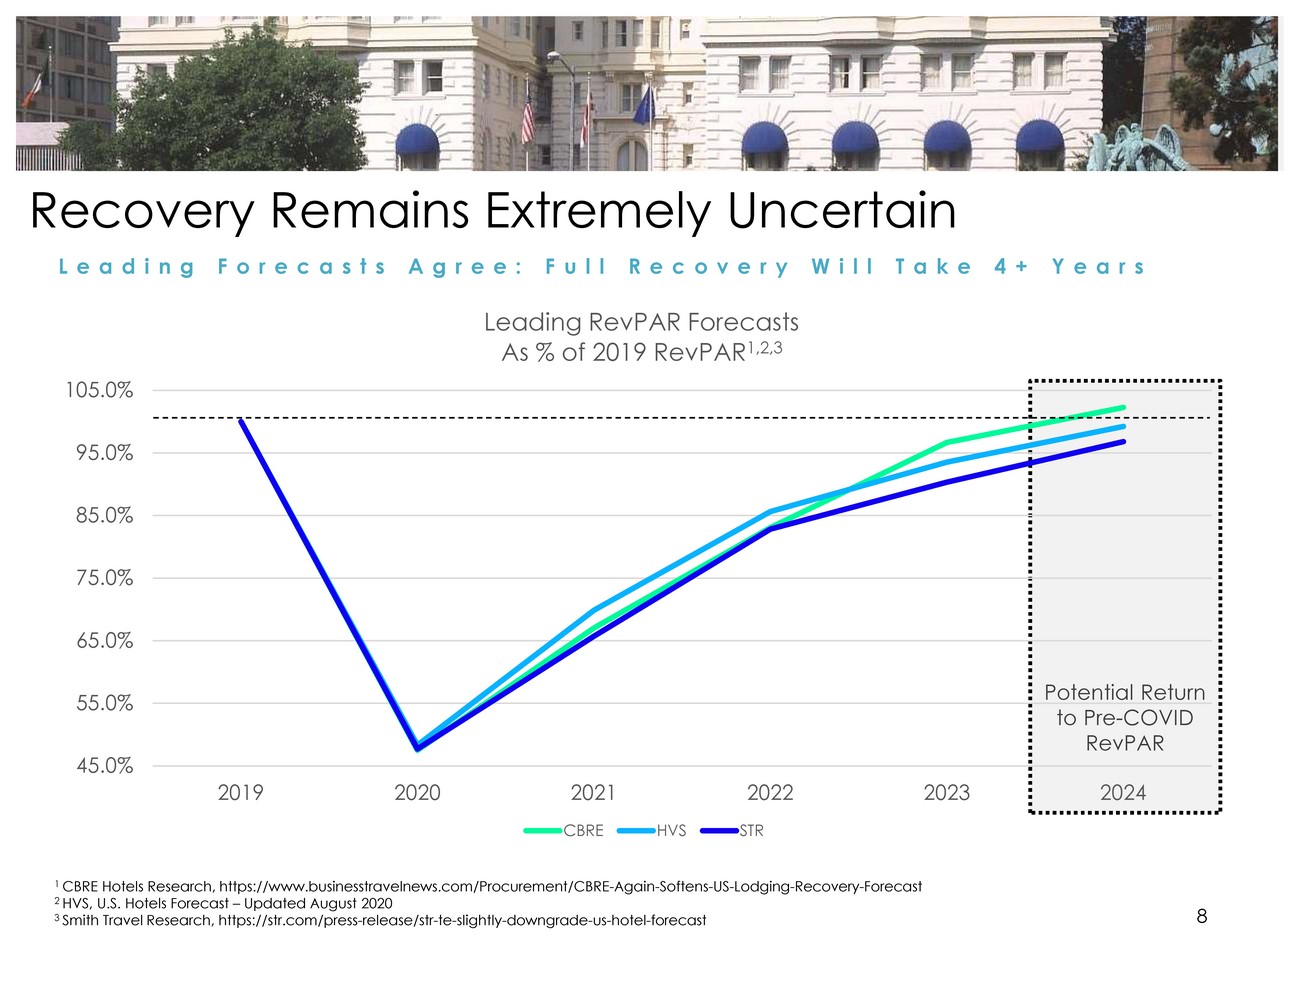 | Recovery Remains Extremely Uncertain L e a d i n gF o r e c a s t s A g r e e :F u l lR e c o v e r y W i l lT a k e4 + Y e a r s 105.0% Leading RevPAR Forecasts As % of 2019 RevPAR1,2,3 95.0% 85.0% 75.0% 65.0% 55.0% 45.0% Potential Return to Pre-COVID RevPAR 2019 2020 2021 2022 2023 2024 CBREHVSSTR 1 CBRE Hotels Research, https://www.businesstravelnews.com/Procurement/CBRE-Again-Softens-US-Lodging-Recovery-Forecast 2 HVS, U.S. Hotels Forecast – Updated August 2020 3 Smith Travel Research, https://str.com/press-release/str-te-slightly-downgrade-us-hotel-forecast8 |
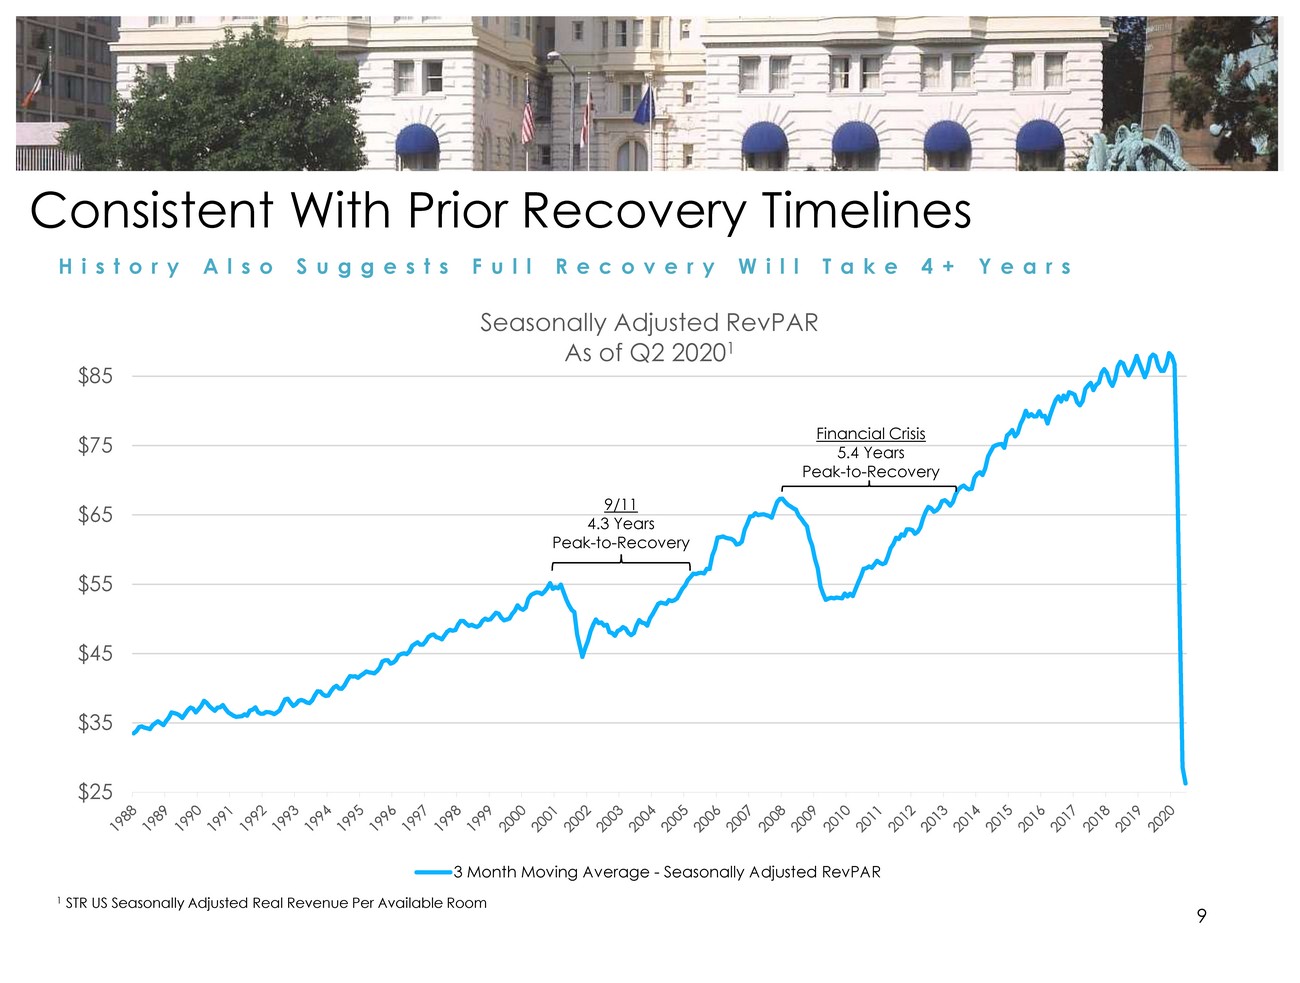 | Consistent With Prior Recovery Timelines H i s t o r y A l s oS u g g e s t s F u l lR e c o v e r y W i l lT a k e4 + Y e a r s $85 Seasonally Adjusted RevPAR As of Q2 20201 $75 $65 Financial Crisis 5.4 Years Peak-to-Recovery 9/11 4.3 Years Peak-to-Recovery $55 $45 $35 $25 3 Month Moving Average - Seasonally Adjusted RevPAR 1 STR US Seasonally Adjusted Real Revenue Per Available Room |
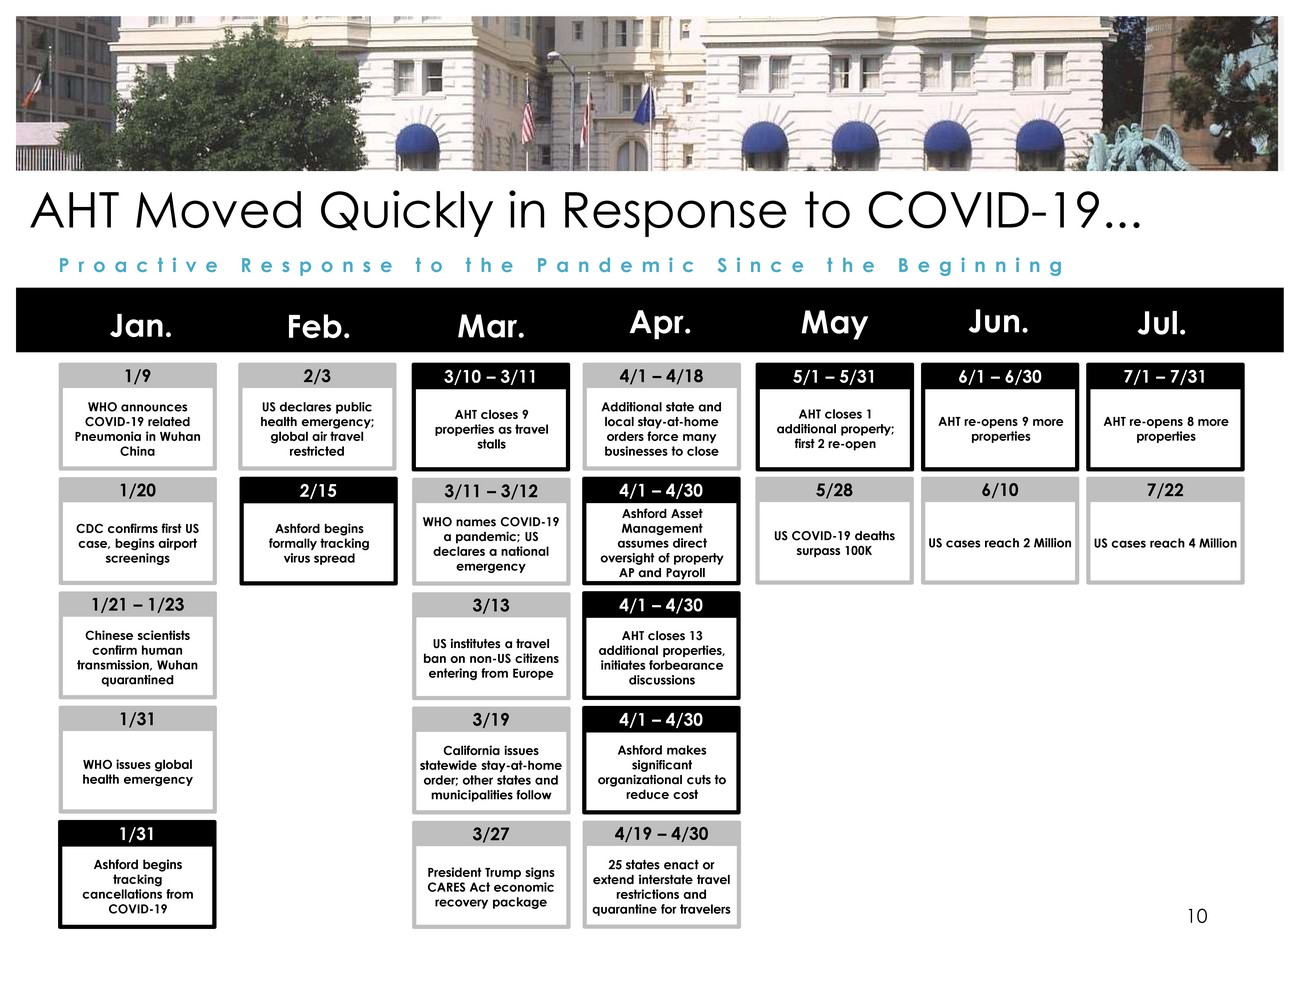 | AHT Moved Quickly in Response to COVID-19... P r o a c t i v eR e s p o n s et ot h eP a n d e m i cS i n c et h eB e g i n n i n g 4/1 – 4/18 Additional state and local stay-at-home orders force many businesses to close 4/1 – 4/30 Ashford Asset Management assumes direct oversight of property AP and Payroll 4/1 – 4/30 AHT closes 13 additional properties, initiates forbearance discussions 4/1 – 4/30 Ashford makes significant organizational cuts to reduce cost 4/19 – 4/30 25 states enact or extend interstate travel restrictions and quarantine for travelers 3/10 – 3/11 AHT closes 9 properties as travel stalls 3/11 – 3/12 WHO names COVID-19 a pandemic; US declares a national emergency 3/13 US institutes a travel ban on non-US citizens entering from Europe 3/19 California issues statewide stay-at-home order; other states and municipalities follow 3/27 President Trump signs CARES Act economic recovery package 5/1 – 5/31 AHT closes 1 additional property; first 2 re-open 5/28 US COVID-19 deaths surpass 100K 6/1 – 6/30 AHT re-opens 9 more properties 6/10 US cases reach 2 Million 7/1 – 7/31 AHT re-opens 8 more properties 7/22 US cases reach 4 Million 2/3 US declares public health emergency; global air travel restricted 2/15 Ashford begins formally tracking virus spread |
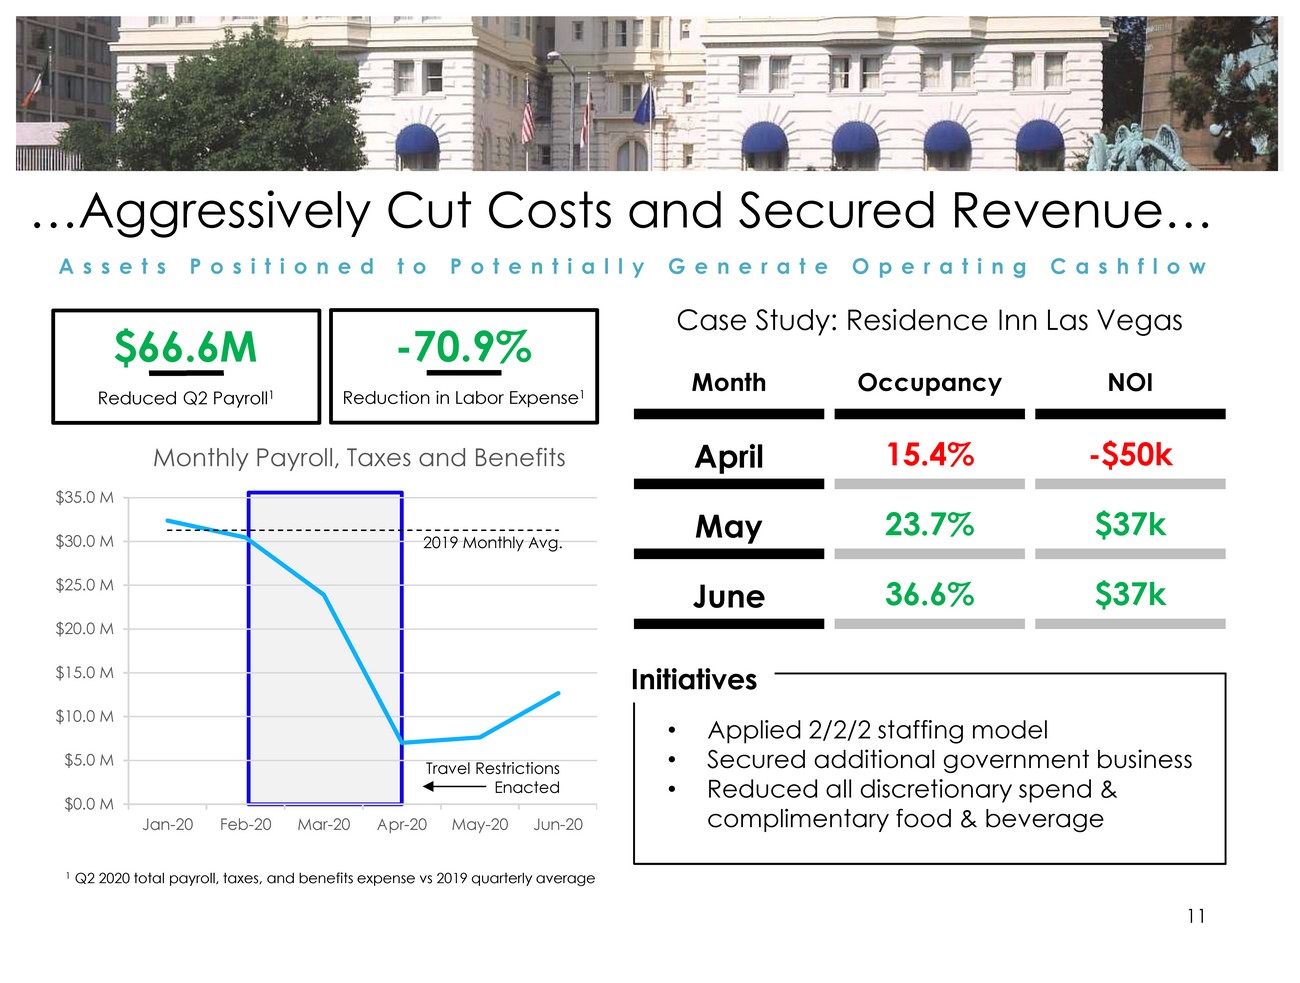 | …Aggressively Cut Costs and Secured Revenue… A s s e t s P o s i t i o n e dt oP o t e n t i a l l y G e n e r a t eO p e r a t i n gC a s h f l o w $66.6M Reduced Q2 Payroll1 -70.9% Reduction in Labor Expense1 Case Study: Residence Inn Las Vegas Month Occupancy NOI Monthly Payroll, Taxes and Benefits April 15.4% -$50k $35.0 M $30.0 M $25.0 M $20.0 M $15.0 M $10.0 M 2019 Monthly Avg. May June Initiatives 23.7% 36.6% $37k $37k $5.0 M $0.0 M Travel Restrictions Enacted Jan-20Feb-20Mar-20Apr-20May-20Jun-20 •Applied 2/2/2 staffing model •Secured additional government business •Reduced all discretionary spend & complimentary food & beverage 1 Q2 2020 total payroll, taxes, and benefits expense vs 2019 quarterly average 11 |
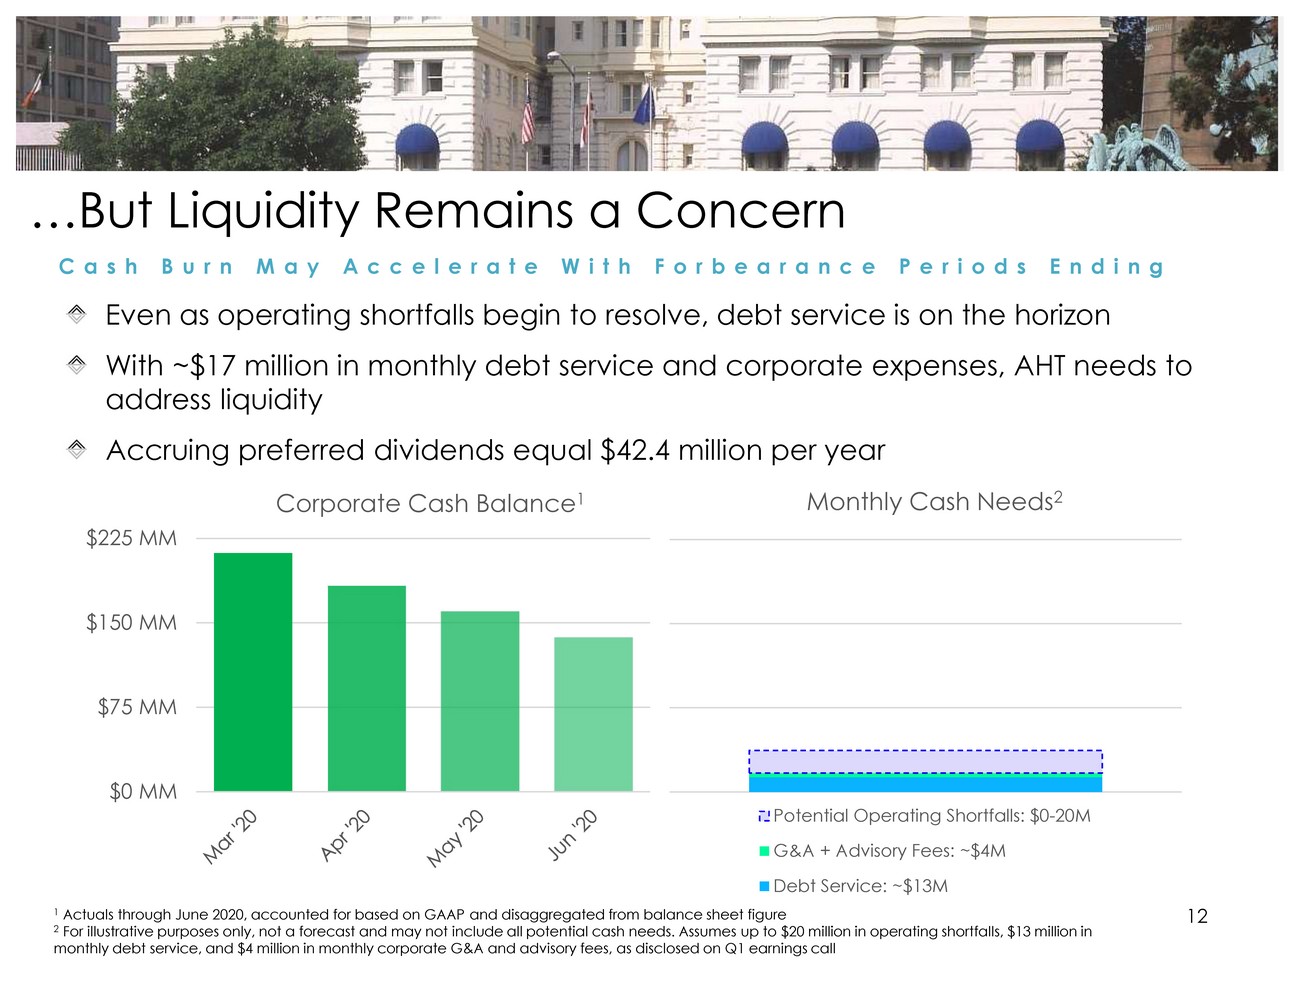 | …But Liquidity Remains a Concern C a s h B u r n M a y A c c e l e r a t eW i t h F o r b e a r a n c eP e r i o d s E n d i n g Even as operating shortfalls begin to resolve, debt service is on the horizon With ~$17 million in monthly debt service and corporate expenses, AHT needs to address liquidity Accruing preferred dividends equal $42.4 million per year $225 MM Corporate Cash Balance1 Monthly Cash Needs2 $150 MM $75 MM $0 MM Potential Operating Shortfalls: $0-20M G&A + Advisory Fees: ~$4M Debt Service: ~$13M 1 Actuals through June 2020, accounted for based on GAAP and disaggregated from balance sheet figure12 2 For illustrative purposes only, not a forecast and may not include all potential cash needs. Assumes up to $20 million in operating shortfalls, $13 million in monthly debt service, and $4 million in monthly corporate G&A and advisory fees, as disclosed on Q1 earnings call |
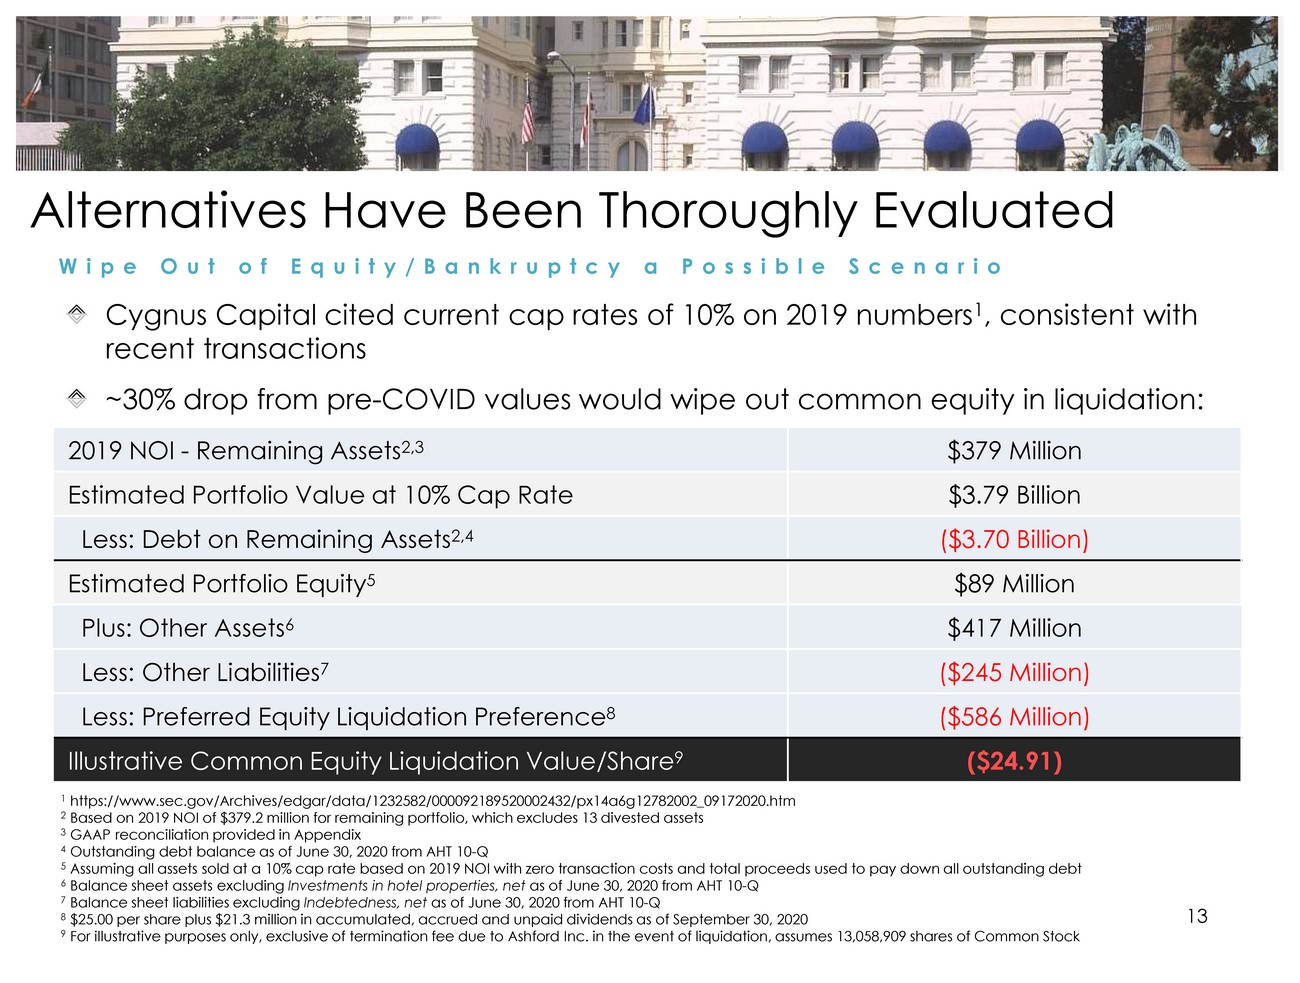 | Alternatives Have Been Thoroughly Evaluated W i p e O u t o fE q u i t y / B a n k r u p t c y aP o s s i b l eS c e n a r i o Cygnus Capital cited current cap rates of 10% on 2019 numbers1, consistent with recent transactions ~30% drop from pre-COVID values would wipe out common equity in liquidation: 2019 NOI - Remaining Assets2,3$379 Million Estimated Portfolio Value at 10% Cap Rate $3.79 Billion Less: Debt on Remaining Assets2,4($3.70 Billion) Estimated Portfolio Equity5$89 Million Plus: Other Assets6 $417 Million Less: Other Liabilities7($245 Million) Less: Preferred Equity Liquidation Preference8($586 Million) Illustrative Common Equity Liquidation Value/Share9 ($24.91) 1 https://www.sec.gov/Archives/edgar/data/1232582/000092189520002432/px14a6g12782002_09172020.htm 2 Based on 2019 NOI of $379.2 million for remaining portfolio, which excludes 13 divested assets 3 GAAP reconciliation provided in Appendix 4 Outstanding debt balance as of June 30, 2020 from AHT 10-Q 5 Assuming all assets sold at a 10% cap rate based on 2019 NOI with zero transaction costs and total proceeds used to pay down all outstanding debt 6 Balance sheet assets excluding Investments in hotel properties, net as of June 30, 2020 from AHT 10-Q 7 Balance sheet liabilities excluding Indebtedness, net as of June 30, 2020 from AHT 10-Q 8 $25.00 per share plus $21.3 million in accumulated, accrued and unpaid dividends as of September 30, 2020 13 9 For illustrative purposes only, exclusive of termination fee due to Ashford Inc. in the event of liquidation, assumes 13,058,909 shares of Common Stock |
 | The Best Course of Action is Recapitalization S u r v i v i n gt oS e et h eR e c o v e r y W i l lL i k e l y M a x i m i z eV a l u e If NOI recovers and portfolio cap rates improve from 10% to 7% over the next 3-4 years, more than $1.6 billion in value could be recovered on remaining assets1 To unlock this value for stakeholders, the company must remain solvent throughout the recovery and avoid bankruptcy There is a substantial doubt about AHT's ability to continue as a going concern and the Exchange Offers are an important part of the efforts to address that Common shares currently trade at option value, inhibiting the company’s ability to grow and access capital Successful completion of the Exchange Offers should boost AHT’s common equity market cap, while likely providing intrinsic value to common shares A larger common equity base with real value should help AHT to efficiently access capital and remain solvent until depressed asset values fully recover Failure to complete the Exchange Offers could further imperil the value of common shares 14 1 Based on 2019 NOI of $379.2 million, which excludes 13 divested assets. GAAP reconciliation provided in Appendix. |
 | Common Shareholder Approval Required F o rt h eP r e f e r r e dE q u i t y E x c h a n g e t oP r o c e e d Company is soliciting common shareholder approval to issue new shares of Common Stock required to proceed with the Preferred Exchange Offers1 Company is also soliciting consents to reclassify and convert any non-tendered shares of Preferred Stock into 1.74 shares of newly-issued Common Stock1 Key Terms of Preferred Equity Exchange Offers2: For all issued and outstanding shares of Series D, F, G, H and I Preferred Stock Preferred holders may elect to exchange each share of Preferred Stock for: 5.58 shares of newly-issued Common Stock (“Stock Option”) – or – $7.75 in cash (“Cash Option”) Total consideration will not exceed 126,048,813 common shares and $30M cash 1 For full details of the common stock shareholder approval requested, see proxy statement filed on Schedule 14A and amendments and additional proxy materials thereto filed with the Securities and Exchange Commission at www.sec.gov 2 For full details regarding the Exchange Offer, see registration statement on Form S-4 and amendments thereto filed with the Securities and Exchange Commission at www.sec.gov15 |
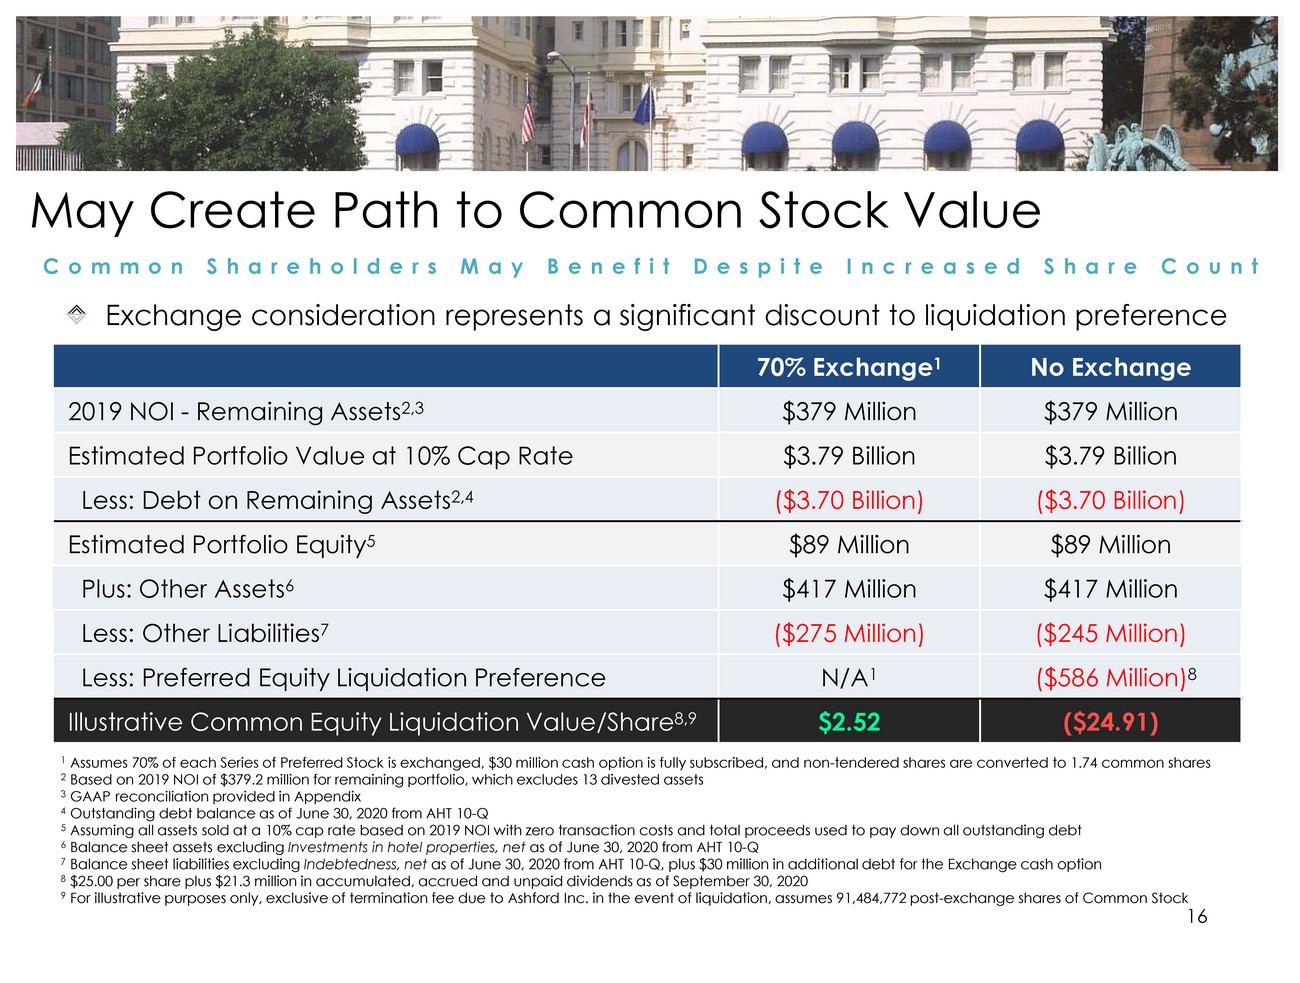 | May Create Path to Common Stock Value C o m m o n S h a r e h o l d e r s M a y B e n e f i t D e s p i t eI n c r e a s e dS h a r eC o u n t Exchange consideration represents a significant discount to liquidation preference 1 Assumes 70% of each Series of Preferred Stock is exchanged, $30 million cash option is fully subscribed, and non-tendered shares are converted to 1.74 common shares 2 Based on 2019 NOI of $379.2 million for remaining portfolio, which excludes 13 divested assets 3 GAAP reconciliation provided in Appendix 4 Outstanding debt balance as of June 30, 2020 from AHT 10-Q 5 Assuming all assets sold at a 10% cap rate based on 2019 NOI with zero transaction costs and total proceeds used to pay down all outstanding debt 6 Balance sheet assets excluding Investments in hotel properties, net as of June 30, 2020 from AHT 10-Q 7 Balance sheet liabilities excluding Indebtedness, net as of June 30, 2020 from AHT 10-Q, plus $30 million in additional debt for the Exchange cash option 8 $25.00 per share plus $21.3 million in accumulated, accrued and unpaid dividends as of September 30, 2020 9 For illustrative purposes only, exclusive of termination fee due to Ashford Inc. in the event of liquidation, assumes 91,484,772 post-exchange shares of Common Stock |
 | Vote FOR Both Proposals in the Proxy T oE n a b l et h eP r e f e r r e dE x c h a n g e O f f e r s t oP r o c e e d If shareholders APPROVE the proposals: xPreferred Exchanges can proceed, creating a path to value for Common Stock xLarger equity base may permit easier, more efficient access to capital xDeleveraged company better positioned to weather the impact of COVID-19 xContinued solvency allows participation in expected long-term recovery If shareholders REJECT the proposals: ×Preferred Exchanges cannot proceed; growing obligation stifles common value ×Difficult to access attractive capital to remain solvent and pursue growth ×Company may become insolvent, preventing participation in long-term recovery ×Liquidation or bankruptcy could result in zero recovery for common shareholders |
 | Appendix Clearing Up the Facts Non-GAAP Reconciliation |
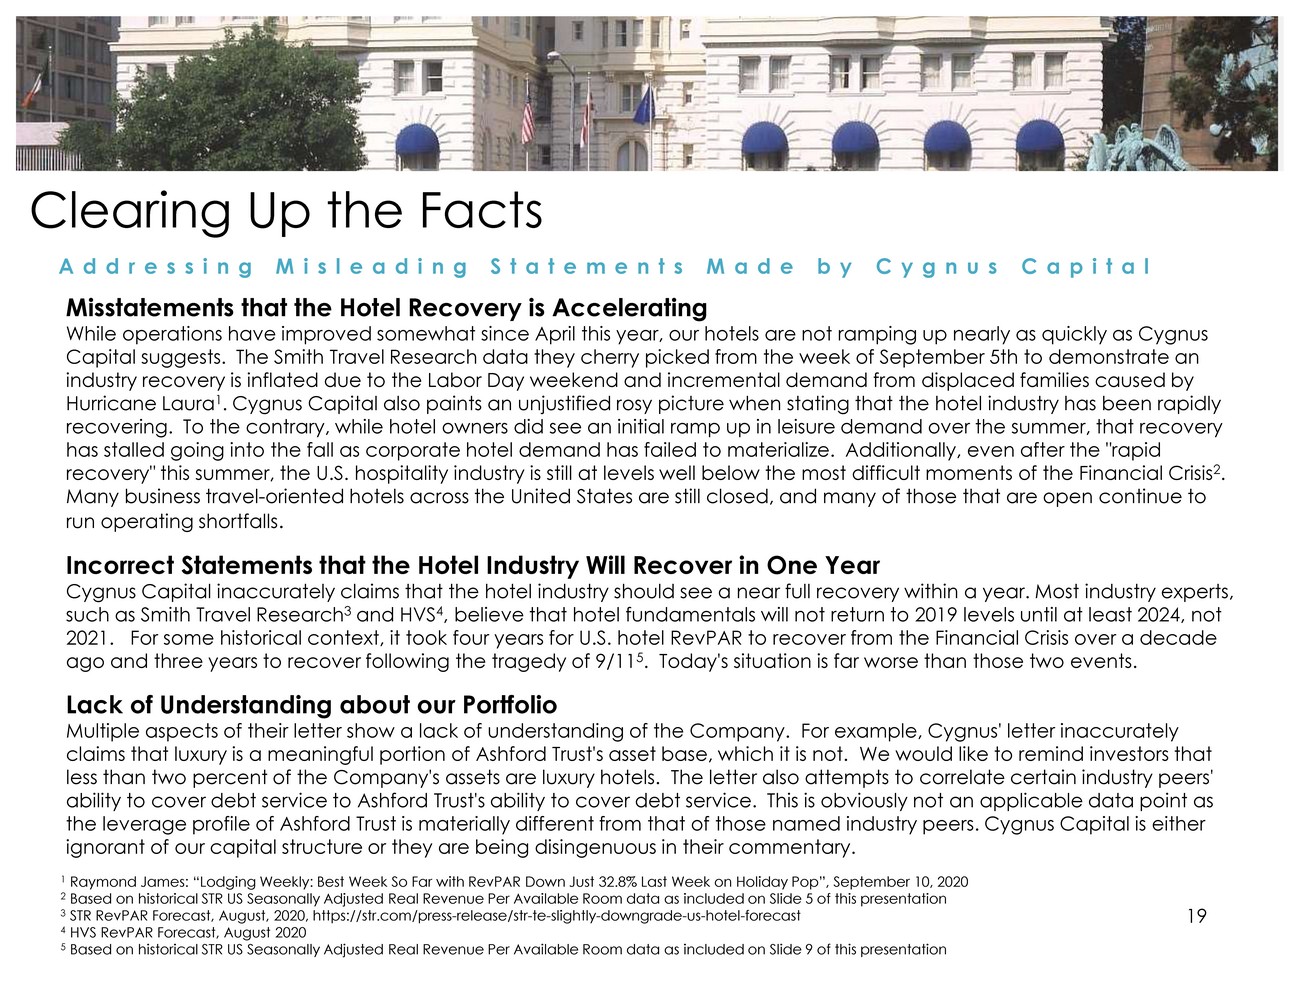 | Clearing Up the Facts A d d r e s s i n gM i s l e a d i n gS t a t e m e n t s M a d e b y C y g n u s C a p i t a l Misstatements that the Hotel Recovery is Accelerating While operations have improved somewhat since April this year, our hotels are not ramping up nearly as quickly as Cygnus Capital suggests. The Smith Travel Research data they cherry picked from the week of September 5th to demonstrate an industry recovery is inflated due to the Labor Day weekend and incremental demand from displaced families caused by Hurricane Laura1. Cygnus Capital also paints an unjustified rosy picture when stating that the hotel industry has been rapidly recovering. To the contrary, while hotel owners did see an initial ramp up in leisure demand over the summer, that recovery has stalled going into the fall as corporate hotel demand has failed to materialize. Additionally, even after the "rapid recovery" this summer, the U.S. hospitality industry is still at levels well below the most difficult moments of the Financial Crisis2. Many business travel-oriented hotels across the United States are still closed, and many of those that are open continue to run operating shortfalls. Incorrect Statements that the Hotel Industry Will Recover in One Year Cygnus Capital inaccurately claims that the hotel industry should see a near full recovery within a year. Most industry experts, such as Smith Travel Research3 and HVS4, believe that hotel fundamentals will not return to 2019 levels until at least 2024, not 2021. For some historical context, it took four years for U.S. hotel RevPAR to recover from the Financial Crisis over a decade ago and three years to recover following the tragedy of 9/115. Today's situation is far worse than those two events. Lack of Understanding about our Portfolio Multiple aspects of their letter show a lack of understanding of the Company. For example, Cygnus' letter inaccurately claims that luxury is a meaningful portion of Ashford Trust's asset base, which it is not. We would like to remind investors that less than two percent of the Company's assets are luxury hotels. The letter also attempts to correlate certain industry peers' ability to cover debt service to Ashford Trust's ability to cover debt service. This is obviously not an applicable data point as the leverage profile of Ashford Trust is materially different from that of those named industry peers. Cygnus Capital is either ignorant of our capital structure or they are being disingenuous in their commentary. 1 Raymond James: “Lodging Weekly: Best Week So Far with RevPAR Down Just 32.8% Last Week on Holiday Pop”, September 10, 2020 2 Based on historical STR US Seasonally Adjusted Real Revenue Per Available Room data as included on Slide 5 of this presentation 3 STR RevPAR Forecast, August, 2020, https://str.com/press-release/str-te-slightly-downgrade-us-hotel-forecast19 4 HVS RevPAR Forecast, August 2020 5 Based on historical STR US Seasonally Adjusted Real Revenue Per Available Room data as included on Slide 9 of this presentation |
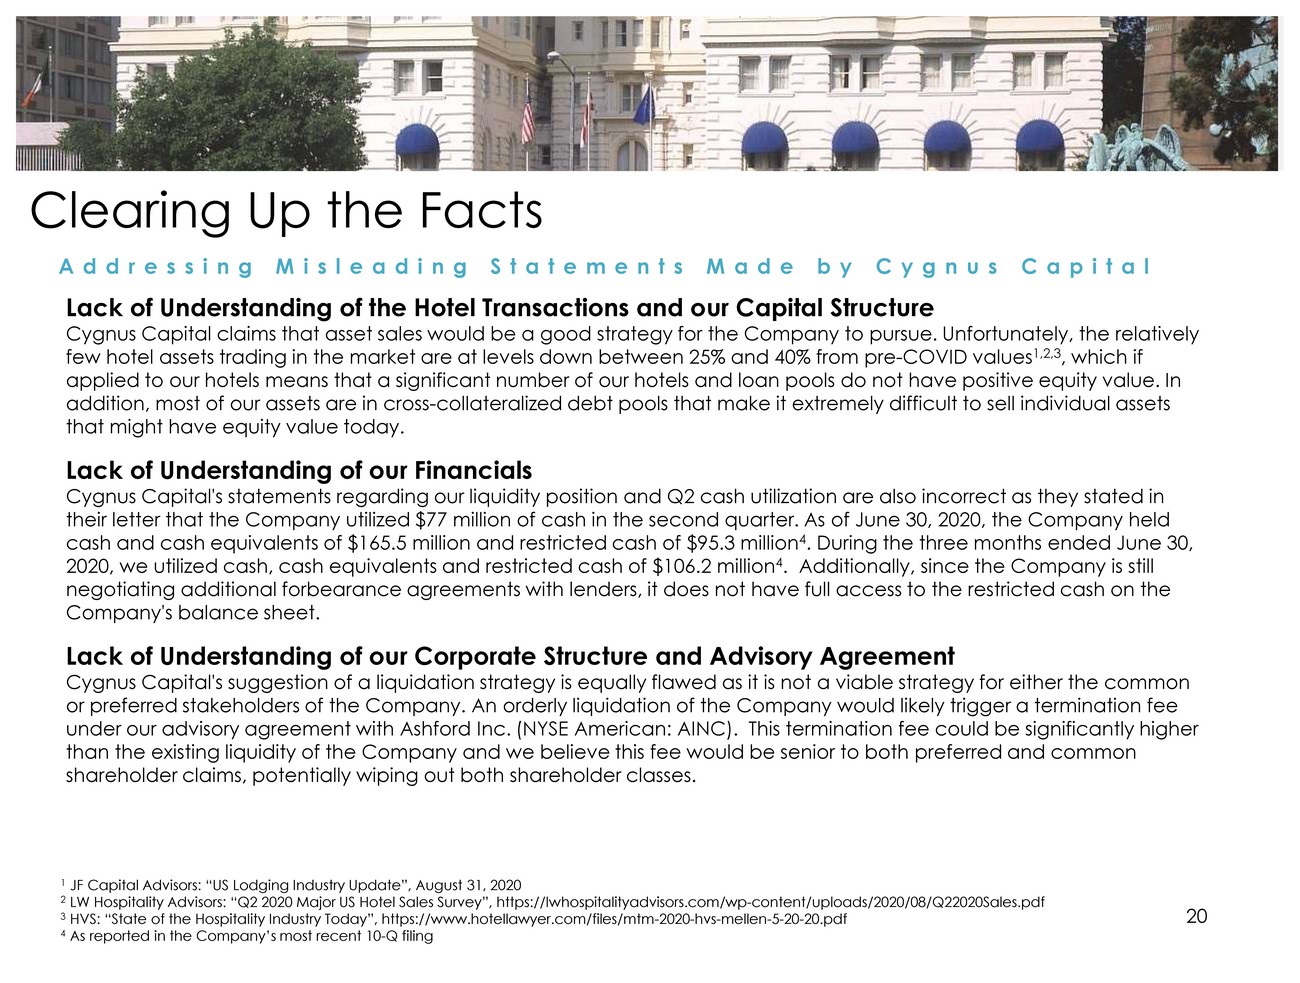 | Clearing Up the Facts A d d r e s s i n gM i s l e a d i n gS t a t e m e n t s M a d e b y C y g n u s C a p i t a l Lack of Understanding of the Hotel Transactions and our Capital Structure Cygnus Capital claims that asset sales would be a good strategy for the Company to pursue. Unfortunately, the relatively few hotel assets trading in the market are at levels down between 25% and 40% from pre-COVID values1,2,3, which if applied to our hotels means that a significant number of our hotels and loan pools do not have positive equity value. In addition, most of our assets are in cross-collateralized debt pools that make it extremely difficult to sell individual assets that might have equity value today. Lack of Understanding of our Financials Cygnus Capital's statements regarding our liquidity position and Q2 cash utilization are also incorrect as they stated in their letter that the Company utilized $77 million of cash in the second quarter. As of June 30, 2020, the Company held cash and cash equivalents of $165.5 million and restricted cash of $95.3 million4. During the three months ended June 30, 2020, we utilized cash, cash equivalents and restricted cash of $106.2 million4. Additionally, since the Company is still negotiating additional forbearance agreements with lenders, it does not have full access to the restricted cash on the Company's balance sheet. Lack of Understanding of our Corporate Structure and Advisory Agreement Cygnus Capital's suggestion of a liquidation strategy is equally flawed as it is not a viable strategy for either the common or preferred stakeholders of the Company. An orderly liquidation of the Company would likely trigger a termination fee under our advisory agreement with Ashford Inc. (NYSE American: AINC). This termination fee could be significantly higher than the existing liquidity of the Company and we believe this fee would be senior to both preferred and common shareholder claims, potentially wiping out both shareholder classes. 1 JF Capital Advisors: “US Lodging Industry Update”, August 31, 2020 2 LW Hospitality Advisors: “Q2 2020 Major US Hotel Sales Survey”, https://lwhospitalityadvisors.com/wp-content/uploads/2020/08/Q22020Sales.pdf 3 HVS: “State of the Hospitality Industry Today”, https://www.hotellawyer.com/files/mtm-2020-hvs-mellen-5-20-20.pdf20 4 As reported in the Company’s most recent 10-Q filing |
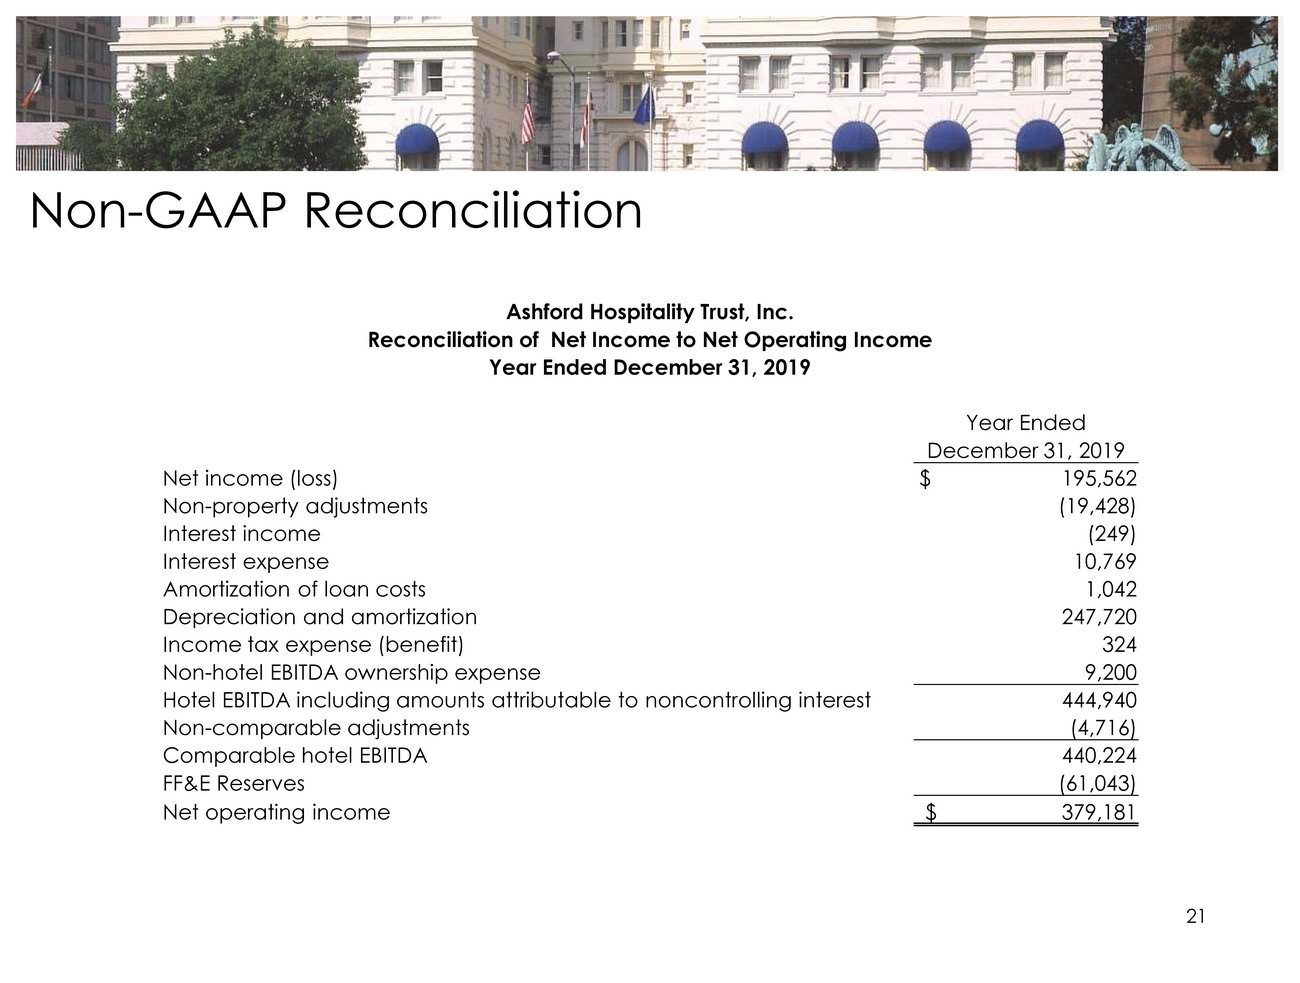 | Non-GAAP Reconciliation Ashford Hospitality Trust, Inc. Reconciliation of Net Income to Net Operating Income Year Ended December 31, 2019 Year Ended December 31, 2019 21 |