Exhibit 99.1
Company Presentation
ALIS Conference January 2012
Safe Harbor
In keeping with the SEC’s “Safe Harbor” guidelines, certain statements made during this presentation could be considered forward-looking and subject to certain risks and uncertainties that could cause results to differ materially from those projected. When we use the words “will likely result,” “may,” “anticipate,” “estimate,” “should,” “expect,” “believe,” “intend,” or similar expressions, we intend to identify forward-looking statements. Such forward-looking statements include, but are not limited to, our business and investment strategy, our understanding of our competition, current market trends and opportunities, projected operating results, and projected capital expenditures.
These forward-looking statements are subject to known and unknown risks and uncertainties, which could cause actual results to differ materially from those anticipated including, without limitation: general volatility of the capital markets and the market price of our common stock; changes in our business or investment strategy; availability, terms and deployment of capital; availability of qualified personnel; changes in our industry and the market in which we operate, interest rates or the general economy, and the degree and nature of our competition. These and other risk factors are more fully discussed in the Company’s filings with the Securities and Exchange Commission.
EBITDA is defined as net income before interest, taxes, depreciation and amortization. EBITDA yield is defined as trailing twelve month EBITDA divided by the purchase price. EBITDA, FFO, AFFO, CAD and other terms are non-GAAP measures, reconciliations of which have been provided in prior earnings releases and filings with the SEC.
This overview is for informational purposes only and is not an offer to sell, or a solicitation of an offer to buy or sell, any securities of Ashford Hospitality Trust, Inc. and may not be relied upon in connection with the purchase or sale of any such security.
2
Ashford Overview
• Ashford Highlights
• High-quality, Focused Portfolio
• Attractive Industry Fundamentals
• Consistent Earnings Growth / Outperformance
• Attractive, Well-covered Dividend
• Highland Operational Update
• High Insider Ownership
3
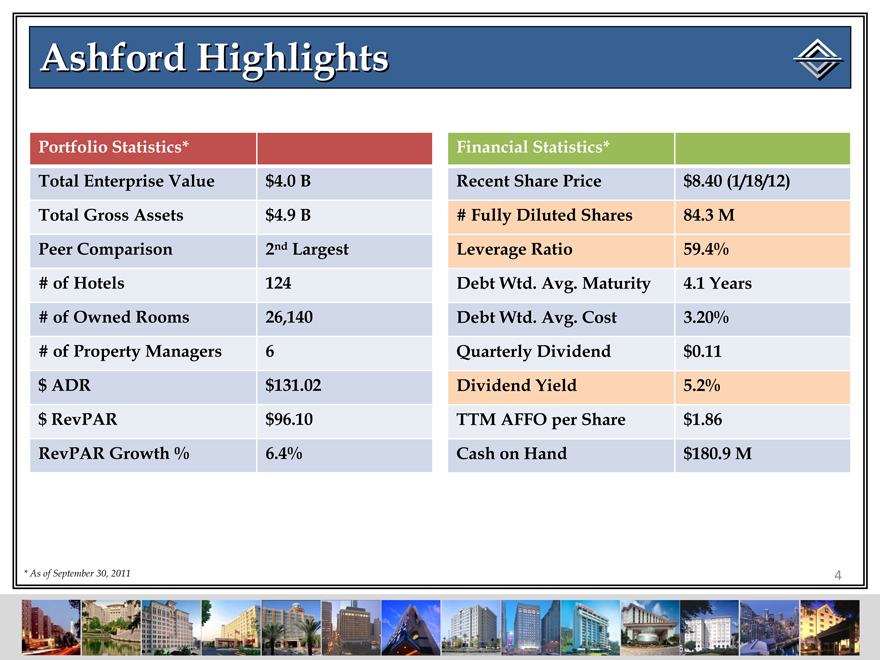
Ashford Highlights
Portfolio Statistics*
Total Enterprise Value $4.0 B
Total Gross Assets $4.9 B
Peer Comparison 2nd Largest
# of Hotels 124
# of Owned Rooms 26,140
# of Property Managers 6
$ ADR $131.02
$ RevPAR $96.10
RevPAR Growth % 6.4%
Financial Statistics*
Recent Share Price $8.40 (1/18/12)
# Fully Diluted Shares 84.3 M
Leverage Ratio 59.4%
Debt Wtd. Avg. Maturity 4.1 Years
Debt Wtd. Avg. Cost 3.20%
Quarterly Dividend $0.11
Dividend Yield 5.2%
TTM AFFO per Share $1.86
Cash on Hand $180.9 M
4
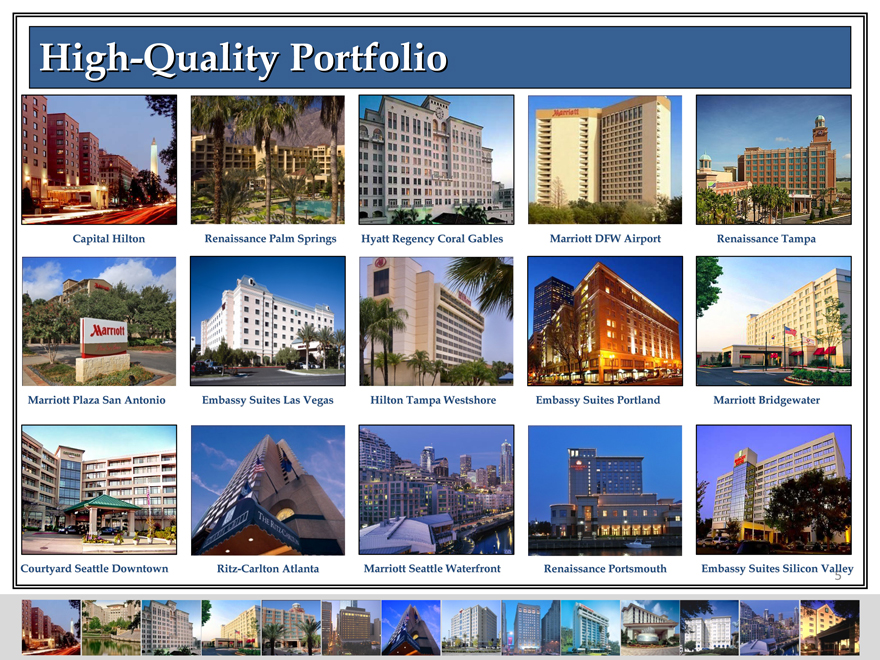
High –Quality Portfolio
Capital Hilton
Renaissance Palm Springs
Hyatt Regency Coral Gables
Marriott DFW Airport
Renaissance Tampa
Marriott Plaza San Antonio
Embassy Suites Las Vegas
Hilton Tampa Westshore
Embassy Suites Portland
Marriott Bridgewater
Courtyard Seattle Downtown
Ritz-Carlton Atlanta
Marriott Seattle Waterfront
Renaissance Portsmouth
Embassy Suites Silicon Valley
5
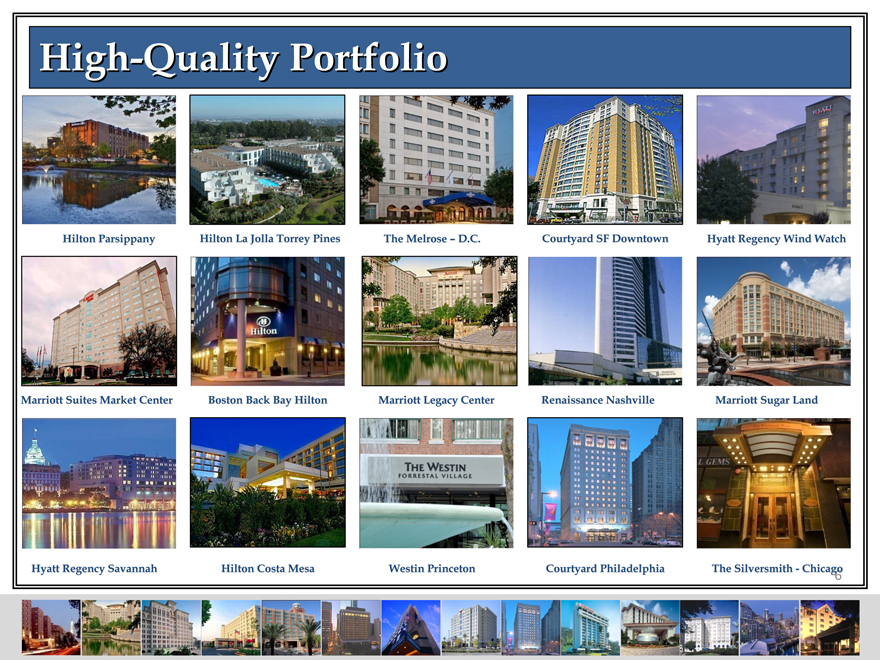
High –Quality Portfolio
Hilton Parsippany
Hilton La Jolla Torrey Pines
The Melrose – D.C.
Courtyard SF Downtown
Hyatt Regency Wind Watch
Marriott Suites Market Center
Boston Back Bay Hilton
Marriott Legacy Center
Renaissance Nashville
Marriott Sugar Land
Hyatt Regency Savannah
Hilton Costa Mesa
Westin Princeton
Courtyard Philadelphia
The Silversmith – Chicago
6
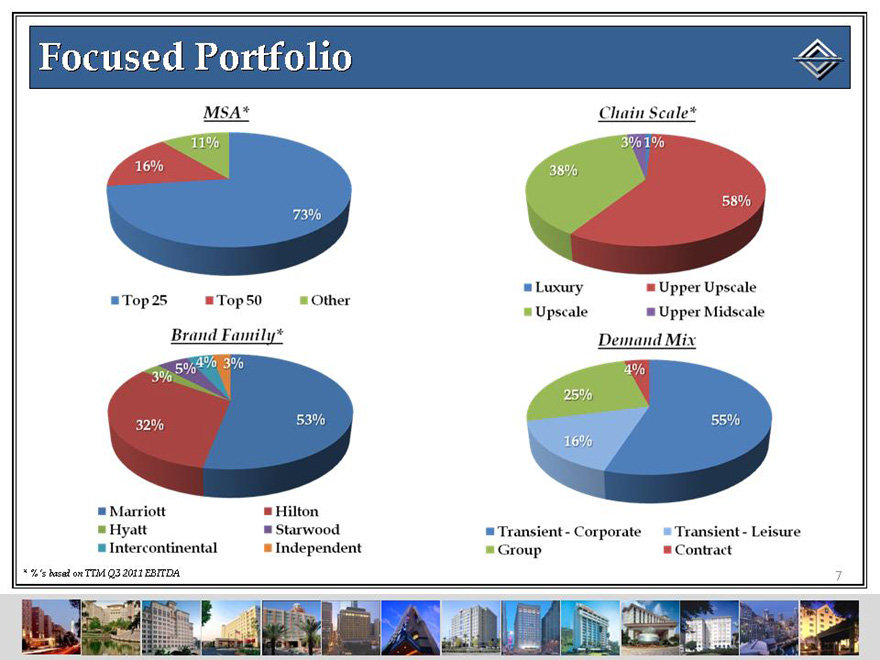
Focused Portfolio
MSA*
11%
16%
73%
Top 25
Top 50
Other
Chain Scale*
3%1%
38%
58%
Luxury
Upper Upscale
Upscale
Upper Midscale
Brand Family*
30%
5%
4%
3%
32%
53%
Marriot
Hilton
Hyatt
Starwood
International
Independent
Demand Mix
4%
25%
16%
55%
Transient-Corporate
Group
Transient-Leisure
Contract
* %’s based on TTM Q3 2011 EBITDA
7
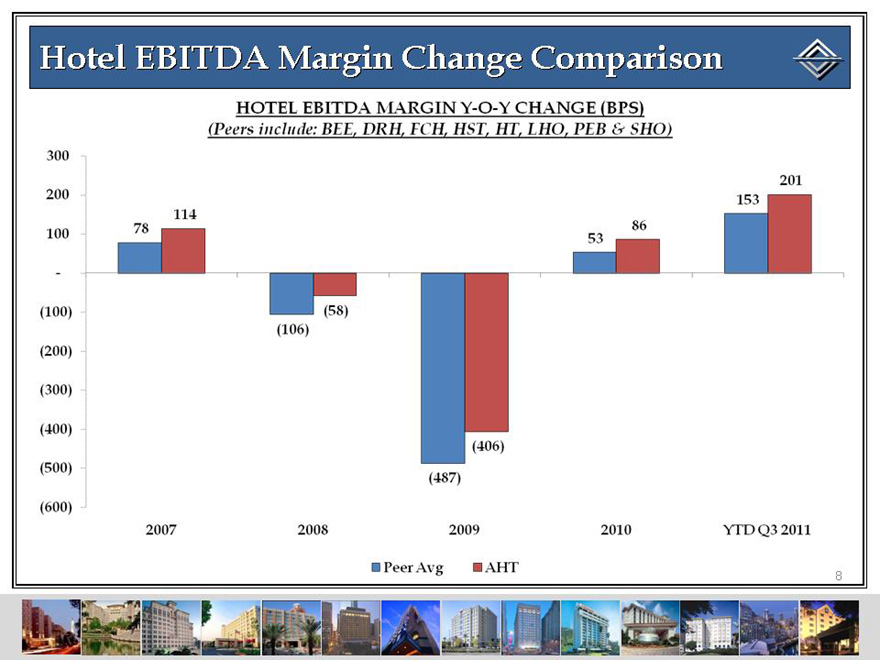
Hotel EBITDA Margin Change Comparison
HOTEL EBITDA MARGIN Y-O-Y CHANGE (BPS)
(Peers include: BEE, DRH, FCH, HST, HT, LHO, PEB & SHO)
300
200
100
-
(100)
(200)
(300)
(400)
(500)
(600)
78
114
(106)
(58)
(487)
(406)
53
86
153
201
2007
2008
2009
2010
YTD Q3 2011
Peer Avg
AHT
8
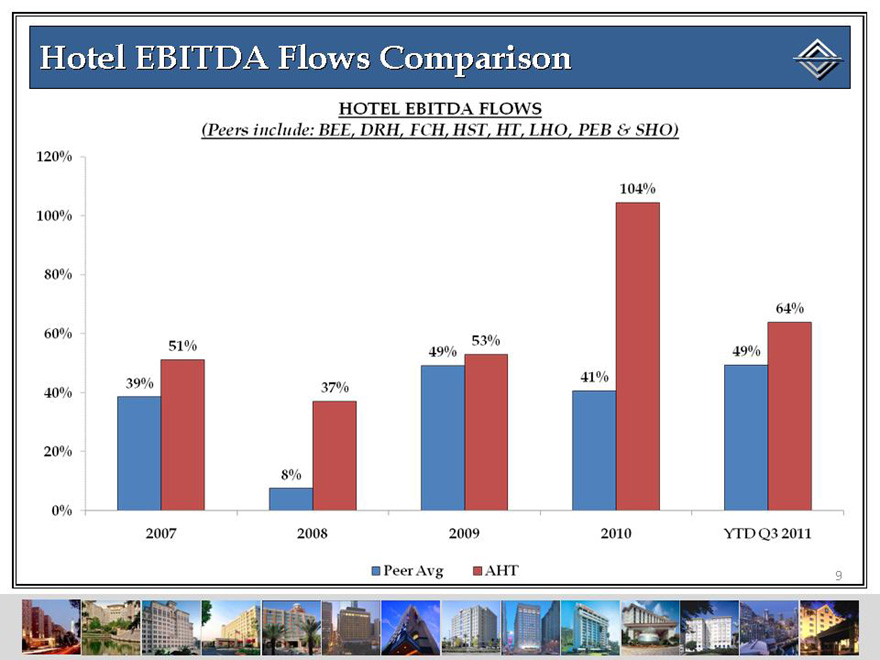
Hotel EBITDA Flows Comparison
HOTEL EBITDA FLOWS
(Peers include: BEE, DRH, FCH, HST, HT, LHO, PEB & SHO)
120%
100%
80%
60$
40%
20%
0%
39$
51%
8%
37%
49%
53%
41%
104%
49%
64%
2007
2008
2009
2010
YTD Q3 2011
Peer Avg
AHT
9
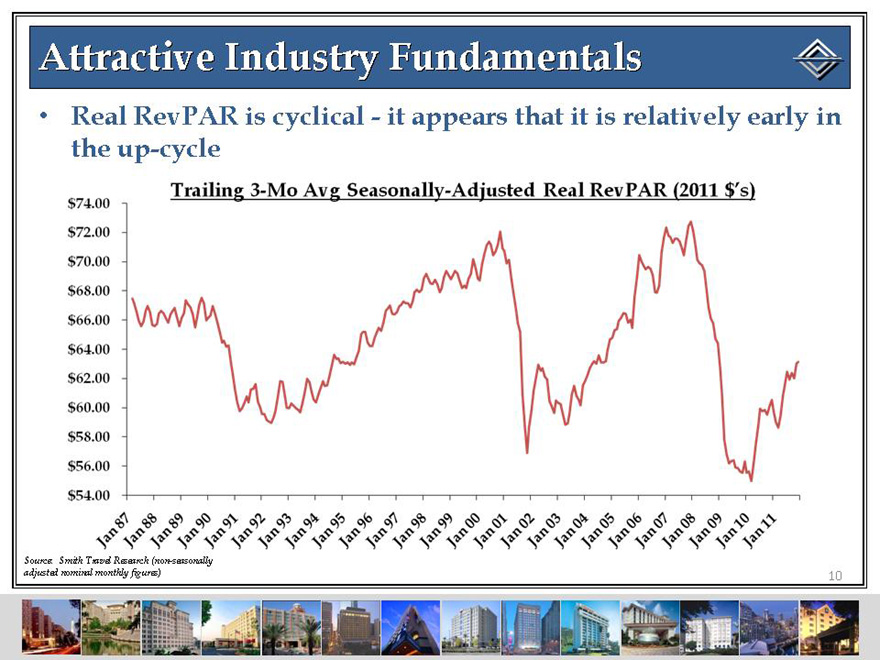
Attractive Industry Fundamentals
• Real RevPAR is cyclical—it appears that it is relatively early in the up-cycle
Trailing 3-Mo Avg Seasonally-Adjusted Real RevPAR (2011 $’s)
$74.00
$72.00
$70.00
$68.00
$66.00
$64.00
$62.00
$60.00
$58.00
$56.00
$54.00
Jan 87
Jan 88
Jan 89
Jan 90
Jan 91
Jan 92
Jan 93
Jan 94
Jan 95
Jan 96
Jan 97
Jan 98
Jan 99
Jan 00
Jan 01
Jan 02
Jan 03
Jan 04
Jan 05
Jan 06
Jan 07
Jan 08
Jan 09
Jan 10
Jan 11
Source: Smith Travel Research (non-seasonally adjusted nominal monthly figures)
10

Attractive Industry Fundamentals
• RevPAR growth has remained consistently high despite economic uncertainties
Trainling 28-Day U.S. RevPAR % Change
12.0%
10.0%
8.0%
6.0%
4.0%
2.0%
0.0%
1/1/2011
1/29/2011
2/26/2011
3/26/2011
4/23/2011
5/21/2011
6/18/2011
7/16/2011
8/13/2011
9/10/2011
10/8/2011
11/5/2011
12/3/2011
12/31/2011
Week Ended
Source: Smith Travel Research
11
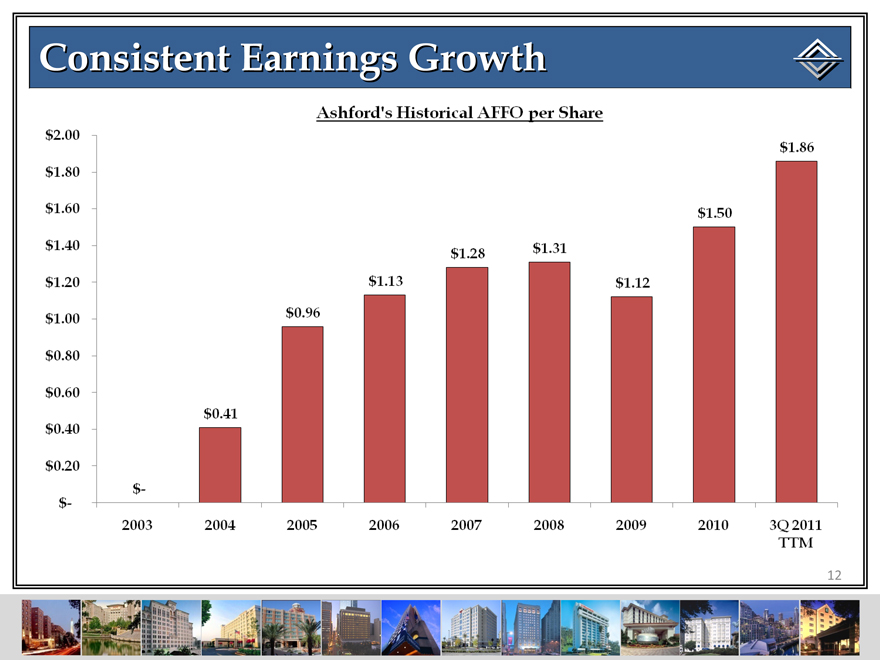
Consistent Earnings Growth
Ashford’s Historical AFFO per Share
$2.00
$1.80
$1.60
$1.40
$1.20
$1.00
$0.80
$0.60
$0.40
$0.20
$-
$-
$0.41
$0.96
$1.13
$1.28
$1.31
$1.12
$1.50
$1.86
2003
2004
2005
2006
2007
2008
2009
2010
3Q 2011 TTM
12
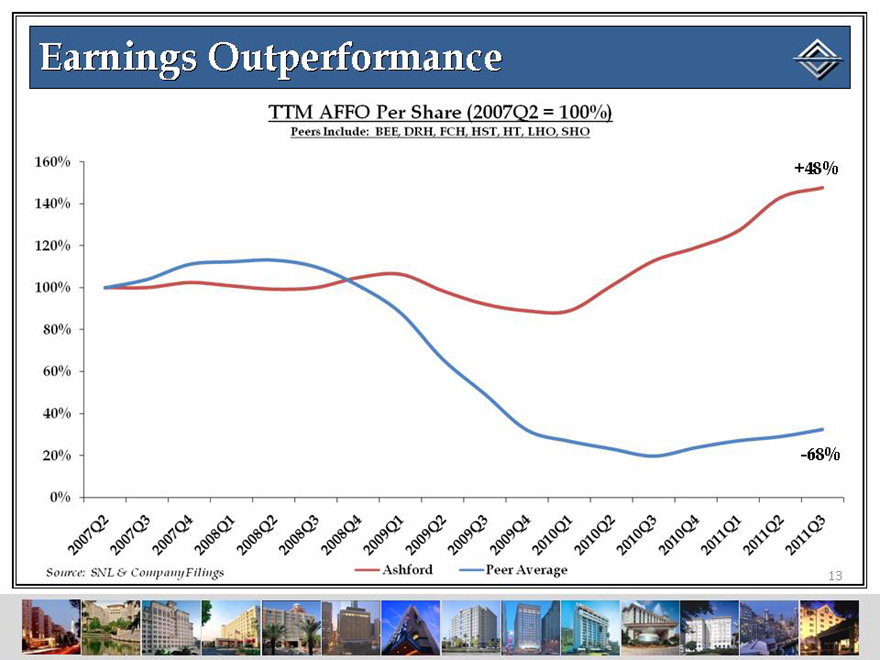
Earnings Outperformance
TTM AFFO Per Share (2007Q2 = 100%)
Peers Include: BEE, DRH, FCH, HST, HT, LHO, SHO
160%
140%
120%
100%
80%
60%
40%
20%
0%
+48%
-68%
2007Q2
2007Q3
2007Q4
2008Q1
2008Q2
2008Q3
2008Q4
2009Q1
2009Q2
2009Q3
2009Q4
2010Q1
2010Q2
2010Q3
2010Q4
2011Q1
2011Q2
2011Q3
Ashford
Peer Average
Source: SNL & Company Filings
13
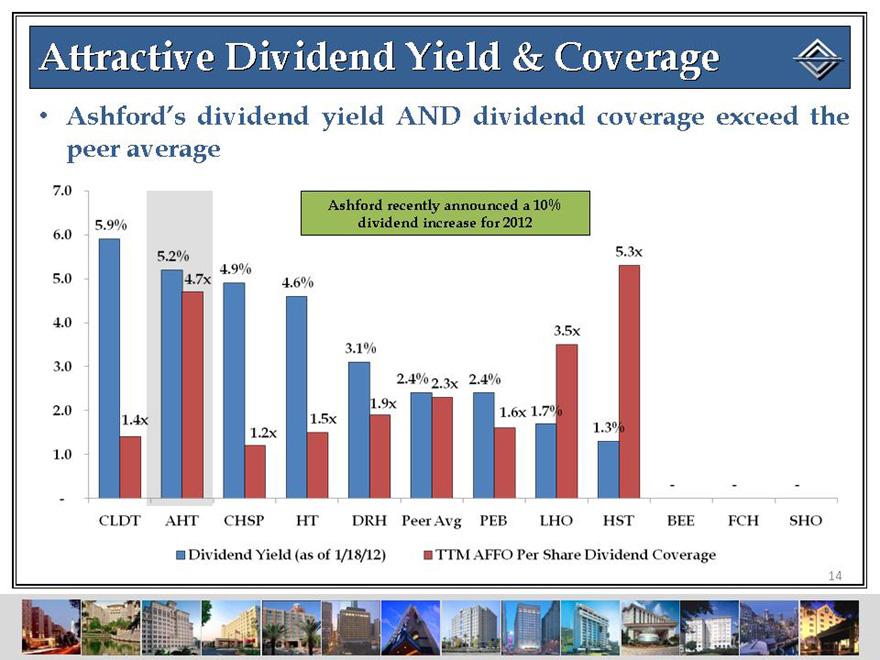
Attractive Dividend Yield & Coverage
• Ashford’s dividend yield AND dividend coverage exceed the peer average
Ashford recently announced a 10% dividend increase for 2012
7.0
6.0
5.0
4.0
3.0
2.0
1.0
-
5.9%
1.4x
5.2%
4.7x
4.9%
1.2x
4.6%
1.2x
4.6%
1.5x
3.1%
1.9x
2.4%
2.3x
2.4%
1.6x
1.7%
3.5x
1.3%
5.3x
CLDT
AHT
CHSP
HT
DRH
Peer Avg
PEB
LHO
HST
BEE
FCH
SHO
Dividend Yield (as of 1/18/12)
TTM AFFO per Share Dividend Coverage
14
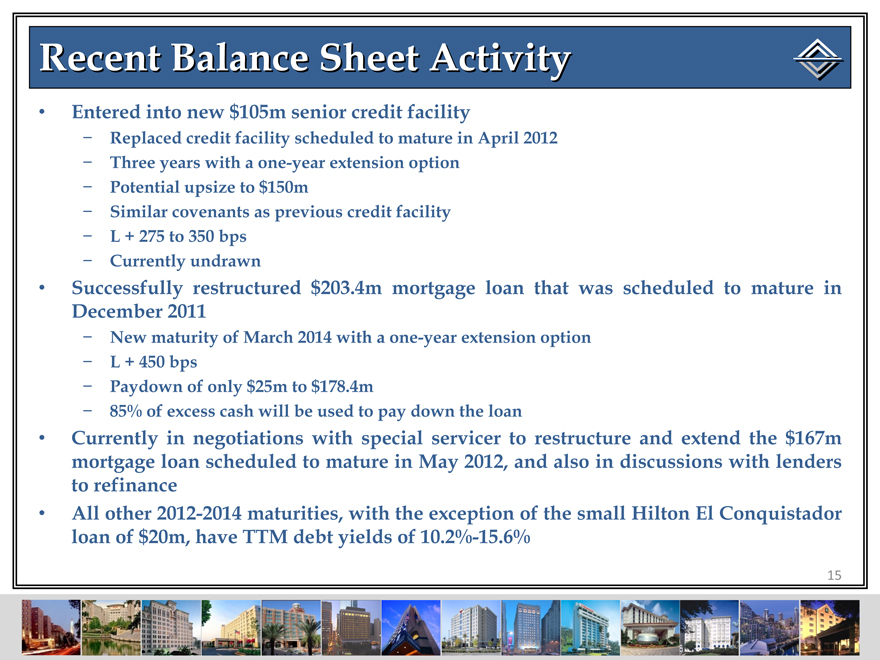
Recent Balance Sheet Activity
• Entered into new $105m senior credit facility
Replaced credit facility scheduled to mature in April 2012
Three years with a one-year extension option
Potential upsize to $150m
Similar covenants as previous credit facility
L + 275 to 350 bps
Currently undrawn
• Successfully restructured $203.4m mortgage loan that was scheduled to mature in December 2011
New maturity of March 2014 with a one-year extension option
L + 450 bps
Paydown of only $25m to $178.4m
85% of excess cash will be used to pay down the loan
• Currently in negotiations with special servicer to restructure and extend the $167m mortgage loan scheduled to mature in May 2012, and also in discussions with lenders to refinance
• All other 2012-2014 maturities, with the exception of the small Hilton El Conquistador loan of $20m, have TTM debt yields of 10.2%-15.6%
15
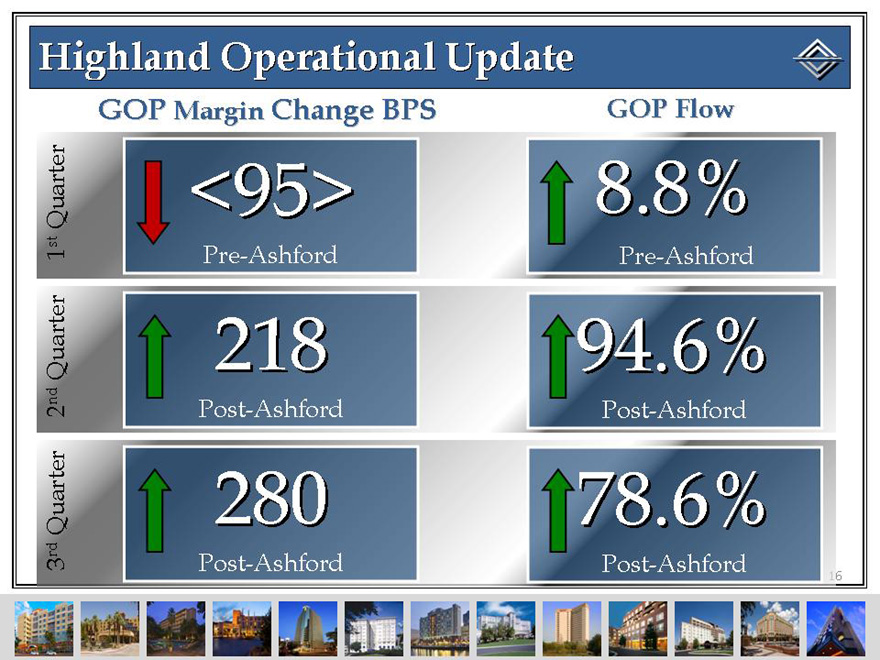
Highland Operational Update
GOP Margin Change BPS
GOP Flow
1st Quarter
2nd Quarter
3rd Quarter
<95>
Pre-Ashford
8.8%
Pre-Ashford
218
Post-Ashford
94.6%
Post-Ashford
280
Post-Ashford
78.6%
Post-Ashford
16
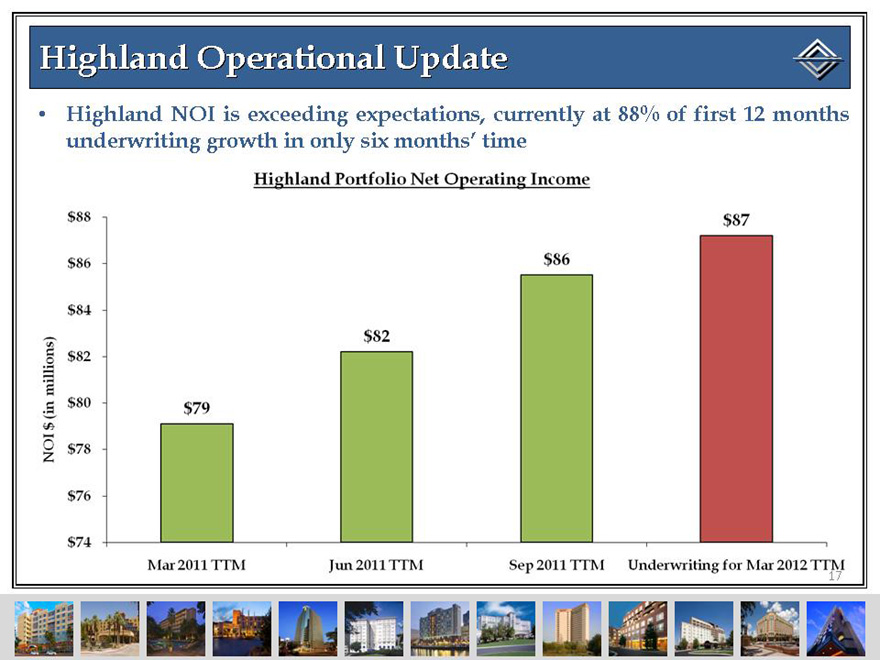
Highland Operational Update
• Highland NOI is exceeding expectations, currently at 88% of first 12 months underwriting growth in only six months’ time
Highland Portfolio Net Operating Income
$88
$86
$84
$82
$80
$78
$76
$74
$79
$82
$86
$87
Mar 2011 TTM
Jun 2011 TTM
Seq 2011 TTM
Underwriting for Mar 2012 TTM
NOI $ (in millions)
17
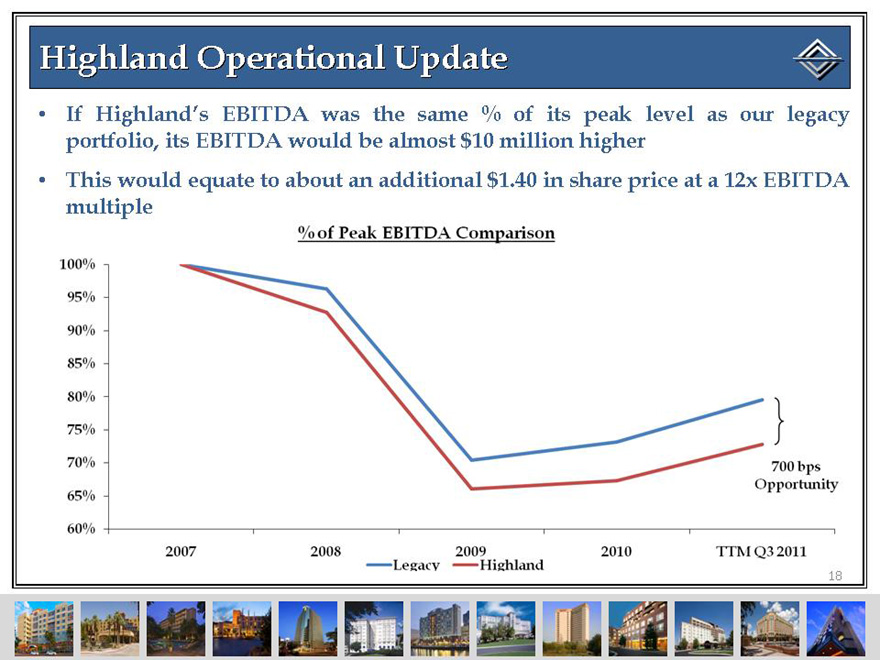
Highland Operational Update
• If Highland’s EBITDA was the same % of its peak level as our legacy portfolio, its EBITDA would be almost $10 million higher
• This would equate to about an additional $1.40 in share price at a 12x EBITDA multiple
% of Peak EBITDA Comparison
100%
95%
90%
85%
80%
75%
70%
65%
60%
700bps Opportunity
2007
2008
2009
2010
TTM Q3 2011
Legacy
Highland
18
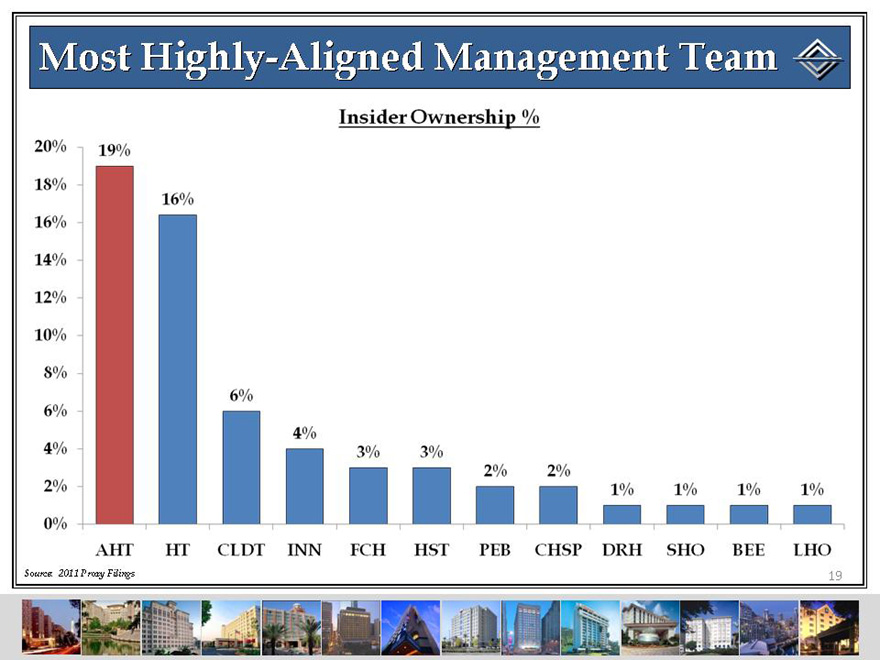
Most Highly-Aligned Management Team
Insider Ownership %
20%
18%
16%
14%
12%
10%
8%
6%
4%
2%
0%
19%
16%
6%
4%
3%
3%
2%
2%
1%
1%
1%
1%
AHT
HT
CLDT
INN
FCH
HST
PEB
CHSP
DRH
SHO
BEE
LHO
Source: 2011 Proxy Filings
19

Ashford Overview
• Ashford Highlights
• High-quality, Focused Portfolio
• Attractive Industry Fundamentals
• Consistent Earnings Growth / Outperformance
• Attractive, Well-covered Dividend
• Highland Operational Update
• High Insider Ownership
20

Company Presentation
ALIS Conference January 2012