
Safe Harbor In keeping with the SEC’s “Safe Harbor” guidelines, certain statements made during this presentation could be considered forward-looking and subject to certain risks and uncertainties that could cause results to differ materially from those projected. When we use the words “will likely result,” “may,” “anticipate,” “estimate,” “should,” “expect,” “believe,” “intend,” or similar expressions, we intend to identify forward-looking statements. Such forward-looking statements include, but are not limited to, our business and investment strategy, our understanding of our competition, current market trends and opportunities, projected operating results, and projected capital expenditures. These forward-looking statements are subject to known and unknown risks and uncertainties, which could cause actual results to differ materially from those anticipated including, without limitation: general volatility of the capital markets and the market price of our common stock; changes in our business or investment strategy; availability, terms and deployment of capital; availability of qualified personnel; changes in our industry and the market in which we operate, interest rates or the general economy, and the degree and nature of our competition. These and other risk factors are more fully discussed in the Company’s filings with the Securities and Exchange Commission. EBITDA is defined as net income before interest, taxes, depreciation and amortization. EBITDA yield is defined as trailing twelve month EBITDA divided by the purchase price. EBITDA, FFO, AFFO, CAD and other terms are non-GAAP measures, reconciliations of which have been provided in prior earnings releases and filings with the SEC. This overview is for informational purposes only and is not an offer to sell, or a solicitation of an offer to buy or sell, any securities of Ashford Hospitality Trust, Inc. and may not be relied upon in connection with the purchase or sale of any such security. 3
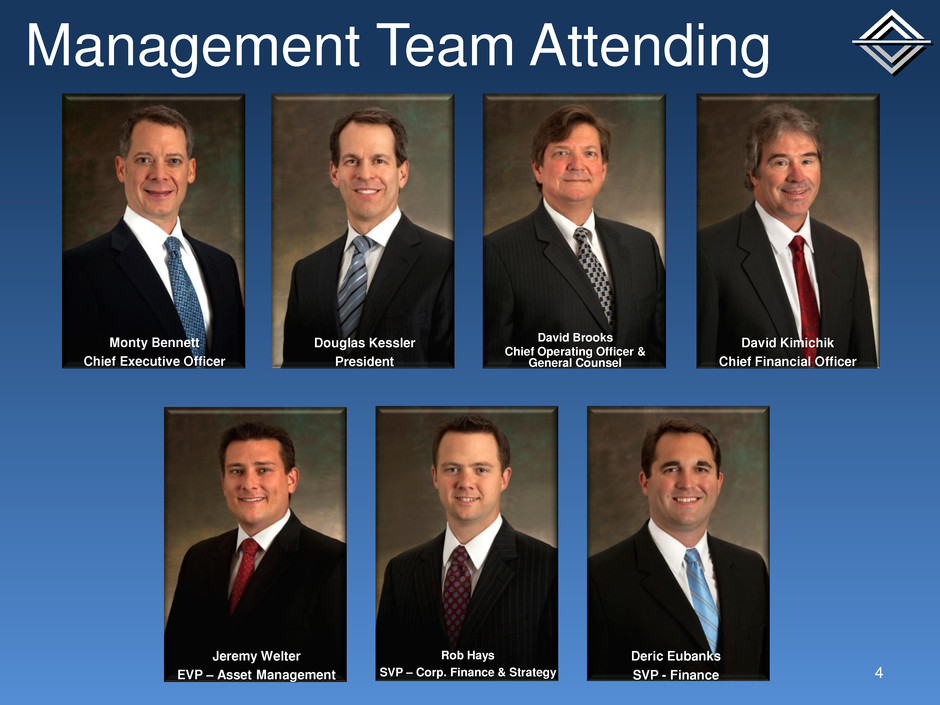
Management Team Attending 4 Monty Bennett Chief Executive Officer Douglas Kessler President David Brooks Chief Operating Officer & General Counsel David Kimichik Chief Financial Officer Jeremy Welter EVP – Asset Management Rob Hays SVP – Corp. Finance & Strategy Deric Eubanks SVP - Finance
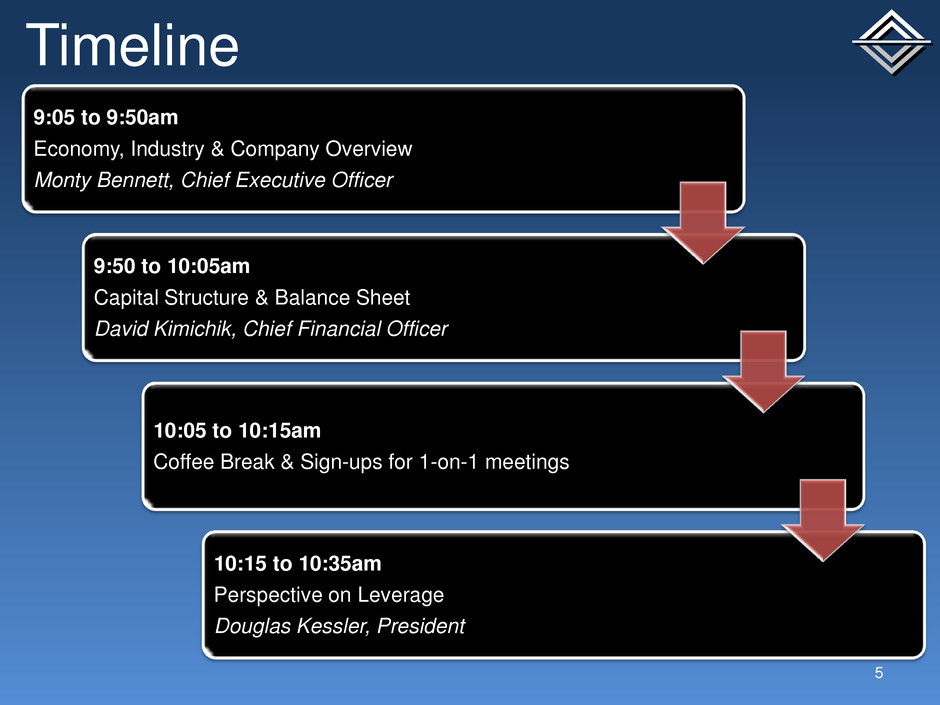
Timeline 5 9:05 to 9:50am Economy, Industry & Company Overview Monty Bennett, Chief Executive Officer 9:50 to 10:05am Capital Structure & Balance Sheet David Kimichik, Chief Financial Officer 10:05 to 10:15am Coffee Break & Sign-ups for 1-on-1 meetings 10:15 to 10:35am Perspective on Leverage Douglas Kessler, President
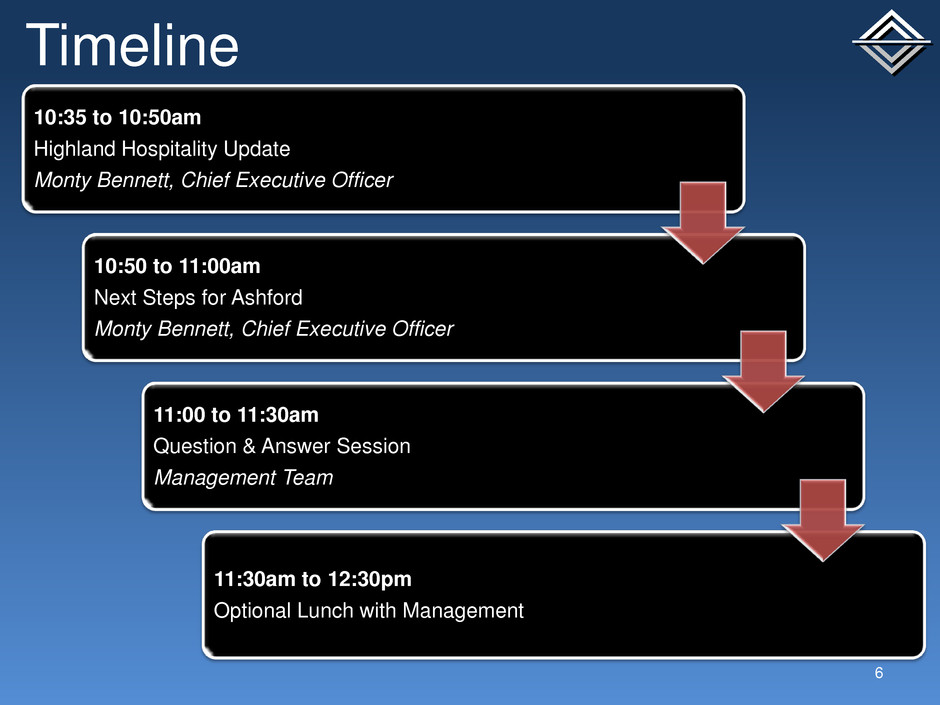
Timeline 6 10:35 to 10:50am Highland Hospitality Update Monty Bennett, Chief Executive Officer 10:50 to 11:00am Next Steps for Ashford Monty Bennett, Chief Executive Officer 11:00 to 11:30am Question & Answer Session Management Team 11:30am to 12:30pm Optional Lunch with Management

Presentation Overview 8 There is still significant upside remaining in this lodging cycle Ashford has a strong, covered dividend and invests in high quality, hard assets with inflation protection Ashford has the right capital structure for this part of the cycle Ashford continues to have superior stock performance results with the industry’s best acquisition and asset management team
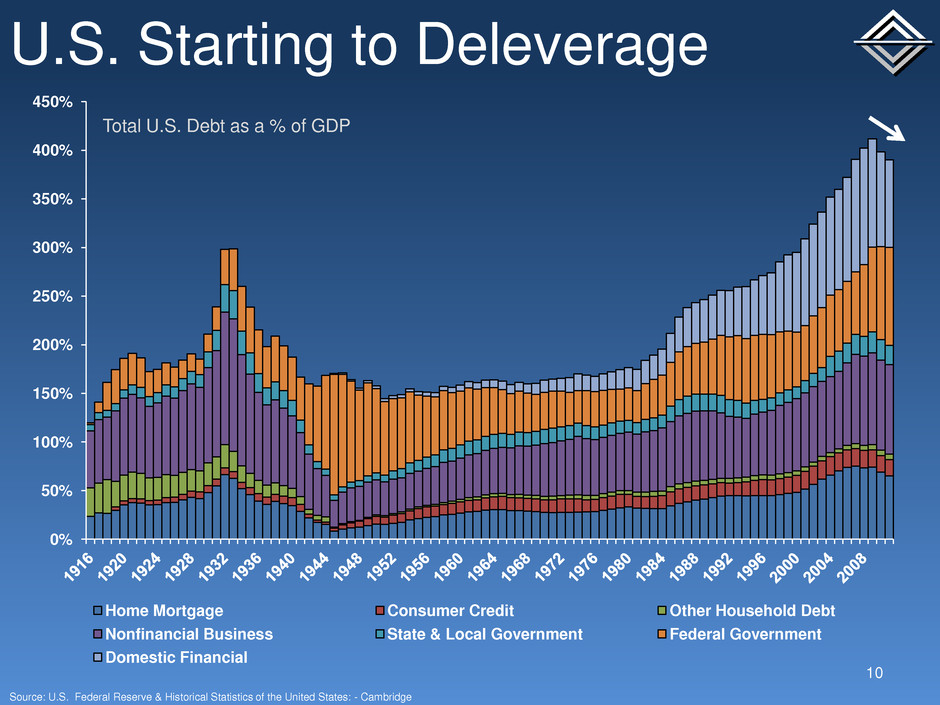
0% 50% 100% 150% 200% 250% 300% 350% 400% 450% Home Mortgage Consumer Credit Other Household Debt Nonfinancial Business State & Local Government Federal Government Domestic Financial U.S. Starting to Deleverage Total U.S. Debt as a % of GDP 10 Source: U.S. Federal Reserve & Historical Statistics of the United States: - Cambridge

U.S. Population Growth Total Population in 000s & Average Annual Growth per Decade 11 3.1% 3.2% 2.9% 3.0% 2.9% 3.2% 3.1% 2.4% 2.3% 2.3% 1.8% 1.9% 1.3% 1.3% 0.6% 1.4% 1.7% 1.1% 1.0% 0.8% 1.1% 0.8% - 50,000 100,000 150,000 200,000 250,000 300,000 350,000 Source: U.S. Census Bureau & Historical Statistics of the United States: - Cambridge
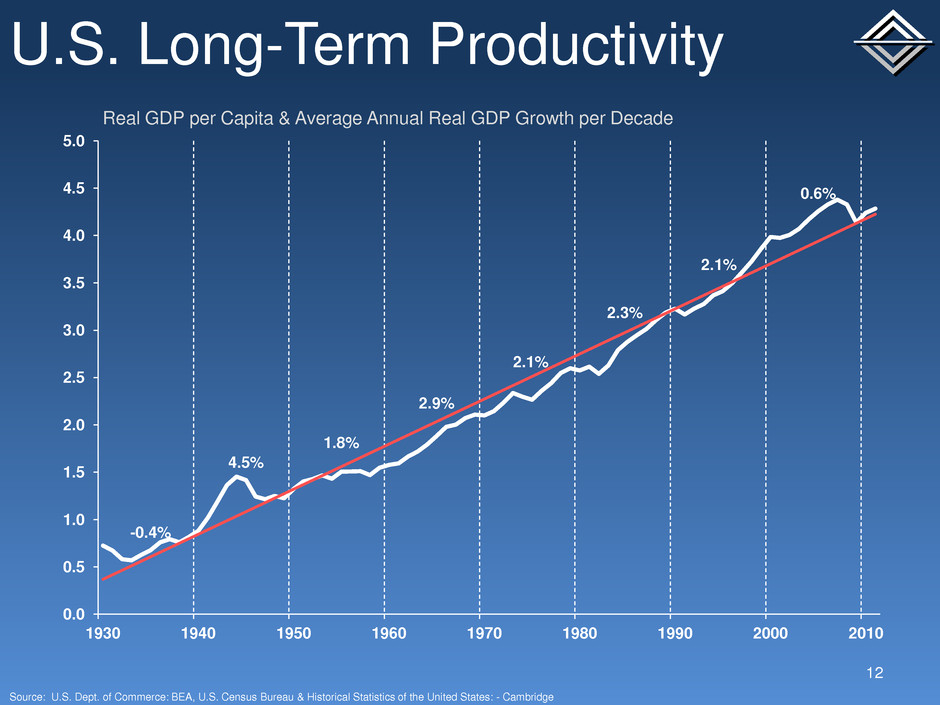
U.S. Long-Term Productivity Real GDP per Capita & Average Annual Real GDP Growth per Decade 12 -0.4% 4.5% 1.8% 2.9% 2.1% 2.3% 2.1% 0.6% 0.0 0.5 1.0 1.5 2.0 2.5 3.0 3.5 4.0 4.5 5.0 1930 1940 1950 1960 1970 1980 1990 2000 2010 Source: U.S. Dept. of Commerce: BEA, U.S. Census Bureau & Historical Statistics of the United States: - Cambridge

-20.0% -15.0% -10.0% -5.0% 0.0% 5.0% 10.0% 15.0% 20.0% 25.0% Real GDP Growth % 13 2011 Real GDP Growth: 1.7% Source: U.S. Dept. of Commerce: BEA & Historical Statistics of the United States: - Cambridge
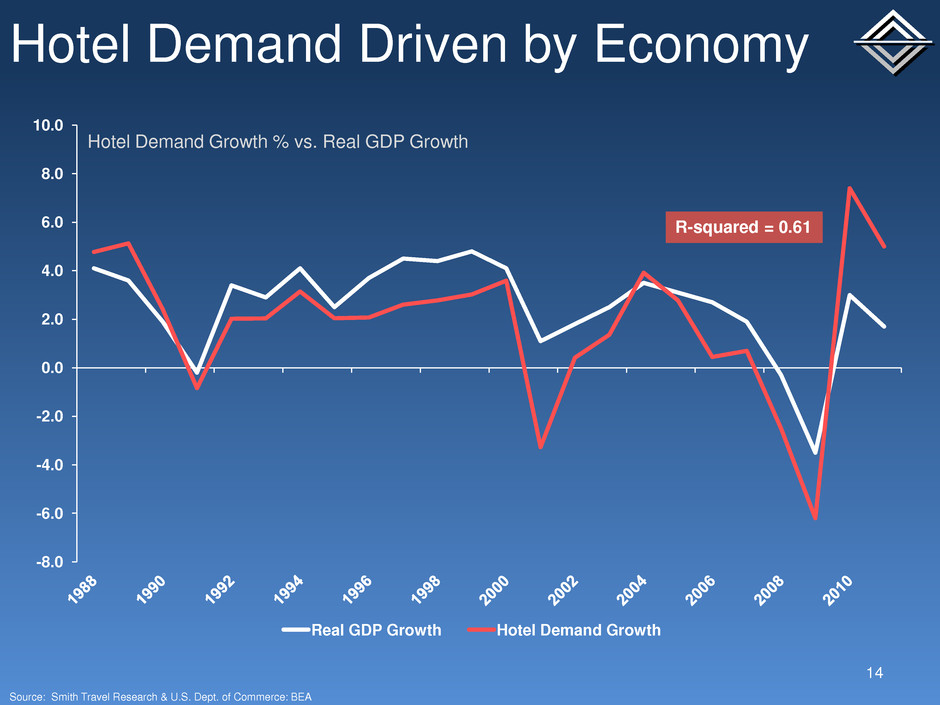
-8.0 -6.0 -4.0 -2.0 0.0 2.0 4.0 6.0 8.0 10.0 Real GDP Growth Hotel Demand Growth Hotel Demand Driven by Economy Source: Smith Travel Research & U.S. Dept. of Commerce: BEA Hotel Demand Growth % vs. Real GDP Growth 14 R-squared = 0.61
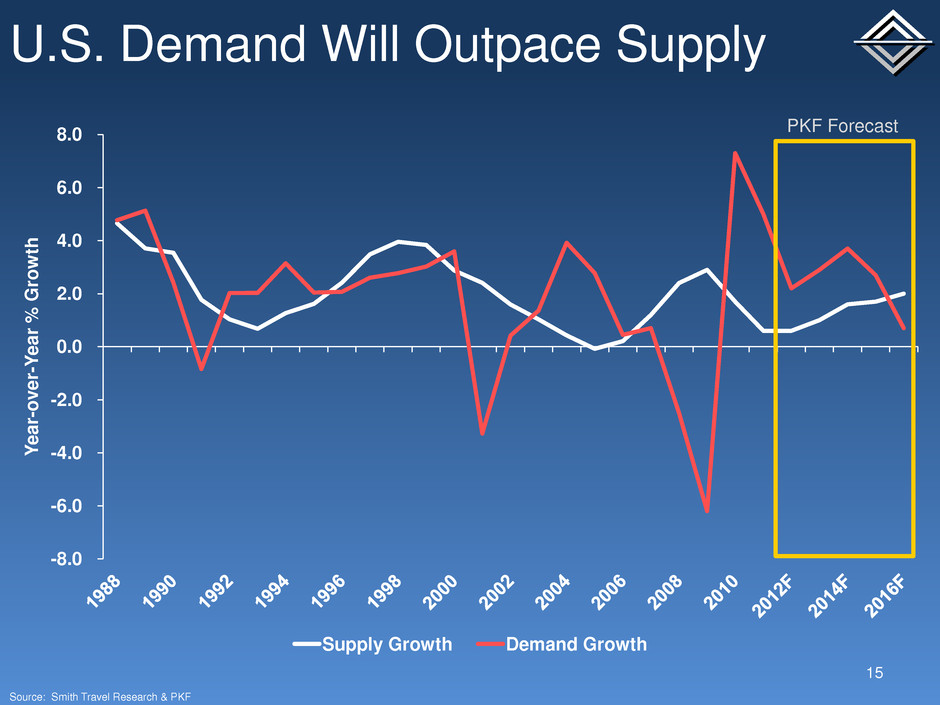
-8.0 -6.0 -4.0 -2.0 0.0 2.0 4.0 6.0 8.0 Y ea r- o v e r- Y ea r % G ro w th Supply Growth Demand Growth U.S. Demand Will Outpace Supply 15 PKF Forecast Source: Smith Travel Research & PKF

Total U.S. Demand 16 Source: Smith Travel Research 55,000,000 60,000,000 65,000,000 70,000,000 75,000,000 80,000,000 85,000,000 90,000,000 95,000,000 Monthly Seasonally-Adjusted Demand TTM Average Demand

Economic & Industry Summary 17 Deleveraging & low, steady demand growth Low interest rates for the foreseeable future Fed unlikely to raise interest rates – unlikely that a “normal” recession will occur due to high interest rates Only mild threat is economic shock: war, euro crisis, sovereign debt & China hard landing, etc. Low hotel supply along with steady real demand will lead to positive real RevPAR growth for several years to come
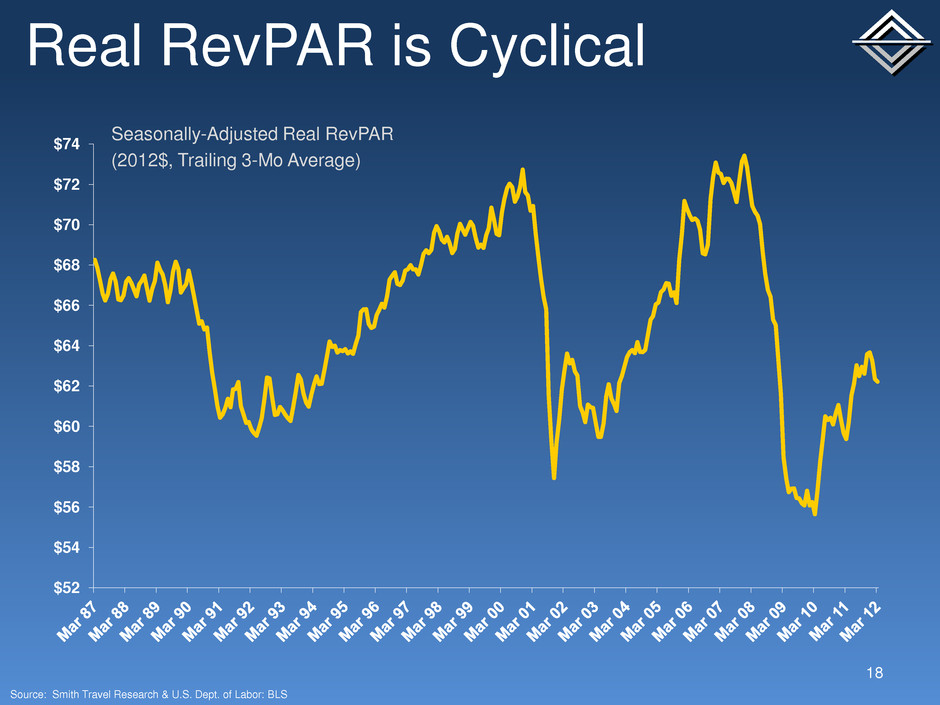
$52 $54 $56 $58 $60 $62 $64 $66 $68 $70 $72 $74 Real RevPAR is Cyclical Source: Smith Travel Research & U.S. Dept. of Labor: BLS Seasonally-Adjusted Real RevPAR (2012$, Trailing 3-Mo Average) 18
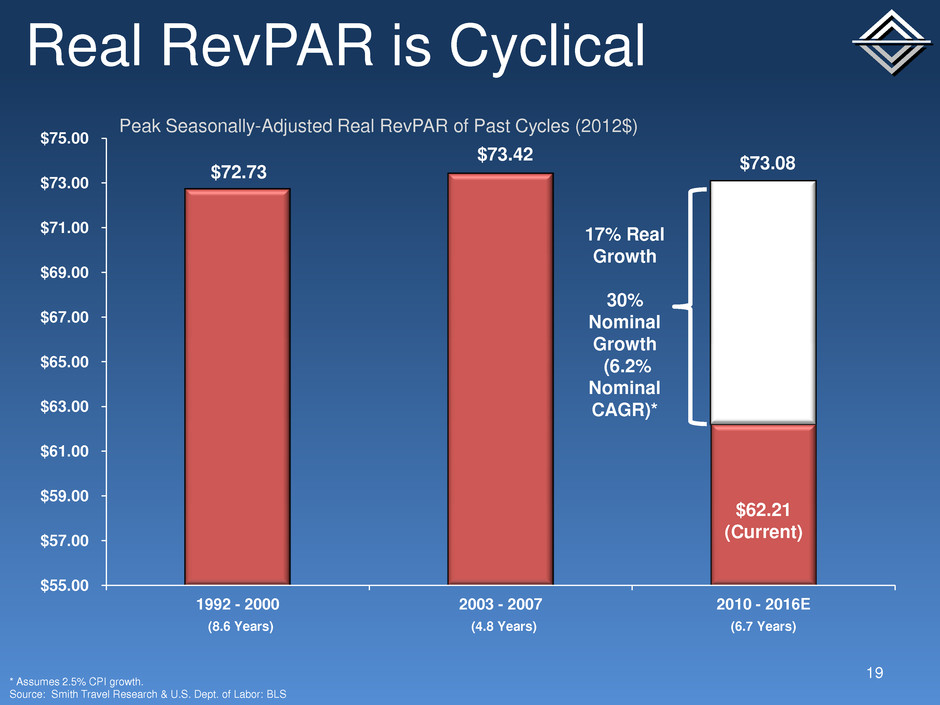
$55.00 $57.00 $59.00 $61.00 $63.00 $65.00 $67.00 $69.00 $71.00 $73.00 $75.00 1992 - 2000 2003 - 2007 2010 - 2016E $72.73 $73.42 $73.08 $62.21 (Current) 17% Real Growth 30% Nominal Growth (6.2% Nominal CAGR)* (8.6 Years) (4.8 Years) (6.7 Years) Real RevPAR is Cyclical * Assumes 2.5% CPI growth. Source: Smith Travel Research & U.S. Dept. of Labor: BLS Peak Seasonally-Adjusted Real RevPAR of Past Cycles (2012$) 19
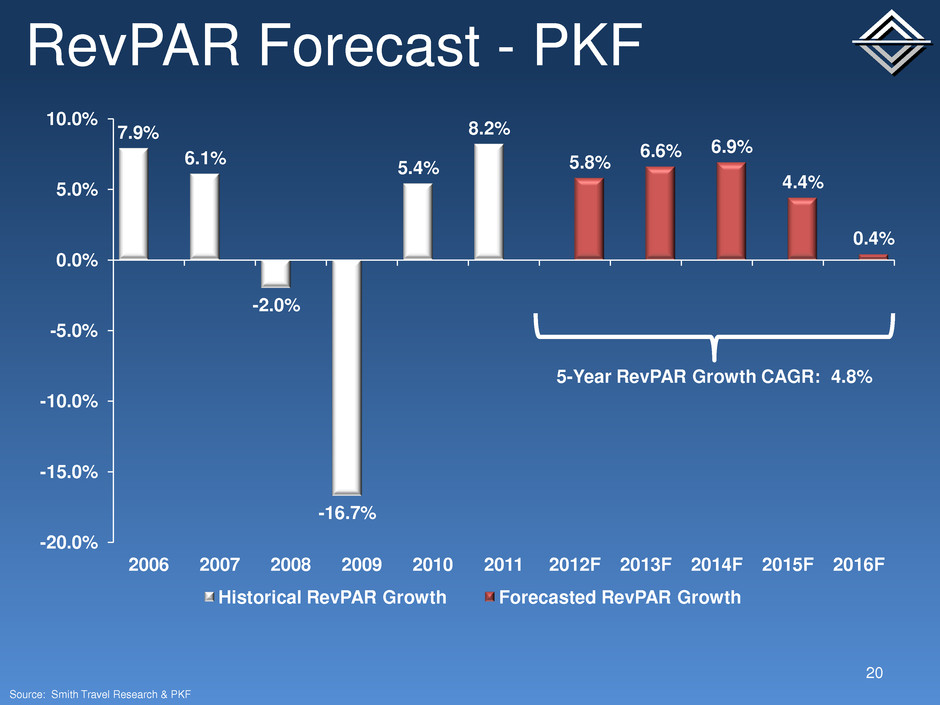
7.9% 6.1% -2.0% -16.7% 5.4% 8.2% 5.8% 6.6% 6.9% 4.4% 0.4% -20.0% -15.0% -10.0% -5.0% 0.0% 5.0% 10.0% 2006 2007 2008 2009 2010 2011 2012F 2013F 2014F 2015F 2016F Historical RevPAR Growth Forecasted RevPAR Growth RevPAR Forecast - PKF Source: Smith Travel Research & PKF 20 5-Year RevPAR Growth CAGR: 4.8%
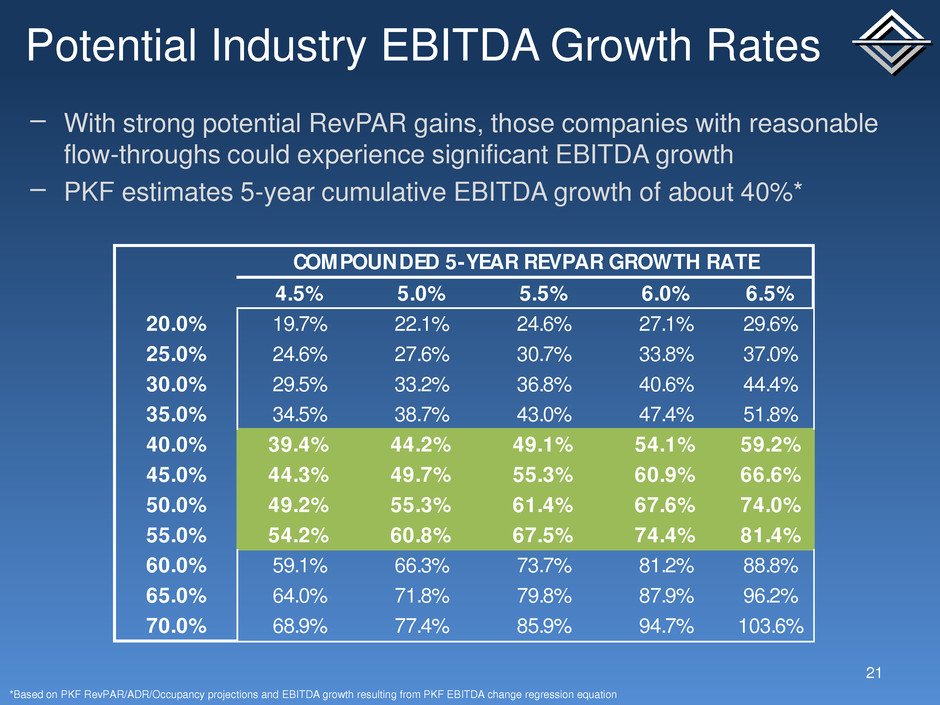
Potential Industry EBITDA Growth Rates 21 − With strong potential RevPAR gains, those companies with reasonable flow-throughs could experience significant EBITDA growth − PKF estimates 5-year cumulative EBITDA growth of about 40%* *Based on PKF RevPAR/ADR/Occupancy projections and EBITDA growth resulting from PKF EBITDA change regression equation COMPOUNDED 5-YEAR REVPAR GROWTH RATE 4.5% 5.0% 5.5% 6.0% 6.5% 20.0% 19.7% 22.1% 24.6% 27.1% 29.6% 25.0% 24.6% 27.6% 30.7% 33.8% 37.0% 30.0% 29.5% 33.2% 36.8% 40.6% 44.4% 35.0% 34.5% 38.7% 43.0% 47.4% 51.8% 40.0% 39.4% 44.2% 49.1% 54.1% 59.2% 45.0% 44.3% 49.7% 55.3% 60.9% 66.6% 50.0% 49.2% 55.3% 61.4% 67.6% 74.0% 55.0% 54.2% 60.8% 67.5% 74.4% 81.4% 60.0% 59.1% 66.3% 73.7% 81.2% 88.8% 65.0% 64.0% 71.8% 79.8% 87.9% 96.2% 70.0% 68.9% 77.4% 85.9% 94.7% 103.6% CUMULATIVE 5-YEAR EBITDA GROWTH 5- YE AR EB IT DA FL OW %
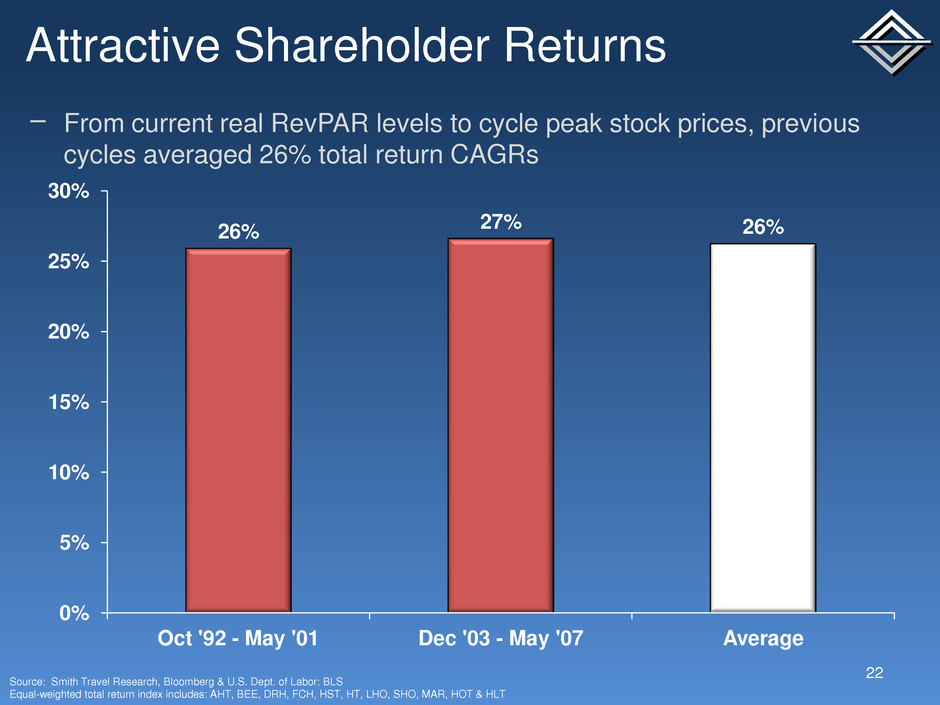
Attractive Shareholder Returns 22 − From current real RevPAR levels to cycle peak stock prices, previous cycles averaged 26% total return CAGRs 26% 27% 26% 0% 5% 10% 15% 20% 25% 30% Oct '92 - May '01 Dec '03 - May '07 Average Source: Smith Travel Research, Bloomberg & U.S. Dept. of Labor: BLS Equal-weighted total return index includes: AHT, BEE, DRH, FCH, HST, HT, LHO, SHO, MAR, HOT & HLT

Projected Hotel Room Value Growth 23 $100,000 $95,000 $81,000 $56,000 $65,000 $78,000 $90,000 $105,000 $114,000 $121,000 $0 $20,000 $40,000 $60,000 $80,000 $100,000 $120,000 $140,000 Private Value of US Hotel Room Source: HVS
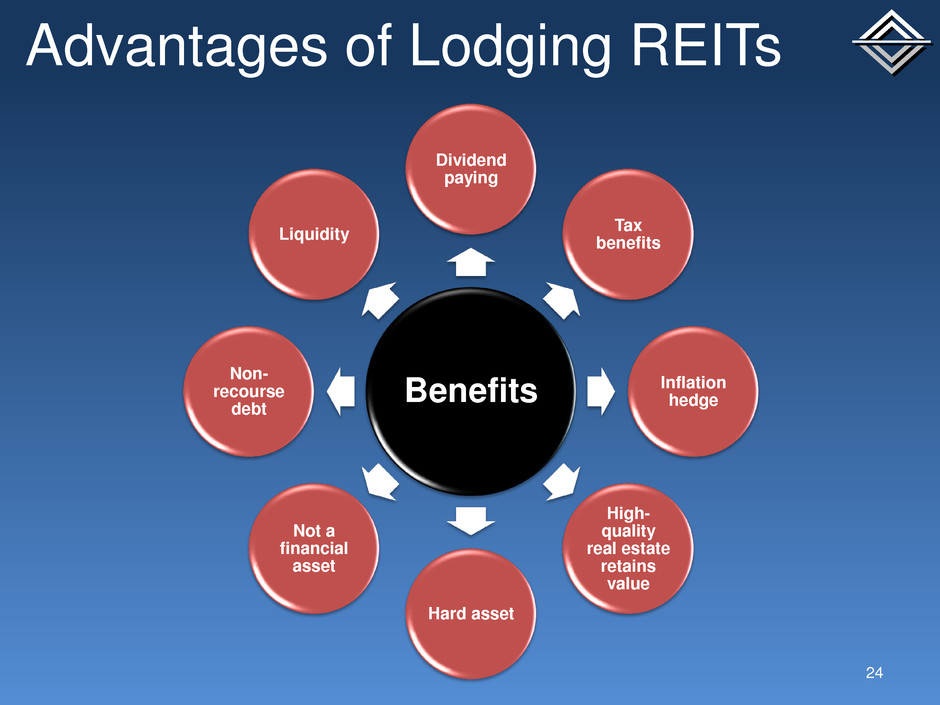
Advantages of Lodging REITs Benefits Dividend paying Tax benefits Inflation hedge High- quality real estate retains value Hard asset Not a financial asset Non- recourse debt Liquidity 24
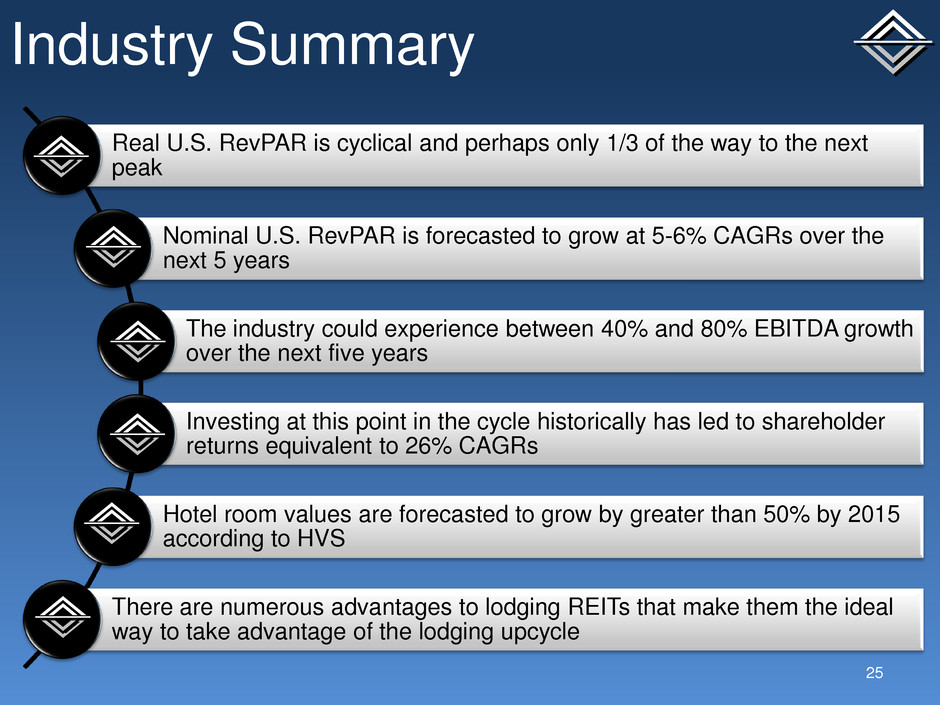
Real U.S. RevPAR is cyclical and perhaps only 1/3 of the way to the next peak Nominal U.S. RevPAR is forecasted to grow at 5-6% CAGRs over the next 5 years The industry could experience between 40% and 80% EBITDA growth over the next five years Investing at this point in the cycle historically has led to shareholder returns equivalent to 26% CAGRs Hotel room values are forecasted to grow by greater than 50% by 2015 according to HVS There are numerous advantages to lodging REITs that make them the ideal way to take advantage of the lodging upcycle Industry Summary 25
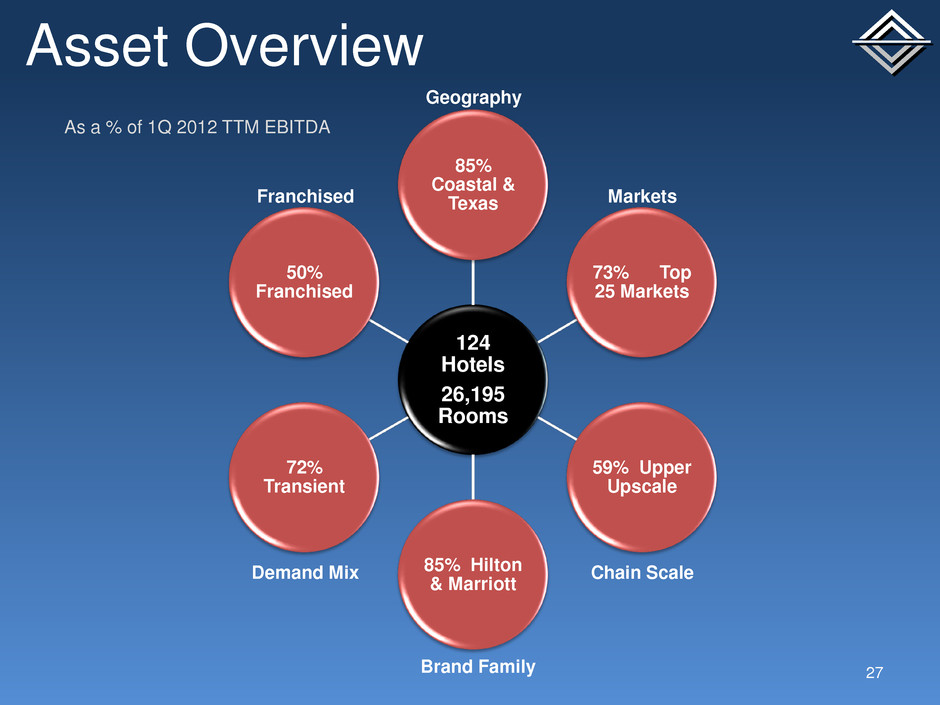
Asset Overview 27 124 Hotels 26,195 Rooms 85% Coastal & Texas 73% Top 25 Markets 59% Upper Upscale 85% Hilton & Marriott 72% Transient 50% Franchised As a % of 1Q 2012 TTM EBITDA Franchised Geography Markets Chain Scale Brand Family Demand Mix
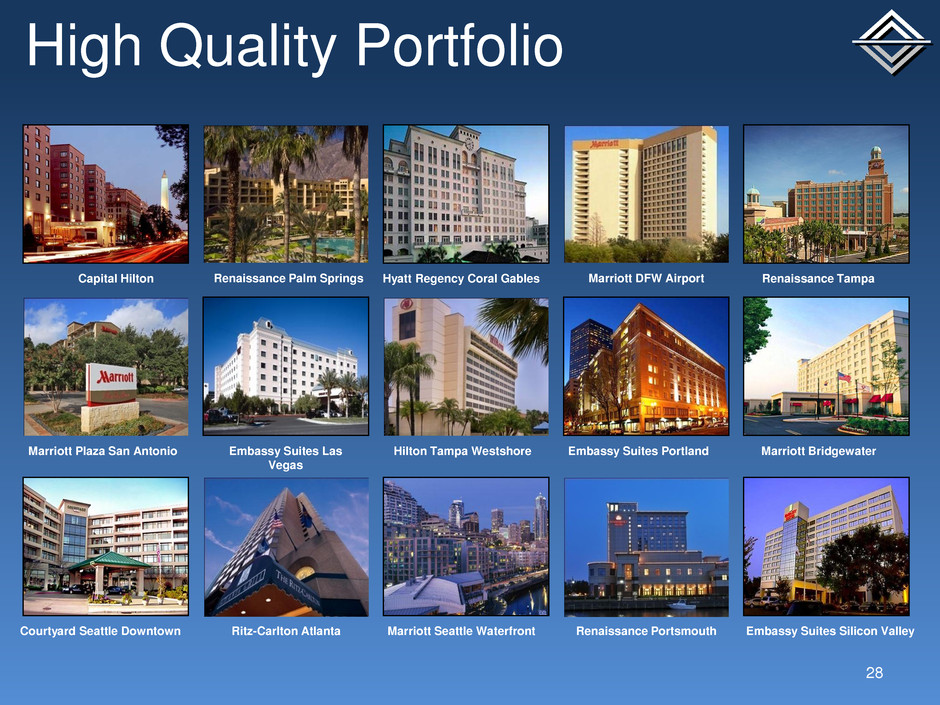
High Quality Portfolio 28 Marriott Bridgewater Hyatt Regency Coral Gables Courtyard Seattle Downtown Capital Hilton Marriott Seattle Waterfront Renaissance Tampa Embassy Suites Portland Embassy Suites Las Vegas Embassy Suites Silicon Valley Renaissance Palm Springs Marriott DFW Airport Marriott Plaza San Antonio Hilton Tampa Westshore Ritz-Carlton Atlanta Renaissance Portsmouth
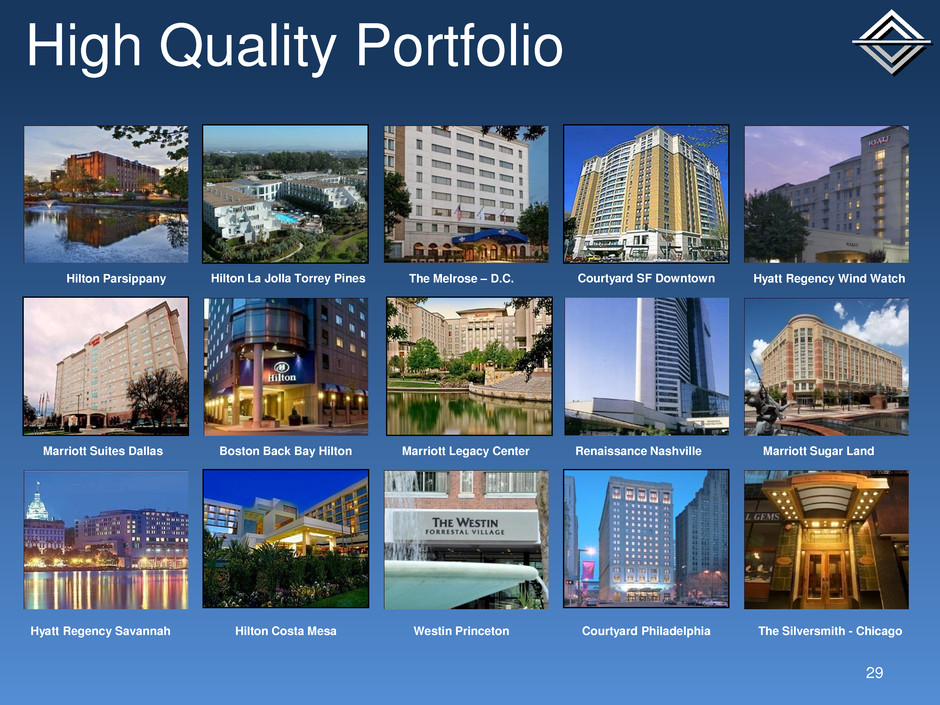
High Quality Portfolio 29 Hilton Parsippany The Melrose – D.C. Hyatt Regency Wind Watch Boston Back Bay Hilton Renaissance Nashville Marriott Sugar Land Hyatt Regency Savannah Westin Princeton The Silversmith - Chicago Hilton La Jolla Torrey Pines Courtyard SF Downtown Marriott Suites Dallas Marriott Legacy Center Hilton Costa Mesa Courtyard Philadelphia
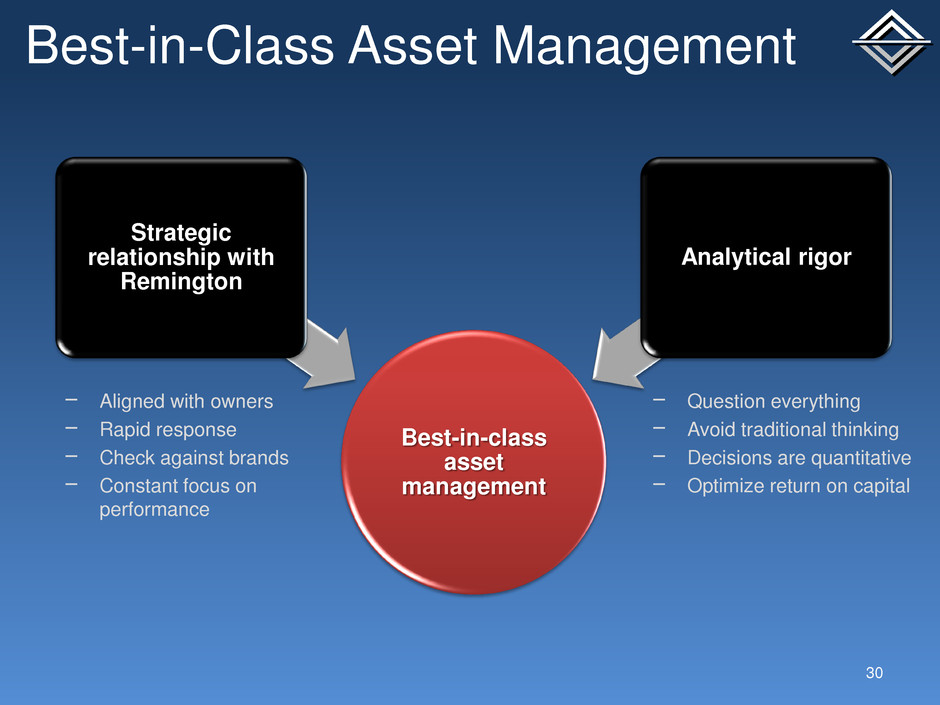
Best-in-Class Asset Management 30 Best-in-class asset management Strategic relationship with Remington Analytical rigor − Aligned with owners − Rapid response − Check against brands − Constant focus on performance − Question everything − Avoid traditional thinking − Decisions are quantitative − Optimize return on capital
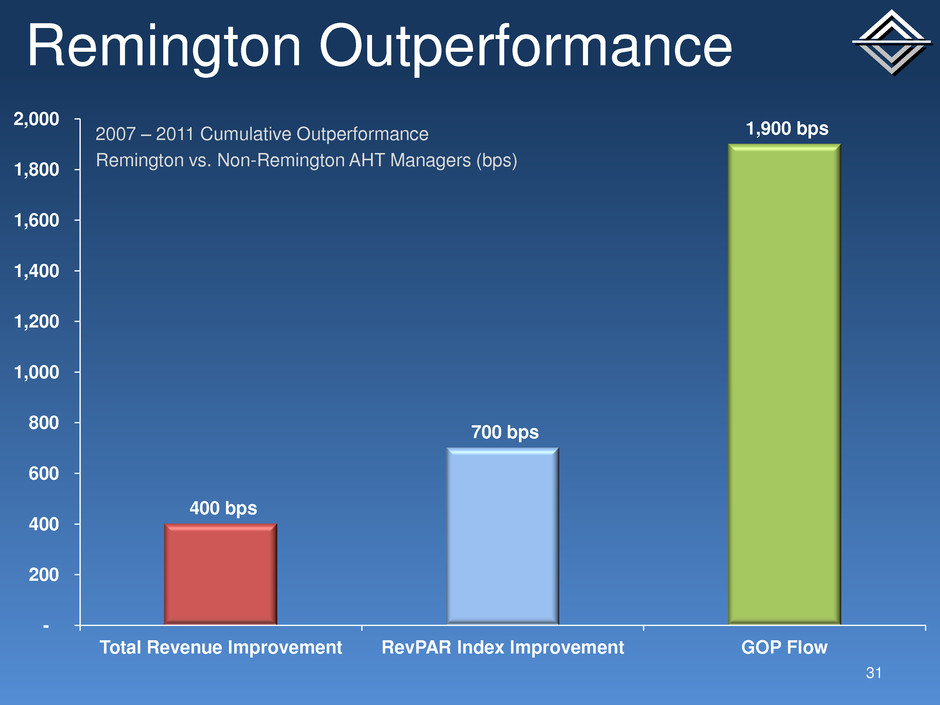
Remington Outperformance 31 400 bps 700 bps 1,900 bps - 200 400 600 800 1,000 1,200 1,400 1,600 1,800 2,000 Total Revenue Improvement RevPAR Index Improvement GOP Flow 2007 – 2011 Cumulative Outperformance Remington vs. Non-Remington AHT Managers (bps)
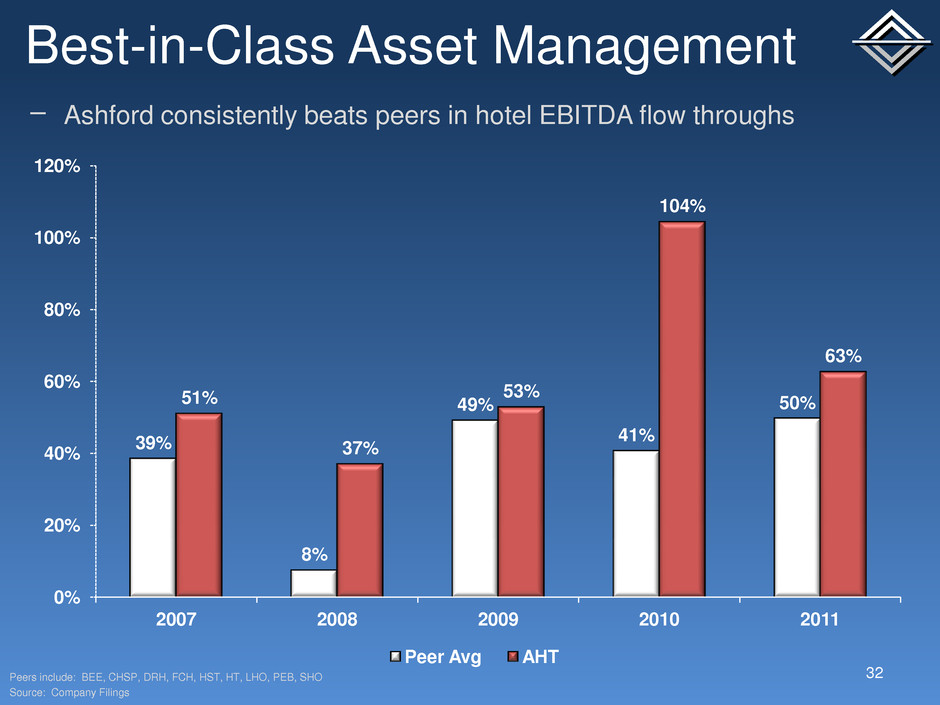
Best-in-Class Asset Management 32 − Ashford consistently beats peers in hotel EBITDA flow throughs 39% 8% 49% 41% 50% 51% 37% 53% 104% 63% 0% 20% 40% 60% 80% 100% 120% 2007 2008 2009 2010 2011 Peer Avg AHT Peers include: BEE, CHSP, DRH, FCH, HST, HT, LHO, PEB, SHO Source: Company Filings

Best-in-Class Asset Management 33 − Ashford consistently beats peers in hotel EBITDA margin change 78 (106) (487) 53 132 114 (58) (406) 86 184 (600) (500) (400) (300) (200) (100) - 100 200 300 2007 2008 2009 2010 2011 Peer Avg AHT In basis points Peers include: BEE, CHSP, CLDT, DRH, FCH, HST, HT, LHO, PEB, SHO Source: Company Filings
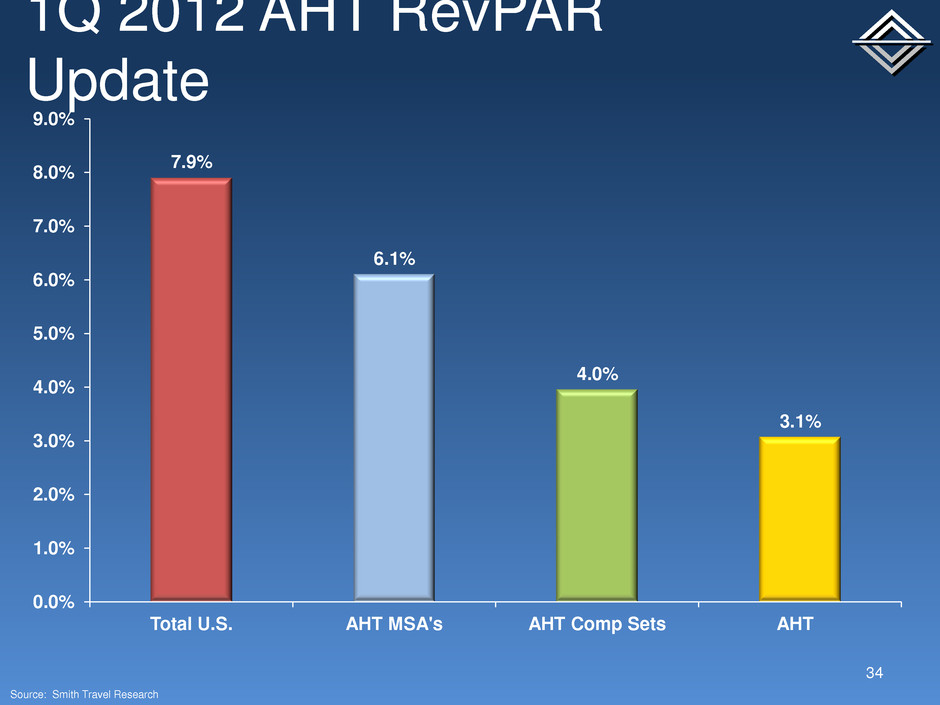
1Q 2012 AHT RevPAR Update 34 7.9% 6.1% 4.0% 3.1% 0.0% 1.0% 2.0% 3.0% 4.0% 5.0% 6.0% 7.0% 8.0% 9.0% Total U.S. AHT MSA's AHT Comp Sets AHT Source: Smith Travel Research

Capex Spend History 35 12.8% 11.1% 8.4% 7.4% 6.9% 9.5% 0.0% 2.0% 4.0% 6.0% 8.0% 10.0% 12.0% 14.0% 2007 2008 2009 2010 2011 2012E* − Ashford consistently spends capital to keep the properties in great shape, but refrains from spending optional dollars which do not meet return hurdles Based on our estimated capex spend and assuming 2012 PKF RevPAR growth of 5.8%
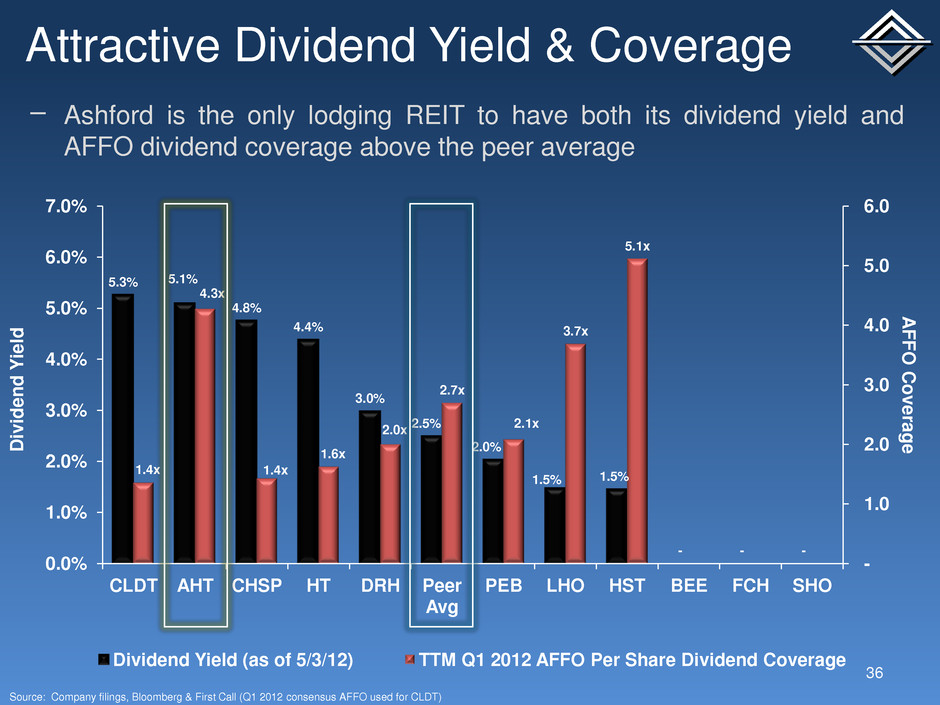
Attractive Dividend Yield & Coverage 36 − Ashford is the only lodging REIT to have both its dividend yield and AFFO dividend coverage above the peer average 5.3% 5.1% 4.8% 4.4% 3.0% 2.5% 2.0% 1.5% 1.5% - - - 1.4x 4.3x 1.4x 1.6x 2.0x 2.7x 2.1x 3.7x 5.1x - 1.0 2.0 3.0 4.0 5.0 6.0 0.0% 1.0% 2.0% 3.0% 4.0% 5.0% 6.0% 7.0% CLDT AHT CHSP HT DRH Peer Avg PEB LHO HST BEE FCH SHO A F F O C o v e ra g e D iv id e n d Y ie ld Dividend Yield (as of 5/3/12) TTM Q1 2012 AFFO Per Share Dividend Coverage Source: Company filings, Bloomberg & First Call (Q1 2012 consensus AFFO used for CLDT)
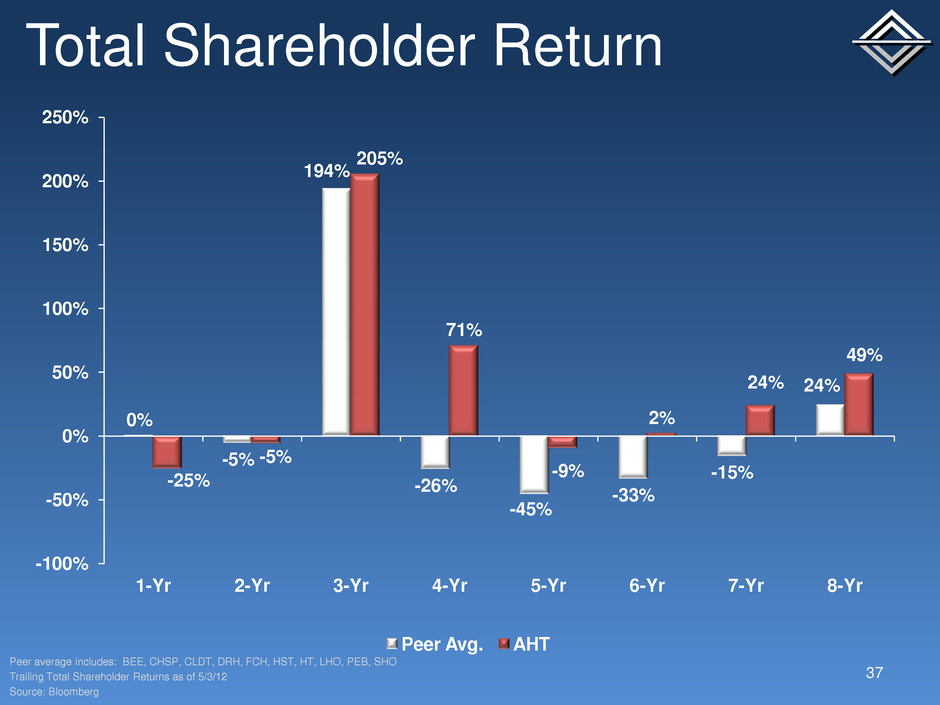
0% -5% 194% -26% -45% -33% -15% 24% -25% -5% 205% 71% -9% 2% 24% 49% -100% -50% 0% 50% 100% 150% 200% 250% 1-Yr 2-Yr 3-Yr 4-Yr 5-Yr 6-Yr 7-Yr 8-Yr Peer Avg. AHT Total Shareholder Return 37 Peer average includes: BEE, CHSP, CLDT, DRH, FCH, HST, HT, LHO, PEB, SHO Trailing Total Shareholder Returns as of 5/3/12 Source: Bloomberg
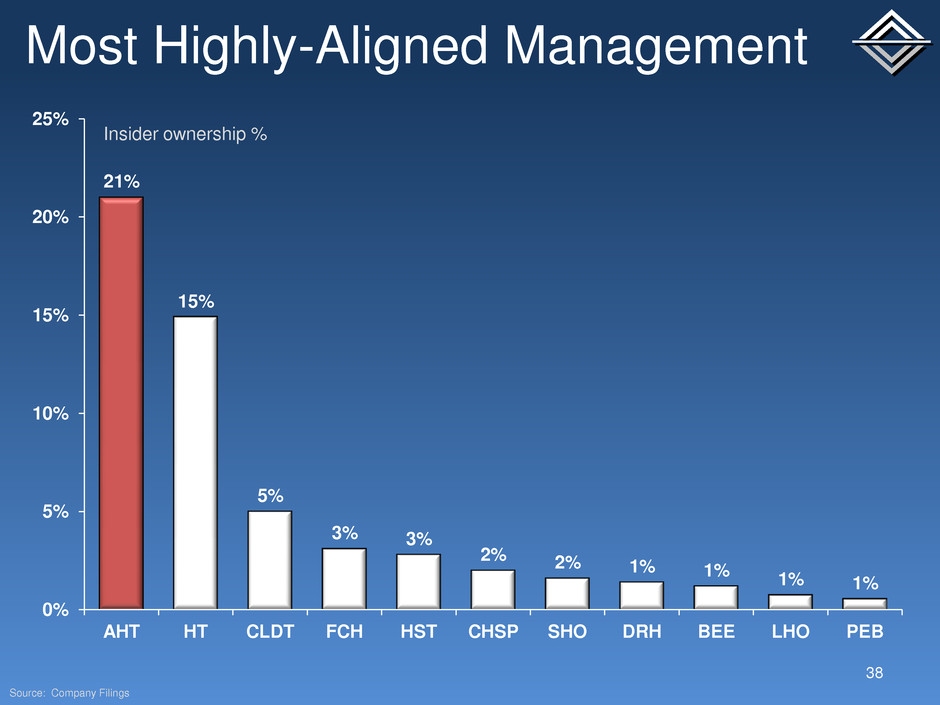
Most Highly-Aligned Management 38 21% 15% 5% 3% 3% 2% 2% 1% 1% 1% 1% 0% 5% 10% 15% 20% 25% AHT HT CLDT FCH HST CHSP SHO DRH BEE LHO PEB Insider ownership % Source: Company Filings
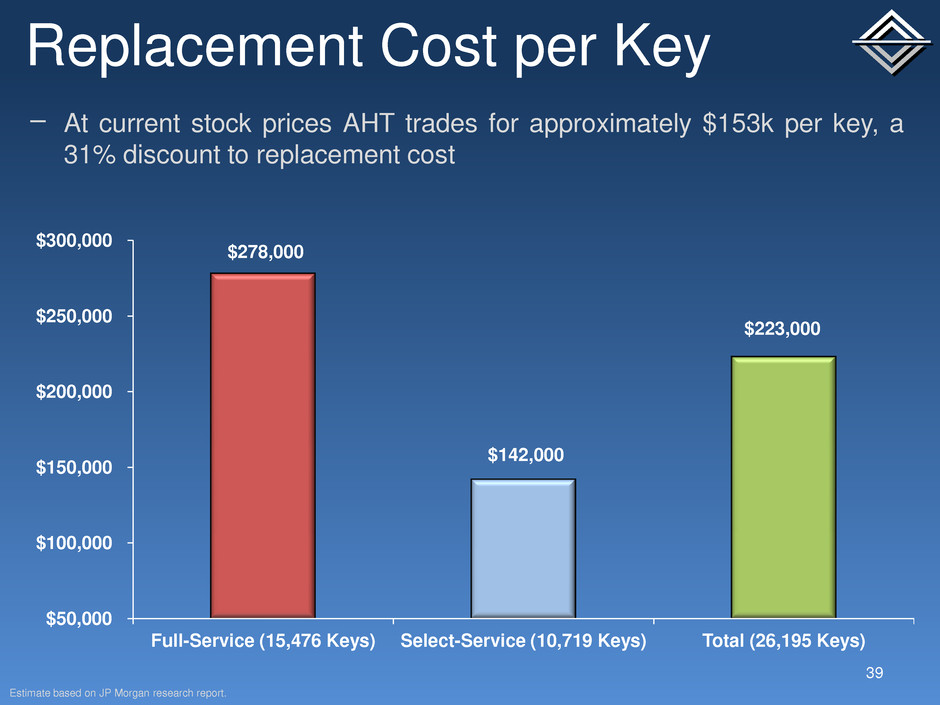
Replacement Cost per Key 39 Estimate based on JP Morgan research report. $278,000 $142,000 $223,000 $50,000 $100,000 $150,000 $200,000 $250,000 $300,000 Full-Service (15,476 Keys) Select-Service (10,719 Keys) Total (26,195 Keys) − At current stock prices AHT trades for approximately $153k per key, a 31% discount to replacement cost
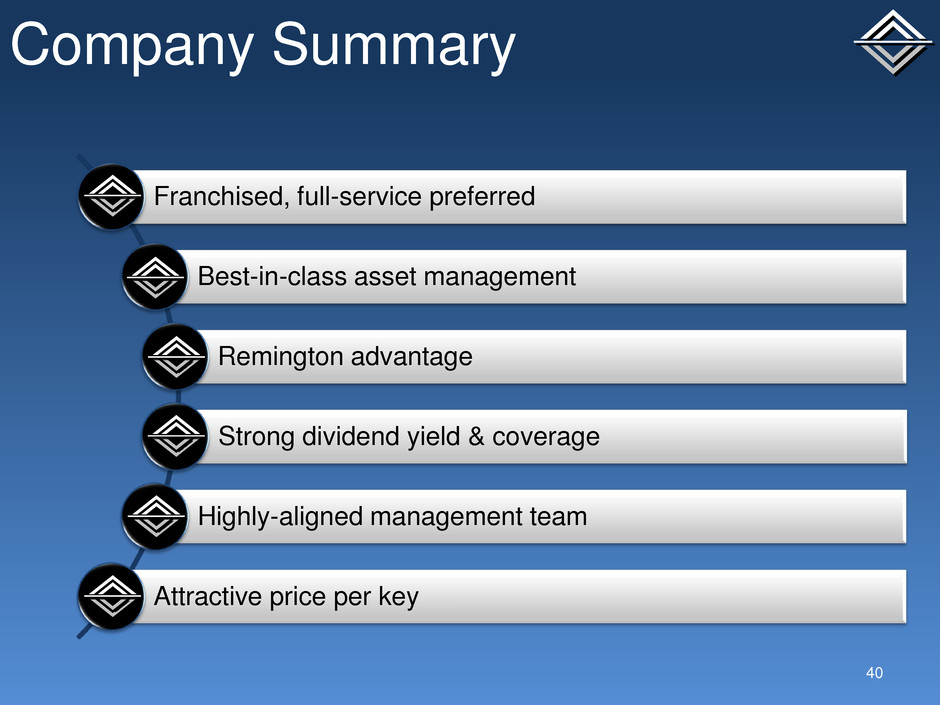
Franchised, full-service preferred Best-in-class asset management Remington advantage Strong dividend yield & coverage Highly-aligned management team Attractive price per key Company Summary 40
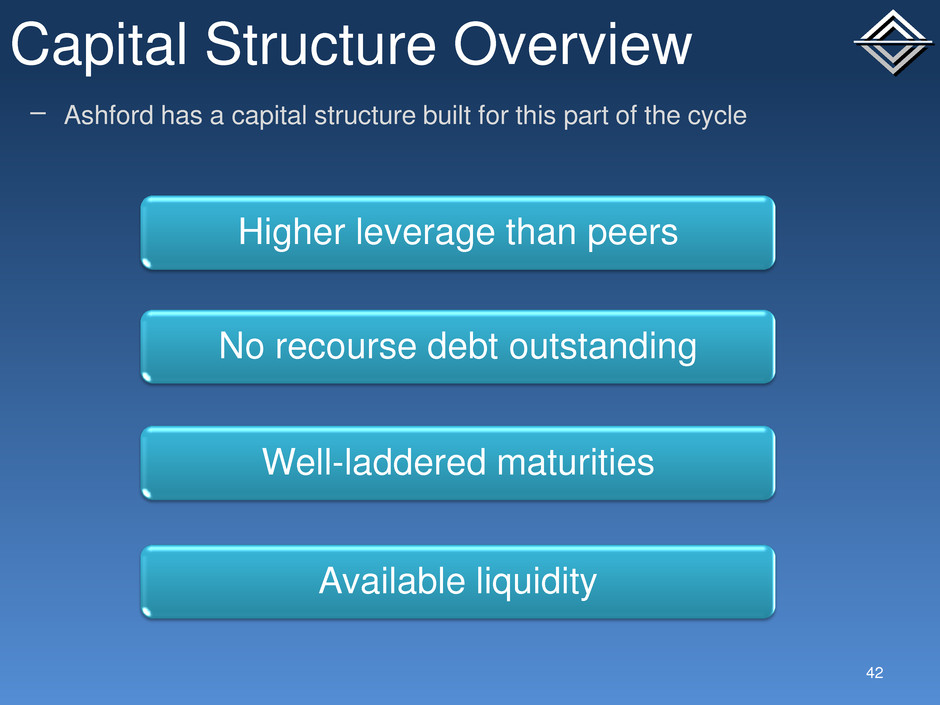
Capital Structure Overview 42 − Ashford has a capital structure built for this part of the cycle Higher leverage than peers No recourse debt outstanding Well-laddered maturities Available liquidity

Current Capital Structure 43 Equity (# of shares) Common 68.2 OP Units 17.6 Total Diluted Shares 85.8 Preferred Series A,D & E (par value) $386.4 As of 1Q 2012 ($ Millions) Assets Hotel Gross Assets $4,454.8 Interest Rate Hedges $30.0 Mezz Book Value $4.0 Other $417.9 Total Gross Assets $4,906.8 Cash & Cash Equivalents $150.5 Total Debt (AHT Share) $3,102.8 Source: Company Filings

Debt Maturity Schedule 44 $0 $200 $400 $600 $800 $1,000 $1,200 2012 2013 2014 2015 2016 2017 Beyond D e b t ($ M ) Fixed-Rate Floating-Rate Source: Company Filings
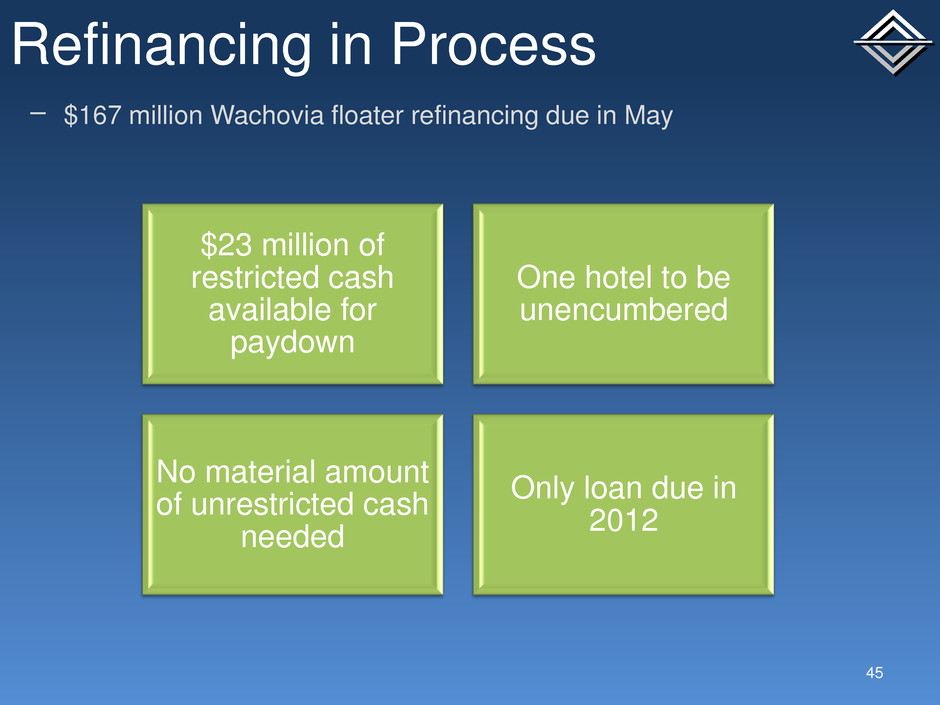
Refinancing in Process 45 $23 million of restricted cash available for paydown One hotel to be unencumbered No material amount of unrestricted cash needed Only loan due in 2012 − $167 million Wachovia floater refinancing due in May
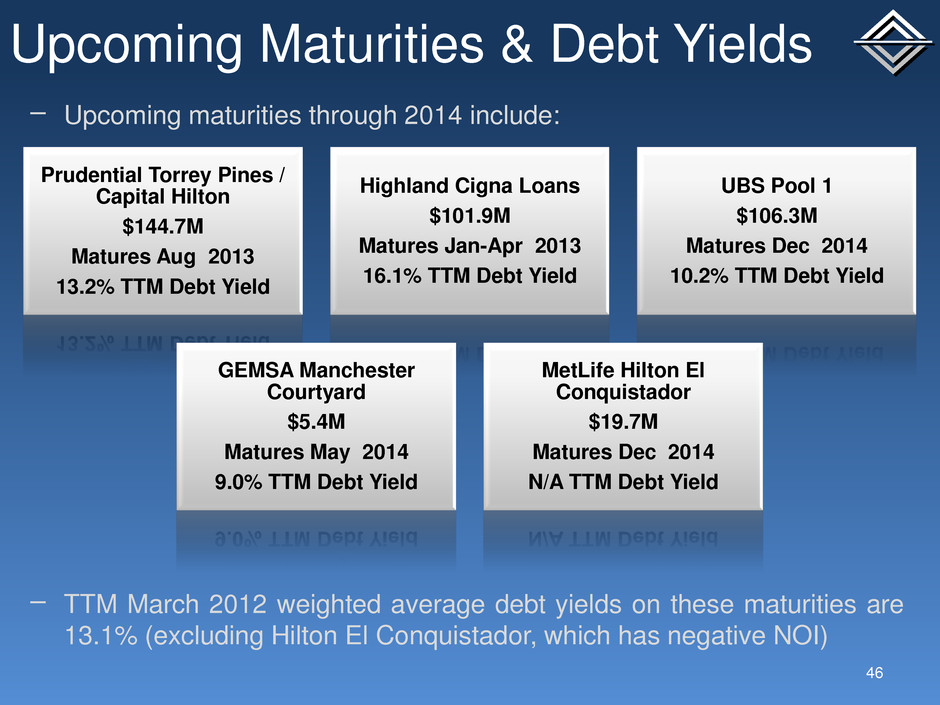
Upcoming Maturities & Debt Yields 46 − Upcoming maturities through 2014 include: − TTM March 2012 weighted average debt yields on these maturities are 13.1% (excluding Hilton El Conquistador, which has negative NOI) Prudential Torrey Pines / Capital Hilton $144.7M Matures Aug 2013 13.2% TTM Debt Yield Highland Cigna Loans $101.9M Matures Jan-Apr 2013 16.1% TTM Debt Yield UBS Pool 1 $106.3M Matures Dec 2014 10.2% TTM Debt Yield GEMSA Manchester Courtyard $5.4M Matures May 2014 9.0% TTM Debt Yield MetLife Hilton El Conquistador $19.7M Matures Dec 2014 N/A TTM Debt Yield
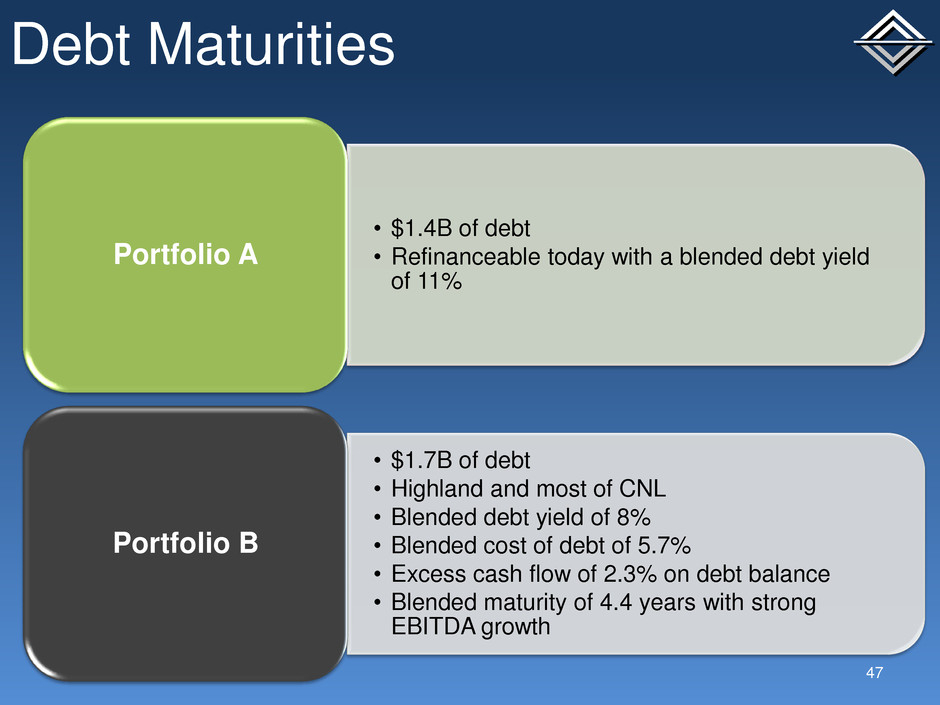
Debt Maturities 47 • $1.4B of debt • Refinanceable today with a blended debt yield of 11% Portfolio A • $1.7B of debt • Highland and most of CNL • Blended debt yield of 8% • Blended cost of debt of 5.7% • Excess cash flow of 2.3% on debt balance • Blended maturity of 4.4 years with strong EBITDA growth Portfolio B
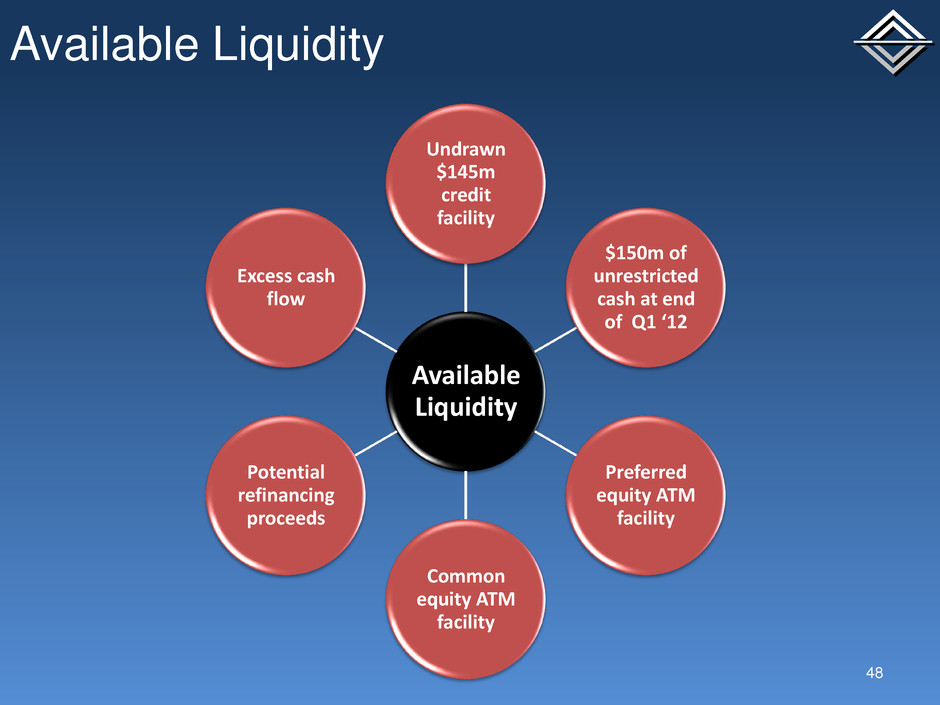
Available Liquidity 48 Available Liquidity Undrawn $145m credit facility $150m of unrestricted cash at end of Q1 ‘12 Preferred equity ATM facility Common equity ATM facility Potential refinancing proceeds Excess cash flow
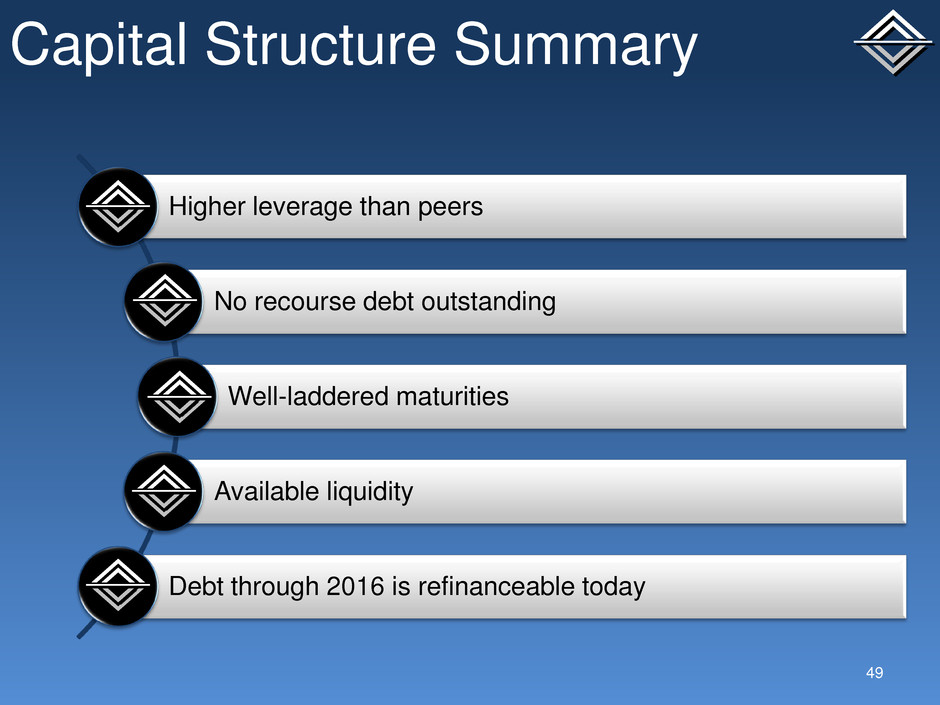
Higher leverage than peers No recourse debt outstanding Well-laddered maturities Available liquidity Debt through 2016 is refinanceable today Capital Structure Summary 49
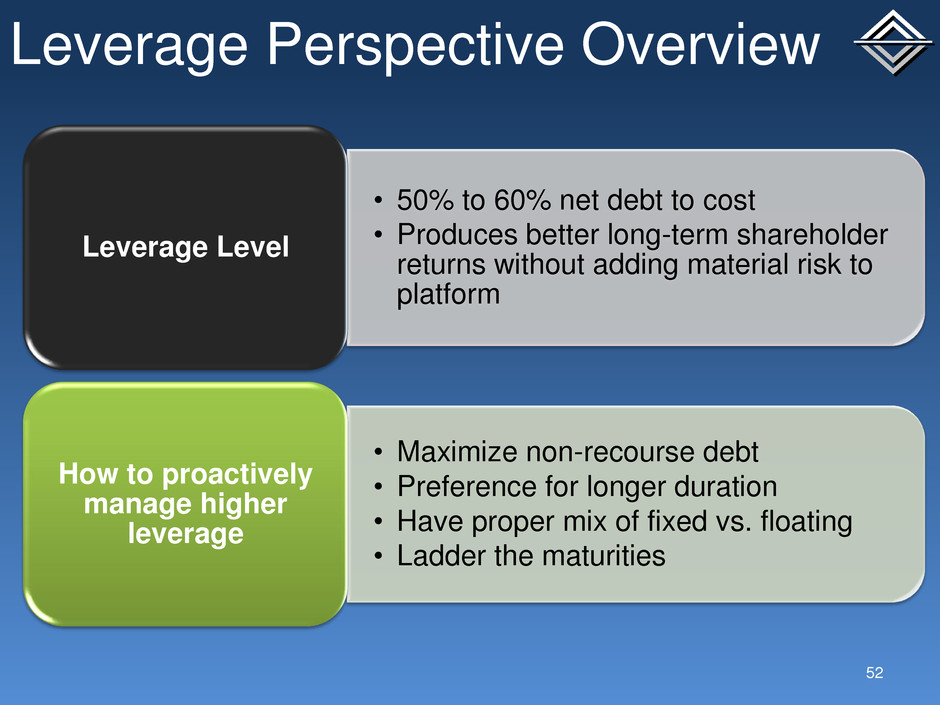
Leverage Perspective Overview 52 • 50% to 60% net debt to cost • Produces better long-term shareholder returns without adding material risk to platform Leverage Level • Maximize non-recourse debt • Preference for longer duration • Have proper mix of fixed vs. floating • Ladder the maturities How to proactively manage higher leverage
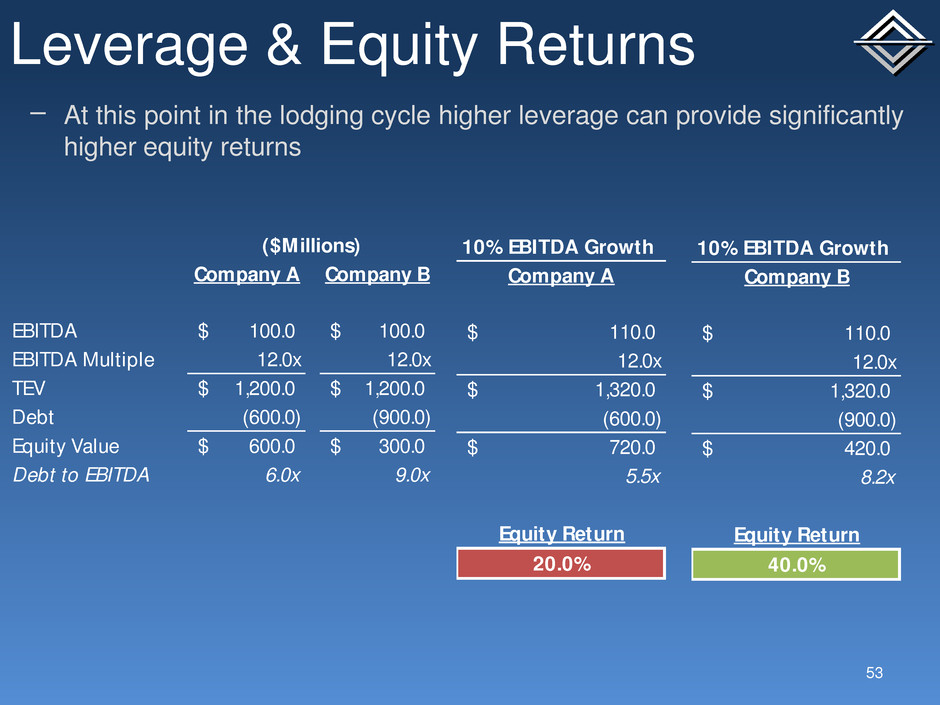
Leverage & Equity Returns 53 − At this point in the lodging cycle higher leverage can provide significantly higher equity returns ($Millions) Company A Company B EBITDA 100.0$ 100.0$ EBITDA Multiple 12.0x 12.0x TEV 1,200.0$ 1,200.0$ Debt (600.0) (900.0) Equity Value 600.0$ 300.0$ Debt to EBITDA 6.0x 9.0x 10% EBITDA Growth Company A 110.0$ 12.0x 1,320.0$ (600.0) 720.0$ 5.5x Equity Return 20.0% 10% EBITDA Growth Company B 110.0$ 12.0x 1,320.0$ (900.0) 420.0$ 8.2x Equity Return 40.0%
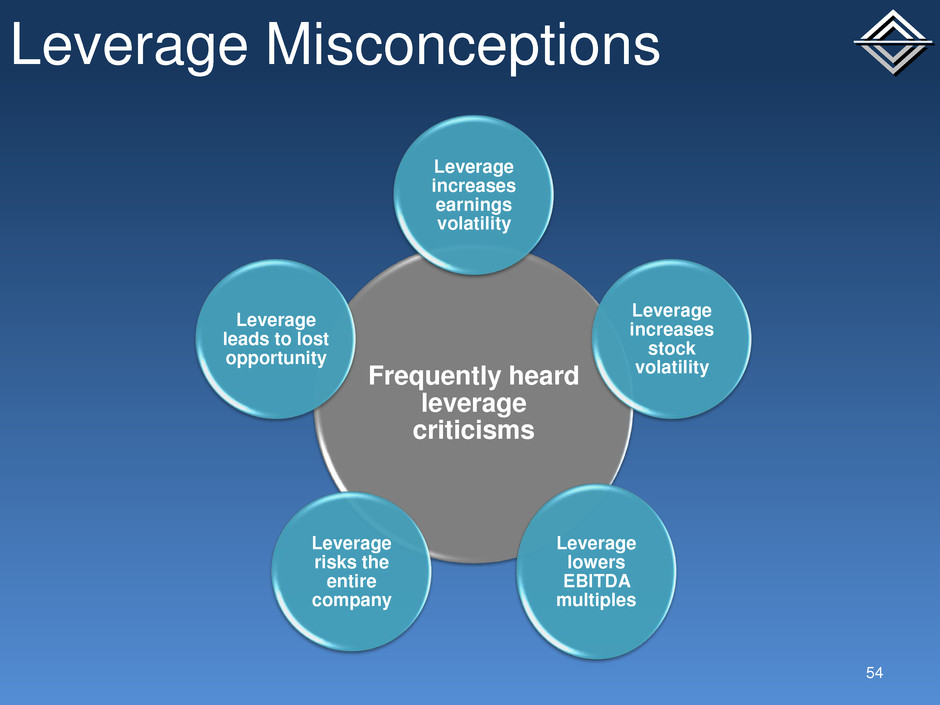
Leverage Misconceptions 54 Frequently heard leverage criticisms Leverage increases earnings volatility Leverage increases stock volatility Leverage lowers EBITDA multiples Leverage risks the entire company Leverage leads to lost opportunity
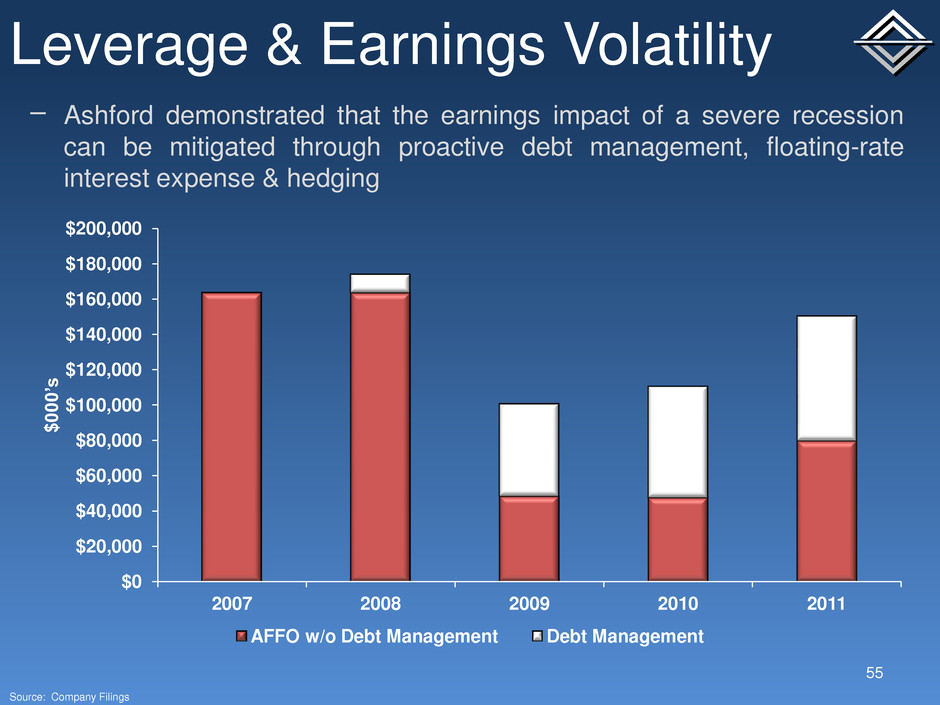
Leverage & Earnings Volatility 55 $0 $20,000 $40,000 $60,000 $80,000 $100,000 $120,000 $140,000 $160,000 $180,000 $200,000 2007 2008 2009 2010 2011 $000’ s AFFO w/o Debt Management Debt Management − Ashford demonstrated that the earnings impact of a severe recession can be mitigated through proactive debt management, floating-rate interest expense & hedging Source: Company Filings
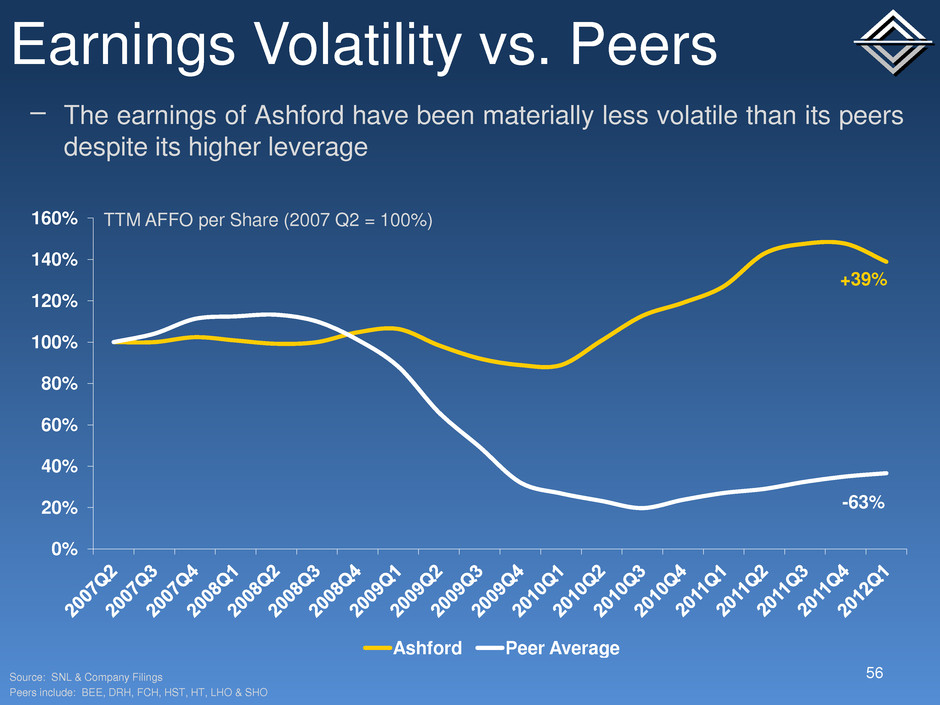
Earnings Volatility vs. Peers 56 − The earnings of Ashford have been materially less volatile than its peers despite its higher leverage TTM AFFO per Share (2007 Q2 = 100%) Source: SNL & Company Filings Peers include: BEE, DRH, FCH, HST, HT, LHO & SHO 0% 20% 40% 60% 80% 100% 120% 140% 160% Ashford Peer Average +39% -63%

Leverage & Stock Volatility 57 − Leverage may impact the volatility of a stock in the short-term, but not necessarily over the long-term Includes all REITs with their multiples normalized across property types Source: Bloomberg 5-year Avg Debt / EBITDA vs. Normalized 5-year Volatility R² = 0.09 0.0x 2.0x 4.0x 6.0x 8.0x 10.0x 12.0x 0.0% 20.0% 40.0% 60.0% 80.0% 100.0% 120.0% 140.0% 160.0%
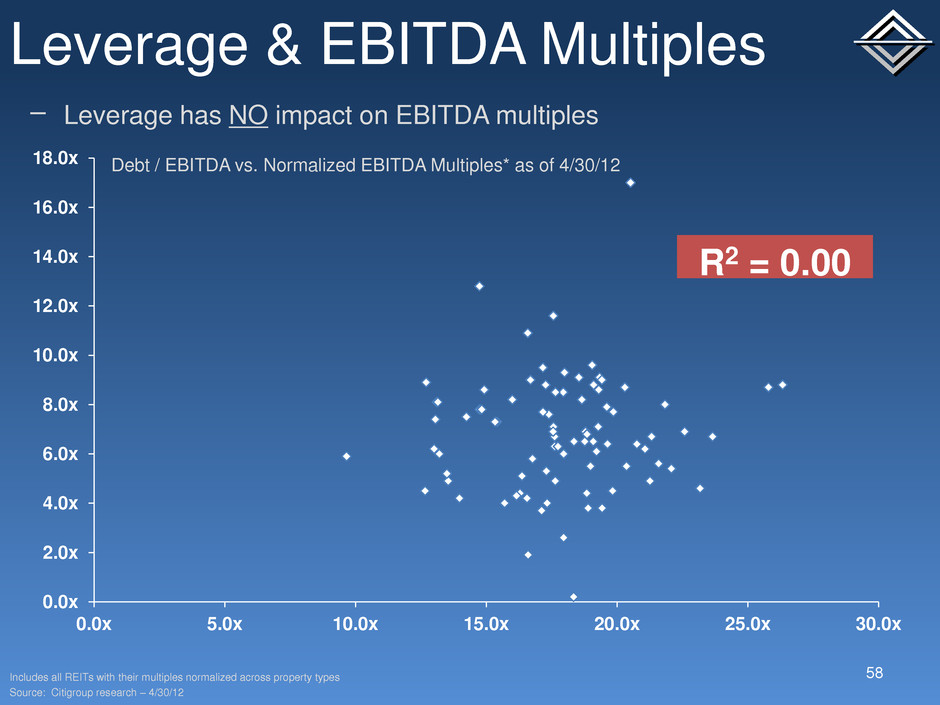
0.0x 2.0x 4.0x 6.0x 8.0x 10.0x 12.0x 14.0x 16.0x 18.0x 0.0x 5.0x 10.0x 15.0x 20.0x 25.0x 30.0x Leverage & EBITDA Multiples 58 − Leverage has NO impact on EBITDA multiples Debt / EBITDA vs. Normalized EBITDA Multiples* as of 4/30/12 Includes all REITs with their multiples normalized across property types Source: Citigroup research – 4/30/12 R2 = 0.00
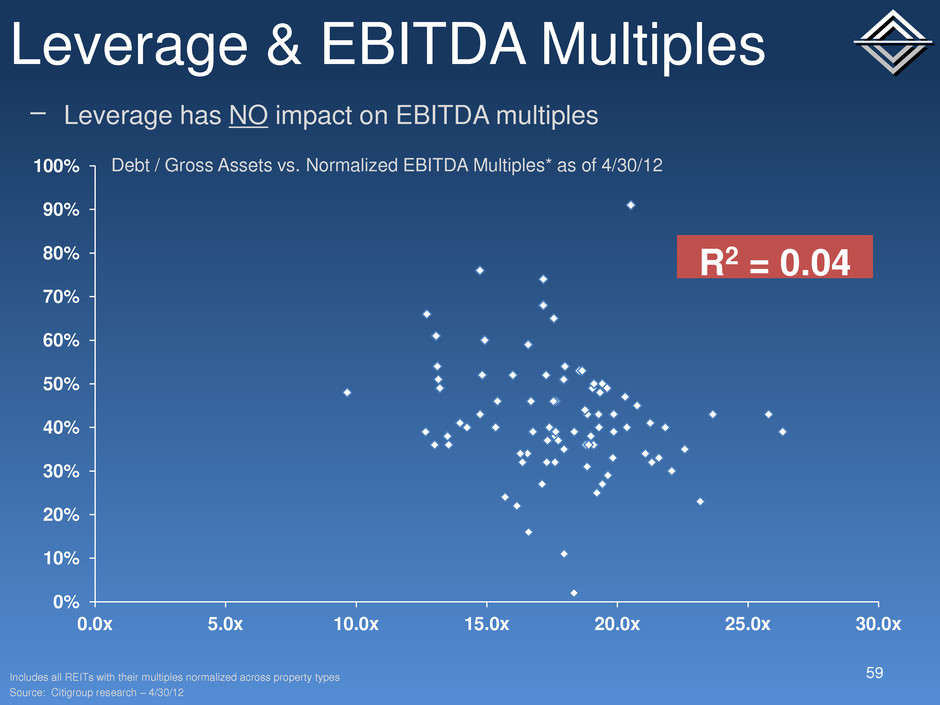
Leverage & EBITDA Multiples 59 − Leverage has NO impact on EBITDA multiples Debt / Gross Assets vs. Normalized EBITDA Multiples* as of 4/30/12 Includes all REITs with their multiples normalized across property types Source: Citigroup research – 4/30/12 0% 10% 20% 30% 40% 50% 60% 70% 80% 90% 100% 0.0x 5.0x 10.0x 15.0x 20.0x 25.0x 30.0x R2 = 0.04
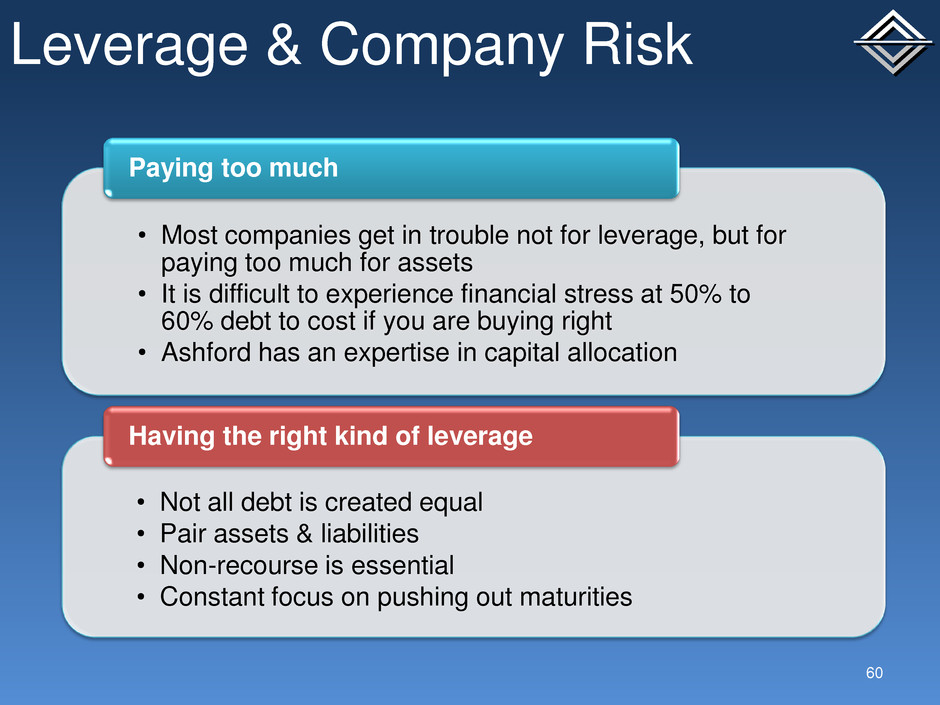
Leverage & Company Risk 60 • Most companies get in trouble not for leverage, but for paying too much for assets • It is difficult to experience financial stress at 50% to 60% debt to cost if you are buying right • Ashford has an expertise in capital allocation Paying too much • Not all debt is created equal • Pair assets & liabilities • Non-recourse is essential • Constant focus on pushing out maturities Having the right kind of leverage
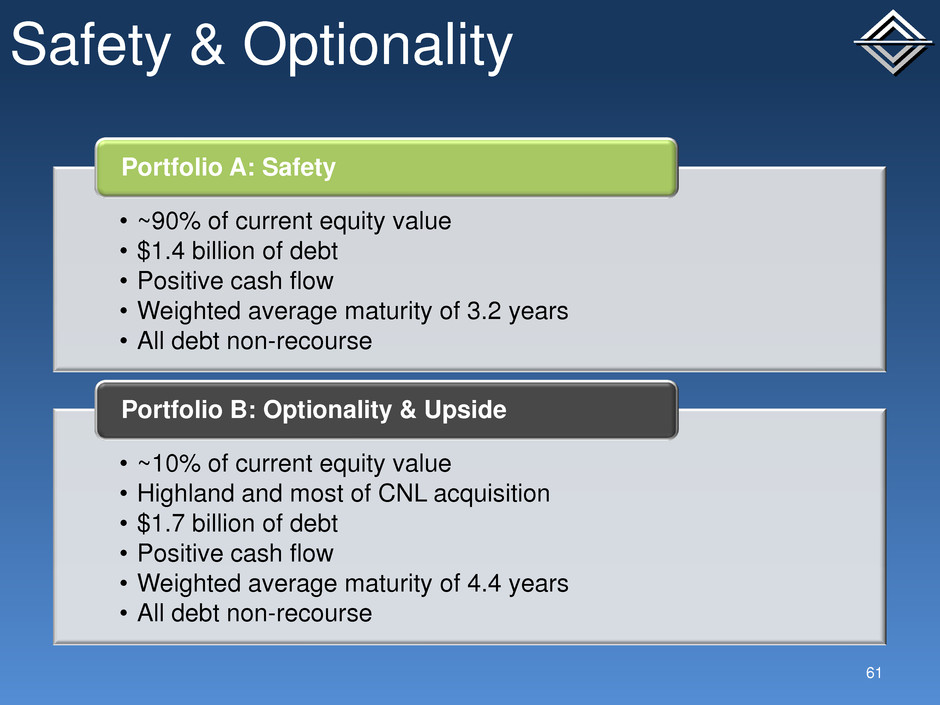
Safety & Optionality 61 • ~90% of current equity value • $1.4 billion of debt • Positive cash flow • Weighted average maturity of 3.2 years • All debt non-recourse Portfolio A: Safety • ~10% of current equity value • Highland and most of CNL acquisition • $1.7 billion of debt • Positive cash flow • Weighted average maturity of 4.4 years • All debt non-recourse Portfolio B: Optionality & Upside

Leverage & Lost Opportunity 62 − Having higher leverage has not prevented Ashford from completing one acquisition or transaction it wanted to Acquisitions • CNL – 2007 • Highland - 2011 Capital Markets • Common stock buybacks • Preferred stock buybacks • Hedging • Preferred stock issuance • Common stock issuance • Debt refinancings
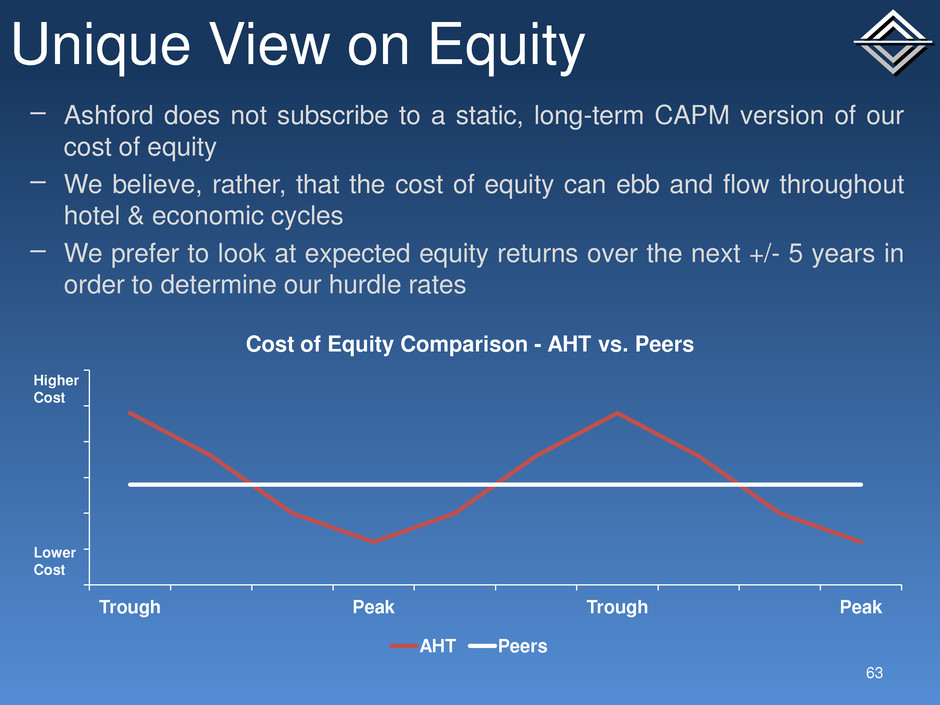
Unique View on Equity 63 − Ashford does not subscribe to a static, long-term CAPM version of our cost of equity − We believe, rather, that the cost of equity can ebb and flow throughout hotel & economic cycles − We prefer to look at expected equity returns over the next +/- 5 years in order to determine our hurdle rates Trough Peak Trough Peak Cost of Equity Comparison - AHT vs. Peers AHT Peers Higher Cost Lower Cost
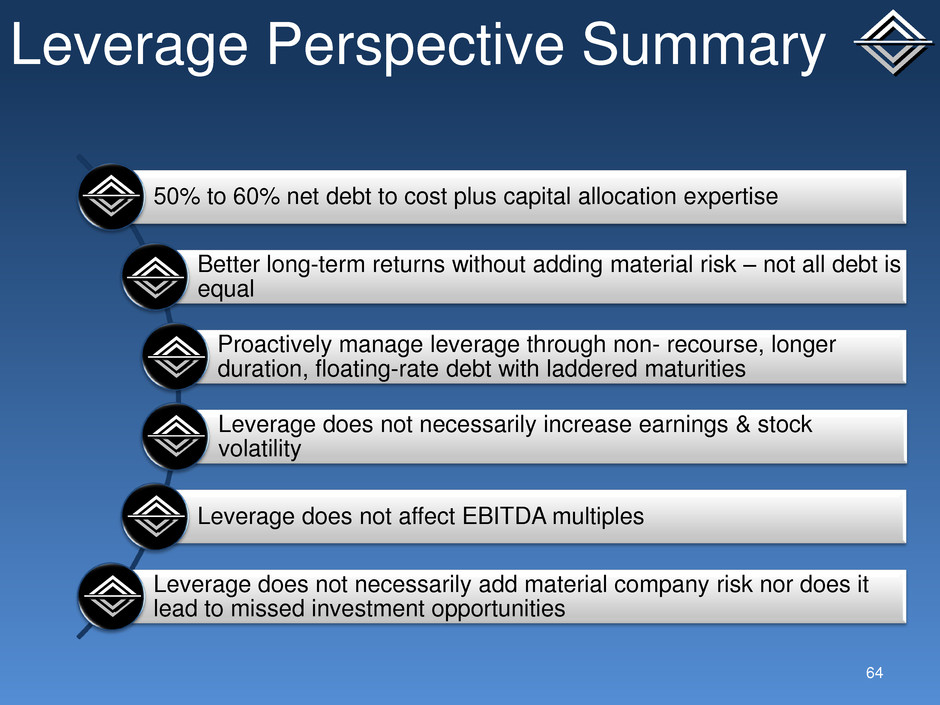
50% to 60% net debt to cost plus capital allocation expertise Better long-term returns without adding material risk – not all debt is equal Proactively manage leverage through non- recourse, longer duration, floating-rate debt with laddered maturities Leverage does not necessarily increase earnings & stock volatility Leverage does not affect EBITDA multiples Leverage does not necessarily add material company risk nor does it lead to missed investment opportunities Leverage Perspective Summary 64
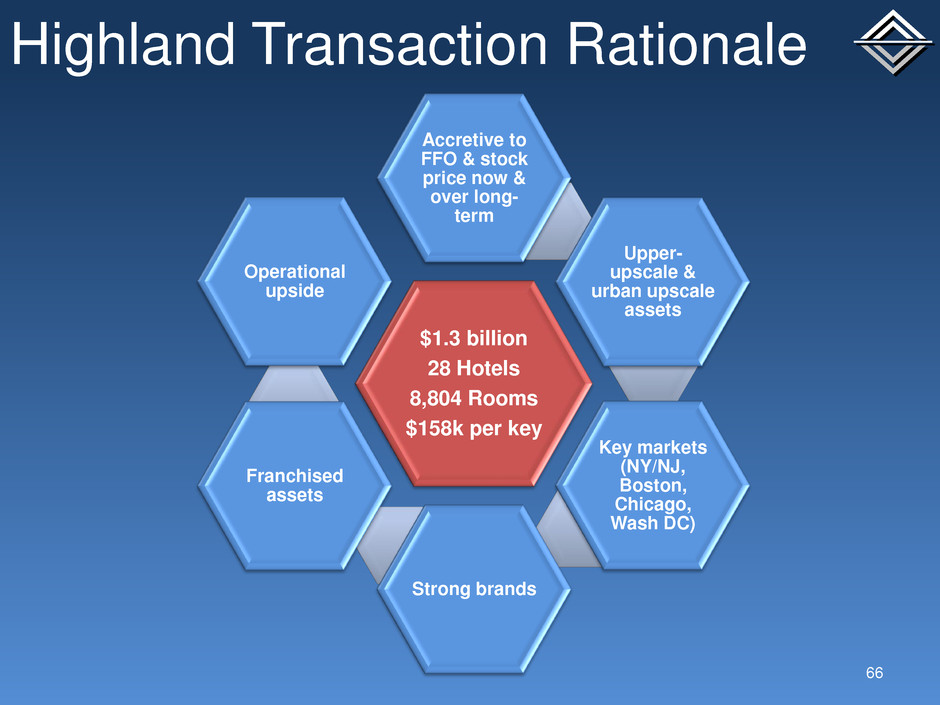
Highland Transaction Rationale 66 $1.3 billion 28 Hotels 8,804 Rooms $158k per key Accretive to FFO & stock price now & over long- term Upper- upscale & urban upscale assets Key markets (NY/NJ, Boston, Chicago, Wash DC) Strong brands Franchised assets Operational upside
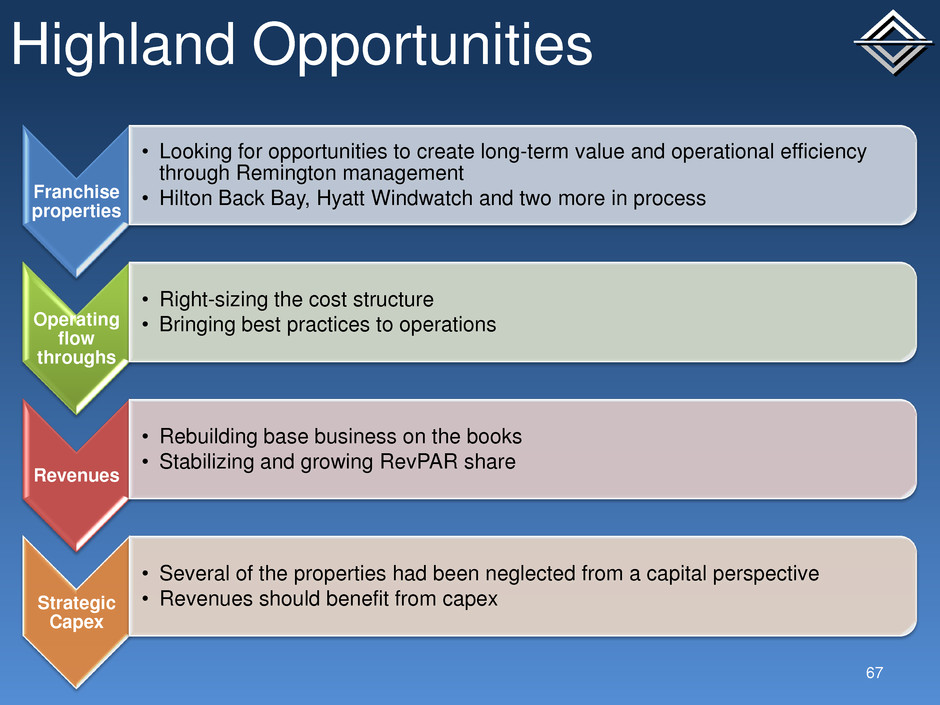
Highland Opportunities 67 Franchise properties • Looking for opportunities to create long-term value and operational efficiency through Remington management • Hilton Back Bay, Hyatt Windwatch and two more in process Operating flow throughs • Right-sizing the cost structure • Bringing best practices to operations Revenues • Rebuilding base business on the books • Stabilizing and growing RevPAR share Strategic Capex • Several of the properties had been neglected from a capital perspective • Revenues should benefit from capex
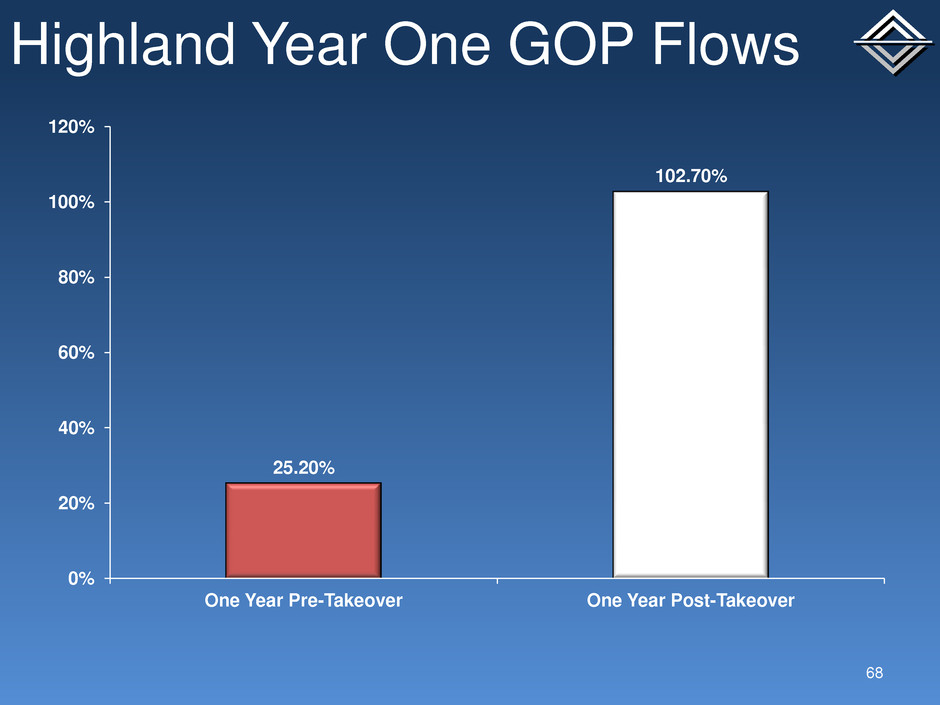
Highland Year One GOP Flows 68 25.20% 102.70% 0% 20% 40% 60% 80% 100% 120% One Year Pre-Takeover One Year Post-Takeover
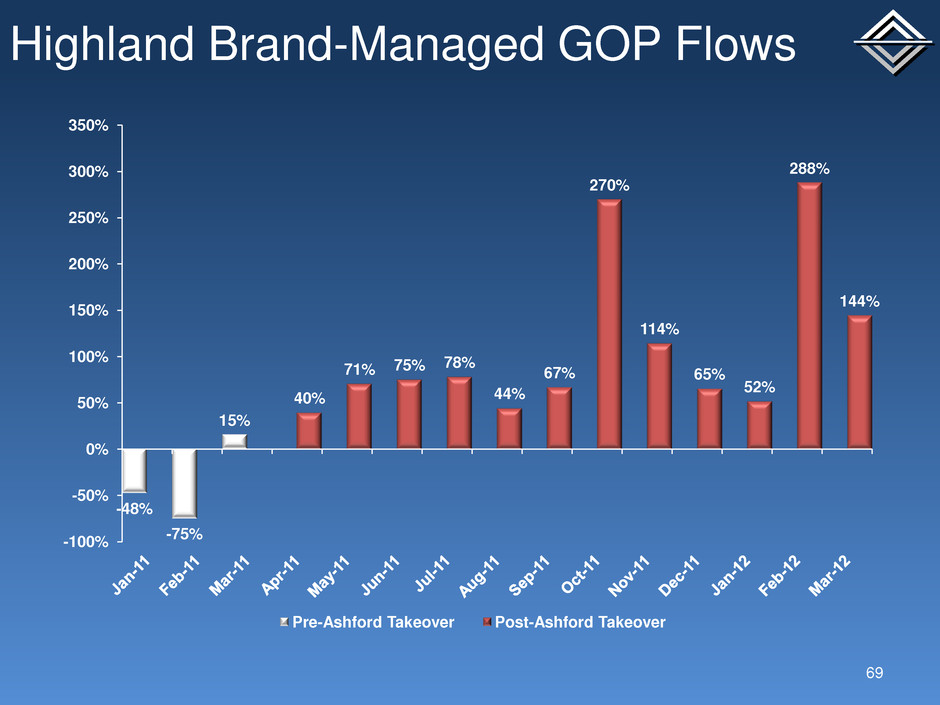
Highland Brand-Managed GOP Flows 69 -48% -75% 15% 40% 71% 75% 78% 44% 67% 270% 114% 65% 52% 288% 144% -100% -50% 0% 50% 100% 150% 200% 250% 300% 350% Pre-Ashford Takeover Post-Ashford Takeover
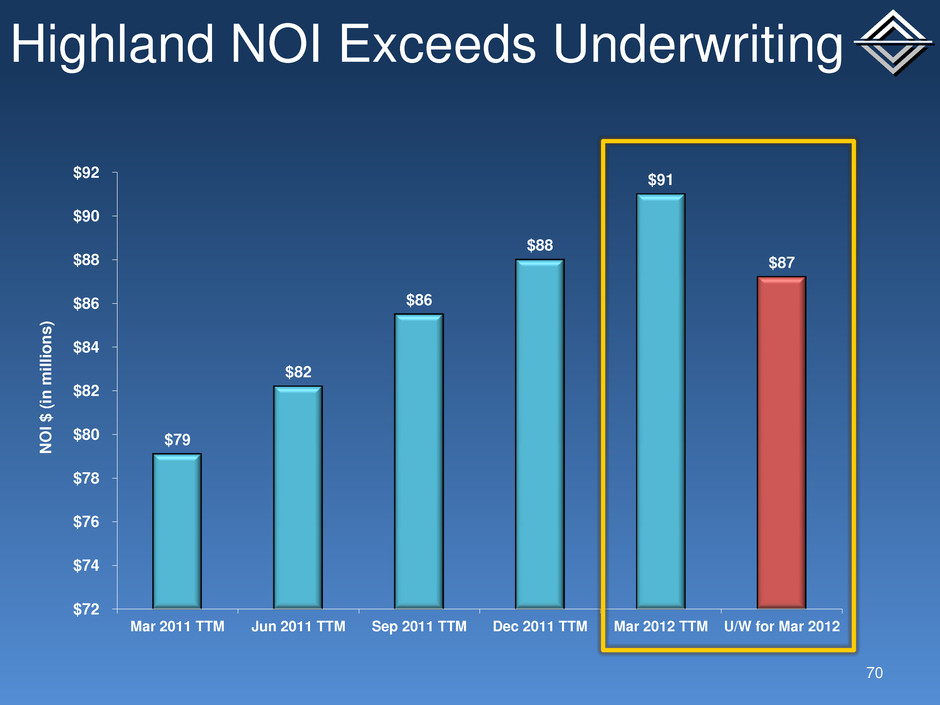
Highland NOI Exceeds Underwriting 70 $79 $82 $86 $88 $91 $87 $72 $74 $76 $78 $80 $82 $84 $86 $88 $90 $92 Mar 2011 TTM Jun 2011 TTM Sep 2011 TTM Dec 2011 TTM Mar 2012 TTM U/W for Mar 2012 NOI $ (in m il lion s )
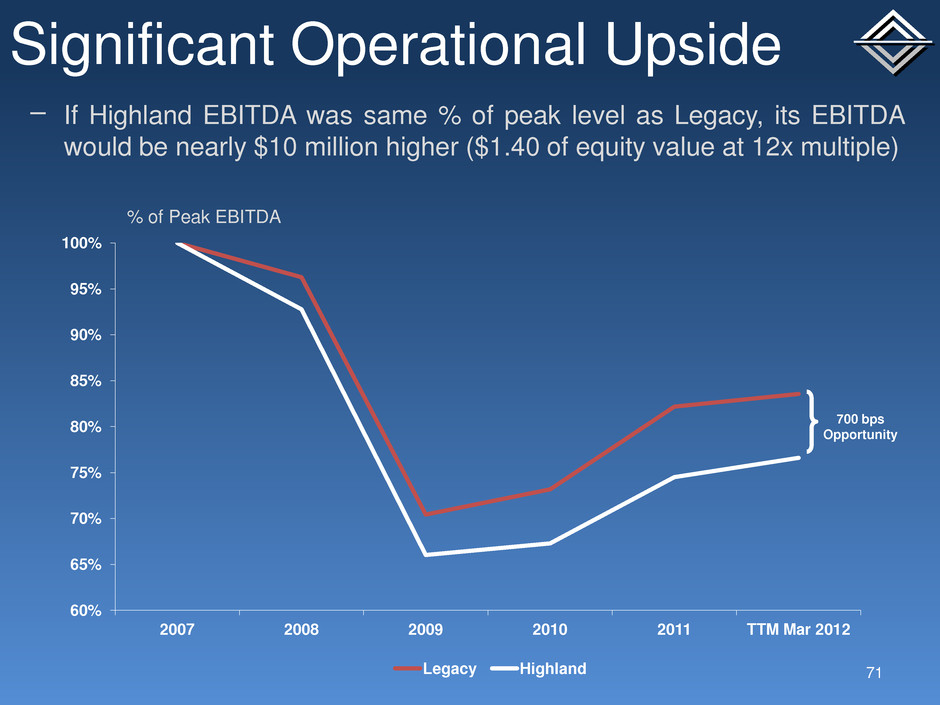
Significant Operational Upside 71 60% 65% 70% 75% 80% 85% 90% 95% 100% 2007 2008 2009 2010 2011 TTM Mar 2012 Legacy Highland 700 bps Opportunity % of Peak EBITDA − If Highland EBITDA was same % of peak level as Legacy, its EBITDA would be nearly $10 million higher ($1.40 of equity value at 12x multiple)

Key Highland Capex 72 Property Project Scheduled Start Date Budget Courtyard Denver Lobby Bistro Complete $875,000 The Churchill Lobby & Restaurant Complete $871,000 Marriott San Antonio Guestrooms & Corridors Complete $3,815,000 Ritz-Carlton Atlanta Meeting Space Complete $757,000 Courtyard Savannah Guestrooms Nearing Completion $1,600,000 HGI Virginia Beach Guestrooms & Corridor Nearing Completion $2,000,000 Hyatt Windwatch Exterior Façade Nearing Completion $1,400,000 The Melrose Guestrooms & Public Space In Progress $8,050,000 Courtyard Boston Tremont HVAC In Progress $6,000,000 Hilton Boston Back Bay 66 Guestrooms & Meeting Space Q3 2012 $2,160,000 Marriott Omaha Lobby & Restaurant Q3 2012 $1,350,000 Courtyard Savannah Lobby & Restaurant Q4 2012 $875,000 The Silversmith Guestrooms & Public Space Q4 2012 $7,500,000 Courtyard Boston Tremont Guestrooms & Lobby Q4 2012 $8,000,000 Marriott DFW Restaurant Repositioning Q4 2012 $750,000 Major projects
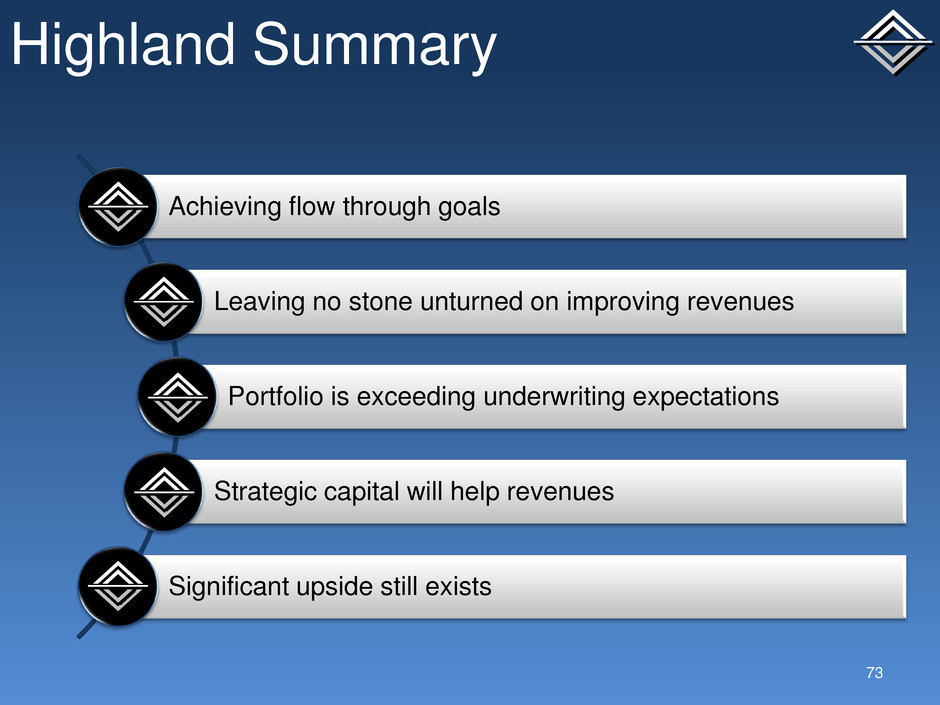
Achieving flow through goals Leaving no stone unturned on improving revenues Portfolio is exceeding underwriting expectations Strategic capital will help revenues Significant upside still exists Highland Summary 73
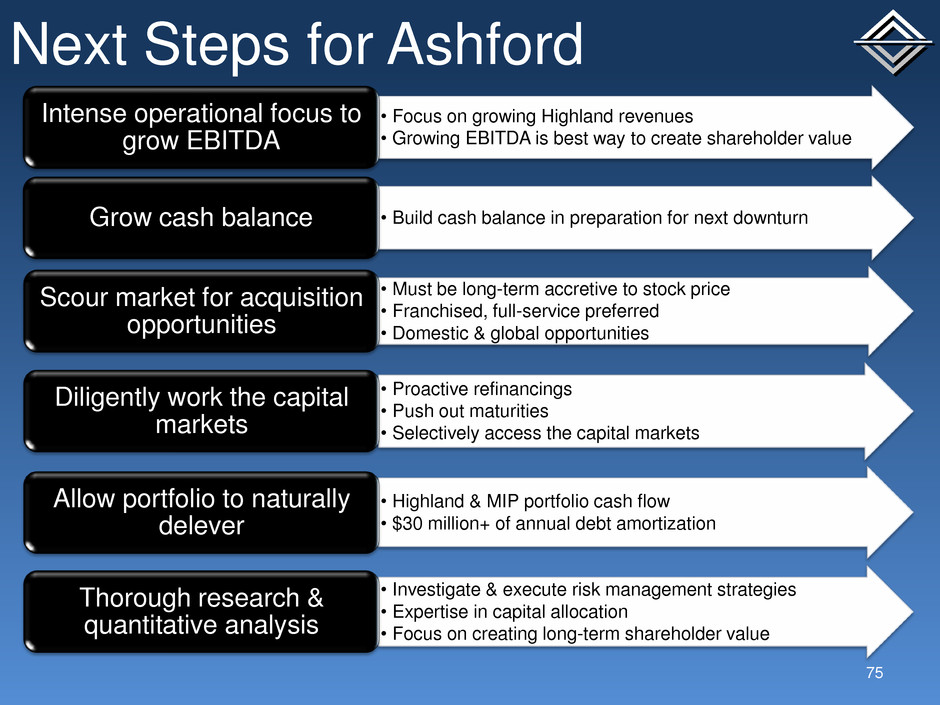
• Focus on growing Highland revenues • Growing EBITDA is best way to create shareholder value Intense operational focus to grow EBITDA • Build cash balance in preparation for next downturn Grow cash balance • Must be long-term accretive to stock price • Franchised, full-service preferred • Domestic & global opportunities Scour market for acquisition opportunities • Proactive refinancings • Push out maturities • Selectively access the capital markets Diligently work the capital markets • Highland & MIP portfolio cash flow • $30 million+ of annual debt amortization Allow portfolio to naturally delever • Investigate & execute risk management strategies • Expertise in capital allocation • Focus on creating long-term shareholder value Thorough research & quantitative analysis Next Steps for Ashford 75


