Investor and Analyst Day October 3, 2017 New York
Forward Looking Statements and Non-GAAP Measures 2 In keeping with the SEC's "Safe Harbor" guidelines, certain statements made during this presentation could be considered forward-looking and subject to certain risks and uncertainties that could cause results to differ materially from those projected. When we use the words "will likely result," "may," "anticipate," "estimate," "should," "expect," "believe," "intend," or similar expressions, we intend to identify forward-looking statements. Such forward-looking statements include, but are not limited to, our business and investment strategy, our understanding of our competition, current market trends and opportunities, projected operating results, and projected capital expenditures. These forward-looking statements are subject to known and unknown risks and uncertainties, which could cause actual results to differ materially from those anticipated including, without limitation: general volatility of the capital markets and the market price of our common stock; changes in our business or investment strategy; availability, terms and deployment of capital; availability of qualified personnel; changes in our industry and the market in which we operate, interest rates or the general economy, and the degree and nature of our competition. These and other risk factors are more fully discussed in the company's filings with the Securities and Exchange Commission. EBITDA is defined as net income before interest, taxes, depreciation and amortization. EBITDA yield is defined as trailing twelve month EBITDA divided by the purchase price or debt amount. A capitalization rate is determined by dividing the property's net operating income by the purchase price. Net operating income is the property's funds from operations minus a capital expense reserve of either 4% or 5% of gross revenues. Hotel EBITDA flow-through is the change in Hotel EBITDA divided by the change in total revenues. EBITDA, FFO, AFFO, CAD and other terms are non-GAAP measures, reconciliations of which have been provided in prior earnings releases and filings with the SEC or in the appendix to this presentation. This overview is for informational purposes only and is not an offer to sell, or a solicitation of an offer to buy or sell, any securities of Ashford Hospitality Trust, Inc. or any of its respective affiliates, and may not be relied upon in connection with the purchase or sale of any such security.
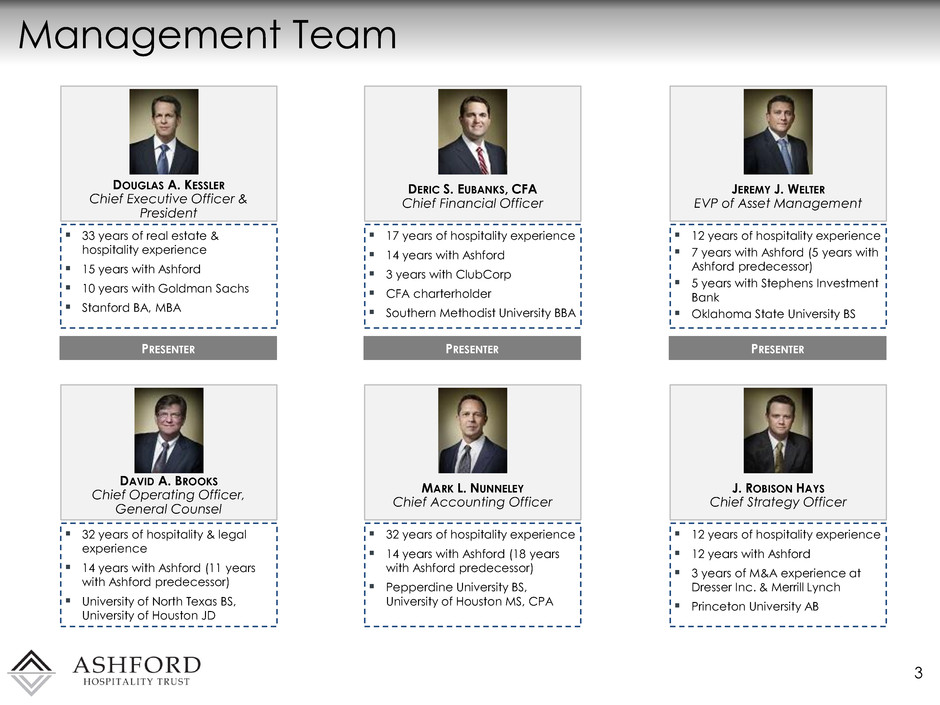
Management Team 3 33 years of real estate & hospitality experience 15 years with Ashford 10 years with Goldman Sachs Stanford BA, MBA DOUGLAS A. KESSLER Chief Executive Officer & President 17 years of hospitality experience 14 years with Ashford 3 years with ClubCorp CFA charterholder Southern Methodist University BBA DERIC S. EUBANKS, CFA Chief Financial Officer 32 years of hospitality experience 14 years with Ashford (18 years with Ashford predecessor) Pepperdine University BS, University of Houston MS, CPA MARK L. NUNNELEY Chief Accounting Officer 32 years of hospitality & legal experience 14 years with Ashford (11 years with Ashford predecessor) University of North Texas BS, University of Houston JD DAVID A. BROOKS Chief Operating Officer, General Counsel 12 years of hospitality experience 7 years with Ashford (5 years with Ashford predecessor) 5 years with Stephens Investment Bank Oklahoma State University BS JEREMY J. WELTER EVP of Asset Management 12 years of hospitality experience 12 years with Ashford 3 years of M&A experience at Dresser Inc. & Merrill Lynch Princeton University AB J. ROBISON HAYS Chief Strategy Officer PRESENTER PRESENTER PRESENTER

Ashford App and Social Media 4 Follow Ashford Inc. Chairman and Chief Executive Officer, Monty J. Bennett, on Twitter at www.twitter.com/MBennettAshford or @MBennettAshford The Ashford App is available for free download at Apple's App Store and Google Play Store by searching "Ashford”

Q&A 5 email questions to: questions@ashfordinc.com
Five Guiding Principles 6 ENGAGING ETHICAL INNOVATIVE PROFITABLE TENACIOUS
Portfolio / Recent Activity – Douglas A. Kessler, CEO & President Hyatt Savannah Savannah, GA

Portfolio Overview 8 (1) As of June 30, 2017 (2) TTM as of June 30, 2017 for the 120 owned hotels as of September 27, 2017 (3) Hotel EBITDA in thousands 120 Hotels 25,000 Rooms $5.7B Gross Assets(1) 31 States TOP TEN METRO AREAS(2),(3) PORTFOLIO BY HOTEL EBITDA(2) Brand Property Manager MSA Chainscale Marriott 57% Hilton 28% Hyatt 4% IHG 5% Indep. 6% Upscale 33% Upper-Upscale 55% Luxury 5% Upper-Midscale 3% Indep. 4% TTM Hotel % of EBITDA Total Washington DC $46,353 9.9% San Fran/Oakland, CA $34,705 7.4% Los Angeles, CA $34,268 7.3% New York/New Jersey $30,338 6.5% Boston, MA $26,601 5.7% Nashville, TN $26,578 5.7% Atlanta, GA $26,525 5.7% DFW, TX $25,455 5.4% Minn./St. Paul, MN $16,687 3.6% Austin, TX $13,160 2.8% Total Portfolio $468,407 100.0% Top 25 74% Top 50 18% Other 8% Marriott 31% Hilton 6% Hyatt 3% Remington 59% Interstate <1% $122 RevPAR(2)
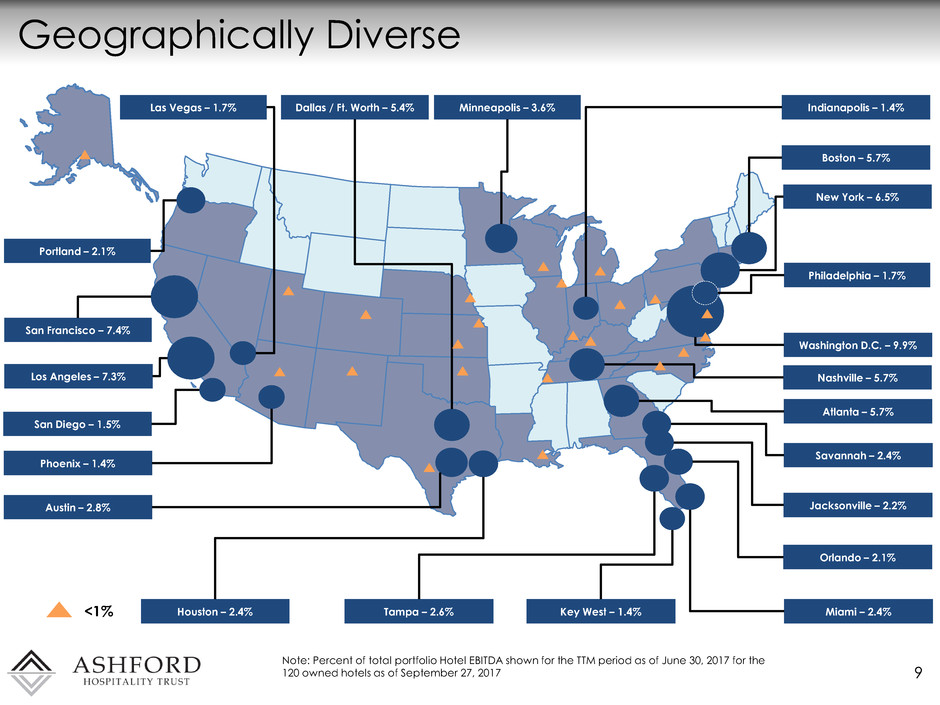
9 <1% Geographically Diverse Washington D.C. – 9.9% Los Angeles – 7.3% San Francisco – 7.4% New York – 6.5% Boston – 5.7% Nashville – 5.7% Atlanta – 5.7% Dallas / Ft. Worth – 5.4% Minneapolis – 3.6% Tampa – 2.6% Houston – 2.4% Miami – 2.4% Orlando – 2.1% San Diego – 1.5% Philadelphia – 1.7% Portland – 2.1% Key West – 1.4% Indianapolis – 1.4% Jacksonville – 2.2% Austin – 2.8% Las Vegas – 1.7% Phoenix – 1.4% Savannah – 2.4% Note: Percent of total portfolio Hotel EBITDA shown for the TTM period as of June 30, 2017 for the 120 owned hotels as of September 27, 2017
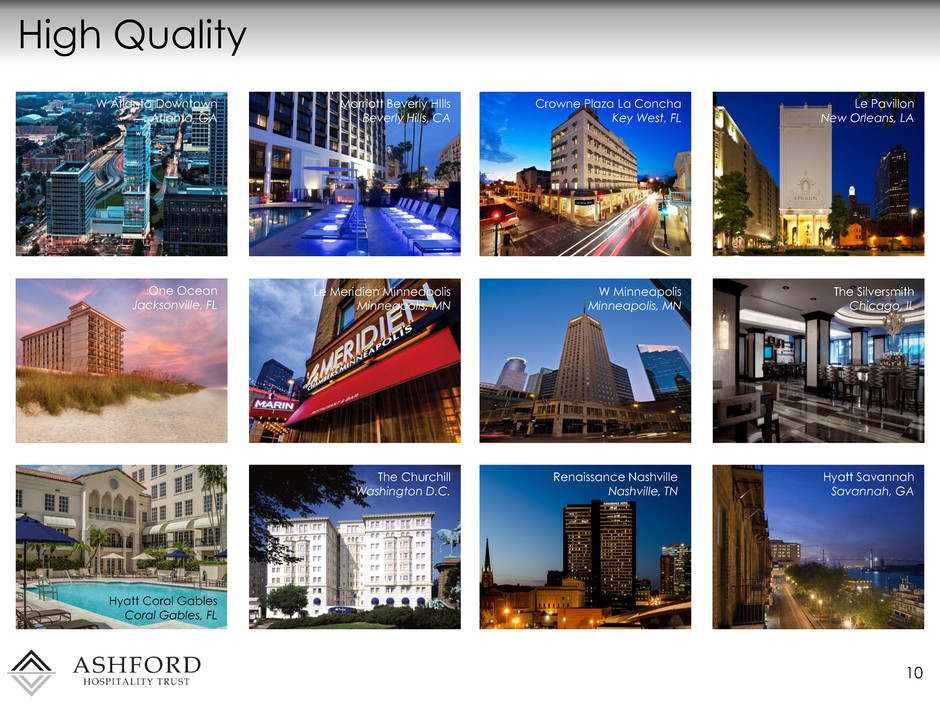
High Quality 10 Crowne Plaza La Concha Key West, FL W Atlanta Downtown Atlanta, GA Marriott Beverly HIlls Beverly Hills, CA Le Pavillon New Orleans, LA One Ocean Jacksonville, FL Le Meridien Minneapolis Minneapolis, MN W Minneapolis Minneapolis, MN The Silversmith Chicago, IL Hyatt Coral Gables Coral Gables, FL The Churchill Washington D.C. Renaissance Nashville Nashville, TN Hyatt Savannah Savannah, GA
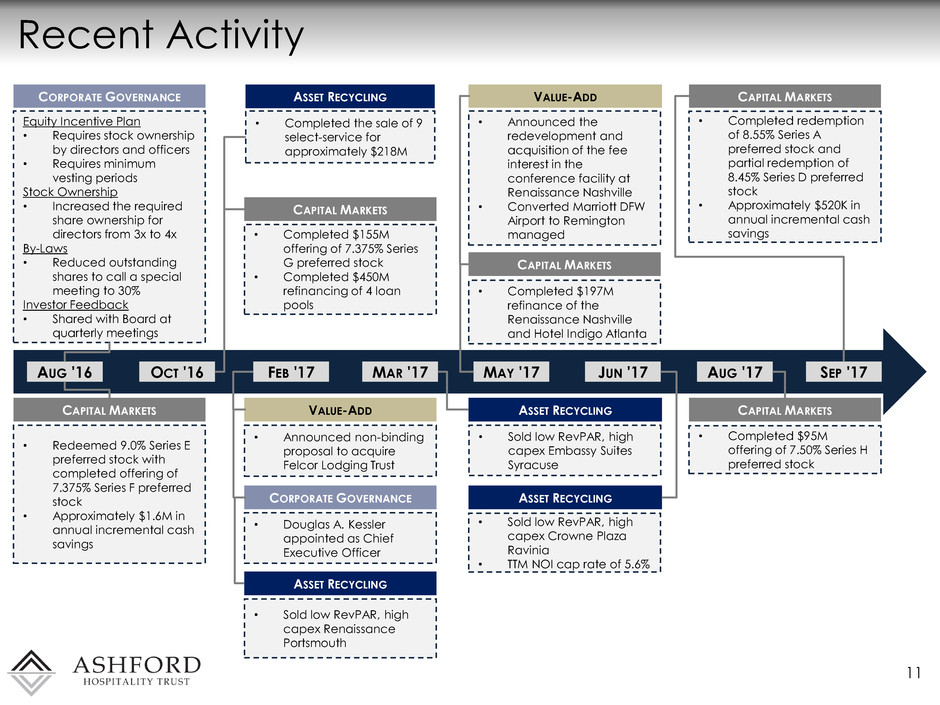
Recent Activity 11 Equity Incentive Plan • Requires stock ownership by directors and officers • Requires minimum vesting periods Stock Ownership • Increased the required share ownership for directors from 3x to 4x By-Laws • Reduced outstanding shares to call a special meeting to 30% Investor Feedback • Shared with Board at quarterly meetings CORPORATE GOVERNANCE • Redeemed 9.0% Series E preferred stock with completed offering of 7.375% Series F preferred stock • Approximately $1.6M in annual incremental cash savings CAPITAL MARKETS • Completed $155M offering of 7.375% Series G preferred stock • Completed $450M refinancing of 4 loan pools CAPITAL MARKETS • Completed the sale of 9 select-service for approximately $218M ASSET RECYCLING • Douglas A. Kessler appointed as Chief Executive Officer CORPORATE GOVERNANCE • Announced non-binding proposal to acquire Felcor Lodging Trust VALUE-ADD • Announced the redevelopment and acquisition of the fee interest in the conference facility at Renaissance Nashville • Converted Marriott DFW Airport to Remington managed VALUE-ADD • Completed $197M refinance of the Renaissance Nashville and Hotel Indigo Atlanta CAPITAL MARKETS • Sold low RevPAR, high capex Renaissance Portsmouth ASSET RECYCLING • Sold low RevPAR, high capex Embassy Suites Syracuse ASSET RECYCLING • Sold low RevPAR, high capex Crowne Plaza Ravinia • TTM NOI cap rate of 5.6% ASSET RECYCLING • Completed redemption of 8.55% Series A preferred stock and partial redemption of 8.45% Series D preferred stock • Approximately $520K in annual incremental cash savings CAPITAL MARKETS AUG '16 OCT '16 FEB '17 MAY '17 MAR '17 JUN '17 SEP '17 AUG '17 • Completed $95M offering of 7.50% Series H preferred stock CAPITAL MARKETS
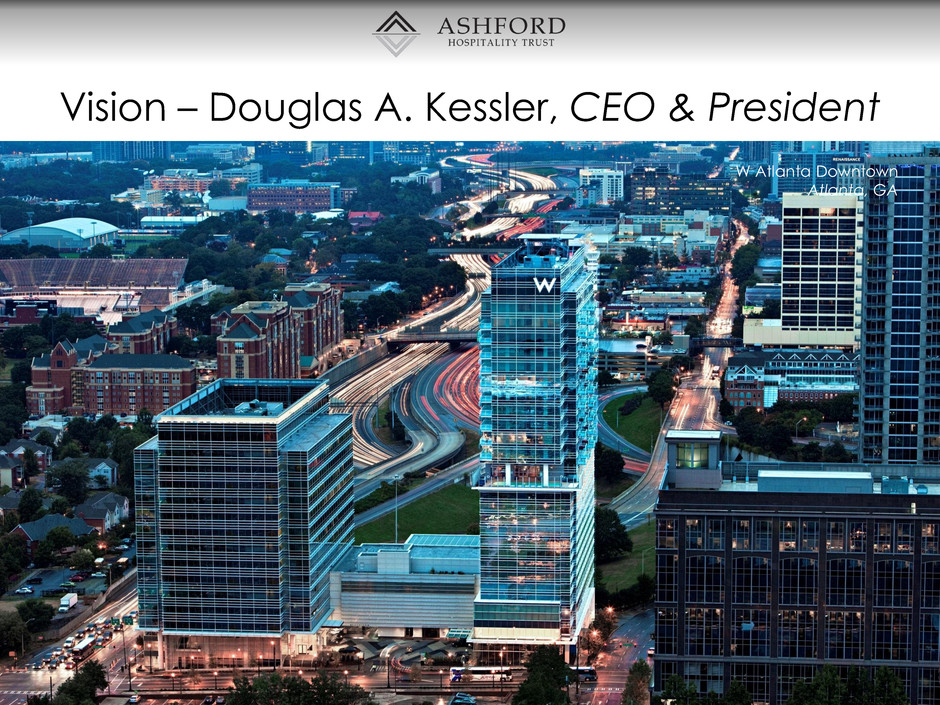
Vision – Douglas A. Kessler, CEO & President W Atlanta Downtown Atlanta, GA
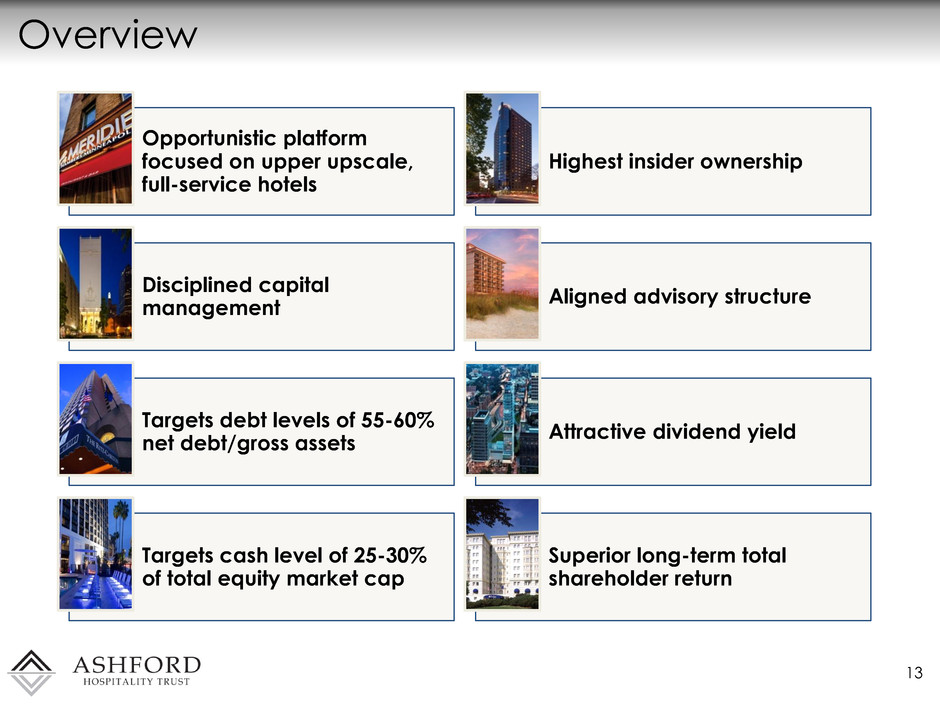
Overview 13 Opportunistic platform focused on upper upscale, full-service hotels Highest insider ownership Disciplined capital management Aligned advisory structure Targets debt levels of 55-60% net debt/gross assets Attractive dividend yield Targets cash level of 25-30% of total equity market cap Superior long-term total shareholder return
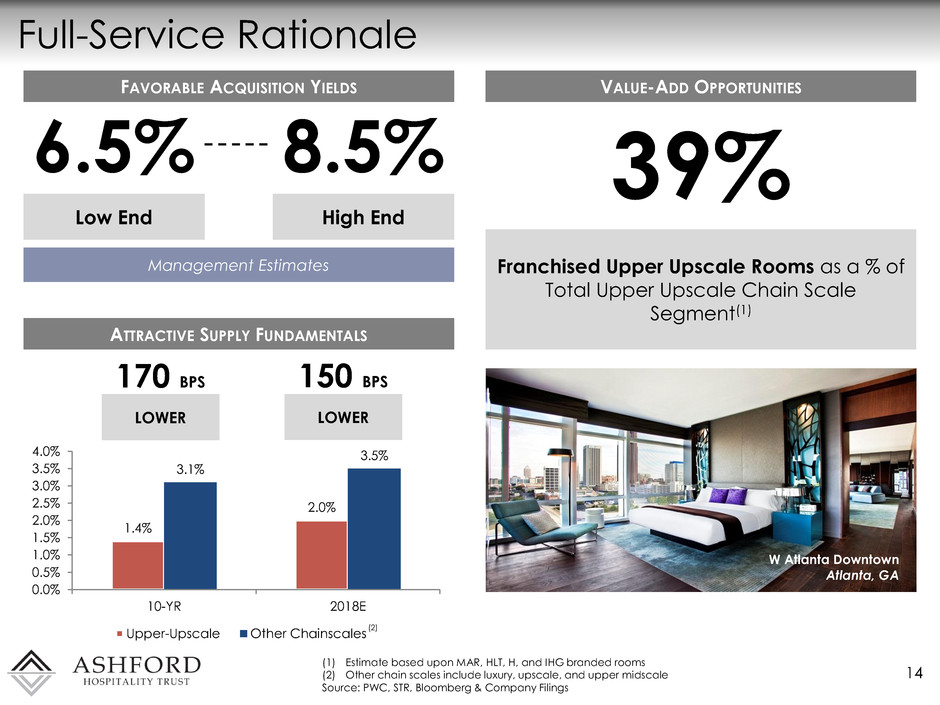
Full-Service Rationale 14 170 BPS ATTRACTIVE SUPPLY FUNDAMENTALS 1.4% 2.0% 3.1% 3.5% 0.0% 0.5% 1.0% 1.5% 2.0% 2.5% 3.0% 3.5% 4.0% 10-YR 2018E Upper-Upscale Other Chainscales LOWER 150 BPS LOWER FAVORABLE ACQUISITION YIELDS 6.5% Low End 8.5% High End Management Estimates VALUE-ADD OPPORTUNITIES 39% Franchised Upper Upscale Rooms as a % of Total Upper Upscale Chain Scale Segment(1) (1) Estimate based upon MAR, HLT, H, and IHG branded rooms (2) Other chain scales include luxury, upscale, and upper midscale Source: PWC, STR, Bloomberg & Company Filings (2) W Atlanta Downtown Atlanta, GA
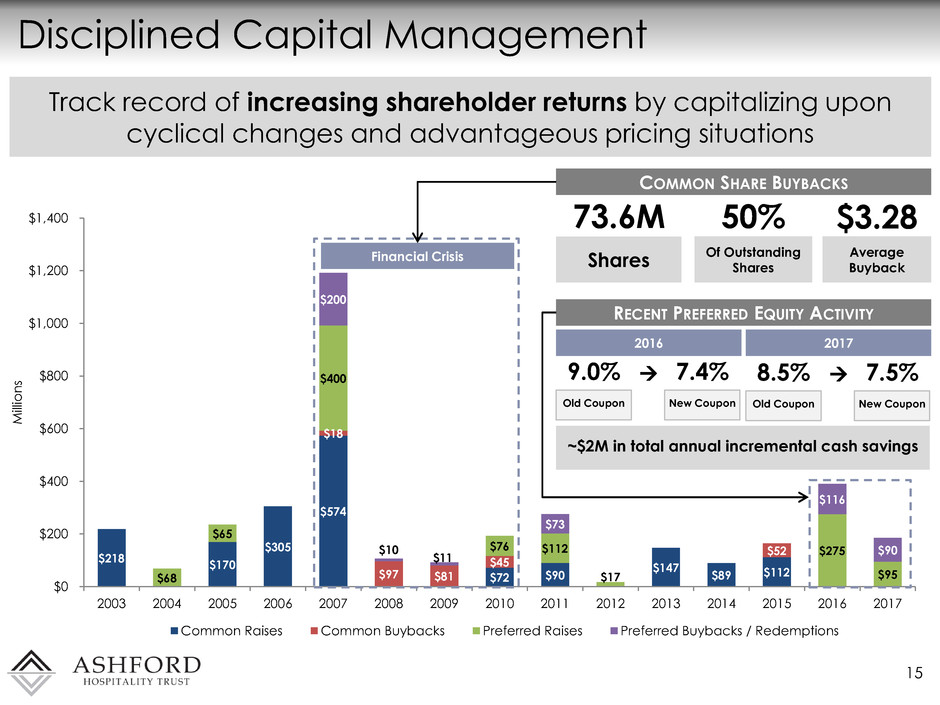
$218 $170 $305 $574 $72 $90 $147 $89 $112 $18 $97 $81 $45 $52 $68 $65 $400 $76 $112 $17 $275 $95 $200 $10 $11 $73 $116 $90 $0 $200 $400 $600 $800 $1,000 $1,200 $1,400 2003 2004 2005 2006 2007 2008 2009 2010 2011 2012 2013 2014 2015 2016 2017 M ill io n s Common Raises Common Buybacks Preferred Raises Preferred Buybacks / Redemptions Disciplined Capital Management 15 Track record of increasing shareholder returns by capitalizing upon cyclical changes and advantageous pricing situations COMMON SHARE BUYBACKS Financial Crisis 73.6M 50% $3.28 Shares Of Outstanding Shares Average Buyback RECENT PREFERRED EQUITY ACTIVITY 9.0% Old Coupon ~$2M in total annual incremental cash savings 7.4% 2016 2017 New Coupon 8.5% Old Coupon 7.5% New Coupon
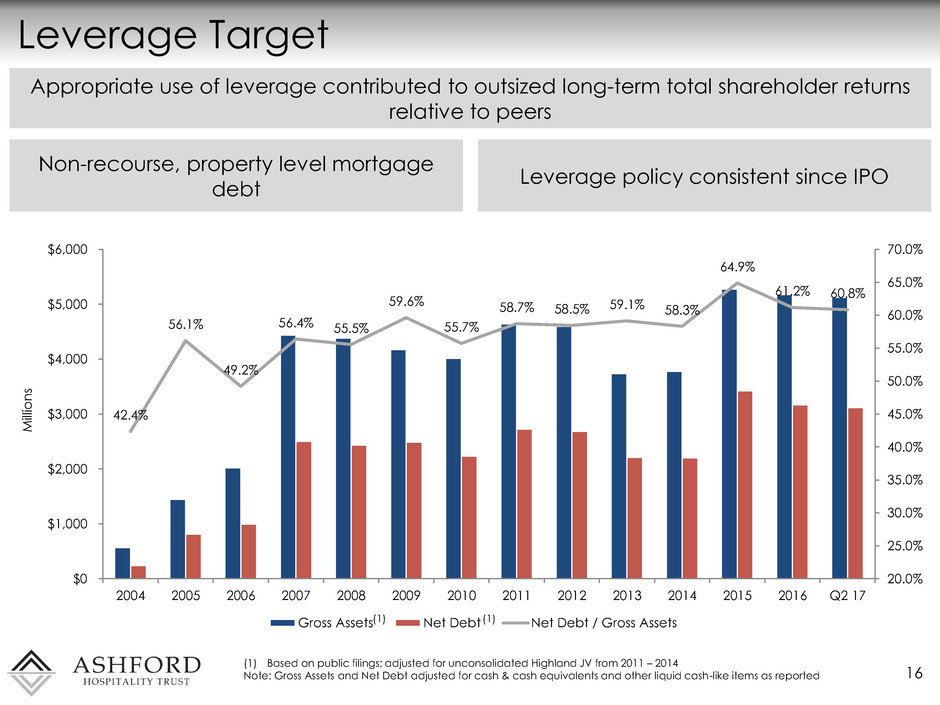
Leverage Target 16 Appropriate use of leverage contributed to outsized long-term total shareholder returns relative to peers Non-recourse, property level mortgage debt Leverage policy consistent since IPO (1) (1) (1) Based on public filings; adjusted for unconsolidated Highland JV from 2011 – 2014 Note: Gross Assets and Net Debt adjusted for cash & cash equivalents and other liquid cash-like items as reported 42.4% 56.1% 49.2% 56.4% 55.5% 59.6% 55.7% 58.7% 58.5% 59.1% 58.3% 64.9% 61.2% 60.8% 20.0% 25.0% 30.0% 35.0% 40.0% 45.0% 50.0% 55.0% 60.0% 65.0% 70.0% $0 $1,000 $2,000 $3,000 $4,000 $5,000 $6,000 2004 2005 2006 2007 2008 2009 2010 2011 2012 2013 2014 2015 2016 Q2 17 M ill io n s Gross Assets Net Debt Net Debt / Gross Assets
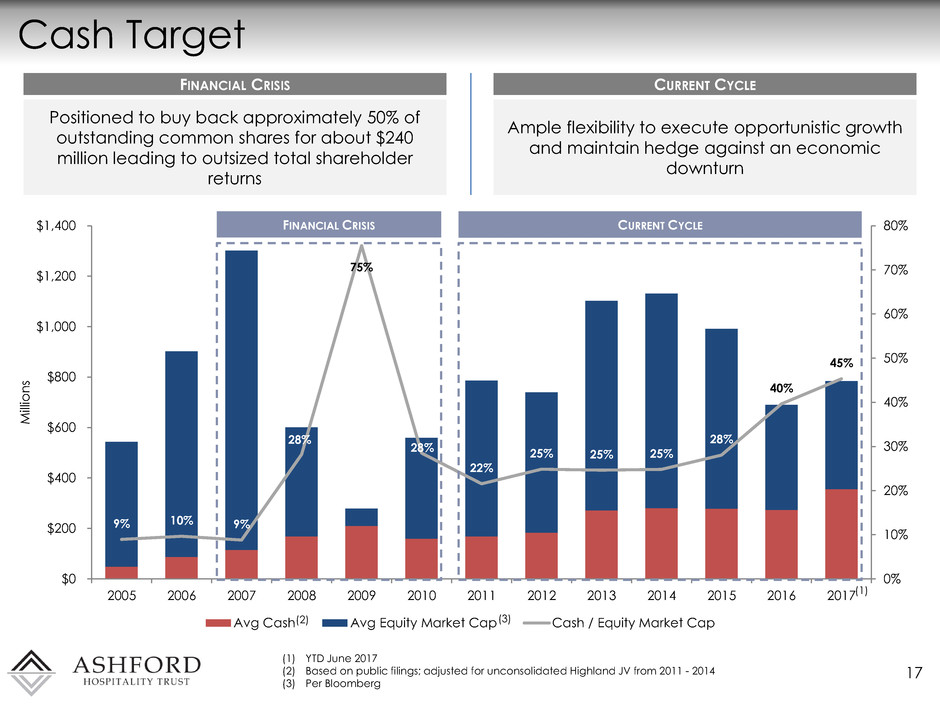
9% 10% 9% 28% 75% 28% 22% 25% 25% 25% 28% 40% 45% 0% 10% 20% 30% 40% 50% 60% 70% 80% $0 $200 $400 $600 $800 $1,000 $1,200 $1,400 2005 2006 2007 2008 2009 2010 2011 2012 2013 2014 2015 2016 2017 M ill io n s Avg Cash Avg Equity Market Cap Cash / Equity Market Cap Cash Target 17 (1) YTD June 2017 (2) Based on public filings; adjusted for unconsolidated Highland JV from 2011 - 2014 (3) Per Bloomberg FINANCIAL CRISIS CURRENT CYCLE FINANCIAL CRISIS Positioned to buy back approximately 50% of outstanding common shares for about $240 million leading to outsized total shareholder returns CURRENT CYCLE Ample flexibility to execute opportunistic growth and maintain hedge against an economic downturn (2) (3) (1)
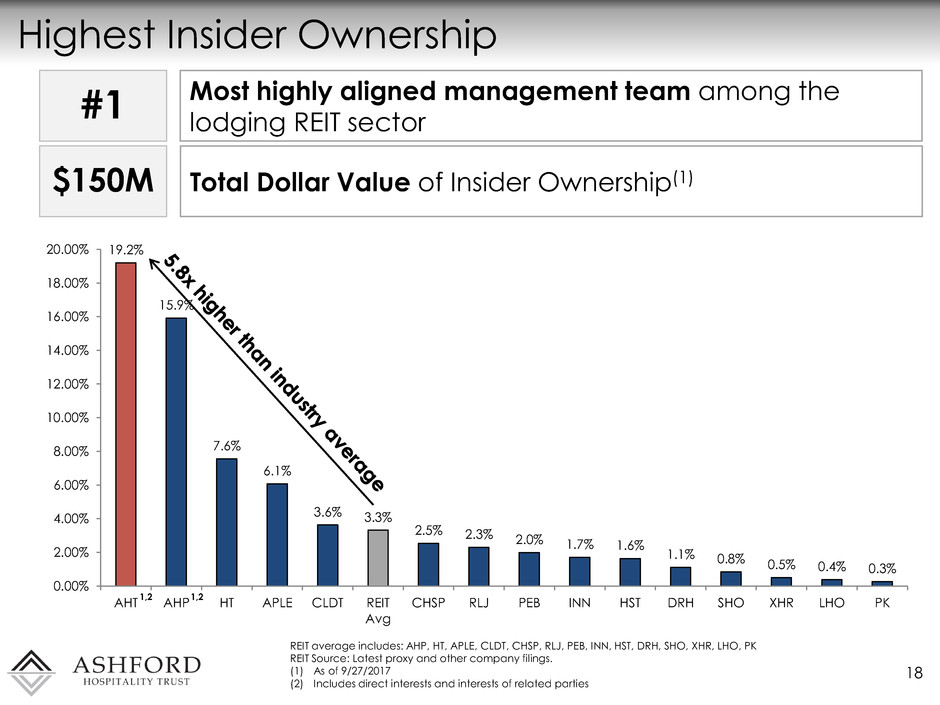
19.2% 15.9% 7.6% 6.1% 3.6% 3.3% 2.5% 2.3% 2.0% 1.7% 1.6% 1.1% 0.8% 0.5% 0.4% 0.3% 0.00% 2.00% 4.00% 6.00% 8.00% 10.00% 12.00% 14.00% 16.00% 18.00% 20.00% AHT AHP HT APLE CLDT REIT Avg CHSP RLJ PEB INN HST DRH SHO XHR LHO PK Highest Insider Ownership 18 REIT average includes: AHP, HT, APLE, CLDT, CHSP, RLJ, PEB, INN, HST, DRH, SHO, XHR, LHO, PK REIT Source: Latest proxy and other company filings. (1) As of 9/27/2017 (2) Includes direct interests and interests of related parties 1,2 Most highly aligned management team among the lodging REIT sector #1 $150M Total Dollar Value of Insider Ownership(1) 1,2
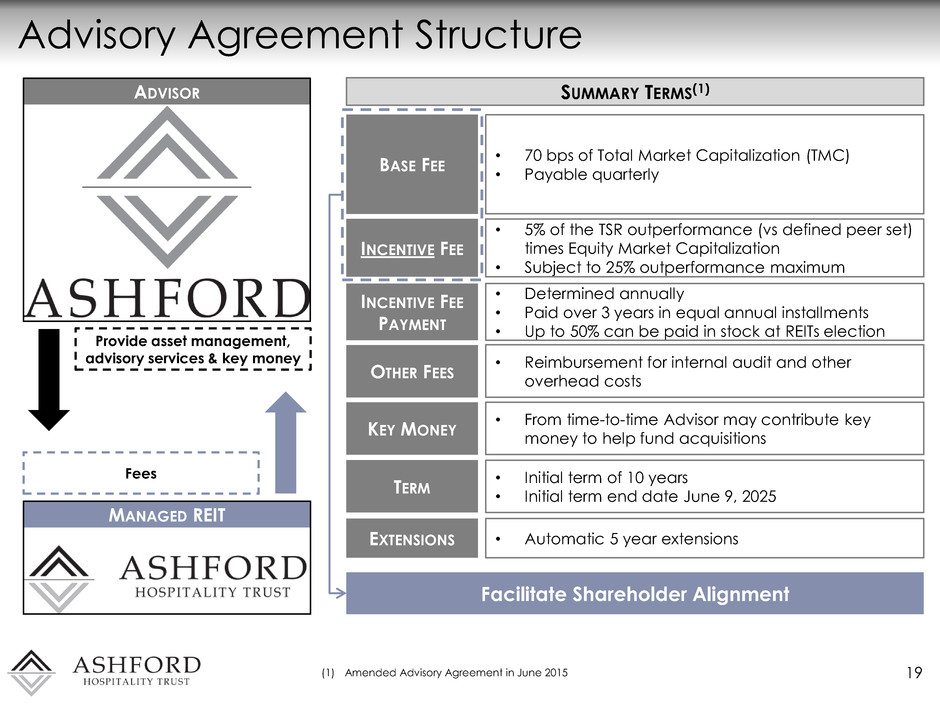
Advisory Agreement Structure 19 (1) Amended Advisory Agreement in June 2015 ADVISOR MANAGED REIT Fees Provide asset management, advisory services & key money SUMMARY TERMS(1) BASE FEE INCENTIVE FEE INCENTIVE FEE PAYMENT OTHER FEES TERM EXTENSIONS • 70 bps of Total Market Capitalization (TMC) • Payable quarterly • 5% of the TSR outperformance (vs defined peer set) times Equity Market Capitalization • Subject to 25% outperformance maximum • Determined annually • Paid over 3 years in equal annual installments • Up to 50% can be paid in stock at REITs election • Reimbursement for internal audit and other overhead costs • Initial term of 10 years • Initial term end date June 9, 2025 • Automatic 5 year extensions KEY MONEY • From time-to-time Advisor may contribute key money to help fund acquisitions Facilitate Shareholder Alignment
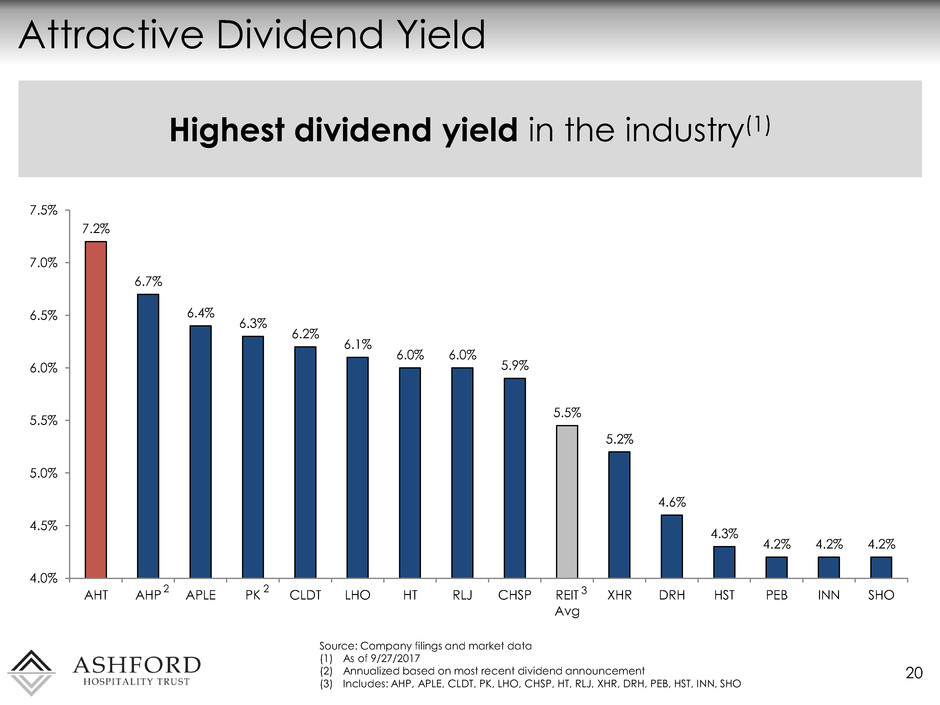
7.2% 6.7% 6.4% 6.3% 6.2% 6.1% 6.0% 6.0% 5.9% 5.5% 5.2% 4.6% 4.3% 4.2% 4.2% 4.2% 4.0% 4.5% 5.0% 5.5% 6.0% 6.5% 7.0% 7.5% AHT AHP APLE PK CLDT LHO HT RLJ CHSP REIT Avg XHR DRH HST PEB INN SHO Attractive Dividend Yield 20 Source: Company filings and market data (1) As of 9/27/2017 (2) Annualized based on most recent dividend announcement (3) Includes: AHP, APLE, CLDT, PK, LHO, CHSP, HT, RLJ, XHR, DRH, PEB, HST, INN, SHO 2 2 3 Highest dividend yield in the industry(1)
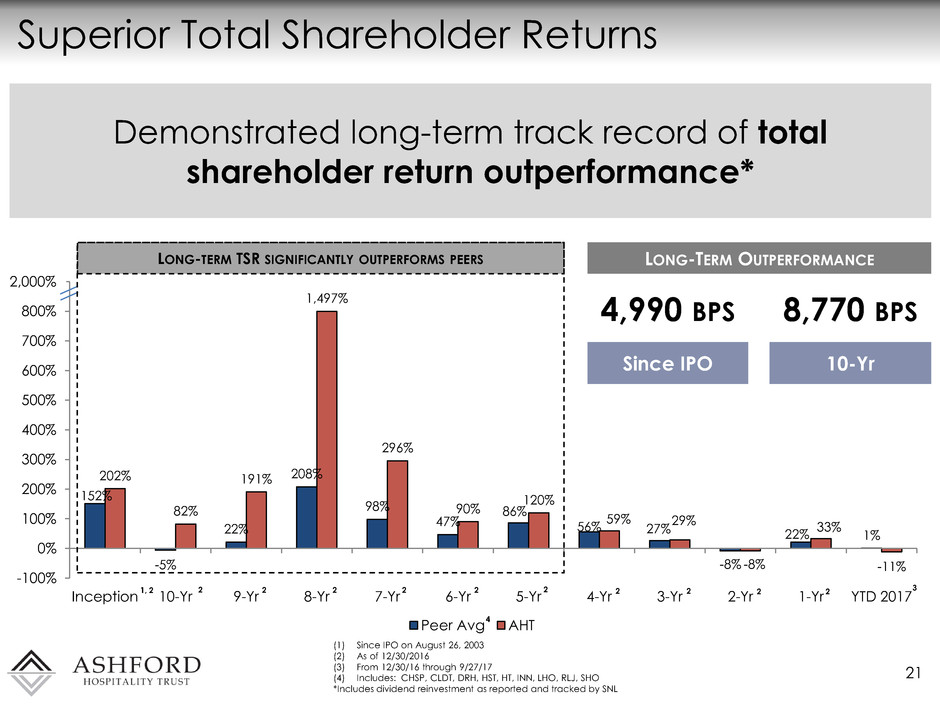
152% -5% 22% 208% 98% 47% 86% 56% 27% -8% 22% 1% 202% 82% 191% 1,497% 296% 90% 120% 59% 29% -8% 33% -11% -100% 0% 100% 200% 300% 400% 500% 600% 700% 800% 900% Inception 10-Yr 9-Yr 8-Yr 7-Yr 6-Yr 5-Yr 4-Yr 3-Yr 2-Yr 1-Yr YTD 2017 Peer Avg AHT Superior Total Shareholder Returns 21 (1) Since IPO on August 26, 2003 (2) As of 12/30/2016 (3) From 12/30/16 through 9/27/17 (4) Includes: CHSP, CLDT, DRH, HST, HT, INN, LHO, RLJ, SHO *Includes dividend reinvestment as reported and tracked by SNL LONG-TERM TSR SIGNIFICANTLY OUTPERFORMS PEERS 1, 2 2,000 2 2 2 2 2 2 2 2 2 2 3 4 Demonstrated long-term track record of total shareholder return outperformance* LONG-TERM OUTPERFORMANCE 4,990 BPS Since IPO 8,770 BPS 10-Yr

Strategy Execution – Douglas A. Kessler, CEO & President Le Meridien Minneapolis Minneapolis, MN
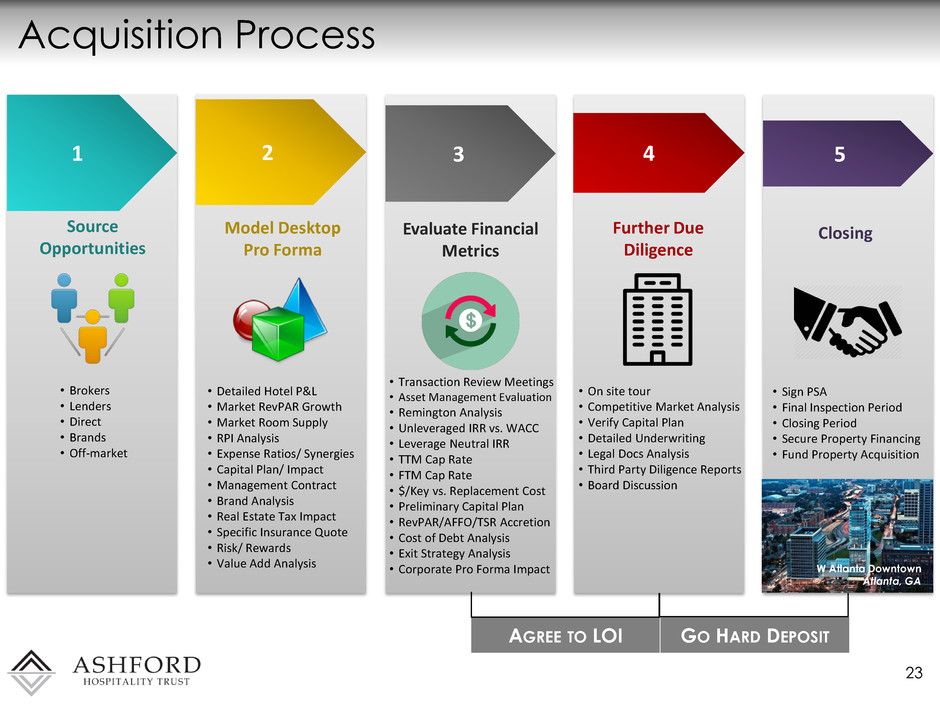
Acquisition Process 23 5 4 3 Evaluate Financial Metrics Closing Further Due Diligence • Transaction Review Meetings • Asset Management Evaluation • Remington Analysis • Unleveraged IRR vs. WACC • Leverage Neutral IRR • TTM Cap Rate • FTM Cap Rate • $/Key vs. Replacement Cost • Preliminary Capital Plan • RevPAR/AFFO/TSR Accretion • Cost of Debt Analysis • Exit Strategy Analysis • Corporate Pro Forma Impact • On site tour • Competitive Market Analysis • Verify Capital Plan • Detailed Underwriting • Legal Docs Analysis • Third Party Diligence Reports • Board Discussion • Sign PSA • Final Inspection Period • Closing Period • Secure Property Financing • Fund Property Acquisition 2 Model Desktop Pro Forma • Detailed Hotel P&L • Market RevPAR Growth • Market Room Supply • RPI Analysis • Expense Ratios/ Synergies • Capital Plan/ Impact • Management Contract • Brand Analysis • Real Estate Tax Impact • Specific Insurance Quote • Risk/ Rewards • Value Add Analysis 1 Source Opportunities • Brokers • Lenders • Direct • Brands • Off-market AGREE TO LOI GO HARD DEPOSIT W Atlanta Downtown Atlanta, GA
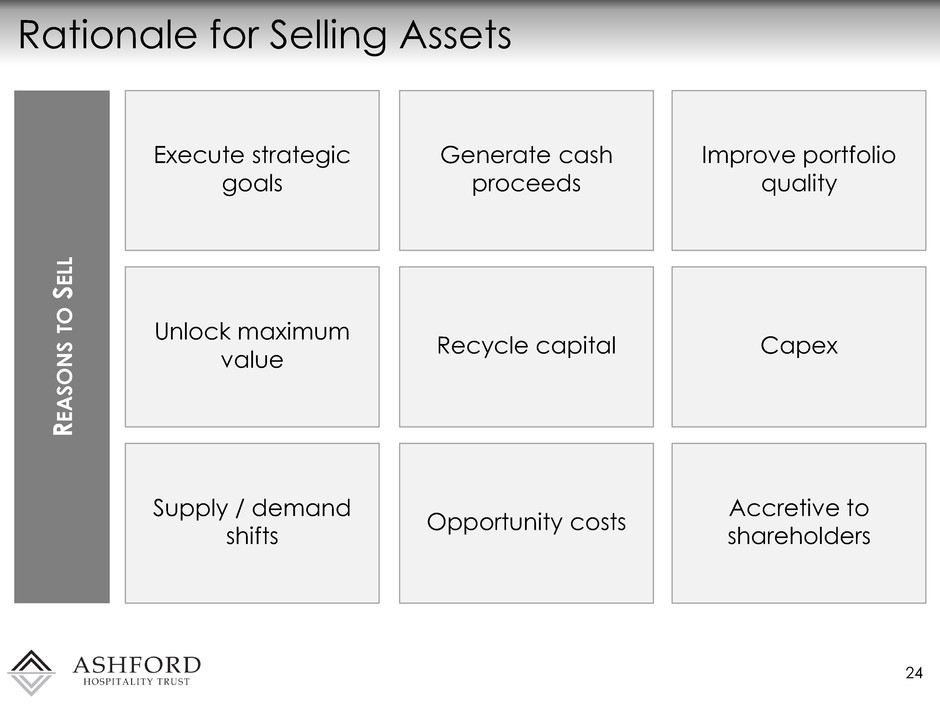
Rationale for Selling Assets 24 R E A SON S T O S EL L Execute strategic goals Unlock maximum value Generate cash proceeds Recycle capital Improve portfolio quality Capex Supply / demand shifts Opportunity costs Accretive to shareholders
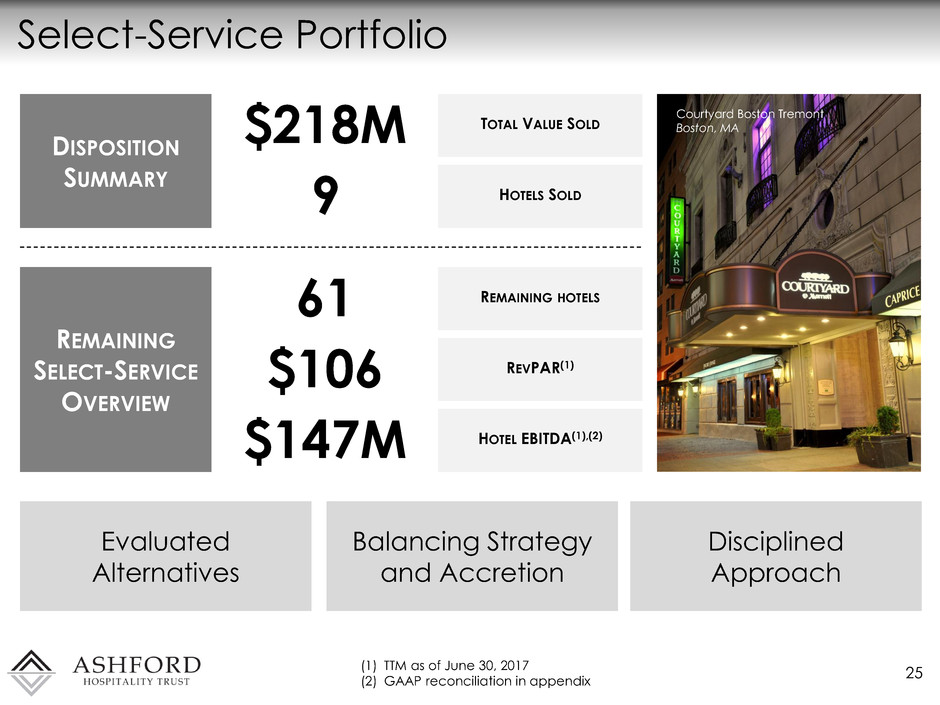
Select-Service Portfolio 25 DISPOSITION SUMMARY $218M TOTAL VALUE SOLD 9 Evaluated Alternatives (1) TTM as of June 30, 2017 (2) GAAP reconciliation in appendix REMAINING SELECT-SERVICE OVERVIEW 61 HOTELS SOLD REMAINING HOTELS $106 REVPAR(1) $147M HOTEL EBITDA(1),(2) Courtyard Boston Tremont Boston, MA Balancing Strategy and Accretion Disciplined Approach
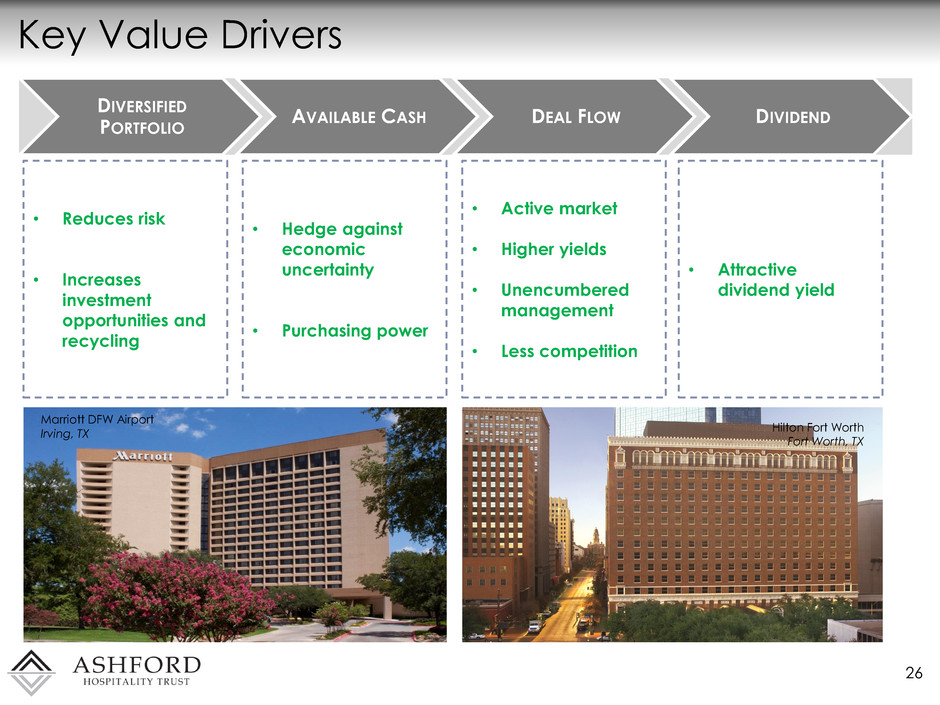
Key Value Drivers 26 DIVERSIFIED PORTFOLIO AVAILABLE CASH DEAL FLOW DIVIDEND • Reduces risk • Increases investment opportunities and recycling • Active market • Higher yields • Unencumbered management • Less competition • Hedge against economic uncertainty • Purchasing power • Attractive dividend yield Marriott DFW Airport Irving, TX Hilton Fort Worth Fort Worth, TX
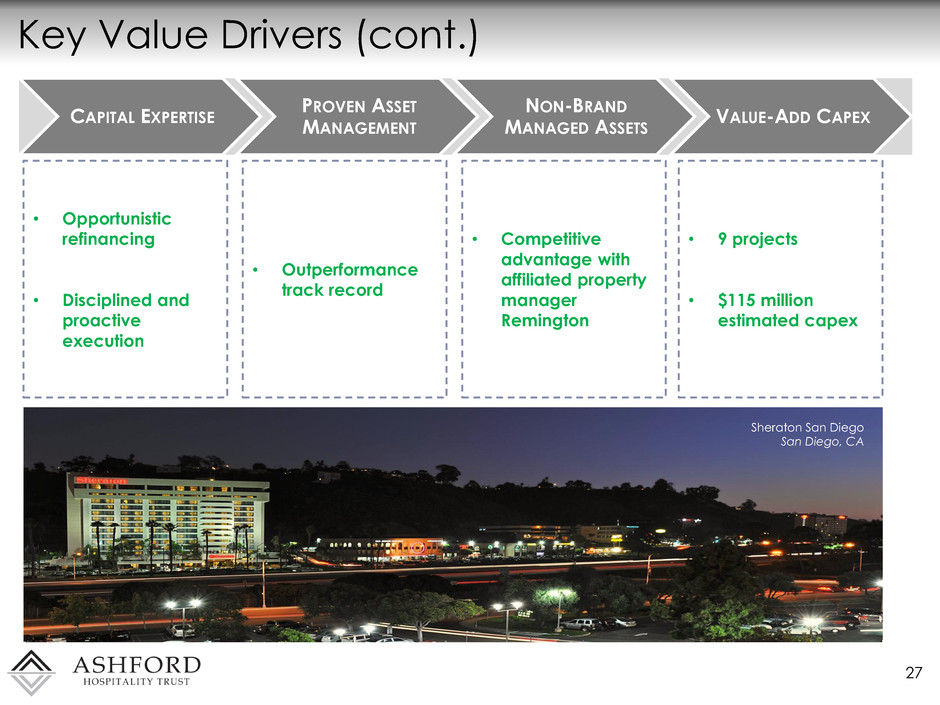
Key Value Drivers (cont.) 27 CAPITAL EXPERTISE PROVEN ASSET MANAGEMENT NON-BRAND MANAGED ASSETS VALUE-ADD CAPEX • Opportunistic refinancing • Disciplined and proactive execution • Competitive advantage with affiliated property manager Remington • Outperformance track record • 9 projects • $115 million estimated capex Sheraton San Diego San Diego, CA
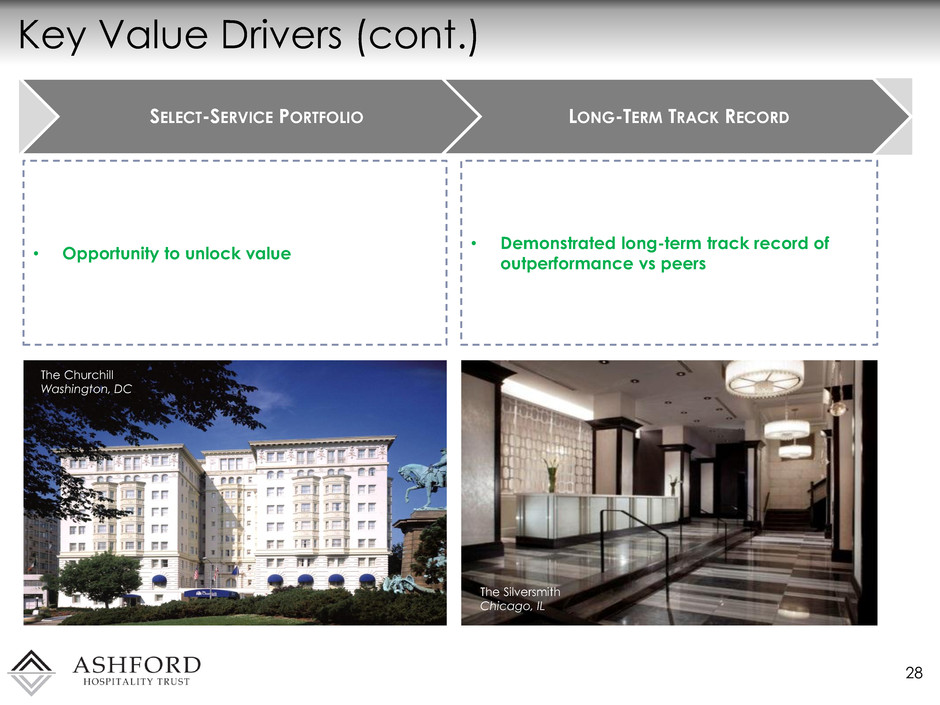
Key Value Drivers (cont.) 28 SELECT-SERVICE PORTFOLIO LONG-TERM TRACK RECORD • Demonstrated long-term track record of outperformance vs peers • Opportunity to unlock value The Silversmith Chicago, IL The Churchill Washington, DC
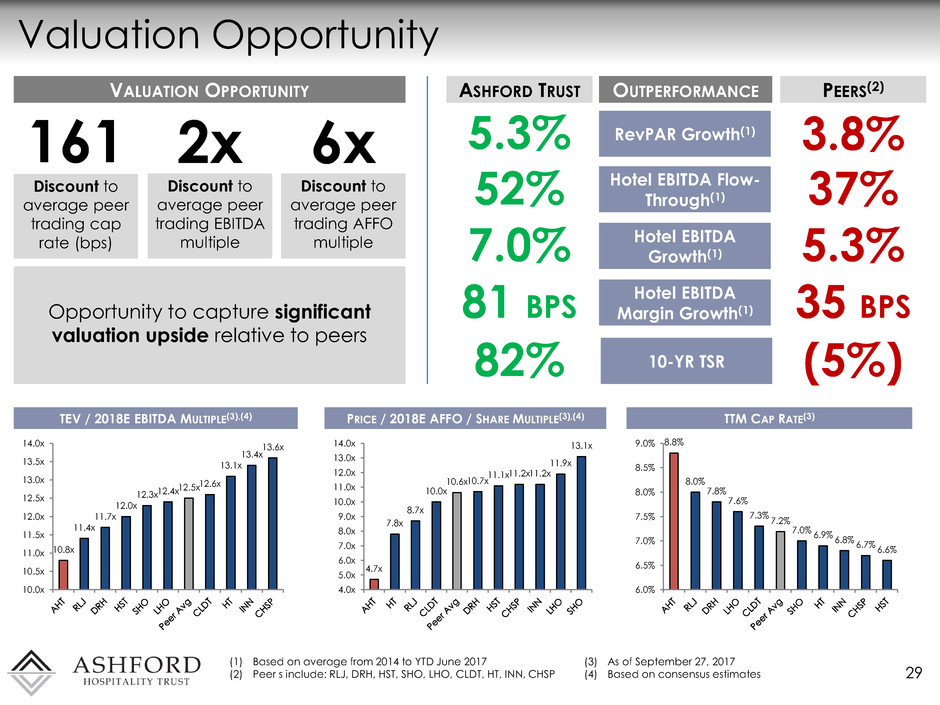
Valuation Opportunity 29 (1) Based on average from 2014 to YTD June 2017 (2) Peer s include: RLJ, DRH, HST, SHO, LHO, CLDT, HT, INN, CHSP PRICE / 2018E AFFO / SHARE MULTIPLE(3),(4) TTM CAP RATE(3) TEV / 2018E EBITDA MULTIPLE(3),(4) Discount to average peer trading cap rate (bps) VALUATION OPPORTUNITY 161 Discount to average peer trading AFFO multiple 6x Discount to average peer trading EBITDA multiple 2x Opportunity to capture significant valuation upside relative to peers RevPAR Growth(1) Hotel EBITDA Flow- Through(1) Hotel EBITDA Growth(1) Hotel EBITDA Margin Growth(1) OUTPERFORMANCE 10-YR TSR ASHFORD TRUST PEERS(2) 5.3% 3.8% 52% 37% 7.0% 5.3% 81 BPS 35 BPS 82% (5%) (3) As of September 27, 2017 (4) Based on consensus estimates 10.8x 11.4x 11.7x 12.0x 12.3x 12.4x 12.5x 12.6x 13.1x 13.4x 13.6x 10.0x 10.5x 11.0x 11.5x 12.0x 12.5x 13.0x 13.5x 14.0x 4.7x 7.8x 8.7x 10.0x 10.6x 10.7x 11.1x 11.2x 11.2x 11.9x 13.1x 4.0x 5.0x 6.0x 7.0x 8.0x 9.0x 10.0x 11.0x 12.0x 13.0x 14.0x 8.8% 8.0% 7.8% 7.6% 7.3% 7.2% 7.0% 6.9% 6.8% 6.7% 6.6% 6.0% 6.5% 7.0% 7.5% 8.0% 8.5% 9.0%
Asset Management – Jeremy J. Welter, EVP The Churchill Washington D.C.
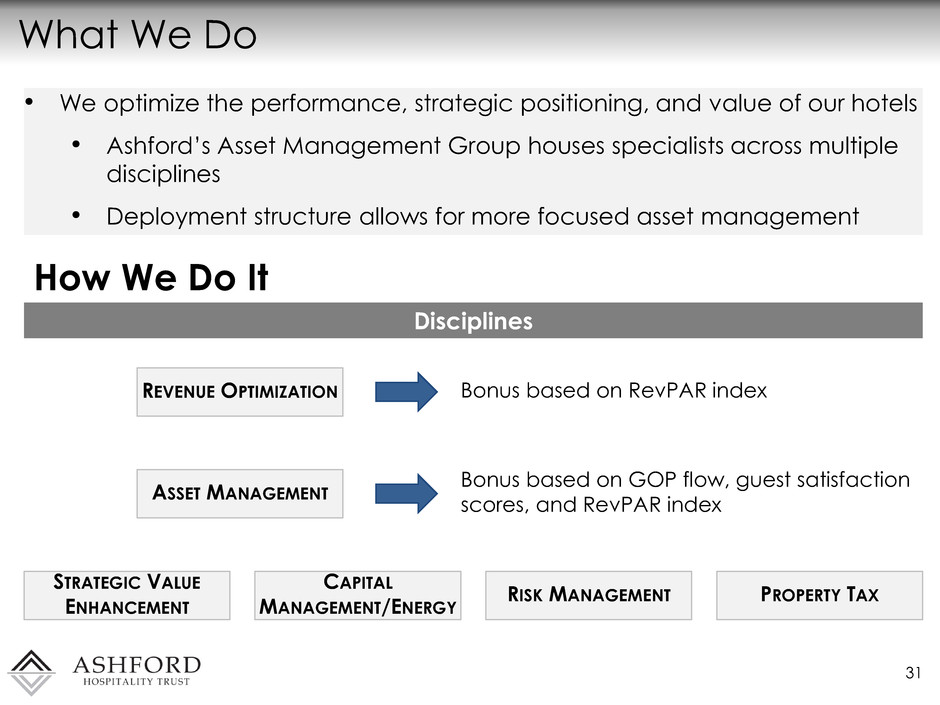
What We Do 31 • We optimize the performance, strategic positioning, and value of our hotels • Ashford’s Asset Management Group houses specialists across multiple disciplines • Deployment structure allows for more focused asset management Disciplines REVENUE OPTIMIZATION Bonus based on RevPAR index ASSET MANAGEMENT Bonus based on GOP flow, guest satisfaction scores, and RevPAR index STRATEGIC VALUE ENHANCEMENT CAPITAL MANAGEMENT/ENERGY RISK MANAGEMENT PROPERTY TAX How We Do It
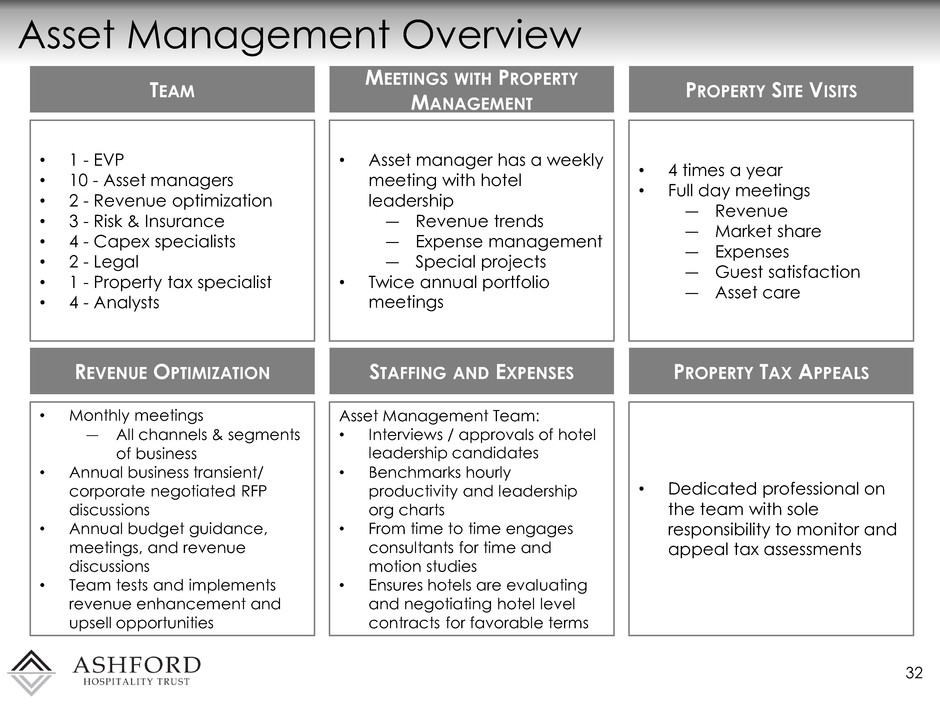
Asset Management Overview 32 TEAM • 1 - EVP • 10 - Asset managers • 2 - Revenue optimization • 3 - Risk & Insurance • 4 - Capex specialists • 2 - Legal • 1 - Property tax specialist • 4 - Analysts MEETINGS WITH PROPERTY MANAGEMENT • Asset manager has a weekly meeting with hotel leadership ― Revenue trends ― Expense management ― Special projects • Twice annual portfolio meetings PROPERTY SITE VISITS • 4 times a year • Full day meetings ― Revenue ― Market share ― Expenses ― Guest satisfaction ― Asset care REVENUE OPTIMIZATION • Monthly meetings ― All channels & segments of business • Annual business transient/ corporate negotiated RFP discussions • Annual budget guidance, meetings, and revenue discussions • Team tests and implements revenue enhancement and upsell opportunities STAFFING AND EXPENSES Asset Management Team: • Interviews / approvals of hotel leadership candidates • Benchmarks hourly productivity and leadership org charts • From time to time engages consultants for time and motion studies • Ensures hotels are evaluating and negotiating hotel level contracts for favorable terms PROPERTY TAX APPEALS • Dedicated professional on the team with sole responsibility to monitor and appeal tax assessments
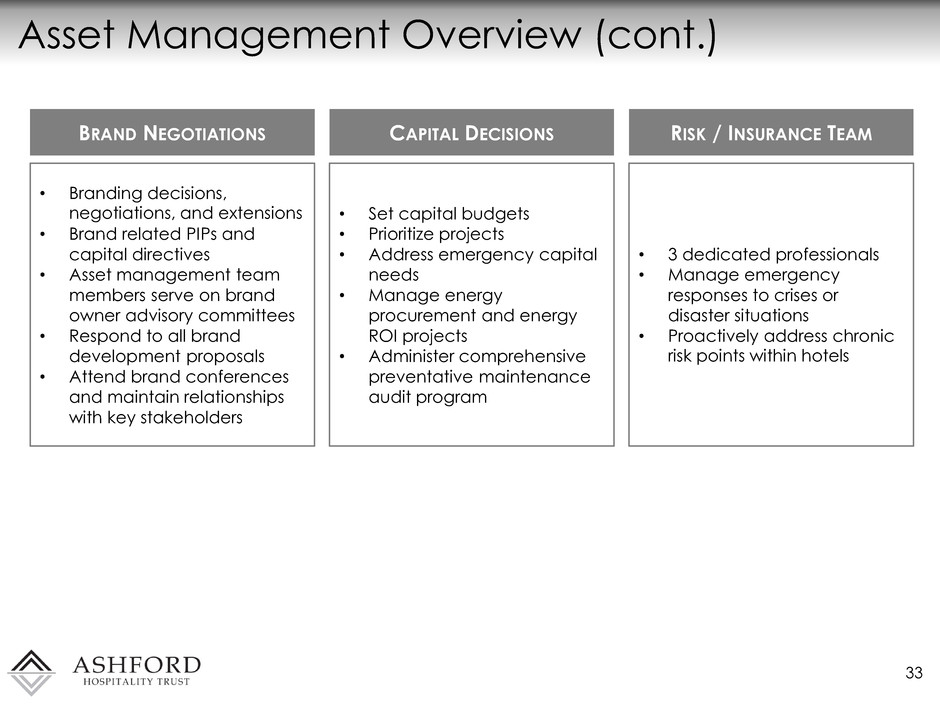
Asset Management Overview (cont.) 33 BRAND NEGOTIATIONS • Branding decisions, negotiations, and extensions • Brand related PIPs and capital directives • Asset management team members serve on brand owner advisory committees • Respond to all brand development proposals • Attend brand conferences and maintain relationships with key stakeholders CAPITAL DECISIONS • Set capital budgets • Prioritize projects • Address emergency capital needs • Manage energy procurement and energy ROI projects • Administer comprehensive preventative maintenance audit program RISK / INSURANCE TEAM • 3 dedicated professionals • Manage emergency responses to crises or disaster situations • Proactively address chronic risk points within hotels
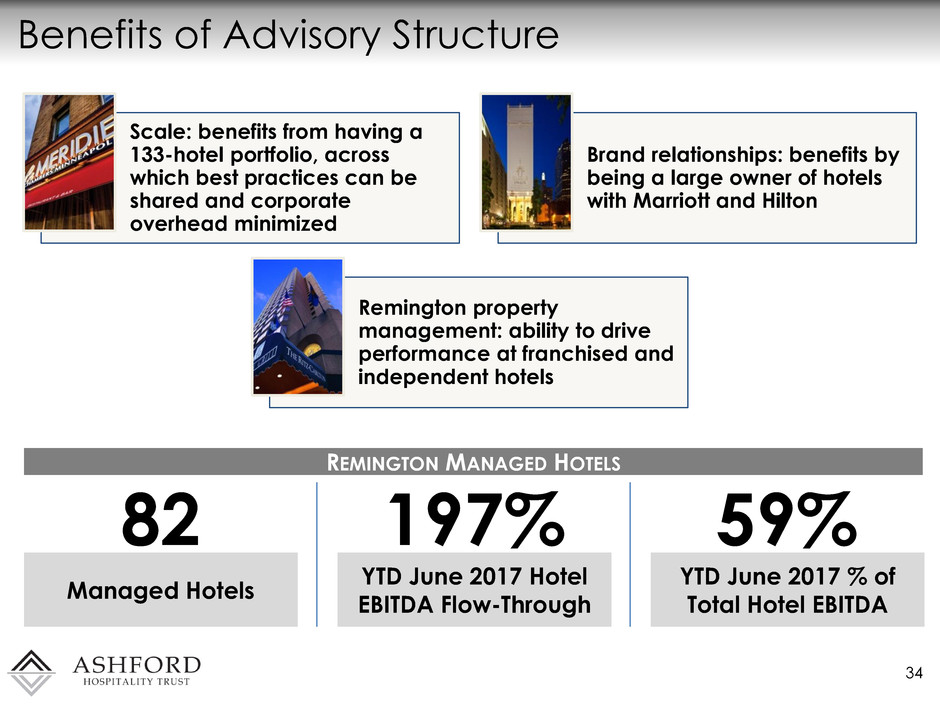
Benefits of Advisory Structure 34 Scale: benefits from having a 133-hotel portfolio, across which best practices can be shared and corporate overhead minimized Brand relationships: benefits by being a large owner of hotels with Marriott and Hilton Remington property management: ability to drive performance at franchised and independent hotels YTD June 2017 % of Total Hotel EBITDA 82 Managed Hotels 59% YTD June 2017 Hotel EBITDA Flow-Through 197% REMINGTON MANAGED HOTELS
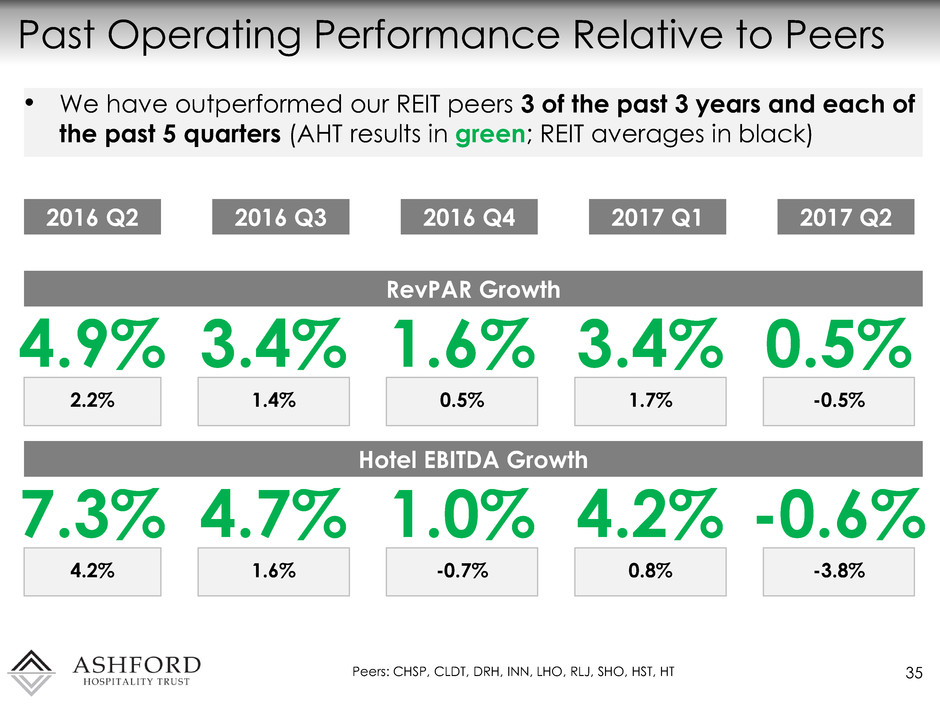
Past Operating Performance Relative to Peers 35 RevPAR Growth 4.9% 3.4% 1.6% 2.2% 1.4% 0.5% Hotel EBITDA Growth 0.5% -0.5% 2016 Q2 3.4% 1.7% 2016 Q3 2016 Q4 2017 Q1 2017 Q2 7.3% 4.7% 1.0% 4.2% 1.6% -0.7% -0.6% -3.8% 4.2% 0.8% Peers: CHSP, CLDT, DRH, INN, LHO, RLJ, SHO, HST, HT • We have outperformed our REIT peers 3 of the past 3 years and each of the past 5 quarters (AHT results in green; REIT averages in black)
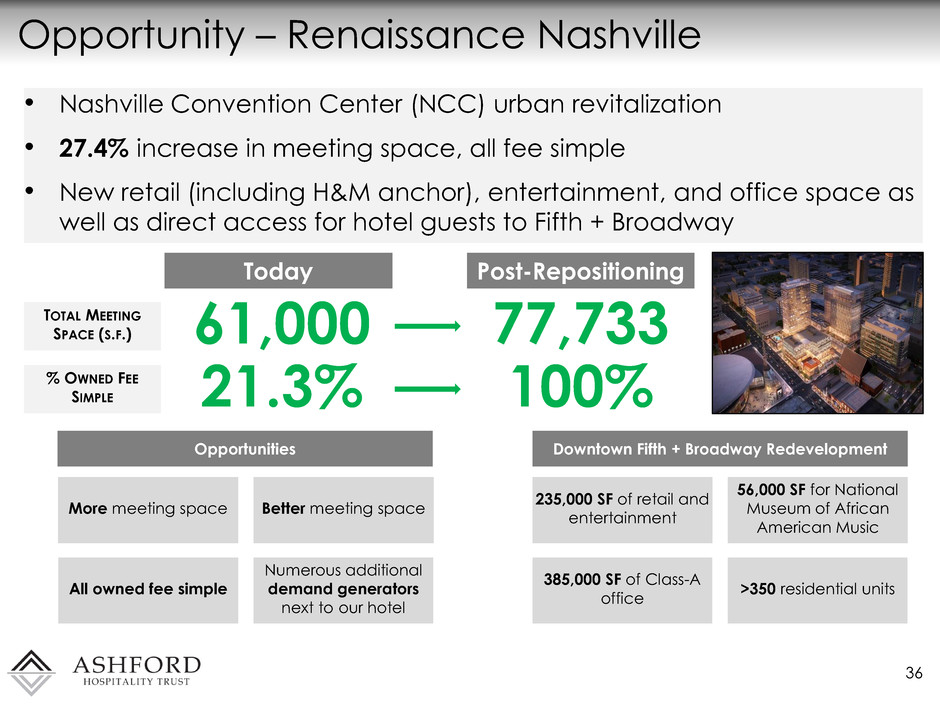
Opportunity – Renaissance Nashville 36 • Nashville Convention Center (NCC) urban revitalization • 27.4% increase in meeting space, all fee simple • New retail (including H&M anchor), entertainment, and office space as well as direct access for hotel guests to Fifth + Broadway Today 61,000 TOTAL MEETING SPACE (S.F.) % OWNED FEE SIMPLE Better meeting space Opportunities All owned fee simple Numerous additional demand generators next to our hotel More meeting space Post-Repositioning 77,733 21.3% 100% 56,000 SF for National Museum of African American Music Downtown Fifth + Broadway Redevelopment 385,000 SF of Class-A office >350 residential units 235,000 SF of retail and entertainment

Opportunity – Renaissance Nashville (cont.) 37 NCC Prior to Construction NCC Going Forward
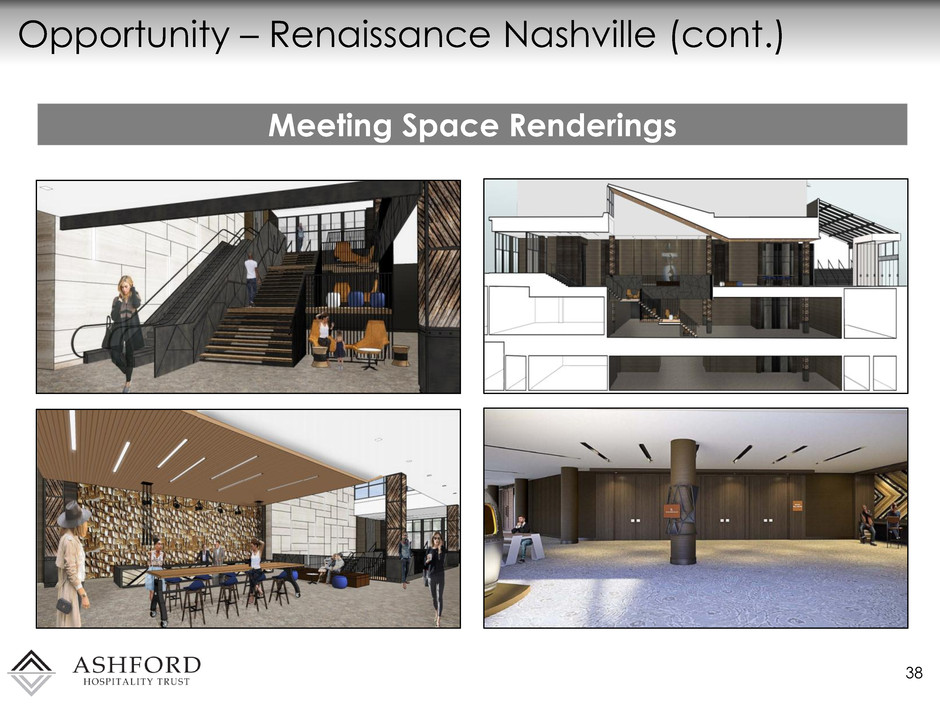
Opportunity – Renaissance Nashville (cont.) 38 Meeting Space Renderings
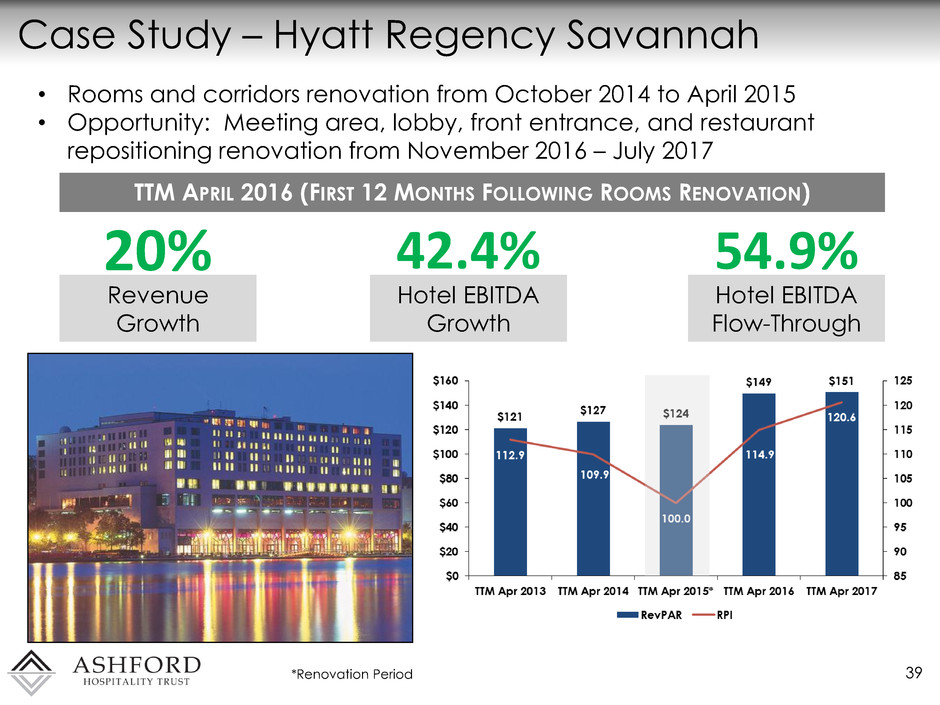
Case Study – Hyatt Regency Savannah 39 • Rooms and corridors renovation from October 2014 to April 2015 • Opportunity: Meeting area, lobby, front entrance, and restaurant repositioning renovation from November 2016 – July 2017 TTM APRIL 2016 (FIRST 12 MONTHS FOLLOWING ROOMS RENOVATION) *Renovation Period 20% 42.4% 54.9% Hotel EBITDA Growth Hotel EBITDA Flow-Through Revenue Growth
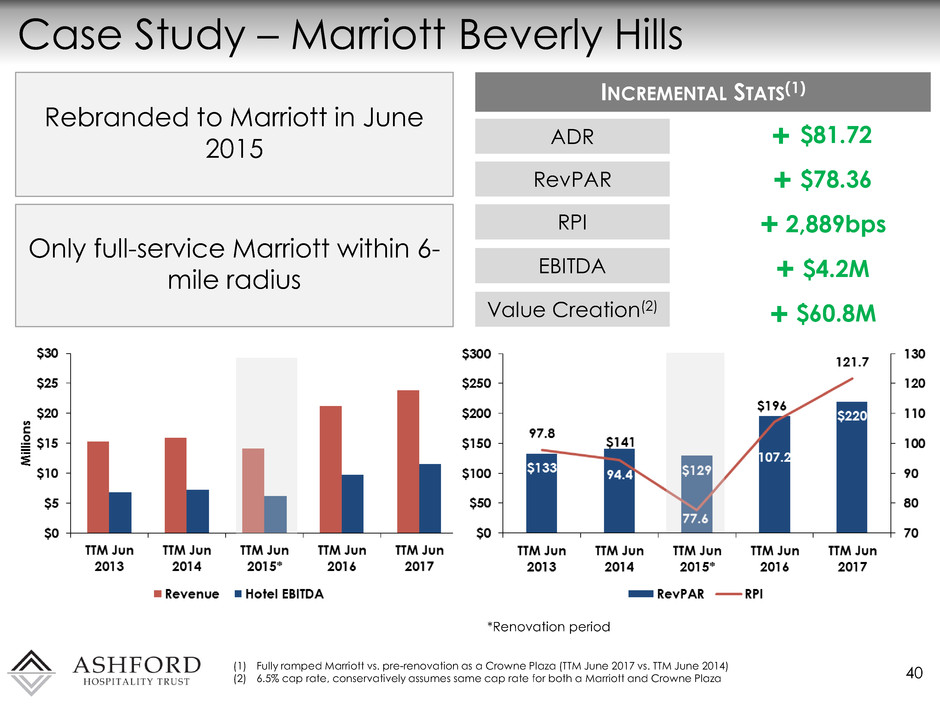
Case Study – Marriott Beverly Hills 40 *Renovation period INCREMENTAL STATS(1) $81.72 ADR (1) Fully ramped Marriott vs. pre-renovation as a Crowne Plaza (TTM June 2017 vs. TTM June 2014) (2) 6.5% cap rate, conservatively assumes same cap rate for both a Marriott and Crowne Plaza $78.36 RevPAR 2,889bps RPI $4.2M EBITDA $60.8M Value Creation(2) Rebranded to Marriott in June 2015 Only full-service Marriott within 6- mile radius + + + + +
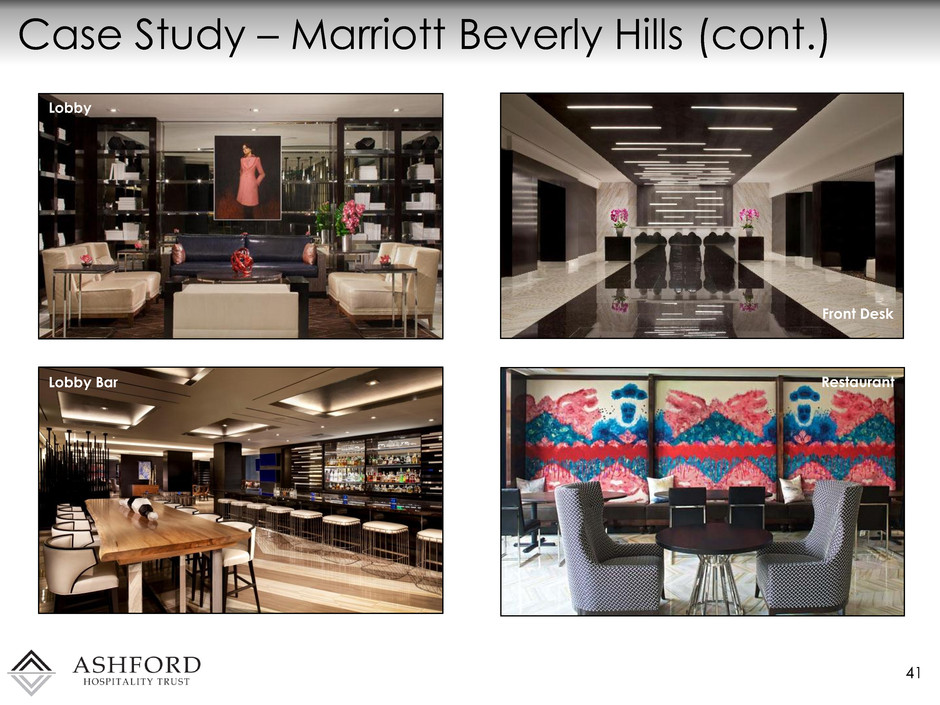
41 Case Study – Marriott Beverly Hills (cont.) Lobby Bar Restaurant Front Desk Lobby

42 Case Study – Marriott Beverly Hills (cont.) Guest Bathroom Boardroom Guestroom Club Lounge Boardroo
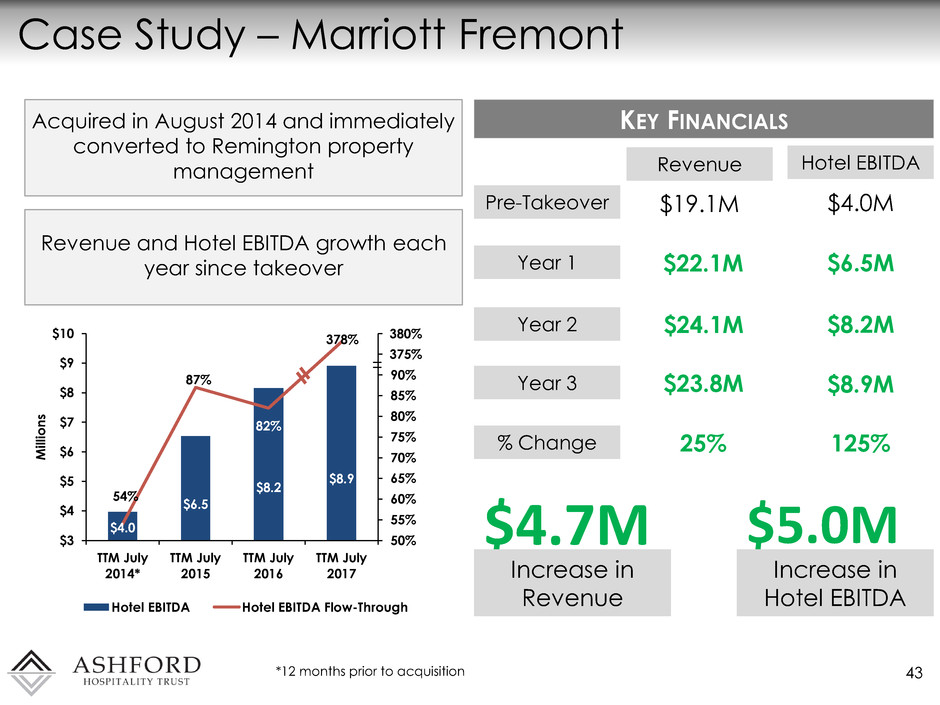
$4.0 $6.5 $8.2 $8.9 54% 87% 82% 378% 50% 55% 60% 65% 70% 75% 80% 85% 90% 95% 100% $3 $4 $5 $6 $7 $8 $9 $10 TTM July 2014* TTM July 2015 TTM July 2016 TTM July 2017 M ill ion s Hotel EBITDA Hotel EBITDA Flow-Through Case Study – Marriott Fremont 43 KEY FINANCIALS *12 months prior to acquisition Pre-Takeover Year 1 Year 2 Year 3 % Change Revenue Hotel EBITDA $19.1M 125% $22.1M $24.1M $23.8M 25% $6.5M $8.2M $8.9M $4.0M $4.7M $5.0M Increase in Hotel EBITDA Increase in Revenue 38 375% Acquired in August 2014 and immediately converted to Remington property management Revenue and Hotel EBITDA growth each year since takeover

Opportunity – W Atlanta 44 *Acquired July 2015 (1) As of June 30, 2017 OPPORTUNITIES Eliminated restaurant manager, who was operating at $250,000 loss Re-concept and reconfigure current restaurant space to include a market Better utilize vacated 2nd floor; turning into flexible meeting space Increase in Hotel EBITDA(1) $1.2M $3.3 $4.0 $4.4 $5.2 117% 124% 217% 0% 50% 100% 150% 200% 250% 300% $3 $4 $4 $5 $5 $6 TTM Jun 2014 TTM Jun 2015* TTM Jun 2016 TTM Jun 2017 M ill ion s Hotel EBITDA Hotel EBITDA Flow-Through SINCE ACQUISITION % Increase in Hotel EBITDA(1) 31%
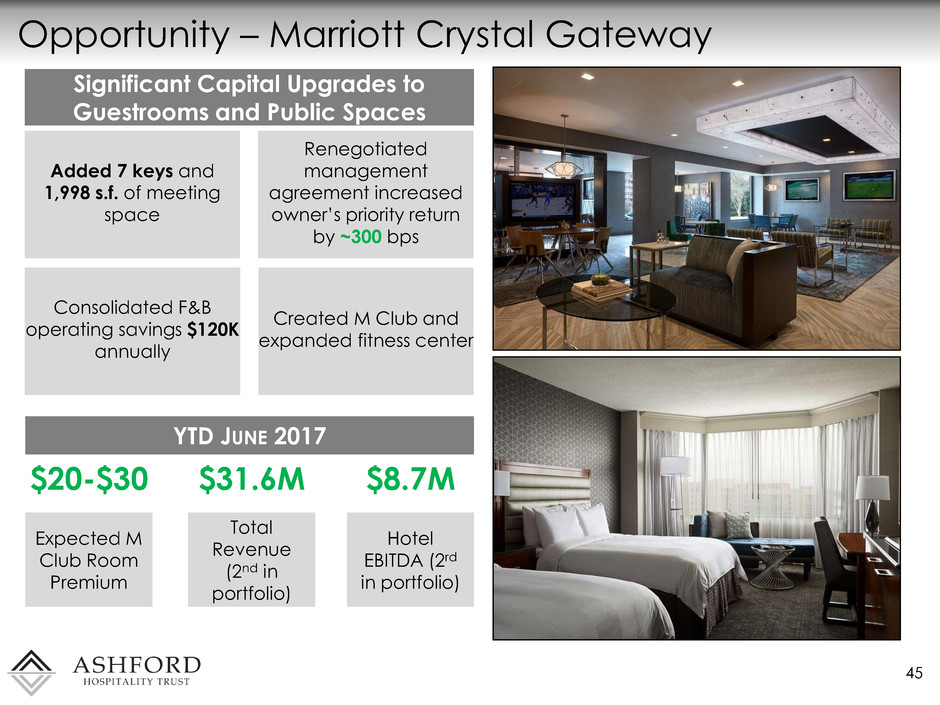
Opportunity – Marriott Crystal Gateway 45 YTD JUNE 2017 $20-$30 $31.6M $8.7M Hotel EBITDA (2rd in portfolio) Total Revenue (2nd in portfolio) Expected M Club Room Premium Renegotiated management agreement increased owner’s priority return by ~300 bps Significant Capital Upgrades to Guestrooms and Public Spaces Added 7 keys and 1,998 s.f. of meeting space Created M Club and expanded fitness center Consolidated F&B operating savings $120K annually
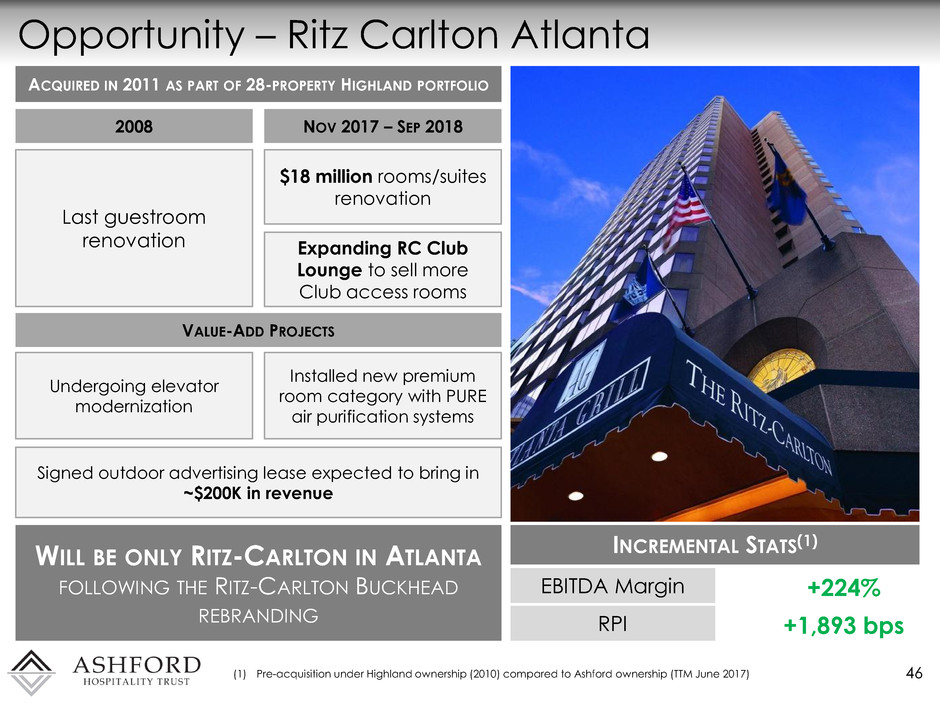
Opportunity – Ritz Carlton Atlanta 46 INCREMENTAL STATS(1) +224% EBITDA Margin +1,893 bps RPI (1) Pre-acquisition under Highland ownership (2010) compared to Ashford ownership (TTM June 2017) Last guestroom renovation ACQUIRED IN 2011 AS PART OF 28-PROPERTY HIGHLAND PORTFOLIO NOV 2017 – SEP 2018 $18 million rooms/suites renovation 2008 VALUE-ADD PROJECTS Undergoing elevator modernization Installed new premium room category with PURE air purification systems Signed outdoor advertising lease expected to bring in ~$200K in revenue WILL BE ONLY RITZ-CARLTON IN ATLANTA FOLLOWING THE RITZ-CARLTON BUCKHEAD REBRANDING Expanding RC Club Lounge to sell more Club access rooms

Opportunity – Ritz Carlton Atlanta (cont.) 47 BEFORE AFTER (MODEL ROOMS)
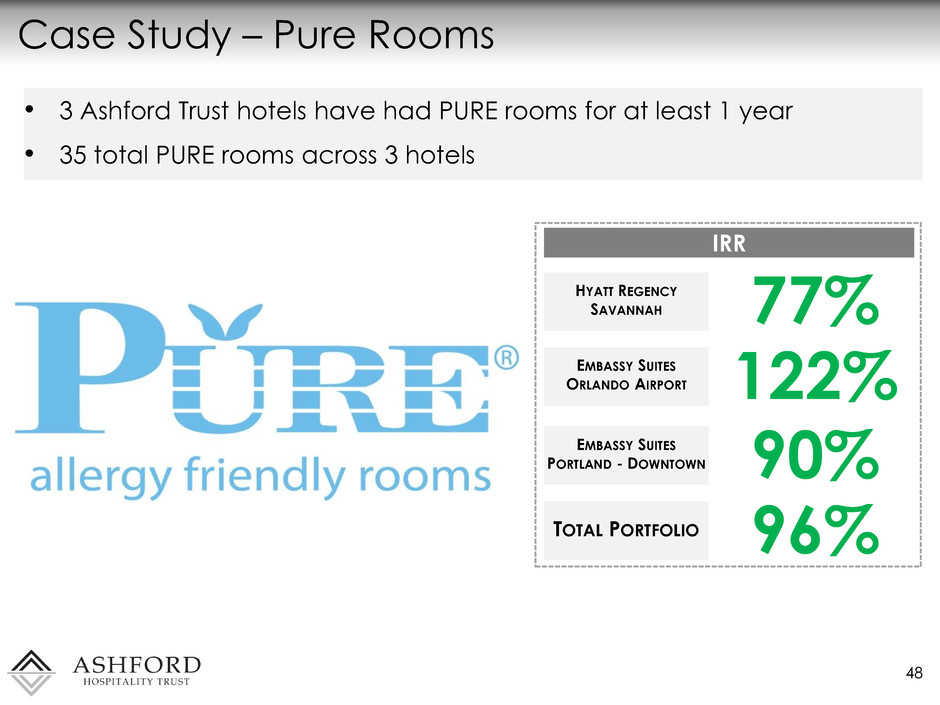
Case Study – Pure Rooms 48 IRR 77% HYATT REGENCY SAVANNAH EMBASSY SUITES ORLANDO AIRPORT 122% 90% EMBASSY SUITES PORTLAND - DOWNTOWN TOTAL PORTFOLIO 96% • 3 Ashford Trust hotels have had PURE rooms for at least 1 year • 35 total PURE rooms across 3 hotels
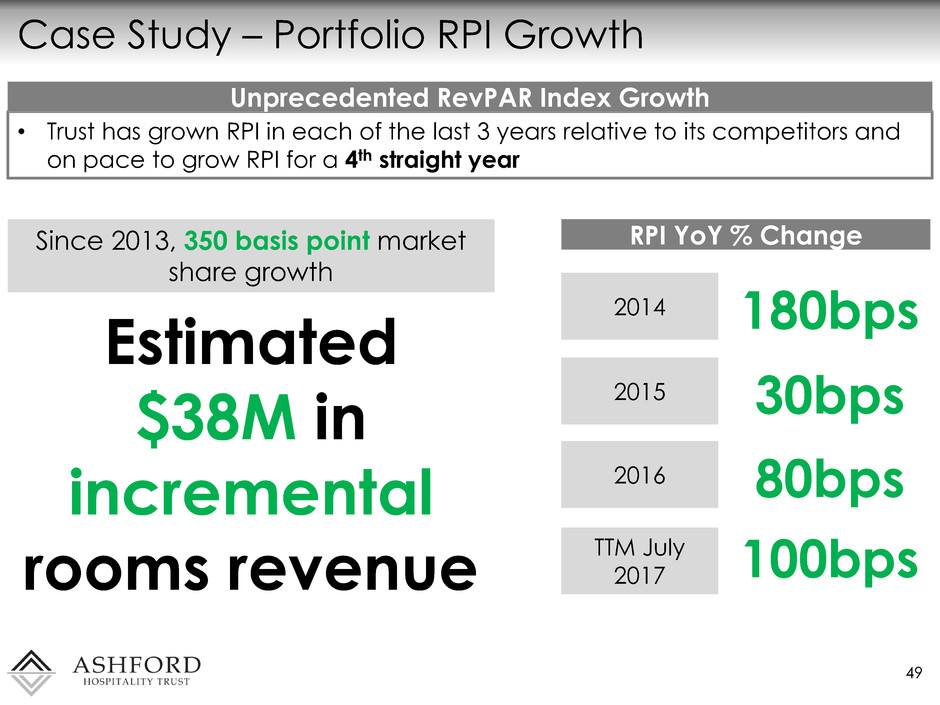
Case Study – Portfolio RPI Growth 49 • Trust has grown RPI in each of the last 3 years relative to its competitors and on pace to grow RPI for a 4th straight year Unprecedented RevPAR Index Growth RPI YoY % Change 2014 2015 2016 TTM July 2017 180bps 30bps 80bps 100bps Since 2013, 350 basis point market share growth Estimated $38M in incremental rooms revenue
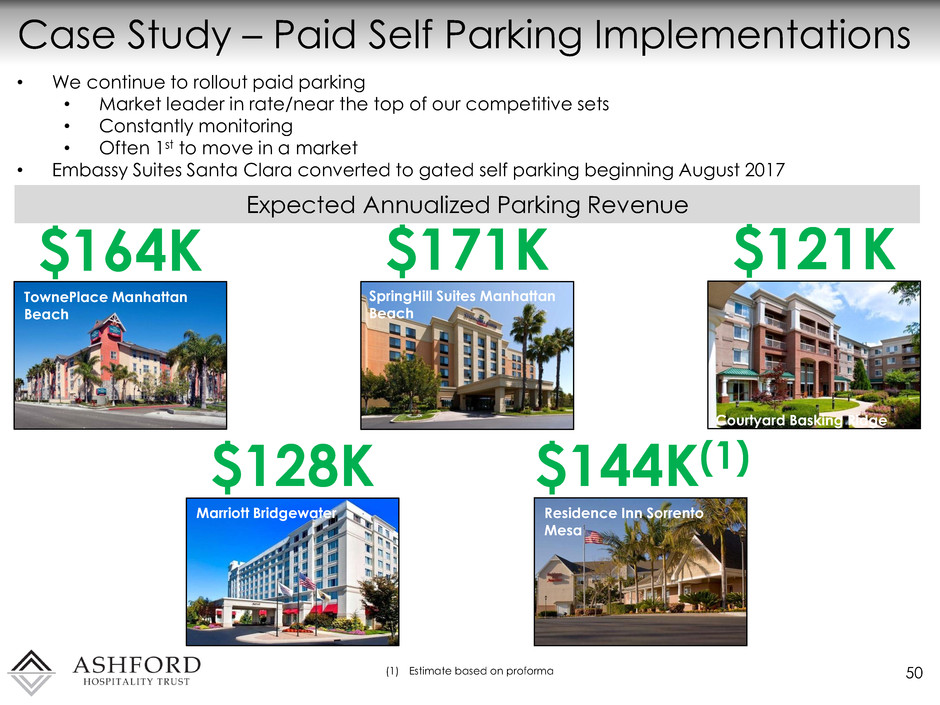
Case Study – Paid Self Parking Implementations 50 • We continue to rollout paid parking • Market leader in rate/near the top of our competitive sets • Constantly monitoring • Often 1st to move in a market • Embassy Suites Santa Clara converted to gated self parking beginning August 2017 Expected Annualized Parking Revenue $171K $164K $121K Courtyard Basking Ridge TownePlace Manhattan Beach Double Room Marriott Crystal Gateway SpringHill Suites Manhattan Beach Marriott Bridgewater $128K Residence Inn Sorrento Mesa $144K(1) (1) Estimate based on proforma
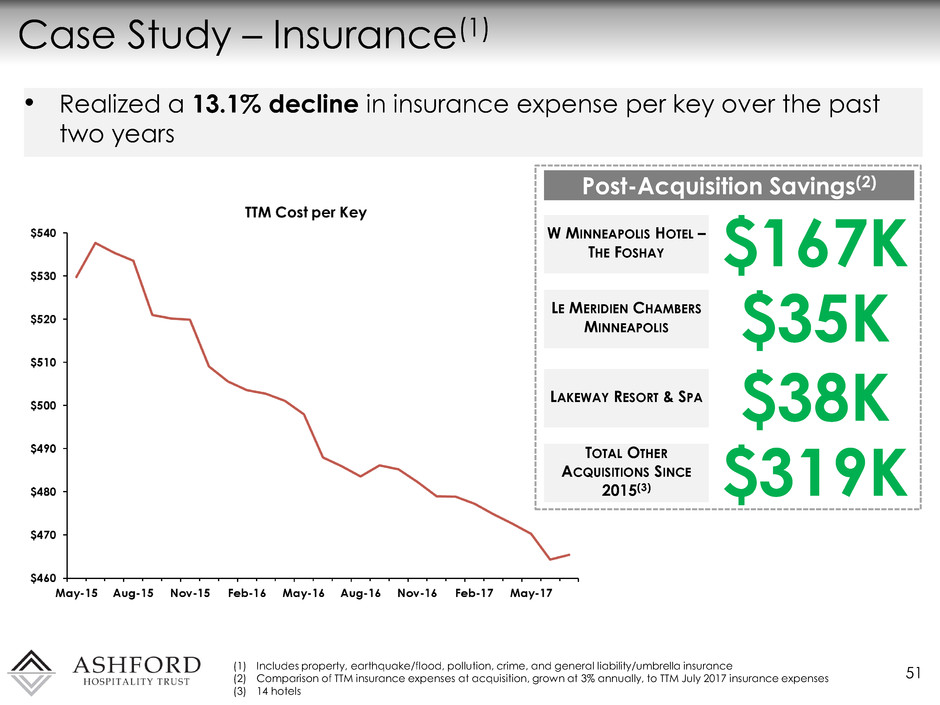
Case Study – Insurance(1) 51 (1) Includes property, earthquake/flood, pollution, crime, and general liability/umbrella insurance (2) Comparison of TTM insurance expenses at acquisition, grown at 3% annually, to TTM July 2017 insurance expenses (3) 14 hotels Post-Acquisition Savings(2) $167K W MINNEAPOLIS HOTEL – THE FOSHAY LE MERIDIEN CHAMBERS MINNEAPOLIS $35K $38K LAKEWAY RESORT & SPA TOTAL OTHER ACQUISITIONS SINCE 2015(3) $319K • Realized a 13.1% decline in insurance expense per key over the past two years
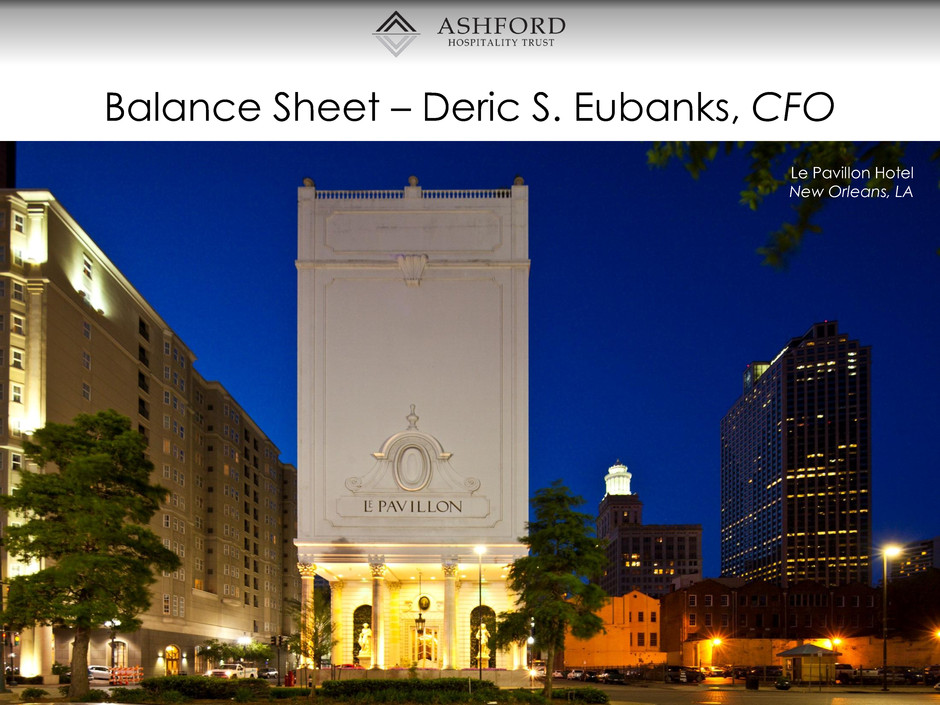
Balance Sheet – Deric S. Eubanks, CFO Le Pavillon Hotel New Orleans, LA
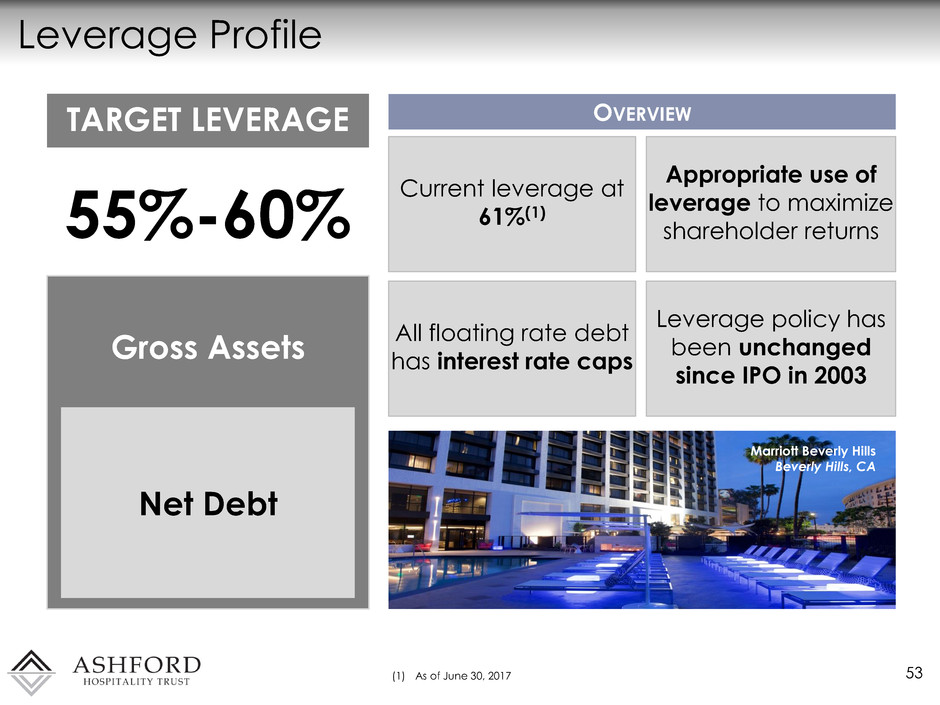
Leverage Profile 53 55%-60% TARGET LEVERAGE Net Debt Gross Assets (1) As of June 30, 2017 Current leverage at 61%(1) OVERVIEW Appropriate use of leverage to maximize shareholder returns All floating rate debt has interest rate caps Leverage policy has been unchanged since IPO in 2003 Marriott Beverly Hills Beverly Hills, CA

Stock Price (As of September 27, 2017) $6.64 Fully Diluted Shares Outstanding 117.6 Equity Value $780.8 Plus: Preferred Equity 553.1 Plus: Debt 3,708.1 Total Market Capitalization $5,042.1 Less: Net Working Capital (517.6) Total Enterprise Value $4,524.5 Non-Recourse Debt 54 (1) As of June 30, 2017 (2) Investment in Ashford Inc. at market value as of September 27, 2017 Total Enterprise Value(1) 100% NON-RECOURSE DEBT 100% PROPERTY LEVEL, MORTGAGE DEBT 0% CORPORATE LEVEL DEBT Non-recourse debt lowers risk profile of the platform BENEFITS Maximizes flexibility in all economic environments Long-standing lender relationships High lender interest in our high quality hotel assets Churchill Washington D.C. (2)
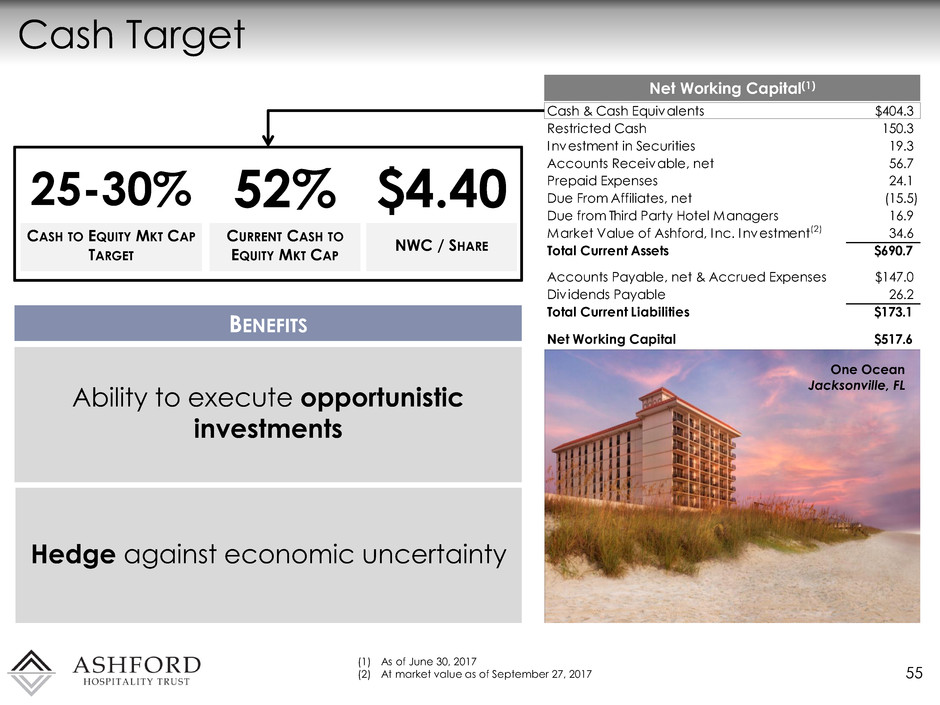
Cash & Cash Equivalents $404.3 Restricted Cash 150.3 Investment in Securities 19.3 Accounts Receivable, net 56.7 Prepaid Expenses 24.1 Due From Affiliates, net (15.5) Due from Third Party Hotel Managers 16.9 Market Value of Ashford, Inc. Investment(2) 34.6 Total Current Assets $690.7 Accounts Payable, net & Accrued Expenses $147.0 Div idends Payable 26.2 Total Current Liabilities $173.1 Net Working Capital $517.6 Cash Target 55 (1) As of June 30, 2017 (2) At market value as of September 27, 2017 Net Working Capital(1) 25-30% CASH TO EQUITY MKT CAP TARGET 52% CURRENT CASH TO EQUITY MKT CAP Ability to execute opportunistic investments BENEFITS Hedge against economic uncertainty One Ocean Jacksonville, FL $4.40 NWC / SHARE
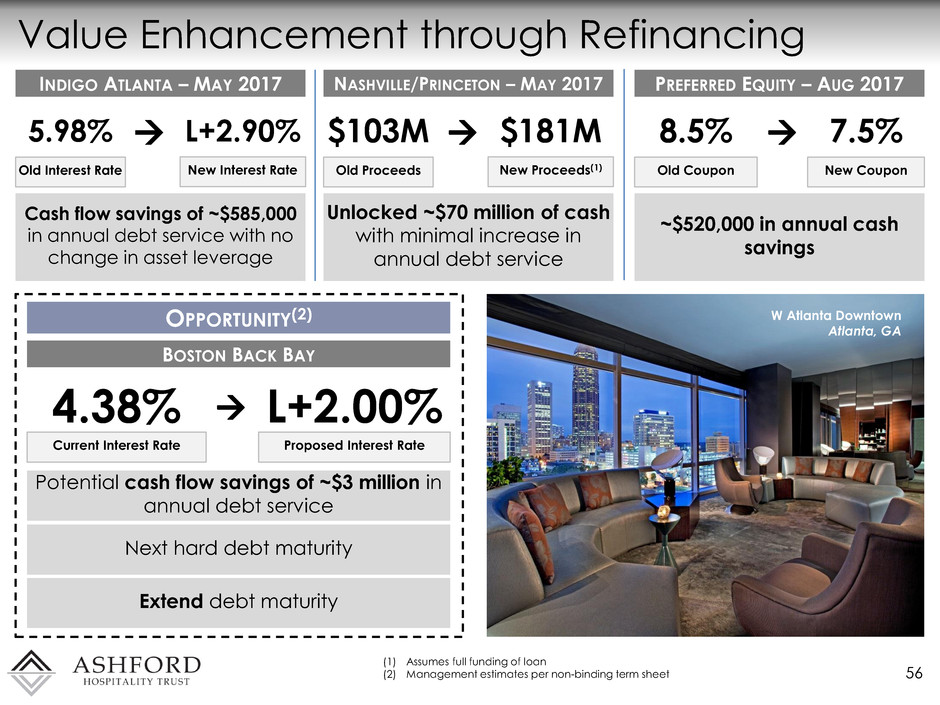
Value Enhancement through Refinancing 56 (1) Assumes full funding of loan (2) Management estimates per non-binding term sheet INDIGO ATLANTA – MAY 2017 5.98% L+2.90% Old Interest Rate New Interest Rate Cash flow savings of ~$585,000 in annual debt service with no change in asset leverage NASHVILLE/PRINCETON – MAY 2017 $103M $181M Old Proceeds New Proceeds(1) Unlocked ~$70 million of cash with minimal increase in annual debt service PREFERRED EQUITY – AUG 2017 8.5% Old Coupon ~$520,000 in annual cash savings 7.5% New Coupon OPPORTUNITY(2) BOSTON BACK BAY 4.38% Current Interest Rate L+2.00% Proposed Interest Rate Potential cash flow savings of ~$3 million in annual debt service Next hard debt maturity Extend debt maturity W Atlanta Downtown Atlanta, GA
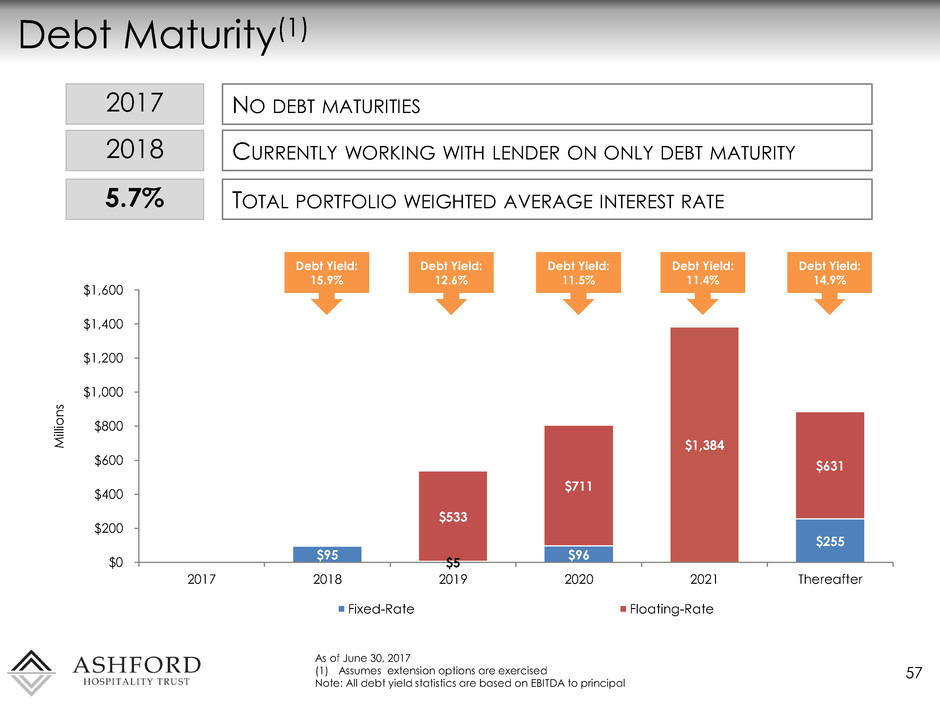
$95 $5 $96 $255 $533 $711 $1,384 $631 $0 $200 $400 $600 $800 $1,000 $1,200 $1,400 $1,600 2017 2018 2019 2020 2021 Thereafter M ill io n s Fixed-Rate Floating-Rate Debt Maturity(1) 57 As of June 30, 2017 (1) Assumes extension options are exercised Note: All debt yield statistics are based on EBITDA to principal Debt Yield: 15.9% Debt Yield: 11.5% Debt Yield: 12.6% Debt Yield: 11.4% Debt Yield: 14.9% 2017 NO DEBT MATURITIES 2018 CURRENTLY WORKING WITH LENDER ON ONLY DEBT MATURITY 5.7% TOTAL PORTFOLIO WEIGHTED AVERAGE INTEREST RATE
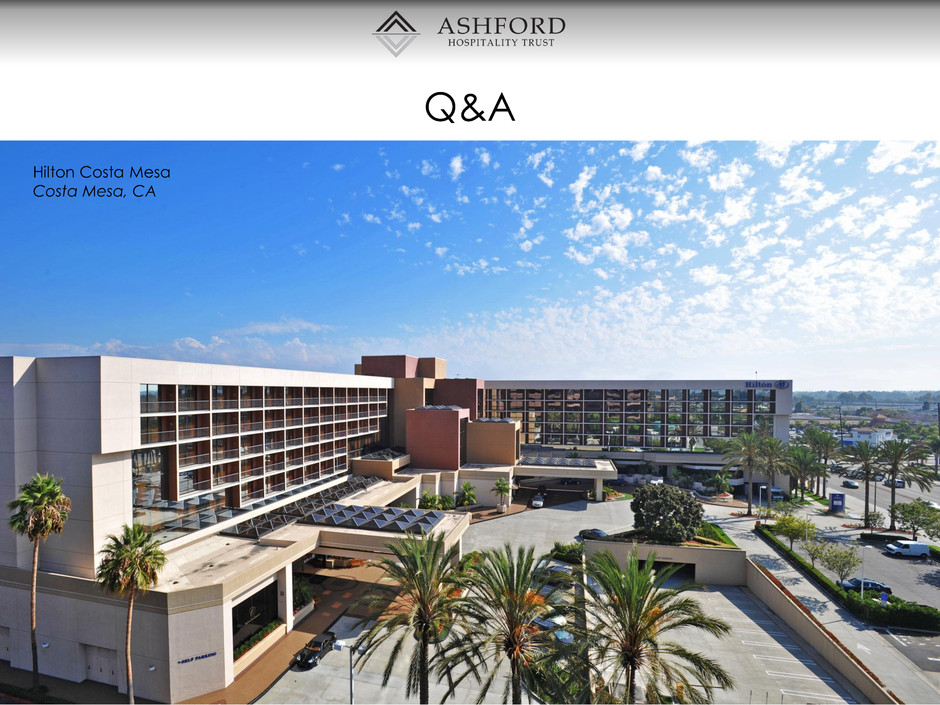
Q&A Hilton Costa Mesa Costa Mesa, CA
Appendix Hilton Fort Worth Ft. Worth, TX
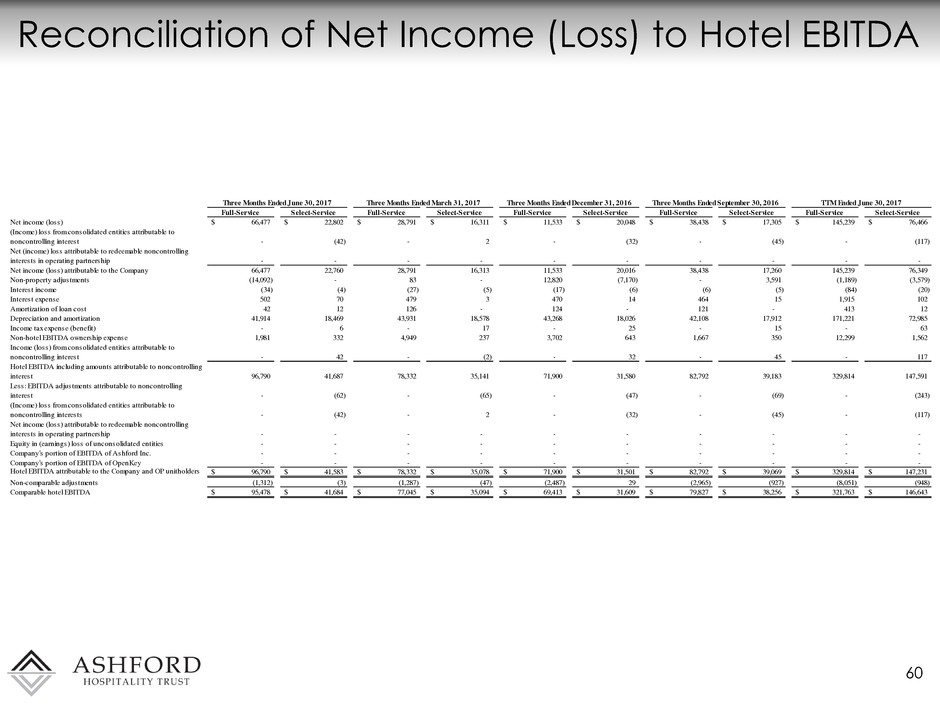
Reconciliation of Net Income (Loss) to Hotel EBITDA 60 Full-Service Select-Service Full-Service Select-Service Full-Service Select-Service Full-Service Select-Service Full-Service Select-Service Net income (loss) 66,477$ 22,802$ 28,791$ 16,311$ 11,533$ 20,048$ 38,438$ 17,305$ 145,239$ 76,466$ (Income) loss from consolidated entities attributable to noncontrolling interest - (42) - 2 - (32) - (45) - (117) Net (income) loss attributable to redeemable noncontrolling interests in operating partnership - - - - - - - - - - Net income (loss) attributable to the Company 66,477 22,760 28,791 16,313 11,533 20,016 38,438 17,260 145,239 76,349 Non-property adjustments (14,092) - 83 - 12,820 (7,170) - 3,591 (1,189) (3,579) Interest income (34) (4) (27) (5) (17) (6) (6) (5) (84) (20) Interest expense 502 70 479 3 470 14 464 15 1,915 102 Amortization of loan cost 42 12 126 - 124 - 121 - 413 12 Depreciation and amortization 41,914 18,469 43,931 18,578 43,268 18,026 42,108 17,912 171,221 72,985 Income tax expense (benefit) - 6 - 17 - 25 - 15 - 63 Non-hotel EBITDA ownership expense 1,981 332 4,949 237 3,702 643 1,667 350 12,299 1,562 Income (loss) from consolidated entities attributable to noncontrolling interest - 42 - (2) - 32 - 45 - 117 Hotel EBITDA including amounts attributable to noncontrolling interest 96,790 41,687 78,332 35,141 71,900 31,580 82,792 39,183 329,814 147,591 Less: EBITDA adjustments attributable to noncontrolling interest - (62) - (65) - (47) - (69) - (243) (Income) loss from consolidated entities attributable to noncontrolling interests - (42) - 2 - (32) - (45) - (117) Net income (loss) attributable to redeemable noncontrolling interests in operating partnership - - - - - - - - - - Equity in (earnings) loss of unconsolidated entities - - - - - - - - - - Company's portion of EBITDA of Ashford Inc. - - - - - - - - - - Company's portion of EBITDA of OpenKey - - - - - - - - - - Hotel EBITDA attributable to the Company and OP unitholders 96,790$ 41,583$ 78,332$ 35,078$ 71,900$ 31,501$ 82,792$ 39,069$ 329,814$ 147,231$ Non-comparable adjustments (1,312) (3) (1,287) (47) (2,487) 29 (2,965) (927) (8,051) (948) Comparable hotel EBITDA 95,478$ 41,684$ 77,045$ 35,094$ 69,413$ 31,609$ 79,827$ 38,256$ 321,763$ 146,643$ Three Months Ended June 30, 2017 Three Months Ended March 31, 2017 Three Months Ended December 31, 2016 Three Months Ended September 30, 2016 TTM Ended June 30, 2017

Investor and Analyst Day October 3, 2017 New York


