UNITED STATES
SECURITIES AND EXCHANGE COMMISSION
Washington, D.C. 20549
FORM N-CSR
CERTIFIED SHAREHOLDER REPORT OF REGISTERED MANAGEMENT
INVESTMENT COMPANIES
Investment Company Act file number: 811-21348
| Name of Fund: | | BlackRock Municipal Income Fund, Inc. (Formerly BlackRock Muni Intermediate Duration Fund, Inc.) (MUI) |
| Fund Address: | | 100 Bellevue Parkway, Wilmington, DE 19809 |
Name and address of agent for service: John M. Perlowski, Chief Executive Officer, BlackRock Municipal Income Fund, Inc. (Formerly BlackRock Muni Intermediate Duration Fund, Inc.), 55 East 52nd Street, New York, NY 10055
Registrant’s telephone number, including area code: (800) 882-0052, Option 4
Date of fiscal year end: 04/30/2022
Date of reporting period: 10/31/2021
| Item 1 – | Report to Stockholders |
(a) The Report to Shareholders is attached herewith.
| | |

| | OCTOBER 31, 2021 |
| | |
| |
| | 2021 Semi-Annual Report (Unaudited) |
BlackRock MuniAssets Fund, Inc. (MUA)
BlackRock Municipal Income Fund, Inc. (MUI)
BlackRock MuniHoldings Fund, Inc. (MHD)
BlackRock MuniVest Fund II, Inc. (MVT)
|
Not FDIC Insured • May Lose Value • No Bank Guarantee |
The Markets in Review
Dear Shareholder,
The 12-month reporting period as of October 31, 2021 was a remarkable period of adaptation and recovery, as the global economy dealt with the implications of the coronavirus (or “COVID-19”) pandemic. The United States began the reporting period as the initial reopening-led economic rebound was beginning to slow. Nonetheless, the economy continued to grow at a solid pace for the reporting period, eventually regaining the output lost from the pandemic. However, a rapid rebound in consumer spending pushed up against supply constraints and led to elevated inflation.
Equity prices rose with the broader economy, as the implementation of mass vaccination campaigns and passage of two additional fiscal stimulus packages further boosted stocks, and many equity indices neared or surpassed all-time highs late in the reporting period. In the United States, returns of small-capitalization stocks, which benefited the most from the resumption of in-person activities, outpaced large-capitalization stocks. International equities also gained, as both developed and emerging markets continued to recover from the effects of the pandemic.
The 10-year U.S. Treasury yield (which is inversely related to bond prices) had fallen sharply prior to the beginning of the reporting period, which meant bonds were priced for extreme risk avoidance and economic disruption. Despite expectations of doom and gloom, the economy expanded rapidly, stoking inflation concerns in early 2021, which led to higher yields and a negative overall return for most U.S. Treasuries. In the corporate bond market, support from the U.S. Federal Reserve (the “Fed”) assuaged credit concerns and led to solid returns for high-yield corporate bonds, outpacing investment-grade corporate bonds.
The Fed remained committed to accommodative monetary policy by maintaining near-zero interest rates and by reiterating that inflation could exceed its 2% target for a sustained period without triggering a rate increase. In response to rising inflation late in the period, the Fed changed its market guidance, raising the possibility of higher rates in 2022 and reducing bond purchasing beginning in late 2021.
Looking ahead, we believe that the global expansion will continue to broaden as Europe and other developed market economies gain momentum, although the Delta variant of the coronavirus remains a threat, particularly in emerging markets. While we expect inflation to remain elevated in the medium-term as the expansion continues, we believe the recent uptick owes more to temporary supply disruptions than a lasting change in fundamentals. The change in Fed policy also means that moderate inflation is less likely to be followed by interest rate hikes that could threaten the economic expansion.
Overall, we favor a moderately positive stance toward risk, with an overweight in equities. Sectors that are better poised to manage the transition to a lower-carbon world, such as technology and health care, are particularly attractive in the long-term. U.S. small-capitalization stocks and European equities are likely to benefit from the continuing vaccine-led restart, while Chinese equities stand to gain from a more accommodative monetary and fiscal environment as the Chinese economy slows. We are underweight long-term credit, but inflation-protected U.S. Treasuries, Asian fixed income, and emerging market local-currency bonds offer potential opportunities. We believe that international diversification and a focus on sustainability can help provide portfolio resilience, and the disruption created by the coronavirus appears to be accelerating the shift toward sustainable investments.
In this environment, our view is that investors need to think globally, extend their scope across a broad array of asset classes, and be nimble as market conditions change. We encourage you to talk with your financial advisor and visit blackrock.com for further insight about investing in today’s markets.
Sincerely,

Rob Kapito
President, BlackRock Advisors, LLC

Rob Kapito
President, BlackRock Advisors, LLC
| | | | |
| Total Returns as of October 31, 2021 |
| | | |
| | | 6-Month | | 12-Month |
| | |
U.S. large cap equities
(S&P 500® Index) | | 10.91% | | 42.91% |
| | |
U.S. small cap equities
(Russell 2000® Index) | | 1.85 | | 50.80 |
| | |
International equities (MSCI Europe, Australasia, Far East Index) | | 4.14 | | 34.18 |
| | |
Emerging market equities
(MSCI Emerging Markets Index) | | (4.87) | | 16.96 |
| | |
3-month Treasury bills
(ICE BofA 3-Month U.S. Treasury Bill Index) | | 0.01 | | 0.06 |
| | |
U.S. Treasury securities
(ICE BofA 10-Year U.S. Treasury Index) | | 1.59 | | (4.77) |
| | |
U.S. investment grade bonds
(Bloomberg U.S. Aggregate Bond Index) | | 1.06 | | (0.48) |
| | |
Tax-exempt municipal bonds
(S&P Municipal Bond Index) | | 0.33 | | 2.76 |
| | |
U.S. high yield bonds
(Bloomberg U.S. Corporate High Yield 2% Issuer Capped Index) | | 2.36 | | 10.53 |
|
| Past performance is not an indication of future results. Index performance is shown for illustrative purposes only. You cannot invest directly in an index. |
| | |
| 2 | | THIS PAGE IS NOT PART OF YOUR FUND REPORT |
Table of Contents
Municipal Market Overview For the Reporting Period Ended October 31, 2021
Municipal Market Conditions
Municipal bonds posted positive total returns during the period despite elevated interest rate volatility as the market priced in more hawkish Fed policy expectations. The asset class benefited from favorable supply and demand dynamics and improved credit fundamentals amid considerable fiscal stimulus and a quicker-than-expected rebound in state and local government revenues. As a result, municipal bonds generated substantial excess returns versus duration matched U.S. Treasuries and longer duration and lower credit quality strategies outperformed. However, the market faced several headwinds including brief periods of volatility surrounding U.S. 2020 election uncertainty, a temporary valuation-based market correction in late February 2021 and more recently, the expectation of a taper announcement from the Fed.
| | | | |
Technical support was helpful throughout the period as robust demand outpaced supply. During the 12 months ended October 31, 2021, municipal bond funds experienced net inflows totaling $92 billion, with January 2021 producing the largest monthly net inflow on record (based on data from the Investment Company Institute). For the same period, the market absorbed $431 billion in issuance, notably muted compared to the $485 billion issued during the prior 12-month period. Additionally, taxable municipal issuance, which typically draws a different and unique buyer base, was proportionally elevated, making supply easily digestible by the traditional tax-exempt market. | | | | S&P Municipal Bond Index Total Returns as of October 31, 2021 6 months: 0.33% 12 months: 2.76% |
| | | | |
| | | | |
A Closer Look at Yields
| | |
AAA Municipal Yield Curves 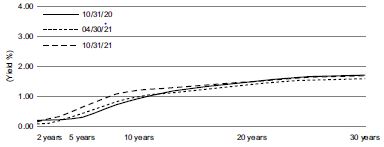
Source: Thomson Municipal Market Data. | | From October 31, 2020 to October 31, 2021, yields on AAA-rated 30-year municipal bonds decreased by 2 basis points (“bps”) from 1.71% to 1.69%, while ten-year rates increased by 28 bps from 0.93% to 1.21% and five-year rates increased by 34 bps from 0.30% to 0.64% (as measured by Thomson Municipal Market Data). As a result, the municipal yield curve flattened over the 12-month period with the spread between two-and 30-year maturities flattening by 6 bps, led by 30 bps of flattening between ten-and 30-year maturities. Consistent municipal outperformance has resulted in stretched valuations. After dislocating at the height of the pandemic, municipal-to-Treasury ratios posted all-time lows in February 2021 and remain well below historical averages. |
Financial Conditions of Municipal Issuers
The COVID-19 pandemic has been an unprecedented shock to the system impacting nearly every sector in the municipal market. Fortunately, most states and municipalities were in excellent fiscal health before the crisis, and the federal government delivered another $350 billion injection. Direct state and local government aid have provided additional support to own-source government tax receipts, which continue to outperform the dire predictions made in early 2020. Essential public services such as power, water, and sewer remain protected segments. State housing authority bonds, flagship universities, and strong national and regional health systems have absorbed the impact of the economic shock. While some segments still confront financial pressures, the combination of new federal stimulus and vaccine distribution is boosting economic activity and, consequently, increasing revenue receipts in these sectors as well. Critical providers (safety net hospitals, mass transit systems, airports) with limited resources may still experience fiscal strain but the additional aid and the re-opening of the economy will continue to support operating results through year end, despite the surging Delta variant. BlackRock anticipates that a small subset of the market, mainly non-rated stand-alone projects, will remain susceptible to credit deterioration. However, the risk of new mandated lockdowns is significantly diminished, and we expect limited impact on the high fundamental quality of state and local governments as well as essential service providers. While credit fundamentals have improved noticeably across the municipal space, BlackRock advocates careful credit selection as the market must still navigate near-term uncertainty.
The opinions expressed are those of BlackRock as of October 31, 2021 and are subject to change at any time due to changes in market or economic conditions. The comments should not be construed as a recommendation of any individual holdings or market sectors. Investing involves risk including loss of principal. Bond values fluctuate in price so the value of your investment can go down depending on market conditions. Fixed income risks include interest-rate and credit risk. Typically, when interest rates rise, there is a corresponding decline in bond values. Credit risk refers to the possibility that the bond issuer will not be able to make principal and interest payments. There may be less information on the financial condition of municipal issuers than for public corporations. The market for municipal bonds may be less liquid than for taxable bonds. Some investors may be subject to Alternative Minimum Tax (“AMT”). Capital gains distributions, if any, are taxable.
The S&P Municipal Bond Index, a broad, market value-weighted index, seeks to measure the performance of the U.S. municipal bond market. All bonds in the index are exempt from U.S. federal income taxes or subject to the AMT. Past performance is not an indication of future results. Index performance is shown for illustrative purposes only. It is not possible to invest directly in an index.
| | |
| 4 | | 2 0 2 1 BLACK ROCK SEMI - ANNUAL REPORT TO SHAREHOLDERS |
The Benefits and Risks of Leveraging
The Funds may utilize leverage to seek to enhance the distribution rate on, and net asset value (“NAV”) of, their common shares (“Common Shares”). However, there is no guarantee that these objectives can be achieved in all interest rate environments.
In general, the concept of leveraging is based on the premise that the financing cost of leverage, which is based on short-term interest rates, is normally lower than the income earned by a Fund on its longer-term portfolio investments purchased with the proceeds from leverage. To the extent that the total assets of each Fund (including the assets obtained from leverage) are invested in higher-yielding portfolio investments, each Fund’s shareholders benefit from the incremental net income. The interest earned on securities purchased with the proceeds from leverage (after paying the leverage costs) is paid to shareholders in the form of dividends, and the value of these portfolio holdings (less the leverage liability) is reflected in the per share NAV.
To illustrate these concepts, assume a Fund’s Common Shares capitalization is $100 million and it utilizes leverage for an additional $30 million, creating a total value of $130 million available for investment in longer-term income securities. If prevailing short-term interest rates are 3% and longer-term interest rates are 6%, the yield curve has a strongly positive slope. In this case, a Fund’s financing costs on the $30 million of proceeds obtained from leverage are based on the lower short-term interest rates. At the same time, the securities purchased by a Fund with the proceeds from leverage earn income based on longer-term interest rates. In this case, a Fund’s financing cost of leverage is significantly lower than the income earned on a Fund’s longer-term investments acquired from such leverage proceeds, and therefore the holders of Common Shares (“Common Shareholders”) are the beneficiaries of the incremental net income.
However, in order to benefit Common Shareholders, the return on assets purchased with leverage proceeds must exceed the ongoing costs associated with the leverage. If interest and other costs of leverage exceed a Fund’s return on assets purchased with leverage proceeds, income to shareholders is lower than if a Fund had not used leverage. Furthermore, the value of the Funds’ portfolio investments generally varies inversely with the direction of long-term interest rates, although other factors can influence the value of portfolio investments. In contrast, the amount of each Fund’s obligations under its respective leverage arrangement generally does not fluctuate in relation to interest rates. As a result, changes in interest rates can influence the Funds’ NAVs positively or negatively. Changes in the future direction of interest rates are very difficult to predict accurately, and there is no assurance that a Fund’s intended leveraging strategy will be successful.
The use of leverage also generally causes greater changes in each Fund’s NAV, market price and dividend rates than comparable portfolios without leverage. In a declining market, leverage is likely to cause a greater decline in the NAV and market price of a Fund’s Common Shares than if the Fund were not leveraged. In addition, each Fund may be required to sell portfolio securities at inopportune times or at distressed values in order to comply with regulatory requirements applicable to the use of leverage or as required by the terms of leverage instruments, which may cause the Fund to incur losses. The use of leverage may limit a Fund’s ability to invest in certain types of securities or use certain types of hedging strategies. Each Fund incurs expenses in connection with the use of leverage, all of which are borne by Common Shareholders and may reduce income to the Common Shares. Moreover, to the extent the calculation of each Fund’s investment advisory fees includes assets purchased with the proceeds of leverage, the investment advisory fees payable to the Funds’ investment adviser will be higher than if the Funds did not use leverage.
To obtain leverage, each Fund has issued Variable Rate Muni Term Preferred Shares (“VMTP Shares” or “Preferred Shares”) and/or leveraged its assets through the use of tender option bond trusts (“TOB Trusts”) as described in the Notes to Financial Statements.
Under the Investment Company Act of 1940, as amended (the “1940 Act”), each Fund is permitted to issue debt up to 33 1/3% of its total managed assets or equity securities (e.g., Preferred Shares) up to 50% of its total managed assets. A Fund may voluntarily elect to limit its leverage to less than the maximum amount permitted under the 1940 Act. In addition, a Fund may also be subject to certain asset coverage, leverage or portfolio composition requirements imposed by the Preferred Shares’ governing instruments or by agencies rating the Preferred Shares, which may be more stringent than those imposed by the 1940 Act.
If a Fund segregates or designates on its books and records cash or liquid assets having a value not less than the value of a Fund’s obligations under the TOB Trust (including accrued interest), then the TOB Trust is not considered a senior security and is not subject to the foregoing limitations and requirements imposed by the 1940 Act.
Derivative Financial Instruments
The Funds may invest in various derivative financial instruments. These instruments are used to obtain exposure to a security, commodity, index, market, and/or other assets without owning or taking physical custody of securities, commodities and/or other referenced assets or to manage market, equity, credit, interest rate, foreign currency exchange rate, commodity and/or other risks. Derivative financial instruments may give rise to a form of economic leverage and involve risks, including the imperfect correlation between the value of a derivative financial instrument and the underlying asset, possible default of the counterparty to the transaction or illiquidity of the instrument. The Funds’ successful use of a derivative financial instrument depends on the investment adviser’s ability to predict pertinent market movements accurately, which cannot be assured. The use of these instruments may result in losses greater than if they had not been used, may limit the amount of appreciation a Fund can realize on an investment and/or may result in lower distributions paid to shareholders. The Funds’ investments in these instruments, if any, are discussed in detail in the Notes to Financial Statements.
| | |
THE BENEFITS AND RISKS OF LEVERAGING / DERIVATIVE FINANCIAL INSTRUMENTS | | 5 |
| | |
| Fund Summary as of October 31, 2021 | | BlackRock MuniAssets Fund, Inc. (MUA) |
Investment Objective
BlackRock MuniAssets Fund, Inc.’s (MUA) (the “Fund”) investment objective is to provide high current income exempt from U.S. federal income taxes by investing primarily in a portfolio of medium- to lower-grade or unrated municipal obligations, the interest on which, in the opinion of bond counsel to the issuer, is exempt from U.S. federal income taxes. The Fund seeks to achieve its investment objective by investing, under normal market conditions, at least 80% of its assets in municipal bonds exempt from U.S. federal income taxes (except that the interest may be subject to the federal alternative minimum tax). The Fund invests at least 65% of its assets in municipal bonds that are rated in the medium to lower rating categories by nationally recognized rating services (for example, Baa or lower by Moody’s Investors Service, Inc. (“Moody’s”) or BBB or lower by S&P Global Ratings, or securities that are unrated but are deemed by the investment adviser to be of comparable quality at the time of investment. The Fund may invest directly in such securities or synthetically through the use of derivatives.
No assurance can be given that the Fund’s investment objective will be achieved.
Fund Information
| | |
| | |
Symbol on New York Stock Exchange | | MUA |
Initial Offering Date | | June 25, 1993 |
Yield on Closing Market Price as of October 31, 2021 ($15.10)(a) | | 3.89% |
Tax Equivalent Yield(b) | | 6.57% |
Current Monthly Distribution per Common Share(c) | | $0.0490 |
Current Annualized Distribution per Common Share(c) | | $0.5880 |
Leverage as of October 31, 2021(d) | | 10% |
| | (a) | Yield on closing market price is calculated by dividing the current annualized distribution per share by the closing market price. Past performance is not an indication of future results. | |
| | (b) | Tax equivalent yield assumes the maximum marginal U.S. federal tax rate of 40.8%, which includes the 3.8% Medicare tax. Actual tax rates will vary based on income, exemptions and deductions. Lower taxes will result in lower tax equivalent yields. | |
| | (c) | The monthly distribution per Common Share, declared on December 6, 2021, was decreased to $0.0455 per share. The yield on closing market price, tax equivalent yield, current monthly distribution per Common Share, and current annualized distribution per Common Share do not reflect the new distribution rate. The new distribution rate is not constant and is subject to change in the future. | |
| | (d) | Represents TOB Trusts as a percentage of total managed assets, which is the total assets of the Fund, including any assets attributable to TOB Trusts, minus the sum of its accrued liabilities. Does not reflect derivatives or other instruments that may give rise to economic leverage. For a discussion of leveraging techniques utilized by the Fund, please see The Benefits and Risks of Leveraging and Derivative Financial Instruments. | |
Market Price and Net Asset Value Per Share Summary
| | | | | | | | | | | | | | | | | | | | |
| | | 10/31/21 | | | 04/30/21 | | | Change | | | High | | | Low | |
| | | | | |
Closing Market Price | | $ | 15.10 | | | $ | 15.26 | | | | (1.05 | )% | | $ | 17.46 | | | $ | 14.76 | |
Net Asset Value | | | 14.86 | | | | 14.77 | | | | 0.61 | | | | 15.23 | | | | 14.77 | |
Performance
Returns for the period ended October 31, 2021 were as follows:
| | | | | | | | | | | | | | | | | | | | |
| | | | | | | | | Average Annual Total Returns | |
| | | | | | | | | | | | | | | | |
| | | | | |
| | | | | | 6-month | | | 1 Year | | | 5 Years | | | 10 Years | |
| | | | | |
Fund at NAV(a)(b) | | | | | | | 2.60 | % | | | 11.30 | % | | | 5.31 | % | | | 6.94 | % |
Fund at Market Price(a)(b) | | | | | | | 0.91 | | | | 16.71 | | | | 5.84 | | | | 7.65 | |
| | | | | |
Lipper High Yield Municipal Debt Funds at NAV(c) | | | | | | | 1.53 | | | | 10.13 | | | | 4.79 | | | | 6.62 | |
Lipper High Yield Municipal Debt Funds at Market Price(c) | | | | | | | 1.61 | | | | 17.14 | | | | 5.53 | | | | 6.46 | |
Bloomberg Municipal High Yield Bond Index(d)(e) | | | | | | | 2.40 | | | | 10.68 | | | | 6.18 | | | | 6.65 | |
High Yield Customized Reference Benchmark(f) | | | | | | | 1.61 | | | | 8.28 | | | | 5.38 | | | | N/A | |
| | (a) | All returns reflect reinvestment of dividends and/or distributions at actual reinvestment prices. Performance results reflect the Fund’s use of leverage. | |
| | (b) | The Fund’s premium to NAV narrowed during the period, which accounts for the difference between performance based on market price and performance based on NAV. | |
| | (c) | Average return. Returns reflect reinvestment of dividends and/or distributions at NAV on the ex-dividend date as calculated by Lipper. | |
| | (d) | An index designed to measure the performance of U.S. dollar-denominated high-yield municipal bonds issued by U.S. states, the District of Columbia, U.S. territories and local governments or agencies. | |
| | (e) | The Fund is presenting the performance of a broad-based securities market index (“broad-based index”) to satisfy SEC reporting requirements. The broad-based index is presented only for informational purposes, as the Fund is actively managed and does not seek to track or replicate the performance of the broad-based index or any other index. | |
| | (f) | The High Yield Customized Reference Benchmark is comprised of the Bloomberg Municipal Bond Rated Baa Index (20%), the Bloomberg Municipal Bond: High Yield (non-Investment Grade) Total Return Index (60%) and the Bloomberg Municipal Investment Grade ex BBB Index (20%). Effective October 1, 2021, the Fund changed its benchmark against which it measures its performance from Lipper High Yield Municipal Debt Funds to the High Yield Customized Reference Benchmark. | |
Performance results may include adjustments made for financial reporting purposes in accordance with U.S. generally accepted accounting principles.
Past performance is not an indication of future results.
More information about the Fund’s historical performance can be found in the “Closed End Funds” section of blackrock.com.
| | |
| 6 | | 2 0 2 1 BLACK ROCK SEMI - ANNUAL REPORT TO SHAREHOLDERS |
| | |
| Fund Summary as of October 31, 2021 (continued) | | BlackRock MuniAssets Fund, Inc. (MUA) |
The following discussion relates to the Fund’s absolute performance based on NAV:
Municipal bonds produced flat returns in the past six months. After performing well in the span from May 2021 through July 2021, municipal bonds lost ground in the second half of the period on concerns that the Fed was set to begin tapering its stimulative quantitative easing policy and start raising interest rates in 2022. In a continuation of a trend that has been in place since mid-2020, lower-rated issues outperformed higher-quality securities amid investors’ continued search for yield.
Income was a key contributor to performance since overall price action was slightly negative. The Fund’s holdings in long-dated unrated and non-investment grade bonds benefited from strong investor risk appetites, improving credit fundamentals and limited supply for much of the reporting period. At the sector level, positions in education, tax-backed, land development, health care, utilities and tobacco issues helped performance. In addition, an increased weighting in charter schools and Puerto Rico general obligation and electric authority bonds were particularly notable contributors.
The views expressed reflect the opinions of BlackRock as of the date of this report and are subject to change based on changes in market, economic or other conditions. These views are not intended to be a forecast of future events and are no guarantee of future results.
| | |
| Fund Summary as of October 31, 2021 (continued) | | BlackRock MuniAssets Fund, Inc. (MUA) |
Overview of the Fund’s Total Investments
SECTOR ALLOCATION
| | | | | | |
| | | |
| Sector(a)(b) | | 10/31/21 | | | 04/30/21 |
| | |
County/City/Special District/School District | | | 16 | % | | 16% |
Education | | | 16 | | | 14 |
State | | | 13 | | | 13 |
Transportation | | | 13 | | | 13 |
Utilities | | | 10 | | | 12 |
Tobacco | | | 10 | | | 11 |
Health | | | 9 | | | 9 |
Corporate | | | 8 | | | 8 |
Housing | | | 5 | | | 4 |
Other | | | — | (c) | | — |
CALL/MATURITY SCHEDULE
| | |
| | |
| Calendar Year Ended December 31,(a)(d) | | Percentage |
| |
2021 | | 11% |
2022 | | 6 |
2023 | | 10 |
2024 | | 8 |
2025 | | 4 |
CREDIT QUALITY ALLOCATION
| | | | | | | | |
| | | |
| Credit Rating(a)(e) | | 10/31/21 | | | 04/30/21 | |
| | |
AAA/Aaa | | | — | %(c) | | | — | % |
AA/Aa | | | 13 | | | | 17 | |
A | | | 10 | | | | 8 | |
BBB/Baa | | | 13 | | | | 12 | |
BB/Ba | | | 12 | | | | 9 | |
B | | | 4 | | | | 7 | |
CCC/Caa | | | — | (c) | | | — | |
C | | | — | | | | 3 | |
N/R(f) | | | 48 | | | | 44 | |
| (a) | Excludes short-term securities. |
| (b) | For Fund compliance purposes, the Fund’s sector classifications refer to one or more of the sector sub-classifications used by one or more widely recognized market indexes or rating group indexes, and/or as defined by the investment adviser. These definitions may not apply for purposes of this report, which may combine such sector sub-classifications for reporting ease. |
| (c) | Rounds to less than 1% of total investments. |
| (d) | Scheduled maturity dates and/or bonds that are subject to potential calls by issuers over the next five years. |
| (e) | For financial reporting purposes, credit quality ratings shown above reflect the highest rating assigned by either S&P Global Ratings or Moody’s Investors Service, Inc. if ratings differ. These rating agencies are independent, nationally recognized statistical rating organizations and are widely used. Investment grade ratings are credit ratings of BBB/Baa or higher. Below investment grade ratings are credit ratings of BB/Ba or lower. Investments designated N/R are not rated by either rating agency. Unrated investments do not necessarily indicate low credit quality. Credit quality ratings are subject to change. |
| (f) | The investment adviser evaluates the credit quality of unrated investments based upon certain factors including, but not limited to, credit ratings for similar investments and financial analysis of sectors and individual investments. Using this approach, the investment adviser has deemed certain of these unrated securities as investment grade quality. As of October 31, 2021 and April 30, 2021, the market value of unrated securities deemed by the investment adviser to be investment grade represents 2% and 2%, respectively, of the Fund’s total investments. |
| | |
| 8 | | 2 0 2 1 BLACK ROCK SEMI - ANNUAL REPORT TO SHAREHOLDERS |
| | |
| Fund Summary as of October 31, 2021 | | BlackRock Municipal Income Fund, Inc. (MUI) |
Investment Objective
BlackRock Municipal Income Fund, Inc.’s (MUI) (formerly known as BlackRock Muni Intermediate Duration Fund, Inc.) (the “Fund”) investment objective is to provide common shareholders with high current income exempt from U.S. federal income taxes. The Fund seeks to achieve its investment objective by investing at least 80% of its assets in municipal bonds exempt from U.S. federal income taxes (except that the interest may be subject to the U.S. federal alternative minimum tax). Under normal market conditions, the Fund invests at least 75% of its assets in municipal bonds rated investment grade or, if unrated, are deemed to be of comparable quality by the investment adviser, at the time of investment. The Fund may invest directly in such securities or synthetically through the use of derivatives.
On September 24, 2021, the Board of Directors of the Fund approved a change in the name of the Fund from BlackRock Muni Intermediate Duration Fund, Inc. to BlackRock Municipal Income Fund, Inc. and the elimination of the Fund’s non-fundamental policy to maintain a dollar-weighted average portfolio duration, as calculated by the investment adviser, of three to ten years. Such changes became effective on October 1, 2021.
On September 24, 2021, the Board of Trustees of BlackRock MuniHoldings Investment Quality Fund (MFL) and the Board of Directors of MUI each approved the reorganization of MFL into MUI. Subject to approvals by each Fund’s shareholders and the satisfaction of customary closing conditions, the reorganization is expected to occur during the first or second quarter of 2022.
No assurance can be given that the Fund’s investment objective will be achieved.
Fund Information
| | |
| | |
Symbol on New York Stock Exchange | | MUI |
Initial Offering Date | | August 1, 2003 |
Yield on Closing Market Price as of October 31, 2021 ($15.21)(a) | | 4.26% |
Tax Equivalent Yield(b) | | 7.20% |
Current Monthly Distribution per Common Share(c) | | $0.0540 |
Current Annualized Distribution per Common Share(c) | | $0.6480 |
Leverage as of October 31, 2021(d) | | 38% |
| | (a) | Yield on closing market price is calculated by dividing the current annualized distribution per share by the closing market price. Past performance is not an indication of future results. | |
| | (b) | Tax equivalent yield assumes the maximum marginal U.S. federal tax rate of 40.8%, which includes the 3.8% Medicare tax. Actual tax rates will vary based on income, exemptions and deductions. Lower taxes will result in lower tax equivalent yields. | |
| | (c) | The distribution rate is not constant and is subject to change. | |
| | (d) | Represents VMTP Shares and TOB Trusts as a percentage of total managed assets, which is the total assets of the Fund, including any assets attributable to VMTP Shares and TOB Trusts, minus the sum of its accrued liabilities. Does not reflect derivatives or other instruments that may give rise to economic leverage. For a discussion of leveraging techniques utilized by the Fund, please see The Benefits and Risks of Leveraging and Derivative Financial Instruments. | |
Market Price and Net Asset Value Per Share Summary
| | | | | | | | | | | | | | | | | | | | |
| | | 10/31/21 | | | 04/30/21 | | | Change | | | High | | | Low | |
| | | | | |
Closing Market Price | | $ | 15.21 | | | $ | 15.09 | | | | 0.80 | % | | $ | 16.11 | | | $ | 15.09 | |
Net Asset Value | | | 15.78 | | | | 16.11 | | | | (2.05 | ) | | | 16.29 | | | | 15.76 | |
Performance
Returns for the period ended October 31, 2021 were as follows:
| | | | | | | | | | | | | | | | | | | | |
| | | | | | | | | Average Annual Total Returns | |
| | | | | | | | | | | | | | | | |
| | | | | |
| | | | | | 6-month | | | 1 Year | | | 5 Years | | | 10 Years | |
| | | | | |
Fund at NAV(a)(b) | | | | | | | (0.01 | )% | | | 5.04 | % | | | 4.29 | % | | | 5.72 | % |
Fund at Market Price(a)(b) | | | | | | | 2.89 | | | | 13.32 | | | | 5.58 | | | | 5.76 | |
| | | | | |
Lipper Intermediate Municipal Debt Funds at NAV(c) | | | | | | | 0.26 | | | | 5.27 | | | | 3.67 | | | | 4.94 | |
Lipper Intermediate Municipal Debt Funds at Market Price(c) | | | | | | | 2.53 | | | | 11.57 | | | | 4.64 | | | | 5.14 | |
Bloomberg Municipal Bond Index(d)(e) | | | | | | | 0.01 | | | | 2.64 | | | | 3.41 | | | | 3.88 | |
National Customized Reference Benchmark(f) | | | | | | | 0.25 | | | | 3.42 | | | | 3.70 | | | | N/A | |
| | (a) | All returns reflect reinvestment of dividends and/or distributions at actual reinvestment prices. Performance results reflect the Fund’s use of leverage. | |
| | (b) | The Fund’s discount to NAV narrowed during the period, which accounts for the difference between performance based on market price and performance based on NAV. | |
| | (c) | Average return. Returns reflect reinvestment of dividends and/or distributions at NAV on the ex-dividend date as calculated by Lipper. | |
| | (d) | An unmanaged index that tracks the U.S. long term tax-exempt bond market, including state and local general obligation bonds, revenue bonds, pre-refunded bonds, and insured bonds. | |
| | (e) | The Fund is presenting the performance of a broad-based securities market index (“broad-based index”) to satisfy SEC reporting requirements. The broad-based index is presented only for informational purposes, as the Fund is actively managed and does not seek to track or replicate the performance of the broad-based index or any other index. | |
| | (f) | The National Customized Reference Benchmark is comprised of the Bloomberg Municipal Bond Index Total Return Index Value Unhedged (90%) and the Bloomberg Municipal Bond: High Yield (non-Investment Grade) Total Return Index (10%). Effective October 1, 2021, the Fund changed its benchmark against which it measures its performance from Lipper Intermediate Municipal Debt Funds to the National Customized Reference Benchmark. | |
Performance results may include adjustments made for financial reporting purposes in accordance with U.S. generally accepted accounting principles.
Past performance is not an indication of future results.
| | |
| Fund Summary as of October 31, 2021 (continued) | | BlackRock Municipal Income Fund, Inc. (MUI) |
More information about the Fund’s historical performance can be found in the “Closed End Funds” section of blackrock.com.
The following discussion relates to the Fund’s absolute performance based on NAV:
Municipal bonds produced flat returns in the past six months. After performing well in the span from May 2021 through July 2021, municipal bonds lost ground in the second half of the period on concerns that the Fed was set to begin tapering its stimulative quantitative easing policy and start raising interest rates in 2022. In a continuation of a trend that has been in place since mid-2020, lower-rated issues outperformed higher-quality securities amid investors’ continued search for yield.
The Fund’s positions in higher-quality, shorter-duration securities detracted from results. (Duration is a measure of interest rate sensitivity). The Fund used U.S. Treasury futures in an effort to manage interest rate risk, which was also a slight detractor.
Conversely, given that price returns were slightly negative during the period, income was the largest driver of performance. The Fund’s holdings in eight- to 15-year maturities added to performance, as did holdings in lower-rated investment-grade bonds (those rated A and BBB). Positions in below investment-grade debt in the BB and non-rated categories were further contributors, as falling yield spreads in these areas helped offset the effect of rising interest rates. At the sector level, allocations to state tax-backed, education and transportation issues helped performance.
The views expressed reflect the opinions of BlackRock as of the date of this report and are subject to change based on changes in market, economic or other conditions. These views are not intended to be a forecast of future events and are no guarantee of future results.
| | |
| 10 | | 2 0 2 1 BLACK ROCK SEMI - ANNUAL REPORT TO SHAREHOLDERS |
| | |
| Fund Summary as of October 31, 2021 (continued) | | BlackRock Municipal Income Fund, Inc. (MUI) |
Overview of the Fund’s Total Investments
SECTOR ALLOCATION
| | | | | | | | |
| | | |
| Sector(a)(b) | | 10/31/21 | | | 04/30/21 | |
| | |
Transportation | | | 28 | % | | | 24 | % |
State | | | 17 | | | | 21 | |
County/City/Special District/School District | | | 15 | | | | 13 | |
Education | | | 11 | | | | 12 | |
Health | | | 11 | | | | 12 | |
Utilities | | | 7 | | | | 7 | |
Corporate | | | 4 | | | | 4 | |
Tobacco | | | 4 | | | | 4 | |
Housing | | | 3 | | | | 2 | |
Other | | | — | (c) | | | 1 | |
CALL/MATURITY SCHEDULE
| | | | |
| | |
| Calendar Year Ended December 31,(a)(d) | | Percentage | |
| |
2021 | | | 5 | % |
2022 | | | 5 | |
2023 | | | 11 | |
2024 | | | 8 | |
2025 | | | 9 | |
CREDIT QUALITY ALLOCATION
| | | | | | | | |
| | | |
| Credit Rating(a)(e) | | 10/31/21 | | | 04/30/21 | |
| | |
AAA/Aaa | | | 4 | % | | | 3 | % |
AA/Aa | | | 32 | | | | 33 | |
A | | | 36 | | | | 33 | |
BBB/Baa | | | 16 | | | | 17 | |
BB/Ba | | | 5 | | | | 5 | |
B | | | — | (c) | | | 1 | |
N/R(f) | | | 7 | | | | 8 | |
| (a) | Excludes short-term securities. |
| (b) | For Fund compliance purposes, the Fund’s sector classifications refer to one or more of the sector sub-classifications used by one or more widely recognized market indexes or rating group indexes, and/or as defined by the investment adviser. These definitions may not apply for purposes of this report, which may combine such sector sub-classifications for reporting ease. |
| (c) | Rounds to less than 1% of total investments. |
| (d) | Scheduled maturity dates and/or bonds that are subject to potential calls by issuers over the next five years. |
| (e) | For financial reporting purposes, credit quality ratings shown above reflect the highest rating assigned by either S&P Global Ratings or Moody’s Investors Service, Inc. if ratings differ. These rating agencies are independent, nationally recognized statistical rating organizations and are widely used. Investment grade ratings are credit ratings of BBB/Baa or higher. Below investment grade ratings are credit ratings of BB/Ba or lower. Investments designated N/R are not rated by either rating agency. Unrated investments do not necessarily indicate low credit quality. Credit quality ratings are subject to change. |
| (f) | The investment adviser evaluates the credit quality of unrated investments based upon certain factors including, but not limited to, credit ratings for similar investments and financial analysis of sectors and individual investments. Using this approach, the investment adviser has deemed certain of these unrated securities as investment grade quality. As of October 31, 2021 and April 30, 2021, the market value of unrated securities deemed by the investment adviser to be investment grade each represents less than 1% of the Fund’s total investments. |
| | |
| Fund Summary as of October 31, 2021 | | BlackRock MuniHoldings Fund, Inc. (MHD) |
Investment Objective
BlackRock MuniHoldings Fund, Inc.’s (MHD) (the “Fund”) investment objective is to provide shareholders with current income exempt from U.S. federal income taxes. The Fund seeks to achieve its investment objective by investing at least 80% of its assets in municipal bonds exempt from U.S. federal income taxes (except that the interest may be subject to the U.S. federal alternative minimum tax). The Fund invests, under normal market conditions, at least 75% of its assets in municipal bonds rated investment grade or, if unrated, are deemed to be of comparable quality by the investment adviser at the time of investment and invests primarily in long-term municipal bonds with a maturity of more than ten years at the time of investment. The Fund may invest directly in such securities or synthetically through the use of derivatives.
No assurance can be given that the Fund’s investment objective will be achieved.
Fund Information
| | |
| | |
Symbol on New York Stock Exchange | | MHD |
Initial Offering Date | | May 2, 1997 |
Yield on Closing Market Price as of October 31, 2021 ($16.29)(a) | | 4.46% |
Tax Equivalent Yield(b) | | 7.53% |
Current Monthly Distribution per Common Share(c) | | $0.0605 |
Current Annualized Distribution per Common Share(c) | | $0.7260 |
Leverage as of October 31, 2021(d) | | 38% |
| | (a) | Yield on closing market price is calculated by dividing the current annualized distribution per share by the closing market price. Past performance is not an indication of future results. | |
| | (b) | Tax equivalent yield assumes the maximum marginal U.S. federal tax rate of 40.8%, which includes the 3.8% Medicare tax. Actual tax rates will vary based on income, exemptions and deductions. Lower taxes will result in lower tax equivalent yields. | |
| | (c) | The distribution rate is not constant and is subject to change. | |
| | (d) | Represents VMTP Shares and TOB Trusts as a percentage of total managed assets, which is the total assets of the Fund, including any assets attributable to VMTP Shares and TOB Trusts, minus the sum of its accrued liabilities. Does not reflect derivatives or other instruments that may give rise to economic leverage. For a discussion of leveraging techniques utilized by the Fund, please see The Benefits and Risks of Leveraging and Derivative Financial Instruments. | |
Market Price and Net Asset Value Per Share Summary
| | | | | | | | | | | | | | | | | | | | |
| | | 10/31/21 | | | 04/30/21 | | | Change | | | High | | | Low | |
| | | | | |
Closing Market Price | | $ | 16.29 | | | $ | 16.33 | | | | (0.24 | )% | | $ | 17.40 | | | $ | 16.07 | |
Net Asset Value | | | 16.95 | | | | 17.30 | | | | (2.02 | ) | | | 17.70 | | | | 16.91 | |
Performance
Returns for the period ended October 31, 2021 were as follows:
| | | | | | | | | | | | | | | | |
| | | | | | Average Annual Total Returns | |
| | | | | | | | | | | | | |
| | | | |
| | | 6-month | | | 1 Year | | | 5 Years | | | 10 Years | |
| | | | |
Fund at NAV(a)(b) | | | 0.11 | % | | | 7.20 | % | | | 4.36 | % | | | 6.70 | % |
Fund at Market Price(a)(b) | | | 1.92 | | | | 13.32 | | | | 4.67 | | | | 6.28 | |
| | | | |
Lipper General & Insured Municipal Debt Funds (Leveraged) at NAV(c) | | | 0.71 | | | | 7.59 | | | | 4.57 | | | | 6.33 | |
Lipper General & Insured Municipal Debt Funds (Leveraged) at Market Price(c) | | | 0.95 | | | | 12.95 | | | | 5.73 | | | | 6.40 | |
Bloomberg Municipal Bond Index(d)(e) | | | 0.01 | | | | 2.64 | | | | 3.41 | | | | 3.88 | |
National Customized Reference Benchmark(f) | | | 0.25 | | | | 3.42 | | | | 3.70 | | | | N/A | |
| | (a) | All returns reflect reinvestment of dividends and/or distributions at actual reinvestment prices. Performance results reflect the Fund’s use of leverage. | |
| | (b) | The Fund’s discount to NAV narrowed during the period, which accounts for the difference between performance based on market price and performance based on NAV. | |
| | (c) | Average return. Returns reflect reinvestment of dividends and/or distributions at NAV on the ex-dividend date as calculated by Lipper. | |
| | (d) | An unmanaged index that tracks the U.S. long term tax-exempt bond market, including state and local general obligation bonds, revenue bonds, pre-refunded bonds, and insured bonds. | |
| | (e) | The Fund is presenting the performance of a broad-based securities market index (“broad-based index”) to satisfy SEC reporting requirements. The broad-based index is presented only for informational purposes, as the Fund is actively managed and does not seek to track or replicate the performance of the broad-based index or any other index. | |
| | (f) | The National Customized Reference Benchmark is comprised of the Bloomberg Municipal Bond Index Total Return Index Value Unhedged (90%) and the Bloomberg Municipal Bond: High Yield (non-Investment Grade) Total Return Index (10%). Effective October 1, 2021, the Fund changed its benchmark against which it measures its performance from Lipper General & Insured Municipal Debt Funds (Leveraged) to the National Customized Reference Benchmark. | |
Performance results may include adjustments made for financial reporting purposes in accordance with U.S. generally accepted accounting principles.
Past performance is not an indication of future results.
More information about the Fund’s historical performance can be found in the “Closed End Funds” section of blackrock.com.
The following discussion relates to the Fund’s absolute performance based on NAV:
Municipal bonds produced flat returns in the past six months. After performing well in the span from May 2021 through July 2021, municipal bonds lost ground in the second half of the period on concerns that the Fed was set to begin tapering its stimulative quantitative easing policy and start raising interest rates in 2022. In a continuation of a trend that has been in place since mid-2020, lower-rated issues outperformed higher-quality securities amid investors’ continued search for yield.
| | |
| 12 | | 2 0 2 1 BLACK ROCK SEMI - ANNUAL REPORT TO SHAREHOLDERS |
| | |
| Fund Summary as of October 31, 2021 (continued) | | BlackRock MuniHoldings Fund, Inc. (MHD) |
Income was a key contributor to performance since overall price action was slightly negative. Positions in longer-dated bonds on the lower end of the investment-grade spectrum, especially those rated A and BBB, contributed to performance. Holdings in non-investment grade and unrated securities also added value, as strong investor risk appetites buoyed the prices of lower-rated debt. At the sector level, tax-backed and education issues performed well, as did residential and commercial land development projects. Yield curve positioning was an additional positive due to holdings in longer-dated securities, where prices remained relatively stable compared to the intermediate maturity range.
The Fund used U.S. Treasury futures in an effort to manage interest rate risk, which was a slight detractor. An allocation to the housing sector also detracted somewhat late in the reporting period as rates rose.
The views expressed reflect the opinions of BlackRock as of the date of this report and are subject to change based on changes in market, economic or other conditions. These views are not intended to be a forecast of future events and are no guarantee of future results.
| | |
| Fund Summary as of October 31, 2021 (continued) | | BlackRock MuniHoldings Fund, Inc. (MHD) |
Overview of the Fund’s Total Investments
SECTOR ALLOCATION
| | | | | | |
| | | |
| Sector(a)(b) | | 10/31/21 | | | 04/30/21 |
| | |
Transportation | | | 23 | % | | 21% |
Health | | | 16 | | | 15 |
County/City/Special District/School District | | | 16 | | | 16 |
State | | | 13 | | | 15 |
Utilities | | | 10 | | | 10 |
Education | | | 8 | | | 8 |
Tobacco | | | 5 | | | 6 |
Housing | | | 5 | | | 4 |
Corporate | | | 4 | | | 4 |
Other | | | — | (c) | | 1 |
CALL/MATURITY SCHEDULE
| | |
| | |
| Calendar Year Ended December 31,(a)(d) | | Percentage |
| |
2021 | | 6% |
2022 | | 6 |
2023 | | 11 |
2024 | | 5 |
2025 | | 7 |
CREDIT QUALITY ALLOCATION
| | | | | | |
| | | |
| Credit Rating(a)(e) | | 10/31/21 | | | 04/30/21 |
| | |
AAA/Aaa | | | 3 | % | | 3% |
AA/Aa | | | 40 | | | 41 |
A | | | 28 | | | 26 |
BBB/Baa | | | 14 | | | 14 |
BB/Ba | | | 4 | | | 4 |
B | | | 1 | | | 1 |
C | | | — | | | —(c) |
N/R(f) | | | 10 | | | 11 |
| (a) | Excludes short-term securities. |
| (b) | For Fund compliance purposes, the Fund’s sector classifications refer to one or more of the sector sub-classifications used by one or more widely recognized market indexes or rating group indexes, and/or as defined by the investment adviser. These definitions may not apply for purposes of this report, which may combine such sector sub-classifications for reporting ease. |
| (c) | Rounds to less than 1% of total investments. |
| (d) | Scheduled maturity dates and/or bonds that are subject to potential calls by issuers over the next five years. |
| (e) | For financial reporting purposes, credit quality ratings shown above reflect the highest rating assigned by either S&P Global Ratings or Moody’s Investors Service, Inc. if ratings differ. These rating agencies are independent, nationally recognized statistical rating organizations and are widely used. Investment grade ratings are credit ratings of BBB/Baa or higher. Below investment grade ratings are credit ratings of BB/Ba or lower. Investments designated N/R are not rated by either rating agency. Unrated investments do not necessarily indicate low credit quality. Credit quality ratings are subject to change. |
| (f) | The investment adviser evaluates the credit quality of unrated investments based upon certain factors including, but not limited to, credit ratings for similar investments and financial analysis of sectors and individual investments. Using this approach, the investment adviser has deemed certain of these unrated securities as investment grade quality. As of October 31, 2021 and April 30, 2021, the market value of unrated securities deemed by the investment adviser to be investment grade represents 2% and 2%, respectively, of the Fund’s total investments. |
| | |
| 14 | | 2 0 2 1 BLACK ROCK SEMI - ANNUAL REPORT TO SHAREHOLDERS |
| | |
| Fund Summary as of October 31, 2021 | | BlackRock MuniVest Fund II, Inc. (MVT) |
Investment Objective
BlackRock MuniVest Fund II, Inc.’s (MVT) (the “Fund”) investment objective is to provide shareholders with as high a level of current income exempt from U.S. federal income taxes as is consistent with its investment policies and prudent investment management. The Fund seeks to achieve its investment objective by investing at least 80% of its assets in municipal bonds exempt from U.S. federal income taxes (except that the interest may be subject to the U.S. federal alternative minimum tax). The Fund invests, under normal market conditions, at least 75% of its assets in municipal bonds rated investment grade or, if unrated, are deemed to be of comparable quality by the investment adviser at the time of investment and invests primarily in long-term municipal bonds with a maturity of more than ten years at the time of investment. The Fund may invest directly in such securities or synthetically through the use of derivatives.
No assurance can be given that the Fund’s investment objective will be achieved.
Fund Information
| | |
| | |
Symbol on New York Stock Exchange | | MVT |
Initial Offering Date | | March 29, 1993 |
Yield on Closing Market Price as of October 31, 2021 ($14.78)(a) | | 4.75% |
Tax Equivalent Yield(b) | | 8.02% |
Current Monthly Distribution per Common Share(c) | | $0.0585 |
Current Annualized Distribution per Common Share(c) | | $0.7020 |
Leverage as of October 31, 2021(d) | | 38% |
| | (a) | Yield on closing market price is calculated by dividing the current annualized distribution per share by the closing market price. Past performance is not an indication of future results. | |
| | (b) | Tax equivalent yield assumes the maximum marginal U.S. federal tax rate of 40.8%, which includes the 3.8% Medicare tax. Actual tax rates will vary based on income, exemptions and deductions. Lower taxes will result in lower tax equivalent yields. | |
| | (c) | The distribution rate is not constant and is subject to change. | |
| | (d) | Represents VMTP Shares and TOB Trusts as a percentage of total managed assets, which is the total assets of the Fund, including any assets attributable to VMTP Shares and TOB Trusts, minus the sum of its accrued liabilities. Does not reflect derivatives or other instruments that may give rise to economic leverage. For a discussion of leveraging techniques utilized by the Fund, please see The Benefits and Risks of Leveraging and Derivative Financial Instruments. | |
Market Price and Net Asset Value Per Share Summary
| | | | | | | | | | | | | | | | | | | | |
| | | 10/31/21 | | | 04/30/21 | | | Change | | | High | | | Low | |
| | | | | |
Closing Market Price | | $ | 14.78 | | | $ | 15.15 | | | | (2.44 | )% | | $ | 16.81 | | | $ | 14.63 | |
Net Asset Value | | | 15.30 | | | | 15.60 | | | | (1.92 | ) | | | 16.01 | | | | 15.25 | |
Performance
Returns for the period ended October 31, 2021 were as follows:
| | | | | | | | | | | | | | | | |
| | | | | | Average Annual Total Returns | |
| | | | | | | | | | | | | |
| | | | |
| | | 6-month | | | 1 Year | | | 5 Years | | | 10 Years | |
| | | | |
Fund at NAV(a)(b) | | | 0.30 | % | | | 7.62 | % | | | 4.56 | % | | | 6.60 | % |
Fund at Market Price(a)(b) | | | (0.23 | ) | | | 11.93 | | | | 3.53 | | | | 5.83 | |
| | | | |
Lipper General & Insured Municipal Debt Funds (Leveraged) at NAV(c) | | | 0.71 | | | | 7.59 | | | | 4.57 | | | | 6.33 | |
Lipper General & Insured Municipal Debt Funds (Leveraged) at Market Price(c) | | | 0.95 | | | | 12.95 | | | | 5.73 | | | | 6.40 | |
Bloomberg Municipal Bond Index(d)(e) | | | 0.01 | | | | 2.64 | | | | 3.41 | | | | 3.88 | |
National Customized Reference Benchmark(f) | | | 0.25 | | | | 3.42 | | | | 3.70 | | | | N/A | |
| | (a) | All returns reflect reinvestment of dividends and/or distributions at actual reinvestment prices. Performance results reflect the Fund’s use of leverage. | |
| | (b) | The Fund’s discount to NAV widened during the period, which accounts for the difference between performance based on market price and performance based on NAV. | |
| | (c) | Average return. Returns reflect reinvestment of dividends and/or distributions at NAV on the ex-dividend date as calculated by Lipper. | |
| | (d) | An unmanaged index that tracks the U.S. long term tax-exempt bond market, including state and local general obligation bonds, revenue bonds, pre-refunded bonds, and insured bonds. | |
| | (e) | The Fund is presenting the performance of a broad-based securities market index (“broad-based index”) to satisfy SEC reporting requirements. The broad-based index is presented only for informational purposes, as the Fund is actively managed and does not seek to track or replicate the performance of the broad-based index or any other index. | |
| | (f) | The National Customized Reference Benchmark is comprised of the Bloomberg Municipal Bond Index Total Return Index Value Unhedged (90%) and the Bloomberg Municipal Bond: High Yield (non-Investment Grade) Total Return Index (10%). Effective October 1, 2021, the Fund changed its benchmark against which it measures its performance from Lipper General & Insured Municipal Debt Funds (Leveraged) to the National Customized Reference Benchmark. | |
Performance results may include adjustments made for financial reporting purposes in accordance with U.S. generally accepted accounting principles.
Past performance is not an indication of future results.
More information about the Fund’s historical performance can be found in the “Closed End Funds” section of blackrock.com.
| | |
| Fund Summary as of October 31, 2021 (continued) | | BlackRock MuniVest Fund II, Inc. (MVT) |
The following discussion relates to the Fund’s absolute performance based on NAV:
Municipal bonds produced flat returns in the past six months. After performing well in the span from May 2021 through July 2021, municipal bonds lost ground in the second half of the period on concerns that the Fed was set to begin tapering its stimulative quantitative easing policy and start raising interest rates in 2022. In a continuation of a trend that has been in place since mid-2020, lower-rated issues outperformed higher-quality securities amid investors’ continued search for yield.
Income was a key contributor to performance since overall price action was slightly negative. Positions in longer-dated bonds on the lower end of the investment-grade spectrum, especially those rated A and BBB, contributed to performance. Holdings in non-investment grade and unrated securities also added value, as strong investor risk appetites buoyed the prices of lower-rated debt. At the sector level, tax-backed, health care and education issues performed well, as did residential and commercial land development projects. Yield curve positioning was an additional positive due to holdings in longer-dated securities, where prices remained relatively stable compared to the intermediate maturity range.
The Fund used U.S. Treasury futures in an effort to manage interest rate risk, which was a slight detractor. An allocation to the housing sector also detracted somewhat late in the reporting period as rates rose.
The views expressed reflect the opinions of BlackRock as of the date of this report and are subject to change based on changes in market, economic or other conditions. These views are not intended to be a forecast of future events and are no guarantee of future results.
| | |
| 16 | | 2 0 2 1 BLACK ROCK SEMI - ANNUAL REPORT TO SHAREHOLDERS |
| | |
| Fund Summary as of October 31, 2021 (continued) | | BlackRock MuniVest Fund II, Inc. (MVT) |
Overview of the Fund’s Total Investments
| | | | | | |
SECTOR ALLOCATION |
| | | |
| Sector(a)(b) | | 10/31/21 | | | 04/30/21 |
| | |
Transportation | | | 22 | % | | 21% |
Health | | | 19 | | | 18 |
State | | | 16 | | | 18 |
County/City/Special District/School District | | | 11 | | | 11 |
Utilities | | | 10 | | | 11 |
Education | | | 8 | | | 8 |
Tobacco | | | 8 | | | 8 |
Corporate | | | 4 | | | 4 |
Housing | | | 2 | | | 1 |
| | | | | | |
CREDIT QUALITY ALLOCATION |
| | | |
| Credit Rating(a)(d) | | 10/31/21 | | | 04/30/21 |
| | |
AAA/Aaa | | | 5 | % | | 5% |
AA/Aa | | | 32 | | | 32 |
A | | | 29 | | | 27 |
BBB/Baa | | | 15 | | | 16 |
BB/Ba | | | 7 | | | 7 |
B | | | 2 | | | 2 |
C | | | — | | | 1 |
N/R(e) | | | 10 | | | 10 |
| | |
| CALL/MATURITY SCHEDULE |
| | |
| Calendar Year Ended December 31,(a)(c) | | Percentage |
| |
2021 | | 5% |
2022 | | 7 |
2023 | | 7 |
2024 | | 6 |
2025 | | 7 |
| (a) | Excludes short-term securities. |
| (b) | For Fund compliance purposes, the Fund’s sector classifications refer to one or more of the sector sub-classifications used by one or more widely recognized market indexes or rating group indexes, and/or as defined by the investment adviser. These definitions may not apply for purposes of this report, which may combine such sector sub-classifications for reporting ease. |
| (c) | Scheduled maturity dates and/or bonds that are subject to potential calls by issuers over the next five years. |
| (d) | For financial reporting purposes, credit quality ratings shown above reflect the highest rating assigned by either S&P Global Ratings or Moody’s Investors Service, Inc. if ratings differ. These rating agencies are independent, nationally recognized statistical rating organizations and are widely used. Investment grade ratings are credit ratings of BBB/Baa or higher. Below investment grade ratings are credit ratings of BB/Ba or lower. Investments designated N/R are not rated by either rating agency. Unrated investments do not necessarily indicate low credit quality. Credit quality ratings are subject to change. |
| (e) | The investment adviser evaluates the credit quality of unrated investments based upon certain factors including, but not limited to, credit ratings for similar investments and financial analysis of sectors and individual investments. Using this approach, the investment adviser has deemed certain of these unrated securities as investment grade quality. As of October 31, 2021 and April 30, 2021, the market value of unrated securities deemed by the investment adviser to be investment grade represents 2% and 2%, respectively, of the Fund’s total investments. |
| | |
Schedule of Investments (unaudited) October 31, 2021 | | BlackRock MuniAssets Fund, Inc. (MUA) (Percentages shown are based on Net Assets) |
| | | | | | | | |
| Security | | Par (000) | | | Value | |
|
Municipal Bonds | |
|
Alabama — 1.5% | |
County of Jefferson Alabama Sewer Revenue, Refunding RB, Series D, Sub Lien, 6.00%, 10/01/42 | | $ | 3,745 | | | $ | 4,227,914 | |
Hoover Industrial Development Board, RB, AMT, 6.38%, 11/01/50(a) | | | 2,725 | | | | 3,477,978 | |
Tuscaloosa County Industrial Development Authority, Refunding RB(b) | | | | | | | | |
Series A, 4.50%, 05/01/32 | | | 353 | | | | 384,380 | |
Series A, 5.25%, 05/01/44 | | | 385 | | | | 442,894 | |
| | | | | | | | |
| | |
| | | | | | | 8,533,166 | |
| | |
| Arizona — 3.7% | | | | | | |
Arizona Industrial Development Authority RB | | | | | | | | |
Class B, 4.00%, 07/01/41 | | | 160 | | | | 172,955 | |
Class B, 4.00%, 07/01/51 | | | 445 | | | | 472,027 | |
Class B, 4.00%, 07/01/61 | | | 890 | | | | 932,292 | |
Series A, 4.00%, 07/01/51 | | | 445 | | | | 486,129 | |
Series A, 4.00%, 07/01/61 | | | 910 | | | | 983,236 | |
Arizona Industrial Development Authority, RB(b) | | | | | | | | |
7.10%, 01/01/55 | | | 1,790 | | | | 1,804,859 | |
Series A, 5.00%, 12/15/39 | | | 250 | | | | 285,890 | |
Series B, 5.13%, 07/01/47 | | | 665 | | | | 741,447 | |
Arizona Industrial Development Authority, Refunding RB(b) | | | | | | | | |
Series A, 5.13%, 07/01/37 | | | 960 | | | | 1,095,565 | |
Series A, 5.25%, 07/01/47 | | | 1,765 | | | | 2,001,101 | |
Series A, 5.50%, 07/01/52 | | | 1,775 | | | | 1,910,253 | |
Glendale Industrial Development Authority, RB | | | | | | | | |
5.00%, 05/15/41 | | | 100 | | | | 114,277 | |
5.00%, 05/15/56 | | | 405 | | | | 452,835 | |
Industrial Development Authority of the City of Phoenix, RB(b) | | | | | | | | |
Series A, 6.50%, 07/01/34 | | | 570 | | | | 645,149 | |
Series A, 6.75%, 07/01/44 | | | 1,000 | | | | 1,145,302 | |
Industrial Development Authority of the City of Phoenix, Refunding RB(b) | | | | | | | | |
5.00%, 07/01/35 | | | 625 | | | | 686,709 | |
5.00%, 07/01/45 | | | 1,425 | | | | 1,559,117 | |
Series A, 5.00%, 07/01/35 | | | 260 | | | | 288,605 | |
Industrial Development Authority of the County of Pima, Refunding RB, 5.00%, 07/01/56(b) | | | 480 | | | | 524,030 | |
La Paz County Industrial Development Authority, RB, 5.88%, 06/15/48(b) | | | 875 | | | | 946,337 | |
Maricopa County Industrial Development Authority, RB(b) | | | | | | | | |
5.25%, 10/01/40 | | | 465 | | | | 518,353 | |
5.50%, 10/01/51 | | | 465 | | | | 517,056 | |
Salt Verde Financial Corp., RB, 5.00%, 12/01/37 | | | 1,650 | | | | 2,257,482 | |
Tempe Industrial Development Authority RB, 4.00%, 12/01/56 | | | 350 | | | | 373,394 | |
| | | | | | | | |
| | |
| | | | | | | 20,914,400 | |
| | |
| Arkansas(b) — 1.7% | | | | | | |
Arkansas Development Finance Authority, RB | | | | | | | | |
Series A, AMT, 4.50%, 09/01/49 | | | 2,815 | | | | 3,063,232 | |
Series A, AMT, 4.75%, 09/01/49 | | | 6,090 | | | | 6,774,687 | |
| | | | | | | | |
| | |
| | | | | | | 9,837,919 | |
| | |
| California — 5.1% | | | | | | |
California Community Housing Agency, RB, M/F Housing(b) | | | | | | | | |
Series A, 5.00%, 04/01/49. | | | 240 | | | | 269,344 | |
| | | | | | | | |
| Security | | Par (000) | | | Value | |
| | |
| California (continued) | | | | | | |
California Community Housing Agency, RB, M/F Housing(b) (continued) | | | | | | | | |
Series A-2, 4.00%, 08/01/47 | | $ | 1,550 | | | $ | 1,591,410 | |
California Municipal Finance Authority, RB(b) | | | | | | | | |
Series A, 5.50%, 08/01/34 | | | 295 | | | | 315,419 | |
Series A, 6.00%, 08/01/44 | | | 665 | | | | 713,693 | |
Series A, 6.13%, 08/01/49 | | | 580 | | | | 622,494 | |
California Public Finance Authority, RB, Series A, 6.25%, 07/01/54(b) | | | 1,780 | | | | 2,049,164 | |
California School Finance Authority, RB | | | | | | | | |
6.65%, 07/01/33 | | | 435 | | | | 470,147 | |
6.90%, 07/01/43 | | | 975 | | | | 1,050,830 | |
Series A, 6.40%, 07/01/48 | | | 1,570 | | | | 1,697,553 | |
California Statewide Communities Development Authority, RB, 5.25%, 12/01/38(b) | | | 580 | | | | 696,157 | |
California Statewide Financing Authority, RB, Series B, 6.00%, 05/01/43 | | | 1,650 | | | | 1,654,368 | |
City of San Jose California Hotel Tax Revenue, RB | | | | | | | | |
6.50%, 05/01/36 | | | 900 | | | | 904,122 | |
6.50%, 05/01/42 | | | 2,220 | | | | 2,229,963 | |
CMFA Special Finance Agency I, RB, M/F Housing, Series A, 4.00%, 04/01/56(b) | | | 3,300 | | | | 3,476,395 | |
CSCDA Community Improvement Authority, RB, M/F Housing(b) | | | | | | | | |
2.65%, 12/01/46 | | | 1,080 | | | | 1,003,199 | |
3.00%, 12/01/56 | | | 890 | | | | 824,219 | |
4.00%, 12/01/56 | | | 1,385 | | | | 1,436,458 | |
Series B, 4.00%, 02/01/57 | | | 700 | | | | 728,089 | |
Golden State Tobacco Securitization Corp., Refunding RB | | | | | | | | |
Series A-1, 5.25%, 06/01/47 | | | 610 | | | | 625,788 | |
Series A-2, 5.00%, 06/01/47 | | | 790 | | | | 809,239 | |
Hastings Campus Housing Finance Authority, RB, CAB, Sub-Series A, 6.75%, 07/01/61(b)(c) | | | 1,705 | | | | 1,010,330 | |
Riverside County Transportation Commission, RB, Series A, Senior Lien, 5.75%, 06/01/48(d) | | | 2,885 | | | | 3,130,135 | |
San Francisco City & County Redevelopment Agency Successor Agency, TA, CAB(b)(e) | | | | | | | | |
Series D, 0.00%, 08/01/26 | | | 1,250 | | | | 1,003,183 | |
Series D, 0.00%, 08/01/43 | | | 1,500 | | | | 513,399 | |
| | | | | | | | |
| | |
| | | | | | | 28,825,098 | |
| | |
| Colorado — 2.1% | | | | | | |
9th Avenue Metropolitan District No.2, GO, 5.00%, 12/01/48 | | | 910 | | | | 967,095 | |
Arista Metropolitan District, Refunding GO, Series A, 5.00%, 12/01/38 | | | 1,240 | | | | 1,328,216 | |
Banning Lewis Ranch Metropolitan District No. 8, GO, 4.88%, 12/01/51(b) | | | 665 | | | | 631,760 | |
Centerra Metropolitan District No.1, TA, 5.00%, 12/01/47(b) | | | 575 | | | | 602,342 | |
Green Valley Ranch East Metropolitan District No.6, GO, Series A, 5.88%, 12/01/50 | | | 935 | | | | 1,022,450 | |
Karl’s Farm Metropolitan District No.2, GO, Series A, 5.63%, 12/01/50(b) | | | 545 | | | | 591,176 | |
Lanterns Metropolitan District No 2 GOL, Series A, 4.50%, 12/01/50 | | | 520 | | | | 501,514 | |
Loretto Heights Community Authority, RB, 4.88%, 12/01/51 | | | 790 | | | | 806,859 | |
| | |
| 18 | | 2 0 2 1 BLACK ROCK SEMI - ANNUAL REPORT TO SHAREHOLDERS |
| | |
Schedule of Investments (unaudited) (continued) October 31, 2021 | | BlackRock MuniAssets Fund, Inc. (MUA) (Percentages shown are based on Net Assets) |
| | | | | | | | |
| Security | | Par (000) | | | Value | |
|
| Colorado (continued) | |
North Holly Metropolitan District, GO, Series A, 5.50%, 12/01/48 | | $ | 500 | | | $ | 532,394 | |
Palisade Metropolitan District No.2, GO, Subordinate, 7.25%, 12/15/49 | | | 1,211 | | | | 1,287,383 | |
Prairie Farm Metropolitan District, GO, Series A, 5.25%, 12/01/48 | | | 760 | | | | 805,135 | |
Pueblo Urban Renewal Authority, TA, 4.75%, 12/01/45(b) | | | 1,365 | | | | 1,520,319 | |
Southlands Metropolitan District No.1, Refunding GO, Series A-1, 5.00%, 12/01/47 | | | 410 | | | | 453,836 | |
Waters’ Edge Metropolitan District No.2, GO, 5.00%, 12/01/51 | | | 790 | | | | 779,941 | |
| | | | | | | | |
| | |
| | | | | | | 11,830,420 | |
| | |
| Connecticut(b) — 0.9% | | | | | | |
Connecticut State Health & Educational Facilities Authority, RB | | | | | | | | |
Series A, 5.00%, 01/01/45 | | | 325 | | | | 352,518 | |
Series A, 5.00%, 01/01/55 | | | 435 | | | | 469,157 | |
Mohegan Tribal Finance Authority, RB, 7.00%, 02/01/45 | | | 1,390 | | | | 1,458,835 | |
Mohegan Tribe of Indians of Connecticut, RB, Series A, 6.75%, 02/01/45 | | | 963 | | | | 1,004,547 | |
Mohegan Tribe of Indians of Connecticut, Refunding RB, Series C, 6.25%, 02/01/30 | | | 1,835 | | | | 2,072,985 | |
| | | | | | | | |
| | |
| | | | | | | 5,358,042 | |
| | |
| District of Columbia — 0.6% | | | | | | |
District of Columbia Tobacco Settlement Financing Corp., RB, CAB, Series A, 0.00%, 06/15/46(e) | | | 15,400 | | | | 3,408,420 | |
| | | | | | | | |
| | |
| Florida — 9.2% | | | | | | |
Boggy Creek Improvement District, Refunding SAB, Series 2013, 5.13%, 05/01/43 | | | 1,335 | | | | 1,380,309 | |
Brevard County Health Facilities Authority, Refunding RB(b) | | | | | | | | |
4.00%, 11/15/23 | | | 125 | | | | 129,905 | |
4.00%, 11/15/24 | | | 440 | | | | 464,462 | |
4.00%, 11/15/25 | | | 460 | | | | 492,675 | |
4.00%, 11/15/27 | | | 495 | | | | 539,920 | |
4.00%, 11/15/29 | | | 435 | | | | 481,130 | |
4.00%, 11/15/32 | | | 450 | | | | 496,703 | |
4.00%, 11/15/35 | | | 675 | | | | 734,364 | |
Capital Region Community Development District, Refunding SAB, Series A-1, 5.13%, 05/01/39 | | | 1,495 | | | | 1,651,873 | |
Capital Trust Agency, Inc., RB | | | | | | | | |
8.25%, 01/01/44 | | | 515 | | | | 10,300 | |
8.25%, 01/01/49 | | | 1,105 | | | | 22,100 | |
Series A, 5.75%, 06/01/54(b) | | | 940 | | | | 1,010,395 | |
Capital Trust Agency, Inc., RB, CAB, 0.00%, 07/01/61(b)(e) | | | 53,225 | | | | 5,601,984 | |
Charlotte County Industrial Development Authority, RB(b) | | | | | | | | |
AMT, 5.00%, 10/01/34 | | | 245 | | | | 272,825 | |
AMT, 5.00%, 10/01/49 | | | 1,170 | | | | 1,267,095 | |
Collier County Industrial Development Authority, Refunding RB, Series A,
8.13%, 05/15/44(b)(f)(g) | | | 630 | | | | 437,850 | |
County of Osceola Florida Transportation Revenue, Refunding RB, CAB(e) | | | | | | | | |
Series A-2, 0.00%, 10/01/50 | | | 730 | | | | 275,517 | |
Series A-2, 0.00%, 10/01/51 | | | 875 | | | | 316,951 | |
Series A-2, 0.00%, 10/01/52 | | | 875 | | | | 304,934 | |
Series A-2, 0.00%, 10/01/53 | | | 2,325 | | | | 779,117 | |
Series A-2, 0.00%, 10/01/54 | | | 875 | | | | 281,882 | |
| | | | | | | | |
| Security | | Par (000) | | | Value | |
| | |
| Florida (continued) | | | | | | |
Florida Development Finance Corp. RB, 5.00%, 06/15/56(b) | | $ | 1,150 | | | $ | 1,228,475 | |
Florida Development Finance Corp., RB | | | | | | | | |
Series A, 5.75%, 06/15/29 | | | 690 | | | | 738,045 | |
Series A, 6.00%, 06/15/34 | | | 835 | | | | 893,532 | |
Series A, 6.13%, 06/15/44 | | | 3,180 | | | | 3,392,265 | |
Series A, 5.13%, 06/15/55(b) | | | 3,645 | | | | 3,745,708 | |
Series A, AMT, 5.00%, 08/01/29(a)(b) | | | 1,550 | | | | 1,588,088 | |
Florida Development Finance Corp., Refunding RB, 5.00%, 06/01/51 | | | 355 | | | | 404,232 | |
Greeneway Improvement District, SAB, 5.13%, 05/01/43 | | | 1,310 | | | | 1,351,737 | |
Lakewood Ranch Stewardship District, SAB | | | | | | | | |
4.25%, 05/01/26 | | | 135 | | | | 141,320 | |
4.95%, 05/01/29(b) | | | 395 | | | | 441,967 | |
5.50%, 05/01/39(b) | | | 400 | | | | 460,857 | |
5.13%, 05/01/46 | | | 810 | | | | 868,666 | |
5.65%, 05/01/48(b) | | | 665 | | | | 763,144 | |
Series 1B, 4.75%, 05/01/29 | | | 565 | | | | 626,367 | |
Series 1B, 5.30%, 05/01/39 | | | 645 | | | | 734,594 | |
Series 1B, 5.45%, 05/01/48 | | | 1,150 | | | | 1,304,616 | |
Miami-Dade County Industrial Development Authority, RB, 5.00%, 01/15/48 | | | 915 | | | | 1,046,549 | |
Midtown Miami Community Development District, Refunding SAB | | | | | | | | |
Series A, 5.00%, 05/01/37 | | | 845 | | | | 874,376 | |
Series B, 5.00%, 05/01/37 | | | 495 | | | | 512,208 | |
North River Ranch Community Development District, SAB | | | | | | | | |
Series A-1, 4.00%, 05/01/40 | | | 310 | | | | 319,234 | |
Series A-1, 4.25%, 05/01/51 | | | 530 | | | | 546,751 | |
Series A-2, 4.20%, 05/01/35 | | | 450 | | | | 462,864 | |
Series A-3, 4.75%, 05/01/40 | | | 600 | | | | 600,145 | |
Palm Beach County Health Facilities Authority, Refunding RB, Series A, 7.25%, 06/01/34 | | | 500 | | | | 526,132 | |
Santa Rosa Bay Bridge Authority, RB, 6.25%, 07/01/28(f)(g) | | | 3,405 | | | | 3,040,114 | |
Sawyers Landing Community Development District Special Assessment, 4.25%, 05/01/53 | | | 1,145 | | | | 1,202,569 | |
Seminole County Industrial Development Authority, Refunding RB, 5.75%, 11/15/54 | | | 985 | | | | 1,082,934 | |
Tolomato Community Development District, Refunding SAB, Series 2015-2, 6.61%, 05/01/40(c) | | | 805 | | | | 646,228 | |
Tolomato Community Development District, Refunding SAB, CAB, Series A-4, Convertible, 6.61%, 05/01/40(c) | | | 305 | | | | 298,256 | |
Tolomato Community Development District, SAB(f)(g) | | | | | | | | |
3rd Series, 6.65%, 05/01/40 | | | 710 | | | | 7 | |
Series 2015-1, 6.61%, 05/01/40 | | | 1,305 | | | | 1,305,001 | |
Series 2015-3, 6.61%, 05/01/40 | | | 875 | | | | 9 | |
Trout Creek Community Development District, SAB | | | | | | | | |
5.38%, 05/01/38 | | | 430 | | | | 481,415 | |
5.50%, 05/01/49 | | | 1,105 | | | | 1,227,126 | |
Village Community Development District No.9, SAB, 5.50%, 05/01/42 | | | 1,045 | | | | 1,055,713 | |
West Villages Improvement District, SAB | | | | | | | | |
4.75%, 05/01/39 | | | 455 | | | | 496,843 | |
5.00%, 05/01/50 | | | 940 | | | | 1,026,400 | |
| | | | | | | | |
| | |
| | | | | | | 52,386,778 | |
| | |
SCHEDULE OF INVESTMENTS | | 19 |
| | |
Schedule of Investments (unaudited) (continued) October 31, 2021 | | BlackRock MuniAssets Fund, Inc. (MUA) (Percentages shown are based on Net Assets) |
| | | | | | | | |
| Security | | Par (000) | | | Value | |
| | |
| Georgia — 0.9% | | | | | | |
Main Street Natural Gas, Inc., RB | | | | | | | | |
Series A, 5.00%, 05/15/35 | | $ | 560 | | | $ | 752,236 | |
Series A, 5.00%, 05/15/36 | | | 560 | | | | 759,771 | |
Series A, 5.00%, 05/15/37 | | | 615 | | | | 841,959 | |
Series A, 5.00%, 05/15/38 | | | 340 | | | | 469,856 | |
Series A, 5.00%, 05/15/49 | | | 1,130 | | | | 1,628,234 | |
Private Colleges & Universities Authority, Refunding RB, 4.00%, 10/01/50 | | | 345 | | | | 392,909 | |
| | | | | | | | |
| | |
| | | | | | | 4,844,965 | |
| | |
| Guam — 0.2% | | | | | | |
Territory of Guam, Refunding RB | | | | | | | | |
Series A, 5.00%, 11/01/35 | | | 385 | | | | 482,601 | |
Series A, 5.00%, 11/01/40 | | | 540 | | | | 661,249 | |
| | | | | | | | |
| | |
| | | | | | | 1,143,850 | |
| | |
| Idaho — 0.1% | | | | | | |
Idaho Housing & Finance Association, RB, Series A, 6.95%, 06/15/55(b) | | | 580 | | | | 628,355 | |
| | | | | | | | |
| | |
| Illinois — 5.9% | | | | | | |
Chicago Board of Education, GO | | | | | | | | |
Series A, 5.00%, 12/01/42 | | | 1,020 | | | | 1,056,295 | |
Series C, 5.25%, 12/01/35 | | | 1,655 | | | | 1,834,011 | |
Series D, 5.00%, 12/01/46 | | | 2,155 | | | | 2,343,372 | |
Series H, 5.00%, 12/01/46 | | | 720 | | | | 829,215 | |
Chicago Board of Education, Refunding GO | | | | | | | | |
Series B, 4.00%, 12/01/35 | | | 745 | | | | 763,712 | |
Series C, 5.00%, 12/01/25 | | | 725 | | | | 842,451 | |
Series D, 5.00%, 12/01/31 | | | 1,000 | | | | 1,179,469 | |
Series G, 5.00%, 12/01/44 | | | 2,150 | | | | 2,482,431 | |
City of Chicago Illinois, Refunding GO, Series A, 6.00%, 01/01/38 | | | 1,260 | | | | 1,541,630 | |
Illinois Finance Authority, Refunding RB | | | | | | | | |
6.60%, 07/01/24 | | | 450 | | | | 450,535 | |
6.00%, 02/01/34 | | | 365 | | | | 380,746 | |
6.13%, 02/01/45 | | | 860 | | | | 889,716 | |
Metropolitan Pier & Exposition Authority, RB | | | | | | | | |
Series A, 5.50%, 06/15/53 | | | 2,370 | | | | 2,741,121 | |
Series A, 5.00%, 06/15/57 | | | 1,020 | | | | 1,177,709 | |
Metropolitan Pier & Exposition Authority, Refunding RB, 4.00%, 12/15/47(h) | | | 1,805 | | | | 2,002,057 | |
Metropolitan Pier & Exposition Authority, Refunding RB, CAB, Series B, 0.00%, 12/15/54(e) | | | 14,000 | | | | 4,930,184 | |
State of Illinois, GO | | | | | | | | |
5.50%, 05/01/30 | | | 530 | | | | 675,319 | |
5.50%, 05/01/39 | | | 1,055 | | | | 1,318,003 | |
Series A, 5.00%, 01/01/33 | | | 740 | | | | 745,099 | |
Series D, 5.00%, 11/01/24 | | | 3,255 | | | | 3,664,612 | |
Village of Lincolnshire Illinois, ST, 6.25%, 03/01/34 | | | 1,448 | | | | 1,449,670 | |
| | | | | | | | |
| | |
| | | | | | | 33,297,357 | |
| | |
| Indiana — 1.8% | | | | | | |
City of Anderson Indiana, RB, 5.38%, 01/01/40 | | | 580 | | | | 598,290 | |
City of Valparaiso Indiana, RB | | | | | | | | |
AMT, 6.75%, 01/01/34 | | | 825 | | | | 907,031 | |
AMT, 7.00%, 01/01/44 | | | 2,000 | | | | 2,202,974 | |
City of Vincennes Indiana, Refunding RB, 6.25%, 01/01/29(b) | | | 1,885 | | | | 1,887,507 | |
| | | | | | | | |
| Security | | Par (000) | | | Value | |
| | |
| Indiana (continued) | | | | | | |
Indiana Finance Authority, RB | | | | | | | | |
Series A, AMT, 5.00%, 07/01/23(d) | | $ | 2,025 | | | $ | 2,176,511 | |
Series A, AMT, 6.75%, 05/01/39 | | | 1,060 | | | | 1,377,380 | |
Indiana Housing & Community Development Authority, RB, 5.38%, 10/01/40(b) | | | 1,230 | | | | 1,275,619 | |
| | | | | | | | |
| | |
| | | | | | | 10,425,312 | |
| | |
| Iowa — 0.4% | | | | | | |
Iowa Finance Authority, Refunding RB | | | | | | | | |
5.25%, 12/01/25 | | | 150 | | | | 163,213 | |
Series B, 5.25%, 12/01/50(a) | | | 2,085 | | | | 2,269,008 | |
| | | | | | | | |
| | |
| | | | | | | 2,432,221 | |
| | |
| Kansas(b) — 0.2% | | | | | | |
City of Shawnee Kansas, RB | | | | | | | | |
5.00%, 08/01/41 | | | 230 | | | | 246,023 | |
5.00%, 08/01/56 | | | 850 | | | | 891,936 | |
| | | | | | | | |
| | |
| | | | | | | 1,137,959 | |
| | |
| Kentucky — 0.8% | | | | | | |
Kentucky Public Transportation Infrastructure Authority, RB, Series A, 5.75%, 07/01/23(d) | | | 4,000 | | | | 4,363,432 | |
| | | | | | | | |
| | |
| Louisiana — 2.0% | | | | | | |
Juban Crossing Economic Development District, Refunding RB, Series C, 7.00%, 09/15/44(b) | | | 2,360 | | | | 2,274,167 | |
Louisiana Local Government Environmental Facilities & Community Development Authority, RB, 5.00%, 07/01/54(b) | | | 930 | | | | 999,067 | |
Parish of St. James Louisiana, RB, 2nd Series, 6.35%, 07/01/40(b) | | | 1,580 | | | | 2,068,359 | |
Tobacco Settlement Financing Corp., Refunding RB, Series A, 5.25%, 05/15/35 | | | 5,570 | | | | 5,929,739 | |
| | | | | | | | |
| | |
| | | | | | | 11,271,332 | |
| | |
| Maryland — 1.1% | | | | | | |
County of Frederick Maryland, Refunding TA, 4.63%, 07/01/43(b) | | | 1,930 | | | | 2,258,945 | |
Maryland Economic Development Corp., RB, 5.00%, 07/01/56 | | | 360 | | | | 431,747 | |
Maryland Health & Higher Educational Facilities Authority, RB, Series A, 7.00%, 03/01/55(b) | | | 3,010 | | | | 3,427,598 | |
| | | | | | | | |
| | |
| | | | | | | 6,118,290 | |
| | |
| Massachusetts — 0.1% | | | | | | |
Massachusetts Development Finance Agency, Refunding RB | | | | | | | | |
4.00%, 07/01/45 | | | 170 | | | | 194,548 | |
4.00%, 07/01/50 | | | 325 | | | | 368,055 | |
| | | | | | | | |
| | |
| | | | | | | 562,603 | |
| | |
| Michigan — 1.2% | | | | | | |
Advanced Technology Academy, Refunding RB, 5.00%, 11/01/44 | | | 415 | | | | 454,793 | |
City of Detroit Michigan Sewage Disposal System Revenue, Refunding RB, Series A, Senior Lien, 5.25%, 07/01/22(d) | | | 2,785 | | | | 2,878,133 | |
City of Detroit Michigan, GO | | | | | | | | |
5.00%, 04/01/34 | | | 285 | | | | 331,477 | |
5.00%, 04/01/35 | | | 285 | | | | 330,687 | |
5.00%, 04/01/36 | | | 200 | | | | 231,585 | |
5.00%, 04/01/37 | | | 320 | | | | 369,840 | |
| | |
| 20 | | 2 0 2 1 BLACK ROCK SEMI - ANNUAL REPORT TO SHAREHOLDERS |
| | |
Schedule of Investments (unaudited) (continued) October 31, 2021 | | BlackRock MuniAssets Fund, Inc. (MUA) (Percentages shown are based on Net Assets) |
| | | | | | | | |
| Security | | Par (000) | | | Value | |
| | |
| Michigan (continued) | | | | | | |
City of Detroit Michigan, GO (continued)
5.00%, 04/01/38 | | $ | 145 | | | $ | 167,251 | |
Michigan Finance Authority, RB, Series C-2, AMT, Senior Lien, 5.00%, 07/01/22(d) | | | 415 | | | | 427,964 | |
Michigan Strategic Fund, RB, AMT, 5.00%, 06/30/48 | | | 1,200 | | | | 1,408,271 | |
| | | | | | | | |
| | |
| | | | | | | 6,600,001 | |
| | |
| Minnesota — 0.3% | | | | | | |
City of Minneapolis Minnesota, RB, Series A, 5.75%, 07/01/55 | | | 1,480 | | | | 1,710,047 | |
| | | | | | | | |
| | |
| Missouri — 0.3% | | | | | | |
Industrial Development Authority of the City of St. Louis Missouri, Refunding RB | | | | | | | | |
Series A, 4.38%, 11/15/35 | | | 685 | | | | 691,869 | |
Series A, 4.75%, 11/15/47 | | | 760 | | | | 751,829 | |
| | | | | | | | |
| | |
| | | | | | | 1,443,698 | |
| | |
| Nevada — 0.2% | | | | | | |
Tahoe-Douglas Visitors Authority, RB | | | | | | | | |
5.00%, 07/01/40 | | | 315 | | | | 364,978 | |
5.00%, 07/01/45 | | | 395 | | | | 450,899 | |
5.00%, 07/01/51 | | | 420 | | | | 474,647 | |
| | | | | | | | |
| | |
| | | | | | | 1,290,524 | |
| | |
| New Hampshire — 0.7% | | | | | | |
New Hampshire Business Finance Authority, RB | | | | | | | | |
Series A, 4.13%, 08/15/40 | | | 530 | | | | 542,823 | |
Series A, 4.25%, 08/15/46 | | | 595 | | | | 605,930 | |
Series A, 4.50%, 08/15/55 | | | 1,235 | | | | 1,265,004 | |
New Hampshire Business Finance Authority, Refunding RB(b) | | | | | | | | |
Series B, 4.63%, 11/01/42 | | | 1,015 | | | | 1,057,165 | |
Series C, AMT, 4.88%, 11/01/42 | | | 485 | | | | 507,112 | |
| | | | | | | | |
| | |
| | | | | | | 3,978,034 | |
| | |
| New Jersey — 4.4% | | | | | | |
Casino Reinvestment Development Authority, Inc., Refunding RB | | | | | | | | |
5.25%, 11/01/39 | | | 1,065 | | | | 1,178,213 | |
5.25%, 11/01/44 | | | 770 | | | | 838,654 | |
New Jersey Economic Development Authority, RB 6.00%, 10/01/43 | | | 1,530 | | | | 1,662,243 | |
Series A, 5.00%, 07/01/32 | | | 165 | | | | 179,655 | |
Series A, 5.00%, 07/01/37 | | | 260 | | | | 280,376 | |
Series A, 5.25%, 11/01/54(b) | | | 1,675 | | | | 1,769,815 | |
Series B, 5.00%, 06/15/43 | | | 2,245 | | | | 2,697,576 | |
AMT, 5.38%, 01/01/43 | | | 2,155 | | | | 2,363,839 | |
Series B, AMT, 6.50%, 04/01/31 | | | 1,940 | | | | 2,194,545 | |
New Jersey Economic Development Authority, Refunding RB, Series A, 6.00%, 08/01/49(b) | | | 500 | | | | 523,036 | |
New Jersey Transportation Trust Fund Authority, RB | | | | | | | | |
Series AA, 5.25%, 06/15/41 | | | 1,140 | | | | 1,299,984 | |
Series S, 5.25%, 06/15/43 | | | 2,345 | | | | 2,888,067 | |
Tobacco Settlement Financing Corp., Refunding RB, Sub-Series B, 5.00%, 06/01/46 | | | 5,970 | | | | 6,871,589 | |
| | | | | | | | |
| | |
| | | | | | | 24,747,592 | |
| | |
| New Mexico — 0.5% | | | | | | |
New Mexico Hospital Equipment Loan Council, Refunding RB, 5.50%, 07/01/42 | | | 2,970 | | | | 3,059,073 | |
| | | | | | | | |
| | | | | | | | |
| Security | | Par (000) | | | Value | |
| | |
| New York — 7.3% | | | | | | |
Erie Tobacco Asset Securitization Corp., Refunding RB, Series A, 5.00%, 06/01/45 | | $ | 2,890 | | | $ | 2,910,496 | |
Huntington Local Development Corp., RB,
Series A, 5.25%, 07/01/56 | | | 185 | | | | 201,381 | |
Metropolitan Transportation Authority, Refunding RB | | | | | | | | |
Series C-1, 4.75%, 11/15/45 | | | 1,740 | | | | 2,036,247 | |
Series C-1, 5.00%, 11/15/50 | | | 565 | | | | 669,685 | |
Series C-1, 5.25%, 11/15/55 | | | 840 | | | | 1,012,161 | |
New York City Industrial Development Agency, Refunding RB | | | | | | | | |
Series A, Class A, (AGM), 3.00%, 01/01/37 | | | 250 | | | | 268,930 | |
Series A, Class A, (AGM), 3.00%, 01/01/39 | | | 250 | | | | 267,897 | |
Series A, Class A, (AGM), 3.00%, 01/01/40 | | | 175 | | | | 186,940 | |
New York Counties Tobacco Trust IV, Refunding RB | | | | | | | | |
Series A, 6.25%, 06/01/41(b) | | | 5,100 | | | | 5,172,068 | |
Series A, 5.00%, 06/01/42 | | | 3,155 | | | | 3,183,780 | |
Series A, 5.00%, 06/01/45 | | | 1,185 | | | | 1,195,755 | |
New York Counties Tobacco Trust VI, Refunding RB | | | | | | | | |
Series A-2-B, 5.00%, 06/01/45 | | | 2,655 | | | | 3,002,539 | |
Series A-2-B, 5.00%, 06/01/51 | | | 1,900 | | | | 2,123,197 | |
New York Liberty Development Corp., Refunding RB | | | | | | | | |
2.88%, 11/15/46 | | | 3,975 | | | | 3,982,739 | |
Series 1, Class 1, 5.00%, 11/15/44(b) | | | 6,205 | | | | 6,777,728 | |
Series 2, Class 2, 5.15%, 11/15/34(b) | | | 455 | | | | 508,387 | |
Series 2, Class 2, 5.38%, 11/15/40(b) | | | 1,080 | | | | 1,208,656 | |
New York Transportation Development Corp., RB | | | | | | | | |
AMT, 5.00%, 10/01/35 | | | 395 | | | | 487,898 | |
AMT, 5.00%, 10/01/40 | | | 1,120 | | | | 1,363,967 | |
New York Transportation Development Corp., Refunding ARB, AMT, 5.38%, 08/01/36 | | | 1,490 | | | | 1,833,229 | |
Westchester County Healthcare Corp., RB, Series A, Senior Lien, 5.00%, 11/01/44 | | | 1,207 | | | | 1,315,334 | |
Westchester County Local Development Corp., Refunding RB, 5.00%, 07/01/46(b)(h) | | | 1,625 | | | | 1,707,963 | |
| | | | | | | | |
| | |
| | | | | | | 41,416,977 | |
| | |
| Ohio — 2.5% | | | | | | |
Buckeye Tobacco Settlement Financing Authority, Refunding RB, Series B-2, Class 2, 5.00%, 06/01/55 | | | 4,980 | | | | 5,596,126 | |
Cleveland-Cuyahoga County Port Authority Refunding TA(b) | | | | | | | | |
4.00%, 12/01/55 | | | 255 | | | | 266,732 | |
4.50%, 12/01/55 | | | 215 | | | | 232,372 | |
Cleveland-Cuyahoga County Port Authority, RB | | | | | | | | |
4.00%, 07/01/46 | | | 65 | | | | 75,698 | |
4.00%, 07/01/51 | | | 95 | | | | 109,620 | |
County of Hamilton Ohio, Refunding RB, Series C, 5.00%, 01/01/46 | | | 875 | | | | 952,554 | |
County of Hardin Ohio, Refunding RB | | | | | | | | |
5.00%, 05/01/30 | | | 240 | | | | 260,242 | |
5.25%, 05/01/40 | | | 480 | | | | 514,927 | |
5.50%, 05/01/50 | | | 1,130 | | | | 1,207,734 | |
Jefferson County Port Authority RB, AMT, 3.50%, 12/01/51(b) | | | 1,125 | | | | 1,131,922 | |
Ohio Air Quality Development Authority, RB, AMT, 5.00%, 07/01/49(b) | | | 840 | | | | 963,551 | |
| | |
SCHEDULE OF INVESTMENTS | | 21 |
| | |
Schedule of Investments (unaudited) (continued) October 31, 2021 | | BlackRock MuniAssets Fund, Inc. (MUA) (Percentages shown are based on Net Assets) |
| | | | | | | | |
| Security | | Par (000) | | | Value | |
| | |
| Ohio (continued) | | | | | | |
Port of Greater Cincinnati Development Authority, RB, 4.25%, 12/01/50(b) | | $ | 385 | | | $ | 385,861 | |
Southern Ohio Port Authority, RB, Series A, AMT, 7.00%, 12/01/42(b) | | | 2,315 | | | | 2,615,505 | |
| | | | | | | | |
| | |
| | | | | | | 14,312,844 | |
| | |
| Oklahoma — 2.4% | | | | | | |
Oklahoma Development Finance Authority, RB | | | | | | | | |
7.25%, 09/01/51(b) | | | 4,615 | | | | 5,445,183 | |
Series B, 5.00%, 08/15/38 | | | 2,990 | | | | 3,590,784 | |
Series B, 5.25%, 08/15/43 | | | 2,690 | | | | 3,268,111 | |
Tulsa Authority for Economic Opportunity TA, 4.38%, 12/01/41(b) | | | 330 | | | | 320,115 | |
Tulsa County Industrial Authority, Refunding RB, 5.25%, 11/15/37 | | | 750 | | | | 850,699 | |
| | | | | | | | |
| | |
| | | | | | | 13,474,892 | |
| | |
| Oregon — 0.5% | | | | | | |
Hospital Facilities Authority of Multnomah County Oregon, Refunding RB, Series A, 5.50%, 10/01/49 | | | 1,765 | | | | 1,860,624 | |
Oregon State Facilities Authority, RB(b) | | | | | | | | |
Series A, 5.00%, 06/15/29 | | | 115 | | | | 124,662 | |
Series A, 5.00%, 06/15/39 | | | 565 | | | | 607,263 | |
| | | | | | | | |
| | |
| | | | | | | 2,592,549 | |
| | |
| Pennsylvania — 1.4% | | | | | | |
Allentown Neighborhood Improvement Zone Development Authority, Refunding RB, Series A, 5.00%, 05/01/42 | | | 2,140 | | | | 2,184,895 | |
Bucks County Industrial Development Authority, RB | | | | | | | | |
4.00%, 07/01/46 | | | 100 | | | | 110,807 | |
4.00%, 07/01/51 | | | 100 | | | | 110,422 | |
Montgomery County Industrial Development Authority, Refunding RB, 5.38%, 01/01/50 | | | 725 | | | | 771,866 | |
Northampton County Industrial Development Authority, TA, 7.00%, 07/01/32 | | | 1,655 | | | | 1,752,716 | |
Pennsylvania Economic Development Financing Authority, Refunding RB, AMT, 5.50%, 11/01/44 | | | 2,710 | | | | 2,863,183 | |
| | | | | | | | |
| | |
| | | | | | | 7,793,889 | |
| | |
| Puerto Rico — 13.8% | | | | | | |
Children’s Trust Fund, RB, Series A, 0.00%, 05/15/57(e) | | | 44,330 | | | | 3,074,241 | |
Children’s Trust Fund, Refunding RB, 5.63%, 05/15/43 | | | 850 | | | | 859,788 | |
Commonwealth of Puerto Rico Refunding
GO(f)(g) | | | | | | | | |
Series A, 5.00%, 07/01/18 | | | 90 | | | | 86,309 | |
Series A, 6.50%, 07/01/40 | | | 1,110 | | | | 1,109,306 | |
Commonwealth of Puerto Rico, GO(f)(g) | | | | | | | | |
Series A, 5.25%, 07/01/22 | | | 145 | | | | 142,870 | |
Series A, 5.25%, 07/01/26 | | | 50 | | | | 49,266 | |
Series A, 5.13%, 07/01/31 | | | 515 | | | | 507,435 | |
Series A, 5.38%, 07/01/33 | | | 500 | | | | 492,655 | |
Series A, 6.00%, 07/01/38 | | | 750 | | | | 749,531 | |
Commonwealth of Puerto Rico, Refunding
GO(f)(g) | | | | | | | | |
Series A, 8.00%, 07/01/35 | | | 9,295 | | | | 8,147,597 | |
Series A, 5.50%, 07/01/39 | | | 1,265 | | | | 1,180,403 | |
Series A, 5.00%, 07/01/41 | | | 2,230 | | | | 1,993,062 | |
Series A, 5.75%, 07/01/41 | | | 165 | | | | 160,372 | |
Series B, 6.00%, 07/01/39 | | | 110 | | | | 109,931 | |
Puerto Rico Commonwealth Aqueduct & Sewer Authority, RB | | | | | | | | |
Series A, Senior Lien, 5.00%, 07/01/33 | | | 170 | | | | 175,405 | |
Series A, Senior Lien, 5.13%, 07/01/37 | | | 200 | | | | 206,521 | |
| | | | | | | | |
| Security | | Par (000) | | | Value | |
| | |
| Puerto Rico (continued) | | | | | | |
Puerto Rico Commonwealth Aqueduct & Sewer Authority, RB (continued) | | | | | | | | |
Series A, Senior Lien, 5.75%, 07/01/37 | | $ | 1,290 | | | $ | 1,335,516 | |
Puerto Rico Commonwealth Aqueduct & Sewer Authority, Refunding RB(b) | | | | | | | | |
Series A, Senior Lien, 5.00%, 07/01/35 | | | 1,780 | | | | 2,135,137 | |
Series A, Senior Lien, 5.00%, 07/01/47 | | | 3,135 | | | | 3,654,473 | |
Puerto Rico Electric Power Authority, 3rd Series, 5.38%, 07/01/22(a)(f)(g) | | | 90 | | | | 83,272 | |
Puerto Rico Electric Power Authority, RB | | | | | | | | |
Series A, 5.00%, 07/01/29(f)(g) | | | 660 | | | | 646,626 | |
Series A, 7.00%, 07/01/33(f)(g) | | | 3,295 | | | | 3,304,612 | |
Series A, 6.75%, 07/01/36(f)(g) | | | 1,335 | | | | 1,338,894 | |
Series A, 5.00%, 07/01/42(f)(g) | | | 1,315 | | | | 1,288,354 | |
Series A, 7.00%, 07/01/43(f)(g) | | | 375 | | | | 376,094 | |
Series A-3, 10.00%, 07/01/19(f)(g) | | | 323 | | | | 339,161 | |
Series B-3, 10.00%, 07/01/19(f)(g) | | | 323 | | | | 339,161 | |
Series C-1, 5.40%, 01/01/18(f)(g) | | | 887 | | | | 823,661 | |
Series C-2, 5.40%, 07/01/18(f)(g) | | | 887 | | | | 823,795 | |
Series C-4, 5.40%, 07/01/20(f)(g) | | | 90 | | | | 83,272 | |
Series CCC, 5.25%, 07/01/26(f)(g) | | | 260 | | | | 254,732 | |
Series CCC, 5.25%, 07/01/28(f)(g) | | | 145 | | | | 142,062 | |
Series TT, 5.00%, 07/01/25(f)(g) | | | 100 | | | | 97,974 | |
Series TT, 5.00%, 07/01/26(f)(g) | | | 225 | | | | 220,441 | |
Series WW, 5.50%, 07/01/17(f)(g) | | | 200 | | | | 195,947 | |
Series WW, 5.50%, 07/01/19(f)(g) | | | 145 | | | | 142,062 | |
Series WW, 5.50%, 07/01/20 | | | 1,595 | | | | 1,480,348 | |
Series WW, 5.38%, 07/01/22(f)(g) | | | 1,310 | | | | 1,283,455 | |
Series WW, 5.50%, 07/01/28(f)(g) | | | 1,175 | | | | 1,151,191 | |
Series WW, 5.25%, 07/01/33(f)(g) | | | 120 | | | | 117,568 | |
Series WW, 5.50%, 07/01/38(f)(g) | | | 205 | | | | 200,846 | |
Series XX, 5.25%, 07/01/27(f)(g) | | | 110 | | | | 107,771 | |
Series XX, 5.25%, 07/01/35 | | | 585 | | | | 542,949 | |
Series XX, 5.25%, 07/01/35(f)(g) | | | 60 | | | | 58,784 | |
Series XX, 5.75%, 07/01/36(f)(g) | | | 860 | | | | 842,574 | |
Series XX, 5.25%, 07/01/40(f)(g) | | | 1,020 | | | | 999,332 | |
Puerto Rico Electric Power Authority, Refunding
RB(f)(g) | | | | | | | | |
Series AAA, 5.25%, 07/01/22 | | | 2,545 | | | | 2,493,431 | |
Series AAA, 5.25%, 07/01/29 | | | 95 | | | | 93,075 | |
Series UU, 1.00%, 07/01/17(a) | | | 60 | | | | 53,373 | |
Series UU, 1.00%, 07/01/18(a) | | | 55 | | | | 48,925 | |
Series UU, 1.00%, 07/01/20(a) | | | 495 | | | | 440,327 | |
Series UU, 2.25%, 07/01/31(a) | | | 580 | | | | 515,939 | |
Series ZZ, 5.00%, 07/01/17 | | | 145 | | | | 142,062 | |
Series ZZ, 5.25%, 07/01/19 | | | 455 | | | | 445,780 | |
Series ZZ, 5.25%, 07/01/24 | | | 345 | | | | 338,009 | |
Puerto Rico Electric Power Authority, Refunding RB, BAB, 6.13%, 07/01/40 | | | 1,085 | | | | 1,007,008 | |
Puerto Rico Infrastructure Financing Authority RB | | | | | | | | |
Series B, 5.00%, 07/01/37 | | | 980 | | | | 447,137 | |
Series B, 5.00%, 07/01/41(f)(g) | | | 1,210 | | | | 552,077 | |
Series B, 5.00%, 07/01/46(f)(g) | | | 855 | | | | 390,104 | |
Puerto Rico Public Buildings Authority, Refunding
RB(f)(g) | | | | | | | | |
Series F, (GTD), 5.25%, 07/01/24 | | | 235 | | | | 250,895 | |
Series M-2, (GTD), 10.00%, 07/01/34 | | | 155 | | | | 175,925 | |
Puerto Rico Sales Tax Financing Corp. Sales Tax Revenue, RB | | | | | | | | |
Series A-1, Restructured, 4.75%, 07/01/53 | | | 2,453 | �� | | | 2,728,462 | |
Series A-1, Restructured, 5.00%, 07/01/58 | | | 5,234 | | | | 5,908,977 | |
Series A-2, Restructured, 4.33%, 07/01/40 | | | 6,129 | | | | 6,721,061 | |
| | |
| 22 | | 2 0 2 1 BLACK ROCK SEMI - ANNUAL REPORT TO SHAREHOLDERS |
| | |
Schedule of Investments (unaudited) (continued) October 31, 2021 | | BlackRock MuniAssets Fund, Inc. (MUA) (Percentages shown are based on Net Assets) |
| | | | | | | | |
| Security | | Par (000) | | | Value | |
| | |
| Puerto Rico (continued) | | | | | | |
Puerto Rico Sales Tax Financing Corp. Sales Tax Revenue, RB (continued) | | | | | | | | |
Series A-2, Restructured, 4.54%, 07/01/53 | | $ | 21 | | | $ | 23,100 | |
Series A-2, Restructured, 4.78%, 07/01/58 | | | 2,080 | | | | 2,317,557 | |
Series B-1, Restructured, 4.55%, 07/01/40 | | | 2,402 | | | | 2,670,628 | |
Puerto Rico Sales Tax Financing Corp. Sales Tax Revenue, RB, CAB(e) | | | | | | | | |
Series A-1, Restructured, 0.00%, 07/01/24 | | | 1,406 | | | | 1,342,740 | |
Series A-1, Restructured, 0.00%, 07/01/29 | | | 1,079 | | | | 941,501 | |
Series A-1, Restructured, 0.00%, 07/01/31 | | | 686 | | | | 549,228 | |
Series A-1, Restructured, 0.00%, 07/01/33 | | | 337 | | | | 249,356 | |
Series A-1, Restructured, 0.00%, 07/01/46 | | | 10,261 | | | | 3,342,028 | |
Series A-1, Restructured, 0.00%, 07/01/51 | | | 2,333 | | | | 549,622 | |
Series B-1, Restructured, 0.00%, 07/01/46 | | | 883 | | | | 287,791 | |
| | | | | | | | |
| | |
| | | | | | | 78,480,874 | |
| | |
| Rhode Island — 1.9% | | | | | | |
Central Falls Detention Facility Corp., Refunding RB, 7.25%, 07/15/35(f)(g) | | | 4,190 | | | | 628,500 | |
Tobacco Settlement Financing Corp., Refunding RB | | | | | | | | |
Series A, 5.00%, 06/01/40 | | | 980 | | | | 1,089,248 | |
Series B, 4.50%, 06/01/45 | | | 5,055 | | | | 5,405,529 | |
Series B, 5.00%, 06/01/50 | | | 3,330 | | | | 3,646,919 | |
| | | | | | | | |
| | |
| | | | | | | 10,770,196 | |
| | |
| South Carolina — 0.1% | | | | | | |
South Carolina Jobs-Economic Development Authority, RB, Series A, 5.00%, 11/15/54 | | | 345 | | | | 375,884 | |
| | | | | | | | |
| | |
| Tennessee — 0.3% | | | | | | |
Memphis-Shelby County Industrial Development Board, Refunding TA | | | | | | | | |
Series A, 5.50%, 07/01/37 | | | 925 | | | | 898,537 | |
Series A, 5.63%, 01/01/46 | | | 1,085 | | | | 1,065,941 | |
| | | | | | | | |
| | |
| | | | | | | 1,964,478 | |
| | |
| Texas — 6.6% | | | | | | |
Angelina & Neches River Authority, RB, Series A, AMT, 7.50%, 12/01/45(b) | | | 715 | | | | 701,364 | |
Arlington Higher Education Finance Corp., RB, 5.00%, 06/15/51 | | | 715 | | | | 746,160 | |
Arlington Higher Education Finance Corp., Refunding RB, Series S, 5.00%, 08/15/41 | | | 370 | | | | 401,887 | |
Brazoria County Industrial Development Corp., RB, AMT, 7.00%, 03/01/39 | | | 675 | | | | 732,797 | |
Central Texas Regional Mobility Authority, Refunding RB, CAB(e) | | | | | | | | |
0.00%, 01/01/28 | | | 1,000 | | | | 913,660 | |
0.00%, 01/01/29 | | | 2,000 | | | | 1,774,066 | |
0.00%, 01/01/30 | | | 1,170 | | | | 1,003,420 | |
0.00%, 01/01/33 | | | 3,690 | | | | 2,852,735 | |
0.00%, 01/01/34 | | | 4,000 | | | | 2,984,276 | |
City of Houston Texas Airport System Revenue, RB, Series A, AMT, 6.63%, 07/15/38 | | | 2,890 | | | | 2,902,427 | |
City of Houston Texas Airport System Revenue, Refunding ARB, AMT, 5.00%, 07/15/27 | | | 250 | | | | 290,350 | |
City of Houston Texas Airport System Revenue, Refunding RB | | | | | | | | |
AMT, 5.00%, 07/01/29 | | | 730 | | | | 790,678 | |
Series C, AMT, 5.00%, 07/15/27 | | | 1,615 | | | | 1,870,267 | |
City of Houston TX Airport System Revenue RB, 4.00%, 07/15/41 | | | 650 | | | | 685,692 | |
| | | | | | | | |
| Security | | Par (000) | | | Value | |
| | |
| Texas (continued) | | | | | | |
Harris County Cultural Education Facilities Finance Corp., RB, Series B, 7.00%, 01/01/23(d) | | $ | 475 | | | $ | 512,288 | |
Mission Economic Development Corp., Refunding RB, AMT, Senior Lien, 4.63%, 10/01/31(b) | | | 785 | | | | 824,996 | |
New Hope Cultural Education Facilities Finance Corp., RB | | | | | | | | |
Series A, 5.88%, 04/01/23(d) | | | 1,210 | | | | 1,305,162 | |
Series A, 6.00%, 04/01/23(d) | | | 1,845 | | | | 1,993,353 | |
Series A, 10.00%, 12/01/25(b) | | | 1,140 | | | | 1,138,622 | |
New Hope Cultural Education Facilities Finance Corp., Refunding RB, Series A, 5.00%, 08/15/36(b) | | | 1,085 | | | | 1,085,052 | |
New Hope Higher Education Finance Corp., RB, Series A, 5.75%, 06/15/51(b) | | | 1,650 | | | | 1,616,746 | |
Newark Higher Education Finance Corp., RB(b) | | | | | | | | |
Series A, 5.50%, 08/15/35 | | | 290 | | | | 333,523 | |
Series A, 5.75%, 08/15/45 | | | 580 | | | | 666,417 | |
Port Beaumont Navigation District RB(b) | | | | | | | | |
2.75%, 01/01/36 | | | 700 | | | | 697,201 | |
2.88%, 01/01/41 | | | 810 | | | | 795,942 | |
Port Beaumont Navigation District, Refunding RB, Series A, AMT, 4.00%, 01/01/50(b) | | | 1,400 | | | | 1,435,777 | |
Red River Health Facilities Development Corp., RB, 5.13%, 01/01/41 | | | 900 | | | | 904,792 | |
Tarrant County Cultural Education Facilities Finance Corp., Refunding RB, 5.00%, 10/01/49 | | | 865 | | | | 936,854 | |
Texas Transportation Commission, RB, CAB(e) | | | | | | | | |
0.00%, 08/01/46 | | | 1,420 | | | | 484,629 | |
0.00%, 08/01/47 | | | 2,120 | | | | 686,628 | |
0.00%, 08/01/48 | | | 2,235 | | | | 687,041 | |
0.00%, 08/01/49 | | | 2,100 | | | | 612,990 | |
0.00%, 08/01/50 | | | 3,015 | | | | 830,431 | |
0.00%, 08/01/51 | | | 1,770 | | | | 460,508 | |
0.00%, 08/01/52 | | | 1,770 | | | | 434,882 | |
0.00%, 08/01/53 | | | 160 | | | | 37,187 | |
| | | | | | | | |
| | |
| | | | | | | 37,130,800 | |
| | |
| Utah(b) — 0.1% | | | | | | |
Utah Charter School Finance Authority, RB | | | | | | | | |
Series A, 5.00%, 06/15/41 | | | 205 | | | | 233,784 | |
Series A, 5.00%, 06/15/52 | | | 265 | | | | 294,857 | |
| | | | | | | | |
| | |
| | | | | | | 528,641 | |
| | |
| Virginia — 1.7% | | | | | | |
Lower Magnolia Green Community Development Authority, SAB(b) | | | | | | | | |
5.00%, 03/01/35 | | | 495 | | | | 521,180 | |
5.00%, 03/01/45 | | | 505 | | | | 526,145 | |
Norfolk Redevelopment & Housing Authority, RB | | | | | | | | |
Series A, 4.00%, 01/01/29 | | | 300 | | | | 320,646 | |
Series A, 5.00%, 01/01/34 | | | 485 | | | | 525,451 | |
Series A, 5.00%, 01/01/49 | | | 955 | | | | 1,020,226 | |
Tobacco Settlement Financing Corp., Refunding RB, Series B-1, 5.00%, 06/01/47 | | | 2,370 | | | | 2,407,994 | |
Virginia Small Business Financing Authority, RB, AMT, Senior Lien, 6.00%, 01/01/37 | | | 4,440 | | | | 4,591,275 | |
| | | | | | | | |
| | |
| | | | | | | 9,912,917 | |
| | |
| Washington — 1.2% | | | | | | |
Greater Wenatchee Regional Events Center Public Facilities District, Refunding RB, Series A, 5.50%, 09/01/22(d) | | | 1,495 | | | | 1,560,276 | |
Washington State Convention Center Public Facilities District RB, 3.00%, 07/01/58 | | | 2,115 | | | | 2,002,708 | |
| | |
SCHEDULE OF INVESTMENTS | | 23 |
| | |
Schedule of Investments (unaudited) (continued) October 31, 2021 | | BlackRock MuniAssets Fund, Inc. (MUA) (Percentages shown are based on Net Assets) |
| | | | | | | | |
| Security | | Par (000) | | | Value | |
| | |
| Washington (continued) | | | | | | |
Washington State Convention Center Public Facilities District, RB, 4.00%, 07/01/31 | | $ | 1,315 | | | $ | 1,511,206 | |
Washington State Housing Finance Commission, RB(b) | | | | | | | | |
Series A, 5.00%, 07/01/50 | | | 225 | | | | 256,047 | |
Series A, 5.00%, 07/01/56 | | | 255 | | | | 287,868 | |
Washington State Housing Finance Commission, Refunding RB(b) | | | | | | | | |
5.75%, 01/01/35 | | | 315 | | | | 343,533 | |
6.00%, 01/01/45 | | | 850 | | | | 925,421 | |
| | | | | | | | |
| | |
| | | | | | | 6,887,059 | |
| | |
| Wisconsin — 5.7% | | | | | | |
Public Finance Authority RB, 5.25%, 12/01/51(b) | | | 1,470 | | | | 1,315,931 | |
Public Finance Authority, RB | | | | | | | | |
5.00%, 06/15/39 | | | 175 | | | | 208,704 | |
5.00%, 06/15/41(b) | | | 345 | | | | 359,574 | |
5.00%, 01/01/42(b) | | | 605 | | | | 648,542 | |
6.85%, 11/01/46(b) | | | 900 | | | | 944,968 | |
7.00%, 11/01/46(b) | | | 570 | | | | 602,154 | |
5.00%, 06/15/49 | | | 530 | | | | 613,759 | |
5.63%, 06/15/49(b) | | | 2,500 | | | | 2,522,845 | |
5.00%, 04/01/50(b) | | | 115 | | | | 134,612 | |
4.00%, 09/30/51 | | | 980 | | | | 1,062,651 | |
5.00%, 06/15/53 | | | 355 | | | | 408,943 | |
4.25%, 07/01/54 | | | 1,595 | | | | 1,638,097 | |
5.00%, 06/15/55(b) | | | 895 | | | | 915,827 | |
5.00%, 01/01/56(b) | | | 1,470 | | | | 1,551,775 | |
4.00%, 03/31/56 | | | 1,025 | | | | 1,105,203 | |
Series A, 6.25%, 10/01/31(b) | | | 605 | | | | 633,603 | |
Series A, 5.38%, 06/01/44(b) | | | 555 | | | | 563,350 | |
Series A, 7.00%, 10/01/47(b) | | | 605 | | | | 626,856 | |
Series A, 5.63%, 06/15/49(b) | | | 2,950 | | | | 3,164,689 | |
Series A, 5.50%, 06/01/54(b) | | | 680 | | | | 685,298 | |
Series A, 5.00%, 06/15/55(b) | | | 4,030 | | | | 4,098,228 | |
Series A-1, 4.50%, 01/01/35(b) | | | 1,225 | | | | 1,340,351 | |
Series A-1, 5.50%, 12/01/48(b)(f)(g) | | | 20 | | | | 6,578 | |
Series A-1, 5.00%, 01/01/55(b) | | | 2,640 | | | | 2,889,073 | |
Series B, 0.00%, 01/01/35(b)(e) | | | 1,750 | | | | 833,707 | |
Series B, 0.00%, 01/01/60(b)(e) | | | 35,940 | | | | 2,916,783 | |
Wisconsin Health & Educational Facilities Authority, Refunding RB, 5.00%, 11/01/46 | | | 470 | | | | 520,750 | |
| | | | | | | | |
| | |
| | | | | | | 32,312,851 | |
| | | | | | | | |
| | |
Total Municipal Bonds — 91.4%
(Cost: $469,908,073) | | | | | | | 518,103,739 | |
| | | | | | | | |
|
Municipal Bonds Transferred to Tender Option Bond Trusts(i) | |
| | |
| Illinois — 1.3% | | | | | | |
Illinois Finance Authority, Refunding RB | | | | | | | | |
Series C, 4.00%, 02/15/27(d) | | | 4 | | | | 4,219 | |
Series C, 4.00%, 02/15/41 | | | 1,495 | | | | 1,681,905 | |
Illinois State Toll Highway Authority, RB, Series A, 5.00%, 01/01/40 | | | 5,056 | | | | 5,785,461 | |
| | | | | | | | |
| | |
| | | | | | | 7,471,585 | |
| | |
| Massachusetts — 0.5% | | | | | | |
Commonwealth of Massachusetts Transportation Fund Revenue, RB, Series A, 4.00%, 06/01/45 | | | 2,268 | | | | 2,467,684 | |
| | | | | | | | |
| | | | | | | | |
| Security | | Par (000) | | | Value | |
| | |
| New Jersey — 1.5% | | | | | | |
New Jersey Health Care Facilities Financing Authority, RB, 4.00%, 07/01/51 | | $ | 7,366 | | | $ | 8,477,773 | |
| | | | | | | | |
| | |
| New York — 12.2% | | | | | | |
Hudson Yards Infrastructure Corp., RB, 5.75%, 02/15/47(j) | | | 1,465 | | | | 1,466,805 | |
New York City Housing Development Corp., RB, M/F Housing | | | | | | | | |
Series C-1A, 4.15%, 11/01/39 | | | 1,893 | | | | 1,951,497 | |
Series C-1A, 4.20%, 11/01/44 | | | 3,470 | | | | 3,577,026 | |
Series C-1A, 4.30%, 11/01/47 | | | 2,840 | | | | 2,927,204 | |
Series D-1B, 4.25%, 11/01/45 | | | 8,996 | | | | 9,437,358 | |
New York City Water & Sewer System, Refunding RB | | | | | | | | |
Series CC, 5.00%, 06/15/23(d) | | | 6,665 | | | | 7,139,466 | |
Series CC, 5.00%, 06/15/47 | | | 7,516 | | | | 8,051,869 | |
New York Liberty Development Corp., ARB, 5.25%, 12/15/43 | | | 18,104 | | | | 18,206,104 | |
New York Liberty Development Corp., Refunding RB, 5.75%, 11/15/51(j) | | | 6,600 | | | | 6,613,659 | |
New York Power Authority, Refunding RB, Series A, 4.00%, 11/15/60 | | | 1,444 | | | | 1,652,557 | |
New York State Dormitory Authority, Refunding RB, Series D, 4.00%, 02/15/47 | | | 6,956 | | | | 7,894,109 | |
| | | | | | | | |
| | |
| | | | | | | 68,917,654 | |
| | |
| Ohio — 0.5% | | | | | | |
Ohio State University, RB, 4.00%, 12/01/48 | | | 2,431 | | | | 2,858,883 | |
| | | | | | | | |
| | |
| Pennsylvania — 0.5% | | | | | | |
Pennsylvania Turnpike Commission, RB, Sub-Series A, 5.50%, 12/01/42 | | | 2,505 | | | | 3,026,596 | |
| | | | | | | | |
| | |
| Rhode Island — 0.3% | | | | | | |
Narragansett Bay Commission, Refunding RB, Series A, 4.00%, 09/01/22(d) | | | 1,710 | | | | 1,763,833 | |
| | | | | | | | |
| | |
| Texas — 0.4% | | | | | | |
Lower Colorado River Authority, Refunding, RB, 4.00%, 05/15/43 | | | 2,271 | | | | 2,311,490 | |
| | | | | | | | |
| | |
| Wisconsin — 0.2% | | | | | | |
Wisconsin Health & Educational Facilities Authority, Refunding RB, 4.00%, 12/01/46 | | | 1,142 | | | | 1,267,393 | |
| | | | | | | | |
| | |
Total Municipal Bonds Transferred to Tender Option Bond Trusts — 17.4%
(Cost: $95,642,848) | | | | | | | 98,562,891 | |
| | | | | | | | |
| | |
Total Long-Term Investments — 108.8%
(Cost: $565,550,921) | | | | | | | 616,666,630 | |
| | | | | | | | |
| | |
| 24 | | 2 0 2 1 BLACK ROCK SEMI - ANNUAL REPORT TO SHAREHOLDERS |
| | |
Schedule of Investments (unaudited) (continued) October 31, 2021 | | BlackRock MuniAssets Fund, Inc. (MUA) (Percentages shown are based on Net Assets) |
| | | | | | | | |
| Security | | Shares | | | Value | |
| | |
Short-Term Securities | | | | | | | | |
| | |
| Money Market Funds — 1.3% | | | | | | |
BlackRock Liquidity Funds, MuniCash, Institutional Class, 0.01%(k)(l) | | | 7,267,370 | | | $ | 7,268,096 | |
| | | | | | | | |
| |
Total Short-Term Securities — 1.3%
(Cost: $7,268,096) | | | | 7,268,096 | |
| | | | | | | | |
| |
Total Investments — 110.1%
(Cost: $572,819,017) | | | | 623,934,726 | |
| | |
Other Assets Less Liabilities — 0.8% | | | | | | | 4,624,167 | |
| |
Liability for TOB Trust Certificates, Including Interest Expense and Fees Payable — (10.9)% | | | | (61,905,399 | ) |
| | | | | | | | |
| |
Net Assets Applicable to Common Shares — 100.0% | | | $ | 566,653,494 | |
| | | | | | | | |
| (a) | Variable rate security. Interest rate resets periodically. The rate shown is the effective interest rate as of period end. Security description also includes the reference rate and spread if published and available. |
| (b) | Security exempt from registration pursuant to Rule 144A under the Securities Act of 1933, as amended. These securities may be resold in transactions exempt from registration to qualified institutional investors. |
| (c) | Step coupon security. Coupon rate will either increase (step-up bond) or decrease (step-down bond) at regular intervals until maturity. Interest rate shown reflects the rate currently in effect. |
| (d) | U.S. Government securities held in escrow, are used to pay interest on this security as well as to retire the bond in full at the date indicated, typically at a premium to par. |
| (f) | Issuer filed for bankruptcy and/or is in default. |
| (g) | Non-income producing security. |
| (i) | Represent bonds transferred to a TOB Trust in exchange of cash and residual certificates received by the Fund. These bonds serve as collateral in a secured borrowing. See Note 4 of the Notes to Financial Statements for details. |
| (j) | All or a portion of the security is subject to a recourse agreement. The aggregate maximum potential amount the Fund could ultimately be required to pay under the agreements, which expire between February 15, 2047 to November 15, 2051, is $4,271,170. See Note 4 of the Notes to Financial Statements for details. |
| (k) | Affiliate of the Fund. |
| (l) | Annualized 7-day yield as of period end. |
Affiliates
Investments in issuers considered to be affiliate(s) of the Fund during the six months ended October 31, 2021 for purposes of Section 2(a)(3) of the Investment Company Act of 1940, as amended, were as follows:
| | | | | | | | | | | | | | | | | | | | | | | | | | | | | | | | | | | | |
| | | | | | | | | | |
| Affiliated Issuer | | Value at 04/30/21 | | | Purchases at Cost | | | Proceeds from Sales | | | Net Realized Gain (Loss) | | | Change in Unrealized Appreciation (Depreciation) | | | Value at 10/31/21 | | | Shares Held at 10/31/21 | | | Income | | | Capital Gain Distributions from Underlying Funds | |
| | | | | | | | | |
BlackRock Liquidity Funds, MuniCash, Institutional Class | | $ | — | | | $ | 7,269,042 | (a) | | $ | — | | | $ | (946 | ) | | $ | — | | | $ | 7,268,096 | | | | 7,267,370 | | | $ | 289 | | | $ | — | |
| | | | | | | | | | | | | | | | | | | | | | | | | | | | | | | | | | | | |
| | (a) | Represents net amount purchased (sold). | |
Derivative Financial Instruments Categorized by Risk Exposure
For the period ended October 31, 2021, the effect of derivative financial instruments in the Statements of Operations was as follows:
| | | | | | | | | | | | | | | | | | | | | | | | | | | | |
| | | | | | | | |
| | | Commodity Contracts | | | Credit Contracts | | | Equity Contracts | | | Foreign Currency Exchange Contracts | | | Interest Rate Contracts | | | Other Contracts | | | Total | |
| | | | | | | |
Net Realized Gain (Loss) from: | | | | | | | | | | | | | | | | | | | | | | | | | | | | |
Futures contracts | | $ | — | | | $ | — | | | $ | — | | | $ | — | | | $ | (624,554 | ) | | $ | — | | | $ | (624,554 | ) |
| | | | | | | | | | | | | | | | | | | | | | | | | | | | |
| | | | | | | |
Net Change in Unrealized Appreciation (Depreciation) on: | | | | | | | | | | | | | | | | | | | | | | | | | | | | |
Futures contracts | | $ | — | | | $ | — | | | $ | — | | | $ | — | | | $ | 88,133 | | | $ | — | | | $ | 88,133 | |
| | | | | | | | | | | | | | | | | | | | | | | | | | | | |
Average Quarterly Balances of Outstanding Derivative Financial Instruments
| | | | |
| |
| |
Futures contracts: | | | | |
Average notional value of contracts — short | | $ | — | (a) |
| |
| | (a) | Derivative not held at any quarter-end. The risk exposure table serves as an indicator of activity during the period. | |
For more information about the Fund’s investment risks regarding derivative financial instruments, refer to the Notes to Financial Statements.
| | |
SCHEDULE OF INVESTMENTS | | 25 |
| | |
Schedule of Investments (unaudited) (continued) October 31, 2021 | | BlackRock MuniAssets Fund, Inc. (MUA) |
Fair Value Hierarchy as of Period End
Various inputs are used in determining the fair value of financial instruments. For a description of the input levels and information about the Fund’s policy regarding valuation of financial instruments, refer to the Notes to Financial Statements.
The following table summarizes the Fund’s financial instruments categorized in the fair value hierarchy. The breakdown of the Fund’s financial instruments into major categories is disclosed in the Schedule of Investments above.
| | | | | | | | | | | | | | | | |
| |
| | | | |
| | | Level 1 | | | Level 2 | | | Level 3 | | | Total | |
| |
| | | | |
Assets | | | | | | | | | | | | | | | | |
Investments | | | | | | | | | | | | | | | | |
Long-Term Investments | | | | | | | | | | | | | | | | |
Municipal Bonds | | $ | — | | | $ | 518,103,739 | | | $ | — | | | $ | 518,103,739 | |
Municipal Bonds Transferred to Tender Option Bond Trusts | | | — | | | | 98,562,891 | | | | — | | | | 98,562,891 | |
Short-Term Securities | | | | | | | | | | | | | | | | |
Money Market Funds | | | 7,268,096 | | | | — | | | | — | | | | 7,268,096 | |
| | | | | | | | | | | | | | | | |
| | | | |
| | $ | 7,268,096 | | | $ | 616,666,630 | | | $ | — | | | $ | 623,934,726 | |
| | | | | | | | | | | | | | | | |
The Fund may hold assets and/or liabilities in which the fair value approximates the carrying amount for financial statement purposes. As of period end, TOB Trust Certificates of $61,889,545 are categorized as Level 2 within the fair value hierarchy.
See notes to financial statements.
| | |
| 26 | | 2 0 2 1 BLACK ROCK SEMI - ANNUAL REPORT TO SHAREHOLDERS |
| | |
Schedule of Investments (unaudited) October 31, 2021 | | BlackRock Municipal Income Fund, Inc. (MUI) (Percentages shown are based on Net Assets) |
| | | | | | | | |
| Security | | Par (000) | | | Value | |
|
Municipal Bonds | |
|
| Alabama — 1.4% | |
Southeast Energy Authority A Cooperative District, RB, Series B, 4.00%, 12/01/51(a) | | $ | 7,050 | | | $ | 8,423,171 | |
| | | | | | | | |
|
| Arizona — 3.4% | |
Arizona Health Facilities Authority, Refunding RB, Series A, 5.00%, 02/01/30 | | | 2,685 | | | | 2,715,115 | |
Arizona Industrial Development Authority, RB(b) 4.00%, 07/01/29 | | | 500 | | | | 551,022 | |
Series A, 3.55%, 07/15/29 | | | 1,300 | | | | 1,401,001 | |
Series B, 4.25%, 07/01/27 | | | 385 | | | | 417,260 | |
City of Phoenix Civic Improvement Corp., ARB, Series B, AMT, Junior Lien, 5.00%, 07/01/35 | | | 4,000 | | | | 4,941,956 | |
Glendale Union High School District No.205, GO | |
Series C, (BAM), 5.00%, 07/01/24 | | | 1,945 | | | | 2,093,250 | |
Series C, (BAM), 5.00%, 07/01/27 | | | 500 | | | | 537,717 | |
Industrial Development Authority of the City of Phoenix, RB, Series A, 5.75%, 07/01/24(b) | | | 475 | | | | 510,036 | |
Industrial Development Authority of the City of Phoenix, Refunding RB, Series A, 5.00%, 07/01/25 | | | 300 | | | | 342,274 | |
Industrial Development Authority of the County of Pima, RB(b) | | | | | | | | |
4.13%, 06/15/29 | | | 350 | | | | 352,688 | |
5.00%, 07/01/29 | | | 300 | | | | 323,074 | |
Maricopa County Industrial Development Authority, Refunding RB
4.00%, 07/01/29(b) | | | 295 | | | | 329,178 | |
Series A, 5.00%, 09/01/32 | | | 1,000 | | | | 1,244,389 | |
Series A, 5.00%, 09/01/33 | | | 800 | | | | 991,257 | |
Series A, 5.00%, 09/01/34 | | | 1,000 | | | | 1,235,662 | |
Phoenix-Mesa Gateway Airport Authority, ARB | |
AMT, 5.00%, 07/01/27 | | | 700 | | | | 721,761 | |
AMT, 5.00%, 07/01/32 | | | 1,925 | | | | 1,984,038 | |
| | | | | | | | |
| |
| | | | 20,691,678 | |
|
| Arkansas — 0.6% | |
City of Benton Arkansas, RB, (AGM), 5.00%, 06/01/29 | | | 1,055 | | | | 1,174,953 | |
University of Arkansas, Refunding RB, 5.00%, 03/01/31 | | | 2,315 | | | | 2,645,476 | |
| | | | | | | | |
| |
| | | | 3,820,429 | |
|
| California — 7.1% | |
California Municipal Finance Authority, RB, Series A, 4.00%, 10/01/29(b) | | | 420 | | | | 455,413 | |
City of Los Angeles Department of Airports, Refunding ARB, Series A, AMT, 5.00%, 05/15/36 | | | 3,670 | | | | 4,667,143 | |
County of Santa Barbara California, COP, Series B, AMT, 5.25%, 12/01/33 | | | 10,330 | | | | 12,793,354 | |
Golden State Tobacco Securitization Corp., Refunding RB | | | | | | | | |
Series A-1, 5.00%, 06/01/33 | | | 6,715 | | | | 8,126,835 | |
Series A-1, 5.00%, 06/01/35 | | | 5,785 | | | | 6,940,074 | |
Riverside County Transportation Commission, Refunding RB | | | | | | | | |
4.00%, 06/01/40 | | | 1,400 | | | | 1,630,663 | |
4.00%, 06/01/47 | | | 590 | | | | 665,936 | |
3.00%, 06/01/49 | | | 410 | | | | 418,611 | |
San Diego County Regional Airport Authority, Refunding ARB | | | | | | | | |
AMT, Subordinate, 5.00%, 07/01/32 | | | 1,000 | | | | 1,273,030 | |
AMT, Subordinate, 5.00%, 07/01/33 | | | 1,030 | | | | 1,305,350 | |
| | | | | | | | |
| Security | | Par (000) | | | Value | |
|
| California (continued) | |
San Diego County Regional Airport Authority, Refunding ARB (continued) | | | | | | | | |
AMT, Subordinate, 5.00%, 07/01/34 | | $ | 1,000 | | | $ | 1,263,026 | |
State of California, GO, 5.50%, 04/01/28 | | | 15 | | | | 15,059 | |
Transbay Joint Powers Authority, TA | | | | | | | | |
Series A, 5.00%, 10/01/35 | | | 700 | | | | 877,512 | |
Series A, 5.00%, 10/01/36 | | | 800 | | | | 1,000,577 | |
Series A, 5.00%, 10/01/37 | | | 1,000 | | | | 1,249,156 | |
| | | | | | | | |
| |
| | | | 42,681,739 | |
|
| Colorado — 1.9% | |
City & County of Denver Colorado Airport System Revenue, Refunding ARB, Series A, AMT, 5.00%, 12/01/32 | | | 5,000 | | | | 6,149,415 | |
Colorado Health Facilities Authority, Refunding RB | | | | | | | | |
Series A, 5.00%, 11/09/22(c) | | | 270 | | | | 282,885 | |
Series A, 5.00%, 08/01/34 | | | 1,500 | | | | 1,895,001 | |
Park Creek Metropolitan District, Refunding RB, Series A, Senior Lien, 5.00%, 12/01/34 | | | 500 | | | | 576,156 | |
Thompson Crossing Metropolitan District No.4, Refunding GO, 3.50%, 12/01/29 | | | 515 | | | | 543,989 | |
University of Northern Colorado, Refunding RB, Series A, 5.00%, 06/01/31 | | | 2,000 | | | | 2,227,282 | |
| | | | | | | | |
| |
| | | | 11,674,728 | |
|
| Connecticut — 2.8% | |
Connecticut Housing Finance Authority, Refunding RB, S/F Housing, Series C-2, AMT, 2.20%, 11/15/34 | | | 1,220 | | | | 1,225,671 | |
Connecticut State Health & Educational Facilities Authority, RB, Series A, 5.00%, 01/01/30(b) | | | 130 | | | | 144,041 | |
Connecticut State Health & Educational Facilities Authority, Refunding RB(b) | | | | | | | | |
Series G-1, 5.00%, 07/01/27 | | | 100 | | | | 118,005 | |
Series G-1, 5.00%, 07/01/28 | | | 100 | | | | 120,275 | |
Series G-1, 5.00%, 07/01/29 | | | 100 | | | | 122,367 | |
Series G-1, 5.00%, 07/01/30 | | | 100 | | | | 121,668 | |
Series G-1, 5.00%, 07/01/32 | | | 150 | | | | 180,588 | |
Series G-1, 5.00%, 07/01/34 | | | 125 | | | | 149,198 | |
State of Connecticut Special Tax Revenue, RB, Series A, 5.00%, 05/01/35 | | | 1,750 | | | | 2,223,422 | |
State of Connecticut, GO | |
Series A, 5.00%, 04/15/30 | | | 5,000 | | | | 6,221,635 | |
Series A, 5.00%, 04/15/31 | | | 4,000 | | | | 4,968,008 | |
Series A, 5.00%, 04/15/34 | | | 1,185 | | | | 1,480,807 | |
| | | | | | | | |
| |
| | | | 17,075,685 | |
|
| Delaware — 0.8% | |
County of Kent Delaware, RB | | | | | | | | |
Series A, 5.00%, 07/01/29 | | | 880 | | | | 1,027,051 | |
Series A, 5.00%, 07/01/30 | | | 1,030 | | | | 1,198,060 | |
Series A, 5.00%, 07/01/31 | | | 750 | | | | 869,530 | |
Series A, 5.00%, 07/01/32 | | | 375 | | | | 433,416 | |
Series A, 5.00%, 07/01/33 | | | 1,190 | | | | 1,371,512 | |
| | | | | | | | |
| |
| | | | 4,899,569 | |
|
| Florida — 7.0% | |
Capital Projects Finance Authority, RB, Series A-1, 5.00%, 10/01/31 | | | 1,500 | | | | 1,872,342 | |
Capital Region Community Development District, Refunding SAB | | | | | | | | |
Series A-1, 4.13%, 05/01/23 | | | 200 | | | | 203,499 | |
Series A-1, 4.63%, 05/01/28 | | | 500 | | | | 541,893 | |
| | |
SCHEDULE OF INVESTMENTS | | 27 |
| | |
Schedule of Investments (unaudited) (continued) October 31, 2021 | | BlackRock Municipal Income Fund, Inc. (MUI) (Percentages shown are based on Net Assets) |
| | | | | | | | |
| Security | | Par (000) | | | Value | |
| | |
| Florida (continued) | | | | | | |
Capital Trust Agency, Inc., RB | | | | | | | | |
Series A, 4.00%, 06/15/29(b) | | $ | 625 | | | $ | 662,571 | |
Series A, 5.00%, 12/15/29 | | | 400 | | | | 464,594 | |
Charlotte County Industrial Development Authority, RB, AMT, 5.00%, 10/01/29(b) | | | 1,000 | | | | 1,121,587 | |
County of Miami-Dade Florida Transit System, Refunding RB, 5.00%, 07/01/22(c) | | | 1,500 | | | | 1,547,920 | |
County of Miami-Dade Seaport Department, ARB, Series B, AMT, 6.00%, 10/01/23(c) | | | 6,950 | | | | 7,698,313 | |
County of Osceola Florida Transportation Revenue, Refunding RB, CAB(d) | | | | | | | | |
Series A-2, 0.00%, 10/01/28 | | | 500 | | | | 446,496 | |
Series A-2, 0.00%, 10/01/29 | | | 800 | | | | 693,162 | |
Escambia County Health Facilities Authority, Refunding RB 5.00%, 08/15/35 | | | 3,100 | | | | 3,789,260 | |
Series A, 5.00%, 08/15/31 | | | 1,000 | | | | 1,246,725 | |
Esplanade Lake Club Community Development District, SAB | | | | | | | | |
Series A-1, 3.63%, 11/01/30 | | | 370 | | | | 387,670 | |
Series A-2, 3.63%, 11/01/30 | | | 200 | | | | 209,551 | |
Florida Development Finance Corp., RB, AMT, 5.00%, 05/01/29(b) | | | 2,255 | | | | 2,403,223 | |
Florida Development Finance Corp., Refunding RB | | | | | | | | |
5.00%, 06/01/31 | | | 300 | | | | 348,509 | |
5.00%, 06/01/35 | | | 225 | | | | 259,183 | |
Florida Gulf Coast University Financing Corp., Refunding RB | | | | | | | | |
5.00%, 02/01/34 | | | 800 | | | | 992,306 | |
5.00%, 02/01/35 | | | 850 | | | | 1,051,991 | |
Harbor Bay Community Development District, Refunding SAB, Series A-2, 3.30%, 05/01/29 | | | 960 | | | | 986,518 | |
Harbor Bay Community Development District, SAB, Series A-1, 3.30%, 05/01/29 | | | 600 | | | | 616,576 | |
Hills Minneola Community Development District, SAB, 3.50%, 05/01/31(b) | | | 1,100 | | | | 1,139,236 | |
Lakewood Ranch Stewardship District, SAB | | | | | | | | |
3.65%, 05/01/22(b) | | | 145 | | | | 146,065 | |
4.00%, 05/01/22 | | | 350 | | | | 353,173 | |
3.60%, 05/01/24 | | | 350 | | | | 356,915 | |
4.30%, 05/01/27(b) | | | 520 | | | | 552,623 | |
3.80%, 05/01/29 | | | 670 | | | | 709,822 | |
Miami-Dade County Educational Facilities Authority, Refunding RB, Series A, 5.00%, 04/01/32 | | | 5,020 | | | | 5,708,006 | |
Midtown Miami Community Development District, Refunding SAB, Series A, 4.25%, 05/01/24 | | | 695 | | | | 719,659 | |
Osceola Chain Lakes Community Development District, SAB, 3.50%, 05/01/30 | | | 350 | | | | 367,590 | |
Pinellas County Industrial Development Authority, RB, 5.00%, 07/01/29 | | | 2,005 | | | | 2,290,309 | |
Sarasota County Health Facilities Authority, RB, 5.00%, 05/15/33 | | | 610 | | | | 695,940 | |
Southern Groves Community Development District No.5, Refunding SAB, 3.25%, 05/01/29 | | | 300 | | | | 308,468 | |
Sterling Hill Community Development District, Refunding SAB, Series B, 5.50%, 11/01/10(e)(f) | | | 143 | | | | 90,783 | |
| | | | | | | | |
| Security | | Par (000) | | | Value | |
| | |
| Florida (continued) | | | | | | |
Talavera Community Development District, SAB | | | | | | | | |
3.50%, 05/01/25 | | $ | 365 | | | $ | 372,729 | |
3.85%, 05/01/30 | | | 540 | | | | 572,505 | |
Tolomato Community Development District, Refunding SAB, Sub-Series A-2, 3.85%, 05/01/29 | | | 180 | | | | 190,055 | |
| | | | | | | | |
| | |
| | | | | | | 42,117,767 | |
|
| Georgia — 7.9% | |
City of Atlanta Georgia Water & Wastewater Revenue, Refunding RB, 5.00%, 11/01/32 | | | 8,315 | | | | 9,545,113 | |
Cobb County Kennestone Hospital Authority, Refunding RB | | | | | | | | |
5.00%, 04/01/32 | | | 1,250 | | | | 1,508,700 | |
4.00%, 04/01/33 | | | 200 | | | | 235,002 | |
4.00%, 04/01/34 | | | 275 | | | | 321,254 | |
4.00%, 04/01/35 | | | 275 | | | | 319,453 | |
4.00%, 04/01/36 | | | 300 | | | | 346,675 | |
George L Smith II Congress Center Authority, RB, 4.00%, 01/01/36 | | | 1,750 | | | | 2,016,641 | |
Georgia Housing & Finance Authority, Refunding RB, S/F Housing, Series A, 2.75%, 12/01/35 | | | 3,000 | | | | 3,106,368 | |
Georgia Ports Authority RB, 2.63%, 07/01/51 | | | 5,000 | | | | 4,906,495 | |
Main Street Natural Gas, Inc. RB, Series C, 4.00%, 05/01/52(a) | | | 3,240 | | | | 3,783,708 | |
Main Street Natural Gas, Inc., RB | | | | | | | | |
Series A, 5.50%, 09/15/28 | | | 2,500 | | | | 3,160,352 | |
Series A, 5.00%, 05/15/33 | | | 5,000 | | | | 6,098,725 | |
Series A, 5.00%, 05/15/34 | | | 5,250 | | | | 6,381,984 | |
Municipal Electric Authority of Georgia, RB | | | | | | | | |
5.00%, 01/01/34 | | | 700 | | | | 841,448 | |
5.00%, 01/01/35 | | | 1,225 | | | | 1,469,207 | |
Municipal Electric Authority of Georgia, Refunding RB | | | | | | | | |
Sub-Series A, 5.00%, 01/01/34 | | | 2,295 | | | | 2,795,680 | |
Sub-Series A, 5.00%, 01/01/35 | | | 925 | | | | 1,124,602 | |
| | | | | | | | |
| | |
| | | | | | | 47,961,407 | |
|
| Guam — 0.3% | |
Territory of Guam, Refunding RB, Series F, 5.00%, 01/01/29 | | | 1,500 | | | | 1,826,412 | |
| | | | | | | | |
|
| Illinois — 14.8% | |
Chicago Board of Education, Refunding GO | | | | | | | | |
Series A, 5.00%, 12/01/28 | | | 385 | | | | 470,324 | |
Series A, 5.00%, 12/01/30 | | | 1,580 | | | | 1,941,196 | |
Series C, 5.00%, 12/01/26 | | | 4,730 | | | | 5,611,294 | |
Series D, 5.00%, 12/01/26 | | | 4,185 | | | | 4,964,749 | |
Chicago Board of Education, Refunding GO, CAB, Series A, 0.00%, 12/01/25(d) | | | 420 | | | | 398,664 | |
Chicago Midway International Airport, Refunding ARB, Series A, AMT, 2nd Lien, 5.00%, 01/01/32 | | | 5,000 | | | | 5,444,830 | |
Chicago Midway International Airport, Refunding RB, Series A, 2nd Lien, AMT, 5.50%, 01/01/32 | | | 1,500 | | | | 1,583,431 | |
Chicago O’Hare International Airport, Refunding ARB | | | | | | | | |
Series C, AMT, Senior Lien, 5.25%, 01/01/28 | | | 1,350 | | | | 1,425,002 | |
Series C, AMT, Senior Lien, 5.25%, 01/01/29 | | | 3,020 | | | | 3,187,100 | |
Chicago O’Hare International Airport, Refunding RB | | | | | | | | |
Series B, 5.00%, 01/01/32 | | | 3,745 | | | | 4,242,752 | |
Series A, AMT, Senior Lien, 5.00%, 01/01/23 | | | 13,000 | | | | 13,694,200 | |
| | |
| 28 | | 2 0 2 1 BLACK ROCK SEMI - ANNUAL REPORT TO SHAREHOLDERS |
| | |
Schedule of Investments (unaudited) (continued) October 31, 2021 | | BlackRock Municipal Income Fund, Inc. (MUI) (Percentages shown are based on Net Assets) |
| | | | | | | | |
| Security | | Par (000) | | | Value | |
|
| Illinois (continued) | |
Chicago Transit Authority Sales Tax Receipts Fund, RB, 5.25%, 12/01/21(c) | | $ | 3,700 | | | $ | 3,715,174 | |
Cook County Community College District No. 508, GO, 5.13%, 12/01/38 | | | 1,000 | | | | 1,071,898 | |
Illinois Finance Authority, RB | | | | | | | | |
Series A, 5.00%, 02/15/28 | | | 810 | | | | 954,774 | |
Series A, 5.00%, 02/15/29 | | | 400 | | | | 469,738 | |
Series A, 5.00%, 02/15/30 | | | 500 | | | | 585,280 | |
Series A, 5.00%, 02/15/31 | | | 500 | | | | 583,443 | |
Series A, 5.00%, 02/15/32 | | | 500 | | | | 581,694 | |
Illinois Finance Authority, Refunding RB | | | | | | | | |
5.00%, 03/01/30 | | | 550 | | | | 660,598 | |
5.00%, 03/01/32 | | | 920 | | | | 1,103,978 | |
Illinois State Toll Highway Authority, RB, Series A, 5.00%, 01/01/34 | | | 9,140 | | | | 9,623,351 | |
Illinois State Toll Highway Authority, Refunding RB, Series A, 5.00%, 12/01/31 | | | 4,220 | | | | 4,934,653 | |
Metropolitan Pier & Exposition Authority, Refunding RB, 5.00%, 12/15/28 | | | 1,200 | | | | 1,451,645 | |
| | |
| State of Illinois, GO | | | | | | |
5.25%, 07/01/29 | | | 5,000 | | | | 5,354,630 | |
5.00%, 04/01/31 | | | 1,000 | | | | 1,093,883 | |
5.00%, 05/01/31 | | | 5,010 | | | | 5,494,277 | |
5.00%, 11/01/34 | | | 5,000 | | | | 5,838,480 | |
Series A, 5.00%, 03/01/35 | | | 2,000 | | | | 2,460,598 | |
Series D, 5.00%, 11/01/28 | | | 350 | | | | 417,579 | |
State of Illinois, Refunding GO, Series B, 5.00%, 10/01/27 | | | 120 | | | | 143,447 | |
| | | | | | | | |
| | |
| | | | | | | 89,502,662 | |
|
| Indiana — 0.2% | |
Indiana Finance Authority, Refunding RB, Series A, 4.13%, 12/01/26 | | | 1,270 | | | | 1,386,852 | |
| | | | | | | | |
|
| Iowa — 0.2% | |
Iowa Student Loan Liquidity Corp., Refunding RB, Series A, AMT, 5.00%, 12/01/26 | | | 775 | | | | 901,537 | |
| | | | | | | | |
|
| Kansas — 1.0% | |
Seward County Unified School District No.480 Liberal, Refunding GO | | | | | | | | |
5.00%, 09/01/22(c) | | | 3,990 | | | | 4,149,652 | |
5.00%, 09/01/33 | | | 2,010 | | | | 2,086,436 | |
| | | | | | | | |
| | |
| | | | | | | 6,236,088 | |
|
| Kentucky(c) — 0.5% | |
Louisville/Jefferson County Metropolitan Government, Refunding RB | | | | | | | | |
5.00%, 06/01/22 | | | 120 | | | | 123,337 | |
Series A, 5.00%, 06/01/22 | | | 2,750 | | | | 2,826,469 | |
| | | | | | | | |
| | |
| | | | | | | 2,949,806 | |
|
| Louisiana — 2.9% | |
City of Bossier City Louisiana Utilities Revenue, Refunding RB, 5.00%, 10/01/24(c) | | | 2,000 | | | | 2,263,670 | |
Louisiana Local Government Environmental Facilities & Community Development Auth, Refunding RB, 5.00%, 12/01/21(c) | | | 7,160 | | | | 7,187,573 | |
| | | | | | | | |
| Security | | Par (000) | | | Value | |
|
| Louisiana (continued) | |
New Orleans Aviation Board, ARB, Series A, 5.00%, 01/01/33 | | $ | 1,000 | | | $ | 1,132,182 | |
State of Louisiana Gasoline & Fuels Tax Revenue, Refunding RB, Series A-1, 4.00%, 05/01/34 | | | 3,000 | | | | 3,054,471 | |
Terrebonne Levee & Conservation District, RB, 5.00%, 07/01/23(c) | | | 3,660 | | | | 3,944,452 | |
| | | | | | | | |
| | |
| | | | | | | 17,582,348 | |
|
| Maine — 0.4% | |
Finance Authority of Maine, Refunding RB | | | | | | | | |
Series A-1, AMT, (AGM), 5.00%, 12/01/28 | | | 1,000 | | | | 1,214,777 | |
Series A-1, AMT, (AGM), 3.00%, 12/01/29 | | | 1,150 | | | | 1,204,522 | |
| | | | | | | | |
| | |
| | | | | | | 2,419,299 | |
|
| Maryland — 1.3% | |
City of Baltimore Maryland, Refunding TA(b) | | | | | | | | |
Series A, Senior Lien, 2.95%, 06/01/27 | | | 175 | | | | 181,116 | |
Series A, Senior Lien, 3.05%, 06/01/28 | | | 190 | | | | 197,918 | |
Series A, Senior Lien, 3.15%, 06/01/29 | | | 200 | | | | 209,855 | |
City of Baltimore Maryland, TA, Series B, 3.38%, 06/01/29(b) | | | 285 | | | | 289,129 | |
Maryland Economic Development Corp., Refunding RB | | | | | | | | |
Series A, 5.00%, 06/01/29 | | | 1,835 | | | | 2,238,427 | |
Series A, 5.00%, 06/01/30 | | | 1,015 | | | | 1,236,351 | |
Series A, 5.00%, 06/01/31 | | | 1,000 | | | | 1,213,214 | |
Series A, 5.00%, 06/01/32 | | | 1,000 | | | | 1,207,343 | |
Maryland Health & Higher Educational Facilities Authority, RB, Series B, 5.00%, 07/01/22(c) | | | 1,140 | | | | 1,175,830 | |
| | | | | | | | |
| | |
| | | | | | | 7,949,183 | |
|
| Massachusetts — 1.5% | |
Massachusetts Development Finance Agency, Refunding RB | | | | | | | | |
5.00%, 07/01/29 | | | 2,700 | | | | 3,228,722 | |
5.00%, 07/01/30 | | | 3,125 | | | | 3,732,075 | |
Series A, 5.00%, 01/01/31 | | | 1,730 | | | | 1,954,018 | |
| | | | | | | | |
| | |
| | | | | | | 8,914,815 | |
|
| Michigan — 2.9% | |
City of Detroit Michigan, GO | | | | | | | | |
5.00%, 04/01/26 | | | 265 | | | | 304,004 | |
5.00%, 04/01/27 | | | 210 | | | | 246,147 | |
5.00%, 04/01/28 | | | 235 | | | | 280,796 | |
5.00%, 04/01/29 | | | 235 | | | | 279,254 | |
5.00%, 04/01/30 | | | 180 | | | | 212,795 | |
5.00%, 04/01/31 | | | 265 | | | | 311,827 | |
5.00%, 04/01/32 | | | 225 | | | | 263,584 | |
5.00%, 04/01/33 | | | 295 | | | | 344,206 | |
Michigan Finance Authority, Refunding RB, Series C-3, Senior Lien, (AGM), 5.00%, 07/01/31 | | | 4,000 | | | | 4,450,896 | |
Michigan State Housing Development Authority, RB, M/F Housing, Series A, 2.13%, 10/01/36 | | | 4,275 | | | | 4,202,073 | |
Michigan Strategic Fund, RB | | | | | | | | |
AMT, 5.00%, 06/30/33 | | | 2,415 | | | | 2,925,635 | |
AMT, 5.00%, 12/31/33 | | | 2,000 | | | | 2,418,286 | |
| | |
SCHEDULE OF INVESTMENTS | | 29 |
| | |
Schedule of Investments (unaudited) (continued) October 31, 2021 | | BlackRock Municipal Income Fund, Inc. (MUI) (Percentages shown are based on Net Assets) |
| | | | | | | | |
| Security | | Par (000) | | | Value | |
| | |
| Michigan (continued) | | | | | | |
Michigan Strategic Fund, Refunding RB | | | | | | | | |
5.00%, 11/15/29 | | $ | 440 | | | $ | 521,950 | |
5.00%, 11/15/34 | | | 490 | | | | 571,376 | |
| | | | | | | | |
| | |
| | | | | | | 17,332,829 | |
|
| Minnesota — 1.8% | |
City of Minneapolis Minnesota, RB | | | | | | | | |
4.00%, 06/01/30 | | | 150 | | | | 165,180 | |
4.00%, 06/01/31 | | | 50 | | | | 54,206 | |
City of Minneapolis Minnesota, Refunding RB, Series A, 5.00%, 11/15/33 | | | 2,370 | | | | 2,881,643 | |
Duluth Economic Development Authority, Refunding RB | | | | | | | | |
Series A, 5.00%, 02/15/33 | | | 1,000 | | | | 1,203,402 | |
Series A, 5.00%, 02/15/34 | | | 1,185 | | | | 1,420,151 | |
Housing & Redevelopment Authority of The City of St. Paul Minnesota, RB, Series A, 4.75%, 07/01/29(b) | | | 250 | | | | 277,900 | |
University of Minnesota, RB, Series C, 5.00%, 08/01/23(c) | | | 4,520 | | | | 4,891,652 | |
| | | | | | | | |
| | |
| | | | | | | 10,894,134 | |
|
| Missouri — 0.6% | |
Industrial Development Authority of the City of St. Louis Missouri, Refunding RB, Series A, 3.88%, 11/15/29 | | | 350 | | | | 352,708 | |
Kansas City Industrial Development Authority, ARB, AMT, 4.00%, 03/01/35 | | | 1,480 | | | | 1,711,743 | |
St. Louis County Industrial Development Authority, Refunding RB | | | | | | | | |
5.00%, 09/01/27 | | | 360 | | | | 415,684 | |
5.00%, 09/01/32 | | | 1,015 | | | | 1,159,969 | |
| | | | | | | | |
| | |
| | | | | | | 3,640,104 | |
|
| Montana — 0.1% | |
Yellowstone County School District No.2 Billings, GO, 5.00%, 06/15/24(c) | | | 500 | | | | 558,726 | |
| | | | | | | | |
| | |
| Nebraska — 0.7% | | | | | | |
Douglas County Hospital Authority No.3, Refunding RB, 5.00%, 11/01/30 | | | 800 | | | | 929,919 | |
Nebraska Public Power District, Refunding RB | | | | | | | | |
Series A, 5.00%, 01/01/30 | | | 1,000 | | | | 1,007,794 | |
Series A, 5.00%, 01/01/32 | | | 2,000 | | | | 2,015,588 | |
| | | | | | | | |
| | |
| | | | | | | 3,953,301 | |
|
| Nevada — 1.2% | |
City of Las Vegas Nevada Special Improvement District No.814, SAB | | | | | | | | |
3.50%, 06/01/28 | | | 160 | | | | 173,821 | |
3.25%, 06/01/30 | | | 350 | | | | 370,849 | |
City of Reno Nevada, Refunding RB, Series A-1, (AGM), 5.00%, 06/01/31 | | | 1,000 | | | | 1,199,776 | |
County of Clark Department of Aviation, Refunding RB, Series A-2, Sub Lien, 5.00%, 07/01/33 | | | 5,000 | | | | 5,572,250 | |
| | | | | | | | |
| | |
| | | | | | | 7,316,696 | |
| | | | | | | | |
| Security | | Par (000) | | | Value | |
|
| New Hampshire(b) — 0.3% | |
New Hampshire Business Finance Authority, RB, AMT, 2.95%, 04/01/29 | | $ | 1,000 | | | $ | 1,070,064 | |
New Hampshire Business Finance Authority, Refunding RB, Series A, AMT, 4.00%, 11/01/27 | | | 795 | | | | 828,463 | |
| | | | | | | | |
| | |
| | | | | | | 1,898,527 | |
|
| New Jersey — 19.2% | |
New Jersey Economic Development Authority, RB | | | | | | | | |
AMT, 5.13%, 09/15/23 | | | 3,210 | | | | 3,343,035 | |
AMT, 5.50%, 01/01/26 | | | 1,500 | | | | 1,655,024 | |
AMT, 5.50%, 01/01/27 | | | 1,000 | | | | 1,102,806 | |
New Jersey Economic Development Authority, Refunding ARB | | | | | | | | |
AMT, 5.00%, 10/01/26 | | | 2,135 | | | | 2,519,648 | |
AMT, 5.00%, 10/01/27 | | | 1,680 | | | | 2,026,556 | |
New Jersey Educational Facilities Authority, RB, 5.00%, 06/15/28 | | | 10,000 | | | | 11,117,530 | |
New Jersey Educational Facilities Authority, Refunding RB | | | | | | | | |
5.00%, 07/01/25(c) | | | 1,966 | | | | 2,286,204 | |
5.00%, 07/01/30 | | | 3,034 | | | | 3,491,988 | |
New Jersey Higher Education Student Assistance Authority, RB, Series B, AMT, 3.50%, 12/01/39 | | | 2,130 | | | | 2,259,123 | |
New Jersey Higher Education Student Assistance Authority, Refunding RB | | | | | | | | |
1st Series, AMT, 5.50%, 12/01/26 | | | 540 | | | | 541,834 | |
Series B, AMT, 5.00%, 12/01/27 | | | 1,000 | | | | 1,219,835 | |
Series B, AMT, 5.00%, 12/01/28 | | | 1,000 | | | | 1,205,286 | |
New Jersey Transportation Trust Fund Authority, RB | | | | | | | | |
Series A, 5.00%, 06/15/30 | | | 2,000 | | | | 2,339,814 | |
Series AA, 5.25%, 06/15/31 | | | 12,000 | | | | 12,895,104 | |
Series AA, 5.25%, 06/15/32 | | | 2,250 | | | | 2,586,769 | |
Series AA, 5.00%, 06/15/35 | | | 3,000 | | | | 3,651,675 | |
Series C, 5.25%, 06/15/32 | | | 10,000 | | | | 11,327,380 | |
New Jersey Transportation Trust Fund Authority, Refunding RB | | | | | | | | |
Series A, 5.00%, 06/15/30 | | | 1,695 | | | | 1,983,226 | |
Series A, 5.00%, 12/15/33 | | | 2,285 | | | | 2,788,888 | |
New Jersey Turnpike Authority, RB, Series E, 5.00%, 01/01/32 | | | 12,000 | | | | 13,605,216 | |
New Jersey Turnpike Authority, Refunding RB, Series B, 5.00%, 01/01/23(c) | | | 6,000 | | | | 6,332,082 | |
Newark Housing Authority Scholarship Foundation A New Jersey Non, RB, M/F Housing | | | | | | | | |
Series A, 5.00%, 12/01/23 | | | 1,230 | | | | 1,312,583 | |
Series A, 5.00%, 12/01/25 | | | 1,345 | | | | 1,460,172 | |
South Jersey Port Corp., ARB | | | | | | | | |
Series B, AMT, 5.00%, 01/01/29 | | | 250 | | | | 300,390 | |
Series B, AMT, 5.00%, 01/01/30 | | | 200 | | | | 240,063 | |
Series B, AMT, 5.00%, 01/01/31 | | | 350 | | | | 419,426 | |
Series B, AMT, 5.00%, 01/01/32 | | | 425 | | | | 507,189 | |
State of New Jersey, GO, 5.00%, 06/01/28 | | | 5,000 | | | | 5,740,260 | |
Tobacco Settlement Financing Corp., Refunding RB | | | | | | | | |
Series A, 5.00%, 06/01/30 | | | 850 | | | | 1,046,881 | |
Series A, 5.00%, 06/01/32 | | | 11,980 | | | | 14,423,021 | |
Series A, 5.00%, 06/01/33 | | | 220 | | | | 264,270 | |
| | | | | | | | |
| | |
| | | | | | | 115,993,278 | |
| | |
| 30 | | 2 0 2 1 BLACK ROCK SEMI - ANNUAL REPORT TO SHAREHOLDERS |
| | |
Schedule of Investments (unaudited) (continued) October 31, 2021 | | BlackRock Municipal Income Fund, Inc. (MUI) (Percentages shown are based on Net Assets) |
| | | | | | | | |
| Security | | Par (000) | | | Value | |
| | |
| New Mexico — 1.2% | | | | | | |
Albuquerque Bernalillo County Water Utility Authority, Refunding RB, 4.00%, 07/01/33 | | $ | 2,510 | | | $ | 2,803,095 | |
Albuquerque Municipal School District No.12, GO, Series 2017, (SAW), 5.00%, 08/01/30 | | | 1,250 | | | | 1,488,599 | |
City of Santa Fe New Mexico, RB, Series A, 5.00%, 05/15/34 | | | 170 | | | | 191,540 | |
New Mexico Hospital Equipment Loan Council, Refunding RB, Series A, 5.00%, 08/01/31 | | | 2,500 | | | | 2,890,055 | |
| | | | | | | | |
| | |
| | | | | | | 7,373,289 | |
| | |
| New York — 12.9% | | | | | | |
Buffalo & Erie County Industrial Land Development Corp., Refunding RB | | | | | | | | |
Series A, 4.00%, 06/01/22 | | | 410 | | | | 417,700 | |
Series A, 4.50%, 06/01/27 | | | 1,710 | | | | 1,913,150 | |
Series A, 5.00%, 06/01/35 | | | 415 | | | | 466,637 | |
Build NYC Resource Corp., RB, Series A, 4.88%, 05/01/31(b) | | | 450 | | | | 509,555 | |
Build NYC Resource Corp., Refunding RB, 5.00%, 08/01/35 | | | 665 | | | | 797,199 | |
City of New York, GO, Series A-1, 5.00%, 08/01/47 | | | 3,745 | | | | 4,729,823 | |
Huntington Local Development Corp., RB, Series A, 5.00%, 07/01/36 | | | 940 | | | | 1,010,496 | |
Metropolitan Transportation Authority, RB | | | | | | | | |
Series B, 5.25%, 11/15/38 | | | 3,145 | | | | 3,454,018 | |
Sub-Series A-1, 5.00%, 11/15/40 | | | 2,355 | | | | 2,633,785 | |
Sub-Series B-1, 5.00%, 11/15/21(c) | | | 2,300 | | | | 2,303,961 | |
Sub-Series B-4, 5.00%, 11/15/21(c) | | | 1,500 | | | | 1,502,583 | |
Monroe County Industrial Development Corp., Refunding RB, Series A, 5.00%, 07/01/23(c) | | | 5,695 | | | | 6,138,082 | |
New York City Industrial Development Agency, Refunding RB (AGM), 4.00%, 03/01/32 | | | 1,030 | | | | 1,220,527 | |
Class A, (AGM), 3.00%, 01/01/35 | | | 500 | | | | 544,700 | |
Class A, (AGM), 3.00%, 01/01/36 | | | 1,000 | | | | 1,080,191 | |
New York Liberty Development Corp., Refunding RB | | | | | | | | |
2.88%, 11/15/46 | | | 4,310 | | | | 4,318,392 | |
3.00%, 11/15/51 | | | 990 | | | | 1,009,409 | |
New York State Dormitory Authority, Refunding RB | | | | | | | | |
5.00%, 12/01/27(b) | | | 900 | | | | 1,091,413 | |
5.00%, 12/01/28(b) | | | 1,800 | | | | 2,180,070 | |
Series A, 5.00%, 05/01/32 | | | 3,060 | | | | 3,503,945 | |
Series A, 5.00%, 07/01/32 | | | 9,000 | | | | 10,358,973 | |
New York State Thruway Authority, Refunding RB, Series A-1, 4.00%, 03/15/44 | | | 2,500 | | | | 2,894,595 | |
New York Transportation Development Corp., RB, AMT, 4.00%, 10/01/30 | | | 2,775 | | | | 3,216,250 | |
Niagara Area Development Corp., Refunding RB, Series B, 3.50%, 11/01/24(b) | | | 1,000 | | | | 1,038,596 | |
Port Authority of New York & New Jersey, ARB, Consolidated, 221st Series, AMT, 4.00%, 07/15/36 | | | 2,650 | | | | 3,087,801 | |
Port Authority of New York & New Jersey, Refunding ARB | | | | | | | | |
Series 223, AMT, 4.00%, 07/15/36 | | | 1,625 | | | | 1,906,713 | |
Series 223, AMT, 4.00%, 07/15/37 | | | 3,250 | | | | 3,810,436 | |
Troy Capital Resource Corp., Refunding RB 5.00%, 09/01/32 | | | 3,000 | | | | 3,816,330 | |
| | | | | | | | |
| Security | | Par (000) | | | Value | |
| | |
| New York (continued) | | | | | | |
Troy Capital Resource Corp., Refunding RB (continued) | | | | | | | | |
Series A, 5.00%, 09/01/33 | | $ | 860 | | | $ | 1,090,948 | |
Westchester County Healthcare Corp., Refunding RB, Series A, Senior Lien, 5.00%, 11/01/21 | | | 6,125 | | | | 6,125,000 | |
| | | | | | | | |
| | |
| | | | | | | 78,171,278 | |
| | |
| North Carolina — 0.3% | | | | | | |
North Carolina Medical Care Commission, Refunding RB, Series A, 5.00%, 10/01/31 | | | 1,500 | | | | 1,562,286 | |
| | | | | | | | |
| | |
| Ohio — 4.7% | | | | | | |
Buckeye Tobacco Settlement Financing Authority, Refunding RB | | | | | | | | |
Series A-2, Class 1, 4.00%, 06/01/37 | | | 1,000 | | | | 1,145,634 | |
Series A-2, Class 1, 4.00%, 06/01/38 | | | 1,000 | | | | 1,139,289 | |
Series A-2, Class 1, 4.00%, 06/01/39 | | | 1,000 | | | | 1,135,952 | |
County of Allen Ohio Hospital Facilities Revenue, Refunding RB, 5.00%, 12/01/35 | | | 850 | | | | 1,066,665 | |
Montgomery County Refunding RB, 4.00%, 08/01/51 | | | 4,250 | | | | 4,817,774 | |
Ohio Air Quality Development Authority, Refunding RB, 3.25 %, 09/01/29 | | | 1,550 | | | | 1,693,558 | |
Ohio Housing Finance Agency RB, Series C, (FNMA/GNMA/FHLMC), 2.70%, 09/01/46(g) | | | 11,000 | | | | 10,980,541 | |
Ohio Turnpike & Infrastructure Commission, RB, Series A-1, Junior Lien, 5.25%, 02/15/31 | | | 6,000 | | | | 6,366,300 | |
| | | | | | | | |
| | |
| | | | | | | 28,345,713 | |
| | |
| Oklahoma — 1.3% | | | | | | |
Oklahoma City Public Property Authority, Refunding RB | | | | | | | | |
5.00%, 10/01/27 | | | 1,190 | | | | 1,389,730 | |
5.00%, 10/01/28 | | | 1,265 | | | | 1,475,634 | |
5.00%, 10/01/29 | | | 1,400 | | | | 1,631,218 | |
Oklahoma Development Finance Authority, RB | | | | | | | | |
Series B, 5.00%, 08/15/29 | | | 1,200 | | | | 1,471,388 | |
Series B, 5.00%, 08/15/33 | | | 1,305 | | | | 1,578,507 | |
| | | | | | | | |
| | |
| | | | | | | 7,546,477 | |
| | |
| Oregon(c) — 1.1% | | | | | | |
Klamath County School District, GO, (GTY), 5.00%, 06/15/23 | | | 2,000 | | | | 2,152,460 | |
State of Oregon, GO, Series H, 5.00%, 05/01/22 | | | 2,000 | | | | 2,047,792 | |
Umatilla County School District No.16R Pendleton, GO, Series A, (GTY), 5.00%, 06/15/24 | | | 2,000 | | | | 2,239,334 | |
| | | | | | | | |
| | |
| | | | | | | 6,439,586 | |
| | |
| Pennsylvania — 7.3% | | | | | | |
Allentown Neighborhood Improvement Zone Development Authority, RB(b) | | | | | | | | |
5.00%, 05/01/22 | | | 550 | | | | 561,195 | |
5.00%, 05/01/23 | | | 335 | | | | 348,512 | |
5.00%, 05/01/28 | | | 835 | | | | 1,009,638 | |
Bucks County Industrial Development Authority, RB | | | | | | | | |
5.00%, 07/01/35 | | | 1,100 | | | | 1,353,056 | |
5.00%, 07/01/36 | | | 1,250 | | | | 1,531,480 | |
Commonwealth Financing Authority, RB | | | | | | | | |
5.00%, 06/01/33 | | | 2,000 | | | | 2,436,982 | |
5.00%, 06/01/34 | | | 3,750 | | | | 4,561,845 | |
| | |
SCHEDULE OF INVESTMENTS | | 31 |
| | |
Schedule of Investments (unaudited) (continued) October 31, 2021 | | BlackRock Municipal Income Fund, Inc. (MUI) (Percentages shown are based on Net Assets) |
| | | | | | | | |
| Security | | Par (000) | | | Value | |
| | |
| Pennsylvania (continued) | | | | | | |
County of Allegheny Pennsylvania, GO, Series C-67, 5.00%, 11/01/21 | | $ | 5,075 | | | $ | 5,075,000 | |
County of Allegheny Pennsylvania, Refunding GO, Series C-68, 5.00%, 11/01/21 | | | 2,515 | | | | 2,515,000 | |
Pennsylvania Economic Development Financing Authority, RB | | | | | | | | |
Series A-1, 5.00%, 04/15/35 | | | 1,450 | | | | 1,838,819 | |
Series A-1, 4.00%, 04/15/36 | | | 1,545 | | | | 1,820,027 | |
AMT, 5.00%, 12/31/28 | | | 115 | | | | 136,577 | |
Pennsylvania Turnpike Commission, RB | | | | | | | | |
Sub-Series B, 5.25%, 12/01/21(c) | | | 4,000 | | | | 4,016,352 | |
Series A, Subordinate, 4.00%, 12/01/43 | | | 3,000 | | | | 3,412,737 | |
Pennsylvania Turnpike Commission, Refunding RB | | | | | | | | |
2nd Series, 5.00%, 12/01/30 | | | 2,620 | | | | 3,223,252 | |
Sub-Series B, 5.00%, 06/01/32 | | | 5,000 | | | | 6,069,535 | |
School District of Philadelphia, GO | | | | | | | | |
Series A, (SAW), 5.00%, 09/01/30 | | | 1,200 | | | | 1,486,159 | |
Series A, (SAW), 5.00%, 09/01/31 | | | 1,000 | | | | 1,233,115 | |
Series A, (SAW), 5.00%, 09/01/32 | | | 1,200 | | | | 1,473,016 | |
| | | | | | | | |
| | |
| | | | | | | 44,102,297 | |
| | |
| Puerto Rico — 4.7% | | | | | | |
Puerto Rico Sales Tax Financing Corp. Sales Tax Revenue, RB | | | | | | | | |
Series A-1, Restructured, 4.50%, 07/01/34 | | | 4,365 | | | | 4,768,649 | |
Series A-1, Restructured, 4.75%, 07/01/53 | | | 350 | | | | 389,304 | |
Series A-1, Restructured, 5.00%, 07/01/58 | | | 2,209 | | | | 2,493,873 | |
Series A-2, Restructured, 4.33%, 07/01/40 | | | 1,919 | | | | 2,103,109 | |
Puerto Rico Sales Tax Financing Corp. Sales Tax Revenue, RB, CAB(d) | | | | | | | | |
Series A-1, Restructured, 0.00%, 07/01/27 | | | 11,890 | | | | 10,761,068 | |
Series A-1, Restructured, 0.00%, 07/01/29 | | | 446 | | | | 389,165 | |
Series A-1, Restructured, 0.00%, 07/01/31 | | | 1,464 | | | | 1,172,113 | |
Series B-1, Restructured, 0.00%, 07/01/27 | | | 2,521 | | | | 2,285,534 | |
Series B-1, Restructured, 0.00%, 07/01/29 | | | 4,466 | | | | 3,921,657 | |
| | | | | | | | |
| | |
| | | | | | | 28,284,472 | |
| | |
| Rhode Island — 1.6% | | | | | | |
Providence Redevelopment Agency, Refunding RB, Series A, 5.00%, 04/01/29 | | | 1,000 | | | | 1,095,525 | |
Rhode Island Health and Educational Building Corp., RB, Series C, 5.00%, 05/15/22(c) | | | 2,305 | | | | 2,364,382 | |
Rhode Island Health and Educational Building Corp., Refunding RB, 5.00%, 09/01/32 | | | 2,000 | | | | 2,167,390 | |
Rhode Island Student Loan Authority, RB | | | | | | | | |
Series A, AMT, 5.00%, 12/01/27 | | | 1,000 | | | | 1,208,449 | |
Series A, AMT, 5.00%, 12/01/28 | | | 1,000 | | | | 1,228,537 | |
Rhode Island Student Loan Authority, Refunding RB | | | | | | | | |
Series A, AMT, 5.00%, 12/01/24 | | | 750 | | | | 844,094 | |
Series A, AMT, 5.00%, 12/01/25 | | | 850 | | | | 983,624 | |
| | | | | | | | |
| | |
| | | | | | | 9,892,001 | |
| | |
| South Carolina — 2.9% | | | | | | |
South Carolina Jobs-Economic Development Authority, Refunding RB, 4.00%, 11/15/27 | | | 625 | | | | 662,304 | |
South Carolina Public Service Authority, Refunding RB | | | | | | | | |
Series A, 5.00%, 12/01/30 | | | 5,500 | | | | 6,527,890 | |
Series A, 5.00%, 12/01/31 | | | 5,660 | | | | 6,709,647 | |
Series A, 5.00%, 12/01/32 | | | 200 | | | | 236,798 | |
| | | | | | | | |
| Security | | Par (000) | | | Value | |
| | |
| South Carolina (continued) | | | | | | |
South Carolina Public Service Authority, Refunding RB (continued) | | | | | | | | |
Series A, 5.00%, 12/01/33 | | $ | 800 | | | $ | 946,101 | |
Series A, 4.00%, 12/01/34 | | | 2,100 | | | | 2,490,335 | |
| | | | | | | | |
| | |
| | | | | | | 17,573,075 | |
| | |
| Tennessee — 1.4% | | | | | | |
Memphis-Shelby County Industrial Development Board, Refunding TA, Series A, 4.75%, 07/01/27 | | | 170 | | | | 166,583 | |
Metropolitan Government Nashville & Davidson County Health & Educational Facilities Board, RB, Series A, 5.00 %, 07/01/35 | | | 4,000 | | | | 4,678,528 | |
Metropolitan Government Nashville & Davidson County Health & Educational Facilities Board, Refunding RB | | | | | | | | |
5.00%, 10/01/29 | | | 350 | | | | 421,785 | |
5.00%, 10/01/34 | | | 450 | | | | 543,570 | |
Tennessee Energy Acquisition Corp., RB, Series A, 5.00%, 05/01/52(a) | | | 2,210 | | | | 2,842,254 | |
| | | | | | | | |
| | |
| | | | | | | 8,652,720 | |
| | |
| Texas — 7.9% | | | | | | |
City of Grapevine Texas, GO, 5.00%, 02/15/23(c) | | | 5,685 | | | | 6,028,766 | |
City of Houston Texas Airport System Revenue, Refunding ARB | | | | | | | | |
Sub-Series A, AMT, 5.00%, 07/01/31 | | | 1,430 | | | | 1,760,705 | |
Sub-Series A, AMT, 5.00%, 07/01/32 | | | 1,515 | | | | 1,856,805 | |
City of Houston Texas Airport System Revenue, Refunding RB, Series A, AMT, Subordinate Lien, 5.00%, 07/01/22(c) | | | 1,010 | | | | 1,041,525 | |
Dallas Fort Worth International Airport, ARB, Series D, AMT, 5.00%, 11/01/21 | | | 8,290 | | | | 8,290,000 | |
Love Field Airport Modernization Corp., RB, AMT, 5.00%, 11/01/28 | | | 1,000 | | | | 1,042,883 | |
Mission Economic Development Corp., Refunding RB, AMT, Senior Lien, 4.63%, 10/01/31(b) | | | 1,360 | | | | 1,429,292 | |
New Hope Cultural Education Facilities Finance Corp., RB(b) | | | | | | | | |
Series A, 3.63%, 08/15/22 | | | 35 | | | | 35,000 | |
Series A, 4.25%, 08/15/27 | | | 160 | | | | 159,789 | |
Red River Education Finance Corp., RB, 5.00%, 03/15/23(c) | | | 1,340 | | | | 1,426,143 | |
San Jacinto River Authority, RB, (AGM), 5.25%, 10/01/25 | | | 2,910 | | | | 2,920,514 | |
Tarrant County Cultural Education Facilities Finance Corp., RB, Series B, 5.00%, 07/01/33 | | | 8,485 | | | | 10,503,666 | |
Texas Municipal Gas Acquisition & Supply Corp. III, Refunding RB, 5.00%, 12/15/32 | | | 3,450 | | | | 4,508,470 | |
Via Metropolitan Transit, Refunding RB, 5.25%, 08/01/23(c) | | | 6,305 | | | | 6,845,490 | |
| | | | | | | | |
| | |
| | | | | | | 47,849,048 | |
| | |
| U.S. Virgin Islands — 0.5% | | | | | | |
Virgin Islands Public Finance Authority, Refunding RB, Series A, (AGM), 5.25%, 10/01/24 | | | 2,800 | | | | 3,000,040 | |
| | | | | | | | |
| | |
| Utah — 1.0% | | | | | | |
Salt Lake City Corp. Utah Airport Revenue, ARB, Series A, AMT, 5.00%, 07/01/33 | | | 3,500 | | | | 4,258,345 | |
| | |
| 32 | | 2 0 2 1 BLACK ROCK SEMI - ANNUAL REPORT TO SHAREHOLDERS |
| | |
Schedule of Investments (unaudited) (continued) October 31, 2021 | | BlackRock Municipal Income Fund, Inc. (MUI) (Percentages shown are based on Net Assets) |
| | | | | | | | |
| Security | | Par (000) | | | Value | |
| | |
| Utah (continued) | | | | | | |
Utah Charter School Finance Authority, RB, Series A, 3.63%, 06/15/29(b) | | $ | 410 | | | $ | 424,513 | |
Utah Charter School Finance Authority, Refunding RB, 4.50%, 06/15/27(b) | | | 1,500 | | | | 1,614,024 | |
| | | | | | | | |
| | |
| | | | | | | 6,296,882 | |
| | |
| Vermont — 1.0% | | | | | | |
University of Vermont and State Agricultural College, Refunding RB, 4.00%, 10/01/30 | | | 5,565 | | | | 6,105,951 | |
| | | | | | | | |
| | |
| Virginia — 0.1% | | | | | | |
Henrico County Economic Development Authority, Refunding RB, 4.00%, 10/01/33 | | | 495 | | | | 561,998 | |
| | | | | | | | |
| | |
| Washington — 2.2% | | | | | | |
Port of Seattle Washington, Refunding ARB, Series C, AMT, 5.00%, 08/01/46 | | | 5,215 | | | | 6,506,469 | |
Washington State Convention Center Public Facilities District, RB, 4.00%, 07/01/31 | | | 1,730 | | | | 1,988,126 | |
Washington State Housing Finance Commission, RB, M/F Housing, Series A-1, 3.50%, 12/20/35 | | | 1,630 | | | | 1,858,616 | |
Washington State Housing Finance Commission, Refunding RB(b) | | | | | | | | |
5.00%, 01/01/27 | | | 1,560 | | | | 1,843,620 | |
5.00%, 01/01/28 | | | 750 | | | | 885,229 | |
| | | | | | | | |
| | |
| | | | | | | 13,082,060 | |
| | |
| Wisconsin — 2.6% | | | | | | |
Public Finance Authority Refunding RB, 4.00%, 12/01/31 | | | 700 | | | | 827,632 | |
Public Finance Authority, RB | | | | | | | | |
5.00%, 04/01/30(b) | | | 500 | | | | 597,124 | |
5.00%, 06/15/34 | | | 430 | | | | 518,055 | |
4.00%, 09/30/51 | | | 1,520 | | | | 1,648,194 | |
4.00%, 03/31/56 | | | 1,595 | | | | 1,719,804 | |
Series A, 4.00%, 03/01/30(b) | | | 445 | | | | 475,952 | |
Public Finance Authority, Refunding RB 4.00%, 09/01/29(b) | | | 140 | | | | 144,948 | |
Series B, AMT, 5.25%, 07/01/28 | | | 4,765 | | | | 4,904,819 | |
Wisconsin Health & Educational Facilities Authority RB, 4.00%, 08/15/46(g) | | | 2,720 | | | | 3,112,178 | |
Wisconsin Health & Educational Facilities Authority, Refunding RB | | | | | | | | |
(AGM), 4.00%, 02/15/35 | | | 750 | | | | 877,586 | |
(AGM), 4.00%, 02/15/36 | | | 800 | | | | 932,880 | |
| | | | | | | | |
| | |
| | | | | | | 15,759,172 | |
| | | | | | | | |
Total Municipal Bonds — 137.5%
(Cost: $776,458,064) | | | | | | | 831,201,115 | |
| | | | | | | | |
|
Municipal Bonds Transferred to Tender Option Bond Trusts(h) | |
| | |
| California — 6.1% | | | | | | |
Bay Area Toll Authority, Refunding RB, 4.00%, 04/01/31(i) | | | 8,080 | | | | 9,331,271 | |
State of California, Refunding GO | | | | | | | | |
5.00%, 10/01/35 | | | 12,500 | | | | 14,728,465 | |
4.00%, 03/01/37(i) | | | 10,775 | | | | 12,813,069 | |
| | | | | | | | |
| | |
| | | | | | | 36,872,805 | |
| | | | | | | | |
| Security | | Par (000) | | | Value | |
| | |
| Iowa — 1.3% | | | | | | |
Iowa Finance Authority, Refunding RB, Series C, 4.13%, 02/15/35 | | $ | 7,500 | | | $ | 8,101,575 | |
| | | | | | | | |
| | |
| Massachusetts — 1.5% | | | | | | |
Massachusetts Development Finance Agency, Refunding RB, 5.00%, 07/01/32 | | | 7,500 | | | | 9,219,505 | |
| | | | | | | | |
| | |
| New Jersey — 1.3% | | | | | | |
New Jersey Housing & Mortgage Finance Agency, Refunding RB | | | | | | | | |
Series BB, AMT, 3.65%, 04/01/28 | | | 4,173 | | | | 4,562,600 | |
Series BB, AMT, 3.70%, 10/01/28 | | | 3,233 | | | | 3,535,732 | |
| | | | | | | | |
| | |
| | | | | | | 8,098,332 | |
| | |
| New York — 8.8% | | | | | | |
City of New York, GO, Sub-Series 1-I, 5.00%, 03/01/32 | | | 7,009 | | | | 7,737,198 | |
New York City Transitional Finance Authority Future Tax Secured Revenue, RB, Sub-Series B-1, 5.00%, 08/01/36 | | | 9,444 | | | | 11,220,606 | |
New York State Dormitory Authority, Refunding RB, Series A, 5.00%, 03/15/36(i) | | | 5,505 | | | | 6,551,411 | |
New York State Urban Development Corp., RB, Series A-1, 5.00%, 03/15/32 | | | 5,501 | | | | 5,845,523 | |
New York State Urban Development Corp., Refunding RB, 4.00%, 03/15/42 | | | 10,000 | | | | 11,598,430 | |
Port Authority of New York & New Jersey, Refunding ARB, 178th Series, AMT, 5.00%, 12/01/32 | | | 4,009 | | | | 4,369,240 | |
Sales Tax Asset Receivable Corp., Refunding RB, Series A, 5.00%, 10/15/24 | | | 5,010 | | | | 5,682,582 | |
| | | | | | | | |
| | |
| | | | | | | 53,004,990 | |
| | |
| Texas — 1.4% | | | | | | |
Pflugerville Independent School District, GO, (PSF-GTD), 5.00%, 02/15/39 | | | 7,500 | | | | 8,288,475 | |
| | | | | | | | |
| | |
| Washington — 3.0% | | | | | | |
Port of Seattle Washington, ARB, Series A, AMT, 5.00%, 05/01/34 | | | 15,000 | | | | 17,944,105 | |
| | | | | | | | |
Total Municipal Bonds Transferred to Tender Option Bond Trusts — 23.4%
(Cost: $131,522,941) | | | | | | | 141,529,787 | |
| | | | | | | | |
Total Long-Term Investments — 160.9%
(Cost: $907,981,005) | | | | | | | 972,730,902 | |
| | | | | | | | |
| | |
SCHEDULE OF INVESTMENTS | | 33 |
| | |
Schedule of Investments (unaudited) (continued) October 31, 2021 | | BlackRock Municipal Income Fund, Inc. (MUI) (Percentages shown are based on Net Assets) |
| | | | | | | | |
| Security | | Shares | | | Value | |
| | |
Short-Term Securities | | | | | | | | |
| | |
| Money Market Funds — 2.5% | | | | | | |
BlackRock Liquidity Funds, MuniCash, Institutional Class, 0.01%(j)(k) | | | 14,802,453 | | | $ | 14,803,933 | |
| | | | | | | | |
| | |
Total Short-Term Securities — 2.5%
(Cost: $14,803,933) | | | | | | | 14,803,933 | |
| | | | | | | | |
| | |
Total Investments — 163.4%
(Cost: $922,784,938) | | | | | | | 987,534,835 | |
| |
Liabilities in Excess of Other Assets — (2.1)% | | | | (12,712,196 | ) |
| |
Liability for TOB Trust Certificates, Including Interest Expense and Fees Payable — (13.8)% | | | | (83,305,272 | ) |
| |
VMTP Shares at Liquidation Value — (47.5)% | | | | (287,100,000 | ) |
| | | | | | | | |
| |
Net Assets Applicable to Common Shares — 100.0% | | | $ | 604,417,367 | |
| | | | | | | | |
| (a) | Variable rate security. Interest rate resets periodically. The rate shown is the effective interest rate as of period end. Security description also includes the reference rate and spread if published and available. |
| (b) | Security exempt from registration pursuant to Rule 144A under the Securities Act of 1933, as amended. These securities may be resold in transactions exempt from registration to qualified institutional investors. |
| (c) | U.S. Government securities held in escrow, are used to pay interest on this security as well as to retire the bond in full at the date indicated, typically at a premium to par. |
| (e) | Issuer filed for bankruptcy and/or is in default. |
| (f) | Non-income producing security. |
| (h) | Represent bonds transferred to a TOB Trust in exchange of cash and residual certificates received by the Fund. These bonds serve as collateral in a secured borrowing. See Note 4 of the Notes to Financial Statements for details. |
| (i) | All or a portion of the security is subject to a recourse agreement. The aggregate maximum potential amount the Fund could ultimately be required to pay under the agreements, which expire between September 15, 2024 to March 1, 2028, is $17,444,020. See Note 4 of the Notes to Financial Statements for details. |
| (j) | Affiliate of the Fund. |
| (k) | Annualized 7-day yield as of period end. |
Affiliates
Investments in issuers considered to be affiliate(s) of the Fund during the six months ended October 31, 2021 for purposes of Section 2(a)(3) of the Investment Company Act of 1940, as amended, were as follows:
| | | | | | | | | | | | | | | | | | | | | | | | | | | | | | | | | | | | | | | | | | |
| | | | | | | | | | | |
| | | Affiliated Issuer | | Value at 04/30/21 | | | Purchases at Cost | | | Proceeds from Sales | | | Net Realized Gain (Loss) | | | Change in Unrealized Appreciation (Depreciation) | | | Value at 10/31/21 | | | Shares Held at 10/31/21 | | | Income | | | Capital Gain Distributions from Underlying Funds | | | | |
| | | | | | | | | | | |
| | BlackRock Liquidity Funds, MuniCash, Institutional Class | | $ | 126,519 | | | $ | 14,677,534 | (a) | | $ | — | | | $ | (120 | ) | | $ | — | | | $ | 14,803,933 | | | | 14,802,453 | | | $ | 261 | | | $ | — | | | | | |
| | | | | | | | | | | | | | | | | | | | | | | | | | | | | | | | | | | | | | | | | | |
| | (a) | Represents net amount purchased (sold). | |
Derivative Financial Instruments Outstanding as of Period End
Futures Contracts
| | | | | | | | | | | | | | | | |
| | | | | |
| Description | | Number of
Contracts | | | Expiration
Date | | | Notional
Amount (000) | | | Value/
Unrealized
Appreciation
(Depreciation) | |
| | | | |
Short Contracts | | | | | | | | | | | | | | | | |
10-Year U.S. Treasury Note | | | 258 | | | | 12/21/21 | | | $ | 33,709 | | | $ | 402,218 | |
U.S. Long Bond | | | 45 | | | | 12/21/21 | | | | 7,237 | | | | 35,685 | |
5-Year U.S. Treasury Note | | | 144 | | | | 12/31/21 | | | | 17,524 | | | | 233,764 | |
| | | | | | | | | | | | | | | | |
| | | | | | | | | | | | | | $ | 671,667 | |
| | | | | | | | | | | | | | | | |
| | |
| 34 | | 2 0 2 1 BLACK ROCK SEMI - ANNUAL REPORT TO SHAREHOLDERS |
| | |
Schedule of Investments (unaudited) (continued) October 31, 2021 | | BlackRock Municipal Income Fund, Inc. (MUI) |
Derivative Financial Instruments Categorized by Risk Exposure
As of period end, the fair values of derivative financial instruments located in the Statements of Assets and Liabilities were as follows:
| | | | | | | | | | | | | | | | | | | | | | | | | | | | |
| | | | | | | | |
| | | Commodity
Contracts | | | Credit
Contracts | | | Equity
Contracts | | | Foreign
Currency
Exchange
Contracts | | | Interest
Rate
Contracts | | | Other
Contracts | | | Total | |
| | | | | | | |
Assets — Derivative Financial Instruments | | | | | | | | | | | | | | | | | | | | | | | | | | | | |
Futures contracts | | | | | | | | | | | | | | | | | | | | | | | | | | | | |
| | | | | | | |
Unrealized appreciation on futures contracts(a) | | $ | — | | | $ | — | | | $ | — | | | $ | — | | | $ | 671,667 | | | $ | — | | | $ | 671,667 | |
| | | | | | | | | | | | | | | | | | | | | | | | | | | | |
| | (a) | Net cumulative unrealized appreciation (depreciation) on futures contracts and centrally cleared swaps, if any, are reported in the Schedule of Investments. In the Statements of Assets and Liabilities, only current day’s variation margin is reported in receivables or payables and the net cumulative unrealized appreciation (depreciation) is included in accumulated earnings (loss). | |
For the period ended October 31, 2021, the effect of derivative financial instruments in the Statements of Operations was as follows:
| | | | | | | | | | | | | | | | | | | | | | | | | | | | |
| | | | | | | | |
| | | Commodity
Contracts | | | Credit
Contracts | | | Equity
Contracts | | | Foreign
Currency
Exchange
Contracts | | | Interest
Rate
Contracts | | | Other
Contracts | | | Total | |
| | | | | | | |
Net Realized Gain (Loss) from: | | | | | | | | | | | | | | | | | | | | | | | | | | | | |
Futures contracts | | $ | — | | | $ | — | | | $ | — | | | $ | — | | | $ | (199,749 | ) | | $ | — | | | $ | (199,749 | ) |
| | | | | | | | | | | | | | | | | | | | | | | | | | | | |
| | | | | | | |
Net Change in Unrealized Appreciation (Depreciation) on: | | | | | | | | | | | | | | | | | | | | | | | | | | | | |
Futures contracts | | $ | — | | | $ | — | | | $ | — | | | $ | — | | | $ | 103,706 | | | $ | — | | | $ | 103,706 | |
| | | | | | | | | | | | | | | | | | | | | | | | | | | | |
Average Quarterly Balances of Outstanding Derivative Financial Instruments
| | | | |
| | |
Futures contracts: | | | | |
Average notional value of contracts — short | | $ | 61,852,930 | |
For more information about the Fund’s investment risks regarding derivative financial instruments, refer to the Notes to Financial Statements.
Fair Value Hierarchy as of Period End
Various inputs are used in determining the fair value of financial instruments. For a description of the input levels and information about the Fund’s policy regarding valuation of financial instruments, refer to the Notes to Financial Statements.
The following table summarizes the Fund’s financial instruments categorized in the fair value hierarchy. The breakdown of the Fund’s financial instruments into major categories is disclosed in the Schedule of Investments above.
| | | | | | | | | | | | | | | | |
| | | | | |
| | | Level 1 | | | Level 2 | | | Level 3 | | | Total | |
| | | | |
Assets | | | | | | | | | | | | | | | | |
Investments | | | | | | | | | | | | | | | | |
Long-Term Investments | | | | | | | | | | | | | | | | |
Municipal Bonds | | $ | — | | | $ | 831,201,115 | | | $ | — | | | $ | 831,201,115 | |
Municipal Bonds Transferred to Tender Option Bond Trusts | | | — | | | | 141,529,787 | | | | — | | | | 141,529,787 | |
Short-Term Securities | | | | | | | | | | | | | | | | |
Money Market Funds | | | 14,803,933 | | | | — | | | | — | | | | 14,803,933 | |
| | | | | | | | | | | | | | | | |
| | $ | 14,803,933 | | | $ | 972,730,902 | | | $ | — | | | $ | 987,534,835 | |
| | | | | | | | | | | | | | | | |
Derivative Financial Instruments(a) | | | | | | | | | | | | | | | | |
Assets | | | | | | | | | | | | | | | | |
Interest Rate Contracts | | $ | 671,667 | | | $ | — | | | $ | — | | | $ | 671,667 | |
| | | | | | | | | | | | | | | | |
| | (a) | Derivative financial instruments are futures contracts. Futures contracts are valued at the unrealized appreciation (depreciation) on the instrument. | |
| | |
SCHEDULE OF INVESTMENTS | | 35 |
| | |
Schedule of Investments (unaudited) (continued) October 31, 2021 | | BlackRock Municipal Income Fund, Inc. (MUI) |
The Fund may hold assets and/or liabilities in which the fair value approximates the carrying amount for financial statement purposes. As of period end, such assets and/or liabilities are categorized within the fair value hierarchy as follows:
| | | | | | | | | | | | | | | | |
| |
| | | | |
| | | Level 1 | | | Level 2 | | | Level 3 | | | Total | |
| |
| | | | |
Liabilities | | | | | | | | | | | | | | | | |
TOB Trust Certificates | | $ | — | | | $ | (83,289,072 | ) | | $ | — | | | $ | (83,289,072 | ) |
VMTP Shares at Liquidation Value | | | — | | | | (287,100,000 | ) | | | — | | | | (287,100,000 | ) |
| | | | | | | | | | | | | | | | |
| | $ | — | | | $ | (370,389,072 | ) | | $ | — | | | $ | (370,389,072 | ) |
| | | | | | | | | | | | | | | | |
See notes to financial statements.
| | |
| 36 | | 2 0 2 1 BLACK ROCK SEMI - ANNUAL REPORT TO SHAREHOLDERS |
| | |
Schedule of Investments (unaudited) October 31, 2021 | | BlackRock MuniHoldings Fund, Inc. (MHD) (Percentages shown are based on Net Assets) |
| | | | | | | | |
| Security | | Par (000) | | | Value | |
|
Municipal Bonds | |
|
Alabama — 1.1% | |
County of Jefferson Alabama Sewer Revenue, Refunding RB | | | | | | | | |
Series A, Senior Lien, (AGM), 5.00%, 10/01/44 | | $ | 570 | | | $ | 621,593 | |
Series A, Senior Lien, (AGM), 5.25%, 10/01/48 | | | 1,090 | | | | 1,191,188 | |
Series D, Sub Lien, 6.00%, 10/01/42 | | | 2,875 | | | | 3,245,728 | |
Series D, Sub Lien, 7.00%, 10/01/51 | | | 1,545 | | | | 1,777,397 | |
Health Care Authority of the City of Huntsville, RB | | | | | | | | |
Series B1, 4.00%, 06/01/45 | | | 315 | | | | 356,076 | |
Series B1, (AGM), 3.00%, 06/01/50 | | | 865 | | | | 898,406 | |
Opelika Utilities Board, Refunding RB, 4.00%, 06/01/41 | | | 960 | | | | 1,080,358 | |
Selma Industrial Development Board, RB, Series A, 5.38%, 12/01/35 | | | 900 | | | | 902,844 | |
| | | | | | | | |
| | |
| | | | | | | 10,073,590 | |
|
| Alaska — 0.2% | |
Northern Tobacco Securitization Corp., Refunding RB, Series A, Class 1, 4.00%, 06/01/50 | | | 1,890 | | | | 2,108,545 | |
| | | | | | | | |
| | |
| Arizona — 3.0% | | | | | | |
Arizona Health Facilities Authority, Refunding RB, Series A, 5.00%, 02/01/42 | | | 2,200 | | | | 2,224,660 | |
Arizona Industrial Development Authority, RB 4.38%, 07/01/39(a) | | | 575 | | | | 622,600 | |
Series A, 5.00%, 07/01/39(a) | | | 480 | | | | 504,586 | |
Series A, (BAM), 4.00%, 06/01/44 | | | 425 | | | | 477,616 | |
Series A, 5.00%, 07/01/49(a) | | | 550 | | | | 573,813 | |
Series A, 5.00%, 07/01/54(a) | | | 425 | | | | 442,727 | |
Arizona Industrial Development Authority, Refunding RB(a) | | | | | | | | |
Series A, 5.50%, 07/01/52 | | | 130 | | | | 139,906 | |
Series G, 5.00%, 07/01/47 | | | 435 | | | | 499,151 | |
Glendale Industrial Development Authority, RB | | | | | | | | |
5.00%, 05/15/41 | | | 65 | | | | 74,280 | |
5.00%, 05/15/56 | | | 575 | | | | 642,914 | |
Industrial Development Authority of the City of Phoenix, RB, Series A, 5.00%, 07/01/46(a) | | | 2,120 | | | | 2,314,775 | |
Industrial Development Authority of the County of Pima, RB(a) | | | | | | | | |
5.00%, 07/01/34 | | | 400 | | | | 426,160 | |
5.00%, 06/15/47 | | | 840 | | | | 850,244 | |
Industrial Development Authority of the County of Pima, Refunding RB, 5.00%, 06/15/52(a) | | | 260 | | | | 272,139 | |
Maricopa County Industrial Development Authority, Refunding RB | | | | | | | | |
5.00%, 07/01/39(a) | | | 215 | | | | 250,503 | |
5.00%, 07/01/54(a) | | | 490 | | | | 555,136 | |
Series A, 4.13%, 09/01/38 | | | 775 | | | | 883,069 | |
Maricopa County Pollution Control Corp., Refunding RB, Series B, 3.60%, 04/01/40 | | | 1,400 | | | | 1,525,367 | |
Salt Verde Financial Corp., RB | | | | | | | | |
5.00%, 12/01/32 | | | 3,500 | | | | 4,509,673 | |
5.00%, 12/01/37 | | | 6,845 | | | | 9,365,130 | |
| | | | | | | | |
| | |
| | | | | | | 27,154,449 | |
|
| Arkansas — 1.1% | |
Arkansas Development Finance Authority, RB | | | | | | | | |
5.00%, 12/01/47 | | | 385 | | | | 463,594 | |
Series A, AMT, 4.50%, 09/01/49(a) | | | 4,925 | | | | 5,359,297 | |
| | | | | | | | |
| Security | | Par (000) | | | Value | |
| | |
Arkansas (continued) | | | | | | | | |
City of Benton Arkansas, RB, (AGM), 4.00%, 06/01/39 | | $ | 505 | | | $ | 545,112 | |
City of Fort Smith Arkansas Water & Sewer Revenue, Refunding RB, Subordinate, 4.00%, 10/01/40 | | | 840 | | | | 911,509 | |
City of Little Rock Arkansas, RB, 4.00%, 07/01/41 | | | 1,835 | | | | 1,943,155 | |
Pulaski County Public Facilities Board, RB, 5.00%, 12/01/42 | | | 465 | | | | 520,803 | |
| | | | | | | | |
| | |
| | | | | | | 9,743,470 | |
|
| California — 8.7% | |
California Educational Facilities Authority, RB, Series V-1, 5.00%, 05/01/49 | | | 1,545 | | | | 2,356,317 | |
California Health Facilities Financing Authority, Refunding RB | | | | | | | | |
Series A, 5.00%, 07/01/33 | | | 1,320 | | | | 1,418,956 | |
Series A, 4.00%, 04/01/45 | | | 1,030 | | | | 1,161,280 | |
California Municipal Finance Authority, ARB, AMT, Senior Lien, 5.00%, 12/31/43 | | | 800 | | | | 937,950 | |
California Municipal Finance Authority, RB, S/F Housing | | | | | | | | |
Series A, 5.25%, 08/15/39 | | | 185 | | | | 197,351 | |
Series A, 5.25%, 08/15/49 | | | 460 | | | | 487,295 | |
California Municipal Finance Authority, Refunding RB, Series A, 5.00%, 02/01/42 | | | 285 | | | | 335,310 | |
California Pollution Control Financing Authority, RB, Series A, AMT, 5.00%, 11/21/45(a) | | | 1,755 | | | | 1,826,827 | |
California State Public Works Board, RB | | | | | | | | |
Series F, 5.25%, 09/01/33 | | | 1,230 | | | | 1,336,032 | |
Series I, 5.50%, 11/01/30 | | | 2,500 | | | | 2,755,483 | |
Series I, 5.50%, 11/01/31 | | | 3,965 | | | | 4,368,058 | |
Series I, 5.00%, 11/01/38 | | | 955 | | | | 1,038,746 | |
California Statewide Communities Development Authority, Refunding RB | | | | | | | | |
4.00%, 03/01/42 | | | 1,000 | | | | 1,133,481 | |
4.00%, 03/01/48 | | | 1,345 | | | | 1,500,497 | |
Carlsbad Unified School District, GO, Series B, 6.00%, 05/01/34 | | | 1,000 | | | | 1,133,984 | |
City of Los Angeles Department of Airports, Refunding ARB | | | | | | | | |
Series A, AMT, 5.00%, 05/15/31 | | | 245 | | | | 319,537 | |
Series A, AMT, 5.00%, 05/15/32 | | | 295 | | | | 382,037 | |
Series A, AMT, 5.00%, 05/15/33 | | | 290 | | | | 374,203 | |
Series A, AMT, 5.00%, 05/15/38 | | | 210 | | | | 265,126 | |
Series A, AMT, 5.00%, 05/15/39 | | | 225 | | | | 283,738 | |
Golden State Tobacco Securitization Corp., Refunding RB | | | | | | | | |
Series A-1, 5.00%, 06/01/47 | | | 2,335 | | | | 2,391,864 | |
Series A-2, 5.00%, 06/01/47 | | | 4,350 | | | | 4,455,936 | |
Hartnell Community College District, GO, CAB, Series D, 7.00%, 08/01/34 | | | 1,650 | | | | 2,117,993 | |
Kern Community College District, GO, Series C, 5.50%, 11/01/23(b) | | | 2,445 | | | | 2,697,652 | |
Montebello Unified School District, GO, CAB, (NPFGC), 0.00%, 08/01/22(c) | | | 2,405 | | | | 2,399,514 | |
Norwalk-La Mirada Unified School District, Refunding GO, CAB, Series E, (AGC), 0.00%, 08/01/38(c) | | | 8,000 | | | | 4,962,928 | |
Palomar Community College District, GO, CAB | | | | | | | | |
Series B, 0.00%, 08/01/30(c) | | | 1,500 | | | | 1,316,709 | |
Series B, Convertible, 6.20%, 08/01/39 | | | 2,605 | | | | 3,209,297 | |
| | |
SCHEDULE OF INVESTMENTS | | 37 |
| | |
Schedule of Investments (unaudited) (continued) October 31, 2021 | | BlackRock MuniHoldings Fund, Inc. (MHD) (Percentages shown are based on Net Assets) |
| | | | | | | | |
| Security | | Par (000) | | | Value | |
|
| California (continued) | |
Regents of the University of California Medical Center Pooled Revenue, Refunding RB | | | | | | | | |
Series J, 5.25%, 05/15/23(b) | | $ | 5,005 | | | $ | 5,386,216 | |
Series J, 5.25%, 05/15/38 | | | 1,420 | | | | 1,525,611 | |
Riverside County Public Financing Authority, RB, 5.25%, 11/01/25(b) | | | 2,500 | | | | 2,966,350 | |
Riverside County Redevelopment Successor Agency, Refunding TA, Series A, (BAM), 4.00%, 10/01/39 | | | 1,550 | | | | 1,757,123 | |
San Diego Community College District, GO, CAB, 6.00%, 08/01/33 | | | 2,800 | | | | 3,580,990 | |
San Diego County Regional Airport Authority, ARB, Series B, AMT, 5.00%, 07/01/47 | | | 1,405 | | | | 1,636,031 | |
San Diego Unified School District, GO, CAB(c) | | | | | | | | |
Series A, 0.00%, 07/01/29 | | | 5,315 | | | | 4,760,422 | |
Series A, 0.00%, 07/01/29(d) | | | 685 | | | | 610,398 | |
San Francisco City & County Airport Comm-San Francisco International Airport, Refunding ARB | | | | | | | | |
Series A, AMT, 5.50%, 05/01/28 | | | 1,085 | | | | 1,165,175 | |
Series A, AMT, 5.25%, 05/01/33 | | | 850 | | | | 908,355 | |
Series A, AMT, 5.00%, 05/01/44 | | | 1,090 | | | | 1,200,039 | |
State of California, Refunding GO | | | | | | | | |
5.00%, 02/01/38 | | | 3,000 | | | | 3,167,829 | |
3.00%, 12/01/46 | | | 1,395 | | | | 1,485,739 | |
Stockton Public Financing Authority, RB, Series A, 6.25%, 10/01/23(b) | | | 440 | | | | 490,206 | |
Washington Township Health Care District, GO, Series B, Election 2004, 5.50%, 08/01/40 | | | 920 | | | | 1,037,392 | |
| | | | | | | | |
| | |
| | | | | | | 78,841,977 | |
|
| Colorado — 2.0% | |
Arapahoe County School District No.6 Littleton, GO, Series A, (SAW), 5.50%, 12/01/43 | | | 1,260 | | | | 1,608,767 | |
City & County of Denver Colorado Airport System Revenue, ARB | | | | | | | | |
Series B, 5.25%, 11/15/32 | | | 3,250 | | | | 3,553,485 | |
Series A, AMT, 5.50%, 11/15/28 | | | 1,000 | | | | 1,101,534 | |
Series A, AMT, 5.50%, 11/15/30 | | | 340 | | | | 374,165 | |
Series A, AMT, 5.50%, 11/15/31 | | | 405 | | | | 445,429 | |
City & County of Denver Colorado, RB, CAB(c) | | | | | | | | |
Series A-2, 0.00%, 08/01/37 | | | 1,490 | | | | 891,503 | |
Series A-2, 0.00%, 08/01/38 | | | 915 | | | | 518,813 | |
Colorado Educational & Cultural Facilities Authority, RB | | | | | | | | |
5.50%, 07/01/40 | | | 2,510 | | | | 2,518,747 | |
5.00%, 03/01/50(a) | | | 360 | | | | 393,586 | |
Colorado Educational & Cultural Facilities Authority, Refunding RB, Class A, 5.00%, 10/01/59(a) | | | 1,690 | | | | 1,847,748 | |
Colorado Health Facilities Authority, Refunding RB | | | | | | | | |
Series A, 4.00%, 08/01/44 | | | 1,285 | | | | 1,445,173 | |
Series A, 3.25%, 08/01/49 | | | 1,415 | | | | 1,482,678 | |
Denver International Business Center Metropolitan District No.1, GO, Series A, 4.00%, 12/01/48 | | | 555 | | | | 568,982 | |
State of Colorado, COP, Series O, 4.00%, 03/15/44 | | | 930 | | | | 1,065,207 | |
| | | | | | | | |
| | |
| | | | | | | 17,815,817 | |
|
| Connecticut — 0.7% | |
Connecticut State Health & Educational Facilities Authority, Refunding RB, Series I-1, 5.00%, 07/01/42 | | | 590 | | | | 692,904 | |
State of Connecticut Special Tax Revenue, RB Series A, 4.00%, 05/01/36 | | | 240 | | | | 282,777 | |
| | | | | | | | |
| Security | | Par (000) | | | Value | |
| | |
| Connecticut (continued) | | | | | | |
State of Connecticut Special Tax Revenue, RB (continued) | | | | | | | | |
Series A, 4.00%, 05/01/39 | | $ | 150 | | | $ | 174,773 | |
State of Connecticut, GO | | | | | | | | |
Series A, 4.00%, 01/15/38 | | | 2,260 | | | | 2,653,339 | |
Series A, 5.00%, 04/15/38 | | | 985 | | | | 1,202,520 | |
State of Connecticut, Refunding GO, Series E, 5.00%, 09/15/37 | | | 970 | | | | 1,193,681 | |
| | | | | | | | |
| | |
| | | | | | | 6,199,994 | |
|
| Delaware — 0.7% | |
County of Kent Delaware, RB | | | | | | | | |
Series A, 5.00%, 07/01/40 | | | 330 | | | | 373,547 | |
Series A, 5.00%, 07/01/48 | | | 900 | | | | 1,005,121 | |
Delaware State Health Facilities Authority, RB | | | | | | | | |
5.00%, 06/01/43 | | | 820 | | | | 970,134 | |
5.00%, 06/01/48 | | | 1,395 | | | | 1,635,526 | |
Delaware Transportation Authority, RB, 5.00%, 06/01/55 | | | 1,790 | | | | 2,015,880 | |
| | | | | | | | |
| | |
| | | | | | | 6,000,208 | |
|
| District of Columbia — 3.4% | |
District of Columbia, Refunding RB | | | | | | | | |
5.00%, 04/01/35 | | | 315 | | | | 375,290 | |
5.00%, 10/01/48 | | | 1,695 | | | | 2,018,347 | |
District of Columbia, TA, 5.13%, 06/01/41 | | | 1,520 | | | | 1,525,246 | |
Metropolitan Washington Airports Authority Aviation Revenue, Refunding ARB | | | | | | | | |
Series A, AMT, 4.00%, 10/01/37 | | | 955 | | | | 1,116,451 | |
Series A, AMT, 4.00%, 10/01/38 | | | 955 | | | | 1,115,566 | |
Series A, AMT, 4.00%, 10/01/39 | | | 1,410 | | | | 1,645,161 | |
Series A, AMT, 4.00%, 10/01/40 | | | 1,150 | | | | 1,338,474 | |
Series A, AMT, 4.00%, 10/01/41 | | | 1,060 | | | | 1,231,472 | |
Metropolitan Washington Airports Authority Dulles Toll Road Revenue, Refunding RB | | | | | | | | |
Series A, 5.00%, 10/01/53 | | | 1,475 | | | | 1,498,725 | |
Series B, Subordinate, 4.00%, 10/01/49 | | | 1,255 | | | | 1,397,894 | |
Metropolitan Washington Airports Authority Dulles Toll Road Revenue, Refunding RB, CAB(c) | | | | | | | | |
Series B, 2nd Senior Lien, (AGC), 0.00%, 10/01/34 | | | 10,170 | | | | 7,618,764 | |
Series B, 2nd Senior Lien, (AGC), 0.00%, 10/01/35 | | | 13,485 | | | | 9,774,467 | |
| | | | | | | | |
| | |
| | | | | | | 30,655,857 | |
|
| Florida — 6.7% | |
Capital Projects Finance Authority, Refunding RB | | | | | | | | |
Series A-1, 5.00%, 10/01/32 | | | 140 | | | | 173,365 | |
Series A-1, 5.00%, 10/01/33 | | | 155 | | | | 191,095 | |
Series A-1, 5.00%, 10/01/34 | | | 155 | | | | 190,395 | |
Series A-1, 5.00%, 10/01/35 | | | 50 | | | | 61,223 | |
Capital Trust Agency, Inc., RB | | | | | | | | |
Series A, 5.00%, 06/01/45(a) | | | 480 | | | | 505,022 | |
Series A, 5.00%, 12/15/49 | | | 160 | | | | 179,514 | |
Series A, 5.00%, 12/15/54 | | | 140 | | | | 156,488 | |
Central Florida Expressway Authority, Refunding RB, Senior Lien, 5.00%, 07/01/48 | | | 2,760 | | | | 3,336,572 | |
City of Tampa Florida, RB, CAB(c) | | | | | | | | |
Series A, 0.00%, 09/01/49 | | | 285 | | | | 102,916 | |
Series A, 0.00%, 09/01/53 | | | 300 | | | | 90,943 | |
| | |
| 38 | | 2 0 2 1 BLACK ROCK SEMI - ANNUAL REPORT TO SHAREHOLDERS |
| | |
Schedule of Investments (unaudited) (continued) October 31, 2021 | | BlackRock MuniHoldings Fund, Inc. (MHD) (Percentages shown are based on Net Assets) |
| | | | | | | | |
| Security | | Par (000) | | | Value | |
| | |
| Florida (continued) | | | | | | |
Collier County Health Facilities Authority, Refunding RB, Series A, 5.00%, 05/01/45 | | $ | 1,755 | | | $ | 1,973,283 | |
County of Broward Florida Airport System Revenue, ARB, Series A, AMT, 5.00%, 10/01/45 | | | 2,845 | | | | 3,205,550 | |
County of Broward Florida Port Facilities Revenue, ARB, Series B, AMT, 4.00%, 09/01/49 | | | 1,070 | | | | 1,198,905 | |
County of Lee Florida Airport Revenue, RB, Series B, 5.00%, 10/01/46 | | | 3,515 | | | | 4,344,435 | |
County of Miami-Dade Florida Aviation Revenue, Refunding RB | | | | | | | | |
Series A, 4.00%, 10/01/37 | | | 235 | | | | 276,313 | |
Series A, 4.00%, 10/01/38 | | | 235 | | | | 275,614 | |
Series A, 4.00%, 10/01/39 | | | 175 | | | | 204,888 | |
Series A, AMT, 5.00%, 10/01/22(b) | | | 2,900 | | | | 3,024,393 | |
County of Miami-Dade Seaport Department, ARB(b) | | | | | | | | |
Series A, 5.38%, 10/01/23 | | | 1,015 | | | | 1,113,840 | |
Series A, 6.00%, 10/01/23 | | | 5,215 | | | | 5,785,010 | |
Series B, AMT, 6.00%, 10/01/23 | | | 4,750 | | | | 5,262,251 | |
Series B, AMT, 6.25%, 10/01/23 | | | 460 | | | | 511,721 | |
County of Osceola Florida Transportation Revenue, Refunding RB, CAB(c) | | | | | | | | |
Series A-2, 0.00%, 10/01/41 | | | 275 | | | | 147,797 | |
Series A-2, 0.00%, 10/01/42 | | | 370 | | | | 190,933 | |
Series A-2, 0.00%, 10/01/43 | | | 335 | | | | 165,846 | |
Series A-2, 0.00%, 10/01/44 | | | 345 | | | | 164,258 | |
Series A-2, 0.00%, 10/01/45 | | | 285 | | | | 130,645 | |
Series A-2, 0.00%, 10/01/46 | | | 625 | | | | 275,557 | |
Series A-2, 0.00%, 10/01/47 | | | 605 | | | | 256,649 | |
Series A-2, 0.00%, 10/01/48 | | | 430 | | | | 175,504 | |
Series A-2, 0.00%, 10/01/49 | | | 355 | | | | 139,768 | |
Cypress Bluff Community Development District, SAB, Series A, 3.80%, 05/01/50(a) | | | 430 | | | | 436,541 | |
Escambia County Health Facilities Authority, Refunding RB, 4.00%, 08/15/45 | | | 1,725 | | | | 1,904,648 | |
Esplanade Lake Club Community Development District, SAB, Series A-1, 4.13%, 11/01/50 | | | 615 | | | | 639,624 | |
Florida Development Finance Corp., RB(a) | | | | | | | | |
Series A, 5.00%, 06/15/40 | | | 155 | | | | 178,181 | |
Series A, 5.00%, 06/15/50 | | | 520 | | | | 587,998 | |
Series A, 5.00%, 06/15/55 | | | 310 | | | | 350,288 | |
AMT, 5.00%, 05/01/29 | | | 270 | | | | 287,747 | |
Series A, AMT, 5.00%, 08/01/29(e) | | | 105 | | | | 107,580 | |
Florida Development Finance Corp., Refunding RB, Series C, 5.00%, 09/15/50(a) | | | 270 | | | | 293,986 | |
Florida Housing Finance Corp., RB, S/F Housing, 1st Series, (FHLMC, FNMA, GNMA), 3.75%, 07/01/42 | | | 160 | | | | 168,864 | |
Hillsborough County Aviation Authority, Refunding RB, Sub-Series A, AMT, 5.50%, 10/01/29 | | | 1,735 | | | | 1,898,749 | |
Lee County Housing Finance Authority, RB, S/F Housing, Series A-2, AMT, (FHLMC, FNMA, GNMA), 6.00%, 09/01/40 | | | 60 | | | | 60,203 | |
Miami-Dade County Educational Facilities Authority, Refunding RB, Series A, 5.00%, 04/01/40 | | | 3,465 | | | | 3,910,797 | |
Miami-Dade County Seaport Department Refunding RB, Series A-1, AMT, (AGM), 4.00%, 10/01/45 | | | 2,180 | | | | 2,490,116 | |
Orange County Health Facilities Authority, Refunding RB, 5.00%, 08/01/41 | | | 1,305 | | | | 1,432,218 | |
Palm Beach County Health Facilities Authority, RB, Series B, 5.00%, 11/15/42 | | | 210 | | | | 252,948 | |
| | | | | | | | |
| Security | | Par (000) | | | Value | |
| | |
| Florida (continued) | | | | | | |
Palm Beach County Health Facilities Authority, Refunding RB, 4.00%, 08/15/49 | | $ | 1,185 | | | $ | 1,334,287 | |
Reedy Creek Improvement District, GO, Series A, 5.25%, 06/01/23(b) | | | 1,785 | | | | 1,925,858 | |
Sarasota County Florida Utility System Revenue, RB | | | | | | | | |
Series A, 5.00%, 10/01/45 | | | 310 | | | | 390,587 | |
Series A, 5.00%, 10/01/50 | | | 465 | | | | 578,914 | |
Southern Groves Community Development District No.5, Refunding SAB, 4.00%, 05/01/43 | | | 220 | | | | 229,462 | |
Stevens Plantation Community Development District, SAB, Series A, 7.10%, 05/01/35(f)(g) | | | 800 | | | | 506,893 | |
Trout Creek Community Development District, SAB | | | | | | | | |
4.00%, 05/01/40 | | | 635 | | | | 663,588 | |
4.00%, 05/01/51 | | | 1,055 | | | | 1,085,387 | |
Village Community Development District No.10, SAB, 5.13%, 05/01/43 | | | 2,320 | | | | 2,382,691 | |
Volusia County Educational Facility Authority, Refunding RB, 5.00%, 10/15/49 | | | 1,265 | | | | 1,525,781 | |
Westside Community Development District, SAB, 4.00%, 05/01/50 | | | 815 | | | | 852,224 | |
| | | | | | | | |
| | |
| | | | | | | 60,286,853 | |
| | |
| Georgia — 2.6% | | | | | | |
Development Authority for Fulton County, RB, 4.00%, 06/15/49 | | | 470 | | | | 532,192 | |
Gainesville & Hall County Hospital Authority, Refunding RB, Series A, (GTD), 5.50%, 02/15/25(b) | | | 640 | | | | 743,693 | |
Georgia Housing & Finance Authority, RB, S/F Housing | | | | | | | | |
Series A, 3.95%, 12/01/43 | | | 120 | | | | 125,847 | |
Series A, 4.00%, 12/01/48 | | | 170 | | | | 177,613 | |
Series B, 2.50%, 06/01/50 | | | 520 | | | | 516,135 | |
Griffin-Spalding County Hospital Authority, RB, 4.00%, 04/01/42 | | | 2,310 | | | | 2,542,839 | |
Main Street Natural Gas, Inc., RB | | | | | | | | |
Series A, 5.00%, 05/15/35 | | | 360 | | | | 483,580 | |
Series A, 5.00%, 05/15/36 | | | 1,860 | | | | 2,523,525 | |
Series A, 5.00%, 05/15/37 | | | 400 | | | | 547,616 | |
Series A, 5.00%, 05/15/38 | | | 1,265 | | | | 1,748,140 | |
Series A, 5.00%, 05/15/43 | | | 330 | | | | 391,634 | |
Series A, 5.00%, 05/15/49 | | | 4,575 | | | | 6,592,186 | |
Municipal Electric Authority of Georgia, RB | | | | | | | | |
5.00%, 01/01/48 | | | 835 | | | | 982,654 | |
4.00%, 01/01/49 | | | 2,105 | | | | 2,316,949 | |
5.00%, 01/01/56 | | | 350 | | | | 411,151 | |
4.00%, 01/01/59 | | | 1,335 | | | | 1,465,440 | |
Municipal Electric Authority of Georgia, Refunding RB | | | | | | | | |
Series A, 4.00%, 01/01/51 | | | 615 | | | | 699,976 | |
Sub-Series A, 4.00%, 01/01/49 | | | 700 | | | | 771,347 | |
| | | | | | | | |
| | |
| | | | | | | 23,572,517 | |
| | |
| Hawaii — 0.3% | | | | | | |
State of Hawaii Airports System Revenue, ARB, Series A, AMT, 5.00%, 07/01/45 | | | 1,500 | | | | 1,698,069 | |
State of Hawaii Airports System Revenue, COP AMT, 5.25%, 08/01/25 | | | 425 | | | | 459,965 | |
| | |
SCHEDULE OF INVESTMENTS | | 39 |
| | |
Schedule of Investments (unaudited) (continued) October 31, 2021 | | BlackRock MuniHoldings Fund, Inc. (MHD) (Percentages shown are based on Net Assets) |
| | | | | | | | |
| Security | | Par (000) | | | Value | |
| | |
| Hawaii (continued) | | | | | | |
State of Hawaii Airports System Revenue, COP (continued) | | | | | | | | |
AMT, 5.25%, 08/01/26 | | $ | 460 | | | $ | 497,728 | |
State of Hawaii Department of Budget & Finance, Refunding RB, 5.25%, 11/15/37 | | | 400 | | | | 418,673 | |
| | | | | | | | |
| | |
| | | | | | | 3,074,435 | |
|
| Idaho — 0.4% | |
Idaho Health Facilities Authority, RB 4.00%, 12/01/43 | | | 670 | | | | 775,545 | |
Series 2017, 5.00%, 12/01/46 | | | 540 | | | | 646,696 | |
Series A, 5.00%, 03/01/39 | | | 500 | | | | 546,322 | |
Power County Industrial Development Corp., RB, AMT, 6.45%, 08/01/32 | | | 2,000 | | | | 2,008,538 | |
| | | | | | | | |
| | |
| | | | | | | 3,977,101 | |
|
| Illinois — 10.5% | |
Chicago Board of Education, GO | | | | | | | | |
Series A, 5.00%, 12/01/36 | | | 985 | | | | 1,209,458 | |
Series A, 5.00%, 12/01/38 | | | 610 | | | | 746,136 | |
Series A, 5.00%, 12/01/40 | | | 730 | | | | 887,163 | |
Series A, 5.00%, 12/01/41 | | | 480 | | | | 582,727 | |
Series C, 5.25%, 12/01/35 | | | 2,655 | | | | 2,942,175 | |
Series D, 5.00%, 12/01/46 | | | 3,480 | | | | 3,784,302 | |
Series H, 5.00%, 12/01/36 | | | 585 | | | | 684,134 | |
Series H, 5.00%, 12/01/46 | | | 240 | | | | 276,405 | |
Chicago Board of Education, Refunding GO | | | | | | | | |
Series C, 5.00%, 12/01/25 | | | 1,120 | | | | 1,301,424 | |
Series C, 5.00%, 12/01/27 | | | 500 | | | | 603,152 | |
Series C, 5.00%, 12/01/30 | | | 605 | | | | 715,310 | |
Series C, 5.00%, 12/01/34 | | | 475 | | | | 555,214 | |
Series D, 5.00%, 12/01/25 | | | 435 | | | | 505,453 | |
Series F, 5.00%, 12/01/22 | | | 455 | | | | 476,316 | |
Series F, 5.00%, 12/01/23 | | | 310 | | | | 337,556 | |
Series F, 5.00%, 12/01/24 | | | 340 | | | | 383,552 | |
Series G, 5.00%, 12/01/34 | | | 315 | | | | 368,195 | |
Chicago Midway International Airport, Refunding ARB, Series A, 2nd Lien, AMT, 5.00%, 01/01/41 | | | 1,870 | | | | 2,023,033 | |
Chicago O’Hare International Airport, ARB, Series D, AMT, Senior Lien, 5.00%, 01/01/42 | | | 430 | | | | 500,781 | |
Chicago O’Hare International Airport, Refunding RB | | | | | | | | |
Series B, AMT, 4.00%, 01/01/29 | | | 1,600 | | | | 1,609,379 | |
Series A, Senior Lien, 4.00%, 01/01/37 | | | 675 | | | | 784,076 | |
Chicago Transit Authority Sales Tax Receipts Fund, RB, 5.25%, 12/01/21(b) | | | 10,900 | | | | 10,944,701 | |
City of Chicago Illinois Special Assessment Revenue, SAB, 6.75%, 12/01/32 | | | 1,429 | | | | 1,432,502 | |
City of Chicago Illinois Wastewater Transmission Revenue, RB, 2nd Lien, 5.00%, 01/01/42 | | | 3,530 | | | | 3,552,461 | |
City of Chicago Illinois Waterworks Revenue, Refunding RB, 2nd Lien, 5.00%, 11/01/42 | | | 1,000 | | | | 1,041,340 | |
Cook County Community College District No. 508, GO | | | | | | | | |
5.50%, 12/01/38 | | | 3,075 | | | | 3,338,983 | |
5.25%, 12/01/43 | | | 2,935 | | | | 3,126,705 | |
County of Will Illinois, GO, 5.00%, 11/15/25(b) | | | 600 | | | | 705,826 | |
Illinois Finance Authority, RB | | | | | | | | |
Series A, 5.00%, 02/15/37 | | | 820 | | | | 941,908 | |
Series A, 5.00%, 02/15/47 | | | 240 | | | | 270,270 | |
Series A, 5.00%, 02/15/50 | | | 130 | | | | 145,767 | |
Illinois Finance Authority, Refunding RB 4.00%, 03/01/35 | | | 1,290 | | | | 1,445,021 | |
| | | | | | | | |
| Security | | Par (000) | | | Value | |
| | |
| Illinois (continued) | | | | | | |
Illinois Finance Authority, Refunding RB (continued) | | | | | | | | |
Series A, 5.00%, 11/15/45 | | $ | 1,205 | | | $ | 1,376,324 | |
Series C, 5.00%, 02/15/41 | | | 555 | | | | 657,441 | |
Illinois State Toll Highway Authority, RB | | | | | | | | |
Series A, 5.00%, 01/01/40 | | | 2,980 | | | | 3,410,062 | |
Series A, 5.00%, 01/01/45 | | | 930 | | | | 1,161,461 | |
Series C, 5.00%, 01/01/37 | | | 2,000 | | | | 2,259,666 | |
Metropolitan Pier & Exposition Authority, RB, Series A, 5.00%, 06/15/57 | | | 2,370 | | | | 2,736,442 | |
Metropolitan Pier & Exposition Authority, Refunding RB, 4.00%, 06/15/50 | | | 2,550 | | | | 2,822,179 | |
Metropolitan Pier & Exposition Authority, Refunding RB, CAB(c) | | | | | | | | |
Series B, (AGM), 0.00%, 06/15/43 | | | 3,765 | | | | 2,098,099 | |
Series B, (AGM), 0.00%, 06/15/47 | | | 22,775 | | | | 10,995,041 | |
State of Illinois, GO | | | | | | | | |
5.25%, 02/01/31 | | | 1,485 | | | | 1,624,260 | |
5.25%, 02/01/32 | | | 2,365 | | | | 2,586,785 | |
5.50%, 07/01/33 | | | 3,000 | | | | 3,221,433 | |
5.50%, 07/01/38 | | | 695 | | | | 745,697 | |
5.00%, 02/01/39 | | | 1,910 | | | | 2,072,661 | |
5.50%, 05/01/39 | | | 795 | | | | 993,187 | |
Series A, 5.00%, 04/01/38 | | | 4,545 | | | | 4,806,983 | |
Series D, 5.00%, 11/01/28 | | | 900 | | | | 1,073,776 | |
State of Illinois, Refunding GO, Series B, 5.00%, 10/01/27 | | | 90 | | | | 107,585 | |
University of Illinois, RB, Series A, 5.00%, 04/01/44 | | | 1,225 | | | | 1,344,950 | |
Upper Illinois River Valley Development Authority, Refunding RB, 5.00%, 01/01/55(a) | | | 390 | | | | 413,287 | |
| | | | | | | | |
| | |
| | | | | | | 94,728,744 | |
|
| Indiana — 1.3% | |
City of Valparaiso Indiana, RB | | | | | | | | |
AMT, 6.75%, 01/01/34 | | | 975 | | | | 1,071,946 | |
AMT, 7.00%, 01/01/44 | | | 2,355 | | | | 2,594,002 | |
Indiana Finance Authority, RB(b) | | | | | | | | |
Series A, AMT, 5.00%, 07/01/23 | | | 2,870 | | | | 3,084,933 | |
Series A, AMT, 5.25%, 07/01/23 | | | 500 | | | | 539,657 | |
Indianapolis Local Public Improvement Bond Bank, RB | | | | | | | | |
Series A, 5.00%, 01/15/40 | | | 1,520 | | | | 1,600,764 | |
Series F, 5.25%, 02/01/36 | | | 3,055 | | | | 3,066,096 | |
| | | | | | | | |
| | |
| | | | | | | 11,957,398 | |
|
| Iowa — 0.9% | |
Iowa Finance Authority, RB, Series A, 5.00%, 05/15/48 | | | 1,900 | | | | 2,154,207 | |
Iowa Finance Authority, Refunding RB | | | | | | | | |
5.25%, 12/01/25 | | | 1,260 | | | | 1,370,993 | |
Series B, 5.25%, 12/01/50(e) | | | 2,445 | | | | 2,660,779 | |
Iowa Student Loan Liquidity Corp., Refunding RB, Series B, AMT, 3.00%, 12/01/39 | | | 1,715 | | | | 1,751,699 | |
| | | | | | | | |
| | |
| | | | | | | 7,937,678 | |
|
| Kansas — 0.1% | |
Seward County Unified School District No.480 Liberal, Refunding GO, 5.00%, 09/01/39 | | | 720 | | | | 747,380 | |
| | | | | | | | |
|
| Kentucky — 1.1% | |
County of Boyle Kentucky, Refunding RB, 5.00%, 06/01/37 | | | 2,500 | | | | 2,964,968 | |
| | |
| 40 | | 2 0 2 1 BLACK ROCK SEMI - ANNUAL REPORT TO SHAREHOLDERS |
| | |
Schedule of Investments (unaudited) (continued) October 31, 2021 | | BlackRock MuniHoldings Fund, Inc. (MHD) (Percentages shown are based on Net Assets) |
| | | | | | | | |
| Security | | Par (000) | | | Value | |
| | |
| Kentucky (continued) | | | | | | |
Kentucky Economic Development Finance Authority, RB(b) | | | | | | | | |
Series A, 5.25%, 01/01/23 | | $ | 1,230 | | | $ | 1,301,606 | |
Series A, 5.38%, 01/01/23 | | | 1,830 | | | | 1,939,192 | |
Kentucky Public Transportation Infrastructure Authority, RB, CAB | | | | | | | | |
Series C, Convertible, 0.00%, 07/01/34(h) | | | 500 | | | | 611,512 | |
Series C, Convertible, 0.00%, 07/01/39(h) | | | 830 | | | | 1,006,912 | |
Series C, Convertible, 6.75%, 07/01/43 | | | 1,770 | | | | 2,148,803 | |
| | | | | | | | |
| | |
| | | | | | | 9,972,993 | |
| | |
| Louisiana — 0.9% | | | | | | |
City of Alexandria Louisiana Utilities Revenue, RB, 5.00%, 05/01/24(b) | | | 860 | | | | 958,290 | |
Lake Charles Harbor & Terminal District, ARB, Series B, AMT, (AGM), 5.50%, 01/01/29 | | | 1,500 | | | | 1,658,518 | |
Louisiana Public Facilities Authority, Refunding RB, 5.00%, 05/15/47 | | | 1,635 | | | | 1,857,687 | |
Tobacco Settlement Financing Corp., Refunding RB | | | | | | | | |
Series A, 5.25%, 05/15/31 | | | 375 | | | | 375,827 | |
Series A, 5.25%, 05/15/32 | | | 1,320 | | | | 1,350,992 | |
Series A, 5.25%, 05/15/33 | | | 1,430 | | | | 1,463,448 | |
Series A, 5.25%, 05/15/35 | | | 605 | | | | 644,074 | |
| | | | | | | | |
| | |
| | | | | | | 8,308,836 | |
| | |
| Maine — 0.0% | | | | | | |
Maine State Housing Authority, RB, S/F Housing, Series C, 3.95%, 11/15/43 | | | 335 | | | | 363,084 | |
| | | | | | | | |
| | |
| Maryland — 1.5% | | | | | | |
Anne Arundel County Consolidated Special Taxing District, ST | | | | | | | | |
5.13%, 07/01/36 | | | 170 | | | | 179,667 | |
5.25%, 07/01/44 | | | 170 | | | | 179,135 | |
Howard County Housing Commission, RB, M/F Housing, 5.00%, 12/01/42 | | | 1,430 | | | | 1,669,709 | |
Maryland Health & Higher Educational Facilities Authority, RB | | | | | | | | |
Series 2017, 5.00%, 12/01/46 | | | 305 | | | | 366,545 | |
Series A, 5.00%, 05/15/42 | | | 1,760 | | | | 2,102,593 | |
Series B, 4.00%, 04/15/45 | | | 795 | | | | 903,964 | |
Maryland Stadium Authority, RB, (NPFGC), 5.00%, 05/01/34 | | | 2,700 | | | | 3,303,423 | |
Maryland State Transportation Authority, Refunding RB, Series A, 2.50%, 07/01/47 | | | 4,915 | | | | 4,736,507 | |
| | | | | | | | |
| | |
| | | | | | | 13,441,543 | |
| | |
| Massachusetts — 2.6% | | | | | | |
Massachusetts Development Finance Agency, RB | | | | | | | | |
5.00%, 01/01/48 | | | 1,115 | | | | 1,306,809 | |
5.00%, 10/01/48 | | | 830 | | | | 940,753 | |
Series A, 5.25%, 01/01/42 | | | 1,110 | | | | 1,316,847 | |
Series A, 5.00%, 01/01/47 | | | 1,570 | | | | 1,805,994 | |
Massachusetts Development Finance Agency, Refunding RB | | | | | | | | |
4.00%, 07/01/39 | | | 1,140 | | | | 1,255,473 | |
5.00%, 04/15/40 | | | 400 | | | | 438,701 | |
5.00%, 09/01/43 | | | 750 | | | | 890,036 | |
Series A, 5.00%, 10/01/35 | | | 500 | | | | 587,428 | |
Series A, 5.00%, 01/01/40 | | | 435 | | | | 515,780 | |
Series A, 5.00%, 10/01/43 | | | 750 | | | | 861,721 | |
Series A, 4.00%, 06/01/49 | | | 225 | | | | 249,856 | |
| | | | | | | | |
| Security | | Par (000) | | | Value | |
| | |
| Massachusetts (continued) | | | | | | |
Massachusetts Development Finance Agency, Refunding RB (continued) | | | | | | | | |
Series P, 5.45%, 05/15/59 | | $ | 2,010 | | | $ | 2,592,022 | |
Massachusetts Educational Financing Authority, RB | | | | | | | | |
Series B, AMT, 2.63%, 07/01/36 | | | 475 | | | | 494,568 | |
AMT, Subordinate, 3.75%, 07/01/47 | | | 1,865 | | | | 1,922,254 | |
Massachusetts Educational Financing Authority, Refunding RB | | | | | | | | |
Series A, AMT, 3.63%, 07/01/32 | | | 1,025 | | | | 1,063,738 | |
Series B, AMT, 3.63%, 07/01/34 | | | 485 | | | | 505,222 | |
Massachusetts Housing Finance Agency, RB, M/F Housing | | | | | | | | |
Series A, 3.80%, 12/01/43 | | | 160 | | | | 171,788 | |
Series A, 3.85%, 06/01/46 | | | 205 | | | | 217,061 | |
Series C-1, 3.15%, 12/01/49 | | | 400 | | | | 405,983 | |
Series C-1, 3.25%, 12/01/54 | | | 1,475 | | | | 1,498,448 | |
Series D-1, 2.55%, 12/01/50 | | | 420 | | | | 409,487 | |
Massachusetts Port Authority, ARB, Series E, AMT, 5.00%, 07/01/51 | | | 3,100 | | | | 3,857,194 | |
| | | | | | | | |
| | |
| | | | | | | 23,307,163 | |
| | |
| Michigan — 3.1% | | | | | | |
City of Detroit Michigan Sewage Disposal System Revenue, Refunding RB, Series A, Senior Lien, 5.25%, 07/01/22(b) | | | 5,320 | | | | 5,497,906 | |
City of Detroit Michigan Water Supply System Revenue, RB, Series B, 2nd Lien, (AGM), 6.25%, 07/01/36 | | | 5 | | | | 5,021 | |
Eastern Michigan University, RB, Series A, 4.00%, 03/01/47 | | | 1,170 | | | | 1,295,163 | |
Michigan Finance Authority, RB | | | | | | | | |
Series S, 5.00%, 11/01/44 | | | 1,555 | | | | 1,786,361 | |
Series C-2, AMT, Senior Lien, 5.00%, 07/01/22(b) | | | 240 | | | | 247,497 | |
Series C-1, Senior Lien, 5.00%, 07/01/22(b) | | | 455 | | | | 469,462 | |
Michigan Finance Authority, Refunding RB | | | | | | | | |
5.00%, 11/15/41 | | | 5,560 | | | | 6,500,602 | |
4.00%, 11/15/46 | | | 570 | | | | 624,189 | |
Series A, 4.00%, 12/01/49 | | | 590 | | | | 663,889 | |
Michigan State Hospital Finance Authority, Refunding RB | | | | | | | | |
5.00%, 11/15/47 | | | 215 | | | | 266,058 | |
Series C, 4.00%, 06/01/22(b) | | | 2,100 | | | | 2,146,246 | |
Michigan State Housing Development Authority, RB, M/F Housing | | | | | | | | |
Series A, 3.80%, 10/01/38 | | | 1,690 | | | | 1,837,427 | |
Series A, 4.15%, 10/01/53 | | | 940 | | | | 1,009,503 | |
Series A, 2.70%, 10/01/56 | | | 2,655 | | | | 2,610,834 | |
Michigan State Housing Development Authority, RB, S/F Housing, Series A, 4.00%, 06/01/49 | | | 80 | | | | 83,070 | |
Michigan State University, Refunding RB, Series B, 5.00%, 02/15/48 | | | 730 | | | | 898,649 | |
Michigan Strategic Fund, RB, AMT, 5.00%, 06/30/48 | | | 1,795 | | | | 2,106,538 | |
| | | | | | | | |
| | |
| | | | | | | 28,048,415 | |
| | |
| Minnesota — 1.2% | | | | | | |
City of Maple Grove Minnesota, Refunding RB, 4.00%, 05/01/37 | | | 880 | | | | 974,598 | |
City of Minneapolis Minnesota, Refunding RB, Series A, 5.00%, 11/15/49 | | | 560 | | | | 661,323 | |
| | |
SCHEDULE OF INVESTMENTS | | 41 |
| | |
Schedule of Investments (unaudited) (continued) October 31, 2021 | | BlackRock MuniHoldings Fund, Inc. (MHD) (Percentages shown are based on Net Assets) |
| | | | | | | | |
| Security | | Par (000) | | | Value | |
| | |
| Minnesota (continued) | | | | | | |
City of Otsego Minnesota, Refunding RB, Series A, 5.00%, 09/01/44 | | $ | 425 | | | $ | 446,305 | |
City of Spring Lake Park Minnesota, RB, 5.00%, 06/15/39 | | | 1,080 | | | | 1,185,112 | |
Duluth Economic Development Authority, Refunding RB | | | | | | | | |
Series A, 4.25%, 02/15/48 | | | 3,800 | | | | 4,166,635 | |
Series A, 5.25%, 02/15/53 | | | 1,500 | | | | 1,776,977 | |
Series A, 5.25%, 02/15/58 | | | 520 | | | | 616,083 | |
Housing & Redevelopment Authority of The City of St. Paul Minnesota, Refunding RB, Series A, 4.00%, 11/15/43 | | | 575 | | | | 629,741 | |
Minneapolis-St. Paul Metropolitan Airports Commission, Refunding RB, Sub Series D, AMT, 5.00%, 01/01/41 | | | 290 | | | | 341,738 | |
Minnesota Higher Education Facilities Authority, RB, Series 8-K, 4.00%, 03/01/43 | | | 385 | | | | 411,548 | |
| | | | | | | | |
| | |
| | | | | | | 11,210,060 | |
| | |
| Mississippi — 1.0% | | | | | | |
County of Warren Mississippi, RB, Series A, 5.38%, 12/01/35 | | | 400 | | | | 401,553 | |
Mississippi Development Bank, RB, (AGM), 6.88%, 12/01/40 | | | 3,595 | | | | 3,995,976 | |
Mississippi State University Educational Building Corp., Refunding RB, 5.25%, 08/01/23(b) | | | 2,000 | | | | 2,172,612 | |
State of Mississippi, RB | | | | | | | | |
Series A, 5.00%, 10/15/37 | | | 330 | | | | 401,043 | |
Series A, 4.00%, 10/15/38 | | | 1,650 | | | | 1,871,504 | |
| | | | | | | | |
| | |
| | | | | | | 8,842,688 | |
| | |
| Missouri — 1.2% | | | | | | |
Health & Educational Facilities Authority of the State of Missouri, RB | | | | | | | | |
4.13%, 02/15/43 | | | 300 | | | | 302,666 | |
4.00%, 06/01/53 | | | 2,075 | | �� | | 2,311,610 | |
Series A, 5.00%, 10/01/23(b) | | | 500 | | | | 546,143 | |
Series A, 5.00%, 06/01/42 | | | 540 | | | | 641,697 | |
Series C-2, 5.00%, 10/01/34 | | | 1,000 | | | | 1,084,331 | |
Health & Educational Facilities Authority of the State of Missouri, Refunding RB | | | | | | | | |
5.50%, 05/01/43 | | | 305 | | | | 323,044 | |
Series A, 4.00%, 07/01/46 | | | 1,670 | | | | 1,934,079 | |
Kansas City Industrial Development Authority, ARB, AMT, (AGM), 4.00%, 03/01/57 | | | 615 | | | | 686,506 | |
Missouri Development Finance Board, RB, Series B, 5.00%, 11/01/41 | | | 900 | | | | 900,000 | |
Missouri Housing Development Commission, RB, S/F Housing | | | | | | | | |
(FHLMC, FNMA, GNMA), 2.35%, 11/01/46 | | | 1,150 | | | | 1,100,625 | |
(FHLMC, FNMA, GNMA), 2.40%, 11/01/51 | | | 1,200 | | | | 1,135,268 | |
| | | | | | | | |
| | |
| | | | | | | 10,965,969 | |
| | |
| Montana — 0.0% | | | | | | |
Montana Board of Housing, RB, S/F Housing | | | | | | | | |
Series B-2, 3.50%, 12/01/42 | | | 85 | | | | 89,362 | |
Series B-2, 3.60%, 12/01/47 | | | 135 | | | | 141,412 | |
| | | | | | | | |
| | |
| | | | | | | 230,774 | |
| | |
| Nebraska — 0.3% | | | | | | |
Central Plains Energy Project, RB 5.25%, 09/01/37 | | | 575 | | | | 597,954 | |
| | | | | | | | |
| Security | | Par (000) | | | Value | |
| | |
| Nebraska (continued) | | | | | | |
Central Plains Energy Project, RB (continued) 5.00%, 09/01/42 | | $ | 600 | | | $ | 622,840 | |
Douglas County Hospital Authority No.3, Refunding RB, 5.00%, 11/01/45 | | | 400 | | | | 456,959 | |
Nebraska Public Power District Refunding RB | | | | | | | | |
Series A, 5.00%, 01/01/32 | | | 250 | | | | 251,949 | |
Series A, 4.00%, 01/01/44 | | | 400 | | | | 402,527 | |
| | | | | | | | |
| | |
| | | | | | | 2,332,229 | |
| | |
| Nevada — 1.3% | | | | | | |
City of Carson City Nevada, Refunding RB, 5.00%, 09/01/42 | | | 650 | | | | 760,062 | |
City of Las Vegas Nevada Special Improvement District No.809, SAB, 5.65%, 06/01/23 | | | 195 | | | | 195,803 | |
City of Reno Nevada, Refunding RB | | | | | | | | |
Series A-1, (AGM), 4.00%, 06/01/43 | | | 1,570 | | | | 1,736,414 | |
Series A-1, (AGM), 4.00%, 06/01/46 | | | 1,250 | | | | 1,369,816 | |
County of Clark Department of Aviation, Refunding RB, Series A-2, Sub Lien, 4.25%, 07/01/36 | | | 1,000 | | | | 1,091,861 | |
County of Clark Nevada, GO | | | | | | | | |
Series A, 5.00%, 06/01/36 | | | 1,205 | | | | 1,474,039 | |
Series A, 5.00%, 06/01/37 | | | 3,000 | | | | 3,670,083 | |
Tahoe-Douglas Visitors Authority, RB | | | | | | | | |
5.00%, 07/01/40 | | | 285 | | | | 330,218 | |
5.00%, 07/01/45 | | | 350 | | | | 399,531 | |
5.00%, 07/01/51 | | | 380 | | | | 429,443 | |
| | | | | | | | |
| | |
| | | | | | | 11,457,270 | |
| | |
| New Hampshire — 0.6% | | | | | | |
New Hampshire Business Finance Authority, Refunding RB(a) | | | | | | | | |
Series A, 3.63%, 07/01/43(e) | | | 430 | | | | 455,511 | |
Series B, 4.63%, 11/01/42 | | | 2,095 | | | | 2,182,030 | |
Series B, AMT, 3.75%, 07/01/45(e) | | | 395 | | | | 416,879 | |
Series C, AMT, 4.88%, 11/01/42 | | | 1,140 | | | | 1,191,975 | |
New Hampshire Housing Finance Authority, RB, M/F Housing, Series 1, (FHA), 4.00%, 07/01/52 | | | 800 | | | | 842,301 | |
| | | | | | | | |
| | |
| | | | | | | 5,088,696 | |
| | |
| New Jersey — 10.5% | | | | | | |
Casino Reinvestment Development Authority, Inc., Refunding RB | | | | | | | | |
5.25%, 11/01/39 | | | 1,265 | | | | 1,399,473 | |
5.25%, 11/01/44 | | | 1,885 | | | | 2,053,069 | |
Hudson County Improvement Authority, RB, 4.00%, 10/01/46 | | | 1,195 | | | | 1,374,698 | |
New Jersey Economic Development Authority, RB | | | | | | | | |
5.00%, 06/15/36 | | | 460 | | | | 568,290 | |
4.00%, 11/01/38 | | | 370 | | | | 418,133 | |
4.00%, 11/01/39 | | | 295 | | | | 331,711 | |
5.00%, 06/15/49 | | | 1,670 | | | | 2,001,557 | |
Series A, 5.00%, 06/15/47 | | | 2,500 | | | | 2,947,955 | |
Series B, 4.50%, 06/15/40 | | | 1,270 | | | | 1,489,716 | |
Series EEE, 5.00%, 06/15/43 | | | 160 | | | | 192,997 | |
Series EEE, 5.00%, 06/15/48 | | | 2,705 | | | | 3,234,571 | |
Series LLL, 5.00%, 06/15/34 | | | 365 | | | | 452,870 | |
Series UU, 5.00%, 06/15/24(b) | | | 80 | | | | 89,661 | |
Series UU, 5.00%, 06/15/40 | | | 345 | | | | 376,714 | |
Series WW, 5.00%, 06/15/36 | | | 210 | | | | 238,598 | |
AMT, 5.13%, 09/15/23 | | | 1,300 | | | | 1,353,877 | |
AMT, (AGM), 5.00%, 01/01/31 | | | 790 | | | | 857,494 | |
AMT, (AGM), 5.13%, 07/01/42 | | | 200 | | | | 216,130 | |
| | |
| 42 | | 2 0 2 1 BLACK ROCK SEMI - ANNUAL REPORT TO SHAREHOLDERS |
| | |
Schedule of Investments (unaudited) (continued) October 31, 2021 | | BlackRock MuniHoldings Fund, Inc. (MHD) (Percentages shown are based on Net Assets) |
| | | | | | | | |
| Security | | Par (000) | | | Value | |
| | |
| New Jersey (continued) | | | | | | |
New Jersey Economic Development Authority, RB (continued) | | | | | | | | |
AMT, 5.38%, 01/01/43 | | $ | 3,000 | | | $ | 3,290,727 | |
Series B, AMT, 5.63%, 11/15/30 | | | 660 | | | | 723,171 | |
New Jersey Economic Development Authority, Refunding ARB, AMT, 5.00%, 10/01/47 | | | 1,060 | | | | 1,218,106 | |
New Jersey Economic Development Authority, Refunding SAB | | | | | | | | |
6.50%, 04/01/28 | | | 5,000 | | | | 5,512,935 | |
5.75%, 04/01/31 | | | 2,675 | | | | 2,852,928 | |
New Jersey Educational Facilities Authority, Refunding RB, Series A, 5.00%, 07/01/42 | | | 1,450 | | | | 1,696,590 | |
New Jersey Health Care Facilities Financing Authority, RB, 4.00%, 07/01/47 | | | 300 | | | | 327,535 | |
New Jersey Health Care Facilities Financing Authority, Refunding RB | | | | | | | | |
5.00%, 10/01/37 | | | 685 | | | | 803,790 | |
Series A, 5.00%, 07/01/22(b) | | | 500 | | | | 515,902 | |
New Jersey Higher Education Student Assistance Authority, RB, Series B, AMT, 3.50%, 12/01/39 | | | 680 | | | | 721,222 | |
New Jersey Housing & Mortgage Finance Agency, Refunding RB, Series A, AMT, 3.80%, 10/01/32 | | | 1,200 | | | | 1,303,070 | |
New Jersey Transportation Trust Fund Authority, RB | | | | | | | | |
5.00%, 06/15/46 | | | 2,070 | | | | 2,488,417 | |
Series AA, 4.13%, 06/15/39 | | | 1,040 | | | | 1,188,350 | |
Series AA, 5.50%, 06/15/39 | | | 3,510 | | | | 3,769,449 | |
Series AA, 5.00%, 06/15/44 | | | 1,835 | | | | 1,964,289 | |
Series AA, 5.00%, 06/15/45 | | | 1,325 | | | | 1,536,520 | |
Series AA, 5.00%, 06/15/46 | | | 400 | | | | 446,220 | |
Series AA, 3.00%, 06/15/50 | | | 130 | | | | 133,804 | |
Series BB, 4.00%, 06/15/50 | | | 1,980 | | | | 2,200,946 | |
Series BB, 5.00%, 06/15/50 | | | 3,720 | | | | 4,424,921 | |
Series S, 5.25%, 06/15/43 | | | 2,810 | | | | 3,460,754 | |
New Jersey Transportation Trust Fund Authority, RB, CAB, Series A, 0.00%, 12/15/35(c) | | | 1,000 | | | | 712,127 | |
New Jersey Transportation Trust Fund Authority, Refunding RB | | | | | | | | |
4.00%, 12/15/39 | | | 510 | | | | 576,739 | |
Series A, 5.00%, 12/15/32 | | | 1,600 | | | | 1,958,277 | |
Series A, 5.00%, 12/15/36 | | | 720 | | | | 872,600 | |
New Jersey Turnpike Authority, RB | | | | | | | | |
Series A, 5.00%, 07/01/22(b) | | | 715 | | | | 737,731 | |
Series A, 4.00%, 01/01/42 | | | 845 | | | | 981,255 | |
Series A, 4.00%, 01/01/48 | | | 270 | | | | 303,705 | |
Series A, 5.00%, 07/01/22 | | | 1,120 | | | | 1,155,607 | |
Series E, 5.00%, 01/01/45 | | | 4,450 | | | | 4,986,367 | |
South Jersey Port Corp., ARB, Series B, AMT, 5.00%, 01/01/35 | | | 625 | | | | 735,097 | |
South Jersey Transportation Authority, RB, Series A, 4.00%, 11/01/50 | | | 275 | | | | 307,613 | |
State of New Jersey, GO | | | | | | | | |
Series A, 4.00%, 06/01/31 | | | 925 | | | | 1,120,818 | |
Series A, 3.00%, 06/01/32 | | | 935 | | | | 1,039,621 | |
Tobacco Settlement Financing Corp., Refunding RB | | | | | | | | |
Series A, 5.00%, 06/01/35 | | | 1,340 | | | | 1,605,398 | |
Series A, 4.00%, 06/01/37 | | | 500 | | | | 564,736 | |
| | | | | | | | |
| Security | | Par (000) | | | Value | |
| | |
| New Jersey (continued) | | | | | | |
Tobacco Settlement Financing Corp., Refunding RB (continued) | | | | | | | | |
Series A, 5.25%, 06/01/46 | | $ | 4,955 | | | $ | 5,930,927 | |
Sub-Series B, 5.00%, 06/01/46 | | | 10,110 | | | | 11,636,812 | |
| | | | | | | | |
| | |
| | | | | | | 95,402,590 | |
| | |
| New Mexico — 0.1% | | | | | | |
City of Santa Fe New Mexico, RB, Series A, 5.00%, 05/15/44 | | | 200 | | | | 221,623 | |
New Mexico Hospital Equipment Loan Council, Refunding RB, Series VIC, 5.00%, 08/01/44 | | | 450 | | | | 510,307 | |
| | | | | | | | |
| | |
| | | | | | | 731,930 | |
| | |
| New York — 11.5% | | | | | | |
City of New York, GO | | | | | | | | |
Series A -1, 4.00%, 08/01/50 | | | 10,000 | | | | 11,546,140 | |
Series C, 5.00%, 08/01/42 | | | 805 | | | | 1,010,191 | |
Erie Tobacco Asset Securitization Corp., Refunding RB, Series A, 5.00%, 06/01/45 | | | 3,585 | | | | 3,610,425 | |
Hudson Yards Infrastructure Corp., RB, 5.75%, 02/15/47 | | | 815 | | | | 815,934 | |
Metropolitan Transportation Authority, RB | | | | | | | | |
Series A, 5.25%, 11/15/21(b) | | | 1,565 | | | | 1,567,750 | |
Series A-1, 5.25%, 11/15/39 | | | 1,000 | | | | 1,073,320 | |
Series B, 5.25%, 11/15/38 | | | 2,970 | | | | 3,261,823 | |
Metropolitan Transportation Authority, Refunding RB | | | | | | | | |
Series C-1, 4.75%, 11/15/45 | | | 1,950 | | | | 2,282,001 | |
Series C-1, 5.00%, 11/15/50 | | | 370 | | | | 438,555 | |
Series C-1, 5.25%, 11/15/55 | | | 1,040 | | | | 1,253,151 | |
Series C-1, 5.00%, 11/15/56 | | | 2,670 | | | | 3,022,883 | |
Series C-1, 5.25%, 11/15/56 | | | 10 | | | | 11,563 | |
Monroe County Industrial Development Corp., Refunding RB | | | | | | | | |
4.00%, 12/01/46 | | | 1,000 | | | | 1,125,899 | |
Series A, 4.00%, 07/01/50 | | | 770 | | | | 883,925 | |
New York City Housing Development Corp., RB, M/F Housing | | | | | | | | |
Series A, 3.00%, 11/01/55 | | | 1,505 | | | | 1,526,245 | |
Series F-1, (FHA), 2.40%, 11/01/46 | | | 7,050 | | | | 6,710,669 | |
Series F-1, (FHA), 2.50%, 11/01/51 | | | 4,860 | | | | 4,776,889 | |
Series I-1, (FHA 542 (C)), 2.55%, 11/01/45 | | | 1,200 | | | | 1,182,569 | |
Series I-1, (FHA 542 (C)), 2.65%, 11/01/50 | | | 3,205 | | | | 3,158,534 | |
Series I-1, (FHA 542 (C)), 2.70%, 11/01/55 | | | 950 | | | | 937,761 | |
New York City Industrial Development Agency, Refunding RB | | | | | | | | |
(AGM), 3.00%, 03/01/49 | | | 775 | | | | 801,611 | |
3.00%, 03/01/49 | | | 605 | | | | 616,710 | |
Series A, Class A, (AGM), 3.00%, 01/01/37 | | | 155 | | | | 166,736 | |
Series A, Class A, (AGM), 3.00%, 01/01/39 | | | 155 | | | | 166,096 | |
Series A, Class A, (AGM), 3.00%, 01/01/40 | | | 110 | | | | 117,505 | |
New York City Transitional Finance Authority Future Tax Secured Revenue, RB | | | | | | | | |
Sub-Series E-1, 5.00%, 02/01/42 | | | 1,050 | | | | 1,061,772 | |
Series C, Subordinate, 4.00%, 05/01/45 | | | 1,615 | | | | 1,859,285 | |
Sub-Series C-1, Subordinate, 4.00%, 05/01/40 | | | 310 | | | | 360,449 | |
New York City Water & Sewer System, Refunding RB, Series CC, 5.00%, 06/15/47 | | | 1,000 | | | | 1,067,556 | |
New York Counties Tobacco Trust IV, Refunding RB Series A, 5.00%, 06/01/38 | | | 1,410 | | | | 1,411,438 | |
| | |
SCHEDULE OF INVESTMENTS | | 43 |
| | |
Schedule of Investments (unaudited) (continued) October 31, 2021 | | BlackRock MuniHoldings Fund, Inc. (MHD) (Percentages shown are based on Net Assets) |
| | | | | | | | |
| Security | | Par (000) | | | Value | |
| | |
| New York (continued) | | | | | | |
New York Counties Tobacco Trust IV, Refunding RB (continued) | | | | | | | | |
Series A, 6.25%, 06/01/41(a) | | $ | 3,200 | | | $ | 3,245,219 | |
New York Counties Tobacco Trust VI, Refunding RB, Series A-2-B, 5.00%, 06/01/45 | | | 500 | | | | 565,450 | |
New York Liberty Development Corp., Refunding RB 2.88%, 11/15/46 | | | 9,305 | | | | 9,323,117 | |
Series 1, Class 1, 5.00%, 11/15/44(a) | | | 6,005 | | | | 6,559,268 | |
Series 2, Class 2, 5.15%, 11/15/34(a) | | | 420 | | | | 469,280 | |
Series 2, Class 2, 5.38%, 11/15/40(a) | | | 1,450 | | | | 1,622,733 | |
New York Power Authority, Refunding RB, Series A, 4.00%, 11/15/60 | | | 670 | | | | 766,986 | |
New York State Environmental Facilities Corp., RB, Series B, Subordinate, 5.00%, 06/15/48 | | | 1,305 | | | | 1,600,560 | |
New York State Housing Finance Agency, RB, M/F Housing, Series L-1, (SONYMA), 2.50%, 11/01/45 | | | 1,605 | | | | 1,549,674 | |
New York State Thruway Authority, Refunding RB, Series B, Subordinate, 3.00%, 01/01/46 | | | 900 | | | | 938,660 | |
New York State Urban Development Corp., RB | | | | | | | | |
Series A, 4.00%, 03/15/49 | | | 5,700 | | | | 6,502,019 | |
Series A, 3.00%, 03/15/50 | | | 930 | | | | 964,924 | |
New York Transportation Development Corp., RB | | | | | | | | |
AMT, 5.00%, 10/01/35 | | | 640 | | | | 790,519 | |
AMT, 5.00%, 10/01/40 | | | 1,825 | | | | 2,222,536 | |
Port Authority of New York & New Jersey, Refunding ARB, Series 223, AMT, 4.00%, 07/15/41 | | | 1,075 | | | | 1,251,013 | |
State of New York Mortgage Agency, Refunding RB, S/F Housing, Series 211, 3.75%, 10/01/43 | | | 1,190 | | | | 1,263,343 | |
Triborough Bridge & Tunnel Authority, RB | | | | | | | | |
Series A, 4.00%, 11/15/54 | | | 710 | | | | 819,637 | |
Series A, 5.00%, 11/15/54 | | | 610 | | | | 759,984 | |
Series A, 5.00%, 11/15/56 | | | 2,480 | | | | 3,109,315 | |
TSASC, Inc., Refunding RB, Series A, 5.00%, 06/01/41 | | | 535 | | | | 623,289 | |
Westchester County Healthcare Corp., RB, Series A, Senior Lien, 5.00%, 11/01/44 | | | 456 | | | | 497,436 | |
Westchester Tobacco Asset Securitization Corp., Refunding RB, Sub-Series C, 4.00%, 06/01/42 | | | 365 | | | | 394,948 | |
| | | | | | | | |
| | |
| | | | | | | 103,665,295 | |
| | |
| North Carolina — 0.9% | | | | | | |
County of Union North Carolina Enterprise System Revenue, RB, 3.00%, 06/01/51 | | | 5,740 | | | | 6,106,763 | |
North Carolina Medical Care Commission, RB 4.00%, 11/01/52 | | | 400 | | | | 451,344 | |
Series A, 4.00%, 10/01/50 | | | 115 | | | | 127,404 | |
Series A, 5.00%, 10/01/50 | | | 305 | | | | 361,563 | |
University of North Carolina at Chapel Hill, RB, 5.00%, 02/01/49 | | | 550 | | | | 827,866 | |
| | | | | | | | |
| | |
| | | | | | | 7,874,940 | |
| | |
| North Dakota — 0.1% | | | | | | |
County of Cass North Dakota, Refunding RB, Series B, 5.25%, 02/15/58 | | | 695 | | | | 821,098 | |
| | | | | | | | |
| | |
| Ohio — 3.9% | | | | | | |
Buckeye Tobacco Settlement Financing Authority, Refunding RB | | | | | | | | |
Series A-2, Class 1, 4.00%, 06/01/37 | | | 210 | | | | 240,583 | |
Series A-2, Class 1, 4.00%, 06/01/38 | | | 210 | | | | 239,251 | |
Series A-2, Class 1, 4.00%, 06/01/39 | | | 210 | | | | 238,550 | |
Series A-2, Class 1, 3.00%, 06/01/48 | | | 1,505 | | | | 1,507,277 | |
| | | | | | | | |
| Security | | Par (000) | | | Value | |
| | |
| Ohio (continued) | | | | | | |
Buckeye Tobacco Settlement Financing Authority, Refunding RB (continued) | | | | | | | | |
Series A-2, Class 1, 4.00%, 06/01/48 | | $ | 550 | | | $ | 608,193 | |
Series B-2, Class 2, 5.00%, 06/01/55 | | | 10,715 | | | | 12,040,660 | |
City of Dayton Ohio Airport Revenue, Refunding RB, Series A, AMT, (AGM), 4.00%, 12/01/32 | | | 2,000 | | | | 2,040,022 | |
County of Franklin Ohio, RB | | | | | | | | |
Series 2017, 5.00%, 12/01/46 | | | 290 | | | | 345,889 | |
Series A, 6.13%, 07/01/22(b) | | | 820 | | | | 852,134 | |
Series A, 4.00%, 12/01/49 | | | 365 | | | | 417,162 | |
County of Hamilton Ohio, Refunding RB | | | | | | | | |
4.00%, 08/15/50 | | | 1,085 | | | | 1,220,528 | |
Series A, 3.75%, 08/15/50 | | | 755 | | | | 822,297 | |
County of Montgomery Ohio, Refunding RB | | | | | | | | |
4.00%, 11/15/42 | | | 655 | | | | 735,772 | |
4.00%, 08/01/46(i) | | | 2,525 | | | | 2,893,428 | |
4.00%, 08/01/51 | | | 810 | | | | 932,794 | |
Northwest Local School District/Hamilton & Butler Counties, GO, 4.00%, 12/01/50 | | | 1,135 | | | | 1,192,719 | |
Ohio Air Quality Development Authority, RB, AMT, 5.00%, 07/01/49(a) | | | 1,335 | | | | 1,531,358 | |
Ohio Housing Finance Agency, RB, S/F Housing, Series A, (FHLMC, FNMA, GNMA), 4.00%, 09/01/48 | | | 80 | | | | 85,036 | |
Ohio Turnpike & Infrastructure Commission, RB, Series A-1, Junior Lien, 5.25%, 02/15/31 | | | 2,470 | | | | 2,620,793 | |
State of Ohio, RB, AMT, 5.00%, 06/30/53 | | | 1,000 | | | | 1,099,640 | |
State of Ohio, Refunding RB | | | | | | | | |
Series A, 5.00%, 01/15/41 | | | 1,500 | | | | 1,513,220 | |
Series A, 4.00%, 01/15/50 | | | 2,250 | | | | 2,521,258 | |
| | | | | | | | |
| | |
| | | | | | | 35,698,564 | |
| | |
| Oklahoma — 0.8% | | | | | | |
Oklahoma City Public Property Authority, Refunding RB, 5.00%, 10/01/39 | | | 720 | | | | 830,432 | |
Oklahoma Development Finance Authority, RB | | | | | | | | |
Series B, 5.25%, 08/15/48 | | | 1,460 | | | | 1,756,345 | |
Series B, 5.50%, 08/15/57 | | | 625 | | | | 760,661 | |
Oklahoma State University, RB, Series A, 4.00%, 09/01/46 | | | 500 | | | | 590,898 | |
Oklahoma Turnpike Authority, RB | | | | | | | | |
Series A, 4.00%, 01/01/48 | | | 1,780 | | | | 2,008,977 | |
Series C, 4.00%, 01/01/42 | | | 1,420 | | | | 1,610,172 | |
| | | | | | | | |
| | |
| | | | | | | 7,557,485 | |
| | |
| Oregon — 1.0% | | | | | | |
Clackamas County School District No.12 North Clackamas, GO, CAB, Series A, (GTD), 0.00%, 06/15/38(c) | | | 510 | | | | 285,281 | |
Medford Hospital Facilities Authority, Refunding RB, Series A, 4.00%, 08/15/50 | | | 1,210 | | | | 1,375,464 | |
Multnomah & Clackamas Counties School District No.10JT Gresham-Barlow, GO, CAB, Series A, (GTY), 0.00%, 06/15/38(c) | | | 530 | | | | 327,662 | |
Oregon Health & Science University, RB | | | | | | | | |
Series A, 4.00%, 07/01/37 | | | 675 | | | | 762,859 | |
Series A, 5.00%, 07/01/42 | | | 600 | | | | 714,830 | |
Oregon State Facilities Authority, Refunding RB, Series A, 5.00%, 04/01/45 | | | 1,475 | | | | 1,661,163 | |
Port of Portland Oregon Airport Revenue, Refunding ARB, Series 27-A, AMT, 5.00%, 07/01/45 | | | 1,290 | | | | 1,567,598 | |
| | |
| 44 | | 2 0 2 1 BLACK ROCK SEMI - ANNUAL REPORT TO SHAREHOLDERS |
| | |
Schedule of Investments (unaudited) (continued) October 31, 2021 | | BlackRock MuniHoldings Fund, Inc. (MHD) (Percentages shown are based on Net Assets) |
| | | | | | | | |
| Security | | Par (000) | | | Value | |
| | |
| Oregon (continued) | | | | | | |
Salem-Keizer School District No.24J, GO, CAB, Series A, (GTY), 0.00%, 06/15/40(c) | | $ | 1,980 | | | $ | 1,219,321 | |
State of Oregon Housing & Community Services Department, RB, S/F Housing, Series C, 3.95%, 07/01/43 | | | 140 | | | | 144,623 | |
Warm Springs Reservation Confederated Tribe, Refunding RB, Series B, 5.00%, 11/01/39(a) | | | 650 | | | | 765,286 | |
| | | | | | | | |
| | |
| | | | | | | 8,824,087 | |
| | |
| Pennsylvania — 5.2% | | | | | | |
Altoona Area School District, GO, (BAM, SAW), 5.00%, 12/01/25(b) | | | 110 | | | | 129,474 | |
Bristol Township School District, GO, (SAW), 5.25%, 06/01/37 | | | 2,500 | | | | 2,685,145 | |
Bucks County Industrial Development Authority, RB, 4.00%, 08/15/50 | | | 1,305 | | | | 1,423,638 | |
Commonwealth Financing Authority, RB | | | | | | | | |
5.00%, 06/01/33 | | | 335 | | | | 408,195 | |
5.00%, 06/01/34 | | | 750 | | | | 912,369 | |
(AGM), 4.00%, 06/01/39 | | | 1,365 | | | | 1,543,658 | |
County of Lehigh Pennsylvania, Refunding RB, Series A, 4.00%, 07/01/49 | | | 420 | | | | 470,474 | |
Delaware River Port Authority, RB, 4.50%, 01/01/32 | | | 1,500 | | | | 1,631,070 | |
Hospitals & Higher Education Facilities Authority of Philadelphia, RB, Series A, 5.63%, 07/01/42 | | | 795 | | | | 817,991 | |
Lancaster Industrial Development Authority, RB, 5.00%, 12/01/49 | | | 950 | | | | 1,102,253 | |
Montgomery County Higher Education and Health Authority, Refunding RB | | | | | | | | |
4.00%, 09/01/49 | | | 715 | | | | 806,198 | |
Series A, 5.00%, 09/01/43 | | | 905 | | | | 1,094,129 | |
Series A, 5.00%, 09/01/48 | | | 980 | | | | 1,178,322 | |
Series A, 4.00%, 09/01/49 | | | 1,380 | | | | 1,526,419 | |
Pennsylvania Economic Development Financing Authority, RB | | | | | | | | |
Series A-1, 4.00%, 04/15/50 | | | 470 | | | | 534,117 | |
AMT, 5.00%, 12/31/38 | | | 390 | | | | 458,262 | |
AMT, 5.00%, 06/30/42 | | | 2,455 | | | | 2,826,606 | |
Pennsylvania Economic Development Financing Authority, Refunding RB, AMT, 5.50%, 11/01/44 | | | 1,905 | | | | 2,012,680 | |
Pennsylvania Higher Education Assistance Agency, RB, Series B, AMT, Subordinate, 3.00%, 06/01/47 | | | 100 | | | | 94,599 | |
Pennsylvania Higher Educational Facilities Authority, RB, 4.00%, 08/15/49 | | | 1,680 | | | | 1,919,595 | |
Pennsylvania Housing Finance Agency, RB, S/F Housing | | | | | | | | |
Series 125B, AMT, 3.65%, 10/01/42 | | | 1,000 | | | | 1,062,232 | |
Series 128B, AMT, 3.85%, 04/01/38 | | | 965 | | | | 1,052,474 | |
Pennsylvania Housing Finance Agency, Refunding RB, S/F Housing, Series 119, AMT, 3.50%, 10/01/36 | | | 1,075 | | | | 1,095,753 | |
Pennsylvania Turnpike Commission, RB | | | | | | | | |
Series A, 5.00%, 12/01/44 | | | 1,380 | | | | 1,549,977 | |
Series C, 5.00%, 12/01/23(b) | | | 1,305 | | | | 1,431,809 | |
Series C, 5.00%, 12/01/43 | | | 415 | | | | 451,103 | |
Sub-Series B-1, 5.25%, 06/01/47 | | | 1,170 | | | | 1,396,581 | |
Series A, Subordinate, 5.00%, 12/01/44 | | | 2,080 | | | | 2,524,675 | |
Series A, Subordinate, 4.00%, 12/01/49 | | | 1,075 | | | | 1,201,611 | |
Series A, Subordinate, 4.00%, 12/01/50 | | | 610 | | | | 683,325 | |
| | | | | | | | |
| Security | | Par (000) | | | Value | |
| | |
| Pennsylvania (continued) | | | | | | |
Pennsylvania Turnpike Commission, Refunding RB, 2nd Series, 5.00%, 12/01/41 | | $ | 1,250 | | | $ | 1,489,975 | |
Pottsville Hospital Authority, Refunding RB, Series B, 5.00%, 07/01/45 | | | 1,250 | | | | 1,462,199 | |
School District of Philadelphia, GO, Series A, (SAW), 4.00%, 09/01/46(i) | | | 1,870 | | | | 2,131,187 | |
Springfield School District/Delaware County, GO | | | | | | | | |
(SAW), 5.00%, 03/01/40 | | | 865 | | | | 1,048,832 | |
(SAW), 5.00%, 03/01/43 | | | 590 | | | | 713,575 | |
Swarthmore Borough Authority, RB, 5.00%, 09/15/48 | | | 1,900 | | | | 2,333,762 | |
Westmoreland County Municipal Authority, Refunding RB, (BAM), 5.00%, 08/15/36 | | | 1,290 | | | | 1,536,800 | |
| | | | | | | | |
| | |
| | | | | | | 46,741,064 | |
| | |
| Puerto Rico — 5.6% | | | | | | |
Children’s Trust Fund, Refunding RB | | | | | | | | |
5.50%, 05/15/39 | | | 1,115 | | | | 1,142,383 | |
5.63%, 05/15/43 | | | 1,200 | | | | 1,213,818 | |
Puerto Rico Commonwealth Aqueduct & Sewer Authority, RB | | | | | | | | |
Series A, Senior Lien, 5.00%, 07/01/33 | | | 4,505 | | | | 4,648,223 | |
Series A, Senior Lien, 5.13%, 07/01/37 | | | 1,270 | | | | 1,311,407 | |
Puerto Rico Sales Tax Financing Corp. Sales Tax Revenue, RB | | | | | | | | |
Series A-1, Restructured, 4.75%, 07/01/53 | | | 9,061 | | | | 10,078,514 | |
Series A-1, Restructured, 5.00%, 07/01/58 | | | 17,440 | | | | 19,689,063 | |
Series A-2, Restructured, 4.33%, 07/01/40 | | | 2,508 | | | | 2,750,273 | |
Series A-2, Restructured, 4.78%, 07/01/58 | | | 2,097 | | | | 2,336,498 | |
Series B-1, Restructured, 4.75%, 07/01/53 | | | 425 | | | | 471,149 | |
Series B-2, Restructured, 4.78%, 07/01/58 | | | 412 | | | | 458,706 | |
Puerto Rico Sales Tax Financing Corp. Sales Tax Revenue, RB, CAB(c) | | | | | | | | |
Series A-1, Restructured, 0.00%, 07/01/46 | | | 18,474 | | | | 6,017,019 | |
Series A-1, Restructured, 0.00%, 07/01/51 | | | 1,442 | | | | 339,715 | |
| | | | | | | | |
| | |
| | | | | | | 50,456,768 | |
| | |
| Rhode Island — 1.9% | | | | | | |
Rhode Island Health and Educational Building Corp., Refunding RB, Series A, (AGM, GTD), 3.75%, 05/15/32 | | | 1,155 | | | | 1,306,443 | |
Rhode Island Housing and Mortgage Finance Corp., RB, M/F Housing, Series 3-B, (FHA INS), 4.13%, 10/01/49 | | | 480 | | | | 491,871 | |
Rhode Island Student Loan Authority, RB, Series A, AMT, 3.63%, 12/01/37 | | | 915 | | | | 950,891 | |
Tobacco Settlement Financing Corp., Refunding RB | | | | | | | | |
Series A, 5.00%, 06/01/35 | | | 1,000 | | | | 1,122,639 | |
Series A, 5.00%, 06/01/40 | | | 2,050 | | | | 2,278,528 | |
Series B, 4.50%, 06/01/45 | | | 6,005 | | | | 6,421,405 | |
Series B, 5.00%, 06/01/50 | | | 4,500 | | | | 4,928,269 | |
| | | | | | | | |
| | |
| | | | | | | 17,500,046 | |
| | |
| South Carolina — 4.4% | | | | | | |
Charleston County Airport District, ARB | | | | | | | | |
Series A, AMT, 5.50%, 07/01/38 | | | 1,000 | | | | 1,078,435 | |
Series A, AMT, 6.00%, 07/01/38 | | | 1,695 | | | | 1,841,933 | |
Series A, AMT, 5.50%, 07/01/41 | | | 1,000 | | | | 1,076,664 | |
County of Berkeley South Carolina, SAB | | | | | | | | |
4.25%, 11/01/40 | | | 315 | | | | 348,133 | |
4.38%, 11/01/49 | | | 470 | | | | 516,721 | |
| | |
SCHEDULE OF INVESTMENTS | | 45 |
| | |
Schedule of Investments (unaudited) (continued) October 31, 2021 | | BlackRock MuniHoldings Fund, Inc. (MHD) (Percentages shown are based on Net Assets) |
| | | | | | | | |
| Security | | Par (000) | | | Value | |
| | |
| South Carolina (continued) | | | | | | |
County of Charleston South Carolina, ARB, 5.25%, 12/01/38 | | $ | 3,705 | | | $ | 4,045,716 | |
South Carolina Jobs-Economic Development Authority, RB | | | | | | | | |
5.00%, 01/01/40(a) | | | 485 | | | | 516,768 | |
5.00%, 04/01/44 | | | 200 | | | | 227,346 | |
4.00%, 04/01/49 | | | 200 | | | | 214,365 | |
5.00%, 04/01/49 | | | 270 | | | | 302,711 | |
4.00%, 04/01/54 | | | 210 | | | | 224,530 | |
5.00%, 04/01/54 | | | 490 | | | | 547,661 | |
5.00%, 01/01/55(a) | | | 845 | | | | 879,223 | |
South Carolina Jobs-Economic Development Authority, Refunding RB | | | | | | | | |
5.00%, 02/01/38 | | | 2,875 | | | | 3,342,688 | |
Series A, 5.00%, 05/01/43 | | | 1,680 | | | | 1,997,930 | |
Series A, 4.25%, 05/01/48 | | | 1,445 | | | | 1,602,180 | |
Series A, 5.00%, 05/01/48 | | | 3,030 | | | | 3,575,442 | |
South Carolina Ports Authority, ARB | | | | | | | | |
AMT, 5.25%, 07/01/25(b) | | | 1,650 | | | | 1,929,599 | |
AMT, 5.00%, 07/01/55 | | | 710 | | | | 831,372 | |
South Carolina Public Service Authority, RB | | | | | | | | |
Series A, 5.50%, 12/01/54 | | | 4,450 | | | | 4,961,670 | |
Series E, 5.00%, 12/01/48 | | | 440 | | | | 476,478 | |
Series E, 5.50%, 12/01/53 | | | 2,500 | | | | 2,736,178 | |
South Carolina Public Service Authority, Refunding RB | | | | | | | | |
Series A, 5.00%, 12/01/36 | | | 175 | | | | 205,881 | |
Series A, 5.00%, 12/01/50 | | | 1,035 | | | | 1,168,989 | |
Series E, 5.25%, 12/01/55 | | | 4,685 | | | | 5,388,453 | |
| | | | | | | | |
| | |
| | | | | | | 40,037,066 | |
| | |
| South Dakota — 0.2% | | | | | | |
City of Rapid City South Dakota Sales Tax Revenue, RB, 4.00%, 12/01/26(b) | | | 740 | | | | 857,871 | |
South Dakota Health & Educational Facilities Authority, Refunding RB, Series A, 4.00%, 09/01/50 | | | 705 | | | | 791,815 | |
| | | | | | | | |
| | |
| | | | | | | 1,649,686 | |
| | |
| Tennessee — 1.6% | | | | | | |
Chattanooga Health Educational & Housing Facility Board, RB, Series A, 5.25%, 01/01/23(b) | | | 3,650 | | | | 3,862,408 | |
Chattanooga Health Educational & Housing Facility Board, Refunding RB, Series A, 4.00%, 08/01/44 | | | 115 | | | | 129,411 | |
Chattanooga-Hamilton County Hospital Authority, Refunding RB, Series A, 5.00%, 10/01/44 | | | 875 | | | | 960,952 | |
Greeneville Health & Educational Facilities Board, Refunding RB, Series A, 4.00%, 07/01/40 | | | 375 | | | | 423,173 | |
Johnson City Health & Educational Facilities Board, RB, Series A, 5.00%, 08/15/42 | | | 800 | | | | 825,698 | |
Metropolitan Government Nashville & Davidson County Health & Educational Facilities Board, RB, Series A, 5.00%, 07/01/40. | | | 1,530 | | | | 1,779,961 | |
Metropolitan Government Nashville & Davidson County Health & Educational Facilities Board, Refunding RB | | | | | | | | |
Series A, 4.00%, 10/01/49 | | | 230 | | | | 253,503 | |
| | | | | | | | |
| Security | | Par (000) | | | Value | |
| | |
| Tennessee (continued) | | | | | | |
Metropolitan Government Nashville & Davidson County Health & Educational Facilities Board, Refunding RB (continued) | | | | | | | | |
Series A, 5.25%, 10/01/58 | | $ | 2,860 | | | $ | 3,412,303 | |
Metropolitan Nashville Airport Authority, ARB, Series B, AMT, 5.00%, 07/01/40 | | | 2,500 | | | | 2,844,010 | |
| | | | | | | | |
| | |
| | | | | | | 14,491,419 | |
| | |
| Texas — 5.9% | | | | | | |
Brazos Higher Education Authority, Inc., RB, Series 1B, AMT, Subordinate, 3.00%, 04/01/40 | | | 65 | | | | 59,903 | |
Central Texas Regional Mobility Authority, RB, Series E, Senior Lien, 4.00%, 01/01/50 | | | 1,555 | | | | 1,741,452 | |
Central Texas Regional Mobility Authority, Refunding RB, Sub Lien, 5.00%, 01/01/23(b) | | | 430 | | | | 453,590 | |
City of Austin Texas Airport System Revenue, ARB, AMT, 5.00%, 11/15/39 | | | 440 | | | | 493,779 | |
City of Austin Texas Electric Utility Revenue, Refunding RB, Series A, 5.00%, 11/15/37 | | | 1,500 | | | | 1,569,911 | |
City of Beaumont Texas, GO, 5.25%, 03/01/23(b) | | | 2,340 | | | | 2,495,179 | |
City of Houston Texas Airport System Revenue, RB, Series A, AMT, 6.63%, 07/15/38 | | | 225 | | | | 225,968 | |
City of Houston Texas Airport System Revenue, Refunding ARB, AMT, 5.00%, 07/15/27 | | | 130 | | | | 150,982 | |
City of Houston Texas Airport System Revenue, Refunding RB | | | | | | | | |
Sub-Series D, 5.00%, 07/01/37 | | | 1,175 | | | | 1,434,633 | |
Series A, AMT, 5.00%, 07/01/27 | | | 125 | | | | 144,712 | |
Sub-Series A, AMT, 4.00%, 07/01/47 | | | 690 | | | | 775,461 | |
City of San Antonio Texas Electric & Gas Systems Revenue, Refunding RB, Series A, 5.00%, 02/01/48 | | | 850 | | | | 1,042,114 | |
Dallas Fort Worth International Airport, ARB, Series H, AMT, 5.00%, 11/01/21(b) | | | 2,200 | | | | 2,200,000 | |
El Paso Independent School District, GO, (PSF), 4.00%, 08/15/43 | | | 890 | | | | 1,020,578 | |
Harris County Cultural Education Facilities Finance Corp., RB, Series B, 7.00%, 01/01/23(b) | | | 565 | | | | 609,353 | |
Harris County-Houston Sports Authority, Refunding RB, Series G, Senior Lien, (NPFGC), 0.00%, 11/15/41(c) | | | 11,690 | | | | 4,684,499 | |
Leander Independent School District, Refunding GO, CAB(c) | | | | | | | | |
Series D, (PSF), 0.00%, 08/15/24(b) | | | 370 | | | | 218,166 | |
Series D, (PSF), 0.00%, 08/15/35 | | | 3,630 | | | | 2,124,316 | |
Lower Colorado River Authority, Refunding RB, 5.50%, 05/15/33 | | | 2,240 | | | | 2,403,303 | |
Midland County Fresh Water Supply District No.1, RB, CAB(c) | | | | | | | | |
Series A, 0.00%, 09/15/38 | | | 10,760 | | | | 5,581,524 | |
Series A, 0.00%, 09/15/40 | | | 2,525 | | | | 1,156,687 | |
Series A, 0.00%, 09/15/41 | | | 1,395 | | | | 606,942 | |
New Hope Cultural Education Facilities Finance Corp., RB | | | | | | | | |
Series A, 5.00%, 04/01/25(b) | | | 145 | | | | 167,001 | |
Series A, 5.00%, 08/15/50(a) | | | 455 | | | | 484,868 | |
North Texas Tollway Authority, RB, CAB, Series B, 0.00%, 09/01/31(b)(c) | | | 2,415 | | | | 1,284,109 | |
| | |
| 46 | | 2 0 2 1 BLACK ROCK SEMI - ANNUAL REPORT TO SHAREHOLDERS |
| | |
Schedule of Investments (unaudited) (continued) October 31, 2021 | | BlackRock MuniHoldings Fund, Inc. (MHD) (Percentages shown are based on Net Assets) |
| | | | | | | | |
| Security | | Par (000) | | | Value | |
| | |
| Texas (continued) | | | | | | |
North Texas Tollway Authority, Refunding RB | | | | | | | | |
4.25%, 01/01/49 | | $ | 3,165 | | | $ | 3,564,043 | |
Series A, 5.00%, 01/01/48 | | | 1,060 | | | | 1,266,980 | |
Red River Education Finance Corp., RB, 5.25%, 03/15/23(b) | | | 1,820 | | | | 1,943,214 | |
San Antonio Public Facilities Corp., Refunding RB, 4.00%, 09/15/42 | | | 1,355 | | | | 1,387,630 | |
San Antonio Water System, Refunding RB, Series A, Junior Lien, 5.00%, 05/15/48 | | | 945 | | | | 1,144,311 | |
Tarrant County Cultural Education Facilities Finance Corp., RB | | | | | | | | |
Series B, 5.00%, 07/01/35 | | | 1,500 | | | | 1,845,186 | |
Series B, 5.00%, 07/01/48 | | | 3,330 | | | | 3,997,332 | |
Texas City Industrial Development Corp., RB, Series 2012, 4.13%, 12/01/45 | | | 255 | | | | 272,985 | |
Texas Department of Housing & Community Affairs, RB, S/F Housing, Series A, (GNMA), 4.25%, 09/01/43 | | | 170 | | | | 182,310 | |
Texas Private Activity Bond Surface Transportation Corp., RB, AMT, 5.00%, 06/30/58 | | | 1,095 | | | | 1,292,087 | |
Texas Transportation Commission, RB, Series A, 5.00%, 08/01/57 | | | 1,085 | | | | 1,241,973 | |
Texas Transportation Commission, RB, CAB(c) | | | | | | | | |
0.00%, 08/01/35 | | | 270 | | | | 167,574 | |
0.00%, 08/01/36 | | | 145 | | | | 85,368 | |
0.00%, 08/01/37 | | | 195 | | | | 108,595 | |
0.00%, 08/01/38 | | | 200 | | | | 105,530 | |
0.00%, 08/01/39 | | | 1,000 | | | | 500,054 | |
0.00%, 08/01/43 | | | 795 | | | | 319,320 | |
0.00%, 08/01/44 | | | 870 | | | | 330,136 | |
0.00%, 08/01/45 | | | 1,135 | | | | 408,266 | |
| | | | | | | | |
| | |
| | | | | | | 53,291,924 | |
| | |
| Utah — 0.5% | | | | | | |
City of Salt Lake City Utah Airport Revenue, ARB, Series A, AMT, 5.00%, 07/01/43 | | | 530 | | | | 632,148 | |
County of Utah, RB | | | | | | | | |
Series A, 4.00%, 05/15/43 | | | 155 | | | | 178,837 | |
Series A, 3.00%, 05/15/50 | | | 710 | | | | 730,548 | |
Salt Lake City Corp. Airport Revenue, ARB | | | | | | | | |
Series A, AMT, 5.00%, 07/01/47 | | | 665 | | | | 778,099 | |
Series A, AMT, 5.00%, 07/01/48 | | | 640 | | | | 756,839 | |
Utah Charter School Finance Authority, RB | | | | | | | | |
(UT), 5.00%, 10/15/48 | | | 360 | | | | 419,950 | |
Series A, 5.00%, 06/15/39(a) | | | 200 | | | | 213,825 | |
Utah Charter School Finance Authority, Refunding RB | | | | | | | | |
5.00%, 06/15/40(a) | | | 150 | | | | 171,489 | |
(UT), 4.00%, 04/15/42 | | | 400 | | | | 421,868 | |
5.00%, 06/15/55(a) | | | 385 | | | | 432,733 | |
| | | | | | | | |
| | |
| | | | | | | 4,736,336 | |
| | |
| Vermont — 0.3% | | | | | | |
University of Vermont and State Agricultural College, Refunding RB | | | | | | | | |
4.00%, 10/01/37 | | | 500 | | | | 545,386 | |
5.00%, 10/01/43 | | | 1,470 | | | | 1,775,351 | |
Vermont Student Assistance Corp., RB, Series A, AMT, 4.13%, 06/15/30 | | | 295 | | | | 309,775 | |
| | | | | | | | |
| | |
| | | | | | | 2,630,512 | |
| | |
| Virginia — 1.6% | | | | | | |
Ballston Quarter Community Development Authority, TA, Series A, 5.38%, 03/01/36 | | | 490 | | | | 493,040 | |
| | | | | | | | |
| Security | | Par (000) | | | Value | |
| | |
| Virginia (continued) | | | | | | |
Hanover County Economic Development Authority, Refunding RB, Series A, 5.00%, 07/01/47 | | $ | 970 | | | $ | 983,912 | |
Henrico County Economic Development Authority, Refunding RB, 4.00%, 10/01/45 | | | 160 | | | | 176,848 | |
Lexington Industrial Development Authority, RB, 5.00%, 01/01/22(b) | | | 940 | | | | 947,426 | |
Virginia Beach Development Authority, Refunding RB | | | | | | | | |
5.00%, 09/01/44 | | | 585 | | | | 660,299 | |
4.00%, 09/01/48 | | | 375 | | | | 402,139 | |
Virginia Housing Development Authority, RB, M/F Housing Series 1, (FHLMC, FNMA, GNMA), 2.55%, 11/01/50 | | | 840 | | | | 813,041 | |
Series B, 4.00%, 06/01/53 | | | 385 | | | | 410,163 | |
Series D, 3.90%, 10/01/48 | | | 1,430 | | | | 1,530,212 | |
Virginia Small Business Financing Authority, RB | | | | | | | | |
AMT, 5.00%, 01/01/48(a)(e) | | | 470 | | | | 491,977 | |
AMT, 5.00%, 12/31/52 | | | 2,330 | | | | 2,719,264 | |
AMT, Senior Lien, 5.25%, 01/01/32 | | | 950 | | | | 978,116 | |
AMT, Senior Lien, 6.00%, 01/01/37 | | | 3,900 | | | | 4,032,877 | |
| | | | | | | | |
| | |
| | | | | | | 14,639,314 | |
| | |
| Washington — 2.3% | | | | | | |
Grant County Public Utility District No.2 Priest Rapids Hydroelectric Project, Refunding RB, Series A, 5.00%, 01/01/26(b) | | | 1,555 | | | | 1,834,769 | |
King County Housing Authority, Refunding RB, 3.00%, 06/01/40 | | | 440 | | | | 459,293 | |
Port of Seattle Washington, ARB | | | | | | | | |
Series A, AMT, 5.00%, 05/01/43 | | | 1,470 | | | | 1,706,799 | |
Series C, AMT, 5.00%, 04/01/40 | | | 930 | | | | 1,034,508 | |
Series C, AMT, Intermediate Lien, 5.00%, 05/01/37 | | | 1,450 | | | | 1,717,374 | |
State of Washington, COP | | | | | | | | |
Series B, 5.00%, 07/01/36 | | | 1,000 | | | | 1,233,202 | |
Series B, 5.00%, 07/01/37 | | | 3,910 | | | | 4,816,850 | |
Series B, 5.00%, 07/01/38 | | | 650 | | | | 800,151 | |
State of Washington, GO, Series C, 5.00%, 02/01/36 | | | 1,300 | | | | 1,590,632 | |
Washington Health Care Facilities Authority, RB, Series A, 5.75%, 01/01/23(b) | | | 2,820 | | | | 3,000,694 | |
Washington Health Care Facilities Authority, Refunding RB | | | | | | | | |
5.00%, 09/01/55 | | | 285 | | | | 346,418 | |
Series A, 4.00%, 08/01/44 | | | 250 | | | | 280,077 | |
Washington State Housing Finance Commission, Refunding RB(a) | | | | | | | | |
5.00%, 01/01/38 | | | 600 | | | | 700,838 | |
5.00%, 01/01/43 | | | 900 | | | | 1,044,211 | |
| | | | | | | | |
| | |
| | | | | | | 20,565,816 | |
| | |
| West Virginia — 0.9% | | | | | | |
West Virginia Hospital Finance Authority, RB, Series A, 4.00%, 06/01/51 | | | 2,910 | | | | 3,190,809 | |
West Virginia Parkways Authority, RB, Senior Lien, 4.00%, 06/01/51 | | | 4,055 | | | | 4,718,313 | |
| | | | | | | | |
| | |
| | | | | | | 7,909,122 | |
| | |
| Wisconsin — 1.2% | | | | | | |
Public Finance Authority, RB | | | | | | | | |
Series A, 4.00%, 11/15/37 | | | 100 | | | | 114,460 | |
Series A, 5.00%, 07/15/39(a) | | | 100 | | | | 111,265 | |
Series A, 5.00%, 10/15/40(a) | | | 425 | | | | 466,946 | |
Series A, 5.00%, 11/15/41 | | | 270 | | | | 325,197 | |
Series A, 5.00%, 07/15/49(a) | | | 245 | | | | 268,992 | |
| | |
SCHEDULE OF INVESTMENTS | | 47 |
| | |
Schedule of Investments (unaudited) (continued) October 31, 2021 | | BlackRock MuniHoldings Fund, Inc. (MHD) (Percentages shown are based on Net Assets) |
| | | | | | | | |
| Security | | Par (000) | | | Value | |
|
| Wisconsin (continued) | |
Public Finance Authority, RB (continued) | | | | | | | | |
Series A, 5.00%, 10/15/50(a) | | $ | 540 | | | $ | 583,773 | |
Series A, 5.00%, 07/15/54(a) | | | 115 | | | | 125,876 | |
Series A, 5.00%, 07/01/55(a) | | | 300 | | | | 323,339 | |
Series A, 5.00%, 10/15/55(a) | | | 560 | | | | 602,660 | |
Series A-1, 4.50%, 01/01/35(a) | | | 230 | | | | 251,658 | |
Series A-1, 5.00%, 01/01/55(a) | | | 305 | | | | 333,775 | |
Public Finance Authority, Refunding RB | | | | | | | | |
5.00%, 09/01/49(a) | | | 165 | | | | 176,976 | |
5.00%, 09/01/54(a) | | | 130 | | | | 139,129 | |
Series A, 4.00%, 10/01/49 | | | 2,000 | | | | 2,211,980 | |
Series A, 5.00%, 11/15/49 | | | 335 | | | | 380,522 | |
AMT, 4.00%, 08/01/35 | | | 280 | | | | 281,858 | |
Wisconsin Health & Educational Facilities Authority, Refunding RB, 5.00%, 04/01/44 | | | 2,005 | | | | 2,465,196 | |
Wisconsin Housing & Economic Development Authority, RB, M/F Housing | | | | | | | | |
Series A, 3.15%, 11/01/44 | | | 480 | | | | 499,591 | |
Series A, 4.45%, 05/01/57 | | | 575 | | | | 620,300 | |
WPPI Energy, Refunding RB, Series A, 5.00%, 07/01/37 | | | 665 | | | | 738,578 | |
| | | | | | | | |
| | |
| | | | | | | 11,022,071 | |
| | |
| Wyoming — 0.0% | | | | | | |
Wyoming Municipal Power Agency, Inc., Refunding RB, Series A, (BAM), 5.00%, 01/01/27(b) | | | 330 | | | | 401,171 | |
| | | | | | | | |
| |
Total Municipal Bonds — 118.9%
(Cost: $972,988,267) | | | | 1,075,094,037 | |
| | | | | | | | |
|
Municipal Bonds Transferred to Tender Option Bond Trusts(j) | |
| | |
| Arizona — 0.1% | | | | | | |
Maricopa County Industrial Development Authority, RB, Series A, 4.00%, 01/01/41 | | | 915 | | | | 1,037,934 | |
| | | | | | | | |
| | |
| California — 2.1% | | | | | | |
Bay Area Toll Authority, Refunding RB, 4.00%, 04/01/42(k) | | | 3,896 | | | | 4,378,804 | |
Los Angeles Unified School District, GO, Series B-1, 5.25%, 07/01/42(k) | | | 1,451 | | | | 1,779,325 | |
Sacramento Area Flood Control Agency, Refunding SAB | | | | | | | | |
5.00%, 10/01/47 | | | 8,384 | | | | 9,876,199 | |
Series A, 5.00%, 10/01/43 | | | 2,775 | | | | 3,271,644 | |
| | | | | | | | |
| | |
| | | | | | | 19,305,972 | |
| | |
| Colorado — 1.6% | | | | | | |
City & County of Denver Colorado Airport System Revenue, Refunding ARB(k) | | | | | | | | |
Series A, AMT, 5.25%, 12/01/43 | | | 1,901 | | | | 2,323,815 | |
Series A, AMT, 5.25%, 12/01/48 | | | 1,664 | | | | 2,025,520 | |
Colorado Health Facilities Authority, Refunding RB(k) | | | | | | | | |
Series A, 5.00%, 08/01/44 | | | 1,950 | | | | 2,397,120 | |
Series A, 4.00%, 08/01/49 | | | 2,490 | | | | 2,762,277 | |
County of Adams Colorado, Refunding COP, 4.00%, 12/01/45 | | | 4,650 | | | | 5,089,802 | |
| | | | | | | | |
| | |
| | | | | | | 14,598,534 | |
| | | | | | | | |
| Security | | Par (000) | | | Value | |
| | |
| Connecticut — 0.7% | | | | | | |
Connecticut State Health & Educational Facilities Authority, Refunding RB, 5.00%, 12/01/45 | | $ | 5,687 | | | $ | 6,587,958 | |
| | | | | | | | |
|
| District of Columbia — 0.7% | |
District of Columbia Housing Finance Agency, RB, M/F Housing, Series B-2, (FHA), 4.10%, 09/01/39 | | | 1,300 | | | | 1,423,386 | |
Metropolitan Washington Airports Authority Dulles Toll Road Revenue, Refunding RB, Series B, Subordinate, (AGM), 4.00%, 10/01/53 | | | 1,299 | | | | 1,467,685 | |
Washington Metropolitan Area Transit Authority, RB, Series B, 5.00%, 07/01/42 | | | 2,992 | | | | 3,559,203 | |
| | | | | | | | |
| | |
| | | | | | | 6,450,274 | |
| | |
| Florida — 1.4% | | | | | | |
City of South Miami Health Facilities Authority, Inc., Refunding RB, 5.00%, 08/15/47 | | | 1,290 | | | | 1,531,961 | |
City of Tampa Florida, RB, Series A, 4.00%, 11/15/46 | | | 1,932 | | | | 2,128,824 | |
County of Broward Florida Port Facilities Revenue, ARB, Series B, AMT, 4.00%, 09/01/49 | | | 2,350 | | | | 2,633,109 | |
Escambia County Health Facilities Authority, Refunding RB, 4.00%, 08/15/45(k) | | | 1,771 | | | | 1,955,098 | |
Greater Orlando Aviation Authority, ARB, Series A, AMT, 4.00%, 10/01/49(k) | | | 3,543 | | | | 3,981,076 | |
| | | | | | | | |
| | |
| | | | | | | 12,230,068 | |
| | |
| Georgia — 0.7% | | | | | | |
Dalton Whitfield County Joint Development Authority, RB, 4.00%, 08/15/48 | | | 3,647 | | | | 4,072,113 | |
Georgia Housing & Finance Authority, Refunding RB | | | | | | | | |
Series A, 3.60%, 12/01/44 | | | 1,041 | | | | 1,108,761 | |
Series A, 3.70%, 06/01/49 | | | 1,041 | | | | 1,117,506 | |
| | | | | | | | |
| | |
| | | | | | | 6,298,380 | |
| | |
| Idaho — 0.2% | | | | | | |
Idaho State Building Authority, RB, Series A, 4.00%, 09/01/48 | | | 1,700 | | | | 1,929,155 | |
| | | | | | | | |
| | |
| Illinois — 1.1% | | | | | | |
City of Chicago IIllinois Waterworks Revenue, Refunding RB, 2nd Lien, (AGM), 5.25%, 11/01/33 | | | 480 | | | | 481,692 | |
Illinois Finance Authority, Refunding RB | | | | | | | | |
Series C, 4.00%, 02/15/27(b) | | | 5 | | | | 5,738 | |
Series C, 4.00%, 02/15/41 | | | 2,033 | | | | 2,287,390 | |
Illinois State Toll Highway Authority, RB | | | | | | | | |
Series A, 5.00%, 01/01/40 | | | 825 | | | | 944,215 | |
Series B, 5.00%, 01/01/40 | | | 3,329 | | | | 3,862,757 | |
Series C, 5.00%, 01/01/38 | | | 2,252 | | | | 2,542,725 | |
| | | | | | | | |
| | |
| | | | | | | 10,124,517 | |
| | |
| Iowa — 0.2% | | | | | | |
Iowa Finance Authority, Refunding RB, Series E,
4.00%, 08/15/46 | | | 1,455 | | | | 1,579,421 | |
| | | | | | | | |
| | |
| Louisiana — 0.9% | | | | | | |
City of Shreveport Louisiana Water & Sewer Revenue, RB | | | | | | | | |
Series B, Junior Lien, (AGM), 4.00%, 12/01/44 | | | 2,043 | | | | 2,294,775 | |
Series B, Junior Lien, (AGM), 4.00%, 12/01/49 | | | 4,105 | | | | 4,610,115 | |
State of Louisiana Gasoline & Fuels Tax Revenue, Refunding RB, Series A, 1st Lien, 4.00%, 05/01/41 | | | 1,245 | | | | 1,359,419 | |
| | | | | | | | |
| | |
| | | | | | | 8,264,309 | |
| | |
| 48 | | 2 0 2 1 BLACK ROCK SEMI - ANNUAL REPORT TO SHAREHOLDERS |
| | |
Schedule of Investments (unaudited) (continued) October 31, 2021 | | BlackRock MuniHoldings Fund, Inc. (MHD) (Percentages shown are based on Net Assets) |
| | | | | | | | |
| Security | | Par (000) | | | Value | |
|
| Maryland — 1.7% | |
City of Baltimore Maryland, RB | | | | | | | | |
Series A, 5.00%, 07/01/46 | | $ | 3,014 | | | $ | 3,558,222 | |
Series A, 4.00%, 07/01/49 | | | 3,122 | | | | 3,580,099 | |
Maryland Stadium Authority, RB | | | | | | | | |
5.00%, 05/01/42 | | | 1,740 | | | | 2,105,202 | |
5.00%, 05/01/47 | | | 4,894 | | | | 5,959,434 | |
| | | | | | | | |
| | |
| | | | | | | 15,202,957 | |
|
| Massachusetts — 1.0% | |
Commonwealth of Massachusetts Transportation Fund Revenue, RB, Series A, 4.00%, 06/01/45 | | | 1,502 | | | | 1,634,228 | |
Commonwealth of Massachusetts, GO, Series A, 5.00%, 01/01/46 | | | 1,982 | | | | 2,398,546 | |
Massachusetts Development Finance Agency, Refunding RB, 5.00%, 07/01/47 | | | 3,359 | | | | 3,918,428 | |
Massachusetts Housing Finance Agency, RB, M/F Housing, Series A-1, (FHA), 3.10%, 06/01/60 | | | 1,111 | | | | 1,115,831 | |
| | | | | | | | |
| | |
| | | | | | | 9,067,033 | |
| | |
| Michigan — 2.0% | | | | | | |
Michigan Finance Authority, RB(k) | | | | | | | | |
4.00%, 02/15/47 | | | 5,486 | | | | 6,265,437 | |
Series A, 4.00%, 02/15/44 | | | 1,912 | | | | 2,187,033 | |
Michigan State Building Authority, Refunding RB, Series I, 5.00%, 10/15/45 | | | 5,670 | | | | 6,504,564 | |
Michigan State Housing Development Authority, RB, M/F Housing, Series A, 4.05%, 10/01/48 | | | 2,337 | | | | 2,533,641 | |
Michigan State Housing Development Authority, RB, S/F Housing, Series C, 3.90%, 12/01/33 | | | 210 | | | | 228,101 | |
| | | | | | | | |
| | |
| | | | | | | 17,718,776 | |
| | |
| Nevada — 0.3% | | | | | | |
County of Clark Nevada, GO, Series A, 5.00%, 05/01/48 | | | 2,260 | | | | 2,715,532 | |
| | | | | | | | |
| | |
| New Jersey — 2.2% | | | | | | |
New Jersey Health Care Facilities Financing Authority, RB, 4.00%, 07/01/51 | | | 17,235 | | | | 19,835,153 | |
| | | | | | | | |
| | |
| New York — 9.5% | | | | | | |
City of New York, GO, Sub-Series-D1, Series D, 5.00%, 12/01/43(k) | | | 2,620 | | | | 3,212,703 | |
City of New York, Refunding GO, Series B, 4.00%, 08/01/32 | | | 3,990 | | | | 4,337,084 | |
Hudson Yards Infrastructure Corp., RB, 5.75%, 02/15/47(k) | | | 1,757 | | | | 1,758,867 | |
New York City Housing Development Corp., Refunding RB, Series A, 4.15%, 11/01/38 | | | 2,970 | | | | 3,254,108 | |
New York City Transitional Finance Authority Building Aid Revenue, RB, Series S-1, (SAW), 4.00%, 07/15/42(k) | | | 1,395 | | | | 1,428,013 | |
New York City Water & Sewer System, Refunding RB | | | | | | | | |
Series BB, 5.25%, 06/15/44(b) | | | 4,993 | | | | 5,023,964 | |
Series BB, 4.00%, 06/15/47 | | | 3,660 | | | | 3,793,297 | |
Series CC, 5.00%, 06/15/23(b) | | | 2,820 | | | | 3,020,931 | |
Series CC, 5.00%, 06/15/47 | | | 3,181 | | | | 3,406,997 | |
Series FF, 5.00%, 06/15/45 | | | 3,019 | | | | 3,101,048 | |
New York Liberty Development Corp., ARB, 5.25%, 12/15/43 | | | 22,829 | | | | 22,957,490 | |
New York Liberty Development Corp., Refunding RB, 5.75%, 11/15/51(k) | | | 12,111 | | | | 12,135,062 | |
| | | | | | | | |
| Security | | Par (000) | | | Value | |
|
| New York (continued) | |
New York Power Authority, Refunding RB, Series A, 4.00%, 11/15/60 | | $ | 947 | | | $ | 1,084,491 | |
New York State Dormitory Authority, Refunding RB, Series D, 4.00%, 02/15/47 | | | 4,317 | | | | 4,899,792 | |
New York State Thruway Authority, Refunding RB, Series B, Subordinate, 4.00%, 01/01/50 | | | 2,083 | | | | 2,357,992 | |
New York State Urban Development Corp., RB, Series A, 4.00%, 03/15/46 | | | 4,846 | | | | 5,445,047 | |
Port Authority of New York & New Jersey, ARB, Series 221, AMT, 4.00%, 07/15/60 | | | 854 | | | | 951,144 | |
Port Authority of New York & New Jersey, Refunding ARB, 194th Series, 5.25%, 10/15/55 | | | 3,210 | | | | 3,698,457 | |
| | | | | | | | |
| | |
| | | | | | | 85,866,487 | |
|
| North Carolina — 0.8% | |
North Carolina Capital Facilities Finance Agency, Refunding RB, Series B, 5.00%, 10/01/25(b) | | | 5,550 | | | | 6,508,169 | |
North Carolina Housing Finance Agency, RB, S/F Housing, Series 39-B, (FHLMC, FNMA, GNMA), 4.00%, 01/01/48 | | | 695 | | | | 744,958 | |
| | | | | | | | |
| | |
| | | | | | | 7,253,127 | |
| | |
| Ohio — 0.7% | | | | | | |
Ohio State University, RB, 4.00%, 12/01/48 | | | 5,700 | | | | 6,702,223 | |
| | | | | | | | |
|
| Pennsylvania — 2.4% | |
Commonwealth of Pennsylvania, GO(k) | | | | | | | | |
1st Series, 4.00%, 03/01/36 | | | 1,559 | | | | 1,789,452 | |
1st Series, 4.00%, 03/01/38 | | | 3,650 | | | | 4,177,106 | |
County of Lehigh Pennsylvania, Refunding RB, Series A, 4.00%, 07/01/49(k) | | | 2,996 | | | | 3,355,733 | |
Northampton County General Purpose Authority, Refunding RB, 4.00%, 11/01/38(k) | | | 2,596 | | | | 3,009,351 | |
Pennsylvania Turnpike Commission, RB, Sub- Series A, 5.50%, 12/01/42 | | | 4,018 | | | | 4,855,380 | |
Pennsylvania Turnpike Commission, Refunding RB, Sub-Series B-2, (AGM), 5.00%, 06/01/35 | | | 1,640 | | | | 1,973,887 | |
Westmoreland County Municipal Authority, Refunding RB, (BAM), 5.00%, 08/15/38 | | | 2,533 | | | | 2,882,654 | |
| | | | | | | | |
| | |
| | | | | | | 22,043,563 | |
| | |
| Rhode Island — 0.4% | | | | | | |
Narragansett Bay Commission, Refunding RB, Series A, 4.00%, 09/01/22(b) | | | 1,140 | | | | 1,175,889 | |
Rhode Island Health and Educational Building Corp., RB, Series A, 4.00%, 09/15/47 | | | 1,982 | | | | 2,212,460 | |
| | | | | | | | |
| | |
| | | | | | | 3,388,349 | |
|
| South Carolina — 0.2% | |
South Carolina Ports Authority, ARB, Series B, AMT, 4.00%, 07/01/49(k) | | | 1,665 | | | | 1,844,428 | |
| | | | | | | | |
| | |
| Texas — 5.5% | | | | | | |
Board of Regents of the University of Texas System, Refunding RB, Series B, 5.00%, 08/15/43 | | | 3,842 | | | | 3,974,744 | |
City of San Antonio Texas Electric & Gas Systems Revenue, RB, Junior Lien, 5.00%, 02/01/23(b) | | | 4,560 | | | | 4,827,994 | |
County of Hidalgo Texas, GO, Series A, 4.00%, 08/15/43 | | | 2,297 | | | | 2,606,797 | |
El Paso Independent School District, GO, (PSF-GTD), 4.00%, 08/15/48 | | | 2,999 | | | | 3,449,730 | |
Harris County Toll Road Authority, Refunding RB, Series A, Senior Lien, 5.00%, 08/15/43 | | | 1,858 | | | | 2,265,754 | |
| | |
SCHEDULE OF INVESTMENTS | | 49 |
| | |
Schedule of Investments (unaudited) (continued) October 31, 2021 | | BlackRock MuniHoldings Fund, Inc. (MHD) (Percentages shown are based on Net Assets) |
| | | | | | | | |
| Security | | Par (000) | | | Value | |
| |
| | |
| Texas (continued) | | | | | | |
Houston Community College System, GO, 4.00%, 02/15/43(b) | | $ | 4,394 | | | $ | 4,602,813 | |
Howe Independent School District, GO, (PSF-GTD), 4.00%, 08/15/43 | | | 1,095 | | | | 1,217,663 | |
Lower Colorado River Authority, Refunding, RB, 4.00%, 05/15/43 | | | 1,504 | | | | 1,530,788 | |
Metropolitan Transit Authority of Harris County Sales & Use Tax Revenue, Refunding RB, Series A, 5.00%, 11/01/21 | | | 4,060 | | | | 4,060,000 | |
San Antonio Public Facilities Corp., Refunding RB, 4.00%, 09/15/42 | | | 3,794 | | | | 3,885,534 | |
San Antonio Water System, Refunding RB, Series C, Junior Lien, 5.00%, 05/15/46 | | | 1,515 | | | | 1,790,745 | |
Tarrant County Cultural Education Facilities Finance Corp., RB, Series A, 5.00%, 05/15/23(b) | | | 4,456 | | | | 4,776,580 | |
Texas Department of Housing & Community Affairs, RB, S/F Housing | | | | | | | | |
Series A, (GNMA), 3.63%, 09/01/44 | | | 1,389 | | | | 1,495,575 | |
Series A, (GNMA), 3.00%, 09/01/45 | | | 905 | | | | 938,604 | |
Series A, (GNMA), 3.75%, 09/01/49 | | | 1,191 | | | | 1,283,136 | |
Series A, (GNMA), 3.00%, 03/01/50 | | | 905 | | | | 938,604 | |
Texas Water Development Board, RB, Series A, 4.00%, 10/15/49 | | | 5,020 | | | | 5,765,258 | |
| | | | | | | | |
| | |
| | | | | | | 49,410,319 | |
| | |
| Virginia — 1.7% | | | | | | |
Fairfax County Economic Development Authority, RB, 5.00%, 04/01/47(k) | | | 2,320 | | | | 2,759,428 | |
Hampton Roads Transportation Accountability Commission, RB | | | | | | | | |
Series A, Senior Lien, 5.00%, 07/01/48 | | | 1,996 | | | | 2,388,733 | |
Series A, Senior Lien, 5.50%, 07/01/57(k) | | | 1,338 | | | | 1,642,690 | |
Series A, Senior Lien, 4.00%, 07/01/60(k) | | | 2,175 | | | | 2,501,261 | |
Virginia Small Business Financing Authority, Refunding RB, Series A, 4.00%, 12/01/49 | | | 5,320 | | | | 6,032,648 | |
| | | | | | | | |
| | |
| | | | | | | 15,324,760 | |
| | |
| Washington — 0.6% | | | | | | |
Washington Health Care Facilities Authority, Refunding RB, Series B, 4.13%, 08/15/43 | | | 1,446 | | | | 1,584,336 | |
Washington State Convention Center Public Facilities District RB, 3.00%, 07/01/58 | | | 3,717 | | | | 3,742,975 | |
| | | | | | | | |
| | |
| | | | | | | 5,327,311 | |
| | |
| West Virginia — 0.2% | | | | | | |
Morgantown Utility Board, Inc., RB, Series B, 4.00%, 12/01/48(k) | | | 1,511 | | | | 1,673,311 | |
| | | | | | | | |
| | |
| Wisconsin — 1.0% | | | | | | |
Wisconsin Health & Educational Facilities Authority, Refunding RB | | | | | | | | |
4.00%, 12/01/46 | | | 2,059 | | | | 2,284,642 | |
4.00%, 12/15/49(k) | | | 2,140 | | | | 2,403,919 | |
Wisconsin Housing & Economic Development Authority, RB, M/F Housing | | | | | | | | |
Series A, 4.10%, 11/01/43 | | | 1,342 | | | | 1,463,143 | |
| | | | | | | | |
| Security | | Par (000) | | | Value | |
| |
|
| Wisconsin (continued) | |
Wisconsin Housing & Economic Development Authority, RB, M/F Housing (continued) | | | | | | | | |
Series A, 4.30%, 11/01/53 | | $ | 1,395 | | | $ | 1,501,856 | |
Series A, 4.45%, 05/01/57 | | | 1,678 | | | | 1,828,929 | |
| | | | | | | | |
| | |
| | | | | | | 9,482,489 | |
| | | | | | | | |
| |
Total Municipal Bonds Transferred to Tender Option Bond Trusts — 39.9%
(Cost: $341,204,507) | | | | 361,262,340 | |
| | | | | | | | |
| |
Total Long-Term Investments — 158.8%
(Cost: $1,314,192,774) | | | | 1,436,356,377 | |
| | | | | | | | |
| | |
| | | Shares | | | | |
| |
|
Short-Term Securities | |
|
| Money Market Funds — 1.4% | |
BlackRock Liquidity Funds, MuniCash, Institutional Class, 0.01%(l)(m) | | | 13,060,788 | | | | 13,062,094 | |
| | | | | | | | |
| |
Total Short-Term Securities — 1.4%
(Cost: $13,062,094) | | | | 13,062,094 | |
| | | | | | | | |
| |
Total Investments — 160.2%
(Cost: $1,327,254,868) | | | | 1,449,418,471 | |
| |
Other Assets Less Liabilities — 1.0% | | | | 9,226,657 | |
| |
Liability for TOB Trust Certificates, Including Interest Expense and Fees Payable — (22.8)% | | | | (206,273,118 | ) |
| |
VMTP Shares at Liquidation Value — (38.4)% | | | | (347,800,000 | ) |
| | | | | | | | |
| |
Net Assets Applicable to Common Shares — 100.0% | | | $ | 904,572,010 | |
| | | | | | | | |
| (a) | Security exempt from registration pursuant to Rule 144A under the Securities Act of 1933, as amended. These securities may be resold in transactions exempt from registration to qualified institutional investors. |
| (b) | U.S. Government securities held in escrow, are used to pay interest on this security as well as to retire the bond in full at the date indicated, typically at a premium to par. |
| (d) | Security is collateralized by municipal bonds or U.S. Treasury obligations. |
| (e) | Variable rate security. Interest rate resets periodically. The rate shown is the effective interest rate as of period end. Security description also includes the reference rate and spread if published and available. |
| (f) | Issuer filed for bankruptcy and/or is in default. |
| (g) | Non-income producing security. |
| (h) | Step coupon security. Coupon rate will either increase (step-up bond) or decrease (step-down bond) at regular intervals until maturity. Interest rate shown reflects the rate currently in effect. |
| (j) | Represent bonds transferred to a TOB Trust in exchange of cash and residual certificates received by the Fund. These bonds serve as collateral in a secured borrowing. See Note 4 of the Notes to Financial Statements for details. |
| (k) | All or a portion of the security is subject to a recourse agreement. The aggregate maximum potential amount the Fund could ultimately be required to pay under the agreements, which expire between May 2, 2022 to November 15, 2051, is $37,457,055. See Note 4 of the Notes to Financial Statements for details. |
| (l) | Affiliate of the Fund. |
| (m) | Annualized 7-day yield as of period end. |
| | |
| 50 | | 2 0 2 1 BLACK ROCK SEMI - ANNUAL REPORT TO SHAREHOLDERS |
| | |
Schedule of Investments (unaudited) (continued) October 31, 2021 | | BlackRock MuniHoldings Fund, Inc. (MHD) |
Affiliates
Investments in issuers considered to be affiliate(s) of the Fund during the six months ended October 31, 2021 for purposes of Section 2(a)(3) of the Investment Company Act of 1940, as amended, were as follows:
| | | | | | | | | | | | | | | | | | | | | | | | | | | | | | | | | | | | | | | | |
| | | | | | | | | | | |
| | | Affiliated Issuer | | Value at
04/30/21 | | | Purchases
at Cost | | | Proceeds
from Sales | | | Net
Realized
Gain (Loss) | | | Change in
Unrealized
Appreciation
(Depreciation) | | | Value at
10/31/21 | | | Shares
Held at
10/31/21 | | | Income | | | Capital Gain
Distributions
from
Underlying
Funds | | | |
| | | | | | | | | | | |
| | BlackRock Liquidity Funds, MuniCash, Institutional Class | | $ | 7,843,901 | | | $ | 5,219,081 | (a) | | $ | — | | | $ | (888 | ) | | $ | — | | | $ | 13,062,094 | | | | 13,060,788 | | | $ | 302 | | | $ | — | | | |
| | | | | | | | | | | | | | | | | | | | | | | | | | | | | | | | | | | | | | | | |
| | (a) | Represents net amount purchased (sold). | |
Derivative Financial Instruments Outstanding as of Period End
Futures Contracts
| | | | | | | | | | | | | | | | |
| | | | | |
| Description | | Number of
Contracts | | | Expiration
Date | | | Notional
Amount (000) | | | Value/
Unrealized
Appreciation
(Depreciation) | |
| | | | |
Short Contracts | | | | | | | | | | | | | | | | |
10-Year U.S. Treasury Note | | | 104 | | | | 12/21/21 | | | $ | 13,588 | | | $ | 236,824 | |
U.S. Long Bond | | | 80 | | | | 12/21/21 | | | | 12,865 | | | | 125,628 | |
5-Year U.S. Treasury Note | | | 76 | | | | 12/31/21 | | | | 9,249 | | | | 122,747 | |
| | | | | | | | | | | | | | | | |
| | | | |
| | | | | | | | | | | | | | $ | 485,199 | |
| | | | | | | | | | | | | | | | |
Derivative Financial Instruments Categorized by Risk Exposure
As of period end, the fair values of derivative financial instruments located in the Statements of Assets and Liabilities were as follows:
| | | | | | | | | | | | | | | | | | | | | | | | | | | | |
| | | | | | | | |
| | | Commodity
Contracts | | | Credit
Contracts | | | Equity
Contracts | | | Foreign Currency Exchange
Contracts | | | Interest
Rate
Contracts | | | Other
Contracts | | | Total | |
| | | | | | | |
Assets — Derivative Financial Instruments | | | | | | | | | | | | | | | | | | | | | | | | | | | | |
Futures contracts | | | | | | | | | | | | | | | | | | | | | | | | | | | | |
Unrealized appreciation on futures contracts(a) | | $ | — | | | $ | — | | | $ | — | | | $ | — | | | $ | 485,199 | | | $ | — | | | $ | 485,199 | |
| | | | | | | | | | | | | | | | | | | | | | | | | | | | |
| | (a) | Net cumulative unrealized appreciation (depreciation) on futures contracts and centrally cleared swaps, if any, are reported in the Schedule of Investments. In the Statements of Assets and Liabilities, only current day’s variation margin is reported in receivables or payables and the net cumulative unrealized appreciation (depreciation) is included in accumulated earnings (loss). | |
For the period ended October 31, 2021, the effect of derivative financial instruments in the Statements of Operations was as follows:
| | | | | | | | | | | | | | | | | | | | | | | | | | | | |
| | | | | | | | |
| | | Commodity
Contracts | | | Credit
Contracts | | | Equity
Contracts | | | Foreign Currency Exchange
Contracts | | | Interest
Rate
Contracts | | | Other
Contracts | | | Total | |
| | | | | | | |
Net Realized Gain (Loss) from: | | | | | | | | | | | | | | | | | | | | | | | | | | | | |
Futures contracts | | $ | — | | | $ | — | | | $ | — | | | $ | — | | | $ | (2,203,042 | ) | | $ | — | | | $ | (2,203,042 | ) |
| | | | | | | | | | | | | | | | | | | | | | | | | | | | |
Net Change in Unrealized Appreciation (Depreciation) on: | | | | | | | | | | | | | | | | | | | | | | | | | | | | |
Futures contracts | | $ | — | | | $ | — | | | $ | — | | | $ | — | | | $ | 725,080 | | | $ | — | | | $ | 725,080 | |
| | | | | | | | | | | | | | | | | | | | | | | | | | | | |
Average Quarterly Balances of Outstanding Derivative Financial Instruments
| | | | |
| | |
Futures contracts: | | | | |
Average notional value of contracts — short | | $ | 36,693,860 | |
For more information about the Fund’s investment risks regarding derivative financial instruments, refer to the Notes to Financial Statements.
| | |
SCHEDULE OF INVESTMENTS | | 51 |
| | |
Schedule of Investments (unaudited) (continued) October 31, 2021 | | BlackRock MuniHoldings Fund, Inc. (MHD) |
Fair Value Hierarchy as of Period End
Various inputs are used in determining the fair value of financial instruments. For a description of the input levels and information about the Fund’s policy regarding valuation of financial instruments, refer to the Notes to Financial Statements.
The following table summarizes the Fund’s financial instruments categorized in the fair value hierarchy. The breakdown of the Fund’s financial instruments into major categories is disclosed in the Schedule of Investments above.
| | | �� | | | | | | | | | | | | | |
| | | | | |
| | | Level 1 | | | Level 2 | | | Level 3 | | | Total | |
| | | | |
Assets | | | | | | | | | | | | | | | | |
Investments | | | | | | | | | | | | | | | | |
Long-Term Investments | | | | | | | | | | | | | | | | |
Municipal Bonds | | $ | — | | | $ | 1,075,094,037 | | | $ | — | | | $ | 1,075,094,037 | |
Municipal Bonds Transferred to Tender Option Bond Trusts | | | — | | | | 361,262,340 | | | | — | | | | 361,262,340 | |
Short-Term Securities | | | | | | | | | | | | | | | | |
Money Market Funds | | | 13,062,094 | | | | — | | | | — | | | | 13,062,094 | |
| | | | | | | | | | | | | | | | |
| | | | |
| | $ | 13,062,094 | | | $ | 1,436,356,377 | | | $ | — | | | $ | 1,449,418,471 | |
| | | | | | | | | | | | | | | | |
Derivative Financial Instruments(a) | | | | | | | | | | | | | | | | |
Assets | | | | | | | | | | | | | | | | |
Interest Rate Contracts | | $ | 485,199 | | | $ | — | | | $ | — | | | $ | 485,199 | |
| | | | | | | | | | | | | | | | |
| | (a) | Derivative financial instruments are futures contracts. Futures contracts are valued at the unrealized appreciation (depreciation) on the instrument. | |
The Fund may hold assets and/or liabilities in which the fair value approximates the carrying amount for financial statement purposes. As of period end, such assets and/or liabilities are categorized within the fair value hierarchy as follows:
| | | | | | | | | | | | | | | | |
| |
| | | | |
| | | Level 1 | | | Level 2 | | | Level 3 | | | Total | |
| |
| | | | |
Liabilities | | | | | | | | | | | | | | | | |
TOB Trust Certificates | | $ | — | | | $ | (206,226,045 | ) | | $ | — | | | $ | (206,226,045 | ) |
VMTP Shares at Liquidation Value | | | — | | | | (347,800,000 | ) | | | — | | | | (347,800,000 | ) |
| | | | | | | | | | | | | | | | |
| | | | |
| | $ | — | | | $ | (554,026,045 | ) | | $ | — | | | $ | (554,026,045 | ) |
| | | | | | | | | | | | | | | | |
See notes to financial statements.
| | |
| 52 | | 2 0 2 1 BLACK ROCK SEMI - ANNUAL REPORT TO SHAREHOLDERS |
| | |
Schedule of Investments (unaudited) October 31, 2021 | | BlackRock MuniVest Fund II, Inc. (MVT) (Percentages shown are based on Net Assets) |
| | | | | | | | |
| Security | | Par (000) | | | Value | |
| | |
Municipal Bonds | | | | | | | | |
| | |
| Alabama — 1.5% | | | | | | |
County of Jefferson Alabama Sewer Revenue, Refunding RB | | | | | | | | |
Series A, Senior Lien, (AGM), 5.00%, 10/01/44 | | $ | 805 | | | $ | 877,863 | |
Series D, Sub Lien, 6.00%, 10/01/42 | | | 3,575 | | | | 4,035,993 | |
| | | | | | | | |
| | |
| | | | | | | 4,913,856 | |
| | |
| Arizona — 0.7% | | | | | | |
Glendale Industrial Development Authority, RB | | | | | | | | |
5.00%, 05/15/41 | | | 90 | | | | 102,849 | |
5.00%, 05/15/56 | | | 360 | | | | 402,520 | |
Industrial Development Authority of the City of Phoenix, RB, Series A, 5.00%, 07/01/46(a) | | | 1,685 | | | | 1,839,809 | |
| | | | | | | | |
| | |
| | | | | | | 2,345,178 | |
| | |
| Arkansas — 0.8% | | | | | | |
Arkansas Development Finance Authority, RB, Series A, AMT, 4.50%, 09/01/49(a) | | | 2,455 | | | | 2,671,487 | |
| | | | | | | | |
| | |
| California — 5.1% | | | | | | |
California Educational Facilities Authority, RB, Series V-1, 5.00%, 05/01/49 | | | 2,095 | | | | 3,195,135 | |
California Health Facilities Financing Authority, Refunding RB | | | | | | | | |
Series A, 5.00%, 07/01/33 | | | 890 | | | | 956,720 | |
Series A, 4.00%, 04/01/45 | | | 390 | | | | 439,708 | |
California Municipal Finance Authority, ARB, AMT, Senior Lien, 4.00%, 12/31/47 | | | 1,475 | | | | 1,620,025 | |
California Municipal Finance Authority, RB, S/F Housing | | | | | | | | |
Series A, 5.25%, 08/15/39 | | | 145 | | | | 154,680 | |
Series A, 5.25%, 08/15/49 | | | 370 | | | | 391,955 | |
California Municipal Finance Authority, Refunding RB, Series A, 5.00%, 02/01/42 | | | 225 | | | | 264,718 | |
California Pollution Control Financing Authority, RB, Series A, AMT, 5.00%, 11/21/45(a) | | | 1,495 | | | | 1,556,186 | |
California State Public Works Board, RB, Series I, 5.00%, 11/01/38 | | | 775 | | | | 842,961 | |
City of Los Angeles Department of Airports, Refunding ARB | | | | | | | | |
Series A, AMT, 5.00%, 05/15/31 | | | 345 | | | | 449,960 | |
Series A, AMT, 5.00%, 05/15/32 | | | 410 | | | | 530,967 | |
Series A, AMT, 5.00%, 05/15/33 | | | 405 | | | | 522,594 | |
Series A, AMT, 5.00%, 05/15/38 | | | 290 | | | | 366,127 | |
Series A, AMT, 5.00%, 05/15/39 | | | 310 | | | | 390,928 | |
Golden State Tobacco Securitization Corp., Refunding RB, Series A-2, 5.00%, 06/01/47 | | | 2,745 | | | | 2,811,849 | |
San Marcos Unified School District, GO, CAB, Series B, 0.00%, 08/01/42(b) | | | 2,000 | | | | 1,218,064 | |
State of California, Refunding GO, 3.00%, 12/01/46 | | | 500 | | | | 532,523 | |
Stockton Public Financing Authority, RB,
Series A, 6.25%, 10/01/23(c) | | | 360 | | | | 401,078 | |
| | | | | | | | |
| | |
| | | | | | | 16,646,178 | |
| | |
| Colorado — 1.7% | | | | | | |
Arapahoe County School District No.6 Littleton, GO, Series A, (SAW), 5.50%, 12/01/43 | | | 1,705 | | | | 2,176,942 | |
| | | | | | | | |
| Security | | Par (000) | | | Value | |
| | |
| Colorado (continued) | | | | | | |
Colorado Health Facilities Authority, Refunding RB, Series A, 4.00%, 08/01/44 | | $ | 1,765 | | | $ | 1,985,004 | |
State of Colorado, COP, Series O, 4.00%, 03/15/44 | | | 1,275 | | | | 1,460,365 | |
| | | | | | | | |
| | |
| | | | | | | 5,622,311 | |
| | |
| Connecticut — 0.2% | | | | | | |
State of Connecticut Special Tax Revenue, RB | | | | | | | | |
Series A, 4.00%, 05/01/36 | | | 330 | | | | 388,818 | |
Series A, 4.00%, 05/01/39 | | | 210 | | | | 244,682 | |
| | | | | | | | |
| | |
| | | | | | | 633,500 | |
| | |
| Delaware — 0.4% | | | | | | |
Delaware Transportation Authority, RB, 5.00%, 06/01/55 | | | 1,165 | | | | 1,312,011 | |
| | | | | | | | |
| | |
| District of Columbia — 6.8% | | | | | | |
District of Columbia, Refunding RB | | | | | | | | |
5.00%, 04/01/35 | | | 435 | | | | 518,258 | |
5.00%, 10/01/48 | | | 2,315 | | | | 2,756,621 | |
Series A, 6.00%, 07/01/23(c) | | | 240 | | | | 262,403 | |
Metropolitan Washington Airports Authority Aviation Revenue, Refunding ARB | | | | | | | | |
Series A, AMT, 4.00%, 10/01/37 | | | 340 | | | | 397,480 | |
Series A, AMT, 4.00%, 10/01/38 | | | 340 | | | | 397,165 | |
Series A, AMT, 4.00%, 10/01/39 | | | 505 | | | | 589,224 | |
Series A, AMT, 4.00%, 10/01/40 | | | 410 | | | | 477,195 | |
Series A, AMT, 4.00%, 10/01/41 | | | 380 | | | | 441,471 | |
Metropolitan Washington Airports Authority Dulles Toll Road Revenue, Refunding RB | | | | | | | | |
Series A, 5.00%, 10/01/53 | | | 2,010 | | | | 2,042,331 | |
Series B, Subordinate, 4.00%, 10/01/49 | | | 765 | | | | 852,103 | |
Metropolitan Washington Airports Authority Dulles Toll Road Revenue, Refunding RB, CAB(b) | | | | | | | | |
Series B, 2nd Senior Lien, (AGC), 0.00%, 10/01/33 | | | 6,590 | | | | 5,107,224 | |
Series B, 2nd Senior Lien, (AGC), 0.00%, 10/01/34 | | | 4,830 | | | | 3,618,351 | |
Series B, 2nd Senior Lien, (AGC), 0.00%, 10/01/35 | | | 6,515 | | | | 4,722,332 | |
| | | | | | | | |
| | |
| | | | | | | 22,182,158 | |
| | |
| Florida — 5.8% | | | | | | |
Capital Projects Finance Authority, Refunding RB | | | | | | | | |
Series A-1, 5.00%, 10/01/32 | | | 195 | | | | 241,472 | |
Series A-1, 5.00%, 10/01/33 | | | 215 | | | | 265,067 | |
Series A-1, 5.00%, 10/01/34 | | | 215 | | | | 264,096 | |
Series A-1, 5.00%, 10/01/35 | | | 75 | | | | 91,834 | |
Celebration Pointe Community Development District, SAB(a) | | | | | | | | |
5.00%, 05/01/32 | | | 450 | | | | 492,340 | |
5.00%, 05/01/48 | | | 1,120 | | | | 1,198,597 | |
Collier County Health Facilities Authority, RB, Series A, 5.00%, 05/01/48 | | | 1,190 | | | | 1,404,756 | |
Collier County Health Facilities Authority, Refunding RB, Series A, 5.00%, 05/01/45 | | | 1,340 | | | | 1,506,667 | |
County of Lee Florida Airport Revenue, RB, Series B, 5.00%, 10/01/46 | | | 1,275 | | | | 1,575,862 | |
County of Miami-Dade Florida Aviation Revenue, Refunding RB | | | | | | | | |
Series A, 4.00%, 10/01/37 | | | 325 | | | | 382,136 | |
Series A, 4.00%, 10/01/38 | | | 325 | | | | 381,168 | |
Series A, 4.00%, 10/01/39 | | | 240 | | | | 280,989 | |
| | |
SCHEDULE OF INVESTMENTS | | 53 |
| | |
Schedule of Investments (unaudited) (continued) October 31, 2021 | | BlackRock MuniVest Fund II, Inc. (MVT) (Percentages shown are based on Net Assets) |
| | | | | | | | |
| Security | | Par (000) | | | Value | |
| | |
| Florida (continued) | | | | | | |
Florida Development Finance Corp., RB(a) | | | | | | | | |
Series A, 5.00%, 06/15/40 | | $ | 215 | | | $ | 247,154 | |
Series A, 5.00%, 06/15/50 | | | 720 | | | | 814,151 | |
Series A, 5.00%, 06/15/55 | | | 435 | | | | 491,533 | |
Palm Beach County Health Facilities Authority, RB, 5.00%, 11/15/45 | | | 3,150 | | | | 3,649,193 | |
Sarasota County Florida Utility System Revenue, RB | | | | | | | | |
Series A, 5.00%, 10/01/45 | | | 435 | | | | 548,082 | |
Series A, 5.00%, 10/01/50 | | | 650 | | | | 809,235 | |
Village Community Development District No.10, SAB, 5.13%, 05/01/43 | | | 2,030 | | | | 2,084,855 | |
Volusia County Educational Facility Authority, Refunding RB, 5.00%, 10/15/49 | | | 1,750 | | | | 2,110,764 | |
| | | | | | | | |
| | |
| | | | | | | 18,839,951 | |
| | |
| Georgia — 4.9% | | | | | | |
Development Authority for Fulton County, Refunding RB, 4.00%, 03/15/44 | | | 5,000 | | | | 5,315,480 | |
Gainesville & Hall County Hospital Authority, Refunding RB,
Series A, (GTD), 5.50%, 02/15/25(c) | | | 515 | | | | 598,440 | |
Georgia Housing & Finance Authority, RB, S/F Housing, Series B, 2.50%, 06/01/50 | | | 720 | | | | 714,649 | |
Glynn-Brunswick Memorial Hospital Authority, RB, 5.00%, 08/01/47 | | | 2,500 | | | | 2,911,837 | |
Main Street Natural Gas, Inc., RB | | | | | | | | |
Series A, 5.00%, 05/15/35 | | | 490 | | | | 658,206 | |
Series A, 5.00%, 05/15/36 | | | 490 | | | | 664,800 | |
Series A, 5.00%, 05/15/37 | | | 540 | | | | 739,281 | |
Series A, 5.00%, 05/15/38 | | | 295 | | | | 407,669 | |
Series A, 5.00%, 05/15/49 | | | 985 | | | | 1,419,301 | |
Municipal Electric Authority of Georgia, RB, 4.00%, 01/01/49 | | | 1,560 | | | | 1,716,596 | |
Municipal Electric Authority of Georgia, Refunding RB | | | | | | | | |
Series A, 4.00%, 01/01/51 | | | 225 | | | | 256,089 | |
Sub-Series A, 4.00%, 01/01/49 | | | 610 | | | | 672,174 | |
| | | | | | | | |
| | |
| | | | | | | 16,074,522 | |
| | |
| Idaho — 0.3% | | | | | | |
Idaho Health Facilities Authority, RB, Series 2017, 5.00%, 12/01/46 | | | 745 | | | | 892,202 | |
| | | | | | | | |
| | |
| Illinois — 10.5% | | | | | | |
Chicago Board of Education, GO | | | | | | | | |
Series C, 5.25%, 12/01/35 | | | 1,465 | | | | 1,623,460 | |
Series D, 5.00%, 12/01/46 | | | 1,915 | | | | 2,082,577 | |
Series H, 5.00%, 12/01/36 | | | 450 | | | | 526,257 | |
Chicago Board of Education, Refunding GO | | | | | | | | |
Series C, 5.00%, 12/01/25 | | | 1,460 | | | | 1,696,488 | |
Series F, 5.00%, 12/01/24 | | | 615 | | | | 693,778 | |
Series G, 5.00%, 12/01/34 | | | 450 | | | | 525,992 | |
Chicago O’Hare International Airport, Refunding RB, Series A, Senior Lien, 4.00%, 01/01/37 | | | 935 | | | | 1,086,090 | |
Chicago Transit Authority Sales Tax Receipts Fund, RB, 5.25%, 12/01/21(c) | | | 1,050 | | | | 1,054,306 | |
City of Chicago Illinois Special Assessment Revenue, SAB, 6.75%, 12/01/32 | | | 762 | | | | 763,868 | |
City of Chicago Illinois Waterworks Revenue, Refunding RB | | | | | | | | |
2nd Lien, (AGM), 5.25%, 11/01/33 | | | 260 | | | | 260,917 | |
2nd Lien, 5.00%, 11/01/42 | | | 915 | | | | 952,826 | |
| | | | | | | | |
| Security | | Par (000) | | | Value | |
| | |
| Illinois (continued) | | | | | | |
Cook County Community College District No. 508, GO, 5.50%, 12/01/38 | | $ | 805 | | | $ | 874,108 | |
Illinois Finance Authority, RB | | | | | | | | |
Series A, 5.00%, 02/15/47 | | | 235 | | | | 264,639 | |
Series A, 5.00%, 02/15/50 | | | 130 | | | | 145,767 | |
Illinois State Toll Highway Authority, RB | | | | | | | | |
Series A, 5.00%, 01/01/45 | | | 1,290 | | | | 1,611,059 | |
Series C, 5.00%, 01/01/37 | | | 2,800 | | | | 3,163,532 | |
Metropolitan Pier & Exposition Authority, RB, Series A, 5.00%, 06/15/57 | | | 870 | | | | 1,004,517 | |
Metropolitan Pier & Exposition Authority, Refunding RB, 4.00%, 06/15/50 | | | 1,340 | | | | 1,483,028 | |
Metropolitan Pier & Exposition Authority, Refunding RB, CAB, Series B, (AGM), 0.00%, 06/15/43(b) | | | 5,175 | | | | 2,883,841 | |
Regional Transportation Authority, RB, Series A, (NPFGC), 6.70%, 11/01/21 | | | 910 | | | | 910,325 | |
State of Illinois, GO | | | | | | | | |
5.00%, 02/01/39 | | | 1,540 | | | | 1,671,151 | |
Series A, 5.00%, 04/01/35 | | | 3,000 | | | | 3,172,926 | |
Series A, 5.00%, 04/01/38 | | | 3,490 | | | | 3,691,171 | |
University of Illinois, RB, Series A, 5.00%, 04/01/44 | | | 985 | | | | 1,081,449 | |
Village of Hodgkins Illinois, RB, AMT, 6.00%, 11/01/23 | | | 1,045 | | | | 1,049,372 | |
| | | | | | | | |
| | |
| | | | | | | 34,273,444 | |
| | |
| Indiana — 2.1% | | | | | | |
City of Valparaiso Indiana, RB | | | | | | | | |
AMT, 6.75%, 01/01/34 | | | 790 | | | | 868,551 | |
AMT, 7.00%, 01/01/44 | | | 1,905 | | | | 2,098,333 | |
Indiana Finance Authority, RB(c) | | | | | | | | |
Series A, AMT, 5.00%, 07/01/23 | | | 1,880 | | | | 2,020,668 | |
Series A, AMT, 5.25%, 07/01/23 | | | 405 | | | | 437,122 | |
Indianapolis Local Public Improvement Bond Bank, RB, Series A, 5.00%, 01/15/40 | | | 1,270 | | | | 1,337,480 | |
| | | | | | | | |
| | |
| | | | | | | 6,762,154 | |
| | |
| Iowa — 0.9% | | | | | | |
Iowa Finance Authority, Refunding RB, Series B, 5.25%, 12/01/50(d) | | | 2,810 | | | | 3,057,991 | |
| | | | | | | | |
| | |
| Kentucky — 1.2% | | | | | | |
Kentucky Economic Development Finance Authority, RB, Series A, 5.25%, 01/01/23(c) | | | 995 | | | | 1,052,925 | |
Kentucky Economic Development Finance Authority, Refunding RB, Series A, (AGM), 5.00%, 12/01/45 | | | 1,235 | | | | 1,491,600 | |
Kentucky Public Transportation Infrastructure Authority, RB, CAB, Series C, Convertible, 6.75%, 07/01/43(e) | | | 1,200 | | | | 1,456,815 | |
| | | | | | | | |
| | |
| | | | | | | 4,001,340 | |
| | |
| Louisiana — 1.7% | | | | | | |
Louisiana Public Facilities Authority, Refunding RB, 4.00%, 12/15/50 | | | 2,000 | | | | 2,201,866 | |
Tobacco Settlement Financing Corp., Refunding RB | | | | | | | | |
Series A, 5.25%, 05/15/31 | | | 315 | | | | 315,694 | |
Series A, 5.25%, 05/15/32 | | | 1,110 | | | | 1,136,062 | |
Series A, 5.25%, 05/15/33 | | | 1,205 | | | | 1,233,185 | |
Series A, 5.25%, 05/15/35 | | | 505 | | | | 537,615 | |
| | | | | | | | |
| | |
| | | | | | | 5,424,422 | |
| | |
| 54 | | 2 0 2 1 BLACK ROCK SEMI - ANNUAL REPORT TO SHAREHOLDERS |
| | |
Schedule of Investments (unaudited) (continued) October 31, 2021 | | BlackRock MuniVest Fund II, Inc. (MVT) (Percentages shown are based on Net Assets) |
| | | | | | | | |
| Security | | Par (000) | | | Value | |
| | |
| Maryland — 0.8% | | | | | | |
Maryland Health & Higher Educational Facilities Authority, RB | | | | | | | | |
Series 2017, 5.00%, 12/01/46 | | $ | 420 | | | $ | 504,751 | |
Series B, (NPFGC), 7.00%, 07/01/22(f) | | | 370 | | | | 386,554 | |
Maryland State Transportation Authority, Refunding RB, Series A, 2.50%, 07/01/47 | | | 1,755 | | | | 1,691,265 | |
| | | | | | | | |
| | |
| | | | | | | 2,582,570 | |
| | |
| Massachusetts — 1.5% | | | | | | |
Massachusetts Development Finance Agency, Refunding RB(a) | | | | | | | | |
4.00%, 10/01/32 | | | 215 | | | | 231,433 | |
4.13%, 10/01/42 | | | 470 | | | | 504,439 | |
Massachusetts Housing Finance Agency, RB, M/F Housing | | | | | | | | |
Series C-1, 3.15%, 12/01/49 | | | 550 | | | | 558,227 | |
Series C-1, 3.25%, 12/01/54 | | | 2,030 | | | | 2,062,271 | |
Massachusetts Port Authority, ARB, Series E, AMT, 5.00%, 07/01/51 | | | 1,110 | | | | 1,381,124 | |
| | | | | | | | |
| | |
| | | | | | | 4,737,494 | |
| | |
| Michigan — 3.5% | | | | | | |
City of Detroit Michigan Sewage Disposal System Revenue, Refunding RB, Series A, Senior Lien, 5.25%, 07/01/22(c) | | | 4,425 | | | | 4,572,976 | |
Michigan Finance Authority, Refunding RB | | | | | | | | |
5.00%, 12/01/48 | | | 2,000 | | | | 2,428,516 | |
Series A, 4.00%, 12/01/49 | | | 810 | | | | 911,440 | |
Michigan State Housing Development Authority, RB, M/F Housing, Series A, 2.70%, 10/01/56 | | | 950 | | | | 934,197 | |
Michigan State University, Refunding RB, Series B, 5.00%, 02/15/48 | | | 990 | | | | 1,218,716 | |
Michigan Strategic Fund, RB, AMT, 5.00%, 06/30/48 | | | 1,070 | | | | 1,255,708 | |
| | | | | | | | |
| | |
| | | | | | | 11,321,553 | |
| | |
| Minnesota — 1.4% | | | | | | |
Duluth Economic Development Authority, Refunding RB | | | | | | | | |
Series A, 4.25%, 02/15/48 | | | 2,020 | | | | 2,214,896 | |
Series A, 5.25%, 02/15/53 | | | 2,045 | | | | 2,422,611 | |
| | | | | | | | |
| | |
| | | | | | | 4,637,507 | |
| | |
| Mississippi — 3.1% | | | | | | |
County of Lowndes Mississippi, Refunding RB, Series A, 6.80%, 04/01/22 | | | 3,000 | | | | 3,078,420 | |
State of Mississippi, RB | | | | | | | | |
Series A, 5.00%, 10/15/37 | | | 1,000 | | | | 1,215,281 | |
Series A, 4.00%, 10/15/38 | | | 5,000 | | | | 5,671,225 | |
| | | | | | | | |
| | |
| | | | | | | 9,964,926 | |
| | |
| Missouri — 3.1% | | | | | | |
Health & Educational Facilities Authority of the State of Missouri, RB, 4.00%, 06/01/53 | | | 2,885 | | | | 3,213,974 | |
Health & Educational Facilities Authority of the State of Missouri, Refunding RB | | | | | | | | |
5.50%, 05/01/43 | | | 245 | | | | 259,494 | |
5.00%, 09/01/48 | | | 2,610 | | | | 3,092,424 | |
| | | | | | | | |
| Security | | Par (000) | | | Value | |
| | |
| Missouri (continued) | | | | | | |
Health & Educational Facilities Authority of the State of Missouri, Refunding RB (continued) | | | | | | | | |
Series A, 4.00%, 07/01/46 | | $ | 595 | | | $ | 689,088 | |
Series C, 5.00%, 11/15/47 | | | 2,570 | | | | 3,025,633 | |
| | | | | | | | |
| | |
| | | | | | | 10,280,613 | |
| | |
| Nebraska — 0.7% | | | | | | |
Central Plains Energy Project, RB | | | | | | | | |
5.25%, 09/01/37 | | | 825 | | | | 857,933 | |
5.00%, 09/01/42 | | | 1,445 | | | | 1,500,007 | |
| | | | | | | | |
| | |
| | | | | | | 2,357,940 | |
| | |
| New Hampshire(a) — 0.8% | | | | | | |
New Hampshire Business Finance Authority, Refunding RB | | | | | | | | |
Series B, 4.63%, 11/01/42 | | | 1,545 | | | | 1,609,182 | |
Series C, AMT, 4.88%, 11/01/42 | | | 805 | | | | 841,702 | |
| | | | | | | | |
| | |
| | | | | | | 2,450,884 | |
| | |
| New Jersey — 14.2% | | | | | | |
Casino Reinvestment Development Authority, Inc., Refunding RB | | | | | | | | |
5.25%, 11/01/39 | | | 1,675 | | | | 1,853,058 | |
5.25%, 11/01/44 | | | 1,525 | | | | 1,660,971 | |
Hudson County Improvement Authority, RB, 4.00%, 10/01/46 | | | 1,655 | | | | 1,903,871 | |
New Jersey Economic Development Authority, RB | | | | | | | | |
4.00%, 11/01/38 | | | 510 | | | | 576,345 | |
4.00%, 11/01/39 | | | 405 | | | | 455,400 | |
5.00%, 06/15/49 | | | 2,295 | | | | 2,750,642 | |
Series EEE, 5.00%, 06/15/48 | | | 3,690 | | | | 4,412,410 | |
New Jersey Economic Development Authority, Refunding ARB, AMT, 5.00%, 10/01/47 | | | 1,425 | | | | 1,637,549 | |
New Jersey Economic Development Authority, Refunding SAB, 5.75%, 04/01/31 | | | 2,240 | | | | 2,388,994 | |
New Jersey Transportation Trust Fund Authority, RB | | | | | | | | |
Series AA, 5.00%, 06/15/44 | | | 1,270 | | | | 1,359,443 | |
Series BB, 5.00%, 06/15/50 | | | 4,120 | | | | 4,900,719 | |
New Jersey Turnpike Authority, RB | | | | | | | | |
Series A, 5.00%, 07/01/22(c) | | | 740 | | | | 763,526 | |
Series A, 4.00%, 01/01/42 | | | 730 | | | | 847,711 | |
Series E, 5.00%, 01/01/45 | | | 2,615 | | | | 2,930,191 | |
State of New Jersey, GO | | | | | | | | |
Series A, 4.00%, 06/01/31 | | | 560 | | | | 678,549 | |
Series A, 3.00%, 06/01/32 | | | 1,300 | | | | 1,445,462 | |
Tobacco Settlement Financing Corp., Refunding RB | | | | | | | | |
Series A, 5.25%, 06/01/46 | | | 525 | | | | 628,403 | |
Sub-Series B, 5.00%, 06/01/46 | | | 13,345 | | | | 15,360,362 | |
| | | | | | | | |
| | |
| | | | | | | 46,553,606 | |
| | |
| New York — 17.7% | | | | | | |
City of New York, GO, Series C, 5.00%, 08/01/42 | | | 1,115 | | | | 1,399,209 | |
Erie Tobacco Asset Securitization Corp., Refunding RB, Series A, 5.00%, 06/01/45 | | | 1,960 | | | | 1,973,900 | |
Metropolitan Transportation Authority, Refunding RB | | | | | | | | |
Series C-1, 4.75%, 11/15/45 | | | 1,585 | | | | 1,854,857 | |
Series C-1, 5.00%, 11/15/50 | | | 515 | | | | 610,421 | |
Series C-1, 5.25%, 11/15/55 | | | 760 | | | | 915,764 | |
| | |
SCHEDULE OF INVESTMENTS | | 55 |
| | |
Schedule of Investments (unaudited) (continued) October 31, 2021 | | BlackRock MuniVest Fund II, Inc. (MVT) (Percentages shown are based on Net Assets) |
| | | | | | | | |
| Security | | Par (000) | | | Value | |
| | |
| New York (continued) | | | | | | |
Monroe County Industrial Development Corp., Refunding RB | | | | | | | | |
4.00%, 12/01/46 | | $ | 520 | | | $ | 585,467 | |
Series A, 4.00%, 07/01/50 | | | 1,065 | | | | 1,222,571 | |
New York City Housing Development Corp., RB, M/F Housing | | | | | | | | |
Series A, 3.00%, 11/01/55 | | | 1,055 | | | | 1,069,892 | |
Series F-1, (FHA), 2.40%, 11/01/46 | | | 2,530 | | | | 2,408,226 | |
Series F-1, (FHA), 2.50%, 11/01/51 | | | 1,745 | | | | 1,715,159 | |
New York City Industrial Development Agency, Refunding RB | | | | | | | | |
Series A, Class A, (AGM), 3.00%, 01/01/37 | | | 215 | | | | 231,280 | |
Series A, Class A, (AGM), 3.00%, 01/01/39 | | | 215 | | | | 230,391 | |
Series A, Class A, (AGM), 3.00%, 01/01/40 | | | 150 | | | | 160,234 | |
New York City Transitional Finance Authority Future Tax Secured Revenue, RB | | | | | | | | |
Sub-Series E-1, 5.00%, 02/01/42 | | | 1,960 | | | | 1,981,974 | |
Series C, Subordinate, 4.00%, 05/01/45 | | | 1,080 | | | | 1,243,361 | |
Sub-Series C-1, Subordinate, 4.00%, 05/01/40 | | | 430 | | | | 499,978 | |
New York Counties Tobacco Trust IV, Refunding RB | | | | | | | | |
Series A, 5.00%, 06/01/38 | | | 1,905 | | | | 1,906,943 | |
Series A, 6.25%, 06/01/41(a) | | | 1,800 | | | | 1,825,436 | |
New York Liberty Development Corp., ARB, 5.25%, 12/15/43 | | | 10,735 | | | | 10,795,245 | |
New York Liberty Development Corp., Refunding RB | | | | | | | | |
2.88%, 11/15/46 | | | 3,365 | | | | 3,371,552 | |
Series 1, Class 1, 5.00%, 11/15/44(a) | | | 2,860 | | | | 3,123,981 | |
Series 2, Class 2, 5.15%, 11/15/34(a) | | | 340 | | | | 379,893 | |
Series 2, Class 2, 5.38%, 11/15/40(a) | | | 850 | | | | 951,257 | |
New York State Environmental Facilities Corp., RB, Series B, Subordinate, 5.00%, 06/15/48 | | | 1,780 | | | | 2,183,140 | |
New York State Urban Development Corp., RB | | | | | | | | |
Series A, 4.00%, 03/15/49 | | | 7,895 | | | | 9,005,866 | |
Series A, 3.00%, 03/15/50 | | | 1,285 | | | | 1,333,256 | |
New York Transportation Development Corp., RB | | | | | | | | |
AMT, 5.00%, 10/01/35 | | | 350 | | | | 432,315 | |
AMT, 5.00%, 10/01/40 | | | 1,000 | | | | 1,217,828 | |
Triborough Bridge & Tunnel Authority, RB | | | | | | | | |
Series A, 4.00%, 11/15/54 | | | 985 | | | | 1,137,102 | |
Series A, 5.00%, 11/15/54 | | | 840 | | | | 1,046,536 | |
Series A, 5.00%, 11/15/56 | | | 885 | | | | 1,109,574 | |
| | | | | | | | |
| | |
| | | | | | | 57,922,608 | |
| | |
| North Carolina — 0.9% | | | | | | |
County of Union North Carolina Enterprise System Revenue, RB, 3.00%, 06/01/51 | | | 2,055 | | | | 2,186,306 | |
University of North Carolina at Chapel Hill, RB, 5.00%, 02/01/49 | | | 530 | | | | 797,762 | |
| | | | | | | | |
| | |
| | | | | | | 2,984,068 | |
| | |
| North Dakota — 0.3% | | | | | | |
County of Cass North Dakota, Refunding RB, Series B, 5.25%, 02/15/58 | | | 950 | | | | 1,122,364 | |
| | | | | | | | |
| | |
| Ohio — 3.2% | | | | | | |
Buckeye Tobacco Settlement Financing Authority, Refunding RB | | | | | | | | |
Series A-2, Class 1, 4.00%, 06/01/37 | | | 285 | | | | 326,506 | |
Series A-2, Class 1, 4.00%, 06/01/38 | | | 285 | | | | 324,697 | |
Series A-2, Class 1, 4.00%, 06/01/39 | | | 285 | | | | 323,746 | |
Series A-2, Class 1, 4.00%, 06/01/48 | | | 755 | | | | 834,884 | |
| | | | | | | | |
| Security | | Par (000) | | | Value | |
| | |
| Ohio (continued) | | | | | | |
Buckeye Tobacco Settlement Financing Authority, Refunding RB (continued) | | | | | | | | |
Series B-2, Class 2, 5.00%, 06/01/55 | | $ | 2,725 | | | $ | 3,062,137 | |
County of Franklin Ohio, RB | | | | | | | | |
Series 2017, 5.00%, 12/01/46 | | | 400 | | | | 477,089 | |
Series A, 6.13%, 07/01/22(c) | | | 660 | | | | 685,865 | |
Series A, 4.00%, 12/01/49 | | | 505 | | | | 577,169 | |
County of Hamilton Ohio, Refunding RB | | | | | | | | |
4.00%, 08/15/50 | | | 590 | | | | 663,697 | |
Series A, 3.75%, 08/15/50 | | | 1,040 | | | | 1,132,700 | |
County of Montgomery Ohio, Refunding RB, 4.00%, 08/01/46 | | | 915 | | | | 1,048,509 | |
Ohio Air Quality Development Authority, RB, AMT,
5.00%, 07/01/49(a) | | | 730 | | | | 837,372 | |
State of Ohio, RB, AMT, 5.00%, 06/30/53 | | | 275 | | | | 302,401 | |
| | | | | | | | |
| | |
| | | | | | | 10,596,772 | |
| | |
| Oklahoma — 1.8% | | | | | | |
Oklahoma Development Finance Authority, RB, Series B, 5.50%, 08/15/57 | | | 1,155 | | | | 1,405,701 | |
Oklahoma Turnpike Authority, RB | | | | | | | | |
Series A, 4.00%, 01/01/48 | | | 2,050 | | | | 2,313,710 | |
Series C, 4.00%, 01/01/42 | | | 1,950 | | | | 2,211,152 | |
| | | | | | | | |
| | |
| | | | | | | 5,930,563 | |
| | |
| Oregon — 1.3% | | | | | | |
Medford Hospital Facilities Authority, Refunding RB, Series A, 4.00%, 08/15/50 | | | 1,680 | | | | 1,909,735 | |
Port of Portland Oregon Airport Revenue, Refunding ARB, Series 27-A, AMT, 5.00%, 07/01/45 | | | 1,795 | | | | 2,181,270 | |
| | | | | | | | |
| | |
| | | | | | | 4,091,005 | |
| | |
| Pennsylvania — 3.7% | | | | | | |
Allentown Neighborhood Improvement Zone Development Authority, RB(a) | | | | | | | | |
Subordinate, 5.00%, 05/01/28 | | | 185 | | | | 209,842 | |
Subordinate, 5.13%, 05/01/32 | | | 230 | | | | 269,625 | |
Subordinate, 5.38%, 05/01/42 | | | 435 | | | | 501,290 | |
Hospitals & Higher Education Facilities Authority of Philadelphia, RB, Series A, 5.63%, 07/01/42 | | | 635 | | | | 653,364 | |
Lancaster Industrial Development Authority, RB,
5.00%, 12/01/49 | | | 1,300 | | | | 1,508,346 | |
Montgomery County Higher Education and Health Authority, Refunding RB | | | | | | | | |
Series A, 5.00%, 09/01/43 | | | 1,220 | | | | 1,474,958 | |
Series A, 4.00%, 09/01/49 | | | 555 | | | | 613,886 | |
Pennsylvania Economic Development Financing Authority, RB, AMT, 5.00%, 06/30/42 | | | 850 | | | | 978,662 | |
Pennsylvania Economic Development Financing Authority, Refunding RB, AMT, 5.50%, 11/01/44 | | | 1,035 | | | | 1,093,503 | |
Pennsylvania Higher Educational Facilities Authority, RB, 4.00%, 08/15/49 | | | 2,305 | | | | 2,633,730 | |
Pennsylvania Turnpike Commission, RB, Series A, 5.00%, 12/01/44 | | | 1,105 | | | | 1,241,105 | |
School District of Philadelphia, GO,
Series A, (SAW), 4.00%, 09/01/46 | | | 675 | | | | 769,279 | |
| | | | | | | | |
| | |
| | | | | | | 11,947,590 | |
| | |
| Puerto Rico — 5.9% | | | | | | |
Children’s Trust Fund, Refunding RB | | | | | | | | |
5.50%, 05/15/39 | | | 675 | | | | 691,577 | |
5.63%, 05/15/43 | | | 690 | | | | 697,945 | |
| | |
| 56 | | 2 0 2 1 BLACK ROCK SEMI - ANNUAL REPORT TO SHAREHOLDERS |
| | |
Schedule of Investments (unaudited) (continued) October 31, 2021 | | BlackRock MuniVest Fund II, Inc. (MVT) (Percentages shown are based on Net Assets) |
| | | | | | | | |
| Security | | Par (000) | | | Value | |
| | |
| Puerto Rico (continued) | | | | | | |
Puerto Rico Commonwealth Aqueduct & Sewer Authority, RB | | | | | | | | |
Series A, Senior Lien, 5.00%, 07/01/33 | | $ | 2,430 | | | $ | 2,507,255 | |
Series A, Senior Lien, 5.13%, 07/01/37 | | | 695 | | | | 717,660 | |
Puerto Rico Sales Tax Financing Corp. Sales Tax Revenue, RB | | | | | | | | |
Series A-1, Restructured, 4.75%, 07/01/53 | | | 1,843 | | | | 2,049,961 | |
Series A-1, Restructured, 5.00%, 07/01/58 | | | 6,807 | | | | 7,684,831 | |
Series A-2, Restructured, 4.33%, 07/01/40 | | | 85 | | | | 93,211 | |
Series A-2, Restructured, 4.78%, 07/01/58 | | | 2,941 | | | | 3,276,892 | |
Puerto Rico Sales Tax Financing Corp. Sales Tax Revenue, RB, CAB(b) | | | | | | | | |
Series A-1, Restructured, 0.00%, 07/01/46 | | | 3,564 | | | | 1,160,802 | |
Series A-1, Restructured, 0.00%, 07/01/51 | | | 1,971 | | | | 464,340 | |
| | | | | | | | |
| | |
| | | | | | | 19,344,474 | |
| | |
| Rhode Island — 2.1% | | | | | | |
Tobacco Settlement Financing Corp., Refunding RB | | | | | | | | |
Series A, 5.00%, 06/01/35 | | | 820 | | | | 920,564 | |
Series B, 4.50%, 06/01/45 | | | 2,645 | | | | 2,828,412 | |
Series B, 5.00%, 06/01/50 | | | 2,945 | | | | 3,225,279 | |
| | | | | | | | |
| | |
| | | | | | | 6,974,255 | |
| | |
| South Carolina — 5.7% | | | | | | |
South Carolina Jobs-Economic Development Authority, Refunding RB | | | | | | | | |
5.00%, 02/01/36 | | | 2,505 | | | | 2,918,759 | |
5.00%, 11/15/47 | | | 1,350 | | | | 1,559,305 | |
Series A, 5.00%, 05/01/48 | | | 3,060 | | | | 3,610,843 | |
South Carolina Public Service Authority, RB, Series A, 5.50%, 12/01/54 | | | 6,180 | | | | 6,890,589 | |
South Carolina Public Service Authority, Refunding RB | | | | | | | | |
Series A, 5.00%, 12/01/50 | | | 1,430 | | | | 1,615,125 | |
Series E, 5.25%, 12/01/55 | | | 1,735 | | | | 1,995,510 | |
| | | | | | | | |
| | |
| | | | | | | 18,590,131 | |
| | |
| Tennessee — 1.0% | | | | | | |
Chattanooga Health Educational & Housing Facility Board, RB, Series A, 5.25%, 01/01/23(c) | | | 995 | | | | 1,052,903 | |
Chattanooga Health Educational & Housing Facility Board, Refunding RB, Series A, 4.00%, 08/01/44 | | | 160 | | | | 180,051 | |
Metropolitan Government Nashville & Davidson County Health & Educational Facilities Board, RB, Series A, 5.00%, 07/01/40 | | | 690 | | | | 802,727 | |
Metropolitan Government Nashville & Davidson County Health & Educational Facilities Board, Refunding RB, Series A, 5.25%, 10/01/58 | | | 955 | | | | 1,139,423 | |
| | | | | | | | |
| | |
| | | | | | | 3,175,104 | |
| | |
| Texas — 5.8% | | | | | | |
Central Texas Regional Mobility Authority, RB, Series E, Senior Lien, 4.00%, 01/01/50 | | | 2,160 | | | | 2,418,995 | |
City of Houston Texas Airport System Revenue, Refunding RB, AMT, 5.00%, 07/01/29 | | | 775 | | | | 839,419 | |
City of San Antonio Texas Electric & Gas Systems Revenue, Refunding RB, Series A, 5.00%, 02/01/48 | | | 1,155 | | | | 1,416,048 | |
Clifton Higher Education Finance Corp., RB, 6.00%, 08/15/43 | | | 745 | | | | 810,728 | |
Fort Bend County Industrial Development Corp., RB, Series B, 4.75%, 11/01/42 | | | 670 | | | | 695,044 | |
| | | | | | | | |
| Security | | Par (000) | | | Value | |
| | |
| Texas (continued) | | | | | | |
Harris County Cultural Education Facilities Finance Corp., RB, Series B, 7.00%, 01/01/23(c) | | $ | 455 | | | $ | 490,718 | |
New Hope Cultural Education Facilities Finance Corp., Refunding RB, Series A, 5.00%, 08/15/46(a) | | | 1,980 | | | | 1,945,904 | |
North Texas Tollway Authority, Refunding RB, Series A, 5.00%, 01/01/38 | | | 925 | | | | 1,043,858 | |
San Antonio Water System, Refunding RB, Series A, Junior Lien, 5.00%, 05/15/48 | | | 1,245 | | | | 1,507,584 | |
Tarrant County Cultural Education Facilities Finance Corp., RB, Series B, 5.00%, 07/01/48 | | | 4,545 | | | | 5,455,818 | |
Tarrant County Cultural Education Facilities Finance Corp., Refunding RB, 5.00%, 10/01/49 | | | 1,000 | | | | 1,083,068 | |
Texas Transportation Commission, RB, Series A, 5.00%, 08/01/57 | | | 1,140 | | | | 1,304,931 | |
| | | | | | | | |
| | |
| | | | | | | 19,012,115 | |
| | |
| Utah — 1.0% | | | | | | |
County of Utah, RB | | | | | | | | |
Series A, 4.00%, 05/15/43 | | | 215 | | | | 248,064 | |
Series A, 3.00%, 05/15/50 | | | 985 | | | | 1,013,507 | |
Salt Lake City Corp. Airport Revenue, ARB | | | | | | | | |
Series A, AMT, 5.00%, 07/01/47 | | | 915 | | | | 1,070,617 | |
Series A, AMT, 5.00%, 07/01/48 | | | 875 | | | | 1,034,741 | |
| | | | | | | | |
| | |
| | | | | | | 3,366,929 | |
| | |
| Virginia — 1.8% | | | | | | |
Front Royal & Warren County Industrial Development Authority, RB, 4.00%, 01/01/50 | | | 1,160 | | | | 1,257,425 | |
Lexington Industrial Development Authority, RB, Series A, 5.00%, 01/01/48 | | | 820 | | | | 868,037 | |
Virginia Small Business Financing Authority, RB | | | | | | | | |
AMT, Senior Lien, 5.25%, 01/01/32 | | | 1,615 | | | | 1,662,797 | |
AMT, Senior Lien, 6.00%, 01/01/37 | | | 1,940 | | | | 2,006,098 | |
| | | | | | | | |
| | |
| | | | | | | 5,794,357 | |
| | |
| Washington — 1.6% | | | | | | |
Port of Seattle Washington, ARB | | | | | | | | |
Series A, AMT, 5.00%, 05/01/43 | | | 1,465 | | | | 1,700,994 | |
Series C, AMT, 5.00%, 04/01/40 | | | 755 | | | | 839,842 | |
Washington Health Care Facilities Authority, RB, Series A, 5.75%, 01/01/23(c) | | | 2,290 | | | | 2,436,734 | |
Washington Health Care Facilities Authority, Refunding RB, Series A, 4.00%, 08/01/44 | | | 340 | | | | 380,905 | |
| | | | | | | | |
| | |
| | | | | | | 5,358,475 | |
| | |
| West Virginia — 0.5% | | | | | | |
West Virginia Parkways Authority, RB, Senior Lien, 4.00%, 06/01/51 | | | 1,455 | | | | 1,693,007 | |
| | | | | | | | |
| | |
Total Municipal Bonds — 128.0%
(Cost: $382,471,785) | | | | | | | 418,443,615 | |
| | | | | | | | |
|
Municipal Bonds Transferred to Tender Option Bond Trusts(g) | |
| | |
| California — 2.2% | | | | | | |
Bay Area Toll Authority, Refunding RB, 4.00%, 04/01/42(h) | | | 3,056 | | | | 3,435,677 | |
Sacramento Area Flood Control Agency, Refunding SAB, 5.00%, 10/01/47 | | | 3,075 | | | | 3,621,862 | |
| | | | | | | | |
| | |
| | | | | | | 7,057,539 | |
| | |
SCHEDULE OF INVESTMENTS | | 57 |
| | |
Schedule of Investments (unaudited) (continued) October 31, 2021 | | BlackRock MuniVest Fund II, Inc. (MVT) (Percentages shown are based on Net Assets) |
| | | | | | | | |
| Security | | Par (000) | | | Value | |
| |
| | |
| Colorado — 0.8% | | | | | | |
City & County of Denver Colorado Airport System Revenue, Refunding ARB, Series A, AMT, 5.25%, 12/01/48(h) | | $ | 2,253 | | | $ | 2,741,374 | |
| | | | | | | | |
| | |
| District of Columbia — 0.6% | | | | | | |
Metropolitan Washington Airports Authority Dulles Toll Road Revenue, Refunding RB, Series B, Subordinate, (AGM), 4.00%, 10/01/53 | | | 1,798 | | | | 2,032,179 | |
| | | | | | | | |
| | |
| Georgia — 1.1% | | | | | | |
Dalton Whitfield County Joint Development Authority, RB, 4.00%, 08/15/48 | | | 1,821 | | | | 2,033,759 | |
Georgia Housing & Finance Authority, Refunding RB, Series A, 3.60%, 12/01/44 | | | 1,442 | | | | 1,535,207 | |
| | | | | | | | |
| | |
| | | | | | | 3,568,966 | |
| | |
| Illinois — 1.1% | | | | | | |
Illinois Finance Authority, Refunding RB | | | | | | | | |
Series C, 4.00%, 02/15/27(c) | | | 6 | | | | 7,004 | |
Series C, 4.00%, 02/15/41 | | | 3,219 | | | | 3,621,108 | |
| | | | | | | | |
| | |
| | | | | | | 3,628,112 | |
| | |
| Massachusetts — 2.3% | | | | | | |
Commonwealth of Massachusetts Transportation Fund Revenue, RB, Series A, 4.00%, 06/01/45 | | | 2,043 | | | | 2,222,550 | |
Massachusetts Development Finance Agency, Refunding RB, 5.00%, 07/01/47 | | | 4,574 | | | | 5,335,359 | |
| | | | | | | | |
| | |
| | | | | | | 7,557,909 | |
| | |
| New Jersey — 2.2% | | | | | | |
New Jersey Health Care Facilities Financing Authority, RB, 4.00%, 07/01/51 | | | 6,241 | | | | 7,182,797 | |
| | | | | | | | |
| | |
| New York — 8.9% | | | | | | |
Hudson Yards Infrastructure Corp., RB,
5.75%, 02/15/47(h) | | | 522 | | | | 522,467 | |
New York Liberty Development Corp., Refunding RB, 5.75%, 11/15/51(h) | | | 6,440 | | | | 6,453,328 | |
New York Power Authority, Refunding RB, Series A, 4.00%, 11/15/60 | | | 1,308 | | | | 1,497,630 | |
New York State Dormitory Authority, Refunding RB, Series D, 4.00%, 02/15/47 | | | 5,956 | | | | 6,759,898 | |
New York State Thruway Authority, Refunding RB, Series B, Subordinate, 4.00%, 01/01/50 | | | 2,884 | | | | 3,264,912 | |
New York State Urban Development Corp., RB, Series A, 4.00%, 03/15/46 | | | 6,617 | | | | 7,434,259 | |
Port Authority of New York & New Jersey, Refunding ARB, 194th Series, 5.25%, 10/15/55 | | | 2,595 | | | | 2,989,874 | |
| | | | | | | | |
| | |
| | | | | | | 28,922,368 | |
| | |
| North Carolina — 0.9% | | | | | | |
North Carolina Capital Facilities Finance Agency, Refunding RB, Series B, 5.00%, 10/01/25(c) | | | 2,550 | | | | 2,990,240 | |
| | | | | | | | |
| | |
| Ohio — 0.7% | | | | | | |
Ohio State University, RB, 4.00%, 12/01/48 | | | 2,071 | | | | 2,435,345 | |
| | | | | | | | |
| | |
| Pennsylvania — 0.9% | | | | | | |
Pennsylvania Turnpike Commission, RB, Sub-Series A, 5.50%, 12/01/42 | | | 2,340 | | | | 2,827,239 | |
| | | | | | | | |
| | | | | | | | |
| Security | | Par (000) | | | Value | |
| |
| | |
| Rhode Island — 0.5% | | | | | | |
Narragansett Bay Commission, Refunding RB, Series A, 4.00%, 09/01/22(c) | | $ | 1,530 | | | $ | 1,578,166 | |
| | | | | | | | |
| | |
| Texas — 5.5% | | | | | | |
Board of Regents of the University of Texas System, Refunding RB, Series B, 5.00%, 08/15/43 | | | 1,831 | | | | 1,894,214 | |
City of San Antonio Texas Electric & Gas Systems Revenue, RB, Junior Lien, 5.00%, 02/01/23(c) | | | 2,520 | | | | 2,668,102 | |
Lower Colorado River Authority, Refunding, RB, 4.00%, 05/15/43 | | | 2,030 | | | | 2,066,564 | |
Metropolitan Transit Authority of Harris County Sales & Use Tax Revenue, Refunding RB, Series A, 5.00%, 11/01/21 | | | 3,400 | | | | 3,400,000 | |
Texas Water Development Board, RB, Series A, 4.00%, 10/15/49 | | | 6,900 | | | | 7,924,358 | |
| | | | | | | | |
| | |
| | | | | | | 17,953,238 | |
| | |
| Virginia — 2.4% | | | | | | |
Hampton Roads Transportation Accountability Commission, RB, Series A, Senior Lien, 4.00%, 07/01/60(h) | | | 2,145 | | | | 2,466,761 | |
Virginia Small Business Financing Authority, Refunding RB, Series A, 4.00%, 12/01/49 | | | 4,780 | | | | 5,420,312 | |
| | | | | | | | |
| | |
| | | | | | | 7,887,073 | |
| | |
| Wisconsin — 2.0% | | | | | | |
Wisconsin Health & Educational Facilities Authority, Refunding RB | | | | | | | | |
4.00%, 12/01/46 | | | 2,833 | | | | 3,142,765 | |
4.00%, 12/15/49(h) | | | 2,940 | | | | 3,302,580 | |
| | | | | | | | |
| | |
| | | | | | | 6,445,345 | |
| | | | | | | | |
| |
Total Municipal Bonds Transferred to Tender Option Bond Trusts — 32.1%
(Cost: $99,133,048) | | | | 104,807,890 | |
| | | | | | | | |
| |
Total Long-Term Investments — 160.1%
(Cost: $481,604,833) | | | | 523,251,505 | |
| | | | | | | | |
| | |
| | | Shares | | | | |
| |
| | |
Short-Term Securities | | | | | | | | |
| | |
| Money Market Funds — 0.5% | | | | | | |
BlackRock Liquidity Funds, MuniCash, Institutional Class, 0.01%(i)(j) | | | 1,719,176 | | | | 1,719,348 | |
| | | | | | | | |
| |
Total Short-Term Securities — 0.5%
(Cost: $1,719,348) | | | | 1,719,348 | |
| | | | | | | | |
| |
Total Investments — 160.6%
(Cost: $483,324,181) | | | | 524,970,853 | |
| |
Other Assets Less Liabilities — 1.2% | | | | 3,821,031 | |
| |
Liability for TOB Trust Certificates, Including Interest Expense and Fees Payable — (19.0)% | | | | (62,001,793 | ) |
| |
VMTP Shares at Liquidation Value — (42.8)% | | | | (140,000,000 | ) |
| | | | | | | | |
| |
Net Assets Applicable to Common Shares — 100.0% | | | $ | 326,790,091 | |
| | | | | | | | |
| (a) | Security exempt from registration pursuant to Rule 144A under the Securities Act of 1933, as amended. These securities may be resold in transactions exempt from registration to qualified institutional investors. |
| | |
| 58 | | 2 0 2 1 BLACK ROCK SEMI - ANNUAL REPORT TO SHAREHOLDERS |
| | |
Schedule of Investments (unaudited) (continued) October 31, 2021 | | BlackRock MuniVest Fund II, Inc. (MVT) |
| (c) | U.S. Government securities held in escrow, are used to pay interest on this security as well as to retire the bond in full at the date indicated, typically at a premium to par. |
| (d) | Variable rate security. Interest rate resets periodically. The rate shown is the effective interest rate as of period end. Security description also includes the reference rate and spread if published and available. |
| (e) | Step coupon security. Coupon rate will either increase (step-up bond) or decrease (step-down bond) at regular intervals until maturity. Interest rate shown reflects the rate currently in effect. |
| (f) | Security is collateralized by municipal bonds or U.S. Treasury obligations. |
| (g) | Represent bonds transferred to a TOB Trust in exchange of cash and residual certificates received by the Fund. These bonds serve as collateral in a secured borrowing. See Note 4 of the Notes to Financial Statements for details. |
| (h) | All or a portion of the security is subject to a recourse agreement. The aggregate maximum potential amount the Fund could ultimately be required to pay under the agreements, which expire between April 1, 2025 to November 15, 2051, is $10,609,108. See Note 4 of the Notes to Financial Statements for details. |
| (i) | Affiliate of the Fund. |
| (j) | Annualized 7-day yield as of period end. |
Affiliates
Investments in issuers considered to be affiliate(s) of the Fund during the six months ended October 31, 2021 for purposes of Section 2(a)(3) of the Investment Company Act of 1940, as amended, were as follows:
| | | | | | | | | | | | | | | | | | | | | | | | | | | | | | | | | | | | |
| | | | | | | | | | |
| Affiliated Issuer | | Value at 04/30/21 | | | Purchases at Cost | | | Proceeds from Sales | | | Net Realized Gain (Loss) | | | Change in Unrealized Appreciation (Depreciation) | | | Value at 10/31/21 | | | Shares Held at 10/31/21 | | | Income | | | Capital Gain Distributions from Underlying Funds | |
| | | | | | | | | |
BlackRock Liquidity Funds, MuniCash, Institutional Class | | $ | 655,154 | | | $ | 1,064,552 | (a) | | $ | — | | | $ | (272 | ) | | $ | (86 | ) | | $ | 1,719,348 | | | | 1,719,176 | | | $ | 45 | | | $ | — | |
| | | | | | | | | | | | | | | | | | | | | | | | | | | | | | | | | | | | |
| | (a) | Represents net amount purchased (sold). | |
Derivative Financial Instruments Outstanding as of Period End
Futures Contracts
| | | | | | | | | | | | | | | | |
| | | | | |
| Description | | Number of Contracts | | | Expiration Date | | | Notional Amount (000) | | | Value/ Unrealized Appreciation (Depreciation) | |
| | | | |
Short Contracts | | | | | | | | | | | | | | | | |
10-Year U.S. Treasury Note | | | 40 | | | | 12/21/21 | | | $ | 5,226 | | | $ | 91,086 | |
U.S. Long Bond | | | 32 | | | | 12/21/21 | | | | 5,146 | | | | 50,251 | |
5-Year U.S. Treasury Note | | | 26 | | | | 12/31/21 | | | | 3,164 | | | | 41,992 | |
| | | | | | | | | | | | | | | | |
| | | | |
| | | | | | | | | | | | | | $ | 183,329 | |
| | | | | | | | | | | | | | | | |
Derivative Financial Instruments Categorized by Risk Exposure
As of period end, the fair values of derivative financial instruments located in the Statements of Assets and Liabilities were as follows:
| | | | | | | | | | | | | | | | | | | | | | | | | | | | |
| | | | | | | | |
| Currency | | Commodity Contracts | | | Credit Contracts | | | Equity Contracts | | | Foreign Currency Exchange Contracts | | | Interest Rate Contracts | | | Other Contracts | | | Total | |
| | | | | | | |
Assets — Derivative Financial Instruments | | | | | | | | | | | | | | | | | | | | | | | | | | | | |
Futures contracts | | | | | | | | | | | | | | | | | | | | | | | | | | | | |
Unrealized appreciation on futures contracts(a) | | $ | — | | | $ | — | | | $ | — | | | $ | — | | | $ | 183,329 | | | $ | — | | | $ | 183,329 | |
| | | | | | | | | | | | | | | | | | | | | | | | | | | | |
| | (a) | Net cumulative unrealized appreciation (depreciation) on futures contracts and centrally cleared swaps, if any, are reported in the Schedule of Investments. In the Statements of Assets and Liabilities, only current day’s variation margin is reported in receivables or payables and the net cumulative unrealized appreciation (depreciation) is included in accumulated earnings (loss). | |
| | |
SCHEDULE OF INVESTMENTS | | 59 |
| | |
Schedule of Investments (unaudited) (continued) October 31, 2021 | | BlackRock MuniVest Fund II, Inc. (MVT) |
For the period ended October 31, 2021, the effect of derivative financial instruments in the Statements of Operations was as follows:
| | | | | | | | | | | | | | | | | | | | | | | | | | | | |
| | | | | | | | |
| Currency | | Commodity Contracts | | | Credit Contracts | | | Equity Contracts | | | Foreign Currency Exchange Contracts | | | Interest Rate Contracts | | | Other Contracts | | | Total | |
| | | | | | | |
Net Realized Gain (Loss) from: | | | | | | | | | | | | | | | | | | | | | | | | | | | | |
Futures contracts | | $ | — | | | $ | — | | | $ | — | | | $ | — | | | $ | (856,039 | ) | | $ | — | | | $ | (856,039 | ) |
| | | | | | | | | | | | | | | | | | | | | | | | | | | | |
| | | | | | | |
Net Change in Unrealized Appreciation (Depreciation) on: | | | | | | | | | | | | | | | | | | | | | | | | | | | | |
Futures contracts | | $ | — | | | $ | — | | | $ | — | | | $ | — | | | $ | 274,931 | | | $ | — | | | $ | 274,931 | |
| | | | | | | | | | | | | | | | | | | | | | | | | | | | |
Average Quarterly Balances of Outstanding Derivative Financial Instruments
| | | | |
| | |
Futures contracts: | | | | |
Average notional value of contracts — short. | | $ | 13,846,094 | |
For more information about the Fund’s investment risks regarding derivative financial instruments, refer to the Notes to Financial Statements.
Fair Value Hierarchy as of Period End
Various inputs are used in determining the fair value of financial instruments. For a description of the input levels and information about the Fund’s policy regarding valuation of financial instruments, refer to the Notes to Financial Statements.
The following table summarizes the Fund’s financial instruments categorized in the fair value hierarchy. The breakdown of the Fund’s financial instruments into major categories is disclosed in the Schedule of Investments above.
| | | | | | | | | | | | | | | | | | | | | | | | | | | | |
| | | | | | | | |
| | | Level 1 | | | | | | Level 2 | | | | | | Level 3 | | | | | | Total | |
| | | | | | | |
Assets | | | | | | | | | | | | | | | | | | | | | | | | | | | | |
Investments | | | | | | | | | | | | | | | | | | | | | | | | | | | | |
Long-Term Investments | | | | | | | | | | | | | | | | | | | | | | | | | | | | |
Municipal Bonds | | $ | — | | | | | | | $ | 418,443,615 | | | | | | | $ | — | | | | | | | $ | 418,443,615 | |
Municipal Bonds Transferred to Tender Option Bond Trusts | | | — | | | | | | | | 104,807,890 | | | | | | | | — | | | | | | | | 104,807,890 | |
Short-Term Securities | | | | | | | | | | | | | | | | | | | | | | | | | | | | |
Money Market Funds | | | 1,719,348 | | | | | | | | — | | | | | | | | — | | | | | | | | 1,719,348 | |
| | | | | | | | | | | | | | | | | | | | | | | | | | | | |
| | | | | | | |
| | $ | 1,719,348 | | | | | | | $ | 523,251,505 | | | | | | | $ | — | | | | | | | $ | 524,970,853 | |
| | | | | | | | | | | | | | | | | | | | | | | | | | | | |
Derivative Financial Instruments(a) | | | | | | | | | | | | | | | | | | | | | | | | | | | | |
Assets | | | | | | | | | | | | | | | | | | | | | | | | | | | | |
Interest Rate Contracts | | $ | 183,329 | | | | | | | $ | — | | | | | | | $ | — | | | | | | | $ | 183,329 | |
| | | | | | | | | | | | | | | | | | | | | | | | | | | | |
| | (a) | Derivative financial instruments are futures contracts. Futures contracts are valued at the unrealized appreciation (depreciation) on the instrument. | |
The Fund may hold assets and/or liabilities in which the fair value approximates the carrying amount for financial statement purposes. As of period end, such assets and/or liabilities are categorized within the fair value hierarchy as follows:
| | | | | | | | | | | | | | | | | | | | | | | | | | | | |
| |
| | | | | | | |
| | | Level 1 | | | | | | Level 2 | | | | | | Level 3 | | | | | | Total | |
| |
| | | | | | | |
Liabilities | | | | | | | | | | | | | | | | | | | | | | | | | | | | |
TOB Trust Certificates | | $ | — | | | | | | | $ | (61,988,645 | ) | | | | | | $ | — | | | | | | | $ | (61,988,645 | ) |
VMTP Shares at Liquidation Value | | | — | | | | | | | | (140,000,000 | ) | | | | | | | — | | | | | | | | (140,000,000 | ) |
| | | | | | | | | | | | | | | | | | | | | | | | | | | | |
| | | | | | | |
| | $ | — | | | | | | | $ | (201,988,645 | ) | | | | | | $ | — | | | | | | | $ | (201,988,645 | ) |
| | | | | | | | | | | | | | | | | | | | | | | | | | | | |
See notes to financial statements.
| | |
| 60 | | 2 0 2 1 BLACK ROCK SEMI - ANNUAL REPORT TO SHAREHOLDERS |
Statements of Assets and Liabilities (unaudited)
October 31, 2021
| | | | | | | | | | | | | | | | |
| | | MUA | | | MUI | | | MHD | | | MVT | |
| |
| | | | |
ASSETS | | | | | | | | | | | | | | | | |
Investments, at value — unaffiliated(a) | | $ | 616,666,630 | | | $ | 972,730,902 | | | $ | 1,436,356,377 | | | $ | 523,251,505 | |
Investments, at value — affiliated(b) | | | 7,268,096 | | | | 14,803,933 | | | | 13,062,094 | | | | 1,719,348 | |
Cash | | | — | | | | 159,190 | | | | 96,813 | | | | 37,156 | |
Cash pledged for futures contracts | | | — | | | | 630,000 | | | | 486,000 | | | | 189,000 | |
Receivables: | | | | | | | | | | | | | | | | |
Investments sold | | | 2,214,808 | | | | 1,364,022 | | | | 222,657 | | | | 515,000 | |
Dividends — affiliated | | | 32 | | | | 59 | | | | 57 | | | | 11 | |
Interest — unaffiliated | | | 8,612,552 | | | | 12,203,390 | | | | 17,842,511 | | | | 6,544,223 | |
Variation margin on futures contracts | | | — | | | | 28,688 | | | | 12,125 | | | | 4,563 | |
Deferred offering costs | | | 67,565 | | | | — | | | | — | | | | — | |
Prepaid expenses | | | — | | | | 4,456 | | | | 53,061 | | | | 8,237 | |
| | | | | | | | | | | | | | | | |
| | | | |
Total assets | | | 634,829,683 | | | | 1,001,924,640 | | | | 1,468,131,695 | | | | 532,269,043 | |
| | | | | | | | | | | | | | | | |
| | | | |
ACCRUED LIABILITIES | | | | | | | | | | | | | | | | |
Payables: | | | | | | | | | | | | | | | | |
Investments purchased | | | 3,780,522 | | | | 23,773,313 | | | | 5,014,688 | | | | 1,814,184 | |
Accounting services fees | | | 110,545 | | | | 156,019 | | | | 252,463 | | | | 101,279 | |
Custodian fees | | | 10,477 | | | | 14,740 | | | | 23,756 | | | | 8,740 | |
Income dividend distributions — Common Shares | | | 1,868,027 | | | | 2,067,998 | | | | 3,228,086 | | | | 1,249,792 | |
Interest expense and fees | | | 15,854 | | | | 16,200 | | | | 47,073 | | | | 13,148 | |
Investment advisory fees | | | 293,944 | | | | 457,705 | | | | 672,659 | | | | 225,598 | |
Offering costs | | | 77,586 | | | | — | | | | — | | | | — | |
Directors’ and Officer’s fees | | | 2,916 | | | | 422,960 | | | | 70,292 | | | | 2,028 | |
Other accrued expenses | | | 30,319 | | | | 12,973 | | | | 12,972 | | | | 5,530 | |
Professional fees | | | 82,993 | | | | 79,937 | | | | 90,442 | | | | 50,710 | |
Reorganization costs | | | — | | | | 91,600 | | | | 79,503 | | | | — | |
Transfer agent fees | | | 13,461 | | | | 10,721 | | | | 16,703 | | | | 9,301 | |
Variation margin on futures contracts | | | — | | | | 14,035 | | | | 25,003 | | | | 9,997 | |
| | | | | | | | | | | | | | | | |
| | | | |
Total accrued liabilities | | | 6,286,644 | | | | 27,118,201 | | | | 9,533,640 | | | | 3,490,307 | |
| | | | | | | | | | | | | | | | |
| | | | |
OTHER LIABILITIES | | | | | | | | | | | | | | | | |
TOB Trust Certificates | | | 61,889,545 | | | | 83,289,072 | | | | 206,226,045 | | | | 61,988,645 | |
VMTP Shares, at liquidation value of $100,000 per share(c)(d)(e) | | | — | | | | 287,100,000 | | | | 347,800,000 | | | | 140,000,000 | |
| | | | | | | | | | | | | | | | |
| | | | |
Total other liabilities | | | 61,889,545 | | | | 370,389,072 | | | | 554,026,045 | | | | 201,988,645 | |
| | | | | | | | | | | | | | | | |
| | | | |
Total liabilities | | | 68,176,189 | | | | 397,507,273 | | | | 563,559,685 | | | | 205,478,952 | |
| | | | | | | | | | | | | | | | |
| | | | |
NET ASSETS APPLICABLE TO COMMON SHAREHOLDERS | | $ | 566,653,494 | | | $ | 604,417,367 | | | $ | 904,572,010 | | | $ | 326,790,091 | |
| | | | | | | | | | | | | | | | |
| | | | |
NET ASSETS APPLICABLE TO COMMON SHAREHOLDERS CONSIST OF | | | | | | | | | | | | | | | | |
Paid-in capital(f)(g)(h) | | $ | 510,566,853 | | | $ | 543,452,912 | | | $ | 808,007,673 | | | $ | 290,342,381 | |
Accumulated earnings | | | 56,086,641 | | | | 60,964,455 | | | | 96,564,337 | | | | 36,447,710 | |
| | | | | | | | | | | | | | | | |
| | | | |
NET ASSETS APPLICABLE TO COMMON SHAREHOLDERS | | $ | 566,653,494 | | | $ | 604,417,367 | | | $ | 904,572,010 | | | $ | 326,790,091 | |
| | | | | | | | | | | | | | | | |
| | | | |
Net asset value per Common Share | | $ | 14.86 | | | $ | 15.78 | | | $ | 16.95 | | | $ | 15.30 | |
| | | | | | | | | | | | | | | | |
| | | | |
(a) Investments, at cost — unaffiliated | | $ | 565,550,921 | | | $ | 907,981,005 | | | $ | 1,314,192,774 | | | $ | 481,604,833 | |
(b) Investments, at cost — affiliated | | $ | 7,268,096 | | | $ | 14,803,933 | | | $ | 13,062,094 | | | $ | 1,719,348 | |
(c) Preferred Shares outstanding | | | — | | | | 2,871 | | | | 3,478 | | | | 1,400 | |
(d) Preferred Shares authorized | | | — | | | | 15,671 | | | | 8,478 | | | | 8,400 | |
(e) Par value per Preferred Share | | | — | | | $ | 0.10 | | | $ | 0.10 | | | $ | 0.10 | |
(f) Common Shares outstanding | | | 38,144,590 | | | | 38,296,266 | | | | 53,356,788 | | | | 21,363,961 | |
(g) Common Shares authorized | | | 200,000,000 | | | | 199,984,329 | | | | 199,991,522 | | | | 199,991,600 | |
(h) Par value per Common Share | | $ | 0.10 | | | $ | 0.10 | | | $ | 0.10 | | | $ | 0.10 | |
See notes to financial statements.
Statements of Operations (unaudited)
Six Months Ended October 31, 2021
| | | | | | | | | | | | | | | | |
| | | MUA | | | MUI | | | MHD | | | MVT | |
| |
| | | | |
INVESTMENT INCOME | | | | | | | | | | | | | | | | |
Dividends — affiliated | | $ | 289 | | | $ | 261 | | | $ | 302 | | | $ | 45 | |
Interest — unaffiliated | | | 12,856,022 | | | | 16,113,630 | | | | 26,806,833 | | | | 9,605,231 | |
| | | | | | | | | | | | | | | | |
| | | | |
Total investment income | | | 12,856,311 | | | | 16,113,891 | | | | 26,807,135 | | | | 9,605,276 | |
| | | | | | | | | | | | | | | | |
| | | | |
EXPENSES | | | | | | | | | | | | | | | | |
Investment advisory | | | 1,745,413 | | | | 2,752,624 | | | | 4,110,493 | | | | 1,346,409 | |
Offering | | | 98,604 | | | | — | | | | — | | | | — | |
Professional | | | 61,026 | | | | 42,258 | | | | 9,940 | | | | 37,264 | |
Accounting services | | | 51,097 | | | | 69,413 | | | | 93,163 | | | | 46,179 | |
Transfer agent | | | 27,054 | | | | 21,876 | | | | 28,501 | | | | 14,666 | |
Directors and Officer | | | 18,695 | | | | 46,795 | | | | 35,242 | | | | 11,428 | |
Registration | | | 6,398 | | | | 6,779 | | | | 4,342 | | | | 4,378 | |
Custodian | | | 3,884 | | | | 2,761 | | | | 5,478 | | | | 4,929 | |
Reorganization | | | — | | | | 102,035 | | | | — | | | | — | |
Miscellaneous | | | 26,880 | | | | 38,370 | | | | 129,032 | | | | 34,377 | |
| | | | | | | | | | | | | | | | |
| | | | |
Total expenses excluding interest expense, fees and amortization of offering costs | | | 2,039,051 | | | | 3,082,911 | | | | 4,416,191 | | | | 1,499,630 | |
Interest expense, fees and amortization of offering costs(a) | | | 202,297 | | | | 1,748,813 | | | | 2,441,590 | | | | 901,781 | |
| | | | | | | | | | | | | | | | |
| | | | |
Total expenses | | | 2,241,348 | | | | 4,831,724 | | | | 6,857,781 | | | | 2,401,411 | |
Less: | | | | | | | | | | | | | | | | |
Fees waived and/or reimbursed by the Manager | | | (1,392 | ) | | | (11,703 | ) | | | (76,231 | ) | | | (246 | ) |
| | | | | | | | | | | | | | | | |
| | | | |
Total expenses after fees waived and/or reimbursed | | | 2,239,956 | | | | 4,820,021 | | | | 6,781,550 | | | | 2,401,165 | |
| | | | | | | | | | | | | | | | |
| | | | |
Net investment income | | | 10,616,355 | | | | 11,293,870 | | | | 20,025,585 | | | | 7,204,111 | |
| | | | | | | | | | | | | | | | |
| | | | |
REALIZED AND UNREALIZED GAIN (LOSS) | | | | | | | | | | | | | | | | |
Net realized gain (loss) from: | | | | | | | | | | | | | | | | |
Investments — unaffiliated | | | 3,571,479 | | | | 35,129 | | | | 258,674 | | | | 259,576 | |
Investments — affiliated | | | (946 | ) | | | (120 | ) | | | (888 | ) | | | (272 | ) |
Futures contracts | | | (624,554 | ) | | | (199,749 | ) | | | (2,203,042 | ) | | | (856,039 | ) |
| | | | | | | | | | | | | �� | | | |
| | | | |
| | | 2,945,979 | | | | (164,740 | ) | | | (1,945,256 | ) | | | (596,735 | ) |
| | | | | | | | | | | | | | | | |
Net change in unrealized appreciation (depreciation) on: | | | | | | | | | | | | | | | | |
Investments — unaffiliated | | | 260,878 | | | | (11,439,135 | ) | | | (17,943,501 | ) | | | (5,881,440 | ) |
Investments — affiliated | | | — | | | | — | | | | — | | | | (86 | ) |
Futures contracts | | | 88,133 | | | | 103,706 | | | | 725,080 | | | | 274,931 | |
| | | | | | | | | | | | | | | | |
| | | | |
| | | 349,011 | | | | (11,335,429 | ) | | | (17,218,421 | ) | | | (5,606,595 | ) |
| | | | | | | | | | | | | | | | |
| | | | |
Net realized and unrealized gain (loss) | | | 3,294,990 | | | | (11,500,169 | ) | | | (19,163,677 | ) | | | (6,203,330 | ) |
| | | | | | | | | | | | | | | | |
| | | | |
NET INCREASE (DECREASE) IN NET ASSETS APPLICABLE TO COMMON SHAREHOLDERS RESULTING FROM OPERATIONS | | $ | 13,911,345 | | | $ | (206,299 | ) | | $ | 861,908 | | | $ | 1,000,781 | |
| | | | | | | | | | | | | | | | |
| (a) | Related to TOB Trusts and VMTP Shares. |
See notes to financial statements.
| | |
| 62 | | 2 0 2 1 BLACK ROCK SEMI - ANNUAL REPORT TO SHAREHOLDERS |
Statements of Changes in Net Assets
| | | | | | | | | | | | | | | | | | | | |
| | | MUA | | | MUI | |
| | | | |
| | | Six Months Ended 10/31/21 (unaudited) | | | Year Ended 04/30/21 | | | Six Months Ended 10/31/21 (unaudited) | | | Year Ended 04/30/21 | |
| |
| | | | | | |
INCREASE (DECREASE) IN NET ASSETS APPLICABLE TO COMMON SHAREHOLDERS | | | | | | | | | | | | | | | | | | | | |
| | | | | | |
OPERATIONS | | | | | | | | | | | | | | | | | | | | |
Net investment income | | | | $ | 10,616,355 | | | $ | 22,721,507 | | | | | $ | 11,293,870 | | | $ | 24,510,091 | |
Net realized gain (loss) | | | | | 2,945,979 | | | | 2,825,504 | | | | | | (164,740 | ) | | | (45,151 | ) |
Net change in unrealized appreciation (depreciation) | | | | | 349,011 | | | | 68,045,700 | | | | | | (11,335,429 | ) | | | 56,855,315 | |
| | | | | | | | | | | | | | | | | | | | |
| | | | | | |
Net increase (decrease) in net assets applicable to Common Shareholders resulting from operations | | | | | 13,911,345 | | | | 93,592,711 | | | | | | (206,299 | ) | | | 81,320,255 | |
| | | | | | | | | | | | | | | | | | | | |
| | | | | | |
DISTRIBUTIONS TO COMMON SHAREHOLDERS(a) | | | | | | | | | | | | | �� | | | | | | | |
Decrease in net assets resulting from distributions to Common Shareholders | | | | | (11,366,821 | ) | | | (23,399,374 | ) | | | | | (12,407,990 | ) | | | (24,222,388 | ) |
| | | | | | | | | | | | | | | | | | | | |
| | | | | | |
CAPITAL SHARE TRANSACTIONS | | | | | | | | | | | | | | | | | | | | |
Net proceeds from the issuance of common shares | | | | | 11,196,611 | | | | 17,859,043 | | | | | | — | | | | — | |
Reinvestment of common distributions | | | | | 539,772 | | | | 889,656 | | | | | | — | | | | — | |
| | | | | | | | | | | | | | | | | | | | |
| | | | | | |
Net increase in net assets derived from capital share transactions | | | | | 11,736,383 | | | | 18,748,699 | | | | | | — | | | | — | |
| | | | | | | | | | | | | | | | | | | | |
| | | | | | |
NET ASSETS APPLICABLE TO COMMON SHAREHOLDERS | | | | | | | | | | | | | | | | | | | | |
Total increase (decrease) in net assets applicable to Common Shareholders | | | | | 14,280,907 | | | | 88,942,036 | | | | | | (12,614,289 | ) | | | 57,097,867 | |
Beginning of period | | | | | 552,372,587 | | | | 463,430,551 | | | | | | 617,031,656 | | | | 559,933,789 | |
| | | | | | | | | | | | | | | | | | | | |
| | | | | | |
End of period | | | | $ | 566,653,494 | | | $ | 552,372,587 | | | | | $ | 604,417,367 | | | $ | 617,031,656 | |
| | | | | | | | | | | | | | | | | | | | |
| (a) | Distributions for annual periods determined in accordance with U.S. federal income tax regulations. |
See notes to financial statements.
Statements of Changes in Net Assets (continued)
| | | | | | | | | | | | | | | | | | | | |
| | | MHD | | | MVT | |
| | | | |
| | | Six Months Ended 10/31/21 (unaudited) | | | Year Ended 04/30/21 | | | Six Months Ended 10/31/21 (unaudited) | | | Year Ended 04/30/21 | |
| |
| | | | | | |
INCREASE (DECREASE) IN NET ASSETS APPLICABLE TO COMMON SHAREHOLDERS | | | | | | | | | | | | | | | | | | | | |
| | | | | | |
OPERATIONS | | | | | | | | | | | | | | | | | | | | |
Net investment income | | | | $ | 20,025,585 | | | $ | 15,555,286 | | | | | $ | 7,204,111 | | | $ | 15,359,842 | |
Net realized gain (loss) | | | | | (1,945,256 | ) | | | 527,251 | | | | | | (596,735 | ) | | | 527,383 | |
Net change in unrealized appreciation (depreciation) | | | | | (17,218,421 | ) | | | 38,716,284 | | | | | | (5,606,595 | ) | | | 41,455,180 | |
| | | | | | | | | | | | | | | | | | | | |
| | | | | | |
Net increase in net assets applicable to Common Shareholders resulting from operations | | | | | 861,908 | | | | 54,798,821 | | | | | | 1,000,781 | | | | 57,342,405 | |
| | | | | | | | | | | | | | | | | | | | |
| | | | | | |
DISTRIBUTIONS TO COMMON SHAREHOLDERS(a) | | | | | | | | | | | | | | | | | | | | |
Decrease in net assets resulting from distributions to Common Shareholders | | | | | (19,368,514 | ) | | | (12,698,865 | ) | | | | | (7,495,900 | ) | | | (14,660,494 | ) |
| | | | | | | | | | | | | | | | | | | | |
| | | | | | |
CAPITAL SHARE TRANSACTIONS | | | | | | | | | | | | | | | | | | | | |
Net proceeds from the issuance of common shares due to reorganization | | | | | — | | | | 665,215,154 | | | | | | — | | | | — | |
Reinvestment of common distributions | | | | | — | | | | — | | | | | | 380,304 | | | | — | |
Redemption of common shares | | | | | — | | | | (424 | ) | | | | | — | | | | — | |
| | | | | | | | | | | | | | | | | | | | |
| | | | | | |
Net increase in net assets derived from capital share transactions | | | | | — | | | | 665,214,730 | | | | | | 380,304 | | | | — | |
| | | | | | | | | | | | | | | | | | | | |
| | | | | | |
NET ASSETS APPLICABLE TO COMMON SHAREHOLDERS | | | | | | | | | | | | | | | | | | | | |
Total increase (decrease) in net assets applicable to Common Shareholders | | | | | (18,506,606 | ) | | | 707,314,686 | | | | | | (6,114,815 | ) | | | 42,681,911 | |
Beginning of period | | | | | 923,078,616 | | | | 215,763,930 | | | | | | 332,904,906 | | | | 290,222,995 | |
| | | | | | | | | | | | | | | | | | | | |
| | | | | | |
End of period | | | | $ | 904,572,010 | | | $ | 923,078,616 | | | | | $ | 326,790,091 | | | $ | 332,904,906 | |
| | | | | | | | | | | | | | | | | | | | |
| (a) | Distributions for annual periods determined in accordance with U.S. federal income tax regulations. |
See notes to financial statements.
| | |
| 64 | | 2 0 2 1 BLACK ROCK SEMI - ANNUAL REPORT TO SHAREHOLDERS |
Statements of Cash Flows (unaudited)
Six Months Ended October 31, 2021
| | | | | | | | | | | | | | | | |
| | | MUA | | | MUI | | | MHD | | | MVT | |
| |
| | | | |
CASH PROVIDED BY (USED FOR) OPERATING ACTIVITIES | | | | | | | | | | | | | | | | |
Net increase (decrease) in net assets resulting from operations | | $ | 13,911,345 | | | $ | (206,299 | ) | | $ | 861,908 | | | $ | 1,000,781 | |
Adjustments to reconcile net increase in net assets resulting from operations to net cash provided by operating activities | | | | | | | | | | | | | | | | |
Proceeds from sales of long-term investments | | | 62,571,881 | | | | 73,745,619 | | | | 104,203,342 | | | | 24,061,023 | |
Purchases of long-term investments | | | (58,318,273 | ) | | | (52,328,440 | ) | | | (93,723,851 | ) | | | (27,615,316 | ) |
Net purchases of short-term securities | | | (8,536,467 | ) | | | (14,677,534 | ) | | | (5,219,081 | ) | | | (1,064,552 | ) |
Amortization of premium and accretion of discount on investments and other fees | | | (361,552 | ) | | | 4,010,954 | | | | 2,147,817 | | | | 1,052,665 | |
Net realized gain on investments | | | (3,570,533 | ) | | | (35,009 | ) | | | (257,786 | ) | | | (259,304 | ) |
Net unrealized (appreciation) depreciation on investments | | | (260,878 | ) | | | 11,439,135 | | | | 17,943,501 | | | | 5,881,526 | |
| | | | |
(Increase) Decrease in Assets | | | | | | | | | | | | | | | | |
Receivables | | | | | | | | | | | | | | | | |
Dividends — affiliated | | | (11 | ) | | | (54 | ) | | | 28 | | | | 3 | |
Interest — unaffiliated | | | 126,709 | | | | 365,639 | | | | 328,287 | | | | (17,723 | ) |
Variation margin on futures contracts | | | — | | | | (28,688 | ) | | | (12,125 | ) | | | (4,563 | ) |
Prepaid expenses | | | — | | | | 14,194 | | | | 200,562 | | | | 10,612 | |
Deferred offering costs | | | 46,273 | | | | — | | | | — | | | | — | |
| | | | |
Increase (Decrease) in Liabilities | | | | | | | | | | | | | | | | |
Payables | | | | | | | | | | | | | | | | |
Accounting services fees | | | 43,702 | | | | 58,875 | | | | 70,921 | | | | 39,273 | |
Custodian fees | | | 3,346 | | | | 1,980 | | | | 4,191 | | | | 4,514 | |
Interest expense and fees | | | (10,595 | ) | | | (6,268 | ) | | | (15,872 | ) | | | (5,065 | ) |
Investment advisory fees | | | 14,778 | | | | 7,227 | | | | 14,960 | | | | 7,883 | |
Directors’ and Officer’s fees | | | 1,785 | | | | 34,552 | | | | 7,987 | | | | 1,084 | |
Other accrued expenses | | | 16,738 | | | | 637 | | | | (8,271 | ) | | | (1,051 | ) |
Professional fees | | | (3,510 | ) | | | (20,127 | ) | | | (83,265 | ) | | | (18,823 | ) |
Reorganization costs | | | — | | | | 91,600 | | | | (342,482 | ) | | | — | |
Transfer agent fees | | | (3,050 | ) | | | (2,758 | ) | | | (7,364 | ) | | | (1,655 | ) |
Variation margin on futures contracts | | | (14,451 | ) | | | (26,032 | ) | | | (14,299 | ) | | | (4,813 | ) |
| | | | | | | | | | | | | | | | |
| | | | |
Net cash provided by operating activities | | | 5,657,237 | | | | 22,439,203 | | | | 26,099,108 | | | | 3,066,499 | |
| | | | | | | | | | | | | | | | |
| | | | |
CASH PROVIDED BY (USED FOR) FINANCING ACTIVITIES | | | | | | | | | | | | | | | | |
Cash dividends paid to Common Shareholders | | | (10,916,227 | ) | | | (12,407,990 | ) | | | (19,368,514 | ) | | | (7,114,187 | ) |
Payments for offering costs | | | 10,911 | | | | — | | | | — | | | | — | |
Repayments of TOB Trust Certificates | | | (13,424,603 | ) | | | (10,893,025 | ) | | | (23,947,474 | ) | | | (1,551,108 | ) |
Repayments of Loan for TOB Trust Certificates | | | — | | | | (1,113,222 | ) | | | (1,780,000 | ) | | | — | |
Proceeds from TOB Trust Certificates | | | 6,532,813 | | | | 1,113,222 | | | | 17,070,000 | | | | 5,542,390 | |
Proceeds from Loan for TOB Trust Certificates | | | — | | | | 1,113,222 | | | | 1,780,000 | | | | — | |
Proceeds from issuance of Common Shares | | | 11,841,307 | | | | — | | | | — | | | | — | |
| | | | | | | | | | | | | | | | |
| | | | |
Net cash used for financing activities | | | (5,955,799 | ) | | | (22,187,793 | ) | | | (26,245,988 | ) | | | (3,122,905 | ) |
| | | | | | | | | | | | | | | | |
| | | | |
CASH | | | | | | | | | | | | | | | | |
Net increase (decrease) in restricted and unrestricted cash | | | (298,562 | ) | | | 251,410 | | | | (146,880 | ) | | | (56,406 | ) |
Restricted and unrestricted cash at beginning of period | | | 298,562 | | | | 537,780 | | | | 729,693 | | | | 282,562 | |
| | | | | | | | | | | | | | | | |
| | | | |
Restricted and unrestricted cash at end of period | | $ | — | | | $ | 789,190 | | | $ | 582,813 | | | $ | 226,156 | |
| | | | | | | | | | | | | | | | |
| | | | |
SUPPLEMENTAL DISCLOSURE OF CASH FLOW INFORMATION | | | | | | | | | | | | | | | | |
Cash paid during the period for interest expense | | $ | 212,892 | | | $ | 1,755,081 | | | $ | 2,457,462 | | | $ | 906,846 | |
| | | | | | | | | | | | | | | | |
| | | | |
NON-CASH FINANCING ACTIVITIES | | | | | | | | | | | | | | | | |
Reinvestment of common distributions | | $ | 539,772 | | | $ | — | | | $ | — | | | $ | 380,304 | |
| | | | | | | | | | | | | | | | |
| | | | |
RECONCILIATION OF RESTRICTED AND UNRESTRICTED CASH AT THE END OF PERIOD TO THE STATEMENTS OF ASSETS AND LIABILITIES | | | | | | | | | | | | | | | | |
Cash | | $ | — | | | $ | 159,190 | | | $ | 96,813 | | | $ | 37,156 | |
Cash pledged | | | | | | | | | | | | | | | | |
Futures contracts | | | — | | | | 630,000 | | | | 486,000 | | | | 189,000 | |
| | | | | | | | | | | | | | | | |
| | | | |
| | $ | — | | | $ | 789,190 | | | $ | 582,813 | | | $ | 226,156 | |
| | | | | | | | | | | | | | | | |
See notes to financial statements.
Financial Highlights
(For a share outstanding throughout each period)
| | | | | | | | | | | | | | | | | | | | | | | | | | |
| | | MUA | |
| | |
| | | Six Months Ended 10/31/21 (unaudited) | | | Year Ended April 30, | |
| | | 2021 | | | 2020 | | | 2019 | | | 2018 | | | 2017 | |
| | | | | | | | |
Net asset value, beginning of period | | | | $ | 14.77 | | | $ | 12.83 | | | $ | 14.14 | | | $ | 14.01 | | | $ | 14.07 | | | $ | 14.45 | |
| | | | | | | | | | | | | | | | | | | | | | | | | | |
| | | | | | | |
Net investment income(a) | | | | | 0.28 | | | | 0.62 | | | | 0.63 | | | | 0.67 | | | | 0.68 | | | | 0.70 | |
Net realized and unrealized gain (loss) | | | | | 0.11 | | | | 1.96 | | | | (1.29 | ) | | | 0.12 | | | | (0.06 | ) | | | (0.38 | ) |
| | | | | | | | | | | | | | | | | | | | | | | | | | |
| | | | | | | |
Net increase (decrease) from investment operations | | | | | 0.39 | | | | 2.58 | | | | (0.66 | ) | | | 0.79 | | | | 0.62 | | | | 0.32 | |
| | | | | | | | | | | | | | | | | | | | | | | | | | |
| | | | | | | |
Distributions to Common Shareholders(b) | | | | | | | | | | | | | | | | | | | | | | | | | | |
From net investment income | | | | | (0.30 | ) | | | (0.64 | ) | | | (0.63 | ) | | | (0.66 | ) | | | (0.68 | ) | | | (0.70 | ) |
From net realized gain | | | | | — | | | | — | | | | (0.02 | ) | | | — | | | | — | | | | — | |
| | | | | | | | | | | | | | | | | | | | | | | | | | |
| | | | | | | |
Total distributions to Common Shareholders | | | | | (0.30 | ) | | | (0.64 | ) | | | (0.65 | ) | | | (0.66 | ) | | | (0.68 | ) | | | (0.70 | ) |
| | | | | | | | | | | | | | | | | | | | | | | | | | |
| | | | | | | |
Net asset value, end of period | | | | $ | 14.86 | | | $ | 14.77 | | | $ | 12.83 | | | $ | 14.14 | | | $ | 14.01 | | | $ | 14.07 | |
| | | | | | | | | | | | | | | | | | | | | | | | | | |
| | | | | | | |
Market price, end of period | | | | $ | 15.10 | | | $ | 15.26 | | | $ | 12.48 | | | $ | 14.98 | | | $ | 13.21 | | | $ | 14.82 | |
| | | | | | | | | | | | | | | | | | | | | | | | | | |
| | | | | | | |
Total Return Applicable to Common Shareholders(c) | | | | | | | | | | | | | | | | | | | | | | | | | | |
Based on net asset value | | | | | 2.60 | %(d) | | | 20.41 | % | | | (5.03 | )% | | | 5.97 | % | | | 4.47 | % | | | 2.23 | % |
| | | | | | | | | | | | | | | | | | | | | | | | | | |
| | | | | | | |
Based on market price | | | | | 0.91 | %(d) | | | 27.89 | % | | | (12.80 | )% | | | 19.07 | % | | | (6.48 | )% | | | 5.56 | % |
| | | | | | | | | | | | | | | | | | | | | | | | | | |
| | | | | | | |
Ratios to Average Net Assets Applicable to Common Shareholders | | | | | | | | | | | | | | | | | | | | | | | | | | |
Total expenses | | | | | 0.78 | %(e) | | | 0.81 | % | | | 0.98 | % | | | 1.01 | % | | | 0.93 | % | | | 0.87 | % |
| | | | | | | | | | | | | | | | | | | | | | | | | | |
| | | | | | | |
Total expenses after fees waived and/or reimbursed | | | | | 0.78 | %(e) | | | 0.80 | % | | | 0.98 | % | | | 1.01 | % | | | 0.93 | % | | | 0.87 | % |
| | | | | | | | | | | | | | | | | | | | | | | | | | |
Total expenses after fees waived and/or reimbursed and excluding interest expense, fees, and amortization of offering costs(f) | | | | | 0.71 | %(e) | | | 0.71 | % | | | 0.69 | % | | | 0.70 | % | | | 0.69 | % | | | 0.69 | % |
| | | | | | | | | | | | | | | | | | | | | | | | | | |
| | | | | | | |
Net investment income | | | | | 3.71 | %(e) | | | 4.39 | % | | | 4.43 | % | | | 4.77 | % | | | 4.83 | % | | | 4.93 | % |
| | | | | | | | | | | | | | | | | | | | | | | | | | |
| | | | | | | |
Supplemental Data | | | | | | | | | | | | | | | | | | | | | | | | | | |
Net assets applicable to Common Shareholders, end of period (000) | | | | $ | 566,653 | | | $ | 552,373 | | | $ | 463,431 | | | $ | 509,645 | | | $ | 504,470 | | | $ | 505,306 | |
| | | | | | | | | | | | | | | | | | | | | | | | | | |
| | | | | | | |
Borrowings outstanding, end of period (000) | | | | $ | 61,890 | | | $ | 68,781 | | | $ | 69,232 | | | $ | 71,659 | | | $ | 71,925 | | | $ | 67,507 | |
| | | | | | | | | | | | | | | | | | | | | | | | | | |
| | | | | | | |
Portfolio turnover rate | | | | | 10 | % | | | 19 | % | | | 21 | % | | | 19 | % | | | 15 | % | | | 11 | % |
| | | | | | | | | | | | | | | | | | | | | | | | | | |
| (a) | Based on average Common Shares outstanding. |
| (b) | Distributions for annual periods determined in accordance with U.S. federal income tax regulations. |
| (c) | Total returns based on market price, which can be significantly greater or less than the net asset value, may result in substantially different returns. Where applicable, excludes the effects of any sales charges and assumes the reinvestment of distributions at actual reinvestment prices. |
| (d) | Aggregate total return. |
| (f) | Interest expense and fees relate to TOB Trusts. See Note 4 of the Notes to Financial Statements for details. |
See notes to financial statements.
| | |
| 66 | | 2 0 2 1 BLACK ROCK SEMI - ANNUAL REPORT TO SHAREHOLDERS |
Financial Highlights (continued)
(For a share outstanding throughout each period)
| | | | | | | | | | | | | | | | | | | | | | | | | | | | |
| | | MUI | |
| | |
| | | Six Months Ended 10/31/21 (unaudited) | | | Year Ended April 30, | |
| | 2021 | | | 2020 | | | 2019 | | | 2018 | | | 2017 | |
| | | | | | | | |
Net asset value, beginning of period | | | | | | $ | 16.11 | | | $ | 14.62 | | | $ | 15.40 | | | $ | 14.93 | | | $ | 15.17 | | | $ | 16.16 | |
| | | | | | | | | | | | | | | | | | | | | | | | | | | | |
Net investment income(a) | | | | | | | 0.29 | | | | 0.64 | | | | 0.56 | | | | 0.56 | | | | 0.59 | | | | 0.65 | |
| | | | | | | |
Net realized and unrealized gain (loss) | | | | | | | (0.30 | ) | | | 1.48 | | | | (0.81 | ) | | | 0.47 | | | | (0.23 | ) | | | (0.83 | ) |
| | | | | | | | | | | | | | | | | | | | | | | | | | | | |
| | | | | | | |
Net increase (decrease) from investment operations | | | | | | | (0.01 | ) | | | 2.12 | | | | (0.25 | ) | | | 1.03 | | | | 0.36 | | | | (0.18 | ) |
| | | | | | | | | | | | | | | | | | | | | | | | | | | | |
| | | | | | | |
Distributions to Common Shareholders(b) | | | | | | | | | | | | | | | | | | | | | | | | | | | | |
From net investment income | | | | | | | (0.32 | ) | | | (0.63 | ) | | | (0.53 | ) | | | (0.53 | ) | | | (0.60 | ) | | | (0.67 | ) |
From net realized gain | | | | | | | — | | | | — | | | | — | | | | (0.03 | ) | | | (0.00 | )(c) | | | (0.14 | ) |
| | | | | | | | | | | | | | | | | | | | | | | | | | | | |
| | | | | | | |
Total distributions to Common Shareholders | | | | | | | (0.32 | ) | | | (0.63 | ) | | | (0.53 | ) | | | (0.56 | ) | | | (0.60 | ) | | | (0.81 | ) |
| | | | | | | | | | | | | | | | | | | | | | | | | | | | |
| | | | | | | |
Net asset value, end of period | | | | | | $ | 15.78 | | | $ | 16.11 | | | $ | 14.62 | | | $ | 15.40 | | | $ | 14.93 | | | $ | 15.17 | |
| | | | | | | | | | | | | | | | | | | | | | | | | | | | |
| | | | | | | |
Market price, end of period | | | | | | $ | 15.21 | | | $ | 15.09 | | | $ | 13.13 | | | $ | 13.85 | | | $ | 13.01 | | | $ | 13.96 | |
| | | | | | | | | | | | | | | | | | | | | | | | | | | | |
| | | | | | | |
Total Return Applicable to Common Shareholders(d) | | | | | | | | | | | | | | | | | | | | | | | | | | | | |
Based on net asset value | | | | | | | (0.01 | )%(e) | | | 15.08 | % | | | (1.41 | )% | | | 7.68 | % | | | 2.76 | % | | | (0.69 | )% |
| | | | | | | | | | | | | | | | | | | | | | | | | | | | |
| | | | | | | |
Based on market price | | | | | | | 2.89 | %(e) | | | 20.02 | % | | | (1.56 | )% | | | 11.13 | % | | | (2.69 | )% | | | (2.77 | )% |
| | | | | | | | | | | | | | | | | | | | | | | | | | | | |
| | | | | | | |
Ratios to Average Net Assets Applicable to Common Shareholders | | | | | | | | | | | | | | | | | | | | | | | | | | | | |
Total expenses | | | | | | | 1.54 | %(f)(g) | | | 1.58 | % | | | 2.31 | % | | | 2.63 | % | | | 2.17 | % | | | 1.90 | % |
| | | | | | | | | | | | | | | | | | | | | | | | | | | | |
| | | | | | | |
Total expenses after fees waived and/or reimbursed | | | | | | | 1.54 | %(f)(g) | | | 1.58 | % | | | 2.31 | % | | | 2.63 | % | | | 2.17 | % | | | 1.89 | % |
| | | | | | | | | | | | | | | | | | | | | | | | | | | | |
Total expenses after fees waived and/or reimbursed and excluding interest expense,fees, and amortization of offering costs(h) | | | | | | | 0.99 | %(f)(g) | | | 0.98 | % | | | 0.97 | % | | | 1.01 | % | | | 0.97 | % | | | 0.96 | % |
| | | | | | | | | | | | | | | | | | | | | | | | | | | | |
| | | | | | | |
Net investment income to Common Shareholders | | | | | | | 3.63 | %(f) | | | 4.05 | % | | | 3.59 | % | | | 3.73 | % | | | 3.87 | % | | | 4.12 | % |
| | | | | | | | | | | | | | | | | | | | | | | | | | | | |
| | | | | | | |
Supplemental Data | | | | | | | | | | | | | | | | | | | | | | | | | | | | |
Net assets applicable to Common Shareholders, end of period (000) | | | | | | $ | 604,417 | | | $ | 617,032 | | | $ | 559,934 | | | $ | 589,887 | | | $ | 571,769 | | | $ | 580,945 | |
| | | | | | | | | | | | | | | | | | | | | | | | | | | | |
| | | | | | | |
VMTP Shares outstanding at $100,000 liquidation value, end of period (000) | | | | | | $ | 287,100 | | | $ | 287,100 | | | $ | 287,100 | | | $ | 287,100 | | | $ | 287,100 | | | $ | 287,100 | |
| | | | | | | | | | | | | | | | | | | | | | | | | | | | |
| | | | | | | |
Asset coverage per VMTP Shares at $100,000 liquidation value, end of period | | | | | | $ | 310,525 | | | $ | 314,919 | | | $ | 295,031 | | | $ | 305,464 | | | $ | 299,153 | | | $ | 302,349 | |
| | | | | | | | | | | | | | | | | | | | | | | | | | | | |
| | | | | | | |
Borrowings outstanding, end of period (000) | | | | | | $ | 83,289 | | | $ | 93,069 | | | $ | 92,014 | | | $ | 93,421 | | | $ | 79,136 | | | $ | 58,337 | |
| | | | | | | | | | | | | | | | | | | | | | | | | | | | |
| | | | | | | |
Portfolio turnover rate | | | | | | | 7 | % | | | 13 | % | | | 20 | % | | | 24 | % | | | 34 | % | | | 12 | % |
| | | | | | | | | | | | | | | | | | | | | | | | | | | | |
| (a) | Based on average Common Shares outstanding. |
| (b) | Distributions for annual periods determined in accordance with U.S. federal income tax regulations. |
| (c) | Amount is greater than $(0.005) per share. |
| (d) | Total returns based on market price, which can be significantly greater or less than the net asset value, may result in substantially different returns. Where applicable, excludes the effects of any sales charges and assumes the reinvestment of distributions at actual reinvestment prices. |
| (e) | Aggregate total return. |
| (g) | Includes non-recurring expenses of reorganization costs. Without these costs, total expenses, total expenses after fees waived and/or reimbursed and total expenses after fees waived and/or reimbursed and excluding interest expense, fees, and amortization of offering cost would have been 1.52%, 1.52% and 0.97%, respectively. |
| (h) | Interest expense, fees and amortization of offering costs related to TOB Trusts and/or VMTP Shares. See Note 4 and Note 10 of the Notes to Financial Statements for details. |
See notes to financial statements.
Financial Highlights (continued)
(For a share outstanding throughout each period)
| | | | | | | | | | | | | | | | | | | | | | | | | | | | |
| | | MHD | |
| | |
| | | Six Months Ended 10/31/21 (unaudited) | | | Year Ended April 30, | |
| | 2021 | | | 2020 | | | 2019 | | | 2018 | | | 2017 | |
| | | | | | | | |
Net asset value, beginning of period | | | | | | $ | 17.30 | | | $ | 15.18 | | | $ | 16.56 | | | $ | 16.41 | | | $ | 16.85 | | | $ | 17.95 | |
| | | | | | | | | | | | | | | | | | | | | | | | | | | | |
| | | | | | | |
Net investment income(a) | | | | | | | 0.38 | | | | 0.78 | | | | 0.74 | | | | 0.81 | | | | 0.88 | | | | 0.95 | |
Net realized and unrealized gain (loss) | | | | | | | (0.37 | ) | | | 2.07 | | | | (1.36 | ) | | | 0.22 | | | | (0.39 | ) | | | (1.07 | ) |
| | | | | | | | | | | | | | | | | | | | | | | | | | | | |
| | | | | | | |
Net increase (decrease) from investment operations | | | | | | | 0.01 | | | | 2.85 | | | | (0.62 | ) | | | 1.03 | | | | 0.49 | | | | (0.12 | ) |
| | | | | | | | | | | | | | | | | | | | | | | | | | | | |
| | | | | | | |
Distributions to Common Shareholders(b) | | | | | | | | | | | | | | | | | | | | | | | | | | | | |
From net investment income | | | | | | | (0.36 | ) | | | (0.73 | ) | | | (0.76 | ) | | | (0.83 | ) | | | (0.92 | ) | | | (0.98 | ) |
From net realized gain | | | | | | | — | | | | — | | | | — | | | | (0.05 | ) | | | (0.01 | ) | | | — | |
| | | | | | | | | | | | | | | | | | | | | | | | | | | | |
| | | | | | | |
Total distributions to Common Shareholders | | | | | | | (0.36 | ) | | | (0.73 | ) | | | (0.76 | ) | | | (0.88 | ) | | | (0.93 | ) | | | (0.98 | ) |
| | | | | | | | | | | | | | | | | | | | | | | | | | | | |
| | | | | | | |
Net asset value, end of period | | | | | | $ | 16.95 | | | $ | 17.30 | | | $ | 15.18 | | | $ | 16.56 | | | $ | 16.41 | | | $ | 16.85 | |
| | | | | | | | | | | | | | | | | | | | | | | | | | | | |
| | | | | | | |
Market price, end of period | | | | | | $ | 16.29 | | | $ | 16.33 | | | $ | 13.91 | | | $ | 15.92 | | | $ | 14.98 | | | $ | 16.65 | |
| | | | | | | | | | | | | | | | | | | | | | | | | | | | |
| | | | | | | |
Total Return Applicable to Common Shareholders(c) | | | | | | | | | | | | | | | | | | | | | | | | | | | | |
Based on net asset value | | | | | | | 0.11 | %(d) | | | 19.31 | % | | | (4.02 | )% | | | 6.84 | % | | | 3.07 | % | | | (0.67 | )% |
| | | | | | | | | | | | | | | | | | | | | | | | | | | | |
| | | | | | | |
Based on market price | | | | | | | 1.92 | %(d) | | | 22.90 | % | | | (8.52 | )% | | | 12.51 | % | | | (4.79 | )% | | | (2.87 | )% |
| | | | | | | | | | | | | | | | | | | | | | | | | | | | |
| | | | | | | |
Ratios to Average Net Assets Applicable to Common Shareholders | | | | | | | | | | | | | | | | | | | | | | | | | | | | |
Total expenses | | | | | | | 1.47 | %(e) | | | 1.56 | %(f) | | | 2.16 | %(g) | | | 2.47 | % | | | 2.16 | % | | | 1.87 | % |
| | | | | | | | | | | | | | | | | | | | | | | | | | | | |
| | | | | | | |
Total expenses after fees waived and/or reimbursed | | | | | | | 1.45 | %(e) | | | 1.51 | %(f) | | | 2.15 | %(g) | | | 2.47 | % | | | 2.16 | % | | | 1.87 | % |
| | | | | | | | | | | | | | | | | | | | | | | | | | | | |
Total expenses after fees waived and/or reimbursed and excluding interest expense,fees, and amortization of offering costs(h) | | | | | | | 0.93 | %(e) | | | 0.98 | %(f) | | | 0.97 | %(g) | | | 1.00 | % | | | 1.01 | % | | | 0.99 | % |
| | | | | | | | | | | | | | | | | | | | | | | | | | | | |
| | | | | | | |
Net investment income to Common Shareholders | | | | | | | 4.28 | %(e) | | | 4.59 | % | | | 4.40 | %(g) | | | 4.98 | % | | | 5.19 | % | | | 5.42 | % |
| | | | | | | | | | | | | | | | | | | | | | | | | | | | |
| | | | | | | |
Supplemental Data | | | | | | | | | | | | | | | | | | | | | | | | | | | | |
Net assets applicable to Common Shareholders, end of period (000) | | | | | | $ | 904,572 | | | $ | 923,079 | | | $ | 215,764 | | | $ | 235,029 | | | $ | 232,921 | | | $ | 238,684 | |
| | | | | | | | | | | | | | | | | | | | | | | | | | | | |
| | | | | | | |
VMTP Shares outstanding at $100,000 liquidation value, end of period (000) | | | | | | $ | 347,800 | | | $ | 347,800 | | | $ | 83,700 | | | $ | 83,700 | | | $ | 83,700 | | | $ | 83,700 | |
| | | | | | | | | | | | | | | | | | | | | | | | | | | | |
| | | | | | | |
Asset coverage per VMTP Shares at $100,000 liquidation value, end of period | | | | | | $ | 360,084 | | | $ | 365,405 | | | $ | 357,782 | | | $ | 380,799 | | | $ | 378,281 | | | $ | 385,166 | |
| | | | | | | | | | | | | | | | | | | | | | | | | | | | |
| | | | | | | |
Borrowings outstanding, end of period (000) | | | | | | $ | 206,226 | | | $ | 213,104 | | | $ | 53,130 | | | $ | 52,674 | | | $ | 63,166 | | | $ | 62,233 | |
| | | | | | | | | | | | | | | | | | | | | | | | | | | | |
| | | | | | | |
Portfolio turnover rate | | | | | | | 7 | % | | | 13 | % | | | 21 | % | | | 17 | % | | | 12 | % | | | 9 | % |
| | | | | | | | | | | | | | | | | | | | | | | | | | | | |
| (a) | Based on average Common Shares outstanding. |
| (b) | Distributions for annual periods determined in accordance with U.S. federal income tax regulations. |
| (c) | Total returns based on market price, which can be significantly greater or less than the net asset value, may result in substantially different returns. Where applicable, excludes the effects of any sales charges and assumes the reinvestment of distributions at actual reinvestment prices. |
| (d) | Aggregate total return. |
| (f) | Includes reorganization costs associated with the Fund’s reorganization. Without these costs, total expenses, total expenses after fees waived and/or reimbursed and total expenses after fees waived and/or reimbursed and excluding interest expense, fees, and amortization of offering costs, would have been 1.49%, 1.47% and 0.95%, respectively, for the year ended April 30, 2021. |
| (g) | Excludes expenses incurred indirectly as a result of investments in underlying funds of 0.01%. |
| (h) | Interest expense, fees and amortization of offering costs related to TOB Trusts and/or VMTP Shares. See Note 4 and Note 10 of the Notes to Financial Statements for details. |
See notes to financial statements.
| | |
| 68 | | 2 0 2 1 BLACK ROCK SEMI - ANNUAL REPORT TO SHAREHOLDERS |
Financial Highlights (continued)
(For a share outstanding throughout each period)
| | | | | | | | | | | | | | | | | | | | | | | | | | | | |
| | | MVT | |
| | |
| | | Six Months Ended 10/31/21 (unaudited) | | | Year Ended April 30, | |
| | 2021 | | | 2020 | | | 2019 | | | 2018 | | | 2017 | |
| | | | | | | | |
Net asset value, beginning of period | | | | | | $ | 15.60 | | | $ | 13.60 | | | $ | 14.87 | | | $ | 14.75 | | | $ | 15.19 | | | $ | 16.17 | |
| | | | | | | | | | | | | | | | | | | | | | | | | | | | |
| | | | | | | |
Net investment income(a) | | | | | | | 0.34 | | | | 0.72 | | | | 0.68 | | | | 0.74 | | | | 0.83 | | | | 0.91 | |
Net realized and unrealized gain (loss) | | | | | | | (0.29 | ) | | | 1.97 | | | | (1.27 | ) | | | 0.20 | | | | (0.41 | ) | | | (0.95 | ) |
| | | | | | | | | | | | | | | | | | | | | | | | | | | | |
| | | | | | | |
Net increase (decrease) from investment operations | | | | | | | 0.05 | | | | 2.69 | | | | (0.59 | ) | | | 0.94 | | | | 0.42 | | | | (0.04 | ) |
| | | | | | | | | | | | | | | | | | | | | | | | | | | | |
| | | | | | | |
Distributions to Common Shareholders(b) | | | | | | | | | | | | | | | | | | | | | | | | | | | | |
From net investment income | | | | | | | (0.35 | ) | | | (0.69 | ) | | | (0.68 | ) | | | (0.76 | ) | | | (0.86 | ) | | | (0.94 | ) |
From net realized gain | | | | | | | — | | | | — | | | | — | | | | (0.06 | ) | | | — | | | | — | |
| | | | | | | | | | | | | | | | | | | | | | | | | | | | |
| | | | | | | |
Total distributions to Common Shareholders | | | | | | | (0.35 | ) | | | (0.69 | ) | | | (0.68 | ) | | | (0.82 | ) | | | (0.86 | ) | | | (0.94 | ) |
| | | | | | | | | | | | | | | | | | | | | | | | | | | | |
| | | | | | | |
Net asset value, end of period | | | | | | $ | 15.30 | | | $ | 15.60 | | | $ | 13.60 | | | $ | 14.87 | | | $ | 14.75 | | | $ | 15.19 | |
| | | | | | | | | | | | | | | | | | | | | | | | | | | | |
| | | | | | | |
Market price, end of period | | | | | | $ | 14.78 | | | $ | 15.15 | | | $ | 12.55 | | | $ | 14.29 | | | $ | 14.05 | | | $ | 15.45 | |
| | | | | | | | | | | | | | | | | | | | | | | | | | | | |
| | | | | | | |
Total Return Applicable to Common Shareholders(c) | | | | | | | | | | | | | | | | | | | | | | | | | | | | |
Based on net asset value | | | | | | | 0.30 | %(d) | | | 20.22 | % | | | (4.21 | )% | | | 6.83 | % | | | 2.79 | % | | | (0.34 | )% |
| | | | | | | | | | | | | | | | | | | | | | | | | | | | |
| | | | | | | |
Based on market price | | | | | | | (0.23 | )%(d) | | | 26.52 | % | | | (8.02 | )% | | | 7.78 | % | | | (3.74 | )% | | | (5.68 | )% |
| | | | | | | | | | | | | | | | | | | | | | | | | | | | |
| | | | | | | |
Ratios to Average Net Assets Applicable to Common Shareholders | | | | | | | | | | | | | | | | | | | | | | | | | | | | |
Total expenses | | | | | | | 1.42 | %(e) | | | 1.47 | % | | | 2.14 | %(f) | | | 2.45 | % | | | 2.11 | % | | | 1.88 | % |
| | | | | | | | | | | | | | | | | | | | | | | | | | | | |
| | | | | | | |
Total expenses after fees waived and/or reimbursed | | | | | | | 1.42 | %(e) | | | 1.47 | % | | | 2.13 | %(f) | | | 2.45 | % | | | 2.11 | % | | | 1.87 | % |
| | | | | | | | | | | | | | | | | | | | | | | | | | | | |
Total expenses after fees waived and/or reimbursed and excluding interest expense,fees, and amortization of offering costs(g) | | | | | | | 0.89 | %(e) | | | 0.90 | % | | | 0.89 | %(f) | | | 0.91 | % | | | 0.91 | % | | | 0.92 | % |
| | | | | | | | | | | | | | | | | | | | | | | | | | | | |
| | | | | | | |
Net investment income to Common Shareholders | | | | | | | 4.26 | %(e) | | | 4.75 | % | | | 4.51 | %(f) | | | 5.09 | % | | | 5.44 | % | | | 5.78 | % |
| | | | | | | | | | | | | | | | | | | | | | | | | | | | |
| | | | | | | |
Supplemental Data | | | | | | | | | | | | | | | | | | | | | | | | | | | | |
Net assets applicable to Common Shareholders, end of period (000) | | | | | | $ | 326,790 | | | $ | 332,905 | | | $ | 290,223 | | | $ | 317,175 | | | $ | 314,261 | | | $ | 321,939 | |
| | | | | | | | | | | | | | | | | | | | | | | | | | | | |
| | | | | | | |
VMTP Shares outstanding at $100,000 liquidation value, end of period (000) | | | | | | $ | 140,000 | | | $ | 140,000 | | | $ | 140,000 | | | $ | 140,000 | | | $ | 140,000 | | | $ | 140,000 | |
| | | | | | | | | | | | | | | | | | | | | | | | | | | | |
| | | | | | | |
Asset coverage per VMTP Shares at $100,000 liquidation value, end of period | | | | | | $ | 333,421 | | | $ | 337,789 | | | $ | 307,302 | | | $ | 326,553 | | | $ | 324,472 | | | $ | 329,956 | |
| | | | | | | | | | | | | | | | | | | | | | | | | | | | |
| | | | | | | |
Borrowings outstanding, end of period (000) | | | | | | $ | 61,989 | | | $ | 57,997 | | | $ | 56,198 | | | $ | 47,982 | | | $ | 61,343 | | | $ | 60,575 | |
| | | | | | | | | | | | | | | | | | | | | | | | | | | | |
| | | | | | | |
Portfolio turnover rate | | | | | | | 5 | % | | | 13 | % | | | 18 | % | | | 25 | % | | | 11 | % | | | 9 | % |
| | | | | | | | | | | | | | | | | | | | | | | | | | | | |
| (a) | Based on average Common Shares outstanding. |
| (b) | Distributions for annual periods determined in accordance with U.S. federal income tax regulations. |
| (c) | Total returns based on market price, which can be significantly greater or less than the net asset value, may result in substantially different returns. Where applicable, excludes the effects of any sales charges and assumes the reinvestment of distributions at actual reinvestment prices. |
| (d) | Aggregate total return. |
| (f) | Excludes 0.01% of expenses incurred indirectly as a result of investments in underlying funds. |
| (g) | Interest expense, fees and amortization of offering costs related to TOB Trusts and/or VMTP Shares. See Note 4 and Note 10 of the Notes to Financial Statements for details. |
See notes to financial statements.
Notes to Financial Statements (unaudited)
The following are registered under the Investment Company Act of 1940, as amended (the “1940 Act”), as closed-end management investment companies and are referred to herein collectively as the “Funds”, or individually as a “Fund”:
| | | | | | |
|
| | | |
| Fund Name | | Herein Referred To As | | Organized | | Diversification Classification |
|
| | | |
BlackRock MuniAssets Fund, Inc. | | MUA | | Maryland | | Diversified |
BlackRock Municipal Income Fund, Inc. | | MUI | | Maryland | | Diversified |
BlackRock MuniHoldings Fund, Inc. | | MHD | | Maryland | | Diversified |
BlackRock MuniVest Fund II, Inc. | | MVT | | Maryland | | Diversified |
|
The Boards of Directors of the Funds are collectively referred to throughout this report as the “Board,” and the directors thereof are collectively referred to throughout this report as “Directors”. The Funds determine and make available for publication the net asset values (“NAVs”) of their Common Shares on a daily basis.
On September 24, 2021, the Board of Directors of the Fund approved a change in the name of BlackRock Muni Intermediate Duration Fund, Inc., effective as of October 1, 2021, to BlackRock Municipal Income Fund, Inc.
On September 24, 2021, the Board of Trustees of BlackRock MuniHoldings Investment Quality Fund (MFL) and the Board of Directors of MUI each approved the reorganization of the MFL into MUI. Subject to approvals by each Fund’s shareholders and the satisfaction of customary closing conditions, the reorganization is expected to occur during the first or second quarter of 2022.
The Funds, together with certain other registered investment companies advised by BlackRock Advisors, LLC (the “Manager”) or its affiliates, are included in a complex of non-index fixed-income mutual funds and all BlackRock-advised closed-end funds referred to as the BlackRock Fixed-Income Complex.
Prior Year Reorganization: The Board and shareholders of MHD (the “Acquiring Fund”) and the Board and shareholders of each of BlackRock Municipal Income Investment Quality Trust (“BAF”), BlackRock Municipal Bond Trust (“BBK”), BlackRock MuniHoldings Fund II, Inc. (“MUH”) and BlackRock MuniHoldings Quality Fund, Inc. (“MUS”) (individually, a “Target Fund” and collectively the “Target Funds”) approved the reorganization of each Target Fund into the Acquiring Fund. As a result, the Acquiring Fund acquired substantially all of the assets and assumed substantially all of the liabilities of each Target Fund in exchange for an equal aggregate value of newly-issued Common Shares and Preferred Shares of the Acquiring Fund.
Each Common Shareholder of a Target Fund received Common Shares of the Acquiring Fund in an amount equal to the aggregate NAV of such Common Shareholder’s Target Fund Common Shares, as determined at the close of business on March 5, 2021. Cash was distributed for any fractional shares.
Each Preferred Shareholder of a Target Fund received Preferred Shares of the Acquiring Fund in an amount equal to the aggregate liquidation preference of the Target Fund’s Preferred Shares held by such Preferred Shareholder prior to the Target Fund’s reorganization.
The reorganizations were accomplished by a tax-free exchange of Common Shares and Preferred Shares of the Acquiring Fund in the following amounts and at the following conversion ratios:
| | | | | | | | | | | | |
| | | | | | |
| Target Funds | | Target Fund’s Share Class | | Shares Prior to Reorganization | | Conversion Ratio | | MHD’s Share Class | | Shares of MHD | |
| | | | | |
BAF | | Common | | 8,749,418 | | 0.89746185 | | Common | | | 7,852,259 | (a) |
BBK | | Common | | 10,522,957 | | 0.96696817 | | Common | | | 10,175,357 | (a) |
MUH | | Common | | 11,336,282 | | 0.92578578 | | Common | | | 10,494,965 | (a) |
MUS | | Common | | 13,018,276 | | 0.81612104 | | Common | | | 10,624,485 | (a) |
BAF | | VMTP | | 422 | | 1 | | VMTP | | | 422 | |
BBK | | VMTP | | 799 | | 1 | | VMTP | | | 799 | |
MUH | | VMTP | | 550 | | 1 | | VMTP | | | 550 | |
MUS | | VMTP | | 870 | | 1 | | VMTP | | | 870 | |
| | (a) | Net of fractional shares redeemed. | |
Each Target Fund’s net assets and composition of net assets on March 5, 2021, the valuation date of the reorganization were as follows:
| | | | | | | | |
|
| | | | |
| | | BAF | | BBK | | MUH | | MUS |
|
| | | | |
Net assets applicable to Common Shareholders | | $133,431,549 | | $172,906,686 | | $178,338,366 | | $180,538,553 |
Paid-in-capital | | 123,568,480 | | 148,932,221 | | 155,728,501 | | 167,933,515 |
Accumulated earnings | | 9,863,069 | | 23,974,465 | | 22,609,865 | | 12,605,038 |
|
For financial reporting purposes, assets received and shares issued by the Acquiring Fund were recorded at fair value. However, the cost basis of the investments received from the Target Funds was carried forward to align ongoing reporting of the Acquiring Fund’s realized and unrealized gains and losses with amounts distributable to shareholders for tax purposes.
| | |
| 70 | | 2 0 2 1 BLACK ROCK SEMI - ANNUAL REPORT TO SHAREHOLDERS |
Notes to Financial Statements (unaudited) (continued)
The net assets applicable to Common Shareholders of the Acquiring Fund before the reorganizations were $241,462,174. The aggregate net assets applicable to Common Shareholders of the Acquiring Fund immediately after the reorganizations amounted to $906,677,328. Each Target Fund’s fair value and cost of financial instruments prior to the reorganization were as follows:
| | | | | | | | | | | | | | |
| | | | | |
| Target Funds | | Fair Value of Investments | | | Cost of Investments | | | TOB Trust Certificates | | | Preferred Shares Value |
| | | | |
BAF | | $ | 223,936,158 | | | $ | 207,836,363 | | | $ | 49,618,622 | | | $42,200,000 |
BBK | | | 277,541,340 | | | | 250,542,078 | | | | 33,649,476 | | | 79,900,000 |
MUH | | | 278,307,330 | | | | 252,425,263 | | | | 49,204,091 | | | 55,000,000 |
MUS | | | 291,481,501 | | | | 268,355,737 | | | | 29,367,864 | | | 87,000,000 |
The purpose of these transactions was to combine five funds managed by the Manager with the same or substantially similar (but not identical) investment objectives, investment policies, strategies, risks and restrictions. Each reorganization was a tax-free event and was effective on March 8, 2021.
Assuming the reorganization had been completed on May 1, 2020, the beginning of the fiscal reporting period of MHD, the pro forma results of operations for the year ended April 30, 2021, are as follows:
| • | | Net investment income (loss): $41,679,250 |
| • | | Net realized and change in unrealized gain/loss on investments: $101,416,927 |
| • | | Net increase in net assets resulting from operations: $143,096,177 |
Because the combined investment portfolios have been managed as a single integrated portfolio since the reorganization was completed, it is not practicable to separate the amounts of revenue and earnings of each Target Fund that have been included in MHD’s Statement of Operations since March 8, 2021.
Reorganization costs incurred by MHD in connection with the reorganization were expensed by MHD. The Manager reimbursed the Fund $123,963.
| 2. | SIGNIFICANT ACCOUNTING POLICIES |
The financial statements are prepared in conformity with accounting principles generally accepted in the United States of America (“U.S. GAAP”), which may require management to make estimates and assumptions that affect the reported amounts of assets and liabilities in the financial statements, disclosure of contingent assets and liabilities at the date of the financial statements and the reported amounts of increases and decreases in net assets from operations during the reporting period. Actual results could differ from those estimates. Each Fund is considered an investment company under U.S. GAAP and follows the accounting and reporting guidance applicable to investment companies. Below is a summary of significant accounting policies:
Investment Transactions and Income Recognition: For financial reporting purposes, investment transactions are recorded on the dates the transactions are executed. Realized gains and losses on investment transactions are determined using the specific identification method. Dividend income and capital gain distributions, if any, are recorded on the ex-dividend dates. Non-cash dividends, if any, are recorded on the ex-dividend dates at fair value. Interest income, including amortization and accretion of premiums and discounts on debt securities, is recognized daily on an accrual basis.
Segregation and Collateralization: In cases where a Fund enters into certain investments (e.g., futures contracts) or certain borrowings (e.g., TOB Trust transactions) that would be treated as “senior securities” for 1940 Act purposes, a Fund may segregate or designate on its books and records cash or liquid assets having a market value at least equal to the amount of its future obligations under such investments or borrowings. Doing so allows the investments or borrowings to be excluded from treatment as a “senior security.” Furthermore, if required by an exchange or counterparty agreement, the Funds may be required to deliver/deposit cash and/or securities to/with an exchange, or broker-dealer or custodian as collateral for certain investments or obligations.
Distributions: Distributions from net investment income are declared and paid monthly. Distributions of capital gains are recorded on the ex-dividend dates and made at least annually. The character and timing of distributions are determined in accordance with U.S. federal income tax regulations, which may differ from U.S. GAAP.
Distributions to Preferred Shareholders are accrued and determined as described in Note 10.
Deferred Compensation Plan: Under the Deferred Compensation Plan (the “Plan”) approved by each Fund’s Board, the directors who are not “interested persons” of the Funds, as defined in the 1940 Act (“Independent Directors”), may defer a portion of their annual complex-wide compensation. Deferred amounts earn an approximate return as though equivalent dollar amounts had been invested in common shares of certain funds in the BlackRock Fixed-Income Complex selected by the Independent Directors. This has the same economic effect for the Independent Directors as if the Independent Directors had invested the deferred amounts directly in certain funds in the BlackRock Fixed-Income Complex.
The Plan is not funded and obligations thereunder represent general unsecured claims against the general assets of each Fund, as applicable. Deferred compensation liabilities, if any, are included in the Directors’ and Officer’s fees payable in the Statements of Assets and Liabilities and will remain as a liability of the Funds until such amounts are distributed in accordance with the Plan.
| | |
NOTES TO FINANCIAL STATEMENTS | | 71 |
Notes to Financial Statements (unaudited) (continued)
Indemnifications: In the normal course of business, a Fund enters into contracts that contain a variety of representations that provide general indemnification. A Fund’s maximum exposure under these arrangements is unknown because it involves future potential claims against a Fund, which cannot be predicted with any certainty.
Other: Expenses directly related to a Fund are charged to that Fund. Other operating expenses shared by several funds, including other funds managed by the Manager, are prorated among those funds on the basis of relative net assets or other appropriate methods.
| 3. | INVESTMENT VALUATION AND FAIR VALUE MEASUREMENTS |
Investment Valuation Policies: Each Fund’s investments are valued at fair value (also referred to as “market value” within the financial statements) each day that the Fund is open for business and, for financial reporting purposes, as of the report date. U.S. GAAP defines fair value as the price a fund would receive to sell an asset or pay to transfer a liability in an orderly transaction between market participants at the measurement date. Each Fund determines the fair values of its financial instruments using various independent dealers or pricing services under policies approved by the Board. If a security’s market price is not readily available or does not otherwise accurately represent the fair value of the security, the security will be valued in accordance with a policy approved by the Board as reflecting fair value. The BlackRock Global Valuation Methodologies Committee (the “Global Valuation Committee”) is the committee formed by management to develop global pricing policies and procedures and to oversee the pricing function for all financial instruments.
Fair Value Inputs and Methodologies: The following methods and inputs are used to establish the fair value of each Fund’s assets and liabilities:
| | • | | Fixed-income investments for which market quotations are readily available are generally valued using the last available bid price or current market quotations provided by independent dealers or third-party pricing services. Pricing services generally value fixed-income securities assuming orderly transactions of an institutional round lot size, but a fund may hold or transact in such securities in smaller, odd lot sizes. Odd lots may trade at lower prices than institutional round lots. The pricing services may use matrix pricing or valuation models that utilize certain inputs and assumptions to derive values, including transaction data (e.g., recent representative bids and offers), market data, credit quality information, perceived market movements, news, and other relevant information. Certain fixed-income securities, including asset-backed and mortgage related securities may be valued based on valuation models that consider the estimated cash flows of each tranche of the entity, establish a benchmark yield and develop an estimated tranche specific spread to the benchmark yield based on the unique attributes of the tranche. The amortized cost method of valuation may be used with respect to debt obligations with sixty days or less remaining to maturity unless the Manager determines such method does not represent fair value. |
| | • | | Investments in open-end U.S. mutual funds (including money market funds) are valued at that day’s published NAV. |
| | • | | Futures contracts are valued based on that day’s last reported settlement or trade price on the exchange where the contract is traded. |
If events (e.g., market volatility, company announcement or a natural disaster) occur that are expected to materially affect the value of such investment, or in the event that application of these methods of valuation results in a price for an investment that is deemed not to be representative of the market value of such investment, or if a price is not available, the investment will be valued by the Global Valuation Committee, or its delegate, in accordance with a policy approved by the Board as reflecting fair value (“Fair Valued Investments”). The fair valuation approaches that may be used by the Global Valuation Committee include market approach, income approach and cost approach. Valuation techniques such as discounted cash flow, use of market comparables and matrix pricing are types of valuation approaches and are typically used in determining fair value. When determining the price for Fair Valued Investments, the Global Valuation Committee, or its delegate, seeks to determine the price that each Fund might reasonably expect to receive or pay from the current sale or purchase of that asset or liability in an arm’s-length transaction. Fair value determinations shall be based upon all available factors that the Global Valuation Committee, or its delegate, deems relevant and consistent with the principles of fair value measurement. The pricing of all Fair Valued Investments is subsequently reported to the Board or a committee thereof on a quarterly basis.
Fair Value Hierarchy: Various inputs are used in determining the fair value of financial instruments. These inputs to valuation techniques are categorized into a fair value hierarchy consisting of three broad levels for financial reporting purposes as follows:
| | • | | Level 1 – Unadjusted price quotations in active markets/exchanges for identical assets or liabilities that each Fund has the ability to access; |
| | • | | Level 2 – Other observable inputs (including, but not limited to, quoted prices for similar assets or liabilities in markets that are active, quoted prices for identical or similar assets or liabilities in markets that are not active, inputs other than quoted prices that are observable for the assets or liabilities (such as interest rates, yield curves, volatilities, prepayment speeds, loss severities, credit risks and default rates) or other market–corroborated inputs); and |
| | • | | Level 3 – Unobservable inputs based on the best information available in the circumstances, to the extent observable inputs are not available (including the Global Valuation Committee’s assumptions used in determining the fair value of financial instruments). |
The hierarchy gives the highest priority to unadjusted quoted prices in active markets for identical assets or liabilities (Level 1 measurements) and the lowest priority to unobservable inputs (Level 3 measurements). Accordingly, the degree of judgment exercised in determining fair value is greatest for instruments categorized in Level 3. The inputs used to measure fair value may fall into different levels of the fair value hierarchy. In such cases, for disclosure purposes, the fair value hierarchy classification is determined based on the lowest level input that is significant to the fair value measurement in its entirety. Investments classified within Level 3 have significant unobservable inputs used by the Global Valuation Committee in determining the price for Fair Valued Investments. Level 3 investments include equity or debt issued by privately held companies or funds that may not have a secondary market and/or may have a limited number of investors. The categorization of a value determined for financial instruments is based on the pricing transparency of the financial instruments and is not necessarily an indication of the risks associated with investing in those securities.
| | |
| 72 | | 2 0 2 1 BLACK ROCK SEMI - ANNUAL REPORT TO SHAREHOLDERS |
Notes to Financial Statements (unaudited) (continued)
| 4. | SECURITIES AND OTHER INVESTMENTS |
Zero-Coupon Bonds: Zero-coupon bonds are normally issued at a significant discount from face value and do not provide for periodic interest payments. These bonds may experience greater volatility in market value than other debt obligations of similar maturity which provide for regular interest payments.
Forward Commitments, When-Issued and Delayed Delivery Securities: The Funds may purchase securities on a when-issued basis and may purchase or sell securities on a forward commitment basis. Settlement of such transactions normally occurs within a month or more after the purchase or sale commitment is made. The Funds may purchase securities under such conditions with the intention of actually acquiring them but may enter into a separate agreement to sell the securities before the settlement date. Since the value of securities purchased may fluctuate prior to settlement, the Funds may be required to pay more at settlement than the security is worth. In addition, a Fund is not entitled to any of the interest earned prior to settlement. When purchasing a security on a delayed delivery basis, the Funds assume the rights and risks of ownership of the security, including the risk of price and yield fluctuations. In the event of default by the counterparty, the Funds’ maximum amount of loss is the unrealized appreciation of unsettled when-issued transactions.
Municipal Bonds Transferred to TOB Trusts: Certain Funds leverage their assets through the use of “TOB Trust” transactions. The funds transfer municipal bonds into a special purpose trust (a “TOB Trust”). A TOB Trust issues two classes of beneficial interests: short-term floating rate interests (“TOB Trust Certificates”), which are sold to third-party investors, and residual inverse floating rate interests (“TOB Residuals”), which are issued to the participating funds that contributed the municipal bonds to the TOB Trust. The TOB Trust Certificates have interest rates that reset weekly and their holders have the option to tender such certificates to the TOB Trust for redemption at par and any accrued interest at each reset date. The TOB Residuals held by a fund provide the fund with the right to cause the holders of a proportional share of the TOB Trust Certificates to tender their certificates to the TOB Trust at par plus accrued interest. The funds may withdraw a corresponding share of the municipal bonds from the TOB Trust. Other funds managed by the investment adviser may also contribute municipal bonds to a TOB Trust into which a fund has contributed bonds. If multiple BlackRock-advised funds participate in the same TOB Trust, the economic rights and obligations under the TOB Residuals will be shared among the funds ratably in proportion to their participation in the TOB Trust.
TOB Trusts are supported by a liquidity facility provided by a third-party bank or other financial institution (the “Liquidity Provider”) that allows the holders of the TOB Trust Certificates to tender their certificates in exchange for payment of par plus accrued interest on any business day. The tendered TOB Trust Certificates are remarketed by a Remarketing Agent. In the event of a failed remarketing, the TOB Trust may draw upon a loan from the Liquidity Provider to purchase the tendered TOB Trust Certificates. Any loans made by the Liquidity Provider will be secured by the purchased TOB Trust Certificates held by the TOB Trust and will be subject to an increased interest rate based on number of days the loan is outstanding.
The TOB Trust may be collapsed without the consent of a fund, upon the occurrence of a termination event as defined in the TOB Trust agreement. Upon the occurrence of a termination event, a TOB Trust would be liquidated with the proceeds applied first to any accrued fees owed to the trustee of the TOB Trust, the Remarketing Agent and the Liquidity Provider. Upon certain termination events, TOB Trust Certificates holders will be paid before the TOB Residuals holders (i.e., the Funds) whereas in other termination events, TOB Trust Certificates holders and TOB Residuals holders will be paid pro rata.
While a fund’s investment policies and restrictions expressly permit investments in inverse floating rate securities, such as TOB Residuals, they restrict the ability of a fund to borrow money for purposes of making investments. MUA and MVT management believes that a Fund’s restrictions on borrowings do not apply to the Funds’ TOB Trust transactions. Each fund’s transfer of the municipal bonds to a TOB Trust is considered a secured borrowing for financial reporting purposes. The cash received by the TOB Trust from the sale of the TOB Trust Certificates, less certain transaction expenses, is paid to a fund. A fund typically invests the cash received in additional municipal bonds.
Accounting for TOB Trusts: The municipal bonds deposited into a TOB Trust are presented in a fund’s Schedule of Investments and the TOB Trust Certificates are shown in Other Liabilities in the Statements of Assets and Liabilities. Any loans drawn by the TOB Trust pursuant to the liquidity facility to purchase tendered TOB Trust Certificates are shown as Loan for TOB Trust Certificates. The carrying amount of a fund’s payable to the holder of the TOB Trust Certificates, as reported in the Statements of Assets and Liabilities as TOB Trust Certificates, approximates its fair value.
Interest income, including amortization and accretion of premiums and discounts, from the underlying municipal bonds is recorded by a fund on an accrual basis. Interest expense incurred on the TOB Trust transaction and other expenses related to remarketing, administration, trustee, liquidity and other services to a TOB Trust are shown as interest expense, fees and amortization of offering costs in the Statements of Operations. Fees paid upon creation of the TOB Trust are recorded as debt issuance costs and are amortized to interest expense, fees and amortization of offering costs in the Statements of Operations to the expected maturity of the TOB Trust. In connection with the restructurings of the TOB Trusts to non-bank sponsored TOB Trusts, a fund incurred non-recurring, legal and restructuring fees, which are recorded as interest expense, fees and amortization of offering costs in the Statements of Operations. Amounts recorded within interest expense, fees and amortization of offering costs in the Statements of Operations are:
| | | | | | | | | | | | | | | | |
| |
| | | | |
| Fund Name | | Interest Expense | | | Liquidity Fees | | | Other Expenses | | | Total | |
| |
| | | | |
MUA | | $ | 24,694 | | | $ | 133,589 | | | $ | 44,014 | | | $ | 202,297 | |
MUI | | | 33,134 | | | | 190,749 | | | | 52,111 | | | | 275,994 | |
MHD | | | 84,654 | | | | 422,076 | | | | 150,650 | | | | 657,380 | |
MVT | | | 24,503 | | | | 119,142 | | | | 39,938 | | | | 183,583 | |
| |
| | |
NOTES TO FINANCIAL STATEMENTS | | 73 |
Notes to Financial Statements (unaudited) (continued)
For the six months ended October 31, 2021, the following table is a summary of each Fund’s TOB Trusts:
| | | | | | | | | | | | | | | | | | | | |
| | | | | | |
| Fund Name | |
| Underlying
Municipal Bonds Transferred to TOB Trusts |
(a) | |
| Liability for
TOB Trust Certificates |
(b) | |
| Range of
Interest Rates on TOB Trust Certificates at Period End |
| |
| Average
TOB Trust Certificates Outstanding |
| |
| Daily Weighted
Average Rate of Interest and Other Expenses on TOB Trusts |
|
| | | | | |
MUA | | | $ 98,562,891 | | | $ | 61,889,545 | | | | 0.06% — 0.17% | | | $ | 62,234,308 | | | | 0.64 | % |
MUI | | | 141,529,787 | | | | 83,289,072 | | | | 0.07 — 0.15 | | | | 88,234,449 | | | | 0.62 | |
MHD | | | 361,262,340 | | | | 206,226,045 | | | | 0.06 — 0.21 | | | | 206,503,795 | | | | 0.63 | |
MVT | | | 104,807,890 | | | | 61,988,645 | | | | 0.06 — 0.20 | | | | 58,956,725 | | | | 0.62 | |
| | (a) | The municipal bonds transferred to a TOB Trust are generally high grade municipal bonds. In certain cases, when municipal bonds transferred are lower grade municipal bonds, the TOB Trust transaction may include a credit enhancement feature that provides for the timely payment of principal and interest on the bonds to the TOB Trust by a credit enhancement provider in the event of default of the municipal bond. The TOB Trust would be responsible for the payment of the credit enhancement fee and the funds, as TOB Residuals holders, would be responsible for reimbursement of any payments of principal and interest made by the credit enhancement provider. The maximum potential amounts owed by the funds, for such reimbursements, as applicable, are included in the maximum potential amounts disclosed for recourse TOB Trusts in the Schedules of Investments. | |
| | (b) | TOB Trusts may be structured on a non-recourse or recourse basis. When a Fund invests in TOB Trusts on a non-recourse basis, the Liquidity Provider may be required to make a payment under the liquidity facility to allow the TOB Trust to repurchase TOB Trust Certificates. The Liquidity Provider will be reimbursed from the liquidation of bonds held in the TOB Trust. If a fund invests in a TOB Trust on a recourse basis, a fund enters into a reimbursement agreement with the Liquidity Provider where a fund is required to reimburse the Liquidity Provider for any shortfall between the amount paid by the Liquidity Provider and proceeds received from liquidation of municipal bonds held in the TOB Trust (the “Liquidation Shortfall”). As a result, if a fund invests in a recourse TOB Trust, a fund will bear the risk of loss with respect to any Liquidation Shortfall. If multiple funds participate in any such TOB Trust, these losses will be shared ratably, including the maximum potential amounts owed by a fund at October 31, 2021, in proportion to their participation in the TOB Trust. The recourse TOB Trusts are identified in the Schedules of Investments including the maximum potential amounts owed by a fund at October 31, 2021. | |
For the six months ended October 31, 2021, the following table is a summary of each Fund’s Loan for TOB Trust Certificates:
| | | | | | | | | | | | | | | | |
| | | | | |
| Fund Name | | Loans Outstanding at Period End | | | Range of Interest Rates on Loans at Period End | | | Average Loans Outstanding | | | Daily Weighted Average Rate of Interest and Other Expenses on Loans | |
| | | | |
MUI | | $ | — | | | | — | % | | $ | 42,351 | | | | 0.78 | % |
MHD | | | — | | | | — | | | | 77,391 | | | | 0.71 | |
| 5. | DERIVATIVE FINANCIAL INSTRUMENTS |
The Funds engage in various portfolio investment strategies using derivative contracts both to increase the returns of the Funds and/or to manage their exposure to certain risks such as credit risk, equity risk, interest rate risk, foreign currency exchange rate risk, commodity price risk or other risks (e.g., inflation risk). Derivative financial instruments categorized by risk exposure are included in the Schedules of Investments. These contracts may be transacted on an exchange or over-the-counter (“OTC”).
Futures Contracts: Futures contracts are purchased or sold to gain exposure to, or manage exposure to, changes in interest rates (interest rate risk) and changes in the value of equity securities (equity risk) or foreign currencies (foreign currency exchange rate risk).
Futures contracts are exchange-traded agreements between the Funds and a counterparty to buy or sell a specific quantity of an underlying instrument at a specified price and on a specified date. Depending on the terms of a contract, it is settled either through physical delivery of the underlying instrument on the settlement date or by payment of a cash amount on the settlement date. Upon entering into a futures contract, the Funds are required to deposit initial margin with the broker in the form of cash or securities in an amount that varies depending on a contract’s size and risk profile. The initial margin deposit must then be maintained at an established level over the life of the contract. Amounts pledged, which are considered restricted, are included in cash pledged for futures contracts in the Statements of Assets and Liabilities.
Securities deposited as initial margin are designated in the Schedules of Investments and cash deposited, if any, are shown as cash pledged for futures contracts in the Statements of Assets and Liabilities. Pursuant to the contract, the Funds agree to receive from or pay to the broker an amount of cash equal to the daily fluctuation in market value of the contract (“variation margin”). Variation margin is recorded as unrealized appreciation (depreciation) and, if any, shown as variation margin receivable (or payable) on futures contracts in the Statements of Assets and Liabilities. When the contract is closed, a realized gain or loss is recorded in the Statements of Operations equal to the difference between the notional amount of the contract at the time it was opened and the notional amount at the time it was closed. The use of futures contracts involves the risk of an imperfect correlation in the movements in the price of futures contracts and interest rates, foreign currency exchange rates or underlying assets.
| 6. | INVESTMENT ADVISORY AGREEMENT AND OTHER TRANSACTIONS WITH AFFILIATES |
Investment Advisory: Each Fund entered into an Investment Advisory Agreement with the Manager, the Funds’ investment adviser and an indirect, wholly-owned subsidiary of BlackRock, Inc. (“BlackRock”), to provide investment advisory and administrative services. The Manager is responsible for the management of each Fund’s portfolio and provides the personnel, facilities, equipment and certain other services necessary to the operations of each Fund.
| | |
| 74 | | 2 0 2 1 BLACK ROCK SEMI - ANNUAL REPORT TO SHAREHOLDERS |
Notes to Financial Statements (unaudited) (continued)
For such services, each Fund, except MUI, pays the Manager a monthly fee at an annual rate equal to the following percentages of the average daily value of each Fund’s net assets:
| | | | |
| | |
| Fund Name | | Investment
Advisory Fees | |
| |
MUA | | | 0.55 | % |
MHD | | | 0.55 | |
MVT | | | 0.50 | |
For such services, MUI pays the Manager a monthly fee of 0.55% of (i) the average daily value of MUI’s net assets and (ii) the proceeds of any outstanding debt securities and borrowings used for leverage.
For purposes of calculating these fees, “net assets” mean the total assets of the Fund minus the sum of its accrued liabilities (which does not include liabilities represented by TOB Trusts and the liquidation preference of any outstanding preferred shares). It is understood that the liquidation preference of any outstanding preferred stock (other than accumulated dividends) and TOB Trusts is not considered a liability in determining a Fund’s NAV.
Distribution Fees: MUA has entered into a Distribution Agreement with BlackRock Investments, LLC (“BRIL”), an affiliate of the Manager, to provide for distribution of MUA common shares on a reasonable best efforts basis through an equity shelf offering (a “Shelf Offering”) (the “Distribution Agreement”). Pursuant to the Distribution Agreement, BRIL will receive commissions with respect to sales of common shares at a commission rate of 1.00% of the gross proceeds of the sale of MUA’s common shares and a portion of such commission is re-allowed to broker-dealers engaged by BRIL. The commissions retained by BRIL during the period ended October 31, 2021 amounted to $22,657.
Waivers: With respect to each Fund, the Manager contractually agreed to waive its investment advisory fees by the amount of investment advisory fees each Fund pays to the Manager indirectly through its investment in affiliated money market funds (the “affiliated money market fund waiver”) through June 30, 2023. The contractual agreement may be terminated upon 90 days’ notice by a majority of the Independent Directors, or by a vote of a majority of the outstanding voting securities of a Fund. These amounts are included in fees waived and/or reimbursed by the Manager in the Statements of Operations. For the six months ended October 31, 2021, the amounts waived were as follows:
| | | | |
| |
| |
| Fund Name | | Fees Waived and/or Reimbursed by the Manager | |
| |
| |
MUA | | $ | 1,392 | |
MUI | | | 1,268 | |
MHD | | | 1,495 | |
MVT | | | 246 | |
| |
The Manager contractually agreed to waive its investment advisory fee with respect to any portion of each Fund’s assets invested in affiliated equity and fixed-income mutual funds and affiliated exchange-traded funds that have a contractual management fee through June 30, 2023. The agreement can be renewed for annual periods thereafter, and may be terminated on 90 days’ notice, each subject to approval by a majority of the Funds’ Independent Directors. For the six months ended October 31, 2021, there were no fees waived by the Manager pursuant to this arrangement.
With respect to MHD, the Manager contractually agreed to waive a portion of its investment advisory fees equal to the annual rate of 0.01% of the average daily value of net assets through June 30, 2022. The contractual agreement may be terminated upon 90 days’ notice by a majority of the Independent Directors, or by a vote of a majority of the outstanding voting securities of the Fund. This amount is included in fees waived and/or reimbursed by the Manager in the Statements of Operations. For the six months ended October 31, 2021, the amounts waived was $74,736.
The Manager reimbursed MUI $10,435 for reorganization costs.
Directors and Officers: Certain directors and/or officers of the Funds are directors and/or officers of BlackRock or its affiliates. The Funds reimburse the Manager for a portion of the compensation paid to the Funds’ Chief Compliance Officer, which is included in Directors and Officer in the Statements of Operations.
For the six months ended October 31, 2021, purchases and sales of investments, excluding short-term investments, were as follows:
| | | | | | | | |
| |
| | |
| Fund Name | | Purchases | | | Sales | |
| |
| | |
MUA | | $ | 62,098,795 | | | $ | 64,611,689 | |
MUI | | | 76,101,753 | | | | 73,094,641 | |
MHD | | | 98,140,209 | | | | 104,187,315 | |
MVT | | | 29,429,500 | | | | 24,421,023 | |
| |
It is each Fund’s policy to comply with the requirements of the Internal Revenue Code of 1986, as amended, applicable to regulated investment companies, and to distribute substantially all of its taxable income to its shareholders. Therefore, no U.S. federal income tax provision is required.
| | |
NOTES TO FINANCIAL STATEMENTS | | 75 |
Notes to Financial Statements (unaudited) (continued)
Each Fund files U.S. federal and various state and local tax returns. No income tax returns are currently under examination. The statute of limitations on each Fund’s U.S. federal tax returns generally remains open for a period of three fiscal years after they are filed. The statutes of limitations on each Fund’s state and local tax returns may remain open for an additional year depending upon the jurisdiction.
Management has analyzed tax laws and regulations and their application to the Funds as of October 31, 2021, inclusive of the open tax return years, and does not believe that there are any uncertain tax positions that require recognition of a tax liability in the Funds’ financial statements.
As of April 30, 2021, the Funds had non-expiring capital loss carryforwards, subject to limitation, available to offset future realized capital gains as follows:
| | | | |
| |
| |
| Fund Name | | Non-Expiring | |
| |
| |
MUI | | $ | 5,533,868 | |
MHD | | | 27,296,188 | |
MVT | | | 5,269,494 | |
| |
As of October 31, 2021, gross unrealized appreciation and depreciation based on cost of investments (including short positions and derivatives, if any) for U.S. federal income tax purposes were as follows:
| | | | | | | | | | | | | | | | |
| |
| | | | |
| Fund Name | | Tax Cost | | | Gross Unrealized Appreciation | | | Gross Unrealized Depreciation | | | Net Unrealized Appreciation (Depreciation) | |
| |
| | | | |
MUA | | $ | 510,327,857 | | | $ | 59,253,188 | | | $ | (7,535,864 | ) | | $ | 51,717,324 | |
MUI | | | 839,438,994 | | | | 66,646,215 | | | | (1,167,779 | ) | | | 65,478,436 | |
MHD | | | 1,121,344,499 | | | | 125,565,892 | | | | (3,232,766 | ) | | | 122,333,126 | |
MVT | | | 421,410,852 | | | | 42,538,849 | | | | (784,164 | ) | | | 41,754,685 | |
| |
In the normal course of business, the Funds invest in securities or other instruments and may enter into certain transactions, and such activities subject each Fund to various risks, including among others, fluctuations in the market (market risk) or failure of an issuer to meet all of its obligations. The value of securities or other instruments may also be affected by various factors, including, without limitation: (i) the general economy; (ii) the overall market as well as local, regional or global political and/or social instability; (iii) regulation, taxation or international tax treaties between various countries; or (iv) currency, interest rate and price fluctuations. Local, regional or global events such as war, acts of terrorism, the spread of infectious illness or other public health issues, recessions, or other events could have a significant impact on the Funds and their investments. MUA’s prospectus provides details of the risks to which the Fund is subject.
The Funds may hold a significant amount of bonds subject to calls by the issuers at defined dates and prices. When bonds are called by issuers and the Funds reinvest the proceeds received, such investments may be in securities with lower yields than the bonds originally held, and correspondingly, could adversely impact the yield and total return performance of a Fund.
A Fund structures and “sponsors” the TOB Trusts in which it holds TOB Residuals and has certain duties and responsibilities, which may give rise to certain additional risks including, but not limited to, compliance, securities law and operational risks.
Should short-term interest rates rise, the Funds’ investments in the TOB Trusts may adversely affect the Funds’ net investment income and dividends to Common Shareholders. Also, fluctuations in the market value of municipal bonds deposited into the TOB Trust may adversely affect the Funds’ NAVs per share.
The U.S. Securities and Exchange Commission (“SEC”) and various federal banking and housing agencies have adopted credit risk retention rules for securitizations (the “Risk Retention Rules”). The Risk Retention Rules would require the sponsor of a TOB Trust to retain at least 5% of the credit risk of the underlying assets supporting the TOB Trust’s municipal bonds. The Risk Retention Rules may adversely affect the Funds’ ability to engage in TOB Trust transactions or increase the costs of such transactions in certain circumstances.
TOB Trusts constitute an important component of the municipal bond market. Any modifications or changes to rules governing TOB Trusts may adversely impact the municipal market and the Funds, including through reduced demand for and liquidity of municipal bonds and increased financing costs for municipal issuers. The ultimate impact of any potential modifications on the TOB Trust market and the overall municipal market is not yet certain.
Each Fund may invest without limitation in illiquid or less liquid investments or investments in which no secondary market is readily available or which are otherwise illiquid, including private placement securities. A Fund may not be able to readily dispose of such investments at prices that approximate those at which a Fund could sell such investments if they were more widely traded and, as a result of such illiquidity, a Fund may have to sell other investments or engage in borrowing transactions if necessary to raise funds to meet its obligations. Limited liquidity can also affect the market price of investments, thereby adversely affecting a Fund’s NAV and ability to make dividend distributions. Privately issued debt securities are often of below investment grade quality, frequently are unrated and present many of the same risks as investing in below investment grade public debt securities.
Market Risk: Each Fund may be exposed to prepayment risk, which is the risk that borrowers may exercise their option to prepay principal earlier than scheduled during periods of declining interest rates, which would force each Fund to reinvest in lower yielding securities. Each Fund may also be exposed to reinvestment risk, which is the risk that income from each Fund’s portfolio will decline if each Fund invests the proceeds from matured, traded or called fixed-income securities at market interest rates that are below each Fund portfolio’s current earnings rate.
| | |
| 76 | | 2 0 2 1 BLACK ROCK SEMI - ANNUAL REPORT TO SHAREHOLDERS |
Notes to Financial Statements (unaudited) (continued)
Municipal securities are subject to the risk that litigation, legislation or other political events, local business or economic conditions, credit rating downgrades, or the bankruptcy of the issuer could have a significant effect on an issuer’s ability to make payments of principal and/or interest or otherwise affect the value of such securities. Municipal securities can be significantly affected by political or economic changes, including changes made in the law after issuance of the securities, as well as uncertainties in the municipal market related to, taxation, legislative changes or the rights of municipal security holders, including in connection with an issuer insolvency. Municipal securities backed by current or anticipated revenues from a specific project or specific assets can be negatively affected by the discontinuance of the tax benefits supporting the project or assets or the inability to collect revenues for the project or from the assets. Municipal securities may be less liquid than taxable bonds, and there may be less publicly available information on the financial condition of municipal security issuers than for issuers of other securities.
An outbreak of respiratory disease caused by a novel coronavirus has developed into a global pandemic and has resulted in closing borders, quarantines, disruptions to supply chains and customer activity, as well as general concern and uncertainty. The impact of this pandemic, and other global health crises that may arise in the future, could affect the economies of many nations, individual companies and the market in general in ways that cannot necessarily be foreseen at the present time. This pandemic may result in substantial market volatility and may adversely impact the prices and liquidity of a fund’s investments. The duration of this pandemic and its effects cannot be determined with certainty.
Counterparty Credit Risk: The Funds may be exposed to counterparty credit risk, or the risk that an entity may fail to or be unable to perform on its commitments related to unsettled or open transactions, including making timely interest and/or principal payments or otherwise honoring its obligations. The Funds manage counterparty credit risk by entering into transactions only with counterparties that the Manager believes have the financial resources to honor their obligations and by monitoring the financial stability of those counterparties. Financial assets, which potentially expose the Funds to market, issuer and counterparty credit risks, consist principally of financial instruments and receivables due from counterparties. The extent of the Funds’ exposure to market, issuer and counterparty credit risks with respect to these financial assets is approximately their value recorded in the Statements of Assets and Liabilities, less any collateral held by the Funds.
A derivative contract may suffer a mark-to-market loss if the value of the contract decreases due to an unfavorable change in the market rates or values of the underlying instrument. Losses can also occur if the counterparty does not perform under the contract.
With exchange-traded futures, there is less counterparty credit risk to the Funds since the exchange or clearinghouse, as counterparty to such instruments, guarantees against a possible default. The clearinghouse stands between the buyer and the seller of the contract; therefore, credit risk is limited to failure of the clearinghouse. While offset rights may exist under applicable law, a Fund does not have a contractual right of offset against a clearing broker or clearinghouse in the event of a default (including the bankruptcy or insolvency). Additionally, credit risk exists in exchange-traded futures with respect to initial and variation margin that is held in a clearing broker’s customer accounts. While clearing brokers are required to segregate customer margin from their own assets, in the event that a clearing broker becomes insolvent or goes into bankruptcy and at that time there is a shortfall in the aggregate amount of margin held by the clearing broker for all its clients, typically the shortfall would be allocated on a pro rata basis across all the clearing broker’s customers, potentially resulting in losses to the Funds.
Concentration Risk: A diversified portfolio, where this is appropriate and consistent with a fund’s objectives, minimizes the risk that a price change of a particular investment will have a material impact on the NAV of a fund. The investment concentrations within each Fund’s portfolio are disclosed in its Schedule of Investments.
Certain Funds invest a significant portion of their assets in securities within a single or limited number of market sectors. When a Fund concentrates its investments in this manner, it assumes the risk that economic, regulatory, political and social conditions affecting such sectors may have a significant impact on the Fund and could affect the income from, or the value or liquidity of, the Fund’s portfolio. Investment percentages in specific sectors are presented in the Schedules of Investments.
Certain Funds invest a significant portion of their assets in high yield securities. High yield securities that are rated below investment-grade (commonly referred to as “junk bonds”) or are unrated may be deemed speculative, involve greater levels of risk than higher-rated securities of similar maturity and are more likely to default. High yield securities may be issued by less creditworthy issuers, and issuers of high yield securities may be unable to meet their interest or principal payment obligations. High yield securities are subject to extreme price fluctuations, may be less liquid than higher rated fixed-income securities, even under normal economic conditions, and frequently have redemption features.
Certain Funds invest a significant portion of their assets in fixed-income securities and/or use derivatives tied to the fixed-income markets. Changes in market interest rates or economic conditions may affect the value and/or liquidity of such investments. Interest rate risk is the risk that prices of bonds and other fixed-income securities will increase as interest rates fall and decrease as interest rates rise. The Funds may be subject to a greater risk of rising interest rates due to the current period of historically low rates.
LIBOR Transition Risk: The United Kingdom’s Financial Conduct Authority announced a phase out of the London Interbank Offered Rate (“LIBOR”). Although many LIBOR rates will be phased out by the end of 2021, a selection of widely used USD LIBOR rates will continue to be published through June 2023 in order to assist with the transition. The Funds may be exposed to financial instruments tied to LIBOR to determine payment obligations, financing terms, hedging strategies or investment value. The transition process away from LIBOR might lead to increased volatility and illiquidity in markets for, and reduce the effectiveness of new hedges placed against, instruments whose terms currently include LIBOR. The ultimate effect of the LIBOR transition process on the Funds is uncertain.
| 10. | CAPITAL SHARE TRANSACTIONS |
Each Fund is authorized to issue 200 million shares, all of which were initially classified as Common Shares. The par value for each Fund’s Common Shares is $0.10. The par value for each of MUI’s, MHD’s and MVT’s Preferred Shares outstanding is $0.10. Each Board is authorized, however, to reclassify any unissued Common Shares to Preferred Shares without the approval of Common Shareholders.
| | |
NOTES TO FINANCIAL STATEMENTS | | 77 |
Notes to Financial Statements (unaudited) (continued)
Common Shares
For the periods shown, shares issued and outstanding increased by the following amounts as a result of dividend reinvestment:
| | | | | | | | |
| |
| | |
| Fund Name | | Six Months Ended 10/31/21 | | | Year Ended 04/30/21 | |
| |
| | |
MUA | | | 35,186 | | | | 62,648 | |
MVT | | | 24,086 | | | | — | |
| |
For the six months ended October 31, 2021 and the year ended April 30, 2021, shares issued and outstanding remained constant for MUI.
For the year ended April 30, 2021, Common Shares issued and outstanding increased by 39,147,091 as a result of the reorganization of BAF, BBK, MUH and MUS into MHD.
For the year ended April 30, 2021, Common Shares issued and outstanding decreased by 25 as a result of a redemption of fractional shares from the reorganization of BAF, BBK, MUH and MUS into MHD.
The Funds participate in an open market share repurchase program (the “Repurchase Program”). From December 1, 2020 through November 30, 2021, each Fund may repurchase up to 5% of its outstanding common shares under the Repurchase Program, based on common shares outstanding as of the close of business on November 30, 2020, subject to certain conditions. There is no assurance that the Funds will purchase shares in any particular amounts. For the six months ended October 31, 2021, the Funds did not repurchase any shares.
MUA has filed a prospectus with the SEC allowing it to issue an additional 5,500,000 Common Shares through an equity shelf program (a “Shelf Offering”). Under the Shelf Offering, MUA, subject to market conditions, may raise additional equity capital from time to time in varying amounts and utilizing various offering methods at a net price at or above the Fund’s NAV per Common Share (calculated within 48 hours of pricing). As of period end, 5,233,338 Common Shares remain available for issuance under the Shelf Offering. During the period ended, MUA issued 709,432 shares under the Shelf Offering. See Additional Information - Shelf Offering Program for additional information.
Initial costs incurred by MUA in connection with its shelf offering are recorded as “Deferred offering costs” in the Statements of Assets and Liabilities. As shares are sold, a portion of the costs attributable to the shares sold will be charged against paid-in-capital. Any remaining deferred charges at the end of the shelf offering period will be charged to expense.
Preferred Shares
A Fund’s Preferred Shares rank prior to its Common Shares as to the payment of dividends by the Fund and distribution of assets upon dissolution or liquidation of the Fund. The 1940 Act prohibits the declaration of any dividend on Common Shares or the repurchase of Common Shares if the Fund fails to maintain asset coverage of at least 200% of the liquidation preference of the Fund’s outstanding Preferred Shares. In addition, pursuant to the Preferred Shares’ governing instruments, a Fund is restricted from declaring and paying dividends on classes of shares ranking junior to or on parity with its Preferred Shares or repurchasing such shares if the Fund fails to declare and pay dividends on the Preferred Shares, redeem any Preferred Shares required to be redeemed under the Preferred Shares’ governing instruments or comply with the basic maintenance amount requirement of the ratings agencies rating the Preferred Shares.
Holders of Preferred Shares have voting rights equal to the voting rights of holders of Common Shares (one vote per share) and vote together with holders of Common Shares (one vote per share) as a single class on certain matters. Holders of Preferred Shares, voting as a separate class, are also entitled to (i) elect two members of the Board, (ii) elect the full Board if dividends on the Preferred Shares are not paid for a period of two years and (iii) a separate class vote to amend the Preferred Share governing documents. In addition, the 1940 Act requires the approval of the holders of a majority of any outstanding Preferred Shares, voting as a separate class, to (a) adopt any plan of reorganization that would adversely affect the Preferred Shares, (b) change a Fund’s sub-classification as a closed-end investment company or change its fundamental investment restrictions or (c) change its business so as to cease to be an investment company.
VMTP Shares
MUI, MHD and MVT (for purposes of this section, each a “VMTP Fund”), have issued Series W-7 VMTP Shares, $100,000 liquidation preference per share, in one or more privately negotiated offerings to qualified institutional buyers as defined pursuant to Rule 144A under the Securities Act of 1933, as amended (the “Securities Act”). The VMTP Shares are subject to certain restrictions on transfer, and a VMTP Fund may also be required to register its VMTP Shares for sale under the Securities Act under certain circumstances. As of period end, the VMTP Shares outstanding and assigned long-term ratings were as follows:
| | | | | | | | | | | | | | | | | | | | | | | | |
| |
| | | | | | |
| Fund Name | | Issue Date | | | Shares Issued | | | Aggregate Principal | | | Term Redemption Date | | | Moody’s Rating | | | Fitch Rating | |
| |
| | | | | | |
MUI | | | 12/07/12 | | | | 2,871 | | | $ | 287,100,000 | | | | 07/02/23 | | | | Aa1 | | | | AA | |
MHD | | | 12/16/11 | | | | 837 | | | | 83,700,000 | | | | 07/02/23 | | | | Aa1 | | | | AA | |
| | | 03/08/21 | | | | 2,641 | | | | 264,100,000 | | | | 07/02/23 | | | | Aa1 | | | | AA | |
MVT | | | 12/16/11 | | | | 1,400 | | | | 140,000,000 | | | | 07/02/23 | | | | Aa1 | | | | AA | |
| |
Redemption Terms: Each VMTP Fund is required to redeem its VMTP Shares on the term redemption date, unless earlier redeemed or repurchased or unless extended. There is no assurance that a term will be extended further or that any VMTP Shares will be replaced with any other preferred shares or other form of leverage upon the redemption or repurchase of the VMTP Shares. Six months prior to the term redemption date, a VMTP Fund is required to begin to segregate liquid assets with its custodian to fund the redemption. In addition, a VMTP Fund is required to redeem certain of its outstanding VMTP Shares if it fails to comply with certain asset coverage, basic maintenance amount or leverage requirements.
| | |
| 78 | | 2 0 2 1 BLACK ROCK SEMI - ANNUAL REPORT TO SHAREHOLDERS |
Notes to Financial Statements (unaudited) (continued)
Subject to certain conditions, VMTP Shares may be redeemed, in whole or in part, at any time at the option of the VMTP Fund. With respect to MUI, MHD and MVT, the redemption price per VMTP Share is equal to the liquidation preference per share plus any outstanding unpaid dividends and applicable redemption premium. If MUI, MHD and MVT redeems the VMTP Shares prior to the term redemption date and the VMTP Shares have long-term ratings above A1/A+ or its equivalent by the ratings agencies then rating the VMTP Shares, then such redemption may be subject to a prescribed redemption premium (up to 2% of the liquidation preference) payable to the holder of the VMTP Shares based on the time remaining until the term redemption date, subject to certain exceptions for redemptions that are required to comply with minimum asset coverage requirements.
Dividends: Dividends on the VMTP Shares are declared daily and payable monthly at a variable rate set weekly at a fixed rate spread to the Securities Industry and Financial Markets Association (“SIFMA”) Municipal Swap Index or to a percentage of the one-month LIBOR rate, as set forth in the VMTP Shares governing instrument. The fixed spread is determined based on the long-term preferred share rating assigned to the VMTP Shares by the ratings agencies then rating the VMTP Shares.
The dividend rate on VMTP Shares is subject to a step-up spread if the VMTP Fund fails to comply with certain provisions, including, among other things, the timely payment of dividends, redemptions or gross-up payments, and complying with certain asset coverage and leverage requirements.
For the six months ended October 31, 2021, the average annualized dividend rates for the VMTP Shares were as follows:
| | | | | | | | | | | | | | | | |
| |
| | | | |
| | | | | | MUI | | | MHD | | | MVT | |
| |
| | | | |
Dividend rates | | | | | | | 1.03 | % | | | 1.03 | % | | | 1.03% | |
| |
For the six months ended October 31, 2021, VMTP Shares issued and outstanding of each VMTP Fund remained constant.
For the year ended April 30, 2021, VMTP Shares issued and outstanding for MHD increased by 2,641 due to the reorganizations of BAF, BBK, MUH and MUS with and into MHD.
Offering Costs: The Funds incurred costs in connection with the issuance of VMTP Shares, which were recorded as a direct deduction from the carrying value of the related debt liability and will be amortized over the life of the VMTP Shares. Amortization of these costs is included in interest expense, fees and amortization of offering costs in the Statements of Operations.
Financial Reporting: The VMTP Shares are considered debt of the issuer; therefore, the liquidation preference, which approximates fair value of the VMTP Shares, is recorded as a liability in the Statements of Assets and Liabilities net of deferred offering costs. Unpaid dividends are included in interest expense and fees payable in the Statements of Assets and Liabilities, and the dividends accrued and paid on the VMTP Shares are included as a component of interest expense, fees and amortization of offering costs in the Statements of Operations. The VMTP Shares are treated as equity for tax purposes. Dividends paid to holders of the VMTP Shares are generally classified as tax-exempt income for tax-reporting purposes. Dividends and amortization of deferred offering costs on VMTP Shares are included in interest expense, fees and amortization of offering costs in the Statements of Operations:
| | | | | | | | |
| |
| | |
| Fund Name | | Dividends Accrued | | | Deferred Offering Costs Amortization | |
| |
| | |
MUI | | $ | 1,472,819 | | | $ | — | |
MHD | | | 1,784,210 | | | | — | |
MVT | | | 718,198 | | | | — | |
| |
| | |
NOTES TO FINANCIAL STATEMENTS | | 79 |
Notes to Financial Statements (unaudited) (continued)
Management’s evaluation of the impact of all subsequent events on the Funds’ financial statements was completed through the date the financial statements were issued and the following items were noted:
The Funds declared and paid or will pay distributions to Common Shareholders as follows:
| | | | | | | | | | | | | | | | | | | | |
| | | | | | |
| Fund Name | | Declaration Date | | | Record Date | | | Payable/ Paid Date | | | | | | Dividend Per Common Share | |
| | | | | |
MUA | | | | | | | | | | | | | | | | | | | | |
| | | 11/01/21 | | | | 11/15/21 | | | | 12/01/21 | | | | | | | $ | 0.049000 | |
| | | 12/06/21 | | | | 12/17/21 | | | | 12/31/21 | | | | | | | | 0.045500 | |
| | | 12/06/21 | | | | 12/17/21 | | | | 12/31/21 | | | | | | | | 0.003940 | (a) |
| | | 12/06/21 | | | | 12/17/21 | | | | 12/31/21 | | | | | | | | 0.025430 | (b) |
| | | 12/06/21 | | | | 12/17/21 | | | | 12/31/21 | | | | | | | | 0.117520 | (c) |
| | | | | |
MUI | | | | | | | | | | | | | | | | | | | | |
| | | | | |
| | | 11/01/21 | | | | 11/15/21 | | | | 12/01/21 | | | | | | | | 0.054000 | |
| | | 12/06/21 | | | | 12/17/21 | | | | 12/31/21 | | | | | | | | 0.054000 | |
| | | | | |
MHD | | | | | | | | | | | | | | | | | | | | |
| | | | | |
| | | 11/01/21 | | | | 11/15/21 | | | | 12/01/21 | | | | | | | | 0.060500 | |
| | | 12/06/21 | | | | 12/17/21 | | | | 12/31/21 | | | | | | | | 0.060500 | |
| | | 12/06/21 | | | | 12/17/21 | | | | 12/31/21 | | | | | | | | 0.000490 | (a) |
| | | 12/06/21 | | | | 12/17/21 | | | | 12/31/21 | | | | | | | | 0.000820 | (c) |
| | | | | |
MVT | | | | | | | | | | | | | | | | | | | | |
| | | | | |
| | | 11/01/21 | | | | 11/15/21 | | | | 12/01/21 | | | | | | | | 0.058500 | |
| | | | 12/06/21 | | | | 12/17/21 | | | | 12/31/21 | | | | | | | | 0.058500 | |
| | (a) | Net investment income special dividend. | |
| | (b) | Special short-term capital gain distribution. | |
| | (c) | Special long-term capital gain distribution. | |
The Funds declared and paid or will pay distributions to Preferred Shareholders as follows:
| | | | | | | | | | | | |
| |
| |
| | | Preferred Shares(a) | |
| | | | |
| | | |
| Fund Name | | Shares | | | Series | | | Declared | |
| |
| | | |
MUI | | | VMTP | | | | W-7 | | | $ | 239,666 | |
MHD | | | VMTP | | | | W-7 | | | | 292,984 | |
MVT | | | VMTP | | | | W-7 | | | | 116,870 | |
| |
| | (a) | Dividends declared for period November 1, 2021 to November 30, 2021. | |
On December 15, 2021, MUA issued 1,750 Series W-7 Variable Rate Demand Preferred Shares with a $100,000 liquidation preference per share and a maturity date of January 1, 2052, in a privately negotiated offering exempt from registration under the Securities Act.
| | |
| 80 | | 2 0 2 1 BLACK ROCK SEMI - ANNUAL REPORT TO SHAREHOLDERS |
Disclosure of Investment Advisory Agreements
The Boards of Directors (collectively, the “Board,” the members of which are referred to as “Board Members”) of BlackRock MuniAssets Fund, Inc. (“MUA”), BlackRock MuniHoldings Fund, Inc. (“MHD”), BlackRock Municipal Income Fund, Inc. (“MUI”) and BlackRock MuniVest Fund II, Inc. (“MVT,” and together with MUA, MHD and MUI, the “Funds” and each, a “Fund”) met on May 4, 2021 (the “May Meeting”) and June 8-9, 2021 (the “June Meeting”) to consider the approval to continue the investment advisory agreements (the “Advisory Agreements” or the “Agreements”) between each Fund and BlackRock Advisors, LLC (the “Manager” or “BlackRock”), each Fund’s investment advisor.
The Approval Process
Consistent with the requirements of the Investment Company Act of 1940 (the “1940 Act”), the Board considers the approval of the continuation of the Agreements for each Fund on an annual basis. The Board members whom are not “interested persons” of each Fund, as defined in the 1940 Act, are considered independent Board members (the “Independent Board Members”). The Board’s consideration entailed a year-long deliberative process during which the Board and its committees assessed BlackRock’s various services to each Fund, including through the review of written materials and oral presentations, and the review of additional information provided in response to requests from the Independent Board Members. The Board had four quarterly meetings per year, each typically extending for two days, as well as additional ad hoc meetings and executive sessions throughout the year, as needed. The committees of the Board similarly met throughout the year. The Board also had a fifth one-day meeting to consider specific information surrounding the renewal of the Agreements. In particular, the Board assessed, among other things, the nature, extent and quality of the services provided to each Fund by BlackRock, BlackRock’s personnel and affiliates, including (as applicable): investment management services; accounting oversight; administrative and shareholder services; oversight of each Fund’s service providers; risk management and oversight; and legal, regulatory and compliance services. Throughout the year, including during the contract renewal process, the Independent Board Members were advised by independent legal counsel, and met with independent legal counsel in various executive sessions outside of the presence of BlackRock’s management.
During the year, the Board, acting directly and through its committees, considered information that was relevant to its annual consideration of the renewal of the Agreements, including the services and support provided by BlackRock to each Fund and its shareholders. BlackRock also furnished additional information to the Board in response to specific questions from the Board. Among the matters the Board considered were: (a) investment performance for one-year, three-year, five-year, and/or since inception periods, as applicable, against peer funds, relevant benchmarks, and other performance metrics, as applicable, as well as BlackRock senior management’s and portfolio managers’ analyses of the reasons for any outperformance or underperformance relative to its peers, benchmarks, and other performance metrics, as applicable; (b) leverage management, as applicable; (c) fees, including advisory, administration, if applicable, and other amounts paid to BlackRock and its affiliates by each Fund for services; (d) Fund operating expenses and how BlackRock allocates expenses to each Fund; (e) the resources devoted to risk oversight of, and compliance reports relating to, implementation of each Fund’s investment objective, policies and restrictions, and meeting regulatory requirements; (f) BlackRock’s and each Fund’s adherence to applicable compliance policies and procedures; (g) the nature, character and scope of non-investment management services provided by BlackRock and its affiliates and the estimated cost of such services, as available; (h) BlackRock’s and other service providers’ internal controls and risk and compliance oversight mechanisms; (i) BlackRock’s implementation of the proxy voting policies approved by the Board; (j) execution quality of portfolio transactions; (k) BlackRock’s implementation of each Fund’s valuation and liquidity procedures; (l) an analysis of management fees paid to BlackRock for products with similar investment mandates across the open-end fund, closed-end fund, sub-advised mutual fund, collective investment trust and institutional separate account product channels, as applicable, and the similarities and differences between these products and the services provided as compared to each Fund; (m) BlackRock’s compensation methodology for its investment professionals and the incentives and accountability it creates, along with investment professionals’ investments in the fund(s) they manage; (n) periodic updates on BlackRock’s business; and (o) each Fund’s market discount/premium compared to peer funds.
Prior to and in preparation for the May Meeting, the Board received and reviewed materials specifically relating to the renewal of the Agreements. The Independent Board Members are continuously engaged in a process with their independent legal counsel and BlackRock to review the nature and scope of the information provided to the Board to better assist its deliberations. The materials provided in connection with the May Meeting included, among other things: (a) information independently compiled and prepared by Broadridge Financial Solutions, Inc. (“Broadridge”), based on Lipper classifications, regarding each Fund’s fees and expenses as compared with a peer group of funds as determined by Broadridge (“Expense Peers”) and the investment performance of each Fund as compared with a peer group of funds (“Performance Peers”); (b) information on the composition of the Expense Peers and Performance Peers and a description of Broadridge’s methodology; (c) information on the estimated profits realized by BlackRock and its affiliates pursuant to the Agreements and a discussion of fall-out benefits to BlackRock and its affiliates; (d) a general analysis provided by BlackRock concerning investment management fees received in connection with other types of investment products, such as institutional accounts, sub-advised mutual funds, closed-end funds, and open-end funds, under similar investment mandates, as applicable; (e) a review of non-management fees; (f) the existence, impact and sharing of potential economies of scale, if any, with each Fund; (g) a summary of aggregate amounts paid by each Fund to BlackRock; and (h) various additional information requested by the Board as appropriate regarding BlackRock’s and each Fund’s operations.
At the May Meeting, the Board reviewed materials relating to its consideration of the Agreements. As a result of the discussions that occurred during the May Meeting, and as a culmination of the Board’s year-long deliberative process, the Board presented BlackRock with questions and requests for additional information. BlackRock responded to these questions and requests with additional written information in advance of the June Meeting.
At the June Meeting, the Board concluded its assessment of, among other things: (a) the nature, extent and quality of the services provided by BlackRock; (b) the investment performance of each Fund as compared to its Performance Peers and to other metrics, as applicable; (c) the advisory fee and the estimated cost of the services and estimated profits realized by BlackRock and its affiliates from their relationship with each Fund; (d) each Fund’s fees and expenses compared to its Expense Peers; (e) the existence and sharing of potential economies of scale; (f) any fall-out benefits to BlackRock and its affiliates as a result of BlackRock’s relationship with each Fund; and (g) other factors deemed relevant by the Board Members.
The Board also considered other matters it deemed important to the approval process, such as other payments made to BlackRock or its affiliates relating to securities lending and cash management, and BlackRock’s services related to the valuation and pricing of Fund portfolio holdings. The Board noted the willingness of BlackRock’s personnel to engage in open, candid discussions with the Board. The Board Members did not identify any particular information, or any single factor as determinative, and each Board Member may have attributed different weights to the various items and factors considered.
| | | | |
DISCLOSURE OF INVESTMENT ADVISORY AGREEMENTS | | | 81 | |
Disclosure of Investment Advisory Agreements (continued)
A. Nature, Extent and Quality of the Services Provided by BlackRock
The Board, including the Independent Board Members, reviewed the nature, extent and quality of services provided by BlackRock, including the investment advisory services, and the resulting performance of each Fund. Throughout the year, the Board compared Fund performance to the performance of a comparable group of closed-end funds, relevant benchmarks, and performance metrics, as applicable. The Board met with BlackRock’s senior management personnel responsible for investment activities, including the senior investment officers. The Board also reviewed the materials provided by each Fund’s portfolio management team discussing each Fund’s performance, investment strategies and outlook.
The Board considered, among other factors, with respect to BlackRock: the number, education and experience of investment personnel generally and each Fund’s portfolio management team; research capabilities; investments by portfolio managers in the funds they manage; portfolio trading capabilities; use of technology; commitment to compliance; credit analysis capabilities; risk analysis and oversight capabilities; and the approach to training and retaining portfolio managers and other research, advisory and management personnel. The Board also considered BlackRock’s overall risk management program, including the continued efforts of BlackRock and its affiliates to address cybersecurity risks and the role of BlackRock’s Risk & Quantitative Analysis Group. The Board engaged in a review of BlackRock’s compensation structure with respect to each Fund’s portfolio management team and BlackRock’s ability to attract and retain high-quality talent and create performance incentives.
In addition to investment advisory services, the Board considered the nature and quality of the administrative and other non-investment advisory services provided to each Fund. BlackRock and its affiliates provide each Fund with certain administrative, shareholder and other services (in addition to any such services provided to each Fund by third parties) and officers and other personnel as are necessary for the operations of each Fund. In particular, BlackRock and its affiliates provide each Fund with administrative services including, among others: (i) responsibility for disclosure documents, such as the prospectus and the statement of additional information in connection with the initial public offering, registration statements in connection with MUA’s equity shelf program and periodic shareholder reports; (ii) preparing communications with analysts to support secondary market trading of each Fund; (iii) oversight of daily accounting and pricing; (iv) responsibility for periodic filings with regulators and stock exchanges; (v) overseeing and coordinating the activities of third-party service providers including, among others, each Fund’s custodian, fund accountant, transfer agent, and auditor; (vi) organizing Board meetings and preparing the materials for such Board meetings; (vii) providing legal and compliance support; (viii) furnishing analytical and other support to assist the Board in its consideration of strategic issues such as the merger, consolidation or repurposing of certain closed-end funds; and (ix) performing or managing administrative functions necessary for the operation of each Fund, such as tax reporting, expense management, fulfilling regulatory filing requirements, and shareholder call center and other services. The Board reviewed the structure and duties of BlackRock’s fund administration, shareholder services, and legal and compliance departments and considered BlackRock’s policies and procedures for assuring compliance with applicable laws and regulations. The Board considered the operation of BlackRock’s business continuity plans, including in light of the ongoing COVID-19 pandemic.
B. The Investment Performance of each Fund and BlackRock
The Board, including the Independent Board Members, reviewed and considered the performance history of each Fund throughout the year and at the May Meeting. In preparation for the May Meeting, the Board was provided with reports independently prepared by Broadridge, which included an analysis of each Fund’s performance as of December 31, 2020, as compared to its Performance Peers. The performance information is based on net asset value (NAV), and utilizes Lipper data. Lipper’s methodology calculates a fund’s total return assuming distributions are reinvested on the ex-date at a fund’s ex-date NAV. Broadridge ranks funds in quartiles, ranging from first to fourth, where first is the most desirable quartile position and fourth is the least desirable. In connection with its review, the Board received and reviewed information regarding the investment performance of each Fund as compared to its Performance Peers and a custom peer group of funds as defined by BlackRock (“Customized Peer Group”) and a composite measuring a blend of total return and yield (“Composite”). The Board and its Performance Oversight Committee regularly review and meet with Fund management to discuss the performance of each Fund throughout the year.
In evaluating performance, the Board focused particular attention on funds with less favorable performance records. The Board also noted that while it found the data provided by Broadridge generally useful, it recognized the limitations of such data, including in particular, that notable differences may exist between a fund and its Performance Peers (for example, the investment objectives and strategies). Further, the Board recognized that the performance data reflects a snapshot of a period as of a particular date and that selecting a different performance period could produce significantly different results. The Board also acknowledged that long-term performance could be impacted by even one period of significant outperformance or underperformance, and that a single investment theme could have the ability to disproportionately affect long-term performance.
The Board noted that for each of the one-, three- and five-year periods reported, MUA ranked in the second quartile against its Customized Peer Group Composite. The Board noted that BlackRock believes that the Customized Peer Group Composite is an appropriate performance metric for MUA, and that BlackRock has explained its rationale for this belief to the Board.
The Board noted that for the one-, three- and five-year periods reported, MHD ranked in the first, first and second quartiles, respectively, against its Customized Peer Group Composite. The Board noted that BlackRock believes that the Customized Peer Group Composite is an appropriate performance metric for MHD, and that BlackRock has explained its rationale for this belief to the Board.
The Board noted that for each of the one-, three- and five-year periods reported, MUI ranked in the second quartile against its Customized Peer Group Composite. The Board noted that BlackRock believes that the Customized Peer Group Composite is an appropriate performance metric for MUI, and that BlackRock has explained its rationale for this belief to the Board.
The Board noted that for each of the one-, three- and five-year periods reported, MVT ranked in the first quartile against its Customized Peer Group Composite. The Board noted that BlackRock believes that the Customized Peer Group Composite is an appropriate performance metric for MVT, and that BlackRock has explained its rationale for this belief to the Board.
| | |
| 82 | | 2 0 2 1 BLACK ROCK SEMI - ANNUAL REPORT TO SHAREHOLDERS |
Disclosure of Investment Advisory Agreements (continued)
C. Consideration of the Advisory/Management Fees and the Estimated Cost of the Services and Estimated Profits Realized by BlackRock and its Affiliates from their Relationship with each Fund
The Board, including the Independent Board Members, reviewed each Fund’s contractual management fee rate compared with those of its Expense Peers. The contractual management fee rate represents a combination of the advisory fee and any administrative fees, before taking into account any reimbursements or fee waivers. The Board also compared each Fund’s total expense ratio, as well as its actual management fee rate as a percentage of managed assets, which is the total assets of each Fund (including any assets attributable to money borrowed for investment purposes) minus the sum of each Fund’s accrued liabilities (other than money borrowed for investment purposes) to those of its Expense Peers. The total expense ratio represents a fund’s total net operating expenses, excluding any investment related expenses. The total expense ratio gives effect to any expense reimbursements or fee waivers, and the actual management fee rate gives effect to any management fee reimbursements or waivers. The Board considered the services provided and the fees charged by BlackRock and its affiliates to other types of clients with similar investment mandates, as applicable, including institutional accounts and sub-advised mutual funds (including mutual funds sponsored by third parties).
The Board received and reviewed statements relating to BlackRock’s financial condition. The Board reviewed BlackRock’s profitability methodology and was also provided with an estimated profitability analysis that detailed the revenues earned and the expenses incurred by BlackRock for services provided to each Fund. The Board reviewed BlackRock’s estimated profitability with respect to each Fund and other funds the Board currently oversees for the year ended December 31, 2020 compared to available aggregate estimated profitability data provided for the prior two years. The Board reviewed BlackRock’s estimated profitability with respect to certain other U.S. fund complexes managed by the Manager and/or its affiliates. The Board reviewed BlackRock’s assumptions and methodology of allocating expenses in the estimated profitability analysis, noting the inherent limitations in allocating costs among various advisory products. The Board recognized that profitability may be affected by numerous factors including, among other things, fee waivers and expense reimbursements by the Manager, the types of funds managed, precision of expense allocations and business mix. The Board thus recognized that calculating and comparing profitability at the individual fund level is difficult.
The Board noted that, in general, individual fund or product line profitability of other advisors is not publicly available. The Board reviewed BlackRock’s overall operating margin, in general, compared to that of certain other publicly traded asset management firms. The Board considered the differences between BlackRock and these other firms, including the contribution of technology at BlackRock, BlackRock’s expense management, and the relative product mix.
The Board considered whether BlackRock has the financial resources necessary to attract and retain high quality investment management personnel to perform its obligations under the Agreements and to continue to provide the high quality of services that is expected by the Board. The Board further considered factors including but not limited to BlackRock’s commitment of time, assumption of risk, and liability profile in servicing each Fund, including in contrast to what is required of BlackRock with respect to other products with similar investment mandates across the open-end fund, closed-end fund, sub-advised mutual fund, collective investment trust, and institutional separate account product channels, as applicable.
The Board noted that MUA’s contractual management fee rate ranked in the first quartile, and that the actual management fee rate and total expense ratio ranked in the second and first quartiles, respectively, relative to the Expense Peers.
The Board noted that MHD’s contractual management fee rate ranked in the first quartile, and that the actual management fee rate and total expense ratio ranked in the second and third quartiles, respectively, relative to the Expense Peers.
The Board noted that MUI’s contractual management fee rate ranked in the first quartile, and that the actual management fee rate and total expense ratio ranked in the second and third quartiles, respectively, relative to the Expense Peers.
The Board noted that MVT’s contractual management fee rate ranked in the first quartile, and that the actual management fee rate and total expense ratio ranked in the first and second quartiles, respectively, relative to the Expense Peers.
D. Economies of Scale
The Board, including the Independent Board Members, considered the extent to which economies of scale might be realized as the assets of each Fund increase. The Board also considered the extent to which each Fund benefits from such economies of scale in a variety of ways, and whether there should be changes in the advisory fee rate or breakpoint structure in order to enable each Fund to more fully participate in these economies of scale. The Board considered each Fund’s asset levels and whether the current fee was appropriate.
Based on the Board’s review and consideration of the issue, the Board concluded that most closed-end funds do not have fund level breakpoints because closed-end funds generally do not experience substantial growth after the initial public offering. Closed-end funds are typically priced at scale at a fund’s inception. The Board noted that although MUA may from time-to-time make additional share offerings pursuant to its equity shelf program, the growth of MUA’s assets will occur primarily through the appreciation of its investment portfolio.
E. Other Factors Deemed Relevant by the Board Members
The Board, including the Independent Board Members, also took into account other ancillary or “fall-out” benefits that BlackRock or its affiliates may derive from BlackRock’s respective relationships with each Fund, both tangible and intangible, such as BlackRock’s ability to leverage its investment professionals who manage other portfolios and its risk management personnel, an increase in BlackRock’s profile in the investment advisory community, and the engagement of BlackRock’s affiliates as service providers to each Fund, including for administrative, securities lending and cash management services. The Board also considered BlackRock’s overall operations and its efforts to expand the scale of, and improve the quality of, its operations. The Board also noted that, subject to applicable law, BlackRock may use and benefit from third-party research obtained by soft dollars generated by certain registered fund transactions to assist in managing all or a number of its other client accounts.
In connection with its consideration of the Agreements, the Board also received information regarding BlackRock’s brokerage and soft dollar practices. The Board received reports from BlackRock which included information on brokerage commissions and trade execution practices throughout the year.
| | | | |
DISCLOSURE OF INVESTMENT ADVISORY AGREEMENTS | | | 83 | |
Disclosure of Investment Advisory Agreements (continued)
The Board noted the competitive nature of the closed-end fund marketplace, and that shareholders are able to sell their Fund shares in the secondary market if they believe that each Fund’s fees and expenses are too high or if they are dissatisfied with the performance of each Fund.
The Board also considered the various notable initiatives and projects BlackRock performed in connection with its closed-end fund product line. These initiatives included developing equity shelf programs; efforts to eliminate product overlap with fund mergers; ongoing services to manage leverage that has become increasingly complex; periodic evaluation of share repurchases and other support initiatives for certain BlackRock funds; and continued communication efforts with shareholders, fund analysts and financial advisers. With respect to the latter, the Independent Board Members noted BlackRock’s continued commitment to supporting the secondary market for the common shares of its closed-end funds through a comprehensive secondary market communication program designed to raise investor and analyst awareness and understanding of closed-end funds. BlackRock’s support services included, among other things: sponsoring and participating in conferences; communicating with closed-end fund analysts covering the BlackRock funds throughout the year; providing marketing and product updates for the closed-end funds; and maintaining and enhancing its closed-end fund website.
Conclusion
The Board, including the Independent Board Members, unanimously approved the continuation of the Advisory Agreements between the Manager and each Fund for a one-year term ending June 30, 2022. Based upon its evaluation of all of the aforementioned factors in their totality, as well as other information, the Board, including the Independent Board Members, was satisfied that the terms of the Agreements were fair and reasonable and in the best interest of each Fund and its shareholders. In arriving at its decision to approve the Agreements, the Board did not identify any single factor or group of factors as all-important or controlling, but considered all factors together, and different Board Members may have attributed different weights to the various factors considered. The Independent Board Members were also assisted by the advice of independent legal counsel in making this determination.
| | |
| 84 | | 2 0 2 1 BLACK ROCK SEMI - ANNUAL REPORT TO SHAREHOLDERS |
Additional Information
Proxy Results
The Annual Meeting of Shareholders was held on July 29, 2021 for shareholders of record on June 1, 2021, to elect director nominees for each Fund. There were no broker non-votes with regard to any of the Funds.
Shareholders elected the Class II Directors as follows:
| | | | | | | | | | | | | | | | | | | | | | | | | | | | | | | | |
|
| |
| | | J. Phillip Holloman | | | Catherine A. Lynch | | | Karen P. Robards | | | Frank J. Fabozzi | |
| | | | | | | | | | | | | | | | | | | | | | | | | |
| | | | | | | | |
| Fund Name | | Votes For | | | Votes Withheld | | | Votes For | | | Votes Withheld | | | Votes For | | | Votes Withheld | | | Votes For | | | Votes Withheld | |
| |
| | | | | | | | |
MUA | | | 32,374,353 | | | | 1,478,230 | | | | 32,585,275 | | | | 1,267,308 | | | | 27,490,754 | | | | 6,361,829 | | | | 32,365,440 | | | | 1,487,143 | |
| |
For the Fund listed above, Directors whose term of office continued after the Annual Meeting of Shareholders because they were not up for election are Michael J. Castellano, Richard E. Cavanagh, Cynthia L. Egan, Robert Fairbairn, Stayce Harris, R. Glenn Hubbard, John M. Perlowski and W. Carl Kester. Lorenzo A. Flores was appointed as a Director effective July 30, 2021.
Shareholders elected the Directors as follows:
| | | | | | | | | | | | | | | | | | | | | | | | | | | | | | | | |
| |
| | | Michael J. Castellano | | | Richard E. Cavanagh | | | Cynthia L. Egan | | | Robert Fairbairn | |
| | | | | | | | | | | | | | | | | | | | | | | | | |
| | | | | | | | |
| Fund Name | | Votes For | | | Votes Withheld | | | Votes For | | | Votes Withheld | | | Votes For | | | Votes Withheld | | | Votes For | | | Votes Withheld | |
| |
| | | | | | | | |
MHD | | | 42,836,321 | | | | 1,970,316 | | | | 42,864,903 | | | | 1,941,734 | | | | 42,801,496 | | | | 2,005,141 | | | | 43,364,091 | | | | 1,442,546 | |
MUI | | | 16,149,623 | | | | 17,837,712 | | | | 16,146,390 | | | | 17,840,945 | | | | 16,626,029 | | | | 17,361,306 | | | | 33,549,523 | | | | 437,812 | |
MVT | | | 13,481,015 | | | | 4,640,488 | | | | 13,480,339 | | | | 4,641,164 | | | | 13,540,693 | | | | 4,580,810 | | | | 17,646,074 | | | | 475,429 | |
| |
| | | | | | | | | | | | | | | | | | | | | | | | | | | | | | | | |
| |
| | | Stayce Harris | | | J. Phillip Holloman | | | R. Glenn Hubbard | | | Catherine A. Lynch | |
| | | | | | | | | | | | | | | | | | | | | | | | | |
| | | | | | | | |
| Fund Name | | Votes For | | | Votes Withheld | | | Votes For | | | Votes Withheld | | | Votes For | | | Votes Withheld | | | Votes For | | | Votes Withheld | |
| |
| | | | | | | | |
MHD | | | 42,741,690 | | | | 2,064,947 | | | | 43,252,540 | | | | 1,554,097 | | | | 43,171,284 | | | | 1,635,353 | | | | 42,782,707 | | | | 2,023,930 | |
MUI | | | 33,356,922 | | | | 630,413 | | | | 33,538,722 | | | | 448,613 | | | | 16,313,226 | | | | 17,674,109 | | | | 27,158,367 | | | | 6,828,968 | |
MVT | | | 17,703,975 | | | | 417,528 | | | | 17,639,695 | | | | 481,808 | | | | 13,483,387 | | | | 4,638,116 | | | | 17,713,626 | | | | 407,877 | |
| |
| |
| |
| | | John M. Perlowski | | | Karen P. Robards | | | Frank J. Fabozzi(a) | | | W. Carl Kester(a) | |
| | | | | | | | | | | | | | | | | | | | | | | | | |
| | | | | | | | |
| Fund Name | | Votes For | | | Votes Withheld | | | Votes For | | | Votes Withheld | | | Votes For | | | Votes Withheld | | | Votes For | | | Votes Withheld | |
| |
| | | | | | | | |
MHD | | | 43,389,120 | | | | 1,417,517 | | | | 42,933,922 | | | | 1,872,715 | | | | 3,478 | | | | 0 | | | | 3,478 | | | | 0 | |
MUI | | | 33,551,264 | | | | 436,071 | | | | 16,804,291 | | | | 17,183,044 | | | | 2,871 | | | | 0 | | | | 2,871 | | | | 0 | |
MVT | | | 17,640,077 | | | | 481,426 | | | | 13,535,218 | | | | 4,586,285 | | | �� | 1,400 | | | | 0 | | | | 1,400 | | | | 0 | |
| |
| (a) | Voted on by holders of Preferred Shares only. |
Fund Certification
The Funds are listed for trading on the NYSE and have filed with the NYSE their annual chief executive officer certification regarding compliance with the NYSE’s listing standards. The Funds filed with the SEC the certification of its chief executive officer and chief financial officer required by Section 302 of the Sarbanes-Oxley Act.
Regulation Regarding Derivatives
On October 28, 2020, the Securities and Exchange Commission (the “SEC”) adopted new regulations governing the use of derivatives by registered investment companies (“Rule 18f-4”). The Funds will be required to implement and comply with Rule 18f-4 by August 19, 2022. Once implemented, Rule 18f-4 will impose limits on the amount of derivatives a fund can enter into, eliminate the asset segregation framework currently used by funds to comply with Section 18 of the 1940 Act, treat derivatives as senior securities and require funds whose use of derivatives is more than a limited specified exposure amount to establish and maintain a comprehensive derivatives risk management program and appoint a derivatives risk manager.
Environmental, Social and Governance (“ESG”) Integration
Although a Fund does not seek to implement a specific ESG, impact or sustainability strategy unless otherwise disclosed, Fund management will consider ESG characteristics as part of the investment process for actively managed Funds. These considerations will vary depending on a Fund’s particular investment strategies and may include consideration of third-party research as well as consideration of proprietary BlackRock research across the ESG risks and opportunities regarding an issuer. Fund management will consider those ESG characteristics it deems relevant or additive when making investment decisions for a Fund. The ESG characteristics utilized in a Fund’s investment process are anticipated to evolve over time and one or more characteristics may not be relevant with respect to all issuers that are eligible for investment. ESG characteristics are not the sole considerations when making investment decisions for a Fund. Further, investors can differ in their views of what constitutes positive or negative ESG characteristics. As a result, a Fund may invest in issuers that do not reflect the beliefs and values with respect to ESG of any particular investor. ESG considerations may affect a Fund’s exposure to certain companies or industries and a Fund may forego certain investment opportunities. While Fund management views ESG considerations as having the potential to contribute to a Fund’s long-term performance, there is no guarantee that such results will be achieved.
| | |
ADDITIONAL INFORMATION | | 85 |
Additional Information (continued)
Dividend Policy
Each Fund’s dividend policy is to distribute all or a portion of its net investment income to its shareholders on a monthly basis. In order to provide shareholders with a more stable level of distributions, the Funds may at times pay out less than the entire amount of net investment income earned in any particular month and may at times in any particular month pay out such accumulated but undistributed income in addition to net investment income earned in that month. As a result, the distributions paid by the Funds for any particular month may be more or less than the amount of net investment income earned by the Funds during such month. The Funds’ current accumulated but undistributed net investment income, if any, is disclosed as accumulated earnings (loss) in the Statements of Assets and Liabilities, which comprises part of the financial information included in this report.
General Information
The Funds (other than MUA) do not make available copies of their Statements of Additional Information because the Funds’ (other than MUA’s) shares are not continuously offered, which means that the Statement of Additional Information of each Fund (other than MUA) has not been updated after completion of the respective Fund’s offerings and the information contained in each Fund’s (other than MUA’s) Statement of Additional Information may have become outdated.
MUA’s Statement of Additional Information includes additional information about its Board and is available, without charge upon request by calling (800)-882-0052.
The following information is a summary of certain changes since April 30, 2021. This information may not reflect all of the changes that have occurred since you purchased the relevant Fund.
Except if noted otherwise herein, there were no changes to the Funds’ charters or by-laws that would delay or prevent a change of control of the Funds that were not approved by the shareholders.
In accordance with Section 23(c) of the Investment Company Act of 1940, each Fund may from time to time purchase shares of its common stock in the open market or in private transactions.
Quarterly performance, semi-annual and annual reports, current net asset value and other information regarding the Funds may be found on BlackRock’s website, which can be accessed at blackrock.com. Any reference to BlackRock’s website in this report is intended to allow investors public access to information regarding the Funds and does not, and is not intended to, incorporate BlackRock’s website in this report.
Electronic Delivery
Shareholders can sign up for e-mail notifications of quarterly statements, annual and semi-annual shareholder reports and, for MUA only, prospectuses, by enrolling in the electronic delivery program. Electronic copies of shareholder reports and, for MUA only, prospectuses, are available on BlackRock’s website.
To enroll in electronic delivery:
Shareholders Who Hold Accounts with Investment Advisers, Banks or Brokerages:
Please contact your financial adviser. Please note that not all investment advisers, banks or brokerages may offer this service.
Householding
The Funds will mail only one copy of shareholder documents, annual and semi-annual reports, Rule 30e-3 notices and proxy statements, to shareholders with multiple accounts at the same address. This practice is commonly called “householding” and is intended to reduce expenses and eliminate duplicate mailings of shareholder documents. Mailings of your shareholder documents may be householded indefinitely unless you instruct us otherwise. If you do not want the mailing of these documents to be combined with those for other members of your household, please call the Funds at (800) 882-0052.
Availability of Quarterly Schedule of Investments
The Funds file their complete schedules of portfolio holdings with the SEC for the first and third quarters of each fiscal year as an exhibit to their reports on Form N-PORT. The Funds’ Forms N-PORT are available on the SEC’s website at sec.gov. Additionally, each Fund makes its portfolio holdings for the first and third quarters of each fiscal year available at blackrock.com/fundreports.
Availability of Proxy Voting Policies, Procedures and Voting Records
A description of the policies and procedures that the Funds use to determine how to vote proxies relating to portfolio securities and information about how the Funds voted proxies relating to securities held in the Funds’ portfolios during the most recent 12-month period ended June 30 is available without charge, upon request (1) by calling (800) 882-0052; (2) on the BlackRock website at blackrock.com; and (3) on the SEC’s website at sec.gov.
| | |
| 86 | | 2 0 2 1 BLACK ROCK SEMI - ANNUAL REPORT TO SHAREHOLDERS |
Additional Information (continued)
Availability of Fund Updates
BlackRock will update performance and certain other data for the Funds on a monthly basis on its website in the “Closed-end Funds” section of blackrock.com as well as certain other material information as necessary from time to time. Investors and others are advised to check the website for updated performance information and the release of other material information about the Funds. This reference to BlackRock’s website is intended to allow investors public access to information regarding the Funds and does not, and is not intended to, incorporate BlackRock’s website in this report.
Shelf Offering Program
From time-to-time, MUA may seek to raise additional equity capital through an equity shelf program (a “Shelf Offering”). In a Shelf Offering, MUA may, subject to market conditions, raise additional equity capital by issuing new Common Shares from time to time in varying amounts at a net price at or above MUA’s net asset value (“NAV”) per Common Share (calculated within 48 hours of pricing). While any such Shelf Offering may allow MUA to pursue additional investment opportunities without the need to sell existing portfolio investments, it could also entail risks – including that the issuance of additional Common Shares may limit the extent to which the Common Shares are able to trade at a premium to NAV in the secondary market.
On August 26, 2021, MUA filed a final prospectus with the SEC in connection with its Shelf Offering. This report and the prospectus of MUA are not offers to sell MUA Common Shares or solicitations of an offer to buy MUA Common Shares in any jurisdiction where such offers or sales are not permitted. The prospectus of MUA contains important information about the Fund, including its investment objective, risks, charges and expenses. Investors are urged to read the prospectus of MUA carefully and in its entirety before investing. Copies of the final prospectus for MUA can be obtained from BlackRock at blackrock.com.
BlackRock Privacy Principles
BlackRock is committed to maintaining the privacy of its current and former fund investors and individual clients (collectively, “Clients”) and to safeguarding their non-public personal information. The following information is provided to help you understand what personal information BlackRock collects, how we protect that information and why in certain cases we share such information with select parties.
If you are located in a jurisdiction where specific laws, rules or regulations require BlackRock to provide you with additional or different privacy-related rights beyond what is set forth below, then BlackRock will comply with those specific laws, rules or regulations.
BlackRock obtains or verifies personal non-public information from and about you from different sources, including the following: (i) information we receive from you or, if applicable, your financial intermediary, on applications, forms or other documents; (ii) information about your transactions with us, our affiliates, or others; (iii) information we receive from a consumer reporting agency; and (iv) from visits to our websites.
BlackRock does not sell or disclose to non-affiliated third parties any non-public personal information about its Clients, except as permitted by law or as is necessary to respond to regulatory requests or to service Client accounts. These non-affiliated third parties are required to protect the confidentiality and security of this information and to use it only for its intended purpose.
We may share information with our affiliates to service your account or to provide you with information about other BlackRock products or services that may be of interest to you. In addition, BlackRock restricts access to non-public personal information about its Clients to those BlackRock employees with a legitimate business need for the information. BlackRock maintains physical, electronic and procedural safeguards that are designed to protect the non-public personal information of its Clients, including procedures relating to the proper storage and disposal of such information.
Fund and Service Providers
Investment Adviser
BlackRock Advisors, LLC
Wilmington, DE 19809
Accounting Agent and Custodian
State Street Bank and Trust Company
Boston, MA 02111
Transfer Agent
Computershare Trust Company, N.A.
Canton, MA 02021
VMTP Redemption and Paying Agent
The Bank of New York Mellon(a)
New York, NY 10286
(a) For MUI, MHD and MVT.
Independent Registered Public Accounting Firm
Deloitte & Touche LLP
Boston, MA 02116
Legal Counsel
Willkie Farr & Gallagher LLP
New York, NY 10019
Address of the Funds
100 Bellevue Parkway
Wilmington, DE 19809
| | |
ADDITIONAL INFORMATION | | 87 |
Glossary of Terms Used in this Report
Portfolio Abbreviation
| | |
| |
AGC | | Assured Guaranty Corp. |
| |
AGM | | Assured Guaranty Municipal Corp. |
| |
AMT | | Alternative Minimum Tax |
| |
ARB | | Airport Revenue Bonds |
| |
BAB | | Build America Bond |
| |
BAM | | Build America Mutual Assurance Co. |
| |
CAB | | Capital Appreciation Bonds |
| |
COP | | Certificates of Participation |
| |
FHA | | Federal Housing Administration |
| |
FHLMC | | Federal Home Loan Mortgage Corp. |
| |
FNMA | | Federal National Mortgage Association |
| |
GNMA | | Government National Mortgage Association |
| |
GO | | General Obligation Bonds |
| |
GOL | | General Obligation Ltd. |
| |
GTD | | GTD Guaranteed |
| |
INS | | Insured |
| |
M/F | | Multi-Family |
| |
NPFGC | | National Public Finance Guarantee Corp. |
| |
PSF | | Permanent School Fund |
| |
PSF-GTD | | Permanent School Fund Guaranteed |
| |
RB | | Revenue Bond |
| |
S/F | | Single-Family |
| |
SAB | | Special Assessment Bonds |
| |
SAW | | State Aid Withholding |
| |
SONYMA | | State of New York Mortgage Agency |
| |
ST | | Special Tax |
| |
TA | | Tax Allocation |
| | |
| 88 | | 2 0 2 1 BLA CK ROCK SEMI - ANNUAL REPORT TO SHAREHO LDERS |
Want to know more?
blackrock.com | 800-882-0052
This report is intended for current holders. It is not a prospectus. Past performance results shown in this report should not be considered a representation of future performance. The Funds have leveraged their Common Shares, which creates risks for Common Shareholders, including the likelihood of greater volatility of NAV and market price of the Common Shares, and the risk that fluctuations in short-term interest rates may reduce the Common Shares’ yield. Statements and other information herein are as dated and are subject to change.
CEMUNI7-10/21-SAR
| Item 2 – | Code of Ethics – Not Applicable to this semi-annual report |
| Item 3 – | Audit Committee Financial Expert – Not Applicable to this semi-annual report |
| Item 4 – | Principal Accountant Fees and Services – Not Applicable to this semi-annual report |
| Item 5 – | Audit Committee of Listed Registrant – Not Applicable to this semi-annual report |
(a) The registrant’s Schedule of Investments is included as part of the Report to Stockholders filed under Item 1(a) of this Form.
(b) Not Applicable due to no such divestments during the semi-annual period covered since the previous Form N-CSR filing.
| Item 7 – | Disclosure of Proxy Voting Policies and Procedures for Closed-End Management Investment Companies – Not Applicable to this semi-annual report |
| Item 8 – | Portfolio Managers of Closed-End Management Investment Companies |
(a) Not Applicable to this semi-annual report
(b) As of the date of this filing, there have been no changes in any of the portfolio managers identified in the most recent annual report on Form N-CSR.
| Item 9 – | Purchases of Equity Securities by Closed-End Management Investment Company and Affiliated Purchasers – Not Applicable due to no such purchases during the period covered by this report. |
| Item 10 – | Submission of Matters to a Vote of Security Holders – There have been no material changes to these procedures. |
| Item 11 – | Controls and Procedures |
(a) The registrant’s principal executive and principal financial officers, or persons performing similar functions, have concluded that the registrant’s disclosure controls and procedures (as defined in Rule 30a-3(c) under the Investment Company Act of 1940, as amended (the “1940 Act”)) are effective as of a date within 90 days of the filing of this report based on the evaluation of these controls and procedures required by Rule 30a-3(b) under the 1940 Act and Rule 13a-15(b) under the Securities Exchange Act of 1934, as amended.
(b) There were no changes in the registrant’s internal control over financial reporting (as defined in Rule 30a-3(d) under the 1940 Act) that occurred during the period covered by this report that have materially affected, or are reasonably likely to materially affect, the registrant’s internal control over financial reporting.
| Item 12 – | Disclosure of Securities Lending Activities for Closed-End Management Investment |
Companies – Not Applicable
| Item 13 – | Exhibits attached hereto |
(a)(1) Code of Ethics – Not Applicable to this semi-annual report
(a)(2) Section 302 Certifications are attached
(a)(3) Any written solicitation to purchase securities under Rule 23c-1 – Not Applicable
(a)(4) Change in Registrant’s independent public accountant – Not Applicable
(b) Section 906 Certifications are attached
Pursuant to the requirements of the Securities Exchange Act of 1934 and the Investment Company Act of 1940, the registrant has duly caused this report to be signed on its behalf by the undersigned, thereunto duly authorized.
BlackRock Municipal Income Fund, Inc. (Formerly BlackRock Muni Intermediate Duration Fund, Inc.)
| | | | |
| | By: | | /s/ John M. Perlowski |
| | | | John M. Perlowski |
| | | | Chief Executive Officer (principal executive officer) of |
| | | | BlackRock Municipal Income Fund, Inc. (Formerly BlackRock Muni Intermediate Duration Fund, Inc.) |
Date: January 4, 2022
Pursuant to the requirements of the Securities Exchange Act of 1934 and the Investment Company Act of 1940, this report has been signed below by the following persons on behalf of the registrant and in the capacities and on the dates indicated.
| | | | |
| | By: | | /s/ John M. Perlowski |
| | | | John M. Perlowski |
| | | | Chief Executive Officer (principal executive officer) of |
| | | | BlackRock Municipal Income Fund, Inc. (Formerly BlackRock Muni Intermediate Duration Fund, Inc.) |
Date: January 4, 2022
| | | | |
| | By: | | /s/ Trent Walker |
| | | | Trent Walker |
| | | | Chief Financial Officer (principal financial officer) of |
| | | | BlackRock Municipal Income Fund, Inc. (Formerly BlackRock Muni Intermediate Duration Fund, Inc.) |
Date: January 4, 2022