UNITED STATES
SECURITIES AND EXCHANGE COMMISSION
Washington, DC 20549
FORM N-CSRS
CERTIFIED SHAREHOLDER REPORT OF REGISTERED
MANAGEMENT INVESTMENT COMPANIES
Investment Company Act file number 811-21357
Franklin Limited Duration Income Trust
(Exact name of registrant as specified in charter)
One Franklin Parkway, San Mateo, CA 94403-1906
(Address of principal executive offices) (Zip code)
Craig S. Tyle, One Franklin Parkway, San Mateo, CA 94403-1906
(Name and address of agent for service)
Registrant’s telephone number, including area code: (650) 312-2000
Date of fiscal year end: 12/31
Date of reporting period: 06/30/20
| Item 1. | Reports to Stockholders. |
Internet Delivery of Fund Reports Unless You Request Paper Copies: Effective January 1, 2021, as permitted by the SEC, paper copies of the Fund’s shareholder reports will no longer be sent by mail, unless you specifically request them from the Fund or your financial intermediary. Instead, the reports will be made available on a website, and you will be notified by mail each time a report is posted and provided with a website link to access the report.
If you already elected to receive shareholder reports electronically, you will not be affected by this change and you need not take any action. If you have not signed up for electronic delivery, we would encourage you to join fellow shareholders who have. You may elect to receive shareholder reports and other communications electronically from the Fund by calling (800) 416-5585 or by contacting your financial intermediary.
You may elect to continue to receive paper copies of all your future shareholder reports free of charge by contacting your financial intermediary or, if you invest directly with a Fund, calling (800) 416-5585 to let the Fund know of your request. Your election to receive reports in paper will apply to all funds held in your account.
| | |
| | Visit franklintempleton.com/investor/ investments-and-solutions/investment- options/closed-end-funds/ for fund updates, to access your account, or to find helpful financial planning tools. |
| |
|
| |
| Not FDIC Insured | May Lose Value | No Bank Guarantee |
| | | | |
| | | |
| franklintempleton.com | | Semiannual Report | | 1 |
SEMIANNUAL REPORT
Franklin Limited Duration Income Trust
Dear Shareholder:
This semiannual report for Franklin Limited Duration Income Trust covers the period ended June 30, 2020.
Your Fund’s Goal and Main Investments
The Fund seeks to provide high, current income, with a secondary objective of capital appreciation to the extent possible and consistent with the Fund’s primary objective, through a portfolio consisting primarily of high-yield corporate bonds, floating rate corporate loans and mortgage- and other asset-backed securities.
Performance Overview
For the six months under review, the Fund posted cumulative total returns of -5.06% based on net asset value and -6.66% based on market price. Net asset value decreased from $10.00 per share on December 31, 2019, to $9.03 at period-end, and the market price decreased from $9.59 to $8.46 over the same period. You can find the Fund’s long-term performance data in the Performance Summary on page 7.
Performance data represent past performance, which does not guarantee future results. Investment return and principal value will fluctuate, and you may have a gain or loss when you sell your shares. Current performance may differ from figures shown.
Economic and Market Overview
The U.S. bond market, as measured by the Bloomberg Barclays U.S. Aggregate Bond Index, advanced during the six-month period despite significant economic disruption in the wake of the novel coronavirus (COVID-19) pandemic. In late February 2020, as more countries adopted social distancing and lockdown measures to slow the global pandemic, the U.S. bond market began pricing in the adverse impact on economic activity. Higher-quality, longer-term bonds rallied, while riskier, lower-rated corporate bonds declined sharply, reflecting a reversal in many investors’ risk appetite. During the last quarter of the reporting period, however, as generally slowing infection rates and phased business reopenings by states drove hopes for an economic rebound, corporate bond valuations advanced significantly. Nevertheless, an increase in infection rates toward
Portfolio Composition*
Based on Total Investments as of 6/30/20
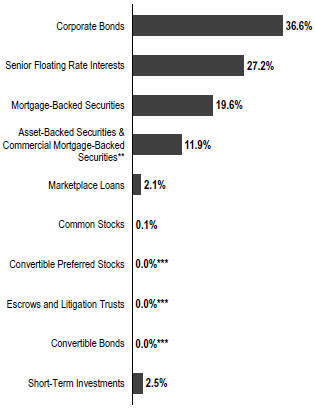
*Total investments include long-term and short-term investments.
**Includes collateralized loan obligations.
***Rounds to less than 0.1% of total investments.
period-end prompted concern among investors, hindering lower-rated bonds.
The U.S. Federal Reserve (Fed) enacted two emergency rate cuts in March 2020 in response to the COVID-19 pandemic, lowering the federal funds target rate to a range of 0.00%–0.25%. In addition, the Fed announced unlimited, open-ended purchasing of government-backed and corporate bonds to help keep markets functioning, significantly expanding its balance sheet.
U.S. Treasury bonds, as measured by the Bloomberg Barclays U.S. Treasury Index, rose significantly during the reporting period. Bond purchasing by the Fed and robust demand for investments perceived as safe drove the U.S. Treasury market higher despite the widening U.S. federal budget deficit and the massive increase in issuance.
The dollar value, number of shares or principal amount, and names of all portfolio holdings are listed in the Fund’s Statement of Investments (SOI).
The SOI begins on page 11.
| | | | |
| | | |
2 | | Semiannual Report | | franklintempleton.com |
FRANKLIN LIMITED DURATION INCOME TRUST
Mortgage-backed securities (MBS), as measured by the Bloomberg Barclays MBS Index, also posted positive returns, aided by declining Treasury rates and the Fed’s decision to purchase agency MBS.
U.S. corporate bond performance varied significantly based on credit rating, as investors became concerned about the pandemic-related economic disruption and the potential credit downgrades of many companies. Investment-grade corporate bonds, as represented by the Bloomberg Barclays U.S. Corporate Bond Index, rebounded significantly after mid-March 2020 to post positive overall returns for the reporting period. In contrast, high-yield corporate bonds, as represented by the Bloomberg Barclays U.S. Corporate High Yield Bond Index, declined due to investor concerns about a potential increase in credit defaults.
Investment Strategy
We invest in a diversified mix of fixed income securities, primarily high-yield corporate bonds, senior secured floating rate corporate loans, and mortgage- and other asset-backed securities. The Fund may also invest a small portion in marketplace loans. Our top-down analysis of macroeconomic trends combined with a bottom-up analysis of market sectors, industries and issuers drives our investment process. We seek to maintain a limited duration, or interest-rate sensitivity, to moderate the impact that fluctuating interest rates might have on the Fund’s fixed income portfolio. Within the corporate bond and corporate loan sectors, we seek securities trading at reasonable valuations from issuers with characteristics such as strong market positions, stable cash flows, reasonable capital structures, supportive asset values, strong sponsorship and improving credit fundamentals. In the mortgage- and other asset-backed securities sector, we look to capture an attractive income stream and total return through our analysis of security prepayment assumptions, potential pricing inefficiencies and underlying collateral characteristics.
Manager’s Discussion
High-Yield Corporate Bonds
Financial markets ended 2019 amid an accommodative Fed rate stance and a phase-one trade deal between the U.S. and China. As the first quarter of 2020 (Q1) got under way, however, sentiments quickly turned negative with heightened volatility as the COVID-19 pandemic began to spread rapidly across the globe. The short-term outlook for the global economy deteriorated significantly as governments took increasingly aggressive actions to try to contain the virus.
Ultimately, markets spent most of February and all of March trying to “price in” an event for which there was no readily known precedent. Compounding the situation was the plunge in oil prices in the wake of the collapse in talks among members of the Organization of the Petroleum Exporting Countries as well as other producers led by Russia, and the subsequent price war between Russia and Saudi Arabia. This weighed particularly heavily on the U.S. high-yield (HY) corporate bond market, where energy is the largest single sector exposure for the ICE BofAML U.S. High Yield Constrained Index. The simultaneous negative shocks to oil demand and supply were key drivers in the HY market selloff that ensued.
After a historic market decline from late February through late March, HY bonds began to recover in April as unprecedented fiscal and monetary measures by central banks and governments helped to improve investor sentiment, driven especially by news that additional measures from the Fed would include support for the HY market. Despite major economic uncertainties associated with the COVID-19 outbreak, market recovery continued throughout May and June amid continued policy support and investor optimism that the worst of the pandemic may have passed. After peaking at nearly 1,100 bps in late March, HY spreads narrowed to 645 bps at the end of June. The pace of the recovery slowed in June, however, as investors weighed the perceived economic progress against an acceleration of virus infections in parts of the U.S. that threatens to slow business reopening. As of period-end, U.S. Treasury yields across the curve remained at or were near all-time record lows.
Several factors benefited the Fund’s relative performance for the six-month period under review. Quality positioning was a major performance contributor, especially in Q1, as the Fund benefited from its higher quality bias as BB rated and B rated bonds notably outperformed CCC rated bonds. Security selection was also a key relative performance contributor, led especially by the energy sector. Within energy, the Fund benefited from its preference for midstream issuers, which proved to be more resilient during much of the market volatility compared to those in the exploration and production and energy services industries, which are typically more sensitive to commodity prices and where the Fund was cautiously positioned. The Fund benefited from security selection in several additional sectors as well, including healthcare, industrials, and technology.
| | | | |
| | | |
| franklintempleton.com | | Semiannual Report | | 3 |
FRANKLIN LIMITED DURATION INCOME TRUST
Floating Rate Corporate Loans
As investor fears about the impact of COVID-19 on the global economy surfaced, the loan market entered a risk-off mode in March, which included the worst declines since the Global Financial Crisis. The combination of aggressive Fed interest rate cuts combined with an increasing likelihood of a global recession resulted in heavy outflows from loan retail vehicles. Managers sold loans across the credit quality spectrum, leading to significant dislocation in prices and wide bid ask spreads. Additionally, although collateralized loan obligation (CLO) issuance had supported loan demand earlier in the period, volume stalled in March as spreads widened. After the announcement of fiscal stimulus in the U.S., investor sentiment and technical conditions improved as severe outflows eventually subsided and modest CLO activity resumed. Loan prices rallied as a result, and while the market retraced a large portion of the declines by the end of the period, the technical environment remained relatively subdued and aggressive credit rating downgrades contributed to price bifurcation across the market.
After a stronger technical environment at the beginning of the period led to a significant repricing wave in January, new issuance was on hold for much of March. Although a resumption in the primary market was slow and limited to issuers that needed liquidity, volume increased as the market recovered. However, despite a few sizeable deals related to acquisitions, mergers and acquisitions volume remained lower than prior periods and a large portion of issuance was for general corporate purposes. Among issuers that had bonds and loans, more looked to raise capital with high yield bonds considering stronger technical conditions in that market.
Default activity was initially muted but increased sharply as more issuers experienced impacts from the slowdown in economic activity. At the end of the period, the default rate by par amount exceeded its historical average and the rate by issuer count was the highest since 2010. Furthermore, the pace of credit rating downgrades accelerated, particularly within cyclical industries that were more sensitive to the impacts of weaker consumer demand and mandated shutdowns. While fundamental conditions diverged between higher quality issuers and those with weaker liquidity, stronger demand in the market for deeply discounted loans helped to reduce the portion of the market trading at distressed levels.
During the period, the loan portion of the portfolio slightly underperformed the loan benchmark. Although the portfolio’s overweighted position in higher-rated loans contributed to relative performance amid significant dislocation in the market, those loans detracted as the market rallied. Among individual loans, the top contributors to performance versus the benchmark included loans in industries that investors perceived to be more insulated from the impact of COVID-19. Securus Technologies, a provider of communications to correctional facilities, contributed to performance as investors believed the impact of shutdowns to be more limited compared to other sectors.1 Additionally, CSM Bakery Supplies (a global producer and distributor of bakery ingredients) contributed to performance as the company received an equity infusion from its sponsor and extended the maturities of its credit facilities. The developments resulted in a credit rating upgrade and the term loan traded higher. However, major detractors from performance were in industries that investors believed to be more impacted by COVID-19 shutdowns and travel restrictions. 24 Hour Fitness Worldwide, a fitness club owner and operator, detracted from performance as the company was negatively impacted by club closures and the company filed for Chapter 11 during the period. The term loan of Hertz (a global car rental company) also detracted from performance as the company experienced a steep decline in revenues and future rental bookings due to virus fears and travel restrictions.1
Mortgage-Backed Securities (MBS) and Securitized Sectors
While performance was mixed over the period, all the securitized sectors that the portfolio invests in provided positive total returns during the period. Non-agency mortgage-backed securities (RMBS) was the top performing sector, outperforming U.S. Treasuries (USTs) and all corporate credit sectors. Commercial mortgage-backed securities (CMBS) also outperformed corporate credit, but lagged USTs. Higher quality agency mortgage-backed securities (MBS) could not keep pace with similar duration USTs or investment-grade corporate credit but outperformed high-yield corporate credit, senior secured floating rate loans and CLOs.
Coming into the recent downturn, housing fundamentals were on stronger footing compared to the Global Financial Crisis, leading to moderate, but positive home price appreciation forecasts. Current supply and demand dynamics remained supportive as inventory remained at
1. Not held at period-end.
| | | | |
| | | |
4 | | Semiannual Report | | franklintempleton.com |
FRANKLIN LIMITED DURATION INCOME TRUST
historically low levels and demand remained intact, as seen in the remarkable recovery in purchase applications in May. The Case Shiller Home Price Index grew in April, marking the 96th straight month of positive price growth.
Given the market shock related to the COVID-19 virus, the Fed once again began actively participating in agency MBS in March to minimize disruption and ensure smooth functioning of the market. The Fed’s support of the MBS sector should keep spreads rangebound but prepayment risk remains elevated, with 75% of the mortgage universe having incentive to refinance, and spreads are relatively tight. The latest announcement from the Fed stating their plan to maintain the current pace of MBS purchases at $40 billion a month should leave daily agency MBS purchases largely unchanged. So far, pandemic related factors have kept prepayment contained, but we believe prepayments will rise as the economy normalizes.
In agency MBS, the portfolio’s mortgage exposure remained heavily weighted to conventional Freddie Mac and Fannie Mae MBS, mainly in 3.0% through 4.0% coupon securities. For our RMBS exposure we remain allocated to seasoned credit risk transfer securities (CRTs) and have continued to stress test the portfolio under various scenarios including multiples of the global financial crisis. For our CMBS allocation, we maintained our exposure at the top of the capital structure. The COVID-19 pandemic has had a severe effect on CMBS with the growing uncertainty about the impact of the pandemic on U.S. commercial real estate. From a sector perspective, hotels and retail sectors have been the hardest hit as discretionary spending plummeted. We also believe that office buildings with large tenancy in co-working spaces will come under pressure.
Thank you for your continued participation in Franklin Limited Duration Income Trust. We look forward to serving your future investment needs.
Sincerely,
David Yuen, CFA, FRM
Co-Lead Portfolio Manager
Sonal Desai, Ph.D.
Co-Lead Portfolio Manager
Glenn I. Voyles, CFA
Co-Lead Porfolio Manager
Justin Ma, CFA
Co-Lead Portfolio Manager
CFA® is a trademark owned by CFA Institute.
The foregoing information reflects our analysis, opinions and portfolio holdings as of June 30, 2020, the end of the reporting period. The way we implement our main investment strategies and the resulting portfolio holdings may change depending on factors such as market and economic conditions. These opinions may not be relied upon as investment advice or an offer for a particular security. The information is not a complete analysis of every aspect of any market, country, industry, security or the Fund. Statements of fact are from sources considered reliable, but the investment manager makes no representation or warranty as to their completeness or accuracy. Although historical performance is no guarantee of future results, these insights may help you understand our investment management philosophy.
| | | | |
| | | |
| franklintempleton.com | | Semiannual Report | | 5 |
FRANKLIN LIMITED DURATION INCOME TRUST
Performance Summary as of June 30, 2020
Total return reflects reinvestment of the Fund’s dividends and capital gain distributions, if any, and any unrealized gains or losses. Total returns do not reflect any sales charges paid at inception or brokerage commissions paid on secondary market purchases. The performance table does not reflect any taxes that a shareholder would pay on Fund dividends, capital gain distributions, if any, or any realized gains on the sale of Fund shares. Your dividend income will vary depending on dividends or interest paid by securities in the Fund’s portfolio, adjusted for operating expenses. Capital gain distributions are net profits realized from the sale of portfolio securities.
Performance1,2
| | | | | | | | | | | | | | | | |
| | | Cumulative Total Return3 | | | Average Annual Total Return3 | |
| | |
| Based on
NAV |
4 | |
| Based on
market price |
5 | |
| Based on
NAV |
4 | |
| Based on
market price |
5 |
| | | | |
6-Month | | | -5.06% | | | | -6.66% | | | | -5.06% | | | | -6.66% | |
| | | | |
1-Year | | | -3.07% | | | | -1.95% | | | | -3.07% | | | | -1.95% | |
| | | | |
5-Year | | | +3.17% | | | | +17.55% | | | | +0.63% | | | | +3.29% | |
| | | | |
10-Year | | | +48.66% | | | | +59.96% | | | | +4.04% | | | | +4.81% | |
Performance data represent past performance, which does not guarantee future results. Investment return and principal value will fluctuate, and you may have a gain or loss when you sell your shares. Current performance may differ from figures shown.
Share Prices
| | | | | | | | | | | | |
| Symbol: FTF | | 6/30/20 | | | 12/31/19 | | | Change | |
| | | |
Net Asset Value (NAV) | | | $9.03 | | | | $10.00 | | | | -$0.97 | |
| | | |
Market Price (NYSE) | | | $8.46 | | | | $ 9.59 | | | | -$1.13 | |
Distributions (1/1/20–6/30/20)
|
Net Investment Income |
|
$0.4807 |
See page 7 for Performance Summary footnotes.
| | | | |
| | | |
6 | | Semiannual Report | | franklintempleton.com |
FRANKLIN LIMITED DURATION INCOME TRUST
PERFORMANCE SUMMARY
All investments involve risks, including possible loss of principal. Interest-rate movements and mortgage prepayments will affect the Fund’s share price and yield. Bond prices generally move in the opposite direction of interest rates. As prices of bonds in the Fund adjust to a rise in interest rates, the Fund’s share price may decline. Investments in lower-rated bonds include higher risk of default and loss of principal. Unexpected events and their aftermaths, such as the spread of deadly diseases; natural, environmental or man-made disasters; financial, political or social disruptions; terrorism and war; and other tragedies or catastrophes, can cause investor fear and panic, which can adversely affect the economies of many companies, sectors, nations, regions and the market in general, in ways that cannot necessarily be foreseen. The Fund is actively managed but there is no guarantee that the manager’s investment decisions will produce the desired results.
1. Figures are for common shares. As of 6/30/20, the Fund had leverage in the amount of 26.97% of the Fund’s total portfolio. The Fund employs leverage through participation in a Credit Facility and purchase of Mortgage Dollar Rolls. The use of financial leverage creates an opportunity for increased income but, at the same time, creates special risks (including the likelihood of greater volatility of net asset value and market price of common shares). The cost of leverage rises and falls with changes in short-term interest rates. Such increases/decreases in the cost of the Fund’s leverage may be offset by increased/decreased income from the Fund’s floating rate investments.
2. The Fund has a fee waiver associated with any investment it makes in a Franklin Templeton money fund and/or other Franklin Templeton fund, contractually guaranteed through 2/29/21. Fund investment results reflect the fee waiver; without this waiver, the results would have been lower.
3. Total return calculations represent the cumulative and average annual changes in value of an investment over the periods indicated. Return for less than one year, if any, has not been annualized.
4. Assumes reinvestment of distributions based on net asset value.
5. Assumes reinvestment of distributions based on the dividend reinvestment and cash purchase plan.
| | | | |
| | | |
| franklintempleton.com | | Semiannual Report | | 7 |
FRANKLIN LIMITED DURATION INCOME TRUST
Important Notice to Shareholders
Managed Distribution Plan
The Fund adopted a managed distribution plan (the “Plan”) under which the Fund makes monthly distributions to common shareholders at an annual minimum fixed rate of 10% based on average monthly net asset value (“NAV”) of the Fund’s common shares. The primary purpose of the Plan is to provide the Fund’s shareholders with a constant, but not guaranteed, fixed minimum rate of distribution each month. The plan is intended to narrow the discount between the market price and the NAV of the Fund’s common shares, but there is no assurance that the plan will be successful in doing so.
Under Plan, to the extent that sufficient investment income is not available on a monthly basis, the Fund will distribute long-term capital gains and/or return of capital in order to maintain its managed distribution level. No conclusions should be drawn about the Fund’s investment performance from the amount of the Fund’s distributions or from the terms of the Plan. The Board may amend the terms of the Plan or terminate the Plan at any time without prior notice to the Fund’s shareholders. The amendment or termination of the Plan could have an adverse effect on the market price of the Fund’s common shares. The Plan is subject to periodic review by the Board, including a yearly review of the annual minimum fixed rate to determine if an adjustment should be made.
The Fund calculates the average NAV from the previous month based on the number of business days in that month on which the NAV is calculated. The distribution is calculated as 10% of the previous month’s average NAV, divided by 12. Typically, distributions will be declared by press release 10 days before the last business day of each month, with the record date on the last business day of the month. The payment date for the distribution will typically be during the middle of the next month.
With each distribution that does not consist solely of net investment income, the Fund will issue a notice to shareholders and an accompanying press release that will provide detailed information regarding the amount and composition of the distribution and other related information. The amounts and sources of distributions reported in the notice to shareholders are only estimates and are not being provided for tax reporting purposes. The actual amounts and sources of the amounts for tax reporting purposes will
depend upon the Fund’s investment experience during its full fiscal year and may be subject to changes based on tax regulations. The Fund will send shareholders a Form 1099-DIV for the calendar year that will tell them how to report these distributions for federal income tax purposes.
The Fund may at times distribute more than its net investment income and net realized capital gains; therefore, a portion of the distribution may result in a return of capital. A return of capital occurs when some or all of the money that shareholders invested in the Fund is paid back to them. A return of capital does not necessarily reflect the Fund’s investment performance and should not be confused with ‘yield’ or ‘income’. Any such returns of capital will decrease the Fund’s total assets and, therefore, could have the effect of increasing the Fund’s expense ratio. In addition, in order to make the level of distributions called for under its plan, the Fund may have to sell portfolio securities at a less than opportune time.
| | | | |
| | | |
8 | | Semiannual Report | | franklintempleton.com |
FRANKLIN LIMITED DURATION INCOME TRUST
Financial Highlights
| | | | | | | | | | | | | | | | | | | | | | | | | | | | |
| | | Six Months Ended June 30, 2020 (unaudited) | | | | | | | | | | | | | | | | | | | |
| | | Year Ended December 31, | | | Year Ended March 31, | |
| | | | 2019 | | | | 2018 | | | | 2017a | | | | 2017 | | | | 2016 | | | | 2015 | |
| | | | | | | |
Per common share operating performance | | | | | | | | | | | | | | | | | | | | | | | | | | | | |
(for a common share outstanding throughout the period) | | | | | | | | | | | | | | | | | | | | | | | | | |
| | | | | | | |
Net asset value, beginning of period | | | $10.00 | | | | $10.11 | | | | $12.32 | | | | $12.91 | | | | $12.38 | | | | $13.87 | | | | $14.36 | |
| | | | | | | |
Income from investment operations: | | | | | | | | | | | | | | | | | | | | | | | | | | | | |
| | | | | | | |
Net investment incomeb | | | 0.25 | | | | 0.53 | | | | 0.57 | | | | 0.48 | | | | 0.62 | | | | 0.72 | | | | 0.73 | |
| | | | | | | |
Net realized and unrealized gains (losses) | | | (0.74 | ) | | | 0.39 | | | | (0.79 | ) | | | (0.03 | ) | | | 0.85 | | | | (1.41 | ) | | | (0.33 | ) |
| | | | | | | |
Dividends to preferred shareholders from net investment income | | | — | | | | — | | | | (0.06 | ) | | | (0.08 | ) | | | (0.07 | ) | | | (0.06 | ) | | | (0.06 | ) |
| | | | | | | |
Total from investment operations | | | (0.49 | ) | | | 0.92 | | | | (0.28 | ) | | | 0.37 | | | | 1.40 | | | | (0.75 | ) | | | 0.34 | |
| | | | | | | |
Less distributions to common shareholders from: | | | | | | | | | | | | | | | | | | | | | | | | | | | | |
| | | | | | | |
Net investment income | | | (0.48 | ) | | | (0.58 | ) | | | (0.49 | ) | | | (0.43 | ) | | | (0.57 | ) | | | (0.74 | ) | | | (0.83 | ) |
| | | | | | | |
Tax return of capital | | | — | | | | (0.45 | ) | | | (0.68 | ) | | | (0.53 | ) | | | (0.36 | ) | | | — | | | | — | |
| | | | | | | |
Total distributions | | | (0.48 | ) | | | (1.03 | ) | | | (1.17 | ) | | | (0.96 | ) | | | (0.93 | ) | | | (0.74 | ) | | | (0.83 | ) |
| | | | | | | |
Repurchase of shares | | | — | | | | — | | | | — | | | | — | | | | 0.06 | | | | — | | | | — | |
| | | | | | | |
Dilution effect of rights offering | | | — | | | | — | | | | (0.76 | )c | | | — | | | | — | | | | — | | | | — | |
| | | | | | | |
Net asset value, end of period | | | $ 9.03 | | | | $10.00 | | | | $10.11 | | | | $12.32 | | | | $12.91 | | | | $12.38 | | | | $13.87 | |
| | | | | | | |
Market value, end of periodd | | | $ 8.46 | | | | $ 9.59 | | | | $ 9.02 | | | | $11.83 | | | | $11.97 | | | | $11.34 | | | | $12.17 | |
| | | | | | | |
Total return (based on market value per share)e | | | (6.66)% | | | | 18.34% | | | | (14.86)% | | | | 7.08% | | | | 14.07% | | | | (0.44)% | | | | (0.35)% | |
| | | | | | | |
| Ratios to average net assets applicable to common sharesf,g | | | | | | | | | | | | | | | | | | | | | | | | | | | | |
| | | | | | | |
Expenses before waiver and payments by affiliates | | | 1.89% | | | | 2.16% | | | | 1.73% | | | | 1.25% | | | | 1.35% | | | | 1.16% | | | | 1.14% | |
| | | | | | | |
Expenses net of waiver and payments by affiliatesh | | | 1.88% | | | | 2.15% | | | | 1.71% | | | | 1.23% | | | | 1.32% | | | | 1.16% | i | | | 1.14% | i |
| | | | | | | |
Net investment income | | | 5.36% | | | | 5.15% | | | | 4.97% | | | | 5.04% | | | | 4.83% | | | | 5.52% | | | | 5.14% | |
| | | | | | | |
Supplemental data | | | | | | | | | | | | | | | | | | | | | | | | | | | | |
| | | | | | | |
Net assets applicable to common shares, end of period (000’s) | | | $272,005 | | | | $301,452 | | | | $304,804 | | | | $278,489 | | | | $291,875 | | | | $332,132 | | | | $372,080 | |
| | | | | | | |
Portfolio turnover rate | | | 49.15% | | | | 113.49% | | | | 198.44% | | | | 168.28% | | | | 265.00% | | | | 270.16% | | | | 289.67% | |
| | | | | | | |
Portfolio turnover rate excluding mortgage dollar rollsj | | | 19.34% | | | | 57.50% | | | | 63.84% | | | | 46.49% | | | | 93.00% | | | | 81.78% | | | | 92.15% | |
| | | | | | | |
Total credit facility and reverse repurchase agreements outstanding at end of period (000’s) | | | $100,446 | | | | $107,117 | | | | $90,000k | | | | $ — | | | | $ — | | | | $ — | | | | $ — | |
| | | | | | | |
Asset coverage per preferred share | | | $ — | | | | $ — | | | | $—l | | | | $72,311 | | | | $74,809 | | | | $75,991 | | | | $76,665 | |
| | | | | | | |
Liquidation preference per preferred share | | | $ — | | | | $ — | | | | $—l | | | | $25,000 | | | | $25,000 | | | | $25,000 | | | | $25,000 | |
| | | | |
| | | |
| franklintempleton.com | | The accompanying notes are an integral part of these financial statements. | Semiannual Report | | 9 |
FRANKLIN LIMITED DURATION INCOME TRUST
FINANCIAL HIGHLIGHTS
| | | | | | | | | | | | | | | | | | | | | | | | | | | | |
| | | Six Months Ended June 30, 2020 (unaudited) | | | | | | | | | | | | | | | | | | | |
| | | Year Ended December 31, | | | Year Ended March 31, | |
| | | | 2019 | | | | 2018 | | | | 2017a | | | | 2017 | | | | 2016 | | | | 2015 | |
| | | | | | | |
Asset coverage per $1,000 of debt | | | $3,708 | | | | $3,814 | | | | $4,387k | | | | $ — | | | | $ — | | | | $ — | | | | $ — | |
aFor the period April 1, 2017 to December 31, 2017.
bBased on average daily shares outstanding.
cRepresents the impact of Fund’s rights offering of 7,534,709 common shares in October 2018 as a subscription price per share based on a formula. dBased on the last sale on the NYSE American.
eTotal return is not annualized for periods less than one year.
fBased on income and expenses applicable to both common and preferred shares.
gRatios are annualized for periods less than one year.
hBenefit of expense reduction rounds to less than 0.01%.
iBenefit of waiver and payments by affiliates rounds to less than 0.01%.
jSee Note 1(d) regarding mortgage dollar rolls.
kEffective August 15, 2018, the Fund began participating in a credit facility.
lEffective August 15, 2018, the Fund’s preferred shares were liquidated.
| | | | |
| | | |
10 | | Semiannual Report | The accompanying notes are an integral part of these financial statements. | | franklintempleton.com |
FRANKLIN LIMITED DURATION INCOME TRUST
Statement of Investments, June 30, 2020 (unaudited)
| | | | | | | | | | | | |
| | | | Country | | |
| Shares/
Warrants |
| | | Value | |
| | | |
Common Stocks and Other Equity Interests 0.1% | | | | | | | | | | | | |
Capital Goods 0.0% | | | | | | | | | | | | |
a,b,cOnsite Rental Group Operations Pty. Ltd. | | | Australia | | | | 522,133 | | | $ | — | |
| | | | | | | | | | | | |
Commercial & Professional Services 0.0%† | | | | | | | | | | | | |
aRemington Outdoor Co. Inc. | | | United States | | | | 39,306 | | | | 19,653 | |
| | | | | | | | | | | | |
Energy 0.1% | | | | | | | | | | | | |
Amplify Energy Corp. | | | United States | | | | 281 | | | | 346 | |
a,bBattalion Oil Corp., wts., A, 10/08/22 | | | United States | | | | 752 | | | | 1,994 | |
a,bBattalion Oil Corp., wts., B, 10/08/22 | | | United States | | | | 940 | | | | 2,262 | |
a,bBattalion Oil Corp., wts., C, 10/08/22 | | | United States | | | | 1,209 | | | | 2,557 | |
a,bBirch Permian Holdings Inc. | | | United States | | | | 2,309 | | | | 10,968 | |
a,bBirch Permian Holdings Inc. | | | United States | | | | 17,998 | | | | 83,241 | |
a,b,cNine Point Energy LLC. | | | United States | | | | 22,270 | | | | 6,230 | |
Riviera Resources Inc. | | | United States | | | | 6,305 | | | | 11,317 | |
a,bSamson Resources II LLC | | | United States | | | | 31,225 | | | | 147,351 | |
aWeatherford International PLC | | | United States | | | | 16,810 | | | | 33,116 | |
| | | | | | | | | | | | |
| | | | | | | | | | | 299,382 | |
| | | | | | | | | | | | |
Materials 0.0%† | | | | | | | | | | | | |
Verso Corp., A | | | United States | | | | 4,163 | | | | 49,790 | |
aVerso Corp., wts., 7/25/23 | | | United States | | | | 438 | | | | 449 | |
| | | | | | | | | | | | |
| | | | | | | | | | | 50,239 | |
| | | | | | | | | | | | |
Total Common Stocks and Other Equity Interests
(Cost $4,204,722) | | | | | | | | | | | 369,274 | |
| | | | | | | | | | | | |
| | | |
Convertible Preferred Stocks (Cost $377,604) 0.0%† | | | | | | | | | | | | |
Energy 0.0%† | | | | | | | | | | | | |
a,b,cNine Point Energy Holdings Inc., cvt. pfd. | | | United States | | | | 404 | | | | 63,983 | |
| | | | | | | | | | | | |
| | | |
| | | | | |
| Principal
Amount |
* | | | | |
Convertible Bonds (Cost $5,723) 0.0%† | | | | | | | | | | | | |
Telecommunication Services 0.0%† | | | | | | | | | | | | |
dDigicel Group 0.5 Ltd., cvt., sub. bond, 144A, PIK, 7.00%, 10/01/68 | | | Jamaica | | | $ | 30,899 | | | | 2,674 | |
| | | | | | | | | | | | |
Corporate Bonds 53.5% | | | | | | | | | | | | |
Automobiles & Components 1.6% | | | | | | | | | | | | |
dAdient U.S. LLC, | | | | | | | | | | | | |
senior note, 144A, 9.00%, 4/15/25 | | | United States | | | | 300,000 | | | | 324,473 | |
esenior secured note, 144A, 7.00%, 5/15/26 | | | United States | | | | 1,300,000 | | | | 1,347,625 | |
Dana Inc., senior note, 5.625%, 6/15/28 | | | United States | | | | 1,400,000 | | | | 1,393,266 | |
eThe Goodyear Tire & Rubber Co., senior note, 5.125%, 11/15/23 | | | United States | | | | 300,000 | | | | 288,657 | |
The Goodyear Tire and Rubber Co., senior note, 9.50%, 5/31/25 | | | United States | | | | 1,000,000 | | | | 1,073,125 | |
| | | | | | | | | | | | |
| | | | | | | | | | | 4,427,146 | |
| | | | | | | | | | | | |
Banks 1.4% | | | | | | | | | | | | |
e,fJPMorgan Chase & Co., junior sub. bond, R, 6.00% to 8/01/23, FRN thereafter, Perpetual | | | United States | | | | 1,500,000 | | | | 1,516,000 | |
dNMI Holdings Inc., secured note, 144A, 7.375%, 6/01/25 | | | United States | | | | 1,200,000 | | | | 1,258,656 | |
Radian Group Inc., senior note, 6.625%, 3/15/25 | | | United States | | | | 900,000 | | | | 924,187 | |
| | | | | | | | | | | | |
| | | | | | | | | | | 3,698,843 | |
| | | | | | | | | | | | |
| | | | |
| | | |
| franklintempleton.com | | Semiannual Report | | 11 |
FRANKLIN LIMITED DURATION INCOME TRUST
STATEMENT OF INVESTMENTS (UNAUDITED)
| | | | | | | | | | | | |
| | | | Country | | |
| Principal
Amount |
* | | | Value | |
| | | |
Corporate Bonds (continued) | | | | | | | | | | | | |
Capital Goods 4.4% | | | | | | | | | | | | |
d,eBeacon Roofing Supply Inc., senior note, 144A, 4.875%, 11/01/25 | | | United States | | | $ | 1,200,000 | | | $ | 1,074,204 | |
eH&E Equipment Services Inc., senior note, 5.625%, 9/01/25 | | | United States | | | | 1,500,000 | | | | 1,518,593 | |
Hillenbrand Inc., senior note, 5.75%, 6/15/25 | | | United States | | | | 800,000 | | | | 829,000 | |
d,eJeld-Wen Inc., senior note, 144A, 4.625%, 12/15/25 | | | United States | | | | 1,600,000 | | | | 1,541,832 | |
d,eThe Manitowoc Co. Inc., secured note, second lien, 144A, 9.00%, 4/01/26 | | | United States | | | | 1,000,000 | | | | 992,965 | |
dNavistar International Corp., senior secured note, 144A, 9.50%, 5/01/25 | | | United States | | | | 600,000 | | | | 645,375 | |
b,c,gOnsite Rental Group Operations Pty. Ltd., secured note, PIK, 6.10%, 10/26/23 | | | Australia | | | | 952,561 | | | | 773,200 | |
d,eSignature Aviation US Holdings Inc., senior note, 144A, 5.375%, 5/01/26 | | | United States | | | | 400,000 | | | | 401,442 | |
eTennant Co., senior note, 5.625%, 5/01/25 | | | United States | | | | 800,000 | | | | 810,916 | |
d,eTransDigm Inc., senior secured note, 144A, 6.25%, 3/15/26 | | | United States | | | | 1,400,000 | | | | 1,401,540 | |
d,hVertical Holdco GmbH, 144A, 7.625%, 7/15/28 | | | Luxembourg | | | | 300,000 | | | | 305,964 | |
d,hVertical U.S. Newco Inc., senior note, 144A, 5.25%, 7/15/27 | | | United States | | | | 600,000 | | | | 600,000 | |
dWESCO Distribution Inc., senior note, 144A, 7.125%, 6/15/25 | | | United States | | | | 900,000 | | | | 951,480 | |
| | | | | | | | | | | | |
| | | | | | | | | | | 11,846,511 | |
| | | | | | | | | | | | |
Commercial & Professional Services 1.2% | | | | | | | | | | | | |
d,eGFL Environmental Inc., senior note, 144A, 5.125%, 12/15/26 | | | Canada | | | | 1,200,000 | | | | 1,245,000 | |
d,eHarsco Corp., senior note, 144A, 5.75%, 7/31/27 | | | United States | | | | 1,400,000 | | | | 1,407,042 | |
eUnited Rentals North America Inc., senior bond, 5.875%, 9/15/26 | | | United States | | | | 600,000 | | | | 629,469 | |
| | | | | | | | | | | | |
| | | | | | | | | | | 3,281,511 | |
| | | | | | | | | | | | |
Consumer Durables & Apparel 1.7% | | | | | | | | | | | | |
dAshton Woods USA LLC/Ashton Woods Finance Co., | | | | | | | | | | | | |
esenior note, 144A, 9.875%, 4/01/27 | | | United States | | | | 1,000,000 | | | | 1,066,060 | |
senior note, 144A, 6.625%, 1/15/28 | | | United States | | | | 500,000 | | | | 492,500 | |
d,eHanesbrands Inc., senior note, 144A, 4.625%, 5/15/24 | | | United States | | | | 1,000,000 | | | | 997,605 | |
eKB Home, senior note, 7.00%, 12/15/21 | | | United States | | | | 1,100,000 | | | | 1,154,093 | |
d,eTaylor Morrison Communities Inc./Taylor Morrison Holdings II Inc., senior note, 144A, 5.875%, 4/15/23 | | | United States | | | | 1,000,000 | | | | 1,031,145 | |
| | | | | | | | | | | | |
| | | | | | | | | | | 4,741,403 | |
| | | | | | | | | | | | |
Consumer Services 4.7% | | | | | | | | | | | | |
d,e1011778 BC ULC/New Red Finance Inc., senior secured note, first lien, 144A, 4.25%, 5/15/24 | | | Canada | | | | 800,000 | | | | 802,216 | |
b,d,i24 Hour Holdings III LLC, senior note, 144A, 8.00%, 6/01/22 | | | United States | | | | 1,500,000 | | | | 41,250 | |
dBoyd Gaming Corp., senior note, 144A, 8.625%, 6/01/25 | | | United States | | | | 1,300,000 | | | | 1,360,937 | |
d,hColt Merger Sub Inc., | | | | | | | | | | | | |
senior note, 144A, 5.75%, 7/01/25 | | | United States | | | | 400,000 | | | | 403,000 | |
senior secured note, 144A, 6.25%, 7/01/25 | | | United States | | | | 900,000 | | | | 895,230 | |
d,eDownstream Development Authority of the Quapaw Tribe of Oklahoma, secured note, 144A, 10.50%, 2/15/23 | | | United States | | | | 1,400,000 | | | | 1,188,103 | |
d,eGolden Nugget Inc., senior note, 144A, 8.75%, 10/01/25 | | | United States | | | | 1,200,000 | | | | 681,738 | |
dInternational Game Technology PLC, senior secured note, first lien, 144A, 5.25%, 1/15/29 | | | United States | | | | 400,000 | | | | 391,000 | |
d,eKFC Holding Co./Pizza Hut Holdings LLC/Taco Bell of America LLC, senior note, 144A, 5.00%, 6/01/24 | | | United States | | | | 1,400,000 | | | | 1,429,897 | |
d,eStars Group Holdings BV/Stars Group U.S. Co-Borrower LLC, senior note, 144A, 7.00%, 7/15/26 | | | Canada | | | | 500,000 | | | | 528,218 | |
d,eStudio City Finance Ltd., senior note, 144A, 7.25%, 2/11/24 | | | Macau | | | | 1,100,000 | | | | 1,128,969 | |
dVail Resorts Inc., senior note, 144A, 6.25%, 5/15/25 | | | United States | | | | 700,000 | | | | 735,438 | |
| | | | |
| | | |
12 | | Semiannual Report | | franklintempleton.com |
FRANKLIN LIMITED DURATION INCOME TRUST
STATEMENT OF INVESTMENTS (UNAUDITED)
| | | | | | | | | | | | |
| | | | Country | | |
| Principal
Amount |
* | | | Value | |
| | | |
Corporate Bonds (continued) | | | | | | | | | | | | |
Consumer Services (continued) | | | | | | | | | | | | |
d,eWynn Las Vegas LLC/Wynn Las Vegas Capital Corp., senior bond, 144A, 5.50%, 3/01/25 | | | United States | | | $ | 1,700,000 | | | $ | 1,560,931 | |
dWynn Resorts Finance LLC/Wynn Resorts Capital Corp., senior note, 144A, 7.75%, 4/15/25 | | | United States | | | | 1,500,000 | | | | 1,517,362 | |
| | | | | | | | | | | | |
| | | | | | | | | | | 12,664,289 | |
| | | | | | | | | | | | |
Diversified Financials 1.8% | | | | | | | | | | | | |
d,eFirstCash Inc., senior note, 144A, 5.375%, 6/01/24 | | | United States | | | | 900,000 | | | | 907,780 | |
dHAT Holdings I LLC/HAT Holdings II LLC, | | | | | | | | | | | | |
esenior note, 144A, 5.25%, 7/15/24 | | | United States | | | | 600,000 | | | | 613,188 | |
senior note, 144A, 6.00%, 4/15/25 | | | United States | | | | 400,000 | | | | 419,750 | |
eNavient Corp., | | | | | | | | | | | | |
senior note, 5.00%, 10/26/20 | | | United States | | | | 200,000 | | | | 199,462 | |
senior note, 5.875%, 3/25/21 | | | United States | | | | 200,000 | | | | 197,063 | |
senior note, 6.625%, 7/26/21 | | | United States | | | | 400,000 | | | | 393,124 | |
senior note, 6.50%, 6/15/22 | | | United States | | | | 200,000 | | | | 197,125 | |
senior note, 7.25%, 9/25/23 | | | United States | | | | 400,000 | | | | 392,202 | |
Springleaf Finance Corp., | | | | | | | | | | | | |
esenior bond, 5.375%, 11/15/29 | | | United States | | | | 500,000 | | | | 473,100 | |
senior note, 8.875%, 6/01/25 | | | United States | | | | 500,000 | | | | 535,533 | |
esenior note, 6.625%, 1/15/28 | | | United States | | | | 600,000 | | | | 595,014 | |
| | | | | | | | | | | | |
| | | | | | | | | | | 4,923,341 | |
| | | | | | | | | | | | |
Energy 6.4% | | | | | | | | | | | | |
dAker BP ASA, | | | | | | | | | | | | |
senior note, 144A, 4.75%, 6/15/24 | | | Norway | | | | 500,000 | | | | 504,037 | |
esenior note, 144A, 5.875%, 3/31/25 | | | Norway | | | | 500,000 | | | | 508,814 | |
d,eArchrock Partners LP/Archrock Partners Finance Corp., senior note, 144A, 6.25%, 4/01/28 | | | United States | | | | 700,000 | | | | 642,460 | |
b,iCalifornia Resources Corp., senior note, 5.50%, 9/15/21 | | | United States | | | | 37,000 | | | | 527 | |
eCalumet Specialty Products Partners LP/Calumet Finance Corp., senior note, 7.75%, 4/15/23 | | | United States | | | | 1,000,000 | | | | 933,645 | |
eCheniere Corpus Christi Holdings LLC, | | | | | | | | | | | | |
senior secured note, first lien, 7.00%, 6/30/24 | | | United States | | | | 700,000 | | | | 797,217 | |
senior secured note, first lien, 5.875%, 3/31/25 | | | United States | | | | 600,000 | | | | 674,004 | |
eCheniere Energy Partners LP, | | | | | | | | | | | | |
dsenior bond, 144A, 4.50%, 10/01/29 | | | United States | | | | 900,000 | | | | 880,263 | |
senior note, 5.625%, 10/01/26 | | | United States | | | | 400,000 | | | | 397,288 | |
senior secured note, first lien, 5.25%, 10/01/25 | | | United States | | | | 1,000,000 | | | | 997,700 | |
Comstock Resources Inc., senior note, 9.75%, 8/15/26 | | | United States | | | | 400,000 | | | | 374,500 | |
eCrestwood Midstream Partners LP/Crestwood Midstream Finance Corp., senior note, 6.25%, 4/01/23 | | | United States | | | | 1,500,000 | | | | 1,338,907 | |
d,eCSI Compressco LP/CSI Compressco Finance Inc., | | | | | | | | | | | | |
gsecured bond, second lien, 144A, PIK, 10.00%, 4/01/26 | | | United States | | | | 1,012,000 | | | | 648,356 | |
senior secured bond, first lien, 144A, PIK, 7.50%, 4/01/25 | | | United States | | | | 325,000 | | | | 277,435 | |
dEndeavor Energy Resources LP/EER Finance Inc., | | | | | | | | | | | | |
esenior bond, 144A, 5.75%, 1/30/28 | | | United States | | | | 1,000,000 | | | | 962,315 | |
senior note, 144A, 6.625%, 7/15/25 | | | United States | | | | 500,000 | | | | 505,160 | |
| | | | |
| | | |
| franklintempleton.com | | Semiannual Report | | 13 |
FRANKLIN LIMITED DURATION INCOME TRUST
STATEMENT OF INVESTMENTS (UNAUDITED)
| | | | | | | | | | | | |
| | | | Country | | |
| Principal
Amount |
* | | | Value | |
| | | |
Corporate Bonds (continued) | | | | | | | | | | | | |
Energy (continued) | | | | | | | | | | | | |
d,g,jEnQuest PLC, senior note, 144A, Reg S, PIK, 7.00%, 10/15/23 | | | United Kingdom | | | $ | 980,949 | | | $ | 589,923 | |
Martin Midstream Partners LP/Martin Midstream Finance Corp., senior note, 7.25%, 2/15/21 | | | United States | | | | 1,100,000 | | | | 828,987 | |
b,d,g,iMurray Energy Corp., secured note, 1.5 lien, 144A, PIK, 12.00% (incl. cash 9.00%), 4/15/24 | | | United States | | | | 606,187 | | | | 748 | |
dNabors Industries Ltd., senior note, 144A, 7.25%, 1/15/26 | | | United States | | | | 1,000,000 | | | | 617,500 | |
Occidental Petroleum Corp., | | | | | | | | | | | | |
senior note, 2.90%, 8/15/24 | | | United States | | | | 200,000 | | | | 171,398 | |
hsenior note, 8.50%, 7/15/27 | | | United States | | | | 1,000,000 | | | | 1,005,000 | |
ksenior note, FRN, 1.842%, (3-month USD LIBOR + 1.45%), 8/15/22 | | | United States | | | | 1,100,000 | | | | 1,012,422 | |
QEP Resources Inc., senior bond, 5.25%, 5/01/23 | | | United States | | | | 500,000 | | | | 331,563 | |
dSeven Generations Energy Ltd., senior note, 144A, 5.375%, 9/30/25 | | | Canada | | | | 800,000 | | | | 706,492 | |
eSunoco LP/Sunoco Finance Corp., senior note, 4.875%, 1/15/23 | | | United States | | | | 700,000 | | | | 692,051 | |
d,eViper Energy Partners LP, senior note, 144A, 5.375%, 11/01/27 | | | United States | | | | 400,000 | | | | 393,044 | |
dWeatherford International Ltd., senior note, 144A, 11.00%, 12/01/24 | | | United States | | | | 916,000 | | | | 641,200 | |
| | | | | | | | | | | | |
| | | | | | | | | | | 17,432,956 | |
| | | | | | | | | | | | |
Food, Beverage & Tobacco 1.2% | | | | | | | | | | | | |
eB&G Foods Inc., | | | | | | | | | | | | |
senior note, 5.25%, 4/01/25 | | | United States | | | | 1,000,000 | | | | 1,008,500 | |
senior note, 5.25%, 9/15/27 | | | United States | | | | 400,000 | | | | 401,376 | |
dKraft Heinz Foods Co., senior note, 144A, 3.875%, 5/15/27 | | | United States | | | | 800,000 | | | | 837,072 | |
d,eLamb Weston Holdings Inc., senior note, 144A, 4.625%, 11/01/24 | | | United States | | | | 1,100,000 | | | | 1,144,115 | |
| | | | | | | | | | | | |
| | | | | | | | | | | 3,391,063 | |
| | | | | | | | | | | | |
Health Care Equipment & Services 3.3% | | | | | | | | | | | | |
d,eCatalent Pharma Solutions Inc., senior note, 144A, 4.875%, 1/15/26 | | | United States | | | | 1,200,000 | | | | 1,222,512 | |
eCentene Corp., | | | | | | | | | | | | |
senior note, 4.25%, 12/15/27 | | | United States | | | | 400,000 | | | | 413,690 | |
dsenior note, 144A, 5.375%, 6/01/26 | | | United States | | | | 1,000,000 | | | | 1,040,725 | |
dsenior note, 144A, 5.375%, 8/15/26 | | | United States | | | | 1,000,000 | | | | 1,044,275 | |
CHS/Community Health Systems Inc., | | | | | | | | | | | | |
d senior note, 144A, 8.125%, 6/30/24 | | | United States | | | | 900,000 | | | | 605,803 | |
dsenior secured note, 144A, 6.625%, 2/15/25 | | | United States | | | | 500,000 | | | | 471,250 | |
esenior secured note, first lien, 6.25%, 3/31/23 | | | United States | | | | 700,000 | | | | 660,737 | |
d,eMEDNAX Inc., senior note, 144A, 6.25%, 1/15/27 | | | United States | | | | 1,400,000 | | | | 1,404,837 | |
d,eMPH Acquisition Holdings LLC, senior note, 144A, 7.125%, 6/01/24 | | | United States | | | | 1,300,000 | | | | 1,213,855 | |
dOrtho-Clinical Diagnostics Inc./Ortho-Clinical Diagnostics SA, senior note, 144A, 7.375%, 6/01/25 | | | United States | | | | 300,000 | | | | 305,438 | |
d,eTenet Healthcare Corp., senior secured note, 144A, 4.875%, 1/01/26 | | | United States | | | | 500,000 | | | | 490,490 | |
| | | | | | | | | | | | |
| | | | | | | | | | | 8,873,612 | |
| | | | | | | | | | | | |
Household & Personal Products 0.2% | | | | | | | | | | | | |
d,ePrestige Brands Inc., senior note, 144A, 5.125%, 1/15/28 | | | United States | | | | 500,000 | | | | 493,750 | |
| | | | | | | | | | | | |
Insurance 0.6% | | | | | | | | | | | | |
d,eAlliant Holdings Intermediate LLC/Alliant Holdings Co-Issuer, senior note, 144A, 6.75%, 10/15/27 | | | United States | | | | 1,500,000 | | | | 1,497,465 | |
| | | | | | | | | | | | |
| | | | |
| | | |
14 | | Semiannual Report | | franklintempleton.com |
FRANKLIN LIMITED DURATION INCOME TRUST
STATEMENT OF INVESTMENTS (UNAUDITED)
| | | | | | | | | | | | |
| | | | Country | | |
| Principal
Amount |
* | | | Value | |
| | | |
Corporate Bonds (continued) | | | | | | | | | | | | |
Materials 7.3% | | | | | | | | | | | | |
dArdagh Packaging Finance PLC/Ardagh Holdings USA Inc., | | | | | | | | | | | | |
senior note, 144A, 5.25%, 8/15/27 | | | Luxembourg | | | $ | 600,000 | | | $ | 589,986 | |
senior secured note, first lien, 144A, 5.25%, 4/30/25 | | | Luxembourg | | | | 600,000 | | | | 616,875 | |
dCleveland-Cliffs Inc., | | | | | | | | | | | | |
secured note, 144A, 9.875%, 10/17/25 | | | United States | | | | 300,000 | | | | 315,248 | |
senior secured note, 144A, 6.75%, 3/15/26 | | | United States | | | | 1,200,000 | | | | 1,161,000 | |
eCrown Americas LLC/Crown Americas Capital Corp. VI, senior note, 4.75%, 2/01/26 | | | United States | | | | 500,000 | | | | 511,295 | |
d,eFMG Resources (August 2006) Pty. Ltd., | | | | | | | | | | | | |
senior note, 144A, 4.75%, 5/15/22 | | | Australia | | | | 700,000 | | | | 715,046 | |
senior note, 144A, 5.125%, 3/15/23 | | | Australia | | | | 600,000 | | | | 618,369 | |
dIlluminate Buyer LLC/Illuminate Holdings IV Inc., senior note, 144A, 9.00%, 7/01/28 | | | United States | | | | 1,000,000 | | | | 1,045,000 | |
dMauser Packaging Solutions Holding Co., | | | | | | | | | | | | |
senior note, 144A, 8.50%, 4/15/24 | | | United States | | | | 500,000 | | | | 525,625 | |
esenior note, 144A, 7.25%, 4/15/25 | | | United States | | | | 1,500,000 | | | | 1,364,610 | |
d,eNeon Holdings Inc., senior note, 144A, 10.125%, 4/01/26 | | | United States | | | | 1,500,000 | | | | 1,496,250 | |
d,eNew Enterprise Stone & Lime Co., senior note, 144A, 6.25%, 3/15/26 | | | United States | | | | 1,500,000 | | | | 1,512,840 | |
d,eOCI NV, senior note, 144A, 6.625%, 4/15/23 | | | Netherlands | | | | 400,000 | | | | 404,000 | |
dOlin Corp., senior note, 144A, 9.50%, 6/01/25 | | | United States | | | | 200,000 | | | | 223,375 | |
dOwens-Brockway Glass Container Inc., | | | | | | | | | | | | |
esenior note, 144A, 5.00%, 1/15/22 | | | United States | | | | 146,000 | | | | 146,325 | |
esenior note, 144A, 5.875%, 8/15/23 | | | United States | | | | 400,000 | | | | 414,042 | |
senior note, 144A, 6.625%, 5/13/27 | | | United States | | | | 500,000 | | | | 520,938 | |
d,iPetra Diamonds U.S. Treasury PLC, secured note, second lien, 144A, 7.25%, 5/01/22 | | | South Africa | | | | 1,200,000 | | | | 474,000 | |
d,ePlastipak Holdings Inc., senior note, 144A, 6.25%, 10/15/25 | | | United States | | | | 1,500,000 | | | | 1,459,687 | |
dRain CII Carbon LLC/CII Carbon Corp., senior note, second lien, 144A, 7.25%, 4/01/25 | | | United States | | | | 600,000 | | | | 577,869 | |
dReynolds Group Issuer Inc./Reynolds Group Issuer LLC/Reynolds Group Issuer Luxembourg SA, | | | | | | | | | | | | |
esenior note, 144A, 7.00%, 7/15/24 | | | United States | | | | 100,000 | | | | 100,516 | |
esenior secured note, first lien, 144A, 5.125%, 7/15/23 | | | United States | | | | 400,000 | | | | 405,278 | |
ksenior secured note, first lien, 144A, FRN, 4.719%, (3-month USD LIBOR + 3.50%), 7/15/21 | | | United States | | | | 400,000 | | | | 398,126 | |
d,eSealed Air Corp., | | | | | | | | | | | | |
senior bond, 144A, 5.125%, 12/01/24 | | | United States | | | | 500,000 | | | | 535,312 | |
senior bond, 144A, 5.50%, 9/15/25 | | | United States | | | | 600,000 | | | | 647,187 | |
dStandard Industries Inc., senior bond, 144A, 5.00%, 2/15/27 | | | United States | | | | 300,000 | | | | 304,622 | |
d,eSunCoke Energy Partners LP/SunCoke Energy Partners Finance Corp., senior note, 144A, 7.50%, 6/15/25 | | | United States | | | | 1,500,000 | | | | 1,272,472 | |
d,eTPC Group Inc., secured note, 144A, 10.50%, 8/01/24 | | | United States | | | | 600,000 | | | | 538,188 | |
d,eTrivium Packaging Finance BV, senior note, 144A, 8.50%, 8/15/27 | | | Netherlands | | | | 800,000 | | | | 856,852 | |
| | | | | | | | | | | | |
| | | | | | | | | | | 19,750,933 | |
| | | | | | | | | | | | |
Media & Entertainment 5.6% | | | | | | | | | | | | |
d,eBanijay Entertainment SASU, senior note, 144A, 5.375%, 3/01/25 | | | France | | | | 2,000,000 | | | | 1,961,250 | |
eClear Channel Worldwide Holdings Inc., | | | | | | | | | | | | |
senior note, 9.25%, 2/15/24 | | | United States | | | | 596,000 | | | | 554,420 | |
dsenior secured note, first lien, 144A, 5.125%, 8/15/27 | | | United States | | | | 600,000 | | | | 577,056 | |
| | | | |
| | | |
| franklintempleton.com | | Semiannual Report | | 15 |
FRANKLIN LIMITED DURATION INCOME TRUST
STATEMENT OF INVESTMENTS (UNAUDITED)
| | | | | | | | | | | | |
| | | | Country | | |
| Principal
Amount |
* | | | Value | |
| | | |
Corporate Bonds (continued) | | | | | | | | | | | | |
Media & Entertainment (continued) | | | | | | | | | | | | |
eCSC Holdings LLC, | | | | | | | | | | | | |
senior bond, 5.25%, 6/01/24 | | | United States | | | $ | 500,000 | | | $ | 532,237 | |
senior note, 6.75%, 11/15/21 | | | United States | | | | 1,000,000 | | | | 1,052,525 | |
dsenior secured note, first lien, 144A, 5.50%, 5/15/26 | | | United States | | | | 1,000,000 | | | | 1,029,275 | |
dDiamond Sports Group LLC/Diamond Sports Finance Co., | | | | | | | | | | | | |
first lien, 144A, 5.375%, 8/15/26 | | | United States | | | | 400,000 | | | | 291,968 | |
esenior note, 144A, 6.625%, 8/15/27 | | | United States | | | | 500,000 | | | | 269,265 | |
d,eGray Escrow Inc., senior note, 144A, 7.00%, 5/15/27 | | | United States | | | | 400,000 | | | | 411,060 | |
d,eiHeartCommunications Inc., senior secured note, first lien, 144A, 5.25%, 8/15/27 | | | United States | | | | 700,000 | | | | 671,433 | |
d,eLCPR Senior Secured Financing DAC, senior secured note, first lien, 144A, 6.75%, 10/15/27 | | | United States | | | | 700,000 | | | | 715,183 | |
d,eLive Nation Entertainment Inc., senior note, 144A, 4.75%, 10/15/27 | | | United States | | | | 500,000 | | | | 431,303 | |
dMatch Group Inc., senior note, 144A, 4.625%, 6/01/28 | | | United States | | | | 500,000 | | | | 507,763 | |
dNetflix Inc., senior note, 144A, 3.625%, 6/15/25 | | | United States | | | | 1,100,000 | | | | 1,113,062 | |
d,eNexstar Broadcasting Inc., | | | | | | | | | | | | |
senior note, 144A, 5.625%, 8/01/24 | | | United States | | | | 500,000 | | | | 505,053 | |
senior note, 144A, 5.625%, 7/15/27 | | | United States | | | | 1,000,000 | | | | 1,002,530 | |
d,eScripps Escrow Inc., senior note, 144A, 5.875%, 7/15/27 | | | United States | | | | 500,000 | | | | 474,595 | |
dSirius XM Radio Inc., senior note, 144A, 4.625%, 7/15/24 | | | United States | | | | 600,000 | | | | 617,064 | |
dSix Flags Theme Parks Inc., senior secured note, first lien, 144A, 7.00%, 7/01/25 | | | United States | | | | 400,000 | | | | 415,250 | |
dUnivision Communications Inc., | | | | | | | | | | | | |
senior note, 144A, 6.625%, 6/01/27 | | | United States | | | | 500,000 | | | | 479,375 | |
senior secured note, first lien, 144A, 9.50%, 5/01/25 | | | United States | | | | 1,200,000 | | | | 1,278,000 | |
d,eVirgin Media Secured Finance PLC, senior secured bond, first lien, 144A, 5.50%, 8/15/26 | | | United Kingdom | | | | 400,000 | | | | 410,338 | |
| | | | | | | | | | | | |
| | | | | | | | | | | 15,300,005 | |
| | | | | | | | | | | | |
Pharmaceuticals, Biotechnology & Life Sciences 2.3% | | | | | | | | | | | | |
d,eAvantor Inc., senior secured note, first lien, 144A, 6.00%, 10/01/24 | | | United States | | | | 1,100,000 | | | | 1,150,600 | |
d,eBausch Health Americas Inc., senior note, 144A, 9.25%, 4/01/26 | | | United States | | | | 1,500,000 | | | | 1,629,300 | |
d,eBausch Health Cos. Inc., senior bond, 144A, 6.125%, 4/15/25 | | | United States | | | | 300,000 | | | | 304,704 | |
d,eEndo Dac/Endo Finance LLC/Endo Finco Inc., | | | | | | | | | | | | |
secured note, second lien, 144A, 9.50%, 7/31/27 | | | United States | | | | 492,000 | | | | 522,848 | |
senior note, 144A, 6.00%, 6/30/28 | | | United States | | | | 713,000 | | | | 463,450 | |
dHorizon Therapeutics USA Inc., senior note, 144A, 5.50%, 8/01/27 | | | United States | | | | 1,100,000 | | | | 1,146,266 | |
d,ePar Pharmaceutical Inc., senior secured note, 144A, 7.50%, 4/01/27 | | | United States | | | | 203,000 | | | | 208,998 | |
d,eTeva Pharmaceutical Finance Netherlands III BV, senior note, 144A, 7.125%, 1/31/25 | | | Israel | | | | 900,000 | | | | 959,823 | |
| | | | | | | | | | | | |
| | | | | | | | | | | 6,385,989 | |
| | | | | | | | | | | | |
Real Estate 1.0% | | | | | | | | | | | | |
d,eFive Point Operating Co. LP/Five Point Capital Corp., senior note, 144A, 7.875%, 11/15/25 | | | United States | | | | 1,000,000 | | | | 948,115 | |
eMPT Operating Partnership LP/MPT Finance Corp., | | | | | | | | | | | | |
senior bond, 5.25%, 8/01/26 | | | United States | | | | 300,000 | | | | 312,122 | |
senior note, 6.375%, 3/01/24 | | | United States | | | | 700,000 | | | | 722,095 | |
d,eVICI Properties LP/VICI Note Co. Inc., senior note, 144A, 3.75%, 2/15/27 | | | United States | | | | 700,000 | | | | 659,204 | |
| | | | | | | | | | | | |
| | | | | | | | | | | 2,641,536 | |
| | | | | | | | | | | | |
| | | | |
| | | |
16 | | Semiannual Report | | franklintempleton.com |
FRANKLIN LIMITED DURATION INCOME TRUST
STATEMENT OF INVESTMENTS (UNAUDITED)
| | | | | | | | | | | | |
| | | | Country | | |
| Principal
Amount |
* | | | Value | |
| | | |
Corporate Bonds (continued) | | | | | | | | | | | | |
Retailing 0.2% | | | | | | | | | | | | |
d,eLithia Motors Inc., senior note, 144A, 4.625%, 12/15/27 | | | United States | | | $ | 400,000 | | | $ | 397,000 | |
dParty City Holdings Inc., senior note, 144A, 6.625%, 8/01/26 | | | United States | | | | 1,100,000 | | | | 247,500 | |
| | | | | | | | | | | | |
| | | | | | | | | | | 644,500 | |
| | | | | | | | | | | | |
Software & Services 0.4% | | | | | | | | | | | | |
d,eCamelot Finance SA, senior note, 144A, 4.50%, 11/01/26 | | | United States | | | | 700,000 | | | | 699,888 | |
dGartner Inc., senior note, 144A, 4.50%, 7/01/28 | | | United States | | | | 500,000 | | | | 507,100 | |
| | | | | | | | | | | | |
| | | | | | | | | | | 1,206,988 | |
| | | | | | | | | | | | |
Technology Hardware & Equipment 1.6% | | | | | | | | | | | | |
d,eBlackboard Inc., secured note, second lien, 144A, 10.375%, 11/15/24 | | | United States | | | | 1,600,000 | | | | 1,565,000 | |
CDW LLC/CDW Finance Corp., senior note, 4.125%, 5/01/25 | | | United States | | | | 900,000 | | | | 905,063 | |
d,ePresidio Holdings Inc., senior note, 144A, 8.25%, 2/01/28 | | | United States | | | | 400,000 | | | | 401,250 | |
d,eTempo Acquisition LLC/Tempo Acquisition Finance Corp., senior note, 144A, 6.75%, 6/01/25 | | | United States | | | | 1,500,000 | | | | 1,523,422 | |
| | | | | | | | | | | | |
| | | | | | | | | | | 4,394,735 | |
| | | | | | | | | | | | |
Telecommunication Services 3.1% | | | | | | | | | | | | |
dAltice France Holding SA, | | | | | | | | | | | | |
senior note, 144A, 10.50%, 5/15/27 | | | Luxembourg | | | | 1,700,000 | | | | 1,880,072 | |
senior note, 144A, 6.00%, 2/15/28 | | | Luxembourg | | | | 300,000 | | | | 285,377 | |
gDigicel Group 0.5 Ltd., | | | | | | | | | | | | |
dsenior note, 144A, PIK, 8.00%, 4/01/25 | | | Jamaica | | | | 186,560 | | | | 51,304 | |
senior note, first lien, PIK, 10.00%, 4/01/24 | | | Jamaica | | | | 580,000 | | | | 403,071 | |
d,eDKT Finance ApS, senior secured note, first lien, 144A, 9.375%, 6/17/23 | | | Denmark | | | | 1,500,000 | | | | 1,513,125 | |
eSprint Corp., | | | | | | | | | | | | |
senior bond, 7.875%, 9/15/23 | | | United States | | | | 1,000,000 | | | | 1,127,495 | |
senior bond, 7.125%, 6/15/24 | | | United States | | | | 300,000 | | | | 339,282 | |
senior note, 7.25%, 9/15/21 | | | United States | | | | 500,000 | | | | 524,752 | |
eT-Mobile USA Inc., | | | | | | | | | | | | |
senior bond, 6.50%, 1/15/24 | | | United States | | | | 500,000 | | | | 512,408 | |
senior note, 4.00%, 4/15/22 | | | United States | | | | 700,000 | | | | 718,994 | |
dZayo Group Holdings Inc., senior note, 144A, 4.00%, 3/01/27 | | | United States | | | | 1,000,000 | | | | 950,780 | |
| | | | | | | | | | | | |
| | | | | | | | | | | 8,306,660 | |
| | | | | | | | | | | | |
Transportation 0.9% | | | | | | | | | | | | |
d,eDAE Funding LLC, | | | | | | | | | | | | |
senior note, 144A, 4.00%, 8/01/20 | | | United Arab Emirates | | | | 800,000 | | | | 796,888 | |
senior note, 144A, 4.50%, 8/01/22 | | | United Arab Emirates | | | | 400,000 | | | | 382,246 | |
senior note, 144A, 5.75%, 11/15/23 | | | United Arab Emirates | | | | 200,000 | | | | 191,229 | |
d,hMileage Plus Holdings LLC/Mileage Plus Intellectual Property Assets Ltd., senior secured note, first lien, 144A, 6.50%, 6/20/27 | | | United States | | | | 1,200,000 | | | | 1,206,000 | |
| | | | | | | | | | | | |
| | | | | | | | | | | 2,576,363 | |
| | | | | | | | | | | | |
Utilities 2.6% | | | | | | | | | | | | |
dCalpine Corp., senior note, 144A, 5.125%, 3/15/28 | | | United States | | | | 1,500,000 | | | | 1,469,437 | |
Clearway Energy Operating LLC, | | | | | | | | | | | | |
esenior bond, 5.00%, 9/15/26 | | | United States | | | | 1,000,000 | | | | 1,016,060 | |
senior note, 5.75%, 10/15/25 | | | United States | | | | 300,000 | | | | 312,302 | |
d,esenior note, 144A, 4.75%, 3/15/28 | | | United States | | | | 300,000 | | | | 306,264 | |
| | | | |
| | | |
| franklintempleton.com | | Semiannual Report | | 17 |
FRANKLIN LIMITED DURATION INCOME TRUST
STATEMENT OF INVESTMENTS (UNAUDITED)
| | | | | | | | | | | | |
| | | | Country | | |
| Principal
Amount |
* | | | Value | |
| | | |
Corporate Bonds (continued) | | | | | | | | | | | | |
Utilities (continued) | | | | | | | | | | | | |
d,eInterGen NV, secured bond, 144A, 7.00%, 6/30/23 | | | Netherlands | | | $ | 1,500,000 | | | $ | 1,447,500 | |
Talen Energy Supply LLC, senior note, 6.50%, 6/01/25 | | | United States | | | | 1,600,000 | | | | 1,083,144 | |
d,eVistra Operations Co. LLC, senior note, 144A, 5.625%, 2/15/27 | | | United States | | | | 1,300,000 | | | | 1,336,972 | |
| | | | | | | | | | | | |
| | | | | | | | | | | 6,971,679 | |
| | | | | | | | | | | | |
Total Corporate Bonds (Cost $152,471,428) | | | | | | | | | | | 145,451,278 | |
| | | | | | | | | | | | |
| | | |
k,lSenior Floating Rate Interests 39.8% | | | | | | | | | | | | |
Automobiles & Components 1.9% | | | | | | | | | | | | |
Adient US LLC, | | | | | | | | | | | | |
Initial Term Loans, 4.178%, (1-month USD LIBOR + 4.00%), 5/06/24 | | | United States | | | | 1,602,728 | | | | 1,547,434 | |
Initial Term Loans, 4.474%, (3-month USD LIBOR + 4.00%), 5/06/24 | | | United States | | | | 541,462 | | | | 522,781 | |
Clarios Global LP (Power Solutions), Initial Dollar Term Loan, 3.678%, (1-month USD LIBOR + 3.50%), 4/30/26 | | | United States | | | | 1,805,213 | | | | 1,725,482 | |
Thor Industries Inc., Initial USD Term Loans, 3.94%, (1-month USD LIBOR + 3.75%), 2/01/26 | | | United States | | | | 1,271,289 | | | | 1,251,227 | |
| | | | | | | | | | | | |
| | | | | | | | | | | 5,046,924 | |
| | | | | | | | | | | | |
Capital Goods 2.8% | | | | | | | | | | | | |
AI Convoy US Borrower LLC, Facility B Loan (USD), 4.65%, (6-month USD LIBOR + 3.50%), 1/15/27 | | | United States | | | | 748,125 | | | | 716,797 | |
gAlloy Finco Ltd., Term Loan B, PIK, 14.00%, 3/06/25 | | | United States | | | | 643,002 | | | | 279,706 | |
Altra Industrial Motion Corp., Term Loan, 2.178%, (1-month USD LIBOR + 2.00%), 10/01/25 | | | United States | | | | 922,129 | | | | 880,634 | |
Dynasty Acquisition Co. Inc., | | | | | | | | | | | | |
Initial Term B-1 Loan, 3.808%, (3-month USD LIBOR + 3.50%), 4/04/26 | | | United States | | | | 813,753 | | | | 701,862 | |
Initial Term B-2 Loan (CAD), 3.808%, (3-month USD LIBOR + 3.50%), 4/04/26 | | | United States | | | | 437,502 | | | | 377,345 | |
Navistar Inc., Tranche B Term Loan, 3.70%, (1-month USD LIBOR + 3.50%), 11/06/24 | | | United States | | | | 3,084,921 | | | | 2,930,675 | |
bOnsite Rental Group Operations Pty. Ltd., Term B Loan, 5.50%, (1-month USD LIBOR + 4.50%), 10/25/22 | | | Australia | | | | 696,715 | | | | 584,370 | |
m,nVertical US Newco Inc (thyssenkrupp Elevator), Term Loan, TBD, 7/01/27 | | | United States | | | | 1,236,519 | | | | 1,236,519 | |
| | | | | | | | | | | | |
| | | | | | | | | | | 7,707,908 | |
| | | | | | | | | | | | |
Commercial & Professional Services 1.3% | | | | | | | | | | | | |
Harsco Corp., Term Loan B-2, 3.25%, (1-month USD LIBOR + 2.25%), 12/10/24 | | | United States | | | | 1,159,780 | | | | 1,139,484 | |
Intrado Corp., Term B Loans, 5.00%, (3-month USD LIBOR + 4.00%), 10/10/24 | | | United States | | | | 261,611 | | | | 225,247 | |
Pitney Bowes Inc., Incremental Tranche Term B Loans, 5.68%, (1-month USD LIBOR + 5.50%), 1/07/25 | | | United States | | | | 888,750 | | | | 750,994 | |
Ventia Pty. Ltd., Term B Loans, 5.00%, (3-month USD LIBOR + 4.00%), 5/21/26 | | | Australia | | | | 1,510,253 | | | | 1,480,047 | |
| | | | | | | | | | | | |
| | | | | | | | | | | 3,595,772 | |
| | | | | | | | | | | | |
Consumer Durables & Apparel 0.6% | | | | | | | | | | | | |
Champ Acquisition Corp., Initial Term Loan, 6.572%, (3-month USD LIBOR + 5.50%), 12/21/25 | | | United States | | | | 493,639 | | | | 468,751 | |
Playtika Holding Corp., Term B Loans, 7.072%, (3-month USD LIBOR + 6.00%), 12/10/24 | | | United States | | | | 1,199,250 | | | | 1,201,499 | |
| | | | | | | | | | | | |
| | | | | | | | | | | 1,670,250 | |
| | | | | | | | | | | | |
| | | | |
| | | |
18 | | Semiannual Report | | franklintempleton.com |
FRANKLIN LIMITED DURATION INCOME TRUST
STATEMENT OF INVESTMENTS (UNAUDITED)
| | | | | | | | | | | | |
| | | | Country | | |
| Principal
Amount |
* | | | Value | |
| | | |
k,lSenior Floating Rate Interests (continued) | | | | | | | | | | | | |
Consumer Services 2.8% | | | | | | | | | | | | |
o24 Hour Fitness Worldwide Inc, New Money, 11.00%, (3-month USD LIBOR + 10.00%), 6/22/21 | | | United States | | | $ | 237,996 | | | $ | 230,857 | |
i,n24 Hour Fitness Worldwide Inc., Term Loan, TBD, 5/30/25 | | | United States | | | | 2,213,145 | | | | 575,418 | |
Aristocrat Technologies Inc., Term B-3 Loans, 2.859%, (3-month USD LIBOR + 1.75%), 10/19/24 | | | United States | | | | 820,014 | | | | 782,089 | |
Caesars Resort Collection LLC, | | | | | | | | | | | | |
Term B Loans, 2.928%, (1-month USD LIBOR + 2.75%), 12/22/24 | | | United States | | | | 1,703,208 | | | | 1,526,263 | |
m,nTerm Loan, TBD, 6/19/25 | | | United States | | | | 215,900 | | | | 202,059 | |
Eldorado Resorts Inc., Initial Term Loan, 3.25%, (3-month USD LIBOR + 2.25%), 4/17/24 | | | United States | | | | 975,671 | | | | 971,860 | |
KFC Holding Co./Pizza Hut Holdings LLC/Taco Bell of America LLC (Yum Brands), Term Loan B, 1.944%, (1-month USD LIBOR + 1.75%), 4/03/25 | | | United States | | | | 1,678,020 | | | | 1,622,087 | |
NASCAR Holdings Inc., Initial Term Loans, 2.93%, (1-month USD LIBOR + 2.75%), 10/18/26 | | | United States | | | | 756,849 | | | | 728,845 | |
Station Casinos LLC, Term B-1 Facility Loans, 2.50%, (1-month USD LIBOR + 2.25%), 2/07/27 | | | United States | | | | 993,478 | | | | 914,827 | |
| | | | | | | | | | | | |
| | | | | | | | | | | 7,554,305 | |
| | | | | | | | | | | | |
Diversified Financials 1.0% | | | | | | | | | | | | |
Asurion LLC, | | | | | | | | | | | | |
AM No. 14 Replacement B-4 Term Loans, 3.178%, (1-month USD LIBOR + 3.00%), 8/04/22 | | | United States | | | | 1,626,827 | | | | 1,587,683 | |
Replacement B-6 Term Loans, 3.178%, (1-month USD LIBOR + 3.00%), 11/03/23 | | | United States | | | | 328,130 | | | | 318,286 | |
mFirst Eagle Holdings Inc., Initial Term Loan, 2/01/27 | | | United States | | | | 498,747 | | | | 480,875 | |
Maverick Purchaser Sub LLC, Initial Term Loans, 4.178%, (1-month USD LIBOR + 4.00%), 1/31/27 | | | United States | | | | 300,000 | | | | 296,250 | |
| | | | | | | | | | | | |
| | | | | | | | | | | 2,683,094 | |
| | | | | | | | | | | | |
Energy 0.3% | | | | | | | | | | | | |
Buckeye Partners LP, Initial Term Loans, 2.923%, (1-month USD LIBOR + 2.75%), 11/01/26 | | | United States | | | | 759,429 | | | | 732,659 | |
| | | | | | | | | | | | |
Food & Staples Retailing 0.1% | | | | | | | | | | | | |
Whatabrands LLC, 2020 Refinancing Term Loans, 2.925%, (1-month USD LIBOR + 2.75%), 8/02/26 | | | United States | | | | 243,711 | | | | 233,811 | |
| | | | | | | | | | | | |
Food, Beverage & Tobacco 1.5% | | | | | | | | | | | | |
B&G Foods Inc., Tranche B-4 Term Loan, 2.678%, (1-month USD LIBOR + 2.50%), 10/10/26 | | | United States | | | | 317,552 | | | | 314,277 | |
CSM Bakery Supplies LLC, Term, 7.25%, (3-month USD LIBOR + 6.25%), 1/04/22 | | | United States | | | | 2,025,000 | | | | 1,966,781 | |
JBS USA Lux SA, New Term Loans, 3.072%, (3-month USD LIBOR + 2.00%), 5/01/26 | | | United States | | | | 1,741,687 | | | | 1,669,843 | |
| | | | | | | | | | | | |
| | | | | | | | | | | 3,950,901 | |
| | | | | | | | | | | | |
Health Care Equipment & Services 2.2% | | | | | | | | | | | | |
Air Medical Group Holdings Inc., 2018 New Term Loans, 5.25%, (3-month USD LIBOR + 4.25%), 3/14/25 | | | United States | | | | 620,219 | | | | 594,081 | |
Catalent Pharma Solutions Inc., Dollar Term B-2 Loan, 3.25%, (1-month USD LIBOR + 2.25%), 5/17/26 | | | United States | | | | 165,290 | | | | 163,637 | |
DaVita Inc., Tranche B-1 Term Loan, 1.928%, (1-month USD LIBOR + 1.75%), 8/12/26 | | | United States | | | | 950,531 | | | | 922,966 | |
| | | | |
| | | |
| franklintempleton.com | | Semiannual Report | | 19 |
FRANKLIN LIMITED DURATION INCOME TRUST
STATEMENT OF INVESTMENTS (UNAUDITED)
| | | | | | | | | | | | |
| | | | Country | | |
| Principal
Amount |
* | | | Value | |
| | | |
k,lSenior Floating Rate Interests (continued) | | | | | | | | | | | | |
Health Care Equipment & Services (continued) | | | | | | | | | | | | |
IQVIA Inc., | | | | | | | | | | | | |
Term B-1 Dollar Loans, 2.50%, (1-month USD LIBOR + 1.75%), 3/07/24 | | | United States | | | $ | 898,405 | | | $ | 877,442 | |
Term B-3 Dollar Loans, 2.058%, (3-month USD LIBOR + 1.75%), 6/11/25 | | | United States | | | | 686,000 | | | | 666,278 | |
Mallinckrodt International Finance SA & Mallinckrodt CB LLC, 2017 Term B Loans, 3.50%, (3-month USD LIBOR + 2.75%), 9/24/24 | | | Luxembourg | | | | 334,459 | | | | 251,263 | |
National Mentor Holdings Inc., | | | | | | | | | | | | |
Initial Term C Loans, 4.43%, (1-month USD LIBOR + 4.25%), 3/08/26 | | | United States | | | | 50,318 | | | | 48,651 | |
Initial Term Loans, 4.43%, (1-month USD LIBOR + 4.25%), 3/08/26 | | | United States | | | | 1,105,136 | | | | 1,068,528 | |
m,nPathway Vet Alliance LLC, | | | | | | | | | | | | |
Initial DDTL Commitment, TBD, 3/31/27 | | | United States | | | | 32,816 | | | | 32,006 | |
Initial Term Loans, TBD, 3/31/27 | | | United States | | | | 403,782 | | | | 393,813 | |
Phoenix Guarantor Inc., Tranche B-1 Term Loan, 3.435%, (1-month USD LIBOR + 3.25%), 3/05/26 | | | United States | | | | 1,094,749 | | | | 1,057,117 | |
| | | | | | | | | | | | |
| | | | | | | | | | | 6,075,782 | |
| | | | | | | | | | | | |
Household & Personal Products 0.4% | | | | | | | | | | | | |
Knowlton Development Corp., Initial Term Loan, 4.058%, (3-month USD LIBOR + 3.75%), 12/21/25 | | | United States | | | | 394,175 | | | | 379,393 | |
Sunshine Luxembourg VII SARL (Nestle Skin Health), Facility B1 Commitments, 5.322%, (6-month USD LIBOR + 4.25%), 9/25/26 | | | Luxembourg | | | | 717,023 | | | | 687,702 | |
| | | | | | | | | | | | |
| | | | | | | | | | | 1,067,095 | |
| | | | | | | | | | | | |
Insurance 0.6% | | | | | | | | | | | | |
Alliant Holdings Intermediate LLC/Alliant Holdings Co-Issuer, Initial Term Loan, 2.928%, (1-month USD LIBOR + 2.75%), 5/10/25 | | | United States | | | | 1,024,771 | | | | 973,533 | |
AssuredPartners Inc., | | | | | | | | | | | | |
2020 February Refinancing Term Loans, 3.678%, (1-month USD LIBOR + 3.50%), 2/13/27 | | | United States | | | | 498,747 | | | | 478,174 | |
June Incremental Term Loan, 5.50%, (1-month USD LIBOR + 4.50%), 2/13/27 | | | United States | | | | 165,728 | | | | 163,242 | |
| | | | | | | | | | | | |
| | | | | | | | | | | 1,614,949 | |
| | | | | | | | | | | | |
Materials 2.4% | | | | | | | | | | | | |
Axalta Coating Systems U.S. Holdings Inc., Term B-3 Dollar Loan, 2.058%, (3-month USD LIBOR + 1.75%), 6/01/24 | | | United States | | | | 2,183,085 | | | | 2,100,309 | |
Berry Global Inc., | | | | | | | | | | | | |
Term W Loans, 2.177%, (1-month USD LIBOR + 2.00%), 10/01/22 | | | United States | | | | 1,090,516 | | | | 1,064,957 | |
Term Y Loans, 2.177%, (1-month USD LIBOR + 2.00%), 7/01/26 | | | United States | | | | 769,372 | | | | 738,871 | |
m,nIlluminate Buyer LLC, Term Loan, TBD, 6/15/27 | | | United States | | | | 711,200 | | | | 701,866 | |
Mauser Packaging Solutions Holding Co., Initial Term Loan, 4.561%, (1-month USD LIBOR + 3.25%), 4/03/24 | | | United States | | | | 997,429 | | | | 900,679 | |
m,nNouryon USA LLC, Term Loan, TBD, 10/01/25 | | | Netherlands | | | | 500,000 | | | | 471,666 | |
Oxbow Carbon LLC, Tranche B Term Loan, 3.928%, (1-month USD LIBOR + 3.75%), 1/04/23 | | | United States | | | | 12,613 | | | | 12,297 | |
Univar USA Inc., Term B-3 Loans, 2.428%, (1-month USD LIBOR + 2.25%), 7/01/24 | | | United States | | | | 538,437 | | | | 520,826 | |
| | | | | | | | | | | | |
| | | | | | | | | | | 6,511,471 | |
| | | | | | | | | | | | |
| | | | |
| | | |
20 | | Semiannual Report | | franklintempleton.com |
FRANKLIN LIMITED DURATION INCOME TRUST
STATEMENT OF INVESTMENTS (UNAUDITED)
| | | | | | | | | | | | |
| | | Country | | |
| Principal
Amount* |
| | | Value | |
| | | |
k,lSenior Floating Rate Interests (continued) | | | | | | | | | | | | |
Media & Entertainment 4.3% | | | | | | | | | | | | |
Ancestry.com Operations Inc., Non-Extended Term Loans, 4.75%, (1-month USD LIBOR + 3.75%), 10/19/23 | | | United States | | | $ | 1,273,314 | | | $ | 1,209,649 | |
Charter Communications Operating LLC (CCO Safari III LLC), Term B-2 Loan, 1.93%, (1-month USD LIBOR + 1.75%), 2/01/27 | | | United States | | | | 480,082 | | | | 462,745 | |
CSC Holdings LLC, March 2017 Incremental Term Loans, 2.435%, (1-month USD LIBOR + 2.25%), 7/17/25 | | | United States | | | | 2,527,482 | | | | 2,403,636 | |
Diamond Sports Group LLC, Term Loan, 3.43%, (1-month USD LIBOR + 3.25%), 8/24/26 | | | United States | | | | 919,493 | | | | 752,835 | |
Gray Television Inc., Term B-2 Loan, 2.423%, (1-month USD LIBOR + 2.25%), 2/07/24 | | | United States | | | | 2,568,789 | | | | 2,485,303 | |
Lions Gate Capital Holdings LLC, Term A Loan, 1.928%, (1-month USD LIBOR + 1.75%), 3/22/23 | | | Canada | | | | 1,330,733 | | | | 1,277,503 | |
Mediacom Illinois LLC, Tranche N Term Loan, 1.86%, (1-week USD LIBOR + 1.75%), 2/15/24 | | | United States | | | | 554,874 | | | | 543,776 | |
Mission Broadcasting Inc., Term B-3 Loan, 2.423%, (1-month USD LIBOR + 2.25%), 1/17/24 | | | United States | | | | 111,216 | | | | 105,933 | |
Nexstar Broadcasting Inc., Term B-3 Loan, 2.434%, (1-month USD LIBOR + 2.25%), 10/26/25 | | | United States | | | | 432,312 | | | | 411,777 | |
Sinclair Television Group Inc., Tranche B Term Loans, 1/03/24 | | | United States | | | | 1,935,838 | | | | 1,855,178 | |
WideOpenWest Finance LLC, Term B Loan, 4.25%, (1-month USD LIBOR + 3.25%), 8/19/23 | | | United States | | | | 316,067 | | | | 302,371 | |
| | | | | | | | | | | | |
| | | | | | | | | | | 11,810,706 | |
| | | | | | | | | | | | |
| | | |
Pharmaceuticals, Biotechnology & Life Sciences 1.8% | | | | | | | | | | | | |
Grifols Worldwide Operations USA Inc., Dollar Tranche B Term Loan, 2.109%, (1-week USD LIBOR + 2.00%), 11/15/27 | | | United States | | | | 1,450,531 | | | | 1,400,770 | |
Horizon Pharma Inc., Seventh Amendment Refinancing Term Loans, 2.438%, (1-month USD LIBOR + 2.25%), 5/22/26 | | | United States | | | | 1,057,049 | | | | 1,026,658 | |
Syneos Health Inc., Initial Term B Loans, 1.924% - 1.928%, (1-month USD LIBOR + 1.75%), 8/01/24 | | | United States | | | | 934,061 | | | | 910,709 | |
Valeant Pharmaceuticals International, Initial Term Loans, 3.19%, (1-month USD LIBOR + 3.00%), 6/02/25 | | | United States | | | | 1,747,454 | | | | 1,700,491 | |
| | | | | | | | | | | | |
| | | | | | | | | | | 5,038,628 | |
| | | | | | | | | | | | |
| | | |
Retailing 3.0% | | | | | | | | | | | | |
Michaels Stores, Inc., | | | | | | | | | | | | |
2018 New Replacement Term B Loan, 3.50%, (1-month USD LIBOR + 2.50%), 1/28/23 | | | United States | | | | 544,697 | | | | 500,668 | |
2018 New Replacement Term B Loan, 3.558% - 3.568%, (3-month USD LIBOR + 2.50%), 1/28/23 | | | United States | | | | 640,741 | | | | 588,948 | |
Bass Pro Group LLC, Initial Term Loans, 6.072%, (3-month USD LIBOR + 5.00%), 9/25/24 | | | United States | | | | 994,885 | | | | 961,556 | |
General Nutrition Centers Inc., | | | | | | | | | | | | |
FILO, 10.00%, (1-month USD LIBOR + 9.00%), 12/30/20 | | | United States | | | | 2,700,000 | | | | 2,619,000 | |
iTranche B-2 Term Loans, 9.500%, (2-month USD LIBOR + 8.75%), 3/04/21 | | | United States | | | | 274,829 | | | | 200,625 | |
| | | | |
| | | |
| franklintempleton.com | | Semiannual Report | | 21 |
FRANKLIN LIMITED DURATION INCOME TRUST
STATEMENT OF INVESTMENTS (UNAUDITED)
| | | | | | | | | | | | |
| | | | Country | | |
| Principal
Amount |
* | | | Value | |
| | | |
k,lSenior Floating Rate Interests (continued) | | | | | | | | | | | | |
Retailing (continued) | | | | | | | | | | | | |
Harbor Freight Tools USA Inc., Refinancing Loans, 3.25%, (1-month USD LIBOR + 2.50%), 8/19/23 | | | United States | | | $ | 808,033 | | | $ | 779,954 | |
PetSmart Inc., Amended Loan, 5.00%, (6-month USD LIBOR + 4.00%), 3/11/22 | | | United States | | | | 785,923 | | | | 777,900 | |
Staples Inc., 2019 Refinancing Term B-1 Loans, 5.687%, (3-month USD LIBOR + 5.00%), 4/12/26 | | | United States | | | | 973,885 | | | | 841,193 | |
Wand NewCo.3 Inc. (Caliber Collision), Initial Term Loan, 4.072%, (3-month USD LIBOR + 3.00%), 2/05/26 | | | United States | | | | 990,025 | | | | 942,999 | |
| | | | | | | | | | | | |
| | | | | | | | | | | 8,212,843 | |
| | | | | | | | | | | | |
Semiconductors & Semiconductor Equipment 0.6% | | | | | | | | | | | | |
ON Semiconductor Corp., 2019 Replacement Term B-4 Loans, 2.178%, (1-month USD LIBOR + 2.00%), 9/18/26 | | | United States | | | | 1,673,238 | | | | 1,611,190 | |
| | | | | | | | | | | | |
Software & Services 6.1% | | | | | | | | | | | | |
Dcert Buyer Inc., Initial Term Loans, 4.178%, (1-month USD LIBOR + 4.00%), 10/16/26 | | | United States | | | | 1,167,404 | | | | 1,133,598 | |
Finastra USA Inc., Dollar Term Loan, 4.50%, (3-month USD LIBOR + 3.50%), 6/13/24 | | | United States | | | | 1,104,023 | | | | 970,621 | |
Go Daddy Operating Co. LLC, Tranche B-2 Term Loan, 1.928%, (1-month USD LIBOR + 1.75%), 2/15/24 | | | United States | | | | 1,539,825 | | | | 1,486,701 | |
Hyland Software Inc., Term Loans, 4.00%, (1-month USD LIBOR + 3.25%), 7/01/24 | | | United States | | | | 994,937 | | | | 969,068 | |
Idera Inc., Initial Term Loans, 5.08%, (3-month USD LIBOR + 4.00%), 6/29/24 | | | United States | | | | 794,332 | | | | 769,178 | |
LegalZoom.com Inc., 2018 Term Loans, 4.678%, (1-month USD LIBOR + 4.50%), 11/21/24 | | | United States | | | | 1,970,000 | | | | 1,930,600 | |
MA Finance Co., Tranche B-4 Term Loans, 5.25%, (3-month USD LIBOR + 4.25%), 5/29/25 | | | United States | | | | 579,425 | | | | 567,836 | |
Neustar Inc., TLB5, 5.572%, (6-month USD LIBOR + 4.50%), 8/08/24 | | | United States | | | | 766,751 | | | | 711,161 | |
Perforce Software Inc., New Term Loan, 3.928%, (1-month USD LIBOR + 3.75%), 7/08/26 | | | United States | | | | 587,050 | | | | 564,057 | |
Quest Software US Holdings Inc., Term Loan B, 5.01%, (3-month USD LIBOR + 4.25%), 5/18/25 | | | United States | | | | 746,212 | | | | 717,608 | |
SS&C Technologies Inc., Term B-5 Loan, 1.928%, (1-month USD LIBOR + 1.75%), 4/16/25 | | | United States | | | | 484,872 | | | | 464,507 | |
Surf Holdings LLC, Dollar Tranche Term Loan, 3.827%, (3-month USD LIBOR + 3.50%), 3/05/27 | | | United States | | | | 995,213 | | | | 958,100 | |
TIBCO Software Inc., Term B-3 Loans, 3.93%, (1-month USD LIBOR + 3.75%), 7/31/26 | | | United States | | | | 1,974,808 | | | | 1,898,285 | |
m,nThe Ultimate Software Group Inc., 2020 Incremental Term Loan, TBD, 5/03/26 | | | United States | | | | 286,352 | | | | 283,565 | |
Verscend Holding Corp., Term B Loans, 4.678%, (1-month USD LIBOR + 4.50%), 7/27/25 | | | United States | | | | 597,212 | | | | 582,281 | |
Vertafore Inc., Initial Term Loans, 3.428%, (1-month USD LIBOR + 3.25%), 7/02/25 | | | United States | | | | 746,212 | | | | 705,637 | |
Waystar (Navicure Inc.), Initial Term Loans, 4.178%, (1-month USD LIBOR + 4.00%), 10/22/26 | | | United States | | | | 498,750 | | | | 482,541 | |
WEX Inc., Term B-3 Loan, 2.428%, (1-month USD LIBOR + 2.25%), 5/17/26 | | | United States | | | | 1,408,801 | | | | 1,352,449 | |
| | | | | | | | | | | | |
| | | | | | | | | | | 16,547,793 | |
| | | | | | | | | | | | |
Technology Hardware & Equipment 0.7% | | | | | | | | | | | | |
CommScope Inc., Initial Term Loans, 3.428%, (1-month USD LIBOR + 3.25%), 4/04/26 | | | United States | | | | 1,940,267 | | | | 1,849,317 | |
| | | | | | | | | | | | |
| | | | |
| | | |
22 | | Semiannual Report | | franklintempleton.com |
FRANKLIN LIMITED DURATION INCOME TRUST
STATEMENT OF INVESTMENTS (UNAUDITED)
| | | | | | | | | | | | |
| | | | Country | | |
| Principal
Amount |
* | | | Value | |
k,lSenior Floating Rate Interests (continued) | | | | | | | | | | | | |
Telecommunication Services 1.8% | | | | | | | | | | | | |
Aventiv Technologies LLC, Initial Term Loan, 5.50%, (3-month USD LIBOR + 4.50%), 11/01/24 | | | United States | | | $ | 1,972,190 | | | $ | 1,647,087 | |
Global Tel*Link Corp., First Lien Term Loan, 4.428%, (1-month USD LIBOR + 4.25%), 11/29/25 | | | United States | | | | 1,968,740 | | | | 1,717,111 | |
Lineage Logistics LLC, Term Loans, 4.00%, (1-month USD LIBOR + 3.00%), 2/27/25 | | | United States | | | | 298,473 | | | | 290,732 | |
T-Mobile USA Inc., Term Loan, 3.178%, (1-month USD LIBOR + 3.00%), 4/01/27 | | | United States | | | | 565,077 | | | | 565,077 | |
Zayo Group Holdings Inc. (Front Range BidCo), Initial Dollar Term Loan, 3.178%, (1-month USD LIBOR + 3.00%), 3/09/27 | | | United States | | | | 710,320 | | | | 675,802 | |
| | | | | | | | | | | | |
| | | | | | | | | | | 4,895,809 | |
| | | | | | | | | | | | |
Transportation 3.0% | | | | | | | | | | | | |
Air Canada, Term Loans, 1.944%, (1-month USD LIBOR + 1.75%), 10/06/23 | | | Canada | | | | 1,408,848 | | | | 1,331,361 | |
Allegiant Travel Co., Class B Term Loan, 3.434%, (3-month USD LIBOR + 3.00%), 2/05/24 | | | United States | | | | 1,975,000 | | | | 1,767,625 | |
Avis Budget Car Rental LLC, Tranche B Term, 2.43%, (1-month USD LIBOR + 2.25%), 8/06/27 | | | United States | | | | 2,176,935 | | | | 1,946,543 | |
Delta Air Lines Inc., Term Loan, 5.51%, (3-month USD LIBOR + 4.75%), 4/29/23 | | | United States | | | | 427,296 | | | | 420,459 | |
JetBlue Airways Corporation, Term Loan, 6.25%, (3-month USD LIBOR + 5.25%), 6/16/24 | | | United States | | | | 659,477 | | | | 647,661 | |
mThe Kenan Advantage Group Inc., | | | | | | | | | | | | |
Initial Canadian Term Loan, 4.00%, (1-month USD LIBOR + 3.00%), 7/29/22 | | | United States | | | | 277,364 | | | | 260,029 | |
Initial U.S. Term Loans, 4.00%, (1-month USD LIBOR + 3.00%), 7/31/22 | | | United States | | | | 1,166,371 | | | | 1,091,286 | |
Westjet Airlines Ltd., Initial Term Loan, 4.00%, (3-month USD LIBOR + 3.00%), 12/11/26 | | | Canada | | | | 856,320 | | | | 695,047 | |
| | | | | | | | | | | | |
| | | | | | | | | | | 8,160,011 | |
| | | | | | | | | | | | |
Utilities 0.6% | | | | | | | | | | | | |
EFS Cogen Holdings I LLC (Linden), | | | | | | | | | | | | |
Term B Advance, 4.25%, (1-month USD LIBOR + 3.25%), 6/28/23 | | | United States | | | | 528,631 | | | | 513,433 | |
Term B Advance, 4.25%, (3-month USD LIBOR + 3.25%), 6/28/23 | | | United States | | | | 1,245,601 | | | | 1,209,790 | |
| | | | | | | | | | | | |
| | | | | | | | | | | 1,723,223 | |
| | | | | | | | | | | | |
Total Senior Floating Rate Interests (Cost $115,118,127) | | | | | | | | | | | 108,294,441 | |
| | | | | | | | | | | | |
| | | |
pMarketplace Loans 3.1% | | | | | | | | | | | | |
Diversified Financials 3.1% | | | | | | | | | | | | |
bLending Club, 6.00%-26.31%, 10/31/21-3/16/25 | | | United States | | | | 9,158,381 | | | | 7,644,281 | |
bLending Club LCX, 6.46%-20.55%, 7/5/22 - 2/10/25 | | | United States | | | | 573,191 | | | | 490,346 | |
bUpgrade, 21.38%-29.69%, 11/12/22-1/3/2025 | | | United States | | | | 194,117 | | | | 179,983 | |
| | | | | | | | | | | | |
Total Marketplace Loans (Cost $9,901,970) | | | | | | | | | | | 8,314,610 | |
| | | | | | | | | | | | |
| | | |
Asset-Backed Securities and Commercial Mortgage-Backed Securities 17.5% | | | | | | | | | | | | |
Banks 2.2% | | | | | | | | | | | | |
Citigroup Commercial Mortgage Trust, 2015-GC27, A5, 3.137%, 2/10/48 | | | United States | | | | 1,520,000 | | | | 1,618,513 | |
qCommercial Mortgage Trust, 2006-GG7, AJ, FRN, 5.807%, 7/10/38 | | | United States | | | | 410,623 | | | | 338,764 | |
CSAIL Commercial Mortgage Trust, 2015-C1, A4, 3.505%, 4/15/50 | | | United States | | | | 1,410,000 | | | | 1,524,276 | |
| | | | |
| | | |
| franklintempleton.com | | Semiannual Report | | 23 |
FRANKLIN LIMITED DURATION INCOME TRUST
STATEMENT OF INVESTMENTS (UNAUDITED)
| | | | | | | | | | | | |
| | | | Country | | |
| Principal
Amount |
* | | | Value | |
| | | |
Asset-Backed Securities and Commercial Mortgage- Backed Securities (continued) | | | | | | | | | | | | |
Banks (continued) | | | | | | | | | | | | |
JPMBB Commercial Mortgage Securities Trust, 2015-C28, A4, 3.227%, 10/15/48 | | | United States | | | $ | 1,410,000 | | | $ | 1,513,259 | |
rMerrill Lynch Mortgage Investors Trust, | | | | | | | | | | | | |
b2003-OPT1, B2, FRN, 4.31%, (1-month USD LIBOR + 4.125%), 7/25/34 | | | United States | | | | 33,301 | | | | 8,370 | |
2005-A6, 2A3, FRN, 0.565%, (1-month USD LIBOR + 0.38%), 8/25/35 | | | United States | | | | 54,869 | | | | 54,739 | |
rMorgan Stanley ABS Capital I Inc. Trust, 2003-NC10, B1, FRN, 5.135%, (1-month USD LIBOR + 4.95%), 10/25/33 | | | United States | | | | 350,442 | | | | 362,892 | |
Wells Fargo Commercial Mortgage Trust, 2014-LC16, A4, 3.548%, 8/15/50 | | | United States | | | | 528,312 | | | | 562,608 | |
| | | | | | | | | | | | |
| | | | | | | | | | | 5,983,421 | |
| | | | | | | | | | | | |
Diversified Financials 15.3% | | | | | | | | | | | | |
d,qCarlyle Global Market Strategies CLO 2014-1 Ltd., 2014-1A, DR, 144A, FRN, 3.735%, 4/17/31 | | | United States | | | | 2,300,000 | | | | 1,949,212 | |
d,rCarlyle U.S. CLO Ltd., 2017-4A, C, 144A, FRN, 4.019%, (3-month USD LIBOR + 2.80%), 1/15/30 | | | United States | | | | 1,000,000 | | | | 888,595 | |
d,qConsumer Loan Underlying Bond CLUB Certificate Issuer Trust I, | | | | | | | | | | | | |
2018-29, PT, 144A, FRN, 17.789%, 12/15/43 | | | United States | | | | 257,031 | | | | 193,964 | |
2019-26, PT, 144A, FRN, 14.393%, 8/15/44 | | | United States | | | | 779,191 | | | | 631,412 | |
2019-31, PT, 144A, FRN, 22.58%, 9/15/44 | | | United States | | | | 722,325 | | | | 581,973 | |
2019-37, PT, 144A, FRN, 14.443%, 10/17/44 | | | United States | | | | 763,897 | | | | 633,079 | |
2019-42, PT, 144A, FRN, 13.345%, 11/15/44 | | | United States | | | | 729,836 | | | | 587,660 | |
2019-51, PT, 144A, FRN, 13.176%, 1/15/45 | | | United States | | | | 889,554 | | | | 741,353 | |
2019-52, PT, 144A, FRN, 13.61%, 1/15/45 | | | United States | | | | 840,032 | | | | 709,111 | |
2019-S1, PT, 144A, FRN, 11.471%, 4/15/44 | | | United States | | | | 763,362 | | | | 611,640 | |
2019-S2, PT, 144A, FRN, 10.056%, 5/16/44 | | | United States | | | | 498,534 | | | | 401,894 | |
2019-S3, PT, 144A, FRN, 10.06%, 6/15/44 | | | United States | | | | 1,289,342 | | | | 1,029,747 | |
2019-S4, PT, 144A, FRN, 8.236%, 8/15/44 | | | United States | | | | 707,336 | | | | 574,226 | |
2019-S5, PT, 144A, FRN, 18.85%, 9/15/44 | | | United States | | | | 688,618 | | | | 566,244 | |
2019-S6, PT, 144A, FRN, 8.475%, 10/17/44 | | | United States | | | | 679,425 | | | | 561,279 | |
2019-S7, PT, 144A, FRN, 9.099%, 12/15/44 | | | United States | | | | 579,708 | | | | 478,527 | |
2019-S8, PT, 144A, FRN, 7.955%, 1/15/45 | | | United States | | | | 666,198 | | | | 553,860 | |
2020-2, PT, 144A, FRN, 13.87%, 3/15/45 | | | United States | | | | 861,909 | | | | 734,453 | |
2020-7, PT, 144A, FRN, 14.48%, 4/17/45 | | | United States | | | | 532,966 | | | | 460,534 | |
d,rDorchester Park CLO Ltd., 2015-1A, CR, 144A, FRN, 2.885%, (3-month USD LIBOR + 1.75%), 4/20/28 | | | United States | | | | 1,000,000 | | | | 971,223 | |
d,qDryden 38 Senior Loan Fund, 2015-38A, DR, 144A, FRN, 4.219%, 7/15/30 | | | United States | | | | 2,500,000 | | | | 2,327,493 | |
d,rDryden 42 Senior Loan Fund, 2016-42A, CR, 144A, FRN, 3.269%, (3-month USD LIBOR + 2.05%), 7/15/30 | | | United States | | | | 2,400,000 | | | | 2,266,149 | |
d,r,sDryden 58 CLO Ltd., 2018-58A, C, 144A, FRN, 2.935%, (3-month USD LIBOR + 1.80%), 7/17/31 | | | United States | | | | 3,000,000 | | | | 2,805,957 | |
r,sFHLMC Structured Agency Credit Risk Debt Notes, | | | | | | | | | | | | |
2014-DN1, M2, FRN, 2.385%, (1-month USD LIBOR + 2.20%), 2/25/24 | | | United States | | | | 583,084 | | | | 585,079 | |
2014-HQ2, M2, FRN, 2.385%, (1-month USD LIBOR + 2.20%), 9/25/24 | | | United States | | | | 264,139 | | | | 266,753 | |
q,sFNMA Connecticut Avenue Securities, | | | | | | | | | | | | |
2017-C03, 1M2, FRN, 3.185%, 10/25/29 | | | United States | | | | 2,101,000 | | | | 2,133,107 | |
2017-C05, 1M2, FRN, 2.385%, 1/25/30 | | | United States | | | | 1,724,479 | | | | 1,703,668 | |
| | | | |
| | | |
24 | | Semiannual Report | | franklintempleton.com |
FRANKLIN LIMITED DURATION INCOME TRUST
STATEMENT OF INVESTMENTS (UNAUDITED)
| | | | | | | | | | | | |
| | | | Country | | |
| Principal
Amount |
* | | | Value | |
| | | |
Asset-Backed Securities and Commercial Mortgage- Backed Securities (continued) | | | | | | | | | | | | |
Diversified Financials (continued) | | | | | | | | | | | | |
d,qMadison Park Funding XXIII Ltd., 2017-23A, D, 144A, FRN, 4.441%, 7/27/30 | | | United States | | | $ | 3,000,000 | | | $ | 2,799,486 | |
d,qMadison Park Funding XXXI Ltd., 2018-31A, D, 144A, FRN, 4.043%, 1/23/31 | | | United States | | | | 1,250,000 | | | | 1,158,333 | |
rMortgageIT Trust, 2004-1, A2, FRN, 1.085%, (1-month USD LIBOR + 0.90%), 11/25/34 | | | United States | | | | 152,884 | | | | 151,145 | |
d,r,sOctagon Investment Partners XXII Ltd., 2014-1A, CRR, 144A, FRN, 2.998%, (3-month USD LIBOR + 1.90%), 1/22/30 | | | United States | | | | 6,050,000 | | | | 5,664,954 | |
rOpteum Mortgage Acceptance Corp. Trust, 2005-4, 1APT, FRN, 0.495%, (1-month USD LIBOR + 0.31%), 11/25/35 | | | United States | | | | 142,223 | | | | 141,726 | |
d,kProsper Pass-Thru Trust III, | | | | | | | | | | | | |
2020-PT1, A, 144A, FRN, 8.796%, 3/15/26 | | | United States | | | | 550,999 | | | | 540,987 | �� |
2020-PT2, A, 144A, FRN, 9.444%, 4/15/26 | | | United States | | | | 582,582 | | | | 577,621 | |
2020-PT3, A, 144A, FRN, 7.183%, 5/15/26 | | | United States | | | | 144,590 | | | | 149,822 | |
rStructured Asset Investment Loan Trust, 2003-BC2, M3, FRN, 5.06%, (1-month USD LIBOR + 4.875%), 4/25/33 | | | United States | | | | 13,987 | | | | 13,258 | |
rStructured Asset Securities Corp., 2005-2XS, 2A2, FRN, 1.673%, (1-month USD LIBOR + 1.50%), 2/25/35 | | | United States | | | | 174,601 | | | | 171,710 | |
qThornburg Mortgage Securities Trust, 2005-1, A3, FRN, 3.647%, 4/25/45 | | | United States | | | | 289,338 | | | | 275,586 | |
d,kUpgrade Master Pass-Thru Trust, 2019-PT2, A, 144A, FRN, 7.727%, 2/15/26 | | | United States | | | | 513,336 | | | | 490,176 | |
dVoya CLO Ltd., | | | | | | | | | | | | |
r2014-1A, BR2, 144A, FRN, 3.035%, (3-month USD LIBOR + 1.90%), 4/18/31 | | | United States | | | | 1,300,000 | | | | 1,212,737 | |
r2014-1A, CR2, 144A, FRN, 3.935%, (3-month USD LIBOR + 2.80%), 4/18/31 | | | United States | | | | 500,000 | | | | 439,081 | |
q2016-3A, CR, 144A, FRN, 4.385%, 10/18/31 | | | United States | | | | 2,000,000 | | | | 1,792,001 | |
| | | | | | | | | | | | |
| | | | | | | | | | | 41,526,815 | |
| | | | | | | | | | | | |
Total Asset-Backed Securities and Commercial Mortgage-Backed Securities (Cost $50,362,529) | | | | | | | | | | | 47,510,236 | |
| | | | | | | | | | | | |
| | | |
Mortgage-Backed Securities 28.7% | | | | | | | | | | | | |
Federal Home Loan Mortgage Corp. (FHLMC) Fixed Rate 8.9% | | | | | | | | | | | | |
eFHLMC Gold 15 Year, 5.00%, 12/01/23 | | | United States | | | | 167,755 | | | | 176,581 | |
eFHLMC Gold 30 Year, 3.50%, 3/01/45 | | | United States | | | | 29,466 | | | | 31,533 | |
FHLMC Gold 30 Year, 3.50%, 10/01/47 | | | United States | | | | 3,851,058 | | | | 4,062,574 | |
FHLMC Gold 30 Year, 3.50%, 11/01/48 | | | United States | | | | 1,000,730 | | | | 1,052,517 | |
eFHLMC Gold 30 Year, 3.50%, 12/01/48 | | | United States | | | | 8,174,648 | | | | 8,631,394 | |
FHLMC Gold 30 Year, 4.00%, 4/01/48 | | | United States | | | | 2,648,026 | | | | 2,818,120 | |
eFHLMC Gold 30 Year, 4.00%, 5/01/48 | | | United States | | | | 6,094,619 | | | | 6,486,671 | |
eFHLMC Gold 30 Year, 6.00%, 7/01/28 - 11/01/36 | | | United States | | | | 372,404 | | | | 428,712 | |
eFHLMC Gold 30 Year, 6.50%, 8/01/27 - 3/01/38 | | | United States | | | | 158,474 | | | | 179,378 | |
eFHLMC Gold 30 Year, 7.00%, 9/01/27 | | | United States | | | | 45,845 | | | | 50,526 | |
eFHLMC Gold 30 Year, 8.50%, 7/01/31 | | | United States | | | | 152,370 | | | | 178,092 | |
| | | | | | | | | | | | |
| | | | | | | | | | | 24,096,098 | |
| | | | | | | | | | | | |
tFederal National Mortgage Association (FNMA) Adjustable Rate 0.1% | | | | | | | | | | | | |
eFNMA, 2.29% - 2.441%, (6-month USD LIBOR +/- MBS Margin), 6/01/32 - 7/01/34 | | | United States | | | | 227,717 | | | | 228,991 | |
| | | | | | | | | | | | |
| | | | |
| | | |
| franklintempleton.com | | Semiannual Report | | 25 |
FRANKLIN LIMITED DURATION INCOME TRUST
STATEMENT OF INVESTMENTS (UNAUDITED)
| | | | | | | | | | | | |
| | | | Country | | |
| Principal
Amount |
* | | | Value | |
| | | |
Mortgage-Backed Securities (continued) | | | | | | | | | | | | |
Federal National Mortgage Association (FNMA) Fixed Rate 16.8% | | | | | | | | | | | | |
eFNMA 15 Year, 3.00%, 8/01/27 | | | United States | | | $ | 6,805 | | | $ | 7,166 | |
eFNMA 15 Year, 3.50%, 1/01/21 - 1/01/26 | | | United States | | | | 13,726 | | | | 14,435 | |
uFNMA 30 Year, 2.50%, 7/01/50 | | | United States | | | | 3,000,000 | | | | 3,126,445 | |
uFNMA 30 Year, 3.00%, 6/01/50 | | | United States | | | | 16,254,000 | | | | 17,114,954 | |
eFNMA 30 Year, 3.50%, 1/01/45 - 6/01/45 | | | United States | | | | 371,675 | | | | 398,598 | |
FNMA 30 Year, 3.50%, 11/01/47 | | | United States | | | | 1,710,970 | | | | 1,808,719 | |
FNMA 30 Year, 3.50%, 3/01/48 | | | United States | | | | 3,258,620 | | | | 3,440,764 | |
FNMA 30 Year, 3.50%, 4/01/48 | | | United States | | | | 1,546,394 | | | | 1,632,144 | |
FNMA 30 Year, 3.50%, 6/01/45 - 10/01/48 | | | United States | | | | 1,522,660 | | | | 1,616,630 | |
eFNMA 30Year, 3.50%, 7/01/56. | | | United States | | | | 687,782 | | | | 748,957 | |
eFNMA 30 Year, 4.00%, 11/01/44 - 1/01/45 | | | United States | | | | 645,516 | | | | 701,027 | |
eFNMA 30 Year, 4.00%, 10/01/47 | | | United States | | | | 7,110,739 | | | | 7,590,528 | |
FNMA 30 Year, 4.00%, 1/01/48 | | | United States | | | | 1,334,182 | | | | 1,424,915 | |
FNMA 30 Year, 4.00%, 4/01/48 | | | United States | | | | 2,300,186 | | | | 2,442,253 | |
FNMA 30 Year, 4.00%, 9/01/48 | | | United States | | | | 2,303,340 | | | | 2,442,012 | |
eFNMA 30 Year, 4.50%, 5/01/24 - 3/01/44 | | | United States | | | | 37,237 | | | | 40,234 | |
eFNMA 30 Year, 5.00%, 5/01/38 - 7/01/39 | | | United States | | | | 281,916 | | | | 323,905 | |
eFNMA 30 Year, 5.50%, 6/01/37 | | | United States | | | | 222,574 | | | | 255,186 | |
eFNMA 30 Year, 6.00%, 4/01/33 - 6/01/38 | | | United States | | | | 502,574 | | | | 585,242 | |
eFNMA 30 Year, 6.50%, 8/01/32 | | | United States | | | | 80,550 | | | | 92,181 | |
eFNMA 30 Year, 8.00%, 10/01/29 | | | United States | | | | 2,931 | | | | 2,942 | |
| | | | | | | | | | | | |
| | | | | | | | | | | 45,809,237 | |
| | | | | | | | | | | | |
Government National Mortgage Association (GNMA) Fixed Rate 2.9% | | | | | | | | | | | | |
eGNMA I SF 30 Year, 6.50%, 6/15/31 - 9/15/32 | | | United States | | | | 265,392 | | | | 301,726 | |
GNMA I SF 30 Year, 6.50%, 12/15/33 | | | United States | | | | 39,229 | | | | 43,182 | |
eGNMA II SF 30 Year, 3.50%, 12/20/49 | | | United States | | | | 3,891,743 | | | | 4,113,039 | |
GNMA II SF 30 Year, 4.50%, 7/20/49 | | | United States | | | | 3,179,766 | | | | 3,398,203 | |
eGNMA II SF 30 Year, 7.00%, 1/20/24 - 1/20/29 | | | United States | | | | 23,996 | | | | 27,109 | |
eGNMA II SF 30 Year, 8.00%, 1/20/28 - 10/20/31 | | | United States | | | | 71,059 | | | | 85,534 | |
| | | | | | | | | | | | |
| | | | | | | | | | | 7,968,793 | |
| | | | | | | | | | | | |
Total Mortgage-Backed Securities (Cost $75,585,453) | | | | | | | | | | | 78,103,119 | |
| | | | | | | | | | | | |
| | | |
| | | | | | Shares | | | | |
Escrows and Litigation Trusts 0.0%† | | | | | | | | | | | | |
a,b,cRemington Outdoor Co. Inc., Litigation Units | | | United States | | | | 3,700 | | | | — | |
a,bVistra Energy Corp., Litigation Trust | | | United States | | | | 2,000,000 | | | | 4,000 | |
| | | | | | | | | | | | |
Total Escrows and Litigation Trusts (Cost $52,910) | | | | | | | | | | | 4,000 | |
| | | | | | | | | | | | |
Total Investments before Short Term Investments
(Cost $408,080,466) | | | | | | | | | | | 388,113,615 | |
| | | | | | | | | | | | |
| | | | |
| | | |
26 | | Semiannual Report | | franklintempleton.com |
FRANKLIN LIMITED DURATION INCOME TRUST
STATEMENT OF INVESTMENTS (UNAUDITED)
| | | | | | | | | | | | |
| | | | Country | | |
| Principal
Amount |
* | | | Value | |
| | | |
Short Term Investments 3.6% | | | | | | | | | | | | |
| | | |
k,lSenior Floating Rate Interests (Cost $28,612) 0.0%† | | | | | | | | | | | | |
Retailing 0.0%† | | | | | | | | | | | | |
oGeneral Nutrition Centers Inc., 14.00%, (3-month USD LIBOR + 13.00%), 12/30/20 | | | United States | | | $ | 31,716 | | | $ | 32,191 | |
| | | | | | | | | | | | |
Total Investments before Money Market Funds
(Cost $408,109,078) | | | | | | | | | | | 388,145,806 | |
| | | | | | | | | | | | |
| | | |
| | | | | | Shares | | | | |
Money Market Funds (Cost $9,780,127) 3.6% | | | | | | | | | | | | |
v,wInstitutional Fiduciary Trust Money Market Portfolio, 0.00% | | | United States | | | | 9,780,127 | | | | 9,780,127 | |
| | | | | | | | | | | | |
Total Investments (Cost $417,889,205) 146.3% | | | | | | | | | | | 397,925,933 | |
Reverse Repurchase Agreements (2.7)% | | | | | | | | | | | (7,457,921 | ) |
Credit Facility (34.2)% | | | | | | | | | | | (93,000,000 | ) |
Other Assets, less Liabilities (9.4)% | | | | | | | | | | | (25,462,782 | ) |
| | | | | | | | | | | | |
Net Assets 100.0% | | | | | | | | | | $ | 272,005,230 | |
| | | | | | | | | | | | |
| | | |
| | | | | |
| Amount
Borrowed |
| | | Payable | |
xReverse Repurchase Agreements (2.7)% | | | | | | | | | | | | |
Counterparty UBS, 1.917%, 9/04/20 | | | Switzerland | | | | 529,141 | | | | (529,845 | ) |
Counterparty UBS, 1.917%, 9/04/20 | | | Switzerland | | | | 245,801 | | | | (246,129 | ) |
Counterparty UBS, 2.317%, 9/04/20 | | | Switzerland | | | | 1,985,550 | | | | (1,988,745 | ) |
Counterparty UBS, 2.317%, 9/04/20 | | | Switzerland | | | | 1,968,750 | | | | (1,971,918 | ) |
Counterparty UBS, 2.317%, 9/04/20 | | | Switzerland | | | | 1,472,171 | | | | (1,474,539 | ) |
Counterparty UBS, 2.317%, 9/04/20 | | | Switzerland | | | | 1,244,742 | | | | (1,246,745 | ) |
| | | | | | | | | | | | |
Total Reverse Repurchase Agreements
(Proceeds $7,446,155) | | | | | | | | | | $ | (7,457,921 | ) |
| | | | | | | | | | | | |
| | | | |
| | | |
| franklintempleton.com | | Semiannual Report | | 27 |
FRANKLIN LIMITED DURATION INCOME TRUST
STATEMENT OF INVESTMENTS (UNAUDITED)
See Abbreviations on page 44.
†Rounds to less than 0.1% of net assets.
*The principal amount is stated in U.S. dollars unless otherwise indicated.
aNon-income producing.
bFair valued using significant unobservable inputs. See Note 13 regarding fair value measurements.
cSee Note 11 regarding restricted securities.
dSecurity was purchased pursuant to Rule 144A under the Securities Act of 1933 and may be sold in transactions exempt from registration only to qualified institutional buyers or in a public offering registered under the Securities Act of 1933. At June 30, 2020, the aggregate value of these securities was $144,978,829, representing 53.3% of net assets.
eA portion or all of the security is pledged as collateral in connection with the Fund’s revolving credit facility.
fPerpetual security with no stated maturity date.
gIncome may be received in additional securities and/or cash.
hA portion or all of the security purchased on a when-issued basis. See Note 1(c).
iSee Note 9 regarding defaulted securities.
jSecurity was purchased pursuant to Regulation S under the Securities Act of 1933, which exempts from registration securities offered and sold outside of the United States. Such a security cannot be sold in the United States without either an effective registration statement filed pursuant to the Securities Act of 1933, or pursuant to an exemption from registration. At June 30, 2020, the aggregate value of these securities was $589,923, representing 0.2% of net assets.
kThe coupon rate shown represents the rate at period end.
lSee Note 1(e) regarding senior floating rate interests.
mA portion or all of the security purchased on a delayed delivery basis. See Note 1(c).
nA portion or all of the security represents an unsettled loan commitment. The coupon rate is to-be determined (TBD) at the time of settlement and will be based upon a reference index/floor plus a spread.
oSee Note 12 regarding unfunded loan commitments.
pSee Note 1(f) regarding Marketplace lending.
qAdjustable rate security with an interest rate that is not based on a published reference index and spread. The rate is based on the structure of the agreement and current market conditions. The coupon rate shown represents the rate at period end.
rThe coupon rate shown represents the rate inclusive of any caps or floors, if applicable, in effect at period end.
sSecurity is designated as collateral for reverse repurchase agreement.
tAdjustable Rate Mortgage-Backed Security (ARM); the rate shown is the effective rate at period end. ARM rates are not based on a published reference rate and spread, but instead pass-through weighted average interest income inclusive of any caps or floors, if applicable, from the underlying mortgage loans in which the majority of mortgages pay interest based on the index shown at their designated reset dates plus a spread, less the applicable servicing and guaranty fee (MBS margin).
uA portion or all of the security purchased on a to-be-announced (TBA) basis. See Note 1(c).
vSee Note 5(c) regarding investments in affiliated management investment companies.
wThe rate shown is the annualized seven-day effective yield at period end.
xSee Note 4 regarding reverse repurchase agreements.
| | | | |
| | | |
28 | | Semiannual Report | The accompanying notes are an integral part of these financial statements. | | franklintempleton.com |
FRANKLIN LIMITED DURATION INCOME TRUST
FINANCIAL STATEMENTS
Statement of Assets and Liabilities
June 30, 2020 (unaudited)
| | | | |
Assets: | | | | |
Investments in securities: | | | | |
Cost - Unaffiliated issuers | | | $408,109,078 | |
Cost - Non-controlled affiliates (Note 5c) | | | 9,780,127 | |
| | | | |
Value - Unaffiliated issuers | | | $388,145,806 | |
Value - Non-controlled affiliates (Note 5c) | | | 9,780,127 | |
Cash | | | 1,068,931 | |
Receivables: | | | | |
Investment securities sold | | | 1,556,016 | |
Interest | | | 3,106,297 | |
Deposits with brokers for: | | | | |
Reverse repurchase agreements | | | 140,000 | |
Unrealized appreciation on unfunded loan commitments (Note 12) | | | 7,569 | |
| | | | |
Total assets | | | 403,804,746 | |
| | | | |
Liabilities: | | | | |
Payables: | | | | |
Investment securities purchased | | | 28,599,189 | |
Credit facility (Note 3) | | | 93,000,000 | |
Management fees | | | 225,747 | |
Trustees’ fees and expenses | | | 786 | |
Distributions to shareholders | | | 2,218,218 | |
Accrued interest (Note 3) | | | 98,336 | |
Reverse repurchase agreements | | | 7,457,921 | |
Accrued expenses and other liabilities | | | 199,319 | |
| | | | |
Total liabilities | | | 131,799,516 | |
| | | | |
Net assets applicable to common shares | | | $272,005,230 | |
| | | | |
Net assets applicable to common shares consist of: | | | | |
Paid-in capital | | | $331,928,821 | |
Total distributable earnings (losses) | | | (59,923,591 | ) |
| | | | |
Net assets applicable to common shares | | | $272,005,230 | |
| | | | |
Common shares outstanding | | | 30,138,835 | |
| | | | |
Net asset value per common share | | | $9.03 | |
| | | | |
| | | | |
| | | |
| franklintempleton.com | | The accompanying notes are an integral part of these financial statements. | Semiannual Report | | 29 |
FRANKLIN LIMITED DURATION INCOME TRUST
FINANCIAL STATEMENTS
Statement of Operations
for the six months ended June 30, 2020 (unaudited)
| | | | |
Investment income: | | | | |
Dividends: | | | | |
Unaffiliated issuers | | $ | (796 | ) |
Non-controlled affiliates (Note 5c) | | | 44,967 | |
Interest: | | | | |
Unaffiliated issuers | | | 10,670,952 | |
Unaffiliated issuers: | | | | |
Paydown gain (loss) | | | (644,279 | ) |
| | | | |
Total investment income | | | 10,070,844 | |
| | | | |
Expenses: | | | | |
Management fees (Note 5a) | | | 1,414,272 | |
Interest expense (Note 3 and 4) | | | 898,698 | |
Transfer agent fees | | | 24,550 | |
Custodian fees (Note 6) | | | 2,576 | |
Reports to shareholders | | | 18,619 | |
Registration and filing fees | | | 517 | |
Professional fees | | | 82,502 | |
Trustees’ fees and expenses | | | 9,081 | |
Marketplace lending fees (Note 1f) | | | 146,642 | |
Other | | | 38,552 | |
| | | | |
Total expenses | | | 2,636,009 | |
Expense reductions (Note 6) | | | (3,469 | ) |
Expenses waived/paid by affiliates | | | (20,672 | ) |
| | | | |
Net expenses | | | 2,611,868 | |
| | | | |
Net investment income | | | 7,458,976 | |
| | | | |
Realized and unrealized gains (losses): | | | | |
Net realized gain (loss) from: | | | | |
Investments: | | | | |
Unaffiliated issuers | | | (9,333,685 | ) |
| | | | |
Net change in unrealized appreciation (depreciation) on: | | | | |
Investments: | | | | |
Unaffiliated issuers | | | (13,373,518 | ) |
Translation of other assets and liabilities denominated in foreign currencies | | | (47 | ) |
| | | | |
Net change in unrealized appreciation (depreciation) | | | (13,373,565 | ) |
| | | | |
Net realized and unrealized gain (loss) | | | (22,707,250 | ) |
| | | | |
Net increase (decrease) in net assets applicable to common shares resulting from operations | | | $(15,248,274 | ) |
| | | | |
| | | | |
| | | |
30 | | Semiannual Report | The accompanying notes are an integral part of these financial statements. | | franklintempleton.com |
FRANKLIN LIMITED DURATION INCOME TRUST
FINANCIAL STATEMENTS
Statements of Changes in Net Assets
| | | | | | | | |
| | | Six Months Ended June 30, 2020 (unaudited) | | | | |
| | | Year Ended | |
| | | December 31, 2019 | |
| |
Increase (decrease) in net assets: | | | | | | | | |
Operations: | | | | | | | | |
Net investment income | | | $ 7,458,976 | | | | $ 15,942,816 | |
Net realized gain (loss) | | | (9,333,685 | ) | | | (1,767,814 | ) |
Net change in unrealized appreciation (depreciation) | | | (13,373,565 | ) | | | 13,493,188 | |
| | | | |
Net increase (decrease) in net assets applicable to common shares resulting from operations | | | (15,248,274 | ) | | | 27,668,190 | |
| | | | |
Distributions to common shareholders | | | (14,198,405 | ) | | | (17,181,094 | ) |
Distributions to common shareholders from tax return of capital | | | — | | | | (13,839,271 | ) |
| | | | |
Total distributions to common shareholders | | | (14,198,405 | ) | | | (31,020,365 | ) |
| | | | |
Net increase (decrease) in net assets | | | (29,446,679 | ) | | | (3,352,175 | ) |
Net assets applicable to common shares: | | | | | | | | |
Beginning of period | | | 301,451,909 | | | | 304,804,084 | |
| | | | |
End of period | | | $272,005,230 | | | | $ 301,451,909 | |
| | | | |
| | | | |
| | | |
| franklintempleton.com | | The accompanying notes are an integral part of these financial statements. | Semiannual Report | | 31 |
FRANKLIN LIMITED DURATION INCOME TRUST
FINANCIAL STATEMENTS
Statements of Cash Flows
for the six months ended June 30, 2020 (unaudited)
| | | | |
Cash flow from operating activities: | | | | |
Dividends, interest and other income received | | $ | 9,641,071 | |
Operating expenses paid | | | (1,757,351 | ) |
Interest expense paid | | | (1,027,764 | ) |
Purchases of long-term investments | | | (192,404,243 | ) |
Sales and maturities of long-term investments | | | 197,479,647 | |
Net sales of short-term investments | | | 9,106,885 | |
| | | | |
Cash provided - operating activities | | | 21,038,245 | |
| | | | |
Cash flow from financing activities: | | | | |
Proceeds from Credit Facility | | | 3,000,000 | |
Prepayment of reverse repurchase agreements | | | (9,711,107 | ) |
Cash distributions to shareholders | | | (14,487,738 | ) |
| | | | |
Cash used - financing activities | | | (21,198,845 | ) |
| | | | |
Net increase (decrease) in cash | | | (160,600 | ) |
Cash at beginning of period | | | 1,369,531 | |
| | | | |
Cash at end of period | | $ | 1,208,931a | |
| | | | |
| |
| Reconciliation of Net Increase (Decrease) in Net Assets resulting from Operating Activities to Net Cash Provided by Operating Activities | | | | |
for the six months ended June 30, 2020 (unaudited) | | | | |
| |
Net increase (decrease) in net assets resulting from operating activities | | $ | (15,248,274 | ) |
Adjustments to reconcile net increase (decrease) in net assets resulting from operating activities to net cash provided by operating activities: | | | | |
Net amortization income | | | (352,611 | ) |
Reinvested dividends from non-controlled affiliates | | | (44,967 | ) |
Interest received in the form of securities | | | (98,104 | ) |
Decrease in dividends and interest receivable and other assets | | | 164,013 | |
Decrease in interest payable | | | (129,066 | ) |
Decrease in affiliates, accrued expenses, and other liabilities | | | (44,181 | ) |
Decrease in receivable for investments sold | | | 2,619,083 | |
Increase in payable for investments purchased | | | 1,315,301 | |
Decrease in cost of investments | | | 19,483,486 | |
Decrease in unrealized appreciation on investments | | | 13,373,565 | |
| | | | |
Net cash provided by operating activities | | $ | 21,038,245 | |
| | | | |
aIncludes cash held of $140,000 as Deposits with brokers for Reverse repurchase agreements.
| | | | |
| | | |
32 | | Semiannual Report | The accompanying notes are an integral part of these financial statements. | | franklintempleton.com |
FRANKLIN LIMITED DURATION INCOME TRUST
Notes to Financial Statements (unaudited)
1. Organization and Significant Accounting Policies
Franklin Limited Duration Income Trust (Fund) is registered under the Investment Company Act of 1940 (1940 Act) as a closed-end management investment company and applies the specialized accounting and reporting guidance in U.S. Generally Accepted Accounting Principles (U.S. GAAP).
The following summarizes the Fund’s significant accounting policies.
a. Financial Instrument Valuation
The Fund’s investments in financial instruments are carried at fair value daily. Fair value is the price that would be received to sell an asset or paid to transfer a liability in an orderly transaction between market participants on the measurement date. The Fund calculates the net asset value (NAV) per share each business day as of 4 p.m. Eastern time or the regularly scheduled close of the New York Stock Exchange (NYSE), whichever is earlier. Under compliance policies and procedures approved by the Fund’s Board of Trustees (the Board), the Fund’s administrator has responsibility for oversight of valuation, including leading the cross-functional Valuation Committee (VC). The Fund may utilize independent pricing services, quotations from securities and financial instrument dealers, and other market sources to determine fair value.
Equity securities listed on an exchange or on the NASDAQ National Market System are valued at the last quoted sale price or the official closing price of the day, respectively. Over-the-counter (OTC) securities are valued within the range of the most recent quoted bid and ask prices. Securities that trade in multiple markets or on multiple exchanges are valued according to the broadest and most representative market. Certain equity securities are valued based upon fundamental characteristics or relationships to similar securities.
Debt securities generally trade in the OTC market rather than on a securities exchange. The Fund’s pricing services use multiple valuation techniques to determine fair value. In instances where sufficient market activity exists, the pricing services may utilize a market-based approach through which quotes from market makers are used to determine fair value. In instances where sufficient market activity may not exist or is limited, the pricing services also utilize proprietary valuation models which may consider market characteristics such as benchmark yield curves, credit spreads, estimated default rates, anticipated market interest rate volatility, coupon
rates, anticipated timing of principal repayments, underlying collateral, and other unique security features in order to estimate the relevant cash flows, which are then discounted to calculate the fair value. Securities denominated in a foreign currency are converted into their U.S. dollar equivalent at the foreign exchange rate in effect at 4 p.m. Eastern time on the date that the values of the foreign debt securities are determined.
Investments in open-end mutual funds are valued at the closing NAV.
The Fund has procedures to determine the fair value of financial instruments for which market prices are not reliable or readily available. Under these procedures, the Fund primarily employs a market-based approach which may use related or comparable assets or liabilities, recent transactions, market multiples, book values, and other relevant information for the investment to determine the fair value of the investment. An income-based valuation approach may also be used in which the anticipated future cash flows of the investment are discounted to calculate fair value. Discounts may also be applied due to the nature or duration of any restrictions on the disposition of the investments. Due to the inherent uncertainty of valuations of such investments, the fair values may differ significantly from the values that would have been used had an active market existed.
b. Foreign Currency Translation
Portfolio securities and other assets and liabilities denominated in foreign currencies are translated into U.S. dollars based on the exchange rate of such currencies against U.S. dollars on the date of valuation. The Fund may enter into foreign currency exchange contracts to facilitate transactions denominated in a foreign currency. Purchases and sales of securities, income and expense items denominated in foreign currencies are translated into U.S. dollars at the exchange rate in effect on the transaction date. Portfolio securities and assets and liabilities denominated in foreign currencies contain risks that those currencies will decline in value relative to the U.S. dollar. Occasionally, events may impact the availability or reliability of foreign exchange rates used to convert the U.S. dollar equivalent value. If such an event occurs, the foreign exchange rate will be valued at fair value using procedures established and approved by the Board.
| | | | |
| | | |
| franklintempleton.com | | Semiannual Report | | 33 |
FRANKLIN LIMITED DURATION INCOME TRUST
NOTES TO FINANCIAL STATEMENTS (UNAUDITED)
1. Organization and Significant Accounting Policies (continued)
b. Foreign Currency Translation (continued)
The Fund does not separately report the effect of changes in foreign exchange rates from changes in market prices on securities held. Such changes are included in net realized and unrealized gain or loss from investments in the Statement of Operations.
Realized foreign exchange gains or losses arise from sales of foreign currencies, currency gains or losses realized between the trade and settlement dates on securities transactions and the difference between the recorded amounts of dividends, interest, and foreign withholding taxes and the U.S. dollar equivalent of the amounts actually received or paid. Net unrealized foreign exchange gains and losses arise from changes in foreign exchange rates on foreign denominated assets and liabilities other than investments in securities held at the end of the reporting period.
c. Securities Purchased on a When-Issued or Delayed Delivery and TBA Basis
The Fund purchases securities on a when-issued or delayed delivery and to-be-announced (TBA) basis, with payment and delivery scheduled for a future date. These transactions are subject to market fluctuations and are subject to the risk that the value at delivery may be more or less than the trade date purchase price. Although the Fund will generally purchase these securities with the intention of holding the securities, it may sell the securities before the settlement date. Sufficient assets have been segregated for these securities and collateral has been pledged and/or received for open TBA trades.
d. Mortgage Dollar Rolls
The Fund enters into mortgage dollar rolls, typically on a TBA basis. Mortgage dollar rolls are agreements between the Fund and a financial institution where the Fund sells (or buys) mortgage-backed securities for delivery on a specified date and simultaneously contracts to repurchase (or sell) substantially similar (same type, coupon, and maturity) securities at a future date and at a predetermined price. Gains or losses are realized on the initial sale, and the difference between the repurchase price and the sale price is recorded as an unrealized gain or loss to the Fund upon entering into the mortgage dollar roll. In addition, the Fund may invest the cash proceeds that are received from the
initial sale. During the period between the sale and repurchase, the Fund is not entitled to principal and interest paid on the mortgage backed securities. Transactions in mortgage dollar rolls are accounted for as purchases and sales and may result in an increase to the Fund’s portfolio turnover rate. The risks of mortgage dollar roll transactions include the potential inability of the counterparty to fulfill its obligations.
The Fund is investing in mortgage dollar rolls as an alternate form of leverage.
e. Senior Floating Rate Interests
The Fund invests in senior secured corporate loans that pay interest at rates which are periodically reset by reference to a base lending rate plus a spread. These base lending rates are generally the prime rate offered by a designated U.S. bank or the London InterBank Offered Rate (LIBOR). Senior secured corporate loans often require prepayment of principal from excess cash flows or at the discretion of the borrower. As a result, actual maturity may be substantially less than the stated maturity. Senior secured corporate loans in which the Fund invests are generally readily marketable, but may be subject to certain restrictions on resale. On July 27, 2017, the United Kingdom’s Financial Conduct Authority announced its intention to cease sustaining LIBOR after 2021. There remains uncertainty regarding the future utilization of LIBOR and the nature of any replacement rate. As such, the potential effect of a transition away from LIBOR on the Fund or the Fund’s investments that use or may use a floating rate based on LIBOR cannot yet be determined.
f. Marketplace Lending
The Fund invests in loans obtained through marketplace lending. Marketplace lending, sometimes referred to as peer-to-peer lending, is a method of financing in which a platform facilitates the borrowing and lending of money. It is considered an alternative to more traditional forms of debt financing. Prospective borrowers are required to provide certain financial information to the platform, including, but not limited to, the intended purpose of the loan, income, employment information, credit score, debt-to-income ratio, credit history (including defaults and delinquencies) and home ownership status. Based on this and other information, the platform assigns its own credit rating to the borrower and sets the interest rate for the requested loan. The platform then posts the borrowing requests online, giving investors the opportunity to purchase the loans based on factors such as
| | | | |
| | | |
34 | | Semiannual Report | | franklintempleton.com |
FRANKLIN LIMITED DURATION INCOME TRUST
NOTES TO FINANCIAL STATEMENTS (UNAUDITED)
the interest rates and expected yields of the loans, the borrower background data, and the credit rating assigned by the platform.
When the Fund invests in these loans, it usually purchase all rights, title and interest in the loans pursuant to a loan purchase agreement directly from the platform. The platform or a third-party servicer typically continues to service the loans, collecting payments and distributing them to the Fund, less any servicing fees assessed. The servicer is typically responsible for taking actions against a borrower in the event of a default on the loan. Servicing fees, along with other administration fees, are included in marketplace lending fees in the Statement of Operations. The Fund, as an investor in a loan, would be entitled to receive payment only from the borrower and would not be able to recover any deficiency from the platform, except under very narrow circumstances. The loans in which the Fund may invest are unsecured.
g. Income and Deferred Taxes
It is the Fund’s policy to qualify as a regulated investment company under the Internal Revenue Code. The Fund intends to distribute to shareholders substantially all of its taxable income and net realized gains to relieve it from federal income and excise taxes. As a result, no provision for U.S. federal income taxes is required.
The Fund may be subject to foreign taxation related to income received, capital gains on the sale of securities and certain foreign currency transactions in the foreign jurisdictions in which it invests. Foreign taxes, if any, are recorded based on the tax regulations and rates that exist in the foreign markets in which the Fund invests. When a capital gain tax is determined to apply, the Fund records an estimated deferred tax liability in an amount that would be payable if the securities were disposed of on the valuation date.
The Fund may recognize an income tax liability related to its uncertain tax positions under U.S. GAAP when the uncertain tax position has a less than 50% probability that it will be sustained upon examination by the tax authorities based on its technical merits. As of June 30, 2020, the Fund has determined that no tax liability is required in its financial statements related to uncertain tax positions for any open tax years (or expected to be taken in future tax years). Open tax years are those that remain subject to examination and are based on the statute of limitations in each jurisdiction in which the Fund invests.
h. Security Transactions, Investment Income, Expenses and Distributions
Security transactions are accounted for on trade date. Realized gains and losses on security transactions are determined on a specific identification basis. Interest income and estimated expenses are accrued daily. Amortization of premium and accretion of discount on debt securities are included in interest income. Paydown gains and losses are recorded as an adjustment to interest income. Facility fees are recognized as income over the expected term of the loan. Dividend income is recorded on the ex-dividend date except for certain dividends from securities where the dividend rate is not available. In such cases, the dividend is recorded as soon as the information is received by the Fund. Distributions to shareholders are recorded on the ex-dividend date. The Fund employs a managed distribution policy whereby the Fund will make monthly distributions to common shareholders at an annual minimum fixed rate of 10%, based on the average monthly NAV of the Fund’s common shares. Under the policy, the Fund is managed with a goal of generating as much of the distribution as possible from net investment income and short-term capital gains. The balance of the distribution will then come from long-term capital gains to the extent permitted and, if necessary, a return of capital. Distributable earnings are determined according to income tax regulations (tax basis) and may differ from earnings recorded in accordance with U.S. GAAP. These differences may be permanent or temporary. Permanent differences are reclassified among capital accounts to reflect their tax character. These reclassifications have no impact on net assets or the results of operations. Temporary differences are not reclassified, as they may reverse in subsequent periods.
i. Accounting Estimates
The preparation of financial statements in accordance with U.S. GAAP requires management to make estimates and assumptions that affect the reported amounts of assets and liabilities at the date of the financial statements and the amounts of income and expenses during the reporting period. Actual results could differ from those estimates.
j. Guarantees and Indemnifications
Under the Fund’s organizational documents, its officers and trustees are indemnified by the Fund against certain liabilities arising out of the performance of their duties to the Fund.
| | | | |
| | | |
| franklintempleton.com | | Semiannual Report | | 35 |
FRANKLIN LIMITED DURATION INCOME TRUST
NOTES TO FINANCIAL STATEMENTS (UNAUDITED)
1. Organization and Significant Accounting Policies (continued)
j. Guarantees and Indemnifications (continued)
Additionally, in the normal course of business, the Fund enters into contracts with service providers that contain
general indemnification clauses. The Fund’s maximum exposure under these arrangements is unknown as this would involve future claims that may be made against the Fund that have not yet occurred. Currently, the Fund expects the risk of loss to be remote.
2. Shares of Beneficial Interest
At June 30, 2020, there were an unlimited number of shares authorized (without par value). During the period ended June 30, 2019 there were no shares issued; all reinvested distributions were satisfied with previously issued shares purchased in the open market.
Under the Board approved open-market share repurchase program, the Fund may purchase, from time to time, Fund shares in open-market transactions, at the discretion of management. Since the inception of the program, the Fund has repurchased a total of 242,561 shares. During the period ended June 30, 2020 and year ended December 31, 2019, there were no shares repurchased.
3. Credit Facility
The Fund has entered into a credit facility agreement (“Credit Facility”) with BNP Paribas Prime Brokerage International Ltd. (“BNPP”) pursuant to which the Fund may borrow up to a maximum commitment amount of $100,000,000. The Fund will pay interest in the amount of 0.90% plus the 3-month U.S. Dollar London Interbank Offered Rate on the amount outstanding. The Fund is required to fully collateralize its outstanding loan balance as determined by BNPP by pledging assets, which are held in a segregated account, and are indicated in the Statement of Investments. If the Fund fails to meet certain requirements or maintain other financial covenants required under the Credit Facility, the Fund may be required to repay immediately, in part or in full, the loan balance outstanding.
The Fund had outstanding borrowings of $93,000,000 as of June 30, 2020 and incurred $898,698 of interest expense during the year. Average borrowings and the average interest rate for the days outstanding during the period ended June 30, 2020, were $90,930,386 and 1.97%, respectively.
The Credit Facility also permits, subject to certain conditions, BNPP to rehypothecate portfolio securities pledged by the Fund up to the amount of the loan balance outstanding. The Fund continues to receive dividends and interest on rehypothecated securities. The Fund also has the right under the Credit Facility to recall any securities pledged as collateral from BNPP on demand. If BNPP fails to deliver the recalled security in a timely manner, the Fund will be compensated for any fees or losses related to the failed delivery or, in the event a recalled security is not be returned, the Fund, upon notice to BNPP, may reduce the loan balance outstanding by the market value of the recalled security. The Fund will receive a portion of the fees earned by BNPP in connection with the rehypothecation of portfolio securities. Rehypothecated securities are included among the portfolio securities pledged by the Fund as collateral for the Credit Facility. As of June 30, 2020, there were no rehypothecated securities.
4. Reverse Repurchase Agreements
The Fund enters into reverse repurchase agreements, under which the Fund sells securities in exchange for cash to counterparties, with a simultaneous agreement to repurchase the same or substantially the same security at a mutually agreed-upon date and price. Such a transaction is accounted for as a secured borrowing by the Fund, collateralized by securities for which the Fund retains possession. The gross amount of cash received in exchange for securities sold plus accrued interest payments to be made by the Fund to counterparties are reflected as a payable for Reverse repurchase
| | | | |
| | | |
36 | | Semiannual Report | | franklintempleton.com |
FRANKLIN LIMITED DURATION INCOME TRUST
NOTES TO FINANCIAL STATEMENTS (UNAUDITED)
agreements on the Statement of Assets and Liabilities. Interest payments made on reverse repurchase agreements are recorded as a component of interest expense on the Statement of Operations. Reverse repurchase agreements are subject to the terms of Master Repurchase Agreements (MRAs) with approved counterparties (buyers). The MRAs contain various provisions, including but not limited to events of default and maintenance of collateral for reverse repurchase agreements. In the event of default by either the buyer or the Fund, certain MRAs may permit the non-defaulting party to net and close-out all transactions, if any, traded under such agreements. The buyer may sell securities the Fund pledged as collateral and apply the proceeds towards the reverse repurchase price and any other amounts owed by the Fund in the event of default by the Fund. This could involve costs or delays in addition to a loss on the securities if their value falls below the reverse repurchase price owed by the Fund. The Fund monitors collateral fair value for the reverse repurchase agreement, including accrued interest, over the life of the agreement, and when necessary, delivers or receives cash or securities in order to manage credit exposure and liquidity.
The remaining contractual maturity of the repurchase agreements totaling $7,488,982, which includes interest due at maturity, are 31-90 days.
The Fund pledged asset-backed securities and commercial mortgage-backed securities as the collateral valued at $10,350,432 which has been identified on the Statement of Investments.
For the period ended June 30, 2020, the average borrowings and the average interest rate were $14,055,338 and 2.5%, respectively.
5. Transactions with Affiliates
Franklin Resources, Inc. is the holding company for various subsidiaries that together are referred to as Franklin Templeton. Certain officers and trustees of the Fund are also officers and/or directors of the following subsidiaries:
| | |
| Subsidiary | | Affiliation |
| |
Franklin Advisers, Inc. (Advisers) | | Investment manager |
| |
Franklin Templeton Services, LLC (FT Services) | | Administrative manager |
a. Management Fees
The Fund pays an investment management fee to Advisers of 0.70% per year of the average daily managed assets. Managed assets are defined as the Fund’s gross asset value minus the sum of accrued liabilities, other than the principal amount of the Credit Facility and other financial leverage.
b. Administrative Fees
Under an agreement with Advisers, FT Services provides administrative services to the Fund. The fee is paid by Advisers based on the Fund’s average daily net assets, and is not an additional expense of the Fund.
| | | | |
| | | |
| franklintempleton.com | | Semiannual Report | | 37 |
FRANKLIN LIMITED DURATION INCOME TRUST
NOTES TO FINANCIAL STATEMENTS (UNAUDITED)
5. Transactions with Affiliates (continued)
c. Investments in Affiliated Management Investment Companies
The Fund invests in one or more affiliated management investment companies for purposes other than exercising a controlling influence over the management or policies. Management fees paid by the Fund are waived on assets invested in the affiliated management investment companies, as noted in the Statement of Operations, in an amount not to exceed the management and administrative fees paid directly or indirectly by each affiliate. During the period ended June 30, 2020, the Fund held investments in affiliated management investment companies as follows:
| | | | | | | | | | | | | | | | | | | | | | | | | | | | | | | | |
| | | Value at
Beginning
of Period | | | Purchases | | | Sales | | | Realized
Gain (Loss) | | | Net Change in
Unrealized
Appreciation
(Depreciation) | | | Value at End of
Period | | | Number of
Shares
Held at End
of Period | | | Dividend Income | |
Non-Controlled Affiliates | | | | | | | | | | | | | | | | | | | | | | | | | | | | | | | | |
Institutional Fiduciary Trust Money Market Portfolio, 0.00% | | | $18,870,657 | | | | $51,709,899 | | | | $(60,800,429 | ) | | | $ — | | | | $ — | | | | $9,780,127 | | | | 9,780,127 | | | | $44,967 | |
| | | | | | | | | | | | |
6. Expense Offset Arrangement
The Fund has entered into an arrangement with its custodian whereby credits realized as a result of uninvested cash balances are used to reduce a portion of the Fund’s custodian expenses. During the period ended June 30, 2020, the custodian fees were reduced as noted in the Statement of Operations.
7. Income Taxes
For tax purposes, capital losses may be carried over to offset future capital gains.
At December 31, 2019, the capital loss carryforwards were as follows:
| | | | |
Capital loss carryforwards not subject to expiration: | | | | |
Short term | | $ | 2,849,863 | |
Long term | | | 18,021,632 | |
| | | | |
Total capital loss carryforwards | | $ | 20,871,495 | |
| | | | |
At June 30, 2020, the cost of investments and net unrealized appreciation (depreciation) for income tax purposes were as follows:
| | | | |
Cost of investments | | $ | 410,792,631 | |
| | | | |
Unrealized appreciation | | $ | 5,971,247 | |
Unrealized depreciation | | | (26,284,100) | |
| | | | |
Net unrealized appreciation (depreciation) | | $ | (20,312,853) | |
| | | | |
Differences between income and/or capital gains as determined on a book basis and a tax basis are primarily due to differing treatments of total return swaps, paydown losses and bond discounts and premiums.
| | | | |
| | | |
38 | | Semiannual Report | | franklintempleton.com |
FRANKLIN LIMITED DURATION INCOME TRUST
NOTES TO FINANCIAL STATEMENTS (UNAUDITED)
8. Investment Transactions
Purchases and sales of investments (excluding short term securities) for the period ended June 30, 2020, aggregated $193,719,544 and $199,206,469, respectively.
9. Credit Risk and Defaulted Securities
At June 30, 2020, the Fund had 68.0% of its portfolio invested in high yield securities, senior secured floating rate loans, or other securities rated below investment grade and unrated securities, if any. These securities may be more sensitive to economic conditions causing greater price volatility and are potentially subject to a greater risk of loss due to default than higher rated securities.
The Fund held defaulted securities and/or other securities for which the income has been deemed uncollectible. At June 30, 2020, the aggregate value of these securities was $1,292,568, representing 0.5% of the Fund’s net assets. The Fund discontinues accruing income on securities for which income has been deemed uncollectible and provides an estimate for losses on interest receivable. The securities have been identified in the accompanying Statement of Investments.
10. Novel Coronavirus Pandemic
The global outbreak of the novel coronavirus disease, known as COVID-19, has caused adverse effects on many companies, sectors, nations, regions and the markets in general, and may continue for an unpredictable duration. The effects of this pandemic may materially impact the value and performance of the Fund, its ability to buy and sell fund investments at appropriate valuations and its ability to achieve its investment objectives.
11. Restricted Securities
The Fund invests in securities that are restricted under the Securities Act of 1933 (1933 Act). Restricted securities are often purchased in private placement transactions, and cannot be sold without prior registration unless the sale is pursuant to an exemption under the 1933 Act. Disposal of these securities may require greater effort and expense, and prompt sale at an acceptable price may be difficult. The Fund may have registration rights for restricted securities. The issuer generally incurs all registration costs.
At June 30, 2020, investments in restricted securities, excluding securities exempt from registration under the 1933 Act, were as follows:
| | | | | | | | | | | | |
| Shares | | Issuer | | Acquisition Date | | | Cost | | | | Value | |
| | | | |
| 404 | | Nine Point Energy Holdings Inc., cvt. pfd., 2/20/49 | | 3/24/17 | | $ | 377,604 | | | $ | 63,983 | |
| 22,270 | | Nine Point Energy LLC | | 7/15/14 - 2/01/18 | | | 830,630 | | | | 6,230 | |
| 522,133 | | aOnsite Rental Group Operations Pty. Ltd. | | 5/20/20 | | | — | | | | — | |
| 952,561 | | aOnsite Rental Group Operations Pty. Ltd., secured note, PIK, 6.10%, 10/26/23 | | 9/10/14 - 9/17/14 | | | 1,001,673 | | | | 773,200 | |
| 3,700 | | bRemington Outdoor Co. Inc., Litigation Units | | 5/16/18 | | | — | | | | — | |
| | | | | | | | |
| | Total Restricted Securities (Value is 0.3% of Net Assets) | | | | $ | 2,209,907 | | | $ | 843,413 | |
| | | | | | | | |
aThe Fund also invests in unrestricted securities of the issuer, valued at $584,370 as of June 30, 2020.
bThe Fund also invests in unrestricted securities of the issuer, valued at $19,653 as of June 30, 2020.
| | | | |
| | | |
| franklintempleton.com | | Semiannual Report | | 39 |
FRANKLIN LIMITED DURATION INCOME TRUST
NOTES TO FINANCIAL STATEMENTS (UNAUDITED)
12. Unfunded Loan Commitments
The Fund enters into certain credit agreements, all or a portion of which may be unfunded. The Fund is obligated to fund these loan commitments at the borrowers’ discretion. Unfunded loan commitments and funded portions of credit agreements are marked to market daily and any unrealized appreciation or depreciation is included in the Statement of Assets and Liabilities and the Statement of Operations. Funded portions of credit agreements are presented in the Statement of Investments.
At June 30, 2020, unfunded commitments were as follows:
| | | | |
| Borrower | | Unfunded Commitment | |
24 Hour Fitness Worldwide, Inc, New Money DIP | | | $732,297 | |
General Nutrition Centers Inc., DIP | | | 74,004 | |
| | | | |
| | | $806,301 | |
| | | | |
13. Fair Value Measurements
The Fund follows a fair value hierarchy that distinguishes between market data obtained from independent sources (observable inputs) and the Fund’s own market assumptions (unobservable inputs). These inputs are used in determining the value of the Fund’s financial instruments and are summarized in the following fair value hierarchy:
| | • | | Level 1 – quoted prices in active markets for identical financial instruments |
| | • | | Level 2 – other significant observable inputs (including quoted prices for similar financial instruments, interest rates, prepayment speed, credit risk, etc.) |
| | • | | Level 3 – significant unobservable inputs (including the Fund’s own assumptions in determining the fair value of financial instruments) |
The input levels are not necessarily an indication of the risk or liquidity associated with financial instruments at that level.
| | | | |
| | | |
40 | | Semiannual Report | | franklintempleton.com |
FRANKLIN LIMITED DURATION INCOME TRUST
NOTES TO FINANCIAL STATEMENTS (UNAUDITED)
A summary of inputs used as of June 30, 2020, in valuing the Fund’s assets and liabilities carried at fair value, is as follows:
| | | | | | | | | | | | | | | | |
| | | | Level 1 | | | | Level 2 | | | | Level 3 | | | | Total | |
Assets: | | | | | | | | | | | | | | | | |
Investments in Securities:a | | | | | | | | | | | | | | | | |
Equity Investments:b | | | | | | | | | | | | | | | | |
Commercial & Professional Services | | $ | — | | | $ | 19,653 | | | $ | — | | | $ | 19,653 | |
Energy | | | 44,779 | | | | — | | | | 318,586 | | | | 363,365 | |
Materials | | | 50,239 | | | | — | | | | — | c | | | 50,239 | |
Convertible Bonds | | | — | | | | 2,674 | | | | — | | | | 2,674 | |
Corporate Bonds: | | | | | | | | | | | | | | | | |
Capital Goods | | | — | | | | 11,073,311 | | | | 773,200 | | | | 11,846,511 | |
Consumer Services | | | — | | | | 12,623,039 | | | | 41,250 | | | | 12,664,289 | |
Energy | | | — | | | | 17,431,681 | | | | 1,275 | | | | 17,432,956 | |
All Other Corporate Bonds | | | — | | | | 103,507,522 | | | | — | | | | 103,507,522 | |
Senior Floating Rate Interests: | | | | | | | | | | | | | | | | |
Capital Goods | | | — | | | | 7,123,538 | | | | 584,370 | | | | 7,707,908 | |
All Other Senior Floating Rate Interests | | | — | | | | 100,586,533 | | | | — | | | | 100,586,533 | |
Marketplace Loans | | | — | | | | — | | | | 8,314,610 | | | | 8,314,610 | |
Asset-Backed Securities and Commercial | | | | | | | | | | | | | | | | |
Mortgage-Backed Securities: | | | | | | | | | | | | | | | | |
Banks | | | — | | | | 5,975,051 | | | | 8,370 | | | | 5,983,421 | |
All Other Asset-Backed Securities and | | | | | | | | | | | | | | | | |
Commercial Mortgage-Backed Securities | | | — | | | | 41,526,815 | | | | — | | | | 41,526,815 | |
Mortgage-Backed Securities | | | — | | | | 78,103,119 | | | | — | | | | 78,103,119 | |
Escrows and Litigation Trusts | | | — | | | | — | | | | 4,000 | c | | | 4,000 | |
Short Term Investments | | | 9,780,127 | | | | 32,191 | | | | — | | | | 9,812,318 | |
| | | | |
Total Investments in Securities | | $ | 9,875,145 | | | $ | 378,005,127 | | | $ | 10,045,661 | | | $ | 397,925,933 | |
| | | | |
| | | | |
Other Financial Instruments: | | | | | | | | | | | | | | | | |
Unfunded Loan Commitments | | $ | — | | | $ | 7,569 | | | $ | — | | | $ | 7,569 | |
| | | | |
| | | | |
Liabilities: | | | | | | | | | | | | | | | | |
Other Financial Instruments: | | | | | | | | | | | | | | | | |
| | | | |
Reverse Repurchase Agreements | | $ | — | | | $ | 7,457,921 | | | $ | — | | | $ | 7,457,921 | |
| | | | |
aFor detailed categories, see the accompanying Statement of Investments.
bIncludes common and convertible preferred stocks as well as other equity interests.
cIncludes securities determined to have no value at June 30, 2020.
A reconciliation in which Level 3 inputs are used in determining fair value is presented when there are significant Level 3 assets and/or liabilities at the beginning and/or end of the year. At June 30, 2020, the reconciliation is as follows:
| | | | |
| | | |
| franklintempleton.com | | Semiannual Report | | 41 |
FRANKLIN LIMITED DURATION INCOME TRUST
NOTES TO FINANCIAL STATEMENTS (UNAUDITED)
13. Fair Value Measurements (continued)
| | | | | | | | | | | | | | | | | | | | | | | | | | | | | | | | | | | | | | | | |
| | |
| Balance at
Beginning
of Period |
| | | Purchases | | | | Sales | | |
| Transfer
Into
Level 3 |
a | |
| Transfer
Out of Level 3 |
b | |
| Cost Basis
Adjustments
|
c
| |
| Net
Realized Gain (Loss) |
| |
| Net
Unrealized Appreciation (Depreciation) |
| |
| Balance
at End of Period |
| |
| Net Change
in
Unrealized Appreciation (Depreciation) on Assets Held at Period End |
|
Assets: | | | | | | | | | | | | | | | | | | | | | | | | | | | | | | | | | | | | | | | | |
Investments in Securities: | | | | | | | | | | | | | | | | | | | | | | | | | | | | | | | | | | | | | | | | |
Equity Investments:d | | | | | | | | | | | | | | | | | | | | | | | | | | | | | | | | | | | | | | | | |
Commercial & Professional Services | | | $ 24,566 | | | | $ — | | | | $ — | | | | $ — | | | | $(19,653 | ) | | | $ — | | | | $ — | | | | $ (4,913 | ) | | | $ — | | | | $ — | |
Energy | | | 341,761e | | | | — | | | | — | | | | 241,560 | | | | — | | | | — | | | | — | | | | (264,735 | ) | | | 318,586 | | | | (264,735 | ) |
Materials | | | — | | | | — | e | | | — | | | | — | | | | — | | | | — | | | | — | | | | — | | | | — | e | | | — | |
Corporate Bonds: | | | | | | | | | | | | | | | | | | | | | | | | | | | | | | | | | | | | | | | | |
Capital Goods | | | — | | | | — | | | | — | | | | 794,793 | | | | — | | | | 16,398 | | | | — | | | | (37,991 | ) | | | 773,200 | | | | (37,991 | ) |
Consumer Services | | | — | | | | — | | | | — | | | | 41,250 | | | | — | | | | — | | | | — | | | | — | | | | 41,250 | | | | — | |
Energy | | | 759 | | | | — | | | | — | | | | 527 | | | | — | | | | — | | | | — | | | | (11 | ) | | | 1,275 | | | | (11 | ) |
Senior Floating Rate Interests: | | | | | | | | | | | | | | | | | | | | | | | | | | | | | | | | | | | | | | | | |
Capital Goods | | | — | | | | — | | | | — | | | | 584,370 | | | | — | | | | (1,638 | ) | | | — | | | | 1,638 | | | | 584,370 | | | | 1,638 | |
Marketplace Loans | | | 9,234,251 | | | | 559,325 | | | | (550,905 | ) | | | — | | | | — | | | | — | | | | — | | | | (928,061 | ) | | | 8,314,610 | | | | (928,061 | ) |
Asset-Backed Securities and Commercial Mortgage-Backed Securities: | | | | | | | | | | | | | | | | | | | | | | | | | | | | | | | | | | | | | | | | |
Banks | | | — | | | | — | | | | — | | | | 8,370 | | | | — | | | | — | | | | — | | | | — | | | | 8,370 | | | | — | |
Escrows and Litigation Trusts | | | — | e | | | — | | | | (8,049 | ) | | | 4,000 | | | | — | | | | — | | | | 8,049 | | | | — | | | | 4,000e | | | | — | |
| | | | |
| Total Investments in Securities | | | $9,601,337 | | | | $ 559,325 | | | | $(558,954 | ) | | | $1,674,870 | | | | $(19,653 | ) | | | $ 14,760 | | | | $ 8,049 | | | | $(1,234,073 | ) | | | $10,045,661 | | | | $(1,229,160 | ) |
| | | | |
aTransferred into Level 3 as a result of the unavailability of a quoted market price in an active market for identical securities and other significant observable valuation inputs.
bTransferred out Level 3 as a result of the availability of a quoted price in an active market for identical securities and other significant observable valuation inputs.
cMay include accretion, amortization, partnership adjustments, and/or other cost basis adjustments.
dIncludes common and convertible preferred stocks as well as other equity interests.
eIncludes securities determined to have no value.
| | | | |
| | | |
42 | | Semiannual Report | | franklintempleton.com |
FRANKLIN LIMITED DURATION INCOME TRUST
NOTES TO FINANCIAL STATEMENTS (UNAUDITED)
Significant unobservable valuation inputs for material Level 3 assets and/or liabilities and impact to fair value as a result of changes in unobservable valuation inputs as of June 30, 2020, are as follows:
| | | | | | | | | | | | | | | | |
| Description | | Fair Value at
End of Year | | | Valuation Technique | | Unobservable Input | | Amount | | | Impact to Fair
Value if Input
Increasesa | |
Assets: | | | | | | | | | | | | | | | | |
Investments in Securities: | | | | | | | | | | | | | | | | |
Marketplace Loans – Lending Club | | | 7,644,281 | | | Discounted Cash Flow | | Loss-Adjusted
Discount Rate | | | 7.2% | | | | Decrease | b |
| | | | | | | | | |
| | | | | | | | Projected Loss Rate | | | 27.9% | | | | Decrease | b |
| | | | | | | | | |
Marketplace Loans – Lending Club LCX | | | 490,346 | | | Discounted Cash Flow | | Loss-Adjusted
Discount Rate | | | 9.5% | | | | Decrease | b |
| | | | | | | | | |
| | | | | | | | Projected Loss Rate | | | 18.3% | | | | Decrease | b |
| |
Corporate Bonds: | | | | | | | | | | | | | | | | |
Capital Goods | | | 773,200 | | | Discounted Cash Flow | | Discount rate | | | 17.0% | | | | Decrease | b |
| | | | | | | | | |
| | | | | | | | Free cash flow | | | $0.9 mil | | | | Increase | b |
| |
Senior Floating Rate Interests: | | | | | | | | | | | | | | | | |
Capital Goods | | | 584,370 | | | Market transaction | | Transaction price weighting | | | $83.9 | | | | Decrease | b |
| |
All other investmentsc | | | 553,464d | | | | | | | | | | | | | |
| |
Total | | | $10,045,661 | | | | | | | | | | | | | |
| |
aRepresents the directional change in the fair value of the Level 3 financial instruments that would result from a significant and reasonable increase in the corresponding input. A significant and reasonable decrease in the input would have the opposite effect. Significant impacts, if any, to fair value and/or net assets have been indicated.
bRepresents a significant impact to fair value but not net assets.
cIncludes financial instruments with values derived using private transaction prices or non-public third party pricing information which is unobservable. May also include fair value of immaterial financial instruments and developed using various valuation techniques and unobservable inputs.
dIncludes securities determined to have no value at June 30, 2020.
14. New Accounting Pronouncements
In March 2020, the Financial Accounting Standards Board issued Accounting Standards Update (ASU) No. 2020-04, Reference Rate Reform (Topic 848) – Facilitation of the Effects of Reference Rate Reform on Financial Reporting. The amendments in the ASU provides optional temporary financial reporting relief from the effect of certain types of contract modifications due to the planned discontinuation of the LIBOR and other interbank-offered based reference rates as of the end of 2021. The ASU is effective for certain reference rate-related contract modifications that occur during the period March 12, 2020 through December 31, 2022. Management is currently evaluating the impact, if any, of applying this ASU.
15. Subsequent Events
The Fund has evaluated subsequent events through the issuance of the financial statements and determined that no events have occurred that require disclosure.
| | | | |
| | | |
| franklintempleton.com | | Semiannual Report | | 43 |
FRANKLIN LIMITED DURATION INCOME TRUST
NOTES TO FINANCIAL STATEMENTS (UNAUDITED)
Abbreviations
| | | | | | | | |
| Counterparty | | Selected Portfolio | | |
| | | | |
UBS | | Union Bank of Switzerland | | FHLMC | | Federal Home Loan Mortgage Corp. | | |
| | | | FNMA | | Federal National Mortgage Association | | |
| | | | FRN | | Floating Rate Note | | |
| | | | GNMA | | Government National Mortgage Association | | |
| | | | LIBOR | | London InterBank Offered Rate | | |
| | | | MBS | | Mortgage-Backed Security | | |
| | | | PIK | | Payment-In-Kind | | |
| | | | SF | | Single Family | | |
| | | | USD | | United States Dollar | | |
| | | | |
| | | |
44 | | Semiannual Report | | franklintempleton.com |
FRANKLIN LIMITED DURATION INCOME TRUST
Dividend Reinvestment and Cash Purchase Plan
The Fund’s Dividend Reinvestment Plan (Plan) offers you a prompt and simple way to reinvest dividends and capital gain distributions (Distributions) in shares of the Fund. American Stock Transfer & Trust Company, LLC (Plan Agent), P.O. Box 922, Wall Street Station, New York, NY 10269-0560, acts as your Plan Agent in administering the Plan. The Agent will open an account for you under the Plan in the same name as your outstanding shares are registered.
You are automatically enrolled in the Plan unless you elect to receive Distributions in cash. If you own shares in your own name, you should notify the Agent, in writing, if you wish to receive Distributions in cash.
If the Fund declares a Distribution, you, as a participant in the Plan, will automatically receive an equivalent amount of shares of the Fund purchased on your behalf by the Agent. If on the payment date for a Distribution, the net asset value per share is equal to or less than the market price per share plus estimated brokerage commissions, the Agent shall receive newly issued shares, including fractions, from the Fund for your account. The number of additional shares to be credited shall be determined by dividing the dollar amount of the Distribution by the greater of the net asset value per share on the payment date, or 95% of the then current market price per share.
If the net asset value per share exceeds the market price plus estimated brokerage commissions on the payment date for a Distribution, the Agent (or a broker-dealer selected by the Agent) shall try, for a purchase period of 30 days, to apply the amount of such Distribution on your shares (less your pro rata share of brokerage commissions incurred) to purchase shares on the open market. The weighted average price (including brokerage commissions) of all shares it purchases shall be your allocated price per share. If, before the Agent has completed its purchases, the market price plus estimated brokerage commissions exceeds the net asset value of the shares as of the payment date, the purchase price the Agent paid may exceed the net asset value of the shares, resulting in the acquisition of fewer shares than if such Distribution had been paid in shares issued by the Fund. Participants should note that they will not be able to instruct the Agent to purchase shares at a specific time or at a specific price. The Agent may make open-market purchases on any securities exchange where shares are traded, in the over-the-counter market or in negotiated transactions, and may be on such terms as to price, delivery and otherwise as the Agent shall determine.
The market price of shares on a particular date shall be the last sales price on NYSE MKT, or, if there is no sale on the exchange on that date, then the mean between the closing bid and asked quotations on the exchange on such date. The net asset value per share on a particular date shall be the amount most recently calculated by or on behalf of the Fund as required by law.
The Agent shall at all times act in good faith and agree to use its best efforts within reasonable limits to ensure the accuracy of all services performed under this agreement and to comply with applicable law, but assumes no responsibility and shall not be liable for loss or damage due to errors unless such error is caused by the Agent’s negligence, bad faith, or willful misconduct or that of its employees. Your uninvested funds held by the Agent will not bear interest. The Agent shall have no responsibility for the value of shares acquired. For the purpose of cash investments, the Agent may commingle your funds with those of other participants in the same Fund.
There is no direct charge to participants for reinvesting Distributions, since the Agent’s fees are paid by the Fund. However, when shares are purchased in the open market, each participant will pay a pro rata portion of any brokerage commissions incurred. If you elect by notice to the Agent to have it sell part or all of your shares and remit the proceeds, the Agent will deduct brokerage commissions from the proceeds.
The automatic reinvestment of Distributions does not relieve you of any taxes that may be payable on Distributions. In connection with the reinvestment of Distributions, shareholders generally will be treated as having received a Distribution equal to the cash Distribution that would have been paid.
The Agent will forward to you any proxy solicitation material and will vote any shares so held for you first in accordance with the instructions set forth on proxies you return to the Fund, and then with respect to any proxies you do not return to the Fund in the same portion as the Agent votes proxies the participants return to the Fund.
| | | | |
| | | |
| franklintempleton.com | | Semiannual Report | | 45 |
FRANKLIN LIMITED DURATION INCOME TRUST
DIVIDEND REINVESTMENT AND CASH PURCHASE PLAN
As long as you participate in the Plan, the Agent will hold the shares it has acquired for you in safekeeping, in its name or in the name of its nominee. This convenience provides added protection against loss, theft or inadvertent destruction of certificates. However, you may request that a certificate representing your Plan shares be issued to you. Upon your written request, the Agent will deliver to you, without charge, a certificate or certificates for the full shares. The Agent will send you a confirmation of each acquisition made for your account as soon as practicable, but not later than 60 days after the acquisition date. Although from time to time you may have an undivided fractional interest in a share of the Fund, no certificates for a fractional share will be issued. Distributions on fractional shares will be credited to your account. If you terminate your account under the Plan, the Agent will adjust for any such undivided fractional interest in cash at the market value of shares at the time of termination.
You may withdraw from the Plan at any time, without penalty, by notifying the Agent in writing at the address above or by telephone at (800) 416-5585. Such termination will be effective with respect to a Distribution if the Agent receives your notice prior to the Distribution record date. The Agent or the Fund may terminate the Plan upon notice to you in writing mailed at least 30 days prior to any record date for the payment of any Distribution. Upon any termination, the Agent will issue, without charge, stock certificates for all full shares you own and will convert any fractional shares you hold at the time of termination to cash at current market price and send you a check for the proceeds.
The Fund or the Agent may amend the Plan. You will receive written notice at least 30 days before the effective date of any amendment.
| | | | |
| | | |
46 | | Semiannual Report | | franklintempleton.com |
FRANKLIN LIMITED DURATION INCOME TRUST
Shareholder Information
Board Approval of Investment Management Agreements
FRANKLIN LIMITED DURATION INCOME TRUST (Fund)
At an in-person meeting held on February 25, 2020 (Meeting), the Board of Trustees (Board) of the Fund, including a majority of the trustees who are not “interested persons” as defined in the Investment Company Act of 1940 (Independent Trustees), reviewed and approved the continuance of the investment management agreement between Franklin Advisers, Inc. (Manager) and the Fund (Management Agreement) for an additional one-year period. The Independent Trustees received advice from and met separately with Independent Trustee counsel in considering whether to approve the continuation of the Management Agreement.
In considering the continuation of the Management Agreement, the Board reviewed and considered information provided by the Manager at the Meeting and throughout the year at meetings of the Board and its committees. The Board also reviewed and considered information provided in response to a detailed set of requests for information submitted to the Manager by Independent Trustee counsel on behalf of the Independent Trustees in connection with the annual contract renewal process. In addition, prior to the Meeting, the Independent Trustees held a telephonic contract renewal meeting at which the Independent Trustees conferred amongst themselves and Independent Trustee counsel about contract renewal matters. The Board reviewed and considered all of the factors it deemed relevant in approving the continuance of the Management Agreement, including, but not limited to: (i) the nature, extent and quality of the services provided by the Manager; (ii) the investment performance of the Fund; (iii) the costs of the services provided and profits realized by the Manager and its affiliates from the relationship with the Fund; (iv) the extent to which economies of scale are realized as the Fund grows; and (v) whether fee levels reflect these economies of scale for the benefit of Fund investors.
In approving the continuance of the Management Agreement, the Board, including a majority of the Independent Trustees, determined that the terms of the Management Agreement are fair and reasonable and that the continuance of such Management Agreement is in the interests of the Fund and its shareholders. While attention was given to all information furnished, the following
discusses some primary factors relevant to the Board’s determination.
Nature, Extent and Quality of Services
The Board reviewed and considered information regarding the nature, extent and quality of investment management services provided by the Manager and its affiliates to the Fund and its shareholders. This information included, among other things, the qualifications, background and experience of the senior management and investment personnel of the Manager, as well as information on succession planning where appropriate; the structure of investment personnel compensation; oversight of third-party service providers; investment performance reports and related financial information for the Fund (including its share price discount to net asset value); reports on expenses and shareholder services; legal and compliance matters; risk controls; pricing and other services provided by the Manager and its affiliates; and management fees charged by the Manager and its affiliates to US funds and other accounts, including management’s explanation of differences among accounts where relevant. The Board noted management’s continuing efforts and expenditures in establishing effective business continuity plans and developing strategies to address areas of heightened concern in the mutual fund industry, such as cybersecurity and liquidity risk management.
The Board also reviewed and considered the benefits provided to Fund shareholders of investing in a fund that is part of the Franklin Templeton (FT) family of funds. The Board noted the financial position of Franklin Resources, Inc. (FRI), the Manager’s parent, and its commitment to the mutual fund business as evidenced by its continued introduction of new funds, reassessment of the fund offerings in response to the market environment and project initiatives and capital investments relating to the services provided to the Fund by the FT organization. The Board specifically noted FT’s commitment to enhancing services and controlling costs, as reflected in its plan to outsource certain administrative functions, and growth opportunities, as evidenced by its upcoming acquisition of the Legg Mason companies. The Board acknowledged the change in leadership at FRI and the opportunity to hear from Jennifer Johnson, President and Chief Executive Officer of FRI, about goals she has for the company that will benefit the Funds.
Following consideration of such information, the Board was satisfied with the nature, extent and quality of services
| | | | |
| | | |
| franklintempleton.com | | Semiannual Report | | 47 |
FRANKLIN LIMITED DURATION INCOME TRUST
SHAREHOLDER INFORMATION
provided by the Manager and its affiliates to the Fund and its shareholders.
Fund Performance
The Board reviewed and considered the performance results of the Fund over various time periods ended December 31, 2019. The Board considered the performance returns for the Fund in comparison to the performance returns of mutual funds deemed comparable to the Fund included in a universe (Performance Universe) selected by Broadridge Financial Solutions, Inc. (Broadridge), an independent provider of investment company data. The Board received a description of the methodology used by Broadridge to select the mutual funds included in a Performance Universe. The Board also reviewed and considered Fund performance reports provided and discussions that occurred with portfolio managers at Board meetings throughout the year. A summary of the Fund’s performance results is below. Such results are based on net asset value without regard to market discounts or premiums.
The Performance Universe for the Fund included the Fund and all leveraged closed-end general bond funds. The Board noted that the Fund’s annualized income return for the one-year period was above the median of its Performance Universe and exceeded 10.0%, but for the three-, five- and 10-year periods was below the median of its Performance Universe. The Board also noted that the Fund’s annualized total return for the one-, three-, five- and 10-year periods was below the median and in the fifth quintile (worst) of the Fund’s Performance Universe. The Board discussed this performance with management and management explained that the Performance Universe was composed of a disparate group of fixed-income closed-end funds, noting that only one of these funds has the same multi-sector asset mix as the Fund and limited duration investment mandate followed by the Fund. The Board took this explanation into account and noted that the Fund’s annualized income return for each of the one-, three-, five- and 10-year periods exceeded 6.0% and annualized total return for the one-year period exceeded 9.0%. Given management’s explanation and the Fund’s income-oriented investment objective, the Board concluded that the Fund’s performance was satisfactory.
Fund Performance
The Board reviewed and considered the performance results of the Fund over various time periods ended December 31, 2019. The Board considered the performance returns for the Fund in comparison to the performance returns of mutual funds deemed comparable to the Fund included in a
universe (Performance Universe) selected by Broadridge Financial Solutions, Inc. (Broadridge), an independent provider of investment company data. The Board received a description of the methodology used by Broadridge to select the mutual funds included in a Performance Universe. The Board also reviewed and considered Fund performance reports provided and discussions that occurred with portfolio managers at Board meetings throughout the year. A summary of the Fund’s performance results is below. Such results are based on net asset value without regard to market discounts or premiums.
The Performance Universe for the Fund included the Fund and all leveraged closed-end general bond funds. The Board noted that the Fund’s annualized income return for the one-year period was above the median of its Performance Universe and exceeded 10.0%, but for the three-, five- and 10-year periods was below the median of its Performance Universe. The Board also noted that the Fund’s annualized total return for the one-, three-, five- and 10-year periods was below the median and in the fifth quintile (worst) of the Fund’s Performance Universe. The Board discussed this performance with management and management explained that the Performance Universe was composed of a disparate group of fixed-income closed-end funds, noting that only one of these funds has the same multi-sector asset mix as the Fund and limited duration investment mandate followed by the Fund. The Board took this explanation into account and noted that the Fund’s annualized income return for each of the one-, three-, five- and 10-year periods exceeded 6.0% and annualized total return for the one-year period exceeded 9.0%. Given management’s explanation and the Fund’s income-oriented investment objective, the Board concluded that the Fund’s performance was satisfactory.
Comparative Fees and Expenses
The Board reviewed and considered information regarding the Fund’s actual total expense ratio and its various components, including, as applicable, management fees; underlying fund expenses; investment-related expenses; and other non-management fees. The Board considered the actual total expense ratio and, separately, the contractual management fee rate, without the effect of fee waivers, if any (Management Rate) of the Fund in comparison to the median expense ratio and median Management Rate, respectively, of other mutual funds deemed comparable to and with a similar expense structure to the Fund selected by Broadridge (Expense Group). Broadridge fee and expense data is based upon information taken from each fund’s most recent annual report, which reflects historical asset levels.
| | | | |
| | | |
48 | | Semiannual Report | | franklintempleton.com |
FRANKLIN LIMITED DURATION INCOME TRUST
SHAREHOLDER INFORMATION
While recognizing such inherent limitation and the fact that expense ratios and Management Rates generally increase as assets decline and decrease as assets grow, the Board believed the independent analysis conducted by Broadridge to be an appropriate measure of comparative fees and expenses. The Broadridge Management Rate includes administrative charges. The Board received a description of the methodology used by Broadridge to select the mutual funds included in the Expense Group.
The Expense Group for the Fund included the Fund and eight other debt leveraged closed-end general bond funds. The Board noted that the Management Rate was equal to the median of its Expense Group. The Board also noted that the actual total expense ratio for the Fund was below the median of its Expense Group. The Board concluded that the Management Rate charged to the Fund is reasonable.
Profitability
The Board reviewed and considered information regarding the profits realized by the Manager and its affiliates in connection with the operation of the Fund. In this respect, the Board considered the Fund profitability analysis provided by the Manager that addresses the overall profitability of FT’s US fund business, as well as its profits in providing investment management and other services to each of the individual funds during the 12-month period ended September 30, 2019, being the most recent fiscal year-end for FRI. The Board noted that although management continually makes refinements to its methodologies used in calculating profitability in response to organizational and product-related changes, the overall methodology has remained consistent with that used in the Fund’s profitability report presentations from prior years. Additionally, PricewaterhouseCoopers LLP, auditor to FRI and certain FT funds, was engaged by the Manager to review and assess the allocation methodologies to be used solely by the Fund’s Board with respect to the profitability analysis.
The Board noted management’s belief that costs incurred in establishing the infrastructure necessary for the type of mutual fund operations conducted by the Manager and its affiliates may not be fully reflected in the expenses allocated to the Fund in determining its profitability, as well as the fact that the level of profits, to a certain extent, reflected operational cost savings and efficiencies initiated by management. As part of this evaluation, the Board considered the initiative currently underway to outsource certain operations, which effort would require considerable up front expenditures by the Manager but, over the long run
is expected to result in greater efficiencies. The Board also noted management’s expenditures in improving shareholder services provided to the Fund, as well as the need to implement systems and meet additional regulatory and compliance requirements resulting from recent US Securities and Exchange Commission and other regulatory requirements, notably in the area of cybersecurity protections.
The Board also considered the extent to which the Manager and its affiliates might derive ancillary benefits from fund operations, potential benefits resulting from personnel and systems enhancements necessitated by fund growth, as well as increased leverage with service providers and counterparties. Based upon its consideration of all these factors, the Board concluded that the level of profits realized by the Manager and its affiliates from providing services to the Fund was not excessive in view of the nature, extent and quality of services provided to the Fund.
Economies of Scale
The Board reviewed and considered the extent to which the Manager may realize economies of scale, if any, as the Fund grows larger and whether the Fund’s management fee structure reflects any economies of scale for the benefit of shareholders. The Board believes that the Manager’s ability to realize economies of scale and the sharing of such benefit is a more relevant consideration in the case of an open-end fund whose size increases as a result of the continuous sale of its shares. A closed-end fund, such as the Fund, does not continuously offer shares, and growth following its initial public offering will primarily result from market appreciation, which benefits its shareholders. While believing economies of scale to be less of a factor in the context of a closed-end fund, the Board believes at some point an increase in size may lead to economies of scale that would be shared with the Fund and its shareholders and intends to monitor future growth of the Fund accordingly. The Board considered the Manager’s view that any analyses of potential economies of scale in managing a particular fund are inherently limited in light of the joint and common costs and investments the Manager incurs across the FT family of funds as a whole.
Conclusion
Based on its review, consideration and evaluation of all factors it believed relevant, including the above-described factors and conclusions, the Board unanimously approved the continuation of the Management Agreement for an additional one-year period.
| | | | |
| | | |
| franklintempleton.com | | Semiannual Report | | 49 |
FRANKLIN LIMITED DURATION INCOME TRUST
SHAREHOLDER INFORMATION
Proxy Voting Policies and Procedures
The Fund’s investment manager has established Proxy Voting Policies and Procedures (Policies) that the Fund uses to determine how to vote proxies relating to portfolio securities. Shareholders may view the Fund’s complete Policies online at franklintempleton.com. Alternatively, shareholders may request copies of the Policies free of charge by calling the Proxy Group collect at (954) 527-7678 or by sending a written request to: Franklin Templeton Companies, LLC, 300 S.E. 2nd Street, Fort Lauderdale, FL 33301, Attention: Proxy Group. Copies of the Fund’s proxy voting records are also made available online at franklintempleton.com and posted on the U.S. Securities and Exchange Commission’s website at sec.gov and reflect the most recent 12-month period ended June 30.
Quarterly Statement of Investments
The Fund files a complete statement of investments with the U.S. Securities and Exchange Commission for the first and third quarters for each fiscal year as an exhibit to its report on Form N-PORT. Shareholders may view the filed Form N-PORT by visiting the Commission’s website at sec.gov. The filed form may also be viewed and copied at the Commission’s Public Reference Room in Washington, DC. Information regarding the operations of the Public Reference Room may be obtained by calling (800) SEC-0330.
| | | | |
| | | |
50 | | Semiannual Report | | franklintempleton.com |
This page intentionally left blank.
This page intentionally left blank.
To help ensure we provide you with quality service, all calls to and from our service areas are monitored and/or recorded.
| | | | |
 | | Semiannual Report Franklin Limited Duration Income Trust |
| | |
| | Investment Manager | | Transfer Agent |
| | Franklin Advisers, Inc. | | American Stock Transfer & Trust Co., LLC |
| | (800) DIAL BEN® / 342-5236 | | 6201 15th Avenue |
| | | | Brooklyn, NY 11219 |
| | | | www.astfinancial.com |
| | |
© 2020 Franklin Templeton Investments. All rights reserved. | | FTF S 08/20 |
| (a) | The Registrant has adopted a code of ethics that applies to its principal executive officers and principal financial and accounting officer. |
| (f) | Pursuant to Item 13(a)(1), the Registrant is attaching as an exhibit a copy of its code of ethics that applies to its principal executive officers and principal financial and accounting officer. |
| Item 3. | Audit Committee Financial Expert. |
(a)(1) The Registrant has an audit committee financial expert serving on its audit committee.
(2) The audit committee financial expert is Mary C. Choksi and she is “independent” as defined under the relevant Securities and Exchange Commission Rules and Releases.
| Item 4. | Principal Accountant Fees and Services. N/A |
| Item 5. | Audit Committee of Listed Registrants. |
Member of the Audit Committee is Mary C. Choksi.
| Item 6. | Schedule of Investments. N/A |
| Item 7. | Disclosure of Proxy Voting Policies and Procedures for Closed-End Management Investment Companies. |
The board of trustees of the Fund has delegated the authority to vote proxies related to the portfolio securities held by the Fund to the Fund’s investment manager, Franklin Advisers, Inc., in accordance with the Proxy Voting Policies and Procedures (Policies) adopted by the investment manager.
The investment manager has delegated its administrative duties with respect to the voting of proxies for securities to the Proxy Group within Franklin Templeton Companies, LLC (Proxy Group), an affiliate and wholly owned subsidiary of Franklin Resources, Inc. All proxies received by the Proxy Group will be voted based upon the investment manager’s instructions and/or policies. The investment manager votes proxies solely in the best interests of the Fund and its shareholders.
To assist it in analyzing proxies of equity securities, the investment manager subscribes to Institutional Shareholder Services, Inc. (ISS), an unaffiliated third-party corporate governance research service that provides in-depth analyses of shareholder meeting agendas, vote recommendations, vote execution services, ballot reconciliation services, recordkeeping and vote disclosure services. In addition, the investment manager subscribes to Glass, Lewis & Co., LLC (Glass Lewis), an unaffiliated third-party analytical research firm, to receive analyses and vote recommendations on the shareholder meetings of publicly held U.S. companies, as well as a limited subscription to its international research. Also, the investment manager has a supplemental subscription to Egan-Jones Proxy Services (Egan-Jones), an unaffiliated third party proxy advisory firm, to receive analyses and vote recommendations. Although analyses provided by ISS, Glass Lewis, Egan-Jones, and/or another independent third party proxy service provider (each a Proxy Service) are thoroughly reviewed and considered in making a final voting decision, the investment manager does not consider recommendations from a Proxy Service or any third party to be determinative of the investment manager’s ultimate decision. Rather, the investment manager exercises its independent judgment in making voting decisions. For most proxy proposals, the investment manager’s evaluation should result in the same position being taken for all Funds. In some cases, however, the evaluation may result in a Fund voting differently, depending upon the nature and objective of the Fund, the composition of its portfolio and other factors. As a matter of policy, the officers, directors/trustees and employees of the investment manager and the Proxy Group will not be influenced by outside sources whose interests conflict with the interests of the Fund and its shareholders. Efforts are made to resolve all conflicts in the best interests of the investment manager’s clients. Material conflicts of interest are identified by the Proxy Group based upon analyses of client, distributor, broker-dealer and vendor lists, information periodically
gathered from directors and officers, and information derived from other sources, including public filings. In situations where a material conflict of interest is identified, the Proxy Group may vote consistent with the voting recommendation of a Proxy Service; or send the proxy directly to the Fund’s board or a committee of the board with the investment manager’s recommendation regarding the vote for approval.
Where a material conflict of interest has been identified, but the items on which the investment manager’s vote recommendations differ from a Proxy Service and relate specifically to (1) shareholder proposals regarding social or environmental issues, (2) “Other Business” without describing the matters that might be considered, or (3) items the investment manager wishes to vote in opposition to the recommendations of an issuer’s management, the Proxy Group may defer to the vote recommendations of the investment manager rather than sending the proxy directly to the Fund’s board or a board committee for approval.
To avoid certain potential conflicts of interest, the investment manager will employ echo voting or pass-through voting, if possible, in the following instances: (1) when the Fund invests in an underlying fund in reliance on any one of Sections 12(d)(1)(F) or (G) of the 1940 Act, the rules thereunder, or pursuant to a SEC exemptive order thereunder; (2) when the Fund invests uninvested cash in affiliated money market funds pursuant to the rules under the 1940 Act or any exemptive orders thereunder (“cash sweep arrangement”); or (3) when required pursuant to the Fund’s governing documents or applicable law. Echo voting means that the investment manager will vote the shares in the same proportion as the vote of all of the other holders of the underlying fund’s shares. With respect to instances when a Franklin Templeton U.S. registered investment company invests in an underlying fund in reliance on any one of Sections 12(d)(1)(F) or (G) of the 1940 Act, the rules thereunder, or pursuant to an SEC exemptive order thereunder, and there are no other unaffiliated shareholders also invested in the underlying fund, the investment manager will vote in accordance with the recommendation of such investment company’s board of trustees or directors. In addition, to avoid certain potential conflicts of interest, and where required under a fund’s governing documents or applicable law, the investment manager will employ pass-through voting when a Franklin Templeton U.S. registered investment company invests in an underlying fund in reliance on Section 12(d)(1)(E) of the 1940 Act, the rules thereunder, or pursuant to an SEC exemptive order thereunder. In “pass-through voting,” a feeder fund will solicit voting instructions from its shareholders as to how to vote on the master fund’s proposals.
The recommendation of management on any issue is a factor that the investment manager considers in determining how proxies should be voted. However, the investment manager does not consider recommendations from management to be determinative of the investment manager’s ultimate decision. As a matter of practice, the votes with respect to most issues are cast in accordance with the position of the company’s management. Each issue, however, is considered on its own merits, and the investment manager will not support the position of the company’s management in any situation where it deems that the ratification of management’s position would adversely affect the investment merits of owning that company’s shares.
Engagement with issuers. The investment manager believes that engagement with issuers is important to good corporate governance and to assist in making proxy voting decisions. The investment manager may engage with issuers to discuss specific ballot items to be voted on in advance of an annual or special meeting
to obtain further information or clarification on the proposals. The investment manager may also engage with management on a range of environmental, social or corporate governance issues throughout the year.
Investment manager’s proxy voting policies and principles The investment manager has adopted general proxy voting guidelines, which are summarized below. These guidelines are not an exhaustive list of all the issues that may arise and the investment manager cannot anticipate all future situations. In all cases, each proxy and proposal (including both management and shareholder proposals) will be considered based on the relevant facts and circumstances on a case-by-case basis.
Board of directors. The investment manager supports an independent, diverse board of directors, and prefers that key committees such as audit, nominating, and compensation committees be comprised of independent directors. The investment manager supports boards with strong risk management oversight. The investment manager will generally vote against management efforts to classify a board and will generally support proposals to declassify the board of directors. The investment manager will consider withholding votes from directors who have attended less than 75% of meetings without a valid reason. While generally in favor of separating Chairman and CEO positions, the investment manager will review this issue as well as proposals to restore or provide for cumulative voting on a case-by-case basis, taking into consideration factors such as the company’s corporate governance guidelines or provisions and performance. The investment manager generally will support non-binding shareholder proposals to require a majority vote standard for the election of directors; however, if these proposals are binding, the investment manager will give careful review on a case-by-case basis of the potential ramifications of such implementation.
In the event of a contested election, the investment manager will review a number of factors in making a decision including management’s track record, the company’s financial performance, qualifications of candidates on both slates, and the strategic plan of the dissidents and/or shareholder nominees.
Ratification of auditors of portfolio companies. The investment manager will closely scrutinize the independence, role and performance of auditors. On a case-by-case basis, the investment manager will examine proposals relating to non-audit relationships and non-audit fees. The investment manager will also consider, on a case-by-case basis, proposals to rotate auditors, and will vote against the ratification of auditors when there is clear and compelling evidence of a lack of independence, accounting irregularities or negligence. The investment manager may also consider whether the ratification of auditors has been approved by an appropriate audit committee that meets applicable composition and independence requirements.
Management and director compensation. A company’s equity-based compensation plan should be in alignment with the shareholders’ long-term interests. The investment manager believes that executive compensation should be directly linked to the performance of the company. The investment manager evaluates plans on a case-by-case basis by considering several factors to determine whether the plan is fair and reasonable, including the ISS quantitative model utilized to assess such plans and/or the Glass Lewis evaluation of the plans. The investment manager will generally oppose plans that have the potential to be excessively dilutive, and will almost always oppose plans that are structured to allow the repricing of underwater options, or plans that have an automatic share replenishment “evergreen” feature. The investment manager will
generally support employee stock option plans in which the purchase price is at least 85% of fair market value, and when potential dilution is 10% or less.
Severance compensation arrangements will be reviewed on a case-by-case basis, although the investment manager will generally oppose “golden parachutes” that are considered to be excessive. The investment manager will normally support proposals that require a percentage of directors’ compensation to be in the form of common stock, as it aligns their interests with those of shareholders.
The investment manager will review non-binding say-on-pay proposals on a case-by-case basis, and will generally vote in favor of such proposals unless compensation is misaligned with performance and/or shareholders’ interests, the company has not provided reasonably clear disclosure regarding its compensation practices, or there are concerns with the company’s remuneration practices.
Anti-takeover mechanisms and related issues. The investment manager generally opposes anti-takeover measures since they tend to reduce shareholder rights. However, as with all proxy issues, the investment manager conducts an independent review of each anti-takeover proposal. On occasion, the investment manager may vote with management when the research analyst has concluded that the proposal is not onerous and would not harm the Fund or its shareholders’ interests. The investment manager generally supports proposals that require shareholder rights’ plans (“poison pills”) to be subject to a shareholder vote and will closely evaluate such plans on a case-by-case basis to determine whether or not they warrant support. In addition, the investment manager will generally vote against any proposal to issue stock that has unequal or subordinate voting rights. The investment manager generally opposes any supermajority voting requirements as well as the payment of “greenmail.” The investment manager generally supports “fair price” provisions and confidential voting. The investment manager will review a company’s proposal to reincorporate to a different state or country on a case-by-case basis taking into consideration financial benefits such as tax treatment as well as comparing corporate governance provisions and general business laws that may result from the change in domicile.
Changes to capital structure. The investment manager realizes that a company’s financing decisions have a significant impact on its shareholders, particularly when they involve the issuance of additional shares of common or preferred stock or the assumption of additional debt. The investment manager will review, on a case-by-case basis, proposals by companies to increase authorized shares and the purpose for the increase. The investment manager will generally not vote in favor of dual-class capital structures to increase the number of authorized shares where that class of stock would have superior voting rights. The investment manager will generally vote in favor of the issuance of preferred stock in cases where the company specifies the voting, dividend, conversion and other rights of such stock and the terms of the preferred stock issuance are deemed reasonable. The investment manager will review proposals seeking preemptive rights on a case-by-case basis.
Mergers and corporate restructuring. Mergers and acquisitions will be subject to careful review by the research analyst to determine whether they would be beneficial to shareholders. The investment manager will analyze various economic and strategic factors in making the final decision on a merger or acquisition. Corporate restructuring proposals are also subject to a thorough examination on a case-by-case basis.
Environmental and social issues. The investment manager considers environmental and social issues alongside traditional financial measures to provide a more comprehensive view of the value, risk and return potential of an investment. Companies may face significant financial, legal and reputational risks resulting from poor environmental and social practices, or negligent oversight of environmental or social issues. Franklin Templeton’s “Responsible Investment Principles and Policies” describes the investment manager’s approach to consideration of environmental, social and governance issues within the investment manager’s processes and ownership practices.
Shareholder proposals: The investment manager will review shareholder proposals on a case-by-case basis and may support those that serve to enhance value or mitigate risk, are drafted appropriately, and do not disrupt the course of business or require a disproportionate or inappropriate use of company resources.
The investment manager will consider supporting a shareholder proposal seeking disclosure and greater board oversight of lobbying and corporate political contributions if the investment manager believes that there is evidence of inadequate oversight by the company’s board, if the company’s current disclosure is significantly deficient, or if the disclosure is notably lacking in comparison to the company’s peers.
Governance matters. The investment manager generally supports the right of shareholders to call special meetings and act by written consent. However, the investment manager will review such shareholder proposals on a case-by-case basis in an effort to ensure that such proposals do not disrupt the course of business or require a disproportionate or inappropriate use of company resources.
Proxy access. In cases where the investment manager is satisfied with company performance and the responsiveness of management, it will generally vote against shareholder proxy access proposals not supported by management. In other instances, the investment manager will consider such proposals on a case-by-case basis, taking into account factors such as the size of the company, ownership thresholds and holding periods, nomination limits (e.g., number of candidates that can be nominated), the intentions of the shareholder proponent, and shareholder base.
Global corporate governance. Many of the tenets discussed above are applied to the investment manager’s proxy voting decisions for international investments. However, the investment manager must be flexible in these worldwide markets. Principles of good corporate governance may vary by country, given the constraints of a country’s laws and acceptable practices in the markets. As a result, it is on occasion difficult to apply a consistent set of governance practices to all issuers. As experienced money managers, the investment manager’s analysts are skilled in understanding the complexities of the regions in which they specialize and are trained to analyze proxy issues germane to their regions.
The investment manager will generally attempt to process every proxy it receives for all domestic and foreign securities. However, there may be situations in which the investment manager may be unable to successfully vote a proxy, or may choose not to vote a proxy, such as where: (i) a proxy ballot was not received from the custodian bank; (ii) a meeting notice was received too late; (iii) there are fees imposed upon the exercise of a vote and it is determined that such fees outweigh the benefit of voting; (iv) there are legal
encumbrances to voting, including blocking restrictions in certain markets that preclude the ability to dispose of a security if the investment manager votes a proxy or where the investment manager is prohibited from voting by applicable law, economic or other sanctions, or other regulatory or market requirements, including but not limited to, effective Powers of Attorney; (v) additional documentation or the disclosure of beneficial owner details is required; (vi) the investment manager held shares on the record date but has sold them prior to the meeting date; (vii) a proxy voting service is not offered by the custodian in the market; (viii) due to either system error or human error, the investment manager’s intended vote is not correctly submitted; (ix) the investment manager believes it is not in the best interest of the Fund or its shareholders to vote the proxy for any other reason not enumerated herein; or (x) a security is subject to a securities lending or similar program that has transferred legal title to the security to another person.
In some non-U.S. jurisdictions, even if the investment manager uses reasonable efforts to vote a proxy on behalf of the Fund, such vote or proxy may be rejected because of (a) operational or procedural issues experienced by one or more third parties involved in voting proxies in such jurisdictions; (b) changes in the process or agenda for the meeting by the issuer for which the investment manager does not have sufficient notice; or (c) the exercise by the issuer of its discretion to reject the vote of the investment manager. In addition, despite the best efforts of the Proxy Group and its agents, there may be situations where the investment manager’s votes are not received, or properly tabulated, by an issuer or the issuer’s agent.
The investment manager or its affiliates may, on behalf of one or more of the proprietary registered investment companies advised by the investment manager or its affiliates, determine to use its best efforts to recall any security on loan where the investment manager or its affiliates (a) learn of a vote on a material event that may affect a security on loan and (b) determine that it is in the best interests of such proprietary registered investment companies to recall the security for voting purposes.
Procedures for meetings involving fixed income securities & privately held issuers. From time to time, certain custodians may process events for fixed income securities through their proxy voting channels rather than corporate action channels for administrative convenience. In such cases, the Proxy Group will receive ballots for such events on the ISS voting platform. The Proxy Group will solicit voting instructions from the investment manager for each Fund involved. If the Proxy Group does not receive voting instructions from the investment manager, the Proxy Group will take no action on the event. The investment manager may be unable to vote a proxy for a fixed income security, or may choose not to vote a proxy, for the reasons described above.
In the rare instance where there is a vote for a privately held issuer, the decision will generally be made by the relevant portfolio managers or research analysts.
The Proxy Group will monitor such meetings involving fixed income securities or privately held issuers for conflicts of interest in accordance with these procedures. If a fixed income or privately held issuer is flagged as a potential conflict of interest, the investment manager may nonetheless vote as it deems in the best interests of the Fund. The investment manager will report such decisions on an annual basis to the Fund board as may be required.
Shareholders may view the complete Policies online at franklintempleton.com. Alternatively, shareholders may request copies of the Policies free of charge by calling the Proxy Group collect at (954) 527-7678 or by sending a written request to: Franklin Templeton Companies, LLC, 300 S.E. 2nd Street, Fort Lauderdale, FL 33301-1923, Attention: Proxy Group. Copies of the Fund’s proxy voting records are available online at franklintempleton.com and posted on the SEC website at www.sec.gov. The proxy voting records are updated each year by August 31 to reflect the most recent 12-month period ended June 30.
| Item 8. | Portfolio Managers of Closed-End Management Investment Companies. N/A |
| Item 9. | Purchases of Equity Securities by Closed-End Management Investment Company and Affiliated Purchasers. N/A |
| Item 10. | Submission of Matters to a Vote of Security Holders. |
There have been no changes to the procedures by which shareholders may recommend nominees to the Registrant’s Board of Trustees that would require disclosure herein.
| Item 11. | Controls and Procedures. |
(a) Evaluation of Disclosure Controls and Procedures. The Registrant maintains disclosure controls and procedures that are designed to provide reasonable assurance that information required to be disclosed in the Registrant’s filings under the Securities Exchange Act of 1934, as amended, and the Investment Company Act of 1940 is recorded, processed, summarized and reported within the periods specified in the rules and forms of the Securities and Exchange Commission. Such information is accumulated and communicated to the Registrant’s management, including its principal executive officer and principal financial officer, as appropriate, to allow timely decisions regarding required disclosure. The Registrant’s management, including the principal executive officer and the principal financial officer, recognizes that any set of controls and procedures, no matter how well designed and operated, can provide only reasonable assurance of achieving the desired control objectives.
Within 90 days prior to the filing date of this Shareholder Report on Form N-CSR, the Registrant had carried out an evaluation, under the supervision and with the participation of the Registrant’s management, including the Registrant’s principal executive officer and the Registrant’s principal financial officer, of the effectiveness of the design and operation of the Registrant’s disclosure controls and procedures. Based on such evaluation, the Registrant’s principal executive officer and principal financial officer concluded that the Registrant’s disclosure controls and procedures are effective.
(b) Changes in Internal Controls. There have been no changes in the Registrant’s internal control over financial reporting that occurred during the
period covered by this report that has materially affected, or is reasonably likely to materially affect the internal control over financial reporting.
| Item 12. | Disclosure of Securities Lending Activities for Closed-End Management Investment Company. N/A |
(a) (1) Code of Ethics
(a) (2) Certifications pursuant to Section 302 of the Sarbanes-Oxley Act of 2002 of Matthew T. Hinkle , Chief Executive Officer - Finance and Administration, and Gaston Gardey, Chief Financial Officer and Chief Accounting Officer
(b) Certifications pursuant to Section 906 of the Sarbanes-Oxley Act of 2002 of Matthew T. Hinkle, Chief Executive Officer - Finance and Administration, and Gaston Gardey, Chief Financial Officer and Chief Accounting Officer
SIGNATURES
Pursuant to the requirements of the Securities Exchange Act of 1934 and the Investment Company Act of 1940, the registrant has duly caused this report to be signed on its behalf by the undersigned, thereunto duly authorized.
Franklin Limited Duration Income Trust
| | |
| By | | S\MATTHEW T. HINKLE |
| | Matthew T. Hinkle |
| | Chief Executive Officer – Finance and Administration |
| Date | | August 25, 2020 |
Pursuant to the requirements of the Securities Exchange Act of 1934 and the Investment Company Act of 1940, this report has been signed below by the following persons on behalf of the registrant and in the capacities and on the dates indicated.
| | |
| By | | S\MATTHEW T. HINKLE |
| | Matthew T. Hinkle |
| | Chief Executive Officer – Finance and Administration |
| Date | | August 25, 2020 |
| | |
| By | | S\GASTON GARDEY |
| | Gaston Gardey |
| | Chief Financial Officer and Chief Accounting Officer |
| Date | | August 25, 2020 |