PRESENTATION REGARDING:
Ryerson Inc.
Discussion Materials
August 10, 2007
Discussion Materials
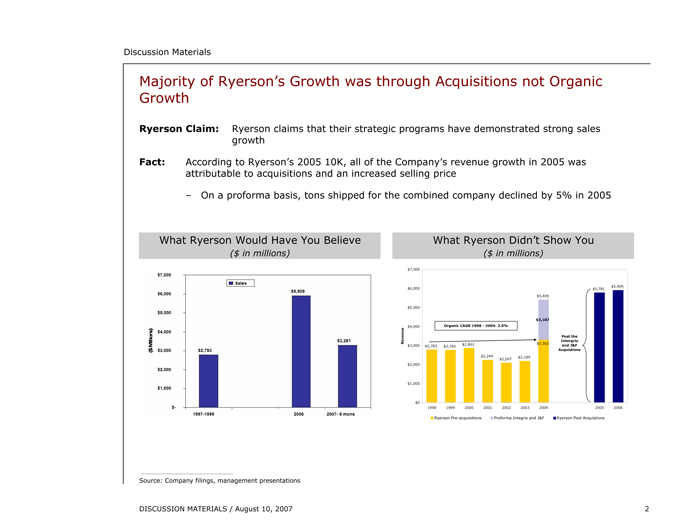
Majority of Ryerson’s Growth was through Acquisitions not Organic Growth
Ryerson Claim: Ryerson claims that their strategic programs have demonstrated strong sales growth
Fact: According to Ryerson’s 2005 10K, all of the Company’s revenue growth in 2005 was attributable to acquisitions and an increased selling price
On a proforma basis, tons shipped for the combined company declined by 5% in 2005
What Ryerson Would Have You Believe
($ in millions) What Ryerson Didn’t Show You
($ in millions)
[GRAPHIC APPEARS HERE]
Source: Company filings, management presentations
DISCUSSION MATERIALS / August 10, 2007
2
Discussion Materials
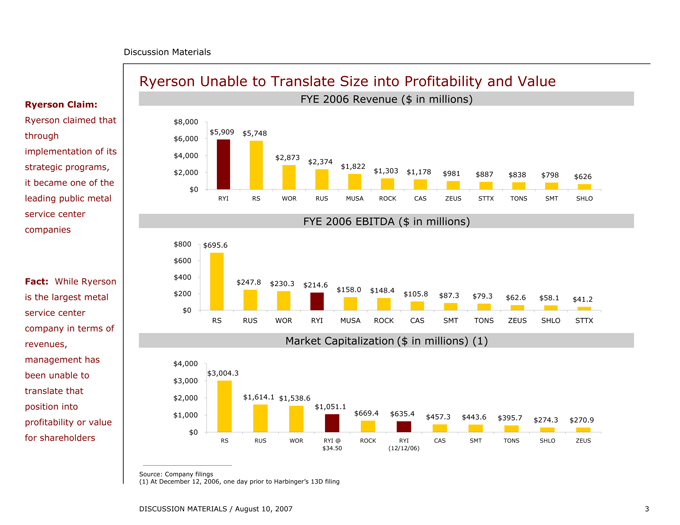
Ryerson Claim: Ryerson claimed that through implementation of its strategic programs, it became one of the leading public metal service center companies
Fact: While Ryerson is the largest metal service center company in terms of revenues, management has been unable to translate that position into profitability or value for shareholders
Ryerson Unable to Translate Size into Profitability and Value
FYE 2006 Revenue ($ in millions)
Market Capitalization ($ in millions) (1)
|
$ 8,000 |
$5,909 $ 5,748 |
$6,000 |
$4,000 $ 2,873 |
$2,374 |
$1,822 |
$2,000 $ 1,303 $ 1,178 $ 981 |
$887 $ 838 $ 798 $ 626 |
$0 |
RYI RS WOR RUS MUSA ROCK CAS ZEUS STTX TONS SMT SHLO |
FYE 2006 EBITDA ( $ in millions) |
$800 $ 695.6 |
$600 |
$400 |
$247.8 $ 230.3 $ 214.6 |
$158.0 $ 148.4 |
$200 $ 105.8 $ 87.3 $ 79.3 |
$62.6 $ 58.1 $ 41.2 |
$0 |
RS RUS WOR RYI MUSA ROCK CAS SMT TONS ZEUS SHLO STTX |
Market Capitalization ( $ in millions) (1) |
$4,000 |
$3,004.3 |
$3,000 |
$2,000 $ 1,614.1 $ 1,538.6 |
$1,051.1 |
$1,000 $ 669.4 $ 635.4 |
$457.3 $ 443.6 $ 395.7 $ 274.3 $ 270.9 |
$0 |
RS RUS WOR RYI @ ROCK RYI CAS SMT TONS SHLO ZEUS |
$34.50(12/12/06) |
Source: Company filings
(1) At December 12, 2006, one day prior to Harbinger’s 13D filing
DISCUSSION MATERIALS / August 10, 2007
3
Discussion Materials
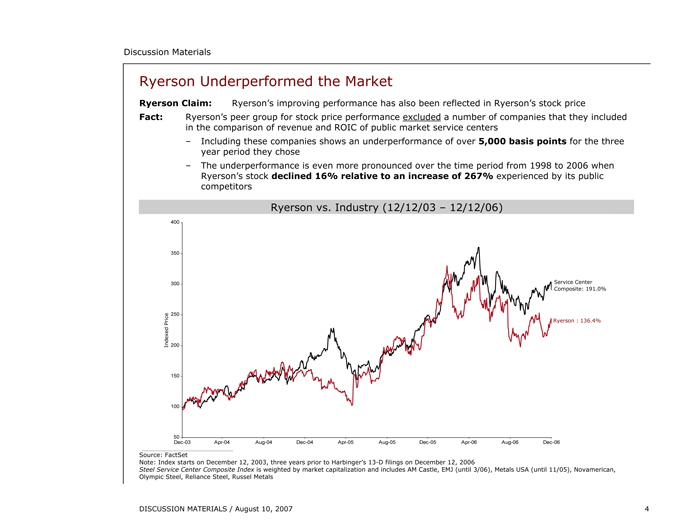
Ryerson Underperformed the Market
Ryerson Claim: Ryerson’s improving performance has also been reflected in Ryerson’s stock price
Fact: Ryerson’s peer group for stock price performance excluded a number of companies that they included in the comparison of revenue and ROIC of public market service centers
Including these companies shows an underperformance of over 5,000 basis points for the three year period they chose
The underperformance is even more pronounced over the time period from 1998 to 2006 when Ryerson’s stock declined 16% relative to an increase of 267% experienced by its public competitors
Ryerson vs. Industry (12/12/03 – 12/12/06)
[GRAPHIC APPEARS HERE]
| | | | | | | | | | | | | | | | | | | | |
| | | 400 | | | | | | | | | | | | | | | | | | |
| | | 350 | | | | | | | | | | | | | | | | | | |
| | | 300 | | | | | | | | | | | | | | | | | | Service Center |
| | | | | | | | | | | | | | | | | | | | | Composite: 191.0% |
| | | 250 | | | | | | | | | | | | | | | | | | |
Price | | | | | | | | | | | | | | | | | | | | Ryerson : 136.4% |
Indexed | | | | | | | | | | | | | | | | | | | | |
| | | | | 200 | | 150 | | 100 | | | | | | | | | | | | |
| | | 50 | | | | | | | | | | | | | | | | | | |
| | | Dec-03 | | Apr-04 | | Aug-04 | | Dec-04 | | Apr-05 | | Aug-05 | | Dec-05 | | Apr-06 | | Aug-06 | | Dec-06 |
Source: FactSet
Note: Index starts on December 12, 2003, three years prior to Harbinger’s 13-D filings on December 12, 2006
Steel Service Center Composite Index is weighted by market capitalization and includes AM Castle, EMJ (until 3/06), Metals USA (until 11/05), Novamerican, Olympic Steel, Reliance Steel, Russel Metals
DISCUSSION MATERIALS / August 10, 2007
4
Discussion Materials
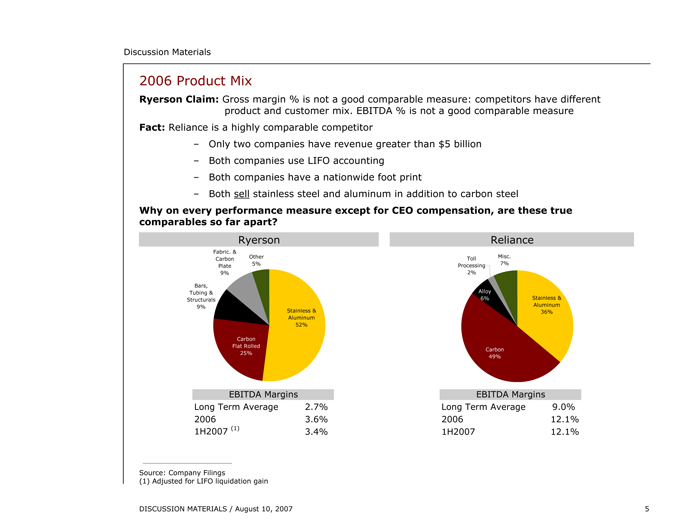
2006 Product Mix
Ryerson Claim: Gross margin % is not a good comparable measure: competitors have different product and customer mix. EBITDA % is not a good comparable measure
Fact: Reliance is a highly comparable competitor
Only two companies have revenue greater than $5 billion
Both companies use LIFO accounting
Both companies have a nationwide foot print
Both sell stainless steel and aluminum in addition to carbon steel
Why on every performance measure except for CEO compensation, are these true comparables so far apart?
Ryerson Fabric. & Carbon Plate 9% Other 5% Bars, Tubing & Structurals 9% Carbon Flat Rolled 25% Stainless & Aluminum 52%
Reliance Toll Processing 2% Misc. 7% Alloy 6% Carbon 49% Stainless & Aluminum 36%
EBITDA Margins Long Term Average 2.7% 2006 3.6% 1H2007 (1) 3.4%
EBITDA Margins Long Term Average 9.0% 2006 12.1% 1H2007 12.1%
Source: Company Filings
(1) Adjusted for LIFO liquidation gain
DISCUSSION MATERIALS / August 10, 2007
5
Discussion Materials
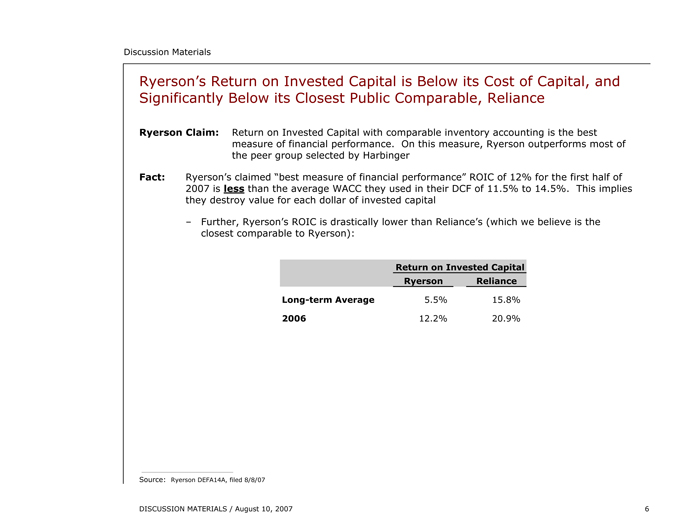
Ryerson’s Return on Invested Capital is Below its Cost of Capital, and Significantly Below its Closest Public Comparable, Reliance
Ryerson Claim: Return on Invested Capital with comparable inventory accounting is the best measure of financial performance. On this measure, Ryerson outperforms most of the peer group selected by Harbinger
Fact: Ryerson’s claimed “best measure of financial performance” ROIC of 12% for the first half of 2007 is less than the average WACC they used in their DCF of 11.5% to 14.5%. This implies they destroy value for each dollar of invested capital
Further, Ryerson’s ROIC is drastically lower than Reliance’s (which we believe is the closest comparable to Ryerson):
| | | | |
| | | Return on Invested Capital |
| | | Ryerson | | Reliance |
Long-term Average | | 5.5% | | 15.8% |
2006 | | 12.2% | | 20.9% |
Source: Ryerson DEFA14A, filed 8/8/07
DISCUSSION MATERIALS / August 10, 2007
6
Discussion Materials
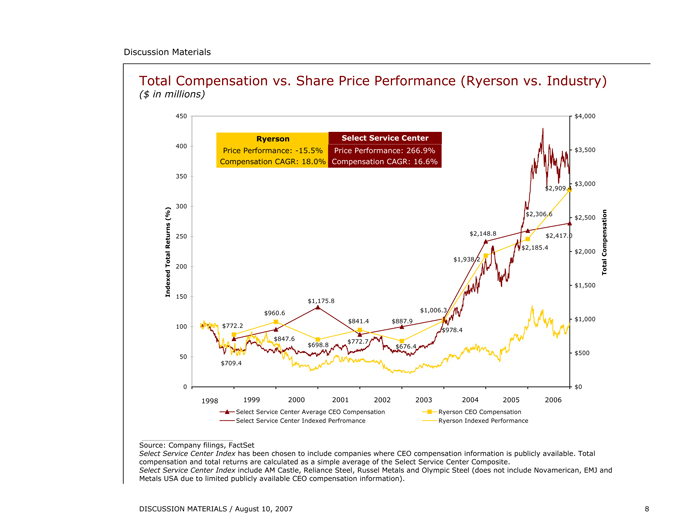
Ryerson’s Compensation Increased More Rapidly than its Public Competitors while its Stock Underperformed on a Relative Basis
Ryerson Claim: Ryerson’s board has insured that management incentive compensation is aligned with stockholders
Fact: While Ryerson’s CEO compensation is based upon achieving certain operating performance metrics, it is clearly not aligned with stock price performance
Since 1998, Ryerson’s share price declined approximately by 16% while CEO total compensation increased by 277%, for a compounded annual growth rate of 18%
This compares with an average share price increase of 267% for Ryerson’s comparable companies an increase in compensation of 241% (17% compounded annual growth rate)
DISCUSSION MATERIALS / August 10, 2007
7
Discussion Materials
Total Compensation vs. Share Price Performance (Ryerson vs. Industry)
($ in millions)
[GRAPHIC APPEARS HERE]
Source: Company filings, FactSet
Select Service Center Index has been chosen to include companies where CEO compensation information is publicly available. Total compensation and total returns are calculated as a simple average of the Select Service Center Composite.
Select Service Center Index include AM Castle, Reliance Steel, Russel Metals and Olympic Steel (does not include Novamerican, EMJ and Metals USA due to limited publicly available CEO compensation information).
DISCUSSION MATERIALS / August 10, 2007
8
Discussion Materials
Ryerson’s Discounted Cash Flow Analysis Understates Value
Ryerson Claim: Ryerson’s discounted cash flow analysis implies an equity value per share range of $27 - $41 before considering execution risk
| | |
Facts: | | > Stating that the value implied by the DCF analysis does not consider execution risk is confusing—a discounted cash flow accounts for the execution risk through the use of a discount rate higher than the risk free rate |
> Ryerson’s DCF analysis does not appear to account for the value of excess inventory sold in 2Q of approximately $150 million, or approximately $5 per share
> Ryerson’s terminal multiple range is lower than the multiple being paid by Platinum. Is this because they believe that the multiple being paid is inflated due to underperformance?
> If an exit multiple equal to the multiple of the proposed transaction with Platinum is used (9.6x Adjusted LTM EBITDA of $197.7 million), the current per share value would be between $63 and $73
DISCUSSION MATERIALS / August 10, 2007
9
Discussion Materials
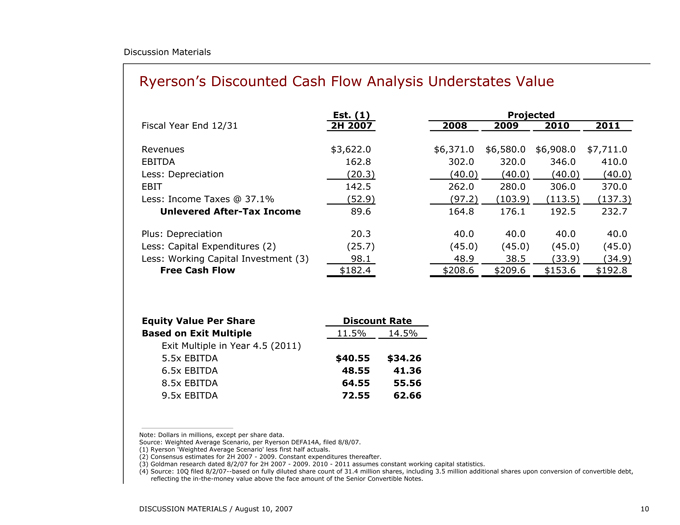
Ryerson’s Discounted Cash Flow Analysis Understates Value
Est. (1) Projected
Fiscal Year End 12/31 2H 2007 2008 2009 2010 2011
Revenues $3,622.0 $6,371.0 $6,580.0 $6,908.0 $7,711.0
EBITDA 162.8 302.0 320.0 346.0 410.0
Less: Depreciation (20.3) (40.0) (40.0) (40.0) (40.0)
EBIT 142.5 262.0 280.0 306.0 370.0
Less: Income Taxes @ 37.1% (52.9) (97.2) (103.9) (113.5) (137.3)
Unlevered After-Tax Income 89.6 164.8 176.1 192.5 232.7
Plus: Depreciation 20.3 40.0 40.0 40.0 40.0
Less: Capital Expenditures (2) (25.7) (45.0) (45.0) (45.0) (45.0)
Less: Working Capital Investment (3) 98.1 48.9 38.5 (33.9) (34.9)
Free Cash Flow $182.4 $208.6 $209.6 $153.6 $192.8
Equity Value Per Share Discount Rate
Based on Exit Multiple 11.5% 14.5%
Exit Multiple in Year 4.5 (2011)
5.5x EBITDA $40.55 $34.26
6.5x EBITDA 48.55 41.36
8.5x EBITDA 64.55 55.56
9.5x EBITDA 72.55 62.66
Note: Dollars in millions, except per share data.
Source: Weighted Average Scenario, per Ryerson DEFA14A, filed 8/8/07.
(1) Ryerson ‘Weighted Average Scenario’ less first half actuals.
(2) Consensus estimates for 2H 2007 - 2009. Constant expenditures thereafter.
(3) Goldman research dated 8/2/07 for 2H 2007 - 2009. 2010 - 2011 assumes constant working capital statistics.
(4) Source: 10Q filed 8/2/07 — based on fully diluted share count of 31.4 million shares, including 3.5 million additional shares upon conversion of convertible debt, reflecting the in-the-money value above the face amount of the Senior Convertible Notes.
DISCUSSION MATERIALS / August 10, 2007
10
Discussion Materials
Value Lost in Selling Now
Ryerson Claim: Timing is appropriate to consider a sale as Ryerson is already performing better than most public companies
Fact: Many operational efficiencies have yet to be achieved. Selling now eliminates the possibility for current shareholder to realize value from these improvements
“There will be an increased sense of urgency related to our financial performance. While our strategic direction will remain the same, there will be a growing emphasis on financial results.” – Neil Novich, Employee FAQ July 24, 2007
“In terms of the inventory, we just continue to improve the systems and reporting and so on…there’s a whole punch list of better tools and better reports and processes and so on that — are being worked through, one by one, to continue to improve the process.” – Neil Novich (Earnings Conference Call Q1 2007)
The Company has stated the following goals:
Complete conversion of all service centers to SAP and achieve targeted savings
Consistently achieve 5 inventory turns
Continue to implement Six Sigma program to offset inflation
Expand global metals trading to reduce purchased material costs
Improve performance at service centers lagging overall company performance
Value lost is selling now
| | |
6/30/2007 LTM EBITDA Margins (1) | | Implied Value (in millions) |
Ryerson | | Reliance |
3.2% | | 11.8% |
LTM Revenue | | $ 6,234.0 |
Long-term Avg EBITDA Margin | | 9.0% |
Implied EBITDA | | $561.1 |
Multiple | | 5.4x |
TEV | | $3,029.72 |
Less: 6/30/2007 Net Debt | | 840.8 |
Implied Equity Value | | $2,188.9 |
Fully Diluted Shares | | 31.4 |
Implied Share Price | | $69.71 |
Platinum Offer | | 34.50 |
Potential Value Lost | | $35.21 |
(1) Ryerson margin adjusted for LIFO Liquidation gain per Ryerson June 30, 2007 10Q
DISCUSSION MATERIALS / August 10, 2007
11
Discussion Materials
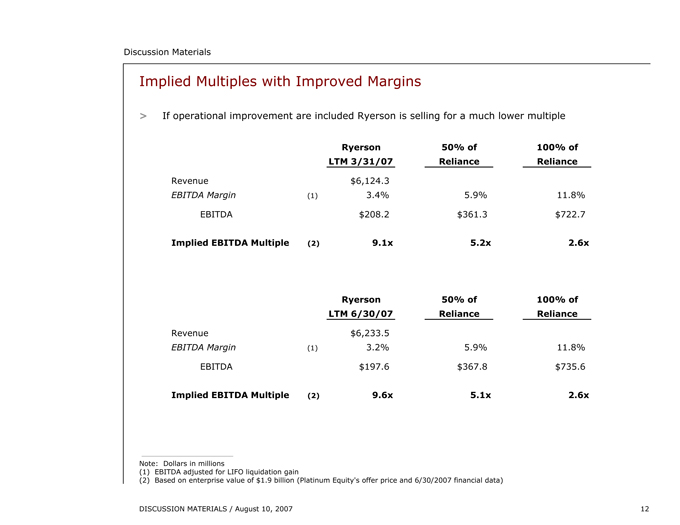
Implied Multiples with Improved Margins
> If operational improvement are included Ryerson is selling for a much lower multiple
| | | | | | | | |
| | | | Ryerson | | | 50% of | | 100% of |
| | |
| LTM
3/31/07 |
| | Reliance | | Reliance |
Revenue | | $ | 6,124.3 | | | | | |
EBITDA Margin (1) | | | 3.4 | % | | 5.9% | | 11.8% |
EBITDA | | $ | 208.2 | | | $361.3 | | $722.7 |
Implied EBITDA Multiple (2) | | | 9.1x | | | 5.2x | | 2.6x |
| | | | Ryerson | | | 50% of | | 100% of |
| | |
| LTM
6/30/07 |
| | Reliance | | Reliance |
Revenue | | $ | 6,233.5 | | | | | |
EBITDA Margin (1) | | | 3.2 | % | | 5.9% | | 11.8% |
EBITDA | | $ | 197.6 | | | $367.8 | | $735.6 |
Implied EBITDA Multiple (2) | | | 9.6x | | | 5.1x | | 2.6x |
Note: Dollars in millions
(1) EBITDA adjusted for LIFO liquidation gain
(2) Based on enterprise value of $1.9 billion (Platinum Equity’s offer price and 6/30/2007 financial data)
DISCUSSION MATERIALS / August 10, 2007
12
Discussion Materials
Ryerson is Trading at a Large Discount to Reliance on both Price to Book Value and Tangible Book Value Basis
Price / Book and Tangible Book Value
| | | | | | |
| | | | | Price / | | |
| | | | | | | Tangible |
| | | Book | | | | Book |
Ryerson | | 1.2x | | | | 1.3x |
Reliance | | 1.9x | | | | 5.4x |
Implied Ryerson Price at Reliance Book and Tangible Book Value Multiples
($ in millions)
| | | | | | | | | | | | | | | | | | |
Book Value | | | | | $ | | | | 742.7 | | Tangible Book Value | | | | | $ | | 683.0 |
Reliance Multiple | | | | | | | | | 1.9x | | Reliance Multiple | | | | | | | 5.4x |
Implied Equity | | | | | | | | $ | 1,411.1 | | Implied Equity | | | | | $3,688.2 |
Price Per Share | | (1 | ) | | | | | $ | 44.94 | | Price Per Share | | (1 | ) | | $117.46 |
Source: Company filings
(1) Based on fully diluted shares outstanding
DISCUSSION MATERIALS / August 10, 2007
13
Discussion Materials
Is Now the Right Time to Sell?
> The financing markets are experiencing significant disruption
> Go-shop and no-shop periods are ineffective as many of the potential competing bidders currently have no ability to secure committed financing
> Extreme volatility in both the equity and debt markets make it more difficult for a competing bidder to emerge
DISCUSSION MATERIALS / August 10, 2007
14