EXHIBIT (f)(ii)
The Queensland Government Report Entitled
“Economic and Fiscal Challenges – Interim Results of Medium Term Modelling”
FORWARD-LOOKING STATEMENTS
This exhibit contains forward-looking statements. Statements that are not historical facts, including statements about the State of Queensland’s (the “State” or “Queensland”) beliefs and expectations, are forward-looking statements. These statements are based on current plans, budgets, estimates and projections and therefore you should not place undue reliance on them. The words “believe”, “may”, “will”, “should”, “estimate”, “continue”, “anticipate”, “intend”, “expect” and similar words are intended to identify forward-looking statements. Forward-looking statements speak only as of the date they are made, and neither the Queensland Treasury Corporation nor the State undertake any obligation to update publicly any of them in light of new information or future events.
Forward-looking statements are based on current plans, estimates and projections and, therefore, undue reliance should not be placed on them. Although the Queensland Treasury Corporation and the State believe that the beliefs and expectations reflected in such forward-looking statements are reasonable, no assurance can be given that such beliefs and expectations will prove to have been correct. Forward-looking statements involve inherent risks and uncertainties. We caution you that actual results may differ materially from those contained in any forward-looking statements.
A number of important factors could cause actual results to differ materially from those expressed in any forward-looking statement. Factors that could cause the actual outcomes to differ materially from those expressed or implied in forward-looking statements include:
| | • | | the international and Australian economies, and in particular the rates of growth (or contraction) of the State’s major trading partners; |
| | • | | the effects, both internationally and in Australia, of any further global financial crisis, any subsequent economic downturn, the ongoing economic, banking and sovereign debt crisis in Europe and any stalling of the protracted United States recovery; |
| | • | | increases or decreases in international and Australian domestic interest rates; |
| | • | | changes in the State’s domestic consumption; |
| | • | | changes in the State’s labor force participation and productivity; |
| | • | | downgrades in the credit ratings of the State and Australia; |
| | • | | changes in the rate of inflation in the State; |
| | • | | changes in environmental and other regulation; and |
| | • | | changes in the distribution of revenue from the Commonwealth of Australia Government to the State. |
Queensland Treasury and Trade Economic and Fiscal Challenges Interim Results of Medium Term Modelling March 2014 Great state. Great opportunity.

© Crown copyright All rights reserved Queensland Government 2014 Excerpts from this publication may be reproduced, with appropriate acknowledgement, as permitted under the Copyright Act.
FOREWORD Queensland is a Great State with Great Opportunity. Over recent years we have faced a number of challenges and together as a community we have risen to conquer them. The debt and deficit challenge confronting all of us is another challenge we must conquer. The Independent Commission of Audit provided Queenslanders with an unprecedented body of medium and long term information on the State’s finances and structural challenges. In its response to the Commission’s Report, the Queensland Government committed to openness and transparency together with a mature discussion about the choices confronting Government. This includes a commitment to the introduction of a Charter of Budget Accountability and the publication of additional information outlining long-term demographic, economic and fiscal trends. For many years, the previous Government spent more money than it earned, with fiscal deficits totalling $29 billion between 2006-07 and 2011-12 and locking in further fiscal deficits from 2012-13 onwards. As a result, General Government sector debt has increased from $2 billion in 2006-07 to $38 billion in 2012-13 and is on its way to $48 billion in 2016-17. The Newman Government has taken significant measures to repair the State’s annual Budget and is on track to deliver a fiscal surplus in 2015-16 – the first fiscal surplus in a decade. While this means that debt grows more slowly in the future, a significant reduction in debt levels is not expected. On current settings, the State’s total debt, including that of Government owned businesses, will reach approximately $80 billion in 2014-15 (over $16,000 per person) and increase to $121 billion (over $21,000 per person) in 2022-23. Queensland’s debt levels are already much higher than any other state on a per person basis. We all understand that there are times when it makes sense to borrow to invest, but we also all understand that there is a limit to how much you should sensibly borrow. Debt comes with a substantial and growing cost in the form of interest payments, which will cost the Government $4 billion this year. Perhaps more importantly, having high levels of debt means the Government has less capacity to address future challenges and invest in projects that will provide benefits to the community and the economy in the future. Queensland Treasury has identified a set of challenges the Government will face into the future, with medium term modelling showing that on current settings, expense growth will outpace revenue growth due to service demands in areas such as Health, Education and Disability Services. The modelling also shows that we will need to invest more in infrastructure into the future, as the economy and the State continues to grow, with Queensland’s population of 4.6 million projected to increase to 7 million in just over 20 years from now. Queensland’s economy is on the cusp of strong growth, with the recent Queensland State Accounts showing our economy is growing at 4.1%, which is around double the growth rate of the rest of Australia at 1.9%. We are outperforming the rest of the nation, as the Queensland Government strives to build a diverse four pillar economy. Based on Queensland Treasury’s current forecasts, strong growth will continue. We have every reason to be optimistic about the future. However, we are not immune from the broader structural challenges facing Australia, specifically those relating to an ageing population together with workforce participation and productivity challenges. While Queensland’s relative performance will remain strong, trends in these drivers of growth have implications for our standard of living and the Government’s finances. The information in this document highlights the challenges we face and the need to make clear choices about Queensland’s future financial position. It also highlights the importance of the Government’s current efforts to improve productivity and boost the economy. The Queensland Government remains committed to an open dialogue with Queenslanders about the challenges, opportunities and choices that confront us. Tim Nicholls MP Treasurer and Minister for Trade 1 Economic and Fiscal Challenges
PREFACE The Independent Queensland Commission of Audit presented economic and fiscal projections over the period to 2050-51 in its Final Report in February 2013, finding that: “Long-term economic projections by the Commission show that Queensland’s per capita economic growth rate over the period to 2050-51 could be around half that of the last 26 years. The ageing population is likely to generate significant economic and fiscal challenges for the State. Strong and decisive action is necessary to restore Queensland’s record of economic and productivity growth. It is necessary to take decisive action to repair state finances and prepare for the challenges posed by demographic change and other factors.” Queensland Treasury and Trade (Treasury) has prepared economic and fiscal projections, based broadly on the Commission’s methodology, but utilising more recent data set out in the 2013-14 Mid Year Fiscal and Economic Review. The purpose of the projections is to identify the State’s economic and fiscal challenges over the next decade to 2022-23. The projections should not be considered to be forecasts, but rather are designed as a baseline scenario to demonstrate future economic and fiscal challenges under existing policy settings. These projections have been prepared on a ‘no policy change’ basis, but do incorporate the impact of policy commitments that extend beyond the standard forward estimates period (to 2016-17), such as the State expenditure associated with the National Health Reform Agreement, the National Disability Insurance Scheme and the 2018 Commonwealth Games. The projections are medium term scenarios with the results in individual years being reflective of this, rather than specific estimates of outcomes in particular years. The projections indicate that Queensland’s rate of economic growth in the coming decade should be stronger than the rest of the nation. However, the economy faces structural challenges in the form of lower rates of working age population growth, productivity growth and labour force participation. Unless there is concerted policy action to address these challenges, economic growth (and hence revenue growth) is expected to be slower over the longer term than in the past. With growth in expenditure expected to substantially outpace revenue growth, the projections indicate that current policy settings would result in the State returning to a fiscal deficit beyond the forward estimates period, with a corresponding increase in debt. Even under a scenario which involves stronger revenue growth and lower capital expenditure than Treasury’s baseline medium term projections, fiscal deficits would re-emerge, thereby resulting in even more debt. 2 Economic and Fiscal Challenges

SUMMARY ? Projections of Queensland’s economic growth and the State Budget have been prepared for the period 2017-18 to 2022-23. Structural changes in the economy will lead to slower revenue growth than experienced in the past decade. ? While current policy settings are supportive of lower expenditure growth than occurred in the past decade, service delivery pressures, particularly in areas such as Health, Education and Disability Services, are expected to result in expenses outpacing revenue growth. General Government sector capital spending is also projected to increase after 2016-17. ? The key issue of projected expenditure demands exceeding revenue growth is consistent with other publications, such as the Commission of Audit’s Final Report, the Grattan Institute’s Budget Pressures on Australian Governments, the Australian Government’s Intergenerational Report and the New South Wales Government’s Long Term Fiscal Pressures Report. ? As a result of expenditure pressures outpacing revenue growth, the Budget is projected to return to a fiscal deficit from 2017-18 onwards and deteriorate each year, without further action. ? With no corrective action being taken, State borrowings (Non-financial Public Sector) are projected to increase from almost $80 billion, or more than $16,000 per person, in 2014-15, to $121 billion, or more than $21,000 per person, in 2022-23. 3 Economic and Fiscal Challenges
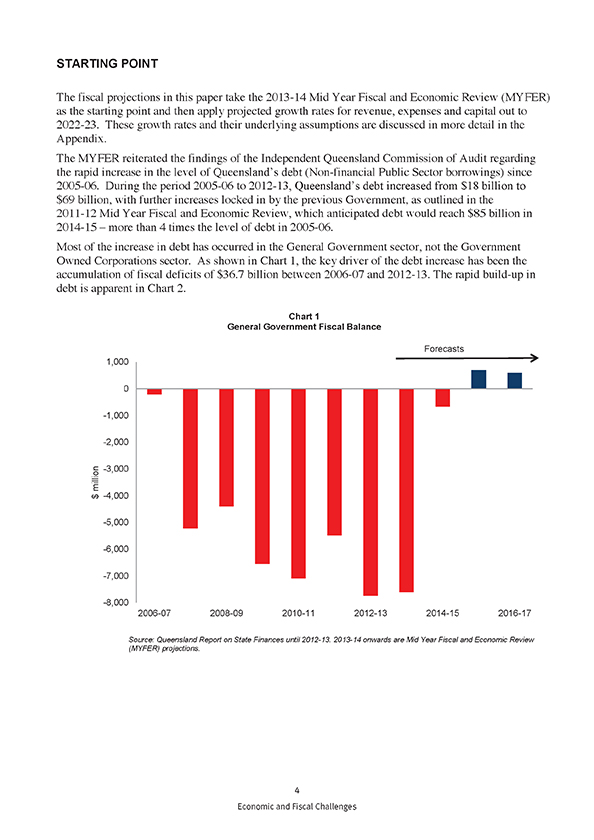
STARTING POINT The fiscal projections in this paper take the 2013-14 Mid Year Fiscal and Economic Review (MYFER) as the starting point and then apply projected growth rates for revenue, expenses and capital out to 2022-23. These growth rates and their underlying assumptions are discussed in more detail in the Appendix. The MYFER reiterated the findings of the Independent Queensland Commission of Audit regarding the rapid increase in the level of Queensland’s debt (Non-financial Public Sector borrowings) since 2005-06. During the period 2005-06 to 2012-13, Queensland’s debt increased from $18 billion to $69 billion, with further increases locked in by the previous Government, as outlined in the 2011-12 Mid Year Fiscal and Economic Review, which anticipated debt would reach $85 billion in 2014-15 – more than 4 times the level of debt in 2005-06. Most of the increase in debt has occurred in the General Government sector, not the Government Owned Corporations sector. As shown in Chart 1, the key driver of the debt increase has been the accumulation of fiscal deficits of $36.7 billion between 2006-07 and 2012-13. The rapid build-up in debt is apparent in Chart 2. Chart 1 General Government Fiscal Balance Source: Queensland Report on State Finances until 2012-13. 2013-14 onwards are Mid Year Fiscal and Economic Review (MYFER) projections. 4 Economic and Fiscal Challenges
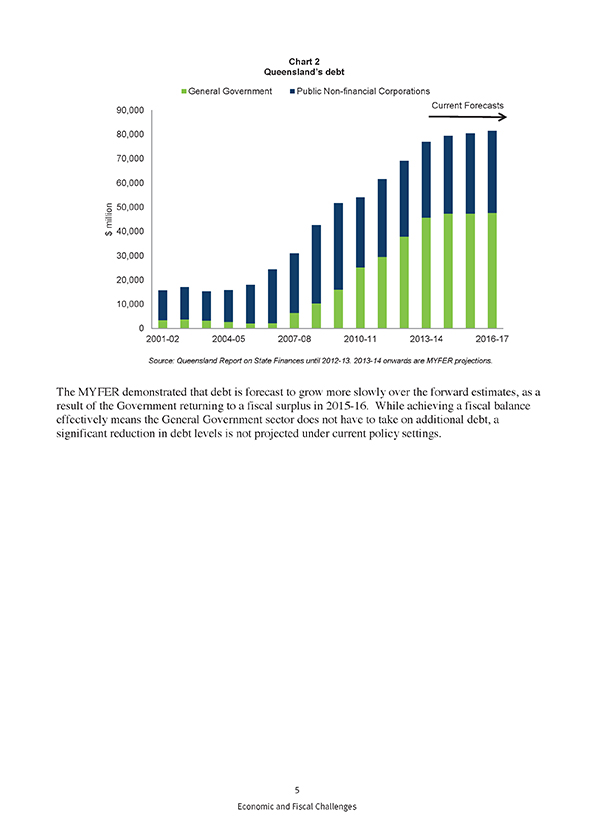
Chart 2 Queensland’s debt Source: Queensland Report on State Finances until 2012-13. 2013-14 onwards are MYFER projections. The MYFER demonstrated that debt is forecast to grow more slowly over the forward estimates, as a result of the Government returning to a fiscal surplus in 2015-16. While achieving a fiscal balance effectively means the General Government sector does not have to take on additional debt, a significant reduction in debt levels is not projected under current policy settings. 5 Economic and Fiscal Challenges
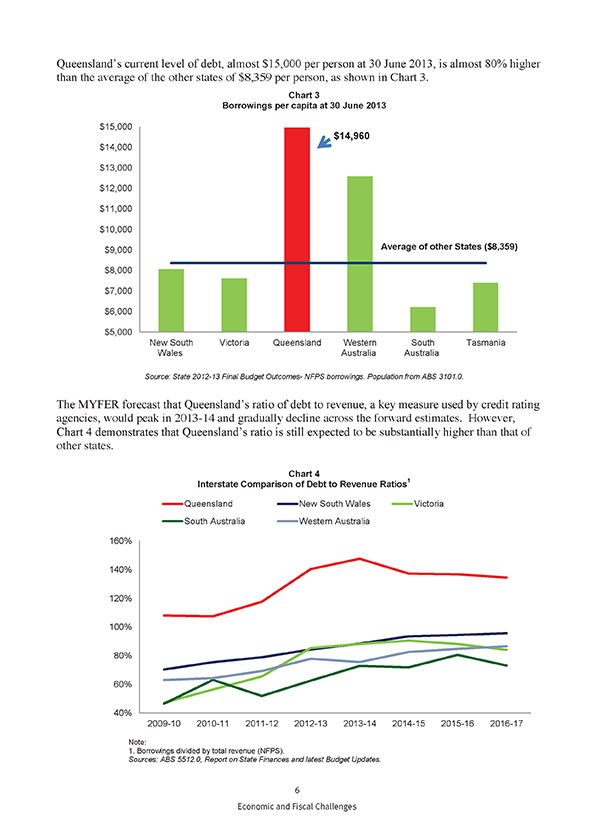
Queensland’s current level of debt, almost $15,000 per person at 30 June 2013, is almost 80% higher than the average of the other states of $8,359 per person, as shown in Chart 3. Chart 3 Borrowings per capita at 30 June 2013 Source: State 2012-13 Final Budget Outcomes- NFPS borrowings. Population from ABS 3101.0. The MYFER forecast that Queensland’s ratio of debt to revenue, a key measure used by credit rating agencies, would peak in 2013-14 and gradually decline across the forward estimates. However, Chart 4 demonstrates that Queensland’s ratio is still expected to be substantially higher than that of other states. Chart 4 1 Interstate Comparison of Debt to Revenue Ratios Note: 1. Borrowings divided by total revenue (NFPS). Sources: ABS 5512.0, Report on State Finances and latest Budget Updates. 6 Economic and Fiscal Challenges
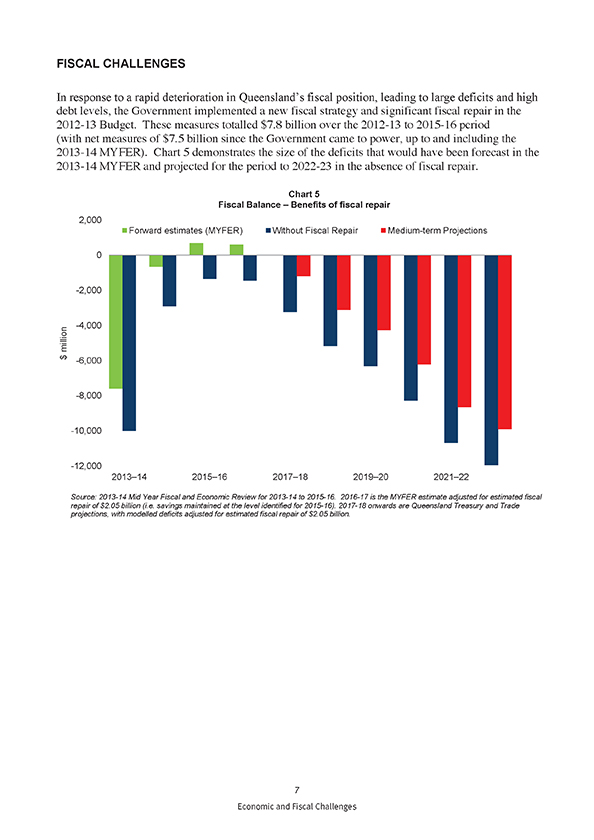
FISCAL CHALLENGES In response to a rapid deterioration in Queensland’s fiscal position, leading to large deficits and high debt levels, the Government implemented a new fiscal strategy and significant fiscal repair in the 2012-13 Budget. These measures totalled $7.8 billion over the 2012-13 to 2015-16 period (with net measures of $7.5 billion since the Government came to power, up to and including the 2013-14 MYFER). Chart 5 demonstrates the size of the deficits that would have been forecast in the 2013-14 MYFER and projected for the period to 2022-23 in the absence of fiscal repair. Chart 5 Fiscal Balance – Benefits of fiscal repair Source: 2013-14 Mid Year Fiscal and Economic Review for 2013-14 to 2015-16. 2016-17 is the MYFER estimate adjusted for estimated fiscal repair of $2.05 billion (i.e. savings maintained at the level identified for 2015-16). 2017-18 onwards are Queensland Treasury and Trade projections, with modelled deficits adjusted for estimated fiscal repair of $2.05 billion. 7 Economic and Fiscal Challenges
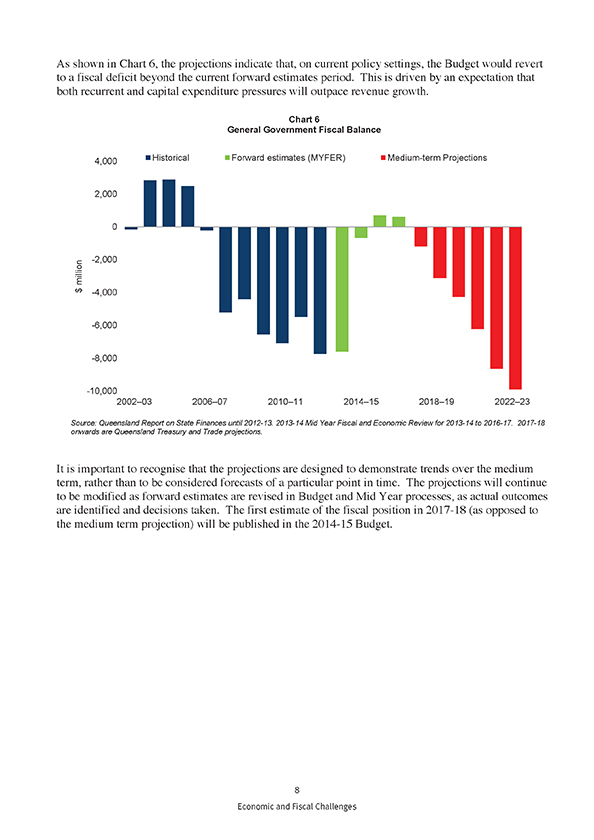
As shown in Chart 6, the projections indicate that, on current policy settings, the Budget would revert to a fiscal deficit beyond the current forward estimates period. This is driven by an expectation that both recurrent and capital expenditure pressures will outpace revenue growth. Chart 6 General Government Fiscal Balance Source: Queensland Report on State Finances until 2012-13. 2013-14 Mid Year Fiscal and Economic Review for 2013-14 to 2016-17. 2017-18 onwards are Queensland Treasury and Trade projections. It is important to recognise that the projections are designed to demonstrate trends over the medium term, rather than to be considered forecasts of a particular point in time. The projections will continue to be modified as forward estimates are revised in Budget and Mid Year processes, as actual outcomes are identified and decisions taken. The first estimate of the fiscal position in 2017-18 (as opposed to the medium term projection) will be published in the 2014-15 Budget. 8 Economic and Fiscal Challenges
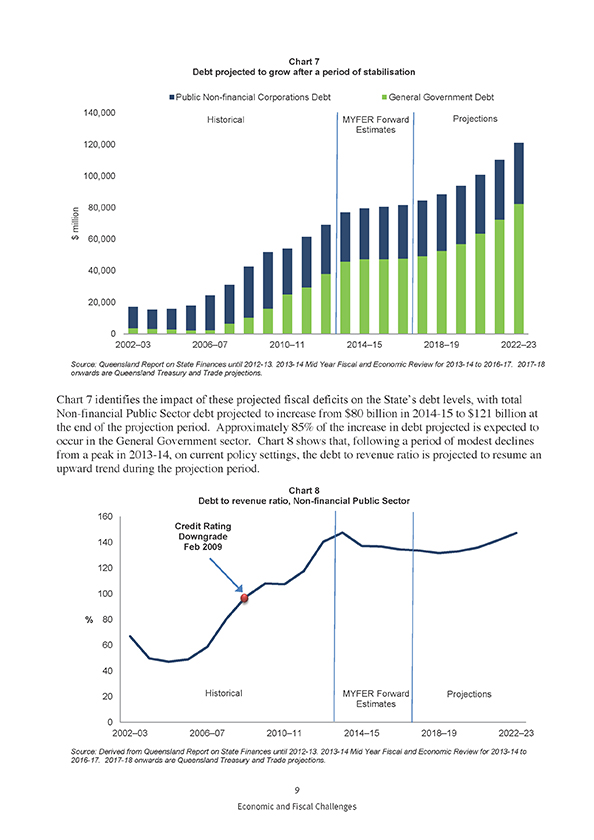
Chart 7 Debt projected to grow after a period of stabilisation Source: Queensland Report on State Finances until 2012-13. 2013-14 Mid Year Fiscal and Economic Review for 2013-14 to 2016-17. 2017-18 onwards are Queensland Treasury and Trade projections. Chart 7 identifies the impact of these projected fiscal deficits on the State’s debt levels, with total Non-financial Public Sector debt projected to increase from $80 billion in 2014-15 to $121 billion at the end of the projection period. Approximately 85% of the increase in debt projected is expected to occur in the General Government sector. Chart 8 shows that, following a period of modest declines from a peak in 2013-14, on current policy settings, the debt to revenue ratio is projected to resume an upward trend during the projection period. Chart 8 Debt to revenue ratio, Non-financial Public Sector Source: Derived from Queensland Report on State Finances until 2012-13. 2013-14 Mid Year Fiscal and Economic Review for 2013-14 to 2016-17. 2017-18 onwards are Queensland Treasury and Trade projections. 9 Economic and Fiscal Challenges
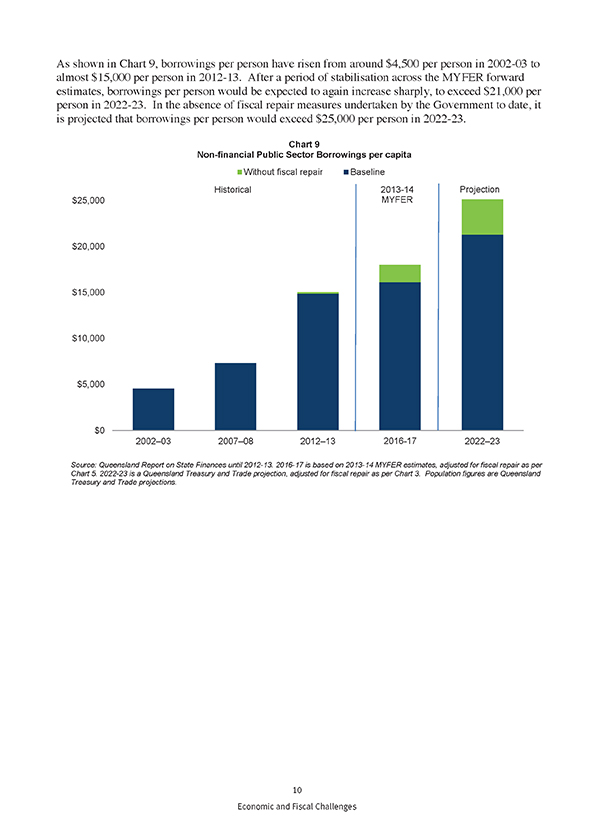
As shown in Chart 9, borrowings per person have risen from around $4,500 per person in 2002-03 to almost $15,000 per person in 2012-13. After a period of stabilisation across the MYFER forward estimates, borrowings per person would be expected to again increase sharply, to exceed $21,000 per person in 2022-23. In the absence of fiscal repair measures undertaken by the Government to date, it is projected that borrowings per person would exceed $25,000 per person in 2022-23. Chart 9 Non-financial Public Sector Borrowings per capita Source: Queensland Report on State Finances until 2012-13. 2016-17 is based on 2013-14 MYFER estimates, adjusted for fiscal repair as per Chart 5. 2022-23 is a Queensland Treasury and Trade projection, adjusted for fiscal repair as per Chart 3. Population figures are Queensland Treasury and Trade projections. 10 Economic and Fiscal Challenges
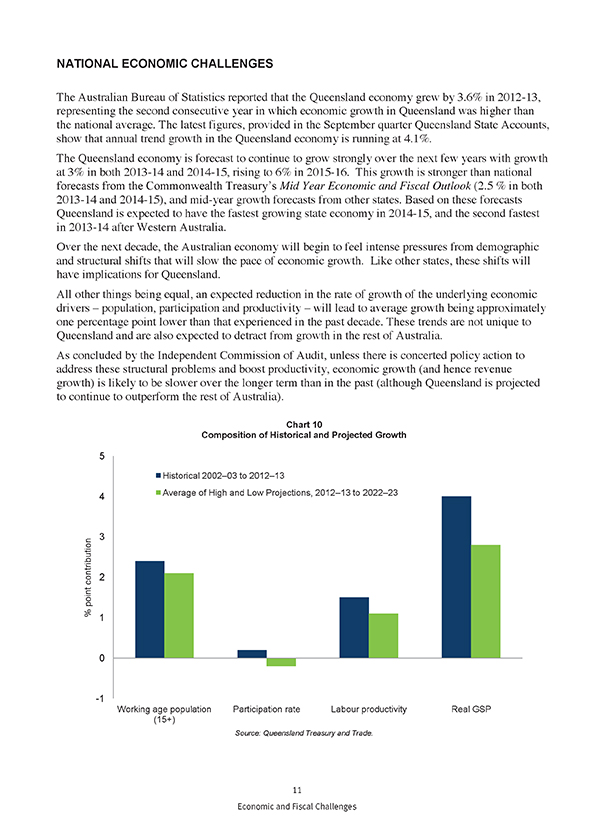
NATIONAL ECONOMIC CHALLENGES The Australian Bureau of Statistics reported that the Queensland economy grew by 3.6% in 2012-13, representing the second consecutive year in which economic growth in Queensland was higher than the national average. The latest figures, provided in the September quarter Queensland State Accounts, show that annual trend growth in the Queensland economy is running at 4.1%. The Queensland economy is forecast to continue to grow strongly over the next few years with growth at 3% in both 2013-14 and 2014-15, rising to 6% in 2015-16. This growth is stronger than national forecasts from the Commonwealth Treasury’s Mid Year Economic and Fiscal Outlook (2.5 % in both 2013-14 and 2014-15), and mid-year growth forecasts from other states. Based on these forecasts Queensland is expected to have the fastest growing state economy in 2014-15, and the second fastest in 2013-14 after Western Australia. Over the next decade, the Australian economy will begin to feel intense pressures from demographic and structural shifts that will slow the pace of economic growth. Like other states, these shifts will have implications for Queensland. All other things being equal, an expected reduction in the rate of growth of the underlying economic drivers – population, participation and productivity – will lead to average growth being approximately one percentage point lower than that experienced in the past decade. These trends are not unique to Queensland and are also expected to detract from growth in the rest of Australia. As concluded by the Independent Commission of Audit, unless there is concerted policy action to address these structural problems and boost productivity, economic growth (and hence revenue growth) is likely to be slower over the longer term than in the past (although Queensland is projected to continue to outperform the rest of Australia). Chart 10 Composition of Historical and Projected Growth Source: Queensland Treasury and Trade. 11 Economic and Fiscal Challenges
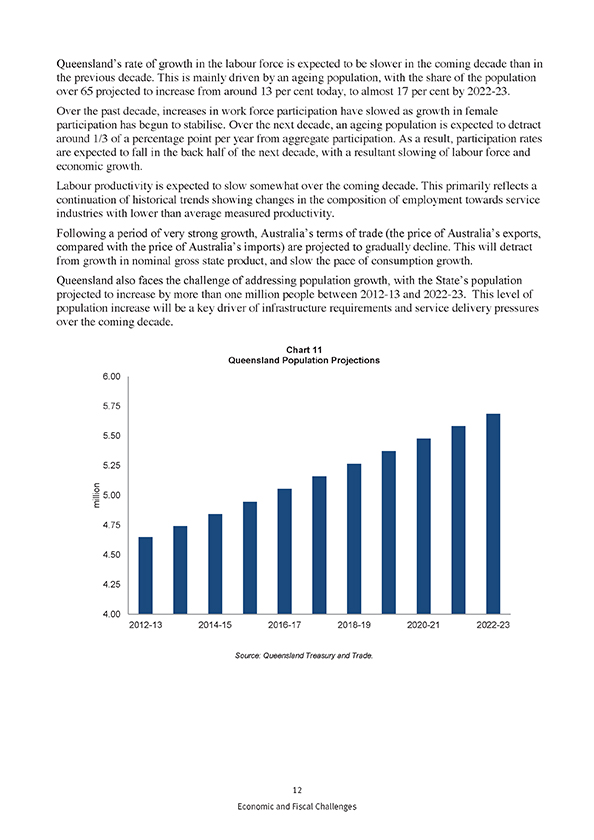
Queensland’s rate of growth in the labour force is expected to be slower in the coming decade than in the previous decade. This is mainly driven by an ageing population, with the share of the population over 65 projected to increase from around 13 per cent today, to almost 17 per cent by 2022-23. Over the past decade, increases in work force participation have slowed as growth in female participation has begun to stabilise. Over the next decade, an ageing population is expected to detract around 1/3 of a percentage point per year from aggregate participation. As a result, participation rates are expected to fall in the back half of the next decade, with a resultant slowing of labour force and economic growth. Labour productivity is expected to slow somewhat over the coming decade. This primarily reflects a continuation of historical trends showing changes in the composition of employment towards service industries with lower than average measured productivity. Following a period of very strong growth, Australia’s terms of trade (the price of Australia’s exports, compared with the price of Australia’s imports) are projected to gradually decline. This will detract from growth in nominal gross state product, and slow the pace of consumption growth. Queensland also faces the challenge of addressing population growth, with the State’s population projected to increase by more than one million people between 2012-13 and 2022-23. This level of population increase will be a key driver of infrastructure requirements and service delivery pressures over the coming decade. Chart 11 Queensland Population Projections Source: Queensland Treasury and Trade. 12 Economic and Fiscal Challenges
APPENDIX – MODELLING AND ASSUMPTIONS Economic The underlying gross state product (GSP) projections, which average 5% growth in nominal terms (just less than 3% in real terms) over the projection period, 2017-18 to 2022-23, have been constructed using a whole-of-economy model, the Queensland General Equilibrium Model for Forecasting (QGEMF). QGEMF is a computable general equilibrium model developed by Queensland Treasury and Trade. Revenue Total General Government sector revenue is projected to grow by an average of 5% per annum over the projection period, compared with average total revenue growth of almost 8% per annum in the decade to 2012-13. Projections for state taxation and Commonwealth grants are prepared on a basis consistent with the output of QGEMF, with state taxation growth based on the historical relationship with GSP and the growth of Commonwealth grants assumed to broadly align with national gross domestic product. Royalty revenue projections assume that movements in the exchange rate are effectively offset by movements in commodity prices (in real terms), while average growth in volumes in the projection period is expected to be lower than in the forward estimates period. Projections of revenues from Government owned Corporations (dividends and income tax equivalents) reflect the current forecasts of these Corporations where available. Interest revenue, which primarily relates to the expected return on the assets the Government has set aside to meet future superannuation obligations, is projected to grow in line with the value of these assets. Sales of goods and services are projected to grow at a rate broadly in line with expenses growth. Expenses Total General Government sector expenses are projected to grow by an average of 6 1⁄4% per annum over the period, compared with average total expenses growth of almost 9% per annum in the decade to 2011-12. This will follow a period of estimated General Government expenses growth of around 3% per annum between 2012-13 and 2016-17. This low rate of growth reflects fiscal repair, as did actual expenses growth of 0.2% in 2012-13. This means the level of expenses is much lower than would otherwise have been expected in the projection period. However, returning to a rate of expenses growth that reflects underlying demand pressures is inevitable over the medium term, as projections are prepared on a ‘no policy change’ basis. Health expenditure is projected to grow at an average rate of 8% per annum, comprised of 2% population growth, 5% growth in health costs, including increased technology use, and 1% growth in demand due to ageing (noting that the ageing effect will be larger beyond the projection period). Education expenditure is projected to grow at an average rate of 5 3⁄4% per annum, which represents a continuation of the expected average growth rate in the decade to 2016-17. Interest expense is derived from the level of borrowings at the end of the prior year, with the interest rate assumed to gradually increase over the period consistent with the outlook implied in the current yield curve for Queensland Treasury Corporation bonds. Other expense items are largely assumed to grow in line with projected GSP growth. 13 Economic and Fiscal Challenges
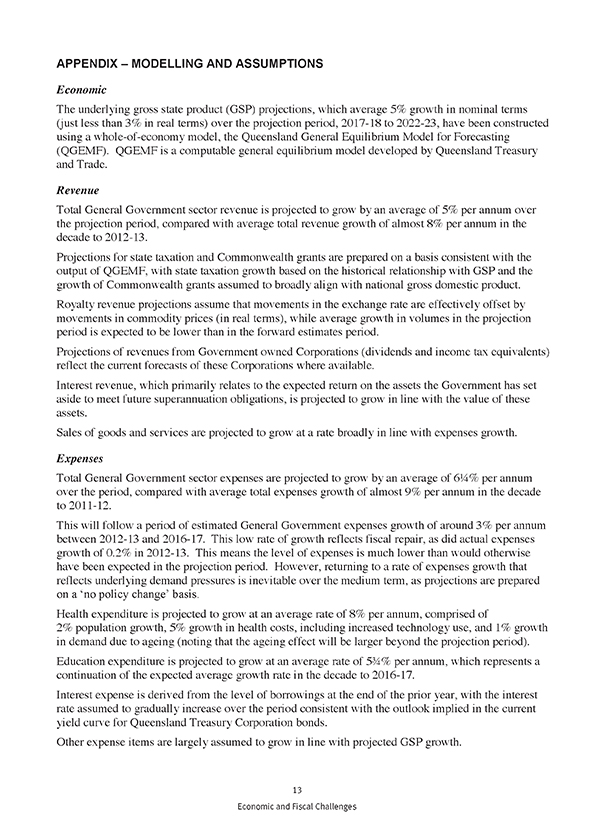
Capital Capital expenditure tends to be very lumpy, driven by factors such as responses to natural disasters, generational renewal of assets such as hospitals, and Australian Government priorities. In order to develop reasonable projections, it was assumed that the level of General Government capital expenditure would, over time, revert to a historical relationship with GSP. Chart A1 General Government purchases of non-financial assets as a proportion of nominal GSP Source: Queensland Treasury and Trade. The average level of General Government capital expenditure between 1998-99 and 2012-13 was 2.2% of GSP, as shown in Chart A1. The projections assume that, following a winding down of the capital program across the current forward estimates, the level of capital expenditure will gradually return to 2.2% of GSP from 2021-22 onwards. Projections of capital expenditure by Government owned Corporations are consistent with the current plans of the Corporations where available. Alternative Scenario Alternative scenarios of revenue and expense growth and capital expenditure have also been modelled by Treasury. One such scenario assumes that the gap between revenue and expense growth is half a percentage point smaller (e.g. revenue growth averages 5.5% per annum, rather than 5% per annum) and capital expenditure reaches a level of 2% of GSP, rather than 2.2% of GSP. 14 Economic and Fiscal Challenges
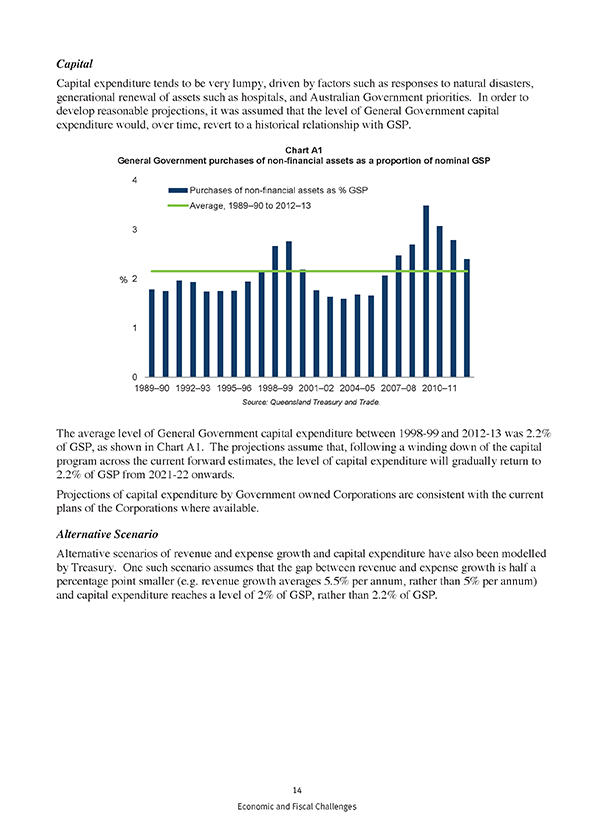
Chart A2 demonstrates that even under this alternative scenario the fiscal balance would be expected to return to a significant deficit position across the projection period, albeit at a much lower level than in the baseline scenario. Similarly, Chart A3 demonstrates debt levels would still continue to increase, albeit at a more moderate pace. Chart A2 Fiscal Balance Source: 2013-14 Mid Year Fiscal and Economic Review for 2013-14 to 2016-17. 2017-18 onwards are Queensland Treasury and Trade projections. Chart A3 Non-financial Public Sector Borrowings Source: 2013-14 Mid Year Fiscal and Economic Review for 2013-14 to 2016-17. 2017-18 onwards are Queensland Treasury and Trade projections. 15 Economic and Fiscal Challenges
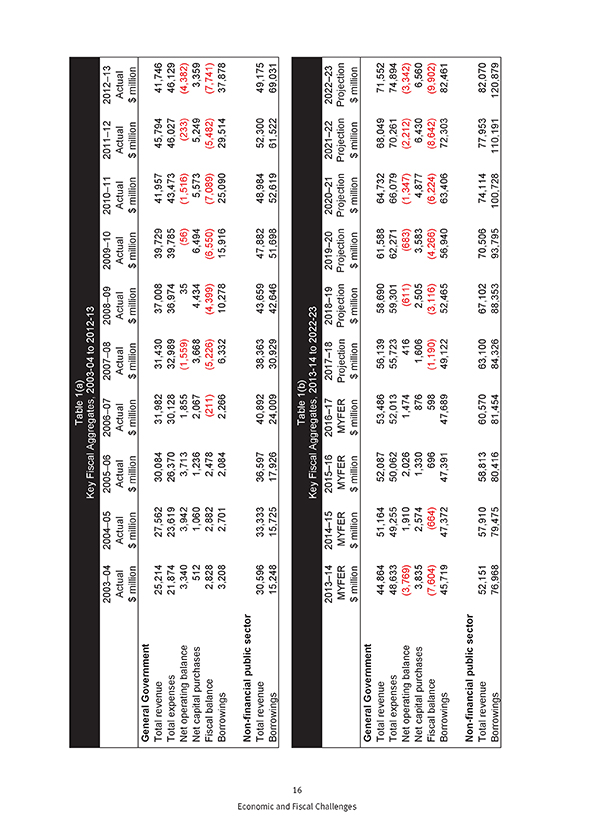
Table 1(a) Key Fiscal Aggregates, 2003-04 to 2012-13 2003–04 2004–05 2005–06 2006–07 2007–08 2008–09 2009–10 2010–11 2011–12 2012–13 Actual Actual Actual Actual Actual Actual Actual Actual Actual Actual $ million $ million $ million $ million $ million $ million $ million $ million $ million $ million General Government Total revenue 25,214 27,562 30,084 31,982 31,430 37,008 39,729 41,957 45,794 41,746 Total expenses 21,874 23,619 26,370 30,128 32,989 36,974 39,785 43,473 46,027 46,129 Net operating balance 3,340 3,942 3,713 1,855 (1,559) 35 (56) (1,516) (233) (4,382) Net capital purchases 512 1,060 1,236 2,067 3,668 4,434 6,494 5,573 5,249 3,359 Fiscal balance 2,828 2,882 2,478 (211) (5,226) (4,399) (6,550) (7,089) (5,482) (7,741) Borrowings 3,208 2,701 2,084 2,266 6,332 10,278 15,916 25,090 29,514 37,878 Non-financial public sector Total revenue 30,596 33,333 36,597 40,892 38,363 43,659 47,882 48,984 52,300 49,175 Borrowings 15,248 15,725 17,926 24,009 30,929 42,646 51,698 52,619 61,522 69,031 Table 1(b) Key Fiscal Aggregates, 2013-14 to 2022-23 2013–14 2014–15 2015–16 2016–17 2017–18 2018–19 2019–20 2020–21 2021–22 2022–23 MYFER MYFER MYFER MYFER Projection Projection Projection Projection Projection Projection $ million $ million $ million $ million $ million $ million $ million $ million $ million $ million General Government Total revenue 44,864 51,164 52,087 53,486 56,139 58,690 61,588 64,732 68,049 71,552 Total expenses 48,633 49,255 50,062 52,013 55,723 59,301 62,271 66,079 70,261 74,894 Net operating balance (3,769) 1,910 2,026 1,474 416 (611) (683) (1,347) (2,212) (3,342) Net capital purchases 3,835 2,574 1,330 876 1,606 2,505 3,583 4,877 6,430 6,560 Fiscal balance (7,604) (664) 696 598 (1,190) (3,116) (4,266) (6,224) (8,642) (9,902) Borrowings 45,719 47,372 47,391 47,689 49,122 52,465 56,940 63,406 72,303 82,461 Non-financial public sector Total revenue 52,151 57,910 58,813 60,570 63,100 67,102 70,506 74,114 77,953 82,070 Borrowings 76,968 79,475 80,416 81,454 84,326 88,353 93,795 100,728 110,191 120,879 16 Economic and Fiscal Challenges

Table 2(a) Key Fiscal Indicators, 2003-04 to 2012-13 2003–04 2004–05 2005–06 2006–07 2007–08 2008–09 2009–10 2010–11 2011–12 2012–13 Actual Actual Actual Actual Actual Actual Actual Actual Actual Actual % % % % % % % % % % General Government Total revenue/GSP 16.6 16.3 15.6 15.0 13.6 14.3 15.8 15.7 16.1 14.4 Total expenses/GSP 14.4 14.0 13.7 14.1 14.3 14.3 15.8 16.2 16.2 15.9 Net operating balance/GSP 2.2 2.3 1.9 0.9 (0.7) 0.0 (0.0) (0.6) (0.1) (1.5) Net capital purchases/GSP 0.3 0.6 0.6 1.0 1.6 1.7 2.6 2.1 1.8 1.2 Fiscal balance/GSP 1.9 1.7 1.3 (0.1) (2.3) (1.7) (2.6) (2.6) (1.9) (2.7) Borrowings/GSP 2.1 1.6 1.1 1.1 2.7 4.0 6.3 9.4 10.4 13.1 Borrowings/revenue 12.7 9.8 6.9 7.1 20.1 27.8 40.1 59.8 64.4 90.7 Non-financial public sector Borrowings/GSP 10.0 9.3 9.3 11.2 13.4 16.5 20.6 19.6 21.6 23.8 Borrowings/revenue 49.8 47.2 49.0 58.7 80.6 97.7 108.0 107.4 117.6 140.4 Table 2(b) Key Fiscal Indicators, 2013-14 to 2022-23 2013–14 2014–15 2015–16 2016–17 2017–18 2018–19 2019–20 2020–21 2021–22 2022–23 MYFER MYFER MYFER MYFER Projection Projection Projection Projection Projection Projection % % % % % % % % % % General Government Total revenue/GSP 14.4 15.4 14.6 14.0 14.0 13.9 14.0 13.9 13.9 13.9 Total expenses/GSP 15.7 14.8 14.0 13.6 13.9 14.1 14.1 14.2 14.4 14.6 Net operating balance/GSP (1.2) 0.6 0.6 0.4 0.1 (0.1) (0.2) (0.3) (0.5) (0.6) Net capital purchases/GSP 1.2 0.8 0.4 0.2 0.4 0.6 0.8 1.0 1.3 1.3 Fiscal balance/GSP (2.4) (0.2) 0.2 (0.2) (0.3) (0.7) (1.0) (1.3) (1.8) (1.9) Borrowings/GSP 14.7 14.2 13.3 12.5 12.2 12.4 12.9 13.7 14.8 16.0 Borrowings/revenue 101.9 92.6 91.0 89.2 87.5 89.4 92.5 98.0 106.3 115.2 Non-financial public sector Borrowings/GSP 24.8 23.9 22.6 21.3 21.0 21.0 21.3 21.7 22.5 23.5 Borrowings/revenue 147.6 137.2 136.7 134.5 133.6 131.7 133.0 135.9 141.4 147.3 17 Economic and Fiscal Challenges

Economic and Fiscal Challenges