Corporate Property Associates 16 Global Inactive
Filed: 28 May 09, 12:00am

| Executive Offices 50 Rockefeller Plaza New York, NY 10020 Tel: 1-800-WPCAREY or (212) 492-1100 Fax: (212) 492-8922 Web Site Address: www.CPA16GLOBAL.com | Investor Relations Susan C. Hyde Managing Director & Director of Investor Relations W. P. Carey & Co. LLC Phone: (212) 492-1151 |
| Three months ended March 31, | ||||||||
| 2009 | 2008 | |||||||
Net (loss) income attributable to CPA®:16 — Global shareholders | $ | (7,645 | ) | $ | 5,812 | |||
| Gain on extinguishment of debt | (6,512 | ) | — | |||||
| Depreciation, amortization, and other non-cash charges | 11,177 | 9,674 | ||||||
| Straight-line and other rent adjustments | 345 | (299 | ) | |||||
| Impairment charge | 15,984 | — | ||||||
| FFO adjustment to earnings from equity investments | 2,151 | 2,641 | ||||||
| FFO adjustment to share of earnings of noncontrolling interests | 1,371 | (1,084 | ) | |||||
| FFO | $ | 16,871 | $ | 16,744 | ||||
FFO per share (a) | $ | 0.16 | $ | 0.16 | ||||
| Weighted average shares outstanding | 122,789,807 | 119,940,316 | ||||||
| (a) | FFO per share includes an adjustment of $2.9 million and $3 million for the three months ended March 31, 2009 and 2008, respectively, for issuance of shares to an affiliate in satisfaction of fees due. These shares are included in the weighted average shares outstanding but are not a reconciling adjustment in the determination of FFO. |
2
| Three months ended March 31, | ||||||||
| 2009 | 2008 | |||||||
| Cash flow from operating activities — as reported | $ | 26,162 | $ | 27,469 | ||||
| Adjustments: | ||||||||
Distributions received from equity investments in real estate in excess of equity income, net (a) | 5,503 | 1,199 | ||||||
Distributions paid to noncontrolling interests, net(b) | (5,806 | ) | (1,515 | ) | ||||
Changes in working capital(c) | (389 | ) | (1,786 | ) | ||||
| Adjusted cash flow from operating activities | $ | 25,470 | $ | 25,367 | ||||
| Adjusted cash flow per share | $ | 0.21 | $ | 0.21 | ||||
| Distributions declared per share | $ | 0.1653 | $ | 0.1637 | ||||
| Payout ratio (distributions per share/adjusted cash flow per share) | 79 | % | 78 | % | ||||
| Weighted average shares outstanding | 122,789,807 | 119,940,316 | ||||||
| (a) | To the extent we receive distributions in excess of the equity income that we recognize, we include such amounts in our evaluation of cash flow from core operations. Distributions also include the repatriation of cash previously accumulated in foreign bank accounts held by certain joint ventures, which has been allocated to the period during which the cash accumulation occurred. | |
| (b) | Represents noncontrolling interests’ share of distributions made by ventures that we consolidate in our financial statements. This adjustment in the calculation of adjusted cash flow from operating activities was introduced during the third quarter of 2008 because we believe that it results in a more accurate presentation of this supplemental measure. | |
| (c) | Timing differences arising from the payment of certain liabilities in a period other than that in which the expense is recognized in determining net income may distort the actual cash flow that our core operations generate. We adjust our GAAP cash flow from operations to record such amounts in the period in which the liability was actually incurred. We believe this is a fairer measure of determining our cash flow from core operations. |
3
| Percentage of | ||||||||
| Tenant/Lease Guarantor | Annualized Rent(a) | Total Annualized Rent | ||||||
Hellweg Die Profi-Baumärkte GmbH & Co KG(b) | $ | 12,770 | 7 | % | ||||
| Telcordia Technologies, Inc. | 9,459 | 5 | % | |||||
| Mercury Partners, LP and U-Haul Moving Partners Inc. | 8,782 | 4 | % | |||||
| The New York Times Company | 6,591 | 3 | % | |||||
Fraikin SAS(b) | 6,349 | 3 | % | |||||
| Nordic Cold Storage, LLC | 6,250 | 3 | % | |||||
| International Aluminum Corporation | 5,134 | 3 | % | |||||
Thales S.A.(b) | 4,691 | 2 | % | |||||
| Corinthian Colleges, Inc. | 4,253 | 2 | % | |||||
| Best Brands Corp. | 4,039 | 2 | % | |||||
Total | $ | 68,318 | 34 | % | ||||
| (a) | Rents reflect annualized rent as of March 31, 2009 on a pro rata basis. | |
| (b) | Rent amounts are subject to fluctuations in foreign currency exchange rates. | |
| (c) | Percentage of the portfolio’s total pro rata square footage that is subject to lease at the given date. |
4
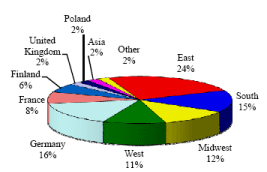
| Region | Annualized Rent(a) | Percent | ||||||
U.S. | ||||||||
| East | $ | 47,823 | 24 | % | ||||
| South | 29,721 | 15 | % | |||||
| Midwest | 22,946 | 12 | % | |||||
| West | 21,873 | 11 | % | |||||
U.S. Total | 122,363 | 62 | % | |||||
International | ||||||||
| Germany | 30,267 | 16 | % | |||||
| France | 16,401 | 8 | % | |||||
| Finland | 11,681 | 6 | % | |||||
| United Kingdom | 4,493 | 2 | % | |||||
| Poland | 3,890 | 2 | % | |||||
Asia(b) | 3,602 | 2 | % | |||||
Other(c) | 3,059 | 2 | % | |||||
International Total | 73,393 | 38 | % | |||||
Total | $ | 195,756 | 100 | % | ||||
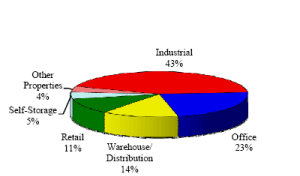
| Property Type | Annualized Rent(a) | Percent | ||||||
| Industrial | $ | 83,116 | 43 | % | ||||
| Office | 45,826 | 23 | % | |||||
| Warehouse/Distribution | 27,402 | 14 | % | |||||
| Retail | 22,395 | 11 | % | |||||
| Self-Storage | 8,782 | 5 | % | |||||
Other Properties(d) | 8,235 | 4 | % | |||||
Total | $ | 195,756 | 100 | % | ||||
| (a) | Rents reflect annualized rent as of March 31, 2009 on a pro rata basis. | |
| (b) | Includes revenue from tenants in Thailand and Malaysia. | |
| (c) | Includes revenue from tenants in Canada, Sweden and Mexico. | |
| (d) | Includes revenue from tenants with the following property types: residential (2%), hospitality (1%), education (0.5%), and land (0.5%). |
5
| Annualized | Percentage of | |||||||
| Industry Type (a) | Rent(b) | Annualized Rent | ||||||
| Retail Trade | $ | 25,762 | 13 | % | ||||
| Automobile | 16,109 | 8 | % | |||||
| Healthcare, Education and Childcare | 15,849 | 8 | % | |||||
| Chemicals, Plastics, Rubber, and Glass | 15,769 | 8 | % | |||||
| Electronics | 13,578 | 7 | % | |||||
| Transportation — Cargo | 10,805 | 5 | % | |||||
| Telecommunications | 9,459 | 5 | % | |||||
| Construction and Building | 9,142 | 5 | % | |||||
| Consumer Non-durable Goods | 9,013 | 5 | % | |||||
| Media: Printing and Publishing | 8,488 | 4 | % | |||||
| Beverages, Food, and Tobacco | 8,424 | 4 | % | |||||
| Business and Commercial Services | 6,250 | 3 | % | |||||
| Machinery | 6,189 | 3 | % | |||||
| Buildings and Real Estate | 5,708 | 3 | % | |||||
| Aerospace and Defense | 5,543 | 3 | % | |||||
| Textiles, Leather, and Apparel | 5,236 | 3 | % | |||||
| Insurance | 4,802 | 2 | % | |||||
| Federal, State and Local Government | 4,006 | 2 | % | |||||
| Grocery | 3,450 | 2 | % | |||||
| Transportation — Personal | 3,074 | 2 | % | |||||
| Hotels and Gaming | 3,000 | 2 | % | |||||
Other(c) | 6,100 | 3 | % | |||||
Total | $ | 195,756 | 100 | % | ||||
| (a) | Based on the Moody’s Classification System and information provided by the tenant. | |
| (b) | Rents reflect annualized rent as of March 31, 2009 on a pro rata basis. | |
| (c) | Includes revenue from tenants in the following industries: mining, metals, and primary metal industries (1.5%), consumer services (1%), and utilities (0.5%). |
6