UNITED STATES
SECURITIES AND EXCHANGE COMMISSION
Washington, D.C. 20549
FORM N-CSR
CERTIFIED SHAREHOLDER REPORT OF REGISTERED
MANAGEMENT INVESTMENT COMPANIES
Investment Company Act file number 811-21399
Aegis Funds
(Exact name of registrant as specified in charter)
6862 Elm Street, Suite 830, McLean, VA 22101
(Address of principal executive offices) (Zip code)
Scott L. Barbee
6862 Elm Street, Suite 830, McLean, VA 22101
(Name and address of agent for service)
(703) 528-7788
Registrant’s telephone number, including area code
Date of fiscal year end: December 31, 2024
Date of reporting period: June 30, 2024
Item 1. Reports to Stockholders.
| | |
| Aegis Value Fund | |
| Class I | AVALX |
| Semi-Annual Shareholder Report | June 30, 2024 |
This semi-annual shareholder report contains important information about the Aegis Value Fund for the period of January 1, 2024, to June 30, 2024. You can find additional information about the Fund at https://aegisfunds.com/. You can also request this information by contacting us at 1-800-528-3780.
This report describes changes to the Fund that occurred during the reporting period.
WHAT WERE THE FUND COSTS FOR THE LAST SIX MONTHS? (based on a hypothetical $10,000 investment)
| | |
Class Name | Costs of a $10,000 investment | Costs paid as a percentage of a $10,000 investment |
| Class I | $72 | 1.43% |
KEY FUND STATISTICS (as of June 30, 2024)
| |
Net Assets | $326,772,307 |
Number of Holdings | 81 |
Portfolio Turnover | 4% |
Visit https://aegisfunds.com/ for more recent performance information.
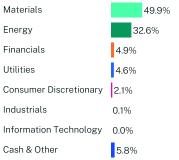
WHAT DID THE FUND INVEST IN? (as of June 30, 2024)
Sector Breakdown (% of net assets)
| |
Top 10 Issuers | (%) |
International Petroleum Corp. | 7.5% |
Amerigo Resources Ltd. | 6.3% |
MEG Energy Corp. | 5.4% |
United States Treasury Bill | 5.2% |
Hallador Energy Company | 4.6% |
Kenmare Resources PLC | 4.5% |
Natural Gas Services Group, Inc. | 4.1% |
Bank of Cyprus Holdings PLC | 4.1% |
Equinox Gold Corp. | 3.8% |
Interfor Corp. | 3.6% |
| |
Top Ten Countries | (%) |
Canada | 56.4% |
United States | 21.1% |
Ireland | 5.0% |
Mauritius | 4.7% |
Cyprus | 4.1% |
Australia | 3.5% |
Nigeria | 2.4% |
Ghana | 2.1% |
United Kingdom | 0.3% |
Cash & Other | 0.4% |
For additional information about the Fund; including its prospectus, financial information, holdings and proxy information, scan the QR code or visit https://aegisfunds.com/
HOUSEHOLDING
To reduce Fund expenses, only one copy of most shareholder documents may be mailed to shareholders with multiple accounts at the same address (Householding). If you would prefer that your Aegis Financial Corporation documents not be householded, please contact Aegis Financial Corporation at 1-800-528-3780, or contact your financial intermediary. Your instructions will typically be effective within 30 days of receipt by Aegis Financial Corporation or your financial intermediary.
| Aegis Value Fund | PAGE 1 | TSR_SAR_00761L102 |
49.932.64.94.62.10.10.05.8
Item 2. Code of Ethics.
Not applicable for semi-annual reports.
Item 3. Audit Committee Financial Expert.
Not applicable for semi-annual reports.
Item 4. Principal Accountant Fees and Services.
Not applicable for semi-annual reports.
Item 5. Audit Committee of Listed Registrants.
Not applicable to registrants who are not listed issuers (as defined in Rule 10A-3 under the Securities Exchange Act of 1934).
Item 6. Investments.
| (a) | Schedule of Investments is included within the financial statements filed under Item 7 of this Form. |
Item 7. Financial Statements and Financial Highlights for Open-End Investment Companies.
Aegis Value Fund
Core Financial Statements
June 30, 2024
TABLE OF CONTENTS
Aegis Value Fund
Schedule of Investments
as of June 30, 2024 (Unaudited)
| | | | | | | |
COMMON STOCKS - 94.2%
| | | | | | |
Consumer Discretionary - 2.1%
| | | | | | |
Household Durables - 2.0%
| | | | | | |
Bassett Furniture Industries, Inc.(a) | | | 456,855 | | | $6,491,910 |
Textiles, Apparel & Luxury Goods - 0.1%
| | | |
Delta Apparel, Inc.(a)(b) | | | 674,352 | | | 391,124 |
Total Consumer Discretionary | | | | | | 6,883,034 |
Energy- 32.6%(c)
| | | | | | |
Energy Equipment & Services - 8.8%
|
AKITA Drilling Ltd. - Class A(a)(b)(h) | | | 5,945,285 | | | 5,823,385 |
Enerflex Ltd. | | | 511,060 | | | 2,759,724 |
Koil Energy Solutions, Inc.(a)(b) | | | 766,584 | | | 607,249 |
Natural Gas Services Group,
Inc.(a)(b) | | | 670,773 | | | 13,495,953 |
Precision Drilling Corp.(b)(h) | | | 86,267 | | | 6,066,215 |
Wolverine Energy & Infrastructure, Inc.(b)(d)(h) | | | 475,591 | | | 0 |
| | | | | | 28,752,526 |
Oil, Gas & Consumable Fuels - 23.8%
| | | |
Adams Resources & Energy, Inc. | | | 108,876 | | | 3,048,528 |
ARC Resources Ltd.(h) | | | 477,703 | | | 8,523,614 |
Ardmore Shipping Corp. | | | 68,579 | | | 1,545,085 |
Athabasca Oil Corp.(b)(h) | | | 500,000 | | | 1,893,206 |
International Petroleum Corp.(b)(h) | | | 1,839,691 | | | 24,340,051 |
MEG Energy Corp.(b)(h) | | | 826,778 | | | 17,689,260 |
Peabody Energy Corp. | | | 444,732 | | | 9,837,472 |
SEPLAT Energy PLC(i) | | | 3,133,891 | | | 7,888,965 |
Vermilion Energy, Inc.(h) | | | 280,000 | | | 3,082,343 |
| | | | | | 77,848,524 |
Total Energy | | | | | | 106,601,050 |
Financials - 4.9%
| | | | | | |
Banks - 4.1%
| | | | | | |
Bank of Cyprus Holdings PLC(i) | | | 3,143,618 | | | 13,312,333 |
| | | | |
Capital Markets - 0.7%
| | | | | | |
Hennessy Advisors, Inc. | | | 140,536 | | | 1,000,617 |
Westwood Holdings Group, Inc. | | | 97,606 | | | 1,188,841 |
| | | | | | 2,189,458 |
Insurance - 0.1%
| | | | | | |
Conifer Holdings, Inc.(b) | | | 430,026 | | | 368,059 |
Total Financials | | | | | | 15,869,850 |
Industrials - 0.1%
| | | | | | |
Machinery - 0.1%
| | | | | | |
Mayville Engineering Co., Inc.(b) | | | 19,347 | | | 322,321 |
Total Industrials | | | | | | 322,321 |
| | | | | | | |
| | | | | | | |
Information Technology - 0.0%(f)
| | | | | | |
Communications Equipment - 0.0%(f)
|
EMCORE Corp.(b) | | | 97,535 | | | $115,091 |
Total Information Technology | | | | | | 115,091 |
Materials - 49.9%(c)
| | | | | | |
Diversified Metals & Mining - 12.4%
|
Alphamin Resources Corp.(h) | | | 5,423,063 | | | 4,201,927 |
Amerigo Resources Ltd.(a)(h) | | | 18,172,738 | | | 20,589,704 |
C3 Metals, Inc.(b)(e)(h) | | | 1,648,351 | | | 307,247 |
Excelsior Mining Corp.(b)(h) | | | 2,483,258 | | | 263,201 |
Kenmare Resources PLC(i) | | | 3,673,650 | | | 14,600,767 |
Solitario Resources Corp.(b) | | | 620,433 | | | 549,083 |
| | | | | | 40,511,929 |
Gold, Silver, & Precious Metals & Minerals - 22.6%
| | | | | | |
Cabral Gold, Inc.(a)(b)(e)(h) | | | 12,911,156 | | | 2,359,409 |
Catalyst Metals Ltd.(b)(j) | | | 4,033,416 | | | 3,045,862 |
Condor Gold PLC(b)(e)(i) | | | 2,810,000 | | | 860,444 |
Dundee Precious Metals, Inc.(h) | | | 606,525 | | | 4,748,279 |
Eldorado Gold Corp.(b)(h) | | | 374,946 | | | 5,539,022 |
Equinox Gold Corp.(b)(e)(h) | | | 2,386,790 | | | 12,456,913 |
Erdene Resource Development Corp.(b)(e)(h) | | | 12,000,338 | | | 3,552,602 |
G Mining Ventures Corp.(b)(h) | | | 3,809,011 | | | 6,570,861 |
GoldQuest Mining Corp.(b)(h) | | | 2,849,300 | | | 437,376 |
i-80 Gold Corp.(b)(h) | | | 1,064,476 | | | 1,120,460 |
Loncor Gold, Inc.(b)(e)(h) | | | 4,142,858 | | | 1,135,610 |
Minera Alamos, Inc.(a)(b)(e)(h) | | | 37,611,661 | | | 8,247,870 |
Mundoro Capital, Inc.(b)(e)(h) | | | 2,714,573 | | | 367,089 |
Newcore Gold Ltd.(a)(b)(e)(h) | | | 16,000,002 | | | 3,450,167 |
O3 Mining, Inc.(b)(h) | | | 1,509,956 | | | 1,490,034 |
Orezone Gold Corp.(b)(h) | | | 15,850,751 | | | 7,647,013 |
Perseus Mining Ltd.(j) | | | 5,226,073 | | | 8,205,722 |
Revival Gold, Inc.(a)(b)(e)(h) | | | 8,183,049 | | | 1,704,739 |
Toubani Resources Ltd.(b)(j) | | | 1,300,000 | | | 155,381 |
TriStar Gold, Inc.(b)(h) | | | 351,164 | | | 56,472 |
Troilus Gold Corp.(b)(h) | | | 2,773,220 | | | 729,768 |
| | | | | | 73,881,093 |
Mining Services - 5.5%
| | | | | | |
Capital Ltd.(i) | | | 8,899,687 | | | 11,225,432 |
Geodrill Ltd.(a)(b)(h) | | | 3,956,698 | | | 6,681,022 |
| | | | | | 17,906,454 |
Paper & Forest Products - 4.5%
| | | | | | |
Canfor Pulp Products, Inc.(b)(h) | | | 174,467 | | | 135,182 |
Conifex Timber, Inc.(a)(b)(h) | | | 2,346,913 | | | 729,095 |
Interfor Corp.(h) | | | 964,599 | | | 11,648,094 |
Mercer International, Inc. | | | 264,447 | | | 2,258,377 |
| | | | | | 14,770,748 |
| | | | | | | |
The accompanying notes are an integral part of these financial statements.
TABLE OF CONTENTS
Aegis Value Fund
Schedule of Investments
as of June 30, 2024 (Unaudited)(Continued)
| | | | | | | |
COMMON STOCKS - (Continued)
|
Steel - 4.9%
| | | | | | |
Algoma Steel Group, Inc.(h) | | | 1,400,123 | | | $9,712,487 |
Stelco Holdings, Inc.(h) | | | 229,299 | | | 6,230,067 |
| | | | | | 15,942,554 |
Total Materials | | | | | | 163,012,778 |
Utilities - 4.6%
| | | | | | |
Independent Power and Renewable Electricity Producers - 4.6%
| | | | | | |
Hallador Energy Company(a)(b) | | | 1,916,083 | | | 14,887,965 |
Total Utilities | | | | | | 14,887,965 |
TOTAL COMMON STOCKS
(Cost $253,868,660) | | | | | | 307,692,089 |
| | | Contracts | | | |
WARRANTS - 0.2%
|
Materials - 0.2%
| | | | | | |
Gold, Silver, & Precious Metals & Minerals - 0.2%
| | | | | | |
Cabral Gold, Inc., Expires 03/17/2025, Exercise Price $0.20(b)(e)(h) | | | 7,500,000 | | | 520,266 |
Cabral Gold, Inc., Expires 11/25/2024, Exercise Price $0.21(b)(e)(h) | | | 5,000,000 | | | 155,331 |
Condor Gold PLC, Expires 06/10/2025, Exercise Price $0.35(b)(e)(i) | | | 1,425,000 | | | 50,426 |
Erdene Resource Development, Expires 07/08/2024, Exercise Price $0.45(b)(e)(h) | | | 2,083,333 | | | 7,310 |
Loncor Gold, Inc., Expires 12/10/2024, Exercise Price $0.75(b)(e)(h) | | | 500,000 | | | 10,635 |
Revival Gold, Inc., Expires 11/30/2026, Exercise Price $0.45(b)(e)(h) | | | 1,428,572 | | | 90,118 |
TOTAL WARRANTS
(Cost $0) | | | | | | 834,086 |
| | | Par | | | |
SHORT-TERM INVESTMENTS - 5.2%
| |
U.S. Treasury Bills - 5.2%
| | | | | | |
2.61%, 07/02/2024(g) | | | $1,000,000 | | | 999,855 |
4.74%, 07/11/2024(g) | | | 1,000,000 | | | 998,553 |
4.92%, 07/18/2024(g) | | | 1,000,000 | | | 997,538 |
4.99%, 07/25/2024(g) | | | 1,000,000 | | | 996,534 |
5.05%, 08/01/2024(g) | | | 1,000,000 | | | 995,511 |
5.07%, 08/08/2024(g) | | | 1,000,000 | | | 994,512 |
5.09%, 08/15/2024(g) | | | 1,000,000 | | | 993,502 |
5.12%, 08/22/2024(g) | | | 1,000,000 | | | 992,460 |
5.16%, 08/29/2024(g) | | | 1,000,000 | | | 991,392 |
5.13%, 09/05/2024(g) | | | 1,000,000 | | | 990,453 |
5.15%, 09/12/2024(g) | | | 1,000,000 | | | 989,408 |
5.14%, 09/19/2024(g) | | | 1,000,000 | | | 988,427 |
5.16%, 09/26/2024(g) | | | 1,000,000 | | | 987,385 |
| | | | | | | |
| | | | | | | |
5.12%, 10/03/2024(g) | | | $1,000,000 | | | $986,500 |
5.14%, 10/10/2024(g) | | | 2,000,000 | | | 1,970,878 |
5.15%, 10/17/2024(g) | | | 1,000,000 | | | 984,400 |
TOTAL SHORT-TERM INVESTMENTS
(Cost $16,857,982) | | | | | | 16,857,308 |
TOTAL INVESTMENTS - 99.6% (Cost $270,726,642) | | | | | | $325,383,483 |
Other Assets in Excess of
Liabilities - 0.4% | | | | | | 1,388,824 |
TOTAL NET ASSETS - 100.0% | | | | | | $326,772,307 |
| | | | | | | |
Percentages are stated as a percent of net assets.
For purposes of this report, the securities in the portfolio have been organized utilizing their respective GICS code. The Fund does not rely exclusively on GICS Industry classifications for purposes of its industry concentration policy. For example, within the Metals & Mining sector, the Fund uses the GICS Sub-Industry classifications, or aggregate thereof as show above, for purposes of determining compliance with its industry concentration policy. In addition, in cases where a holding has been judged to be misclassified by GICS, or has not been classified by GICS, the Fund uses a Fund-determined GICS framework classification.
The Global Industry Classification Standard (GICS®) was developed by and/or is the exclusive property of MSCI, Inc. and Standard & Poor’s Financial Services LLC (“S&P”). GICS is a service mark of MSCI, Inc. and S&P and has been licensed for use by U.S. Bank Global Fund Services.
More narrow industries are utilized for compliance purposes, whereas broad sectors are utilized for reporting purposes.
PLC - Public Limited Company
(a)
| Affiliated company as defined by the Investment Company Act of 1940. |
(b)
| Non-income producing security. |
(c)
| To the extent that the Fund invests more heavily in a particular industry or sector of the economy, its performance will be especially sensitive to developments that significantly affect those industries or sectors. |
(d)
| Fair value determined using significant unobservable inputs in accordance with procedures established by and under the supervision of the Adviser, acting as Valuation Designee. These securities represented $0 or 0.0% of net assets as of June 30, 2024. |
(e)
| All or a portion of this position was purchased in a private placement transaction and may be a security as defined in Rule 144A under the Securities Act of 1933. An initial four-month sale restriction may apply. Resale may only be available to Qualified Institutional Buyers or through sales on certain offshore exchanges as allowed under Section 904 of Regulation S-X. |
(f)
| Represents less than 0.05% of net assets. |
(g)
| The rate shown is the effective yield as of June 30, 2024. |
(h)
| Country currency: Canadian Dollar (CAD) |
(i)
| Country currency: British Pound Sterling (GBP) |
(j)
| Country currency: Australian Dollar (AUD) |
The accompanying notes are an integral part of these financial statements.
TABLE OF CONTENTS
Aegis Value Fund
Statement of Assets and Liabilities
June 30, 2024 (Unaudited)
| |
ASSETS
|
Investments in unaffiliated secruities, at value (cost $203,056,763) | | | $239,923,892 |
Investments in affiliated securities*, at value (cost $67,669,878) | | | 85,459,591 |
Total investments in securities, at value (cost $270,726,641) | | | 325,383,483 |
Cash | | | 285,844 |
Receivable for Fund shares sold | | | 146,706 |
Receivable for investments securities sold | | | 1,133,103 |
Interest and dividends receivable | | | 273,946 |
Prepaid assets | | | 72,135 |
Total assets | | | 327,295,217 |
LIABILITIES
|
Payable for investment securities purchased | | | — |
Foreign currency (cost $0) | | | — |
Payable to Investment Adviser | | | 328,988 |
Payable for Fund shares redeemed | | | 54,305 |
Accrued Trustee and chief compliance officer fees | | | 31,315 |
Other payables | | | 108,302 |
Total liabilities | | | 522,910 |
NET ASSETS | | | $ 326,772,307 |
Net Assets Consist of:
| | | |
Paid-in captial | | | 236,135,418 |
Total distributable earnings | | | 90,636,889 |
Net assets | | | $ 326,772,307 |
Net Assets | | | 326,772,307 |
Authorized (Par value $0.001 per share) | | | 100,000,000 |
Outstanding Shares | | | 8,967,301 |
Net asset value per share | | | $36.44 |
| | | | |
*
| Please refer to Note 6 for additional details. |
The accompanying notes are an integral part of these financial statements.
TABLE OF CONTENTS
Aegis Value Fund
Statement of Operations
For the Six Months Ended June 30, 2024 (Unaudited)
| | | | |
INVESTMENT INCOME
| | | |
Dividends from unaffiliated companies# | | | $3,615,922 |
Dividends from affiliated companies (Note 6)## | | | 803,616 |
Interest income from unaffiliated companies# | | | 221,721 |
Total investment income | | | 4,641,259 |
EXPENSES
|
Investment advisory fees (Note 3) | | | 2,001,422 |
Fund servicing fees | | | 131,677 |
Transfer agent & custody fees | | | 108,132 |
Printing and postage fees | | | 25,844 |
Registration fees | | | 31,122 |
Legal fees | | | 32,942 |
Chief Compliance Officer fees (Note 3) | | | 24,843 |
Audit fees | | | 12,103 |
Director fees | | | 6,461 |
Insurance fees | | | 17,745 |
Gross expenses | | | 2,392,291 |
Expenses previously waived/receovered by advisor (Note 3) | | | — |
Net expenses | | | 2,392,291 |
Net investment income | | | 2,248,968 |
Realized and Unrealized Gain on Investments and Foreign Currency Transactions
| | | |
Net realized gain (loss) from:
| | | |
Investments in unaffiliated companies | | | 30,406,648 |
Investments in affiliated companies (Note 6) | | | 2,655,340 |
Invesments in foreign currency transactions | | | (8,188) |
Net realized gain on investments and foreign currency transactions | | | 33,053,800 |
Change in unrealized appreciation on:
| | | |
Investments in unaffiliated companies | | | (24,820,777) |
Investments in affiliated companies (Note 6) | | | (3,234,402) |
Investments in foreign currency translations | | | 244 |
Net change in unrealized appreciation on investments | | | (28,054,935) |
Net realized and unrealized gain on investments and foreign currency transactions | | | 4,998,865 |
Net Increase in Net Assets Resulting from Operations | | | $7,247,833 |
| | | | |
#
| Net of foreign taxes withholding of $99,456. |
##
| Net of foreign taxes withholding of $159,909. |
The accompanying notes are an integral part of these financial statements.
TABLE OF CONTENTS
Aegis Value Fund
Statements of Changes in Net Assets
| | | | | | | |
OPERATIONS:
| | | | | | |
Net investment income (loss) | | | $2,248,968 | | | $2,523,574 |
Net realized gain on investments and foreign currency transactions | | | 33,053,800 | | | 4,394,851 |
Net change in unrealized appreciation on investments | | | (28,054,935) | | | 30,747,151 |
Net increase in net assets resulting from operations | | | 7,247,833 | | | 37,665,576 |
DISTRIBUTIONS
| | | | | | |
Net dividends and distributions to shareholders | | | — | | | (8,048,587) |
Net decrease in assets resulting from distributions paid | | | — | | | (8,048,587) |
CAPITAL SHARE TRANSACTIONS
| | | | | | |
Subscriptions | | | 23,162,421 | | | 140,002,193 |
Distributions reinvested | | | — | | | 6,521,400 |
Redemptions | | | (74,831,405) | | | (79,257,393) |
Net increase in net assets resulting from capital share transactions | | | (51,668,984) | | | 67,266,200 |
Total increase in net assets | | | (44,421,151) | | | 96,883,189 |
NET ASSETS
| | | | | | |
Beginning of Year | | | 371,193,458 | | | 274,310,269 |
End of Year | | | $ 326,772,307 | | | $371,193,458 |
SHARE INFORMATION
| | | | | | |
Subscriptions | | | 657,466 | | | 4,065,519 |
Distributions reinvested | | | — | | | 191,581 |
Redemptions | | | (2,189,524) | | | (2,337,894) |
Net increase (decrease) in shares | | | (1,532,058) | | | 1,919,206 |
Beginning shares | | | 10,499,359 | | | 8,580,153 |
Ending shares | | | 8,967,301 | | | 10,499,359 |
| | | | | | | |
The accompanying notes are an integral part of these financial statements.
TABLE OF CONTENTS
Aegis Value Fund
Financial Highlights
The table below sets forth financial data for a share outstanding in Class I throughout each year:
| | | | | | | |
Per Share Data
|
Net asset value, beginning of year | | | $35.35 | | | $31.97 | | | $28.98 | | | $21.05 | | | $18.94 | | | $15.44 |
Income from investment operations:
|
Net investment income (loss)(1) | | | 0.24 | | | 0.25 | | | 0.07 | | | 0.07 | | | (0.15) | | | (0.20) |
Net realized and unrealized gain (loss) on investments | | | 0.85 | | | 3.92 | | | 2.97 | | | 7.86 | | | 3.65 | | | 4.15 |
Total from investment operations | | | 1.09 | | | 4.17 | | | 3.04 | | | 7.93 | | | 3.50 | | | 3.95 |
Less distributions to shareholders from:
|
Net investment income | | | — | | | (0.23) | | | (0.05) | | | — | | | (0.44) | | | (0.05) |
Net realized capital gains | | | — | | | (0.56) | | | — | | | — | | | (0.95) | | | (0.40) |
Total distributions | | | — | | | (0.79) | | | (0.05) | | | — | | | (1.39) | | | (0.45) |
Net asset value, end of year | | | $36.44 | | | $35.35 | | | $31.97 | | | $28.98 | | | $21.05 | | | $18.94 |
Total investment return | | | 3.08% | | | 13.13% | | | 10.50% | | | 37.67% | | | 18.72% | | | 25.66% |
Ratios (to average net assets)/Supplemental data:
|
Expenses after waiver/recovery | | | 1.43% | | | 1.46% | | | 1.50% | | | 1.50% | | | 1.50% | | | 1.50% |
Expenses before waiver/recovery | | | 1.43% | | | 1.43% | | | 1.45% | | | 1.48% | | | 1.55% | | | 1.63% |
Net investment gain (loss) | | | 1.35% | | | 0.75% | | | 0.23% | | | 0.25% | | | (0.86)% | | | (1.18)% |
Portfolio turnover | | | 4% | | | 2% | | | 20% | | | 40% | | | 41% | | | 30% |
Net assets at end of year (000’s) | | | $326,772 | | | $371,193 | | | $274,310 | | | $179,564 | | | $123,550 | | | $115,114 |
| | | | | | | | | | | | | | | | | | | |
(1)
| Per share net investment loss was calculated prior to tax adjustments, using average shares method. |
The accompanying notes are an integral part of these financial statements.
TABLE OF CONTENTS
AEGIS VALUE FUND
Notes to Financial Statements
June 30, 2024
1. The Organization
The Aegis Funds (comprised of the Aegis Value Fund) (the “Fund”) is registered under the Investment Company Act of 1940 (the “1940 Act”) as a diversified open- end management investment company. Prior to December 13, 2019, the shares of the Aegis Funds were issued in multiple series, with each series, in effect, representing a separate fund. Effective at the close of business on December 13, 2019, Class A shares were converted into Class I shares and Class A shares were terminated. The Fund’s principal investment goal is to seek long-term capital appreciation by investing primarily in common stocks that are believed to be significantly undervalued relative to the market based on a company’s book value, revenues, or cash flow.
2. Summary of Significant Accounting Policies
As an investment company, as defined in Financial Accounting Standards Board (“FASB”) Accounting Standards Update 2013-08, the Fund follows accounting and reporting guidance under FASB Accounting Standards Codification Topic 946, “Financial Services – Investment Companies”.
Security valuation. Investments in securities are valued based on market quotations or on data furnished by an independent pricing service. Investments in securities traded on a national securities exchange (or reported on the NASDAQ National Market) are stated at the last reported sales price or a market’s official close price on the day of valuation; other securities traded in the over-the-counter market and listed securities for which no sale was reported on that date are stated at the last close price, or the average of bid and ask price for NASDAQ National Market securities. Short- term (less than 60 days maturity) notes are stated at amortized cost, which is equivalent to value. Restricted securities, securities for which market quotations are not readily available, and securities with market quotations that Aegis Financial Corporation (the “Advisor”) does not believe are reflective of market value are valued at fair value as determined by the Advisor under the supervision of the Board of Trustees (the “Board”). In determining fair value, the Board procedures consider all relevant qualitative and quantitative factors available. These factors are subject to change over time and are reviewed periodically. The values assigned to fair value investments are based on available information and do not necessarily represent amounts that might ultimately be realized, since such amounts depend on future developments inherent in long-term investments. Further, because of the inherent uncertainty of valuation, those estimated values may differ significantly from the values that would have been used had a ready market for the investments existed, and the differences could be material. Where a security is traded in more than one market, which may include foreign markets, the securities are generally valued on the market considered by the Advisor to be the primary market. The Fund will value its foreign securities in U.S. dollars on the basis of the then-prevailing currency exchange rates.
In accordance with accounting principles generally accepted in the United States of America (“GAAP”), fair value is defined as the price that the Fund would receive to sell an investment or pay to transfer a liability in an orderly transaction with an independent buyer in the principal market, or in the absence of a principal market, the most advantageous market for the investment or liability. GAAP establishes a three-tier hierarchy to distinguish between (1) inputs that reflect the assumptions market participants would use in pricing an asset or liability developed based on market data obtained from sources independent of the reporting entity (observable inputs) and (2) inputs that reflect the reporting entity’s own assumptions about the assumptions market participants would use in pricing an asset or liability developed based on the best information available in the circumstances (unobservable inputs) and to establish classification of fair value measurements for disclosure purposes. Various inputs are used in determining the value of the Fund’s investments. The inputs are summarized in the three broad levels listed below:
Level 1 –
quoted prices in active markets for identical securities. An active market for the security is a market in which transactions occur with sufficient frequency and volume to provide pricing information on an ongoing basis. A quoted price in an active market provides the most reliable evidence of fair value.
Level 2 –
other significant observable inputs (including quoted prices for similar securities, interest rates, prepayment speeds, credit risk, etc.), quoted prices for identical or similar assets in markets that are not active, and inputs that are derived principally from or corroborated by observable market data. An adjustment to any observable input that is significant to the fair value may render the measurement a Level 3 measurement.
TABLE OF CONTENTS
AEGIS VALUE FUND
Notes to Financial Statements
June 30, 2024(Continued)
Level 3 –
significant unobservable inputs, including the Fund’s own assumptions in determining the fair value of investments.
Common stocks, preferred stocks and warrants. Securities traded or dealt in one or more domestic securities exchanges, excluding the National Association of Securities Dealers’ Automated Quotation System (“NASDAQ”), and not subject to restrictions against resale shall be valued on the business day as of which such value is being determined at the close of the exchange representing the principal market for such securities at the last quoted sales price or in the absence of a sale, at the mean of the last bid and asked prices. Securities traded or dealt in the NASDAQ and not subject to restrictions against resale shall be valued in accordance with the NASDAQ Official Closing Price. Securities traded on the NASDAQ Stock Market for which there were no transactions on a particular day are valued at the mean of the last bid and asked prices. To the extent these securities are actively traded and valuation adjustments are not applied, they are categorized in Level 1 of the fair value hierarchy. Stocks traded on inactive markets or valued by reference to similar instruments are categorized in Level 2.
The inputs or methodology used for valuing securities are not necessarily an indication of the risk associated with
investing in those securities. The following is a summary of the inputs used to value the Fund’s investments as of
June 30, 2024:
Investment Valuation – Investments in securities traded on a national securities exchange (or reported on the NASDAQ National Market) are stated at the last reported sales price or a market’s official close price on the day of valuation; other securities traded in the over-the-counter market and listed securities for which no sale was reported on that date are stated at the last close price, or the average of bid and ask price for NASDAQ National Market securities. Short-term (less than 60 days maturity) notes are stated at amortized cost, which is equivalent to value. Restricted securities, securities for which market quotations are not readily available, and securities with market quotations that Aegis Financial Corporation (the “Advisor”) does not believe are reflective of market value are valued at fair value as determined by the Advisor under the supervision of the Board of Trustees.
The valuation assigned to fair valued securities for purposes of calculating the Fund’s net asset value (“NAV”) may differ from the security’s most recent closing market price and from the prices used by other mutual funds to calculate their NAVs. Where a security is traded in more than one market, which may include foreign markets, the securities are generally valued on the market considered by the Advisor to be the primary market. The Fund will value its foreign securities in U.S. dollars on the basis of the then-prevailing currency exchange rates.
Summary of Fair Value Exposure at June 30, 2024 – In accordance with accounting principles generally accepted in the United States of America (“GAAP”), fair value is defined as the price that the Fund would receive to sell an investment or pay to transfer a liability in an orderly transaction with an independent buyer in the principal market, or in the absence of a principal market, the most advantageous market for the investment or liability. GAAP establishes a three-tier hierarchy to distinguish between (1) inputs that reflect the assumptions market participants would use in pricing an asset or liability developed based on market data obtained from sources independent of the reporting entity (observable inputs) and (2) inputs that reflect the reporting entity’s own assumptions about the assumptions market participants would use in pricing an asset or liability developed based on the best information available in the circumstances (unobservable inputs) and to establish classification of fair value measurements for disclosure purposes. Various inputs are used in determining the value of the Fund’s investments. The inputs are summarized in the three broad levels listed below:
Level 1 –
quoted prices in active markets for identical securities. An active market for the security is a market in which transactions occur with sufficient frequency and volume to provide pricing information on an ongoing basis. A quoted price in an active market provides the most reliable evidence of fair value.
Level 2 –
other significant observable inputs (including quoted prices for similar securities, interest rates, prepayment speeds, credit risk, etc.), quoted prices for identical or similar assets in markets that are not active, and inputs that are derived principally from or corroborated by observable market data. An adjustment to any observable input that is significant to the fair value may render the measurement a Level 3 measurement.
TABLE OF CONTENTS
AEGIS VALUE FUND
Notes to Financial Statements
June 30, 2024(Continued)
Level 3 –
significant unobservable inputs, including the Fund’s own assumptions in determining the fair value of investments.
Common stocks, preferred stocks and warrants. Securities traded or dealt in one or more domestic securities exchanges, excluding the National Association of Securities Dealers’ Automated Quotation System (“NASDAQ”), and not subject to restrictions against resale shall be valued on the business day as of which such value is being determined at the close of the exchange representing the principal market for such securities at the last quoted sales price or in the absence of a sale, at the mean of the last bid and asked prices. Securities traded or dealt in upon the NASDAQ and not subject to restrictions against resale shall be valued in accordance with the NASDAQ Official Closing Price. Securities traded on the NASDAQ Stock Market for which there were no transactions on a particular day are valued at the mean of the last bid and asked prices. To the extent these securities are actively traded and valuation adjustments are not applied, they are categorized in Level 1 of the fair value hierarchy. Stocks traded on inactive markets or valued by reference to similar instruments are categorized in Level 2.
The inputs or methodology used for valuing securities are not necessarily an indication of the risk associated with investing in those securities. The following is a summary of the inputs used to value the Fund’s investments as of June 30, 2024:
| | | | | | | | | | | | | |
Common Stocks
| | | | | | | | | | | | |
Consumer Discretionary | | | $6,883,034 | | | $— | | | $ — | | | $6,883,034 |
Energy | | | 112,992,801 | | | 8,496,214 | | | — | | | 121,489,015 |
Financials | | | 15,869,850 | | | — | | | — | | | 15,869,850 |
Industrials | | | 322,321 | | | — | | | — | | | 322,321 |
Information Technology | | | 115,091 | | | — | | | — | | | 115,091 |
Materials | | | 124,190,075 | | | 38,822,703 | | | — | | | 163,012,778 |
Warrants
| | | | | | | | | | | | |
Materials | | | — | | | 834,086 | | | — | | | 834,086 |
Short-Term Investments
| | | | | | | | | | | | |
U.S. Treasury Bills | | | — | | | 16,857,308 | | | — | | | 16,857,308 |
Total | | | $ 260,373,172 | | | $65,010,311 | | | $— | | | $325,383,483 |
| | | | | | | | | | | | | |
When market quotations are not readily available, any security or other asset is valued at its fair value as determined in good faith under procedures approved by the Board. If events occur that will affect the value of the Fund’s portfolio securities before the net asset value (“NAV”) has been calculated (a “significant event”), the security will generally be priced using a fair value procedure. The Board has adopted specific procedures for valuing portfolio securities and delegated the responsibility of fair value determinations to the Advisor, as the Fund’s valuation designee. In determining the fair value of an investment, the Advisor seeks, in conjunction with the valuation methodology used pursuant to the procedures approved by the Board, to take into account the relevant factors and surrounding circumstances, which may include as appropriate and among other factors: (i) the nature and pricing history (if any) of the security; (ii) whether any dealer quotations for the security are available; (iii) the price and extent of trading similar securities of comparable companies; (iv) the political and economic environment and government actions or pronouncements; (v) any special reports prepared by analysts; and (vi) the extent to which the fair value to be determined for the security will result from the use of data or formula produced by the third parties independent of the Advisor.
TABLE OF CONTENTS
AEGIS VALUE FUND
Notes to Financial Statements
June 30, 2024(Continued)
The following is a summary of quantitative information about significant unobservable valuation inputs for the Fund approved by the Valuation Committee for Level 3 Fair Value Measurements for investments held as of June 30, 2024:
The following is a reconciliation of the Fund’s Level 3 assets for which significant unobservable inputs were used to determine fair value for the period ended June 30, 2024:
| | | | |
Beginning balance as of December 31, 2023 | | | $ — |
Purchases | | | — |
Sales | | | — |
Realized gain included in earnings | | | — |
Change in unrealized depreciation | | | — |
Transfer into Level 3 during the period | | | — |
Ending balance as of June 30, 2024 | | | $0 |
Change in unrealized depreciation still held as of June 30, 2024 | | | $ — |
| | | | |
Foreign risk and currency translation. The Fund may invest directly in foreign securities. Financial market fluctuations in any country where the Fund has investments will likely affect the value of the securities that the Fund owns in that country. These movements will affect the Fund’s share price and investment performance. The political, economic, and social structures of some countries may be less stable and more volatile than those in the United States. The risks of foreign markets include currency fluctuations, possible nationalization or expropriation of assets, extraordinary taxation or exchange controls, political or social instability, unfavorable diplomatic developments, and certain custody and settlement risks. In addition to these risks, many foreign markets have less trading volume and less liquidity than the U.S. markets, and therefore prices in foreign markets can be highly volatile.
Foreign markets may also have less protection for investors than the U.S. markets. Foreign issuers may be subject to less government supervision. It may also be difficult to enforce legal and shareholder/bondholder rights in foreign countries. There is no assurance that the Fund will be able to anticipate these risks or counter their effects.
The accounting records of the Fund are maintained in U.S. dollars. Foreign currency amounts are translated into U.S. dollars at the current rate of exchange to determine the value of investments, assets and liabilities. Purchases and sales of securities, and income and expenses are translated at the prevailing rate of exchange on the respective date of these transactions. The Fund does not isolate that portion of the results of operations resulting from changes in foreign exchange rates on investments from fluctuations arising from changes in market prices of securities held. These fluctuations are included with the net realized and unrealized gains or losses from investments.
Reported net realized foreign exchange gains or losses arise from sales and maturities of short-term securities, sales of foreign currencies, currency gains or losses realized between the trade and settlement dates on securities transactions and the difference between the amounts of dividends, interest and foreign withholding taxes recorded on the Fund’s books and the U.S. dollar equivalent of the amounts actually received or paid. Net unrealized foreign currency gains and losses arise from changes in the fair values of assets and liabilities, other than investments in securities at each reporting period, resulting from changes in the exchange rate. These fluctuations are included with the net realized and unrealized gains or losses from investments.
Federal income and excise taxes. The Fund’s policy is to comply with the requirements of Subchapter M of the Internal Revenue Code that are applicable to regulated investment companies and to distribute substantially all investment company taxable income and net capital gain to shareholders in a manner that results in no tax cost to the Fund. Therefore, no federal income tax provision is required.
Distributions to shareholders. Distributions to the Fund’s shareholders, which are determined in accordance with income tax regulations, are recorded on the ex- dividend date. Distributions of net investment income, if any, are made at least annually for the Fund. Net realized gains from investment transactions, if any, will be distributed to shareholders annually.
TABLE OF CONTENTS
AEGIS VALUE FUND
Notes to Financial Statements
June 30, 2024(Continued)
The character of distributions made during the year from net investment income or net realized gain may differ from the characterization for federal income tax purposes due to differences in the recognition of income, expense and gain/(loss) items for financial statement and tax purposes. Where appropriate, reclassifications between net asset accounts are made for such differences that are permanent in nature.
Use of estimates. The preparation of financial statements in conformity with GAAP requires management to make estimates and assumptions that affect the reported amounts of assets and liabilities and disclosure of contingent assets and liabilities at the date of the financial statements and the reported amounts of revenues and expenses during the reporting period. Actual results could differ from those estimates.
Security Transactions, Income and Expenses. The Fund records security transactions based on the trade date. Interest income is recognized on the accrual basis and includes accretion of discounts and amortization of premiums. The specific identification method is used to determine book and tax cost basis when calculating realized gains and losses. Dividend income is recognized on the ex-dividend date, and interest income is recognized on the accrual basis and includes accretion of discounts and amortization of premiums. Withholding taxes on foreign dividends have been provided for in accordance with the Fund’s understanding of the applicable country’s tax rules and rates.
Indemnifications. In the normal course of business, the Fund enters into contracts that contain a variety of representations, which provide general indemnifications. The Fund’s maximum exposure under these arrangements is unknown as this would involve future claims that may be made against the Fund that have not yet occurred. However, based on experience, the Fund expects the risk of loss to be remote.
Significant Concentrations. The Fund maintains a demand deposit in excess of Federal Deposit Insurance Company (“FDIC”) Insurance limits. As a result, the Fund is exposed to credit risk in the event of insolvency or other failure of the institution to meet its obligations. The Fund manages this risk by dealing with a major financial institution and monitoring its credit worthiness.
3. Advisory Fees and Other Transactions with Affiliates
The Fund entered into an investment management and advisory services agreement (the “Agreement”) with the Advisor that provides for a fee, computed daily and paid monthly at the annual rate of 1.20% of the Fund’s average daily net assets. The Agreement shall remain in force through December 31, 2024, and may be renewed for additional one-year periods thereafter if approved annually by a majority of the independent members of the Board. The Agreement may be terminated at any time, without penalty, by the Fund on sixty (60) days’ written notice or by the Advisor on ninety (90) days’ written notice. During the period ended June 30, 2024, the Fund incurred $2,001,422 in investment advisory fees. The Fund and the Advisor have also entered into an expense limitation agreement which shall remain in force through April 30, 2025, that provides for an advisory fee waiver and expense reimbursement from the Advisor if the Fund’s expenses, exclusive of taxes, interest, fees incurred in acquiring or disposing of portfolio securities, and extraordinary expenses, exceeds 1.50% for the Class I, of the Fund’s average daily net assets. During the period ended June 30, 2024, the Advisor did not recover or waive fees.
The Fund has agreed to repay the Advisor for amounts waived or reimbursed by the Advisor pursuant to the expense limitation agreement provided that such repayment does not cause the Fund’s expenses, exclusive of taxes, interest, fees incurred in acquiring or disposing of portfolio securities and extraordinary expenses, to exceed 1.50% for Class I and the repayment is made within three years from the month in which the Advisor incurred the expense. As of June 30, 2024, the Fund had recovered all fees that had previously been waived.
Certain officers and Trustees of the Fund are also officers of the Advisor. The Fund pays each Trustee not an officer of the Advisor fees in cash or Fund shares of $1,000 for each attended board meeting for the Fund and $500 for each attended audit committee meeting for the Fund. In addition, the Fund reimburses the Advisor for chief compliance officer services, a yearly amount of $50,000 paid on a quarterly basis.
TABLE OF CONTENTS
AEGIS VALUE FUND
Notes to Financial Statements
June 30, 2024(Continued)
4. Investment Transactions
Purchases and sales of long-term investment securities (excluding short-term investments) for the Fund are presented below for the period ended June 30, 2024.
| | | | | | | |
Aegis Value Fund | | | $13,215,957 | | | $69,567,740 |
| | | | | | | |
5. Distributions to Shareholders and Tax Components of Net Assets
As of June 30, 2024, the components of accumulated earnings (losses) for income tax purposes were as follows:
| | | | |
Tax cost of Investments | | | $ 284,212,012 |
Unrealized appreciation of Investments | | | 116,717,418 |
Unrealized depreciation of Investments | | | (34,083,115) |
Net unrealized depreciation | | | 82,634,303 |
Undistributed ordinary income | | | 732,182 |
Undistributed long term gain | | | 22,570 |
Distributable earnings (deficit) | | | 754,752 |
Total accumulated loss | | | $83,389,055 |
| | | | |
The difference between cost amounts for financial statement and federal income tax purposes is due primarily to timing differences in recognizing certain gains and losses in securities transactions.
The differences between book-basis and tax-basis unrealized appreciations are attributable primarily to PFIC mark to market adjustments and wash sales.
As of December 31, 2023, the Fund has no capital loss carryforwards. The Fund did not utilize short term capital loss carryovers, and long-term capital loss carryovers during the year ended December 31, 2023.
As of December 31, 2023, the Fund did not defer on a tax basis, any qualified late year losses.
The tax components of dividends paid during the year ended December 31, 2023, and the year ended December 31, 2022, were as follows:
| | | | |
$ 2,335,355 | | | $5,713,232 | | | $8,048,587 | | | $431,698 | | | $ — | | | $431,698 |
| | | | | | | | | | | | | | | | |
GAAP requires an evaluation of tax positions taken (or expected to be taken) in the course of preparing the Fund’s tax returns to determine whether these positions meet a “more-likely-than-not” standard that, based on technical merits, have a more than fifty percent likelihood of being sustained by a taxing authority upon examination. A tax position that meets the “more-likely-than-not” recognition threshold is measured to determine the amount of benefit to recognize in the financial statements. The Fund recognizes interest and penalties, if any, related to unrecognized tax benefits as an interest expense in the Statement of Operations.
GAAP requires management of the Fund to analyze all open tax years, as defined by IRS statute of limitations for all major jurisdictions, including federal tax authorities and certain state tax authorities. Open tax years include the tax years ended December 31, 2020, through December 31, 2023. As of and during the year ended December 31, 2023, the Fund did not have a liability for any unrecognized tax benefits. The Fund files U.S. Federal income and excise tax returns, as required. The Fund’s Federal income tax returns are subject to examination by the IRS for a period of three fiscal years after they are filed. The Fund has no examination in progress and is not aware of any tax positions for which it is reasonably possible that the total amounts of unrecognized tax benefits will significantly change in the next twelve months.
TABLE OF CONTENTS
AEGIS VALUE FUND
Notes to Financial Statements
June 30, 2024(Continued)
6. Investments in Affiliated Companies*
Investments representing 5% or more of the outstanding voting securities of a portfolio company result in that company being considered an affiliated company, as defined in the 1940 Act. The aggregate value of all securities of affiliated companies held in the Aegis Value Fund as of June 30, 2024 amounted to $85,459,591 representing 26.15% of net assets. A summary of affiliated transactions for the period ended June 30, 2024 is as follows:
| | | | | | | | | | | | | |
AKITA Drilling Ltd** | | | 5,945,285 | | | — | | | — | | | 5,945,285 |
Amerigo Resources Ltd. | | | 18,172,738 | | | — | | | — | | | 18,172,738 |
Bassett Furniture Industries Inc | | | 456,855 | | | — | | | — | | | 456,855 |
Cabral Gold Inc. | | | 12,911,156 | | | — | | | — | | | 12,911,156 |
Conifex Timber, Inc. | | | 2,346,913 | | | — | | | — | | | 2,346,913 |
Delta Apparel Inc | | | 674,352 | | | — | | | — | | | 674,352 |
Geodrill Ltd. | | | 3,956,698 | | | — | | | — | | | 3,956,698 |
Hallador Energy Co. | | | 1,971,083 | | | — | | | (55,000) | | | 1,916,083 |
Koil Energy Solutions, Inc. | | | 766,584 | | | — | | | — | | | 766,584 |
Minera Alamos, Inc. | | | 37,611,661 | | | — | | | — | | | 37,611,661 |
Natural Gas Services Group Inc | | | 843,293 | | | — | | | (172,520) | | | 670,773 |
Newcore Gold Ltd | | | 10,666,668 | | | 5,333,334 | | | — | | | 16,000,002 |
Revival Gold, Inc. | | | 8,183,049 | | | — | | | — | | | 8,183,049 |
| | | | | | | | | | | | | |
| | | | | | | | | | | | | |
AKITA Drilling Ltd** | | | $6,146,968 | | | $— | | | $— | | | $— |
Amerigo Resources Ltd. | | | 19,063,511 | | | — | | | — | | | — |
Bassett Furniture Industries Inc | | | 7,583,793 | | | — | | | — | | | — |
Cabral Gold Inc. | | | 1,900,061 | | | — | | | — | | | — |
Conifex Timber, Inc. | | | 1,168,984 | | | — | | | — | | | — |
Delta Apparel Inc | | | 4,808,130 | | | — | | | — | | | — |
Geodrill Ltd. | | | 5,345,073 | | | — | | | — | | | — |
Hallador Energy Co. | | | 17,424,374 | | | — | | | (400,289) | | | — |
Koil Energy Solutions, Inc. | | | 398,624 | | | — | | | — | | | — |
Minera Alamos, Inc. | | | 9,083,228 | | | — | | | — | | | — |
Natural Gas Services Group Inc | | | 13,560,151 | | | — | | | (4,082,226) | | | — |
Newcore Gold Ltd | | | 1,127,002 | | | 780,669 | | | — | | | — |
Revival Gold, Inc. | | | 2,130,600 | | | — | | | — | | | — |
Total | | | $ 89,740,499 | | | $780,669 | | | $(4,482,515) | | | $ — |
| | | | | | | | | | | | | |
TABLE OF CONTENTS
AEGIS VALUE FUND
Notes to Financial Statements
June 30, 2024(Continued)
| | | | | | | | | | | | | |
AKITA Drilling Ltd** | | | $— | | | $(323,583) | | | $5,823,385 | | | $— |
Amerigo Resources Ltd. | | | — | | | 1,526,192 | | | 20,589,703 | | | 639,148 |
Bassett Furniture Industries Inc | | | — | | | (1,091,883) | | | 6,491,910 | | | 164,468 |
Cabral Gold Inc. | | | — | | | 459,348 | | | 2,359,409 | | | — |
Conifex Timber, Inc. | | | — | | | (439,890) | | | 729,094 | | | — |
Delta Apparel Inc | | | — | | | (4,417,006) | | | 391,124 | | | — |
Geodrill Ltd. | | | — | | | 1,335,949 | | | 6,681,022 | | | — |
Hallador Energy Co. | | | 360,695 | | | (2,496,814) | | | 14,887,966 | | | — |
Koil Energy Solutions, Inc. | | | — | | | 208,626 | | | 607,250 | | | — |
Minera Alamos, Inc. | | | — | | | (835,358) | | | 8,247,870 | | | — |
Natural Gas Services Group Inc | | | 2,294,645 | | | 1,723,382 | | | 13,495,952 | | | — |
Newcore Gold Ltd | | | — | | | 1,542,496 | | | 3,450,167 | | | — |
Revival Gold, Inc. | | | — | | | (425,861) | | | 1,704,739 | | | — |
Total | | | $ 2,655,340 | | | $(3,234,402) | | | $85,459,591 | | | $803,616 |
| | | | | | | | | | | | | |
*
| As a result of the Aegis Value Fund’s beneficial ownership of common stock of these companies, regulators require that the Fund state that it may be deemed an affiliate of the respective issuer. The Fund disclaims that the “affiliated persons” are affiliates of the Distributor, Advisor, Funds or any other client of the Advisor. |
**
| This security was not affiliated as of June 30, 2024. |
7. Control Ownership
The beneficial ownership, either directly or indirectly, of more than 25% of the voting securities of a fund creates presumption of control of the fund pursuant to Section 2(a)9 of the 1940 Act. As of June 30, 2024, Pershing LLC. held approximately 28.94% of the Aegis Value Fund for the benefit of its customers.
8. Subsequent Events
In connection with the preparation of the financial statements of the Fund as of and for the period ended June 30, 2024, events and transactions subsequent to June 30, 2024, have been evaluated by management for possible adjustment and/or disclosure. Management has determined that there were no material events that would require disclosure in the Fund’s financial statements.
TABLE OF CONTENTS
Aegis Value Fund
Other Information
Proxy Voting
A description of the policies and procedures that the Fund uses to determine how to vote proxies relating to
portfolio securities is available by request, without charge, by calling the Fund’s toll-free telephone number,
800-528-3780. Information regarding how the Fund voted proxies, if any, relating to portfolio securities during the most recent 12-month year ended December 31 is available upon request, without charge, by calling 800-528-3780. The Fund’s proxy voting policies and procedures and voting record are also available on the U.S. Securities and Exchange Commission (“SEC”) website at http://www.sec.gov.
Code of Ethics
The Fund has adopted a code of ethics applicable to its principal executive officer and principal financial officer. A copy of this code is available, without charge, by calling the Fund’s toll-free phone number, 800-528-3780.
Fund Holdings
The complete schedules of the Fund’s holdings for the second and fourth quarters of each fiscal year are contained in the Fund’s semi-annual and annual shareholder reports, respectively. The Fund files complete schedules of the Fund’s holdings with the SEC for the first and third quarters of each fiscal year on Form N-PORT Part F within 60 days after the end of the period. Copies of the Fund’s Form N-PORT Part F are available without charge, upon request, by contacting the Fund at 800-528-3780 and on the SEC’s website at http://www.sec.gov. You may also review and copy Form N-PORT Part F at the SEC’s Public Reference Room in Washington, DC. For more information about the operation of the Public Reference Room, please call the SEC at 1-800-SEC-0330.
Tax Designation
For the year ended December 31, 2023, certain dividends paid by the Fund may be subject to a maximum tax rate of 15%, as provided for by the Jobs and Growth Tax Relief Reconciliation Act of 2003. The percentage of dividends declared from ordinary income designated as qualified dividend income was as follows:
For corporate shareholders, the percent of ordinary income distributions qualifying for the corporate dividends received deduction for the year ended December 31, 2023, was as follows:
The percentage of income that is designated as qualified interest income which may be exempt from U.S tax withholding when paid to non-U.S. Shareholders was as follows:
| (b) | Financial Highlights are included within the financial statements filed under Item 7 of this Form. |
Item 8. Changes in and Disagreements with Accountants for Open-End Investment Companies.
There were no changes in or disagreements with accountants during the period covered by this report.
Item 9. Proxy Disclosure for Open-End Investment Companies.
There were no matters submitted to a vote of shareholders during the period covered by this report.
Item 10. Remuneration Paid to Directors, Officers, and Others of Open-End Investment Companies.
See Item 7(a).
Item 11. Statement Regarding Basis for Approval of Investment Advisory Contract.
See Item 7(a).
Item 12. Disclosure of Proxy Voting Policies and Procedures for Closed-End Management Investment Companies.
Not applicable to open-end investment companies.
Item 13. Portfolio Managers of Closed-End Management Investment Companies.
Not applicable to open-end investment companies.
Item 14. Purchases of Equity Securities by Closed-End Management Investment Company and Affiliated Purchasers.
Not applicable to open-end investment companies.
Item 15. Submission of Matters to a Vote of Security Holders.
Not Applicable.
Item 16. Controls and Procedures.
| (a) | The Registrant’s Principal Executive Officer and Principal Financial Officer have reviewed the Registrant’s disclosure controls and procedures (as defined in Rule 30a-3(c) under the Investment Company Act of 1940 (the “Act”)) as of a date within 90 days of the filing of this report, as required by Rule 30a-3(b) under the Act and Rules 13a-15(b) or 15d-15(b) under the Securities Exchange Act of 1934. Based on their review, such officers have concluded that the disclosure controls and procedures are effective in ensuring that information required to be disclosed in this report is appropriately recorded, processed, summarized and reported and made known to them by others within the Registrant and by the Registrant’s service provider. |
| (b) | There were no changes in the Registrant’s internal control over financial reporting (as defined in Rule 30a-3(d) under the Act) that occurred during the period covered by this report that have materially affected, or are reasonably likely to materially affect, the Registrant’s internal control over financial reporting. |
Item 17. Disclosure of Securities Lending Activities for Closed-End Management Investment Companies
Not applicable to open-end investment companies.
Item 18. Recovery of Erroneously Awarded Compensation.
Not applicable
Item 19. Exhibits.
(2) Any policy required by the listing standards adopted pursuant to Rule 10D-1 under the Exchange Act (17 CFR 240.10D-1) by the registered national securities exchange or registered national securities association upon which the registrant’s securities are listed. Filed herewith.
(3) A separate certification for each principal executive officer and principal financial officer of the registrant as required by Rule 30a-2(a) under the Investment Company Act of 1940 (17 CFR 270.30a-2(a)). Filed herewith.
(4) Any written solicitation to purchase securities under Rule 23c-1 under the Act sent or given during the period covered by the report by or on behalf of the registrant to 10 or more persons. Not applicable to open-end investment companies.
(5) Changes in the registrant’s independent public accountant. Provide the information called for by Item 4 of Form 8-K under the Exchange Act (17 CFR 249.308). Unless otherwise specified by Item 4, or related to and necessary for a complete understanding of information not previously disclosed, the information should relate to events occurring during the reporting period. Not applicable.
SIGNATURES
Pursuant to the requirements of the Securities Exchange Act of 1934 and the Investment Company Act of 1940, the registrant has duly caused this report to be signed on its behalf by the undersigned, thereunto duly authorized.
| | By (Signature and Title)* | /s/ Scott L. Barbee | |
| | | Scott L. Barbee, Principal Executive Officer | |
Pursuant to the requirements of the Securities Exchange Act of 1934 and the Investment Company Act of 1940, this report has been signed below by the following persons on behalf of the registrant and in the capacities and on the dates indicated.
| | By (Signature and Title)* | /s/ Scott L. Barbee | |
| | | Scott L. Barbee, Principal Executive Officer | |
| | By (Signature and Title)* | /s/ Justin P. Harrison | |
| | | Justin P. Harrison, Principal Financial Officer | |
* Print the name and title of each signing officer under his or her signature.