
1 Columbia Property Trust 2015 Investor Conference – New York City
2 Forward-Looking Statements Certain statements contained in this presentation other than historical facts may be considered forward-looking statements. Such statements include, in particular, statements about our plans, strategies, and prospects, and are subject to certain risks and uncertainties, including known and unknown risks, which could cause actual results to differ materially from those projected or anticipated. Therefore, such statements are not intended to be a guarantee of our performance in future periods. Such forward-looking statements can generally be identified by our use of forward-looking terminology such as "may," "will," "expect," "intend," "anticipate," "estimate," "believe," "continue," or other similar words and include statements related to expected dispositions, our projected debt profile and future debt maturities. Readers are cautioned not to place undue reliance on these forward-looking statements. We make no representations or warranties (express or implied) about the accuracy of any such forward-looking statements contained in this presentation, and we do not intend to publicly update or revise any forward-looking statements, whether as a result of new information, future events, or otherwise. Any such forward-looking statements are subject to risks, uncertainties, and other factors and are based on a number of assumptions involving judgments with respect to, among other things, future economic, competitive, and market conditions, all of which are difficult or impossible to predict accurately. To the extent that our assumptions differ from actual conditions, our ability to accurately anticipate results expressed in such forward-looking statements, including our ability to generate positive cash flow from operations, make distributions to stockholders, and maintain the value of our real estate properties, may be significantly hindered. See Item 1A in the Company's most recently filed Annual Report on Form 10-K for the year ended December 31, 2014, for a discussion of some of the risks and uncertainties that could cause actual results to differ materially from those presented in our forward-looking statements. The risk factors described in our Annual Report are not the only ones we face but do represent those risks and uncertainties that we believe are material to us. Additional risks and uncertainties not currently known to us or that we currently deem immaterial may also harm our business. For additional information, including reconciliations of any non-GAAP financial measures found herein, please reference the supplemental report furnished by the Company on a Current Report on Form 8-K filed on February 12, 2015. The names, logos and related product and service names, design marks, and slogans are the trademarks or service marks of their respective companies. Unless otherwise noted, all data herein is as of 12/31/14, pro forma for the acquisition of 116 Huntington Avenue, which closed on 1/8/15 for $152M, and for the acquisition of the two property portfolio, which closed on 1/7/15 for $436M (collectively, “the January acquisitions”).
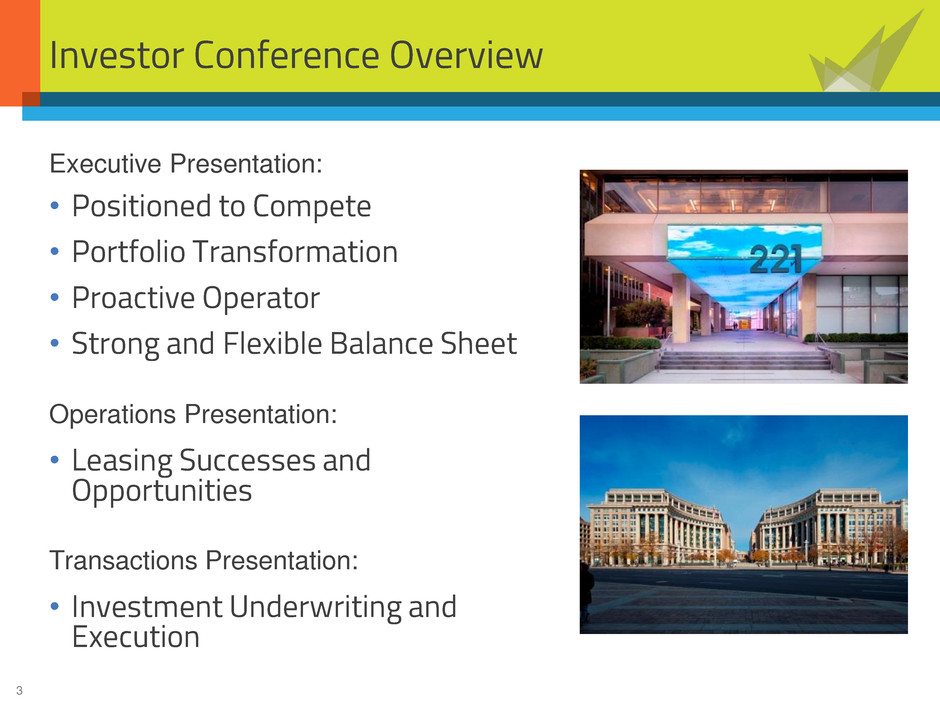
3 Investor Conference Overview Executive Presentation: • Positioned to Compete • Portfolio Transformation • Proactive Operator • Strong and Flexible Balance Sheet Operations Presentation: • Leasing Successes and Opportunities Transactions Presentation: • Investment Underwriting and Execution

4 Positioned to Compete View of 333 Market Street, San Francisco
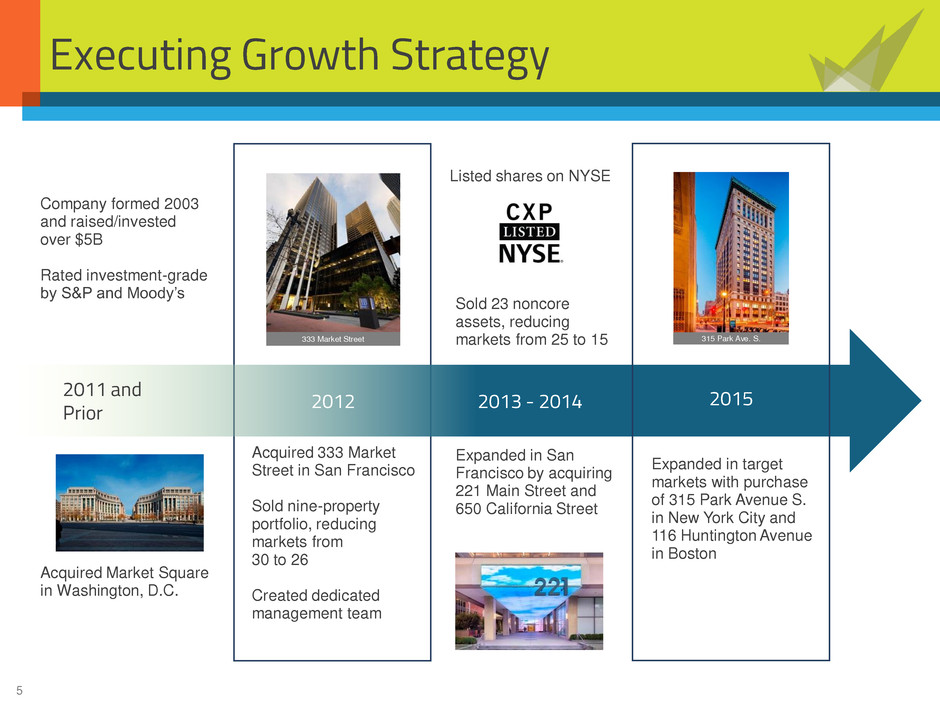
5 Executing Growth Strategy Company formed 2003 and raised/invested over $5B Rated investment-grade by S&P and Moody’s Acquired Market Square in Washington, D.C. Listed shares on NYSE Expanded in San Francisco by acquiring 221 Main Street and 650 California Street Acquired 333 Market Street in San Francisco Sold nine-property portfolio, reducing markets from 30 to 26 Created dedicated management team Expanded in target markets with purchase of 315 Park Avenue S. in New York City and 116 Huntington Avenue in Boston Sold 23 noncore assets, reducing markets from 25 to 15 2012 2011 and Prior 2013 - 2014 2015 333 Market Street 315 Park Ave. S.
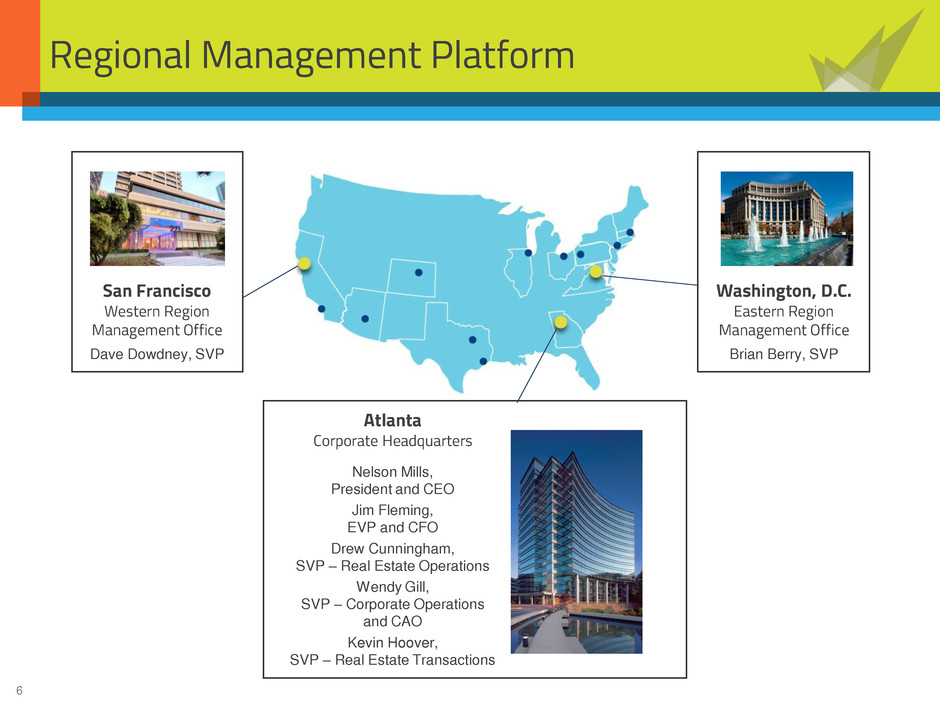
6 Regional Management Platform Atlanta Corporate Headquarters Nelson Mills, President and CEO Jim Fleming, EVP and CFO Drew Cunningham, SVP – Real Estate Operations Wendy Gill, SVP – Corporate Operations and CAO Kevin Hoover, SVP – Real Estate Transactions San Francisco Western Region Management Office Dave Dowdney, SVP Washington, D.C. Eastern Region Management Office Brian Berry, SVP
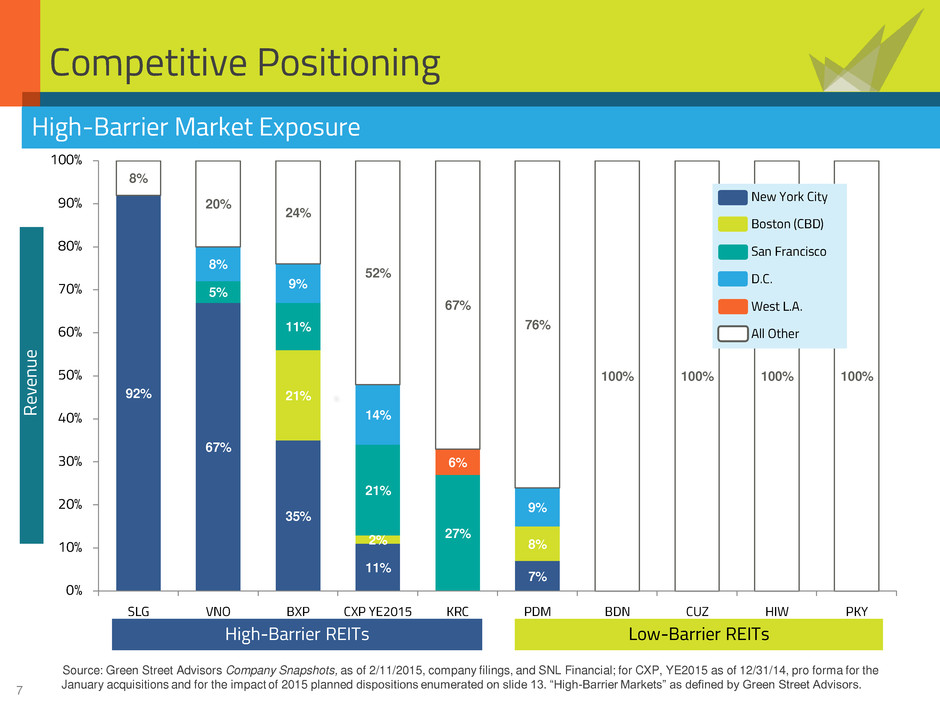
7 Competitive Positioning 92% 67% 35% 11% 7% 21% 2% 8% 5% 11% 21% 27% 8% 9% 14% 9% 6% 8% 20% 24% 52% 67% 76% 100% 100% 100% 100% 0% 10% 20% 30% 40% 50% 60% 70% 80% 90% 100% SLG VNO BXP CXP YE2015 KRC PDM BDN CUZ HIW PKY New York City Boston (CBD) San Francisco D.C. West L.A. All Other Source: Green Street Advisors Company Snapshots, as of 2/11/2015, company filings, and SNL Financial; for CXP, YE2015 as of 12/31/14, pro forma for the January acquisitions and for the impact of 2015 planned dispositions enumerated on slide 13. “High-Barrier Markets” as defined by Green Street Advisors. High-Barrier Market Exposure High-Barrier REITs Low-Barrier REITs Re ve nu e
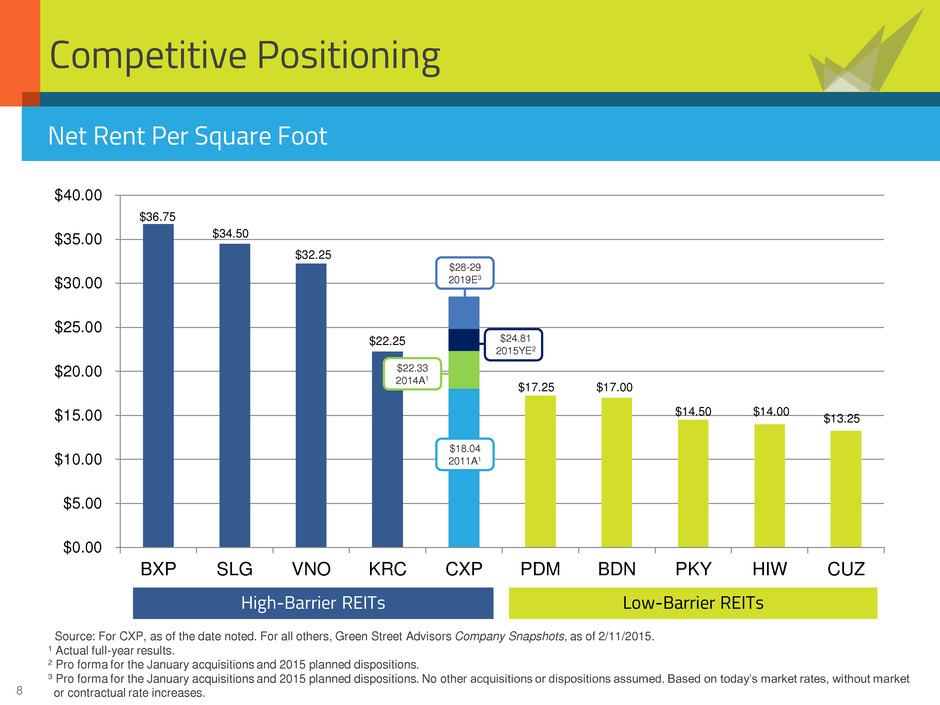
8 $0.00 $5.00 $10.00 $15.00 $20.00 $25.00 $30.00 $35.00 $40.00 BXP SLG VNO KRC CXP PDM BDN PKY HIW CUZ $32.25 $22.25 $34.50 $17.25 $17.00 $14.50 $14.00 $13.25 $28-29 2019E3 Competitive Positioning High-Barrier REITs Low-Barrier REITs Net Rent Per Square Foot Source: For CXP, as of the date noted. For all others, Green Street Advisors Company Snapshots, as of 2/11/2015. 1 Actual full-year results. 2 Pro forma for the January acquisitions and 2015 planned dispositions. 3 Pro forma for the January acquisitions and 2015 planned dispositions. No other acquisitions or dispositions assumed. Based on today’s market rates, without market or contractual rate increases. $36.75 $24.81 2015YE2 $22.33 2014A1 $18.04 2011A1
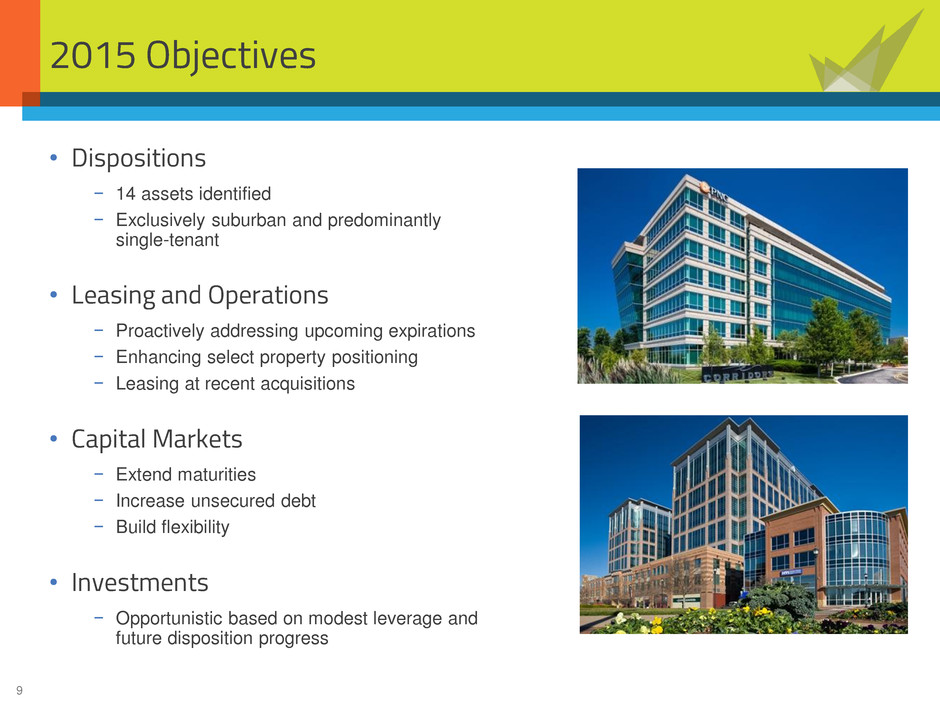
9 2015 Objectives • Dispositions − 14 assets identified − Exclusively suburban and predominantly single-tenant • Leasing and Operations − Proactively addressing upcoming expirations − Enhancing select property positioning − Leasing at recent acquisitions • Capital Markets − Extend maturities − Increase unsecured debt − Build flexibility • Investments − Opportunistic based on modest leverage and future disposition progress
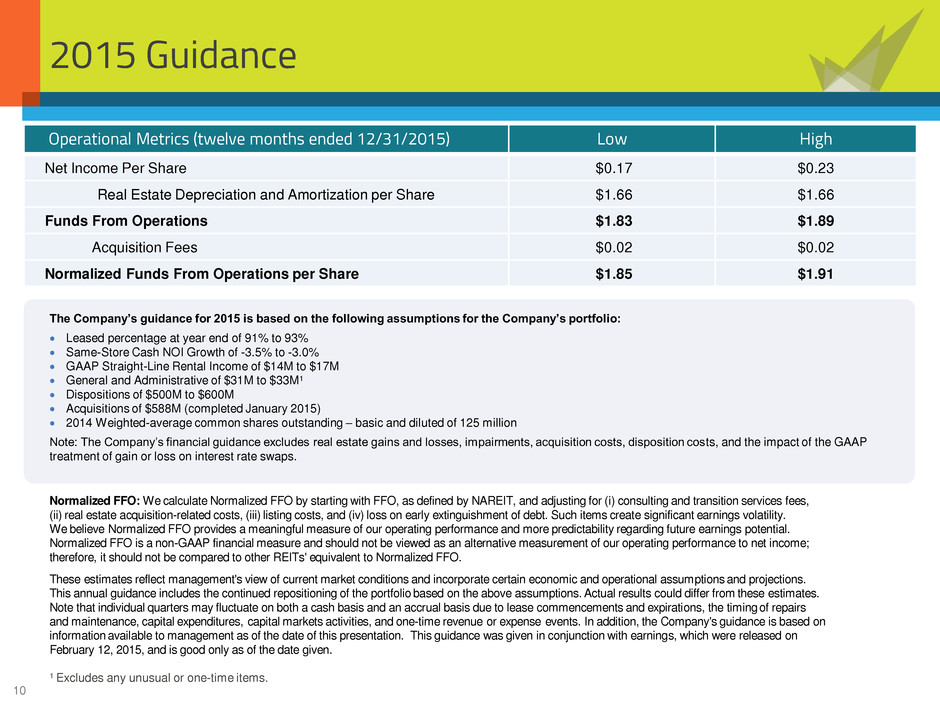
10 Operational Metrics (twelve months ended 12/31/2015) Low High Net Income Per Share $0.17 $0.23 Real Estate Depreciation and Amortization per Share $1.66 $1.66 Funds From Operations $1.83 $1.89 Acquisition Fees $0.02 $0.02 Normalized Funds From Operations per Share $1.85 $1.91 2015 Guidance 1 Excludes any unusual or one-time items. The Company’s guidance for 2015 is based on the following assumptions for the Company’s portfolio: Leased percentage at year end of 91% to 93% Same-Store Cash NOI Growth of -3.5% to -3.0% GAAP Straight-Line Rental Income of $14M to $17M General and Administrative of $31M to $33M1 Dispositions of $500M to $600M Acquisitions of $588M (completed January 2015) 2014 Weighted-average common shares outstanding – basic and diluted of 125 million Note: The Company’s financial guidance excludes real estate gains and losses, impairments, acquisition costs, disposition costs, and the impact of the GAAP treatment of gain or loss on interest rate swaps. Normalized FFO: We calculate Normalized FFO by starting with FFO, as defined by NAREIT, and adjusting for (i) consulting and transition services fees, (ii) real estate acquisition-related costs, (iii) listing costs, and (iv) loss on early extinguishment of debt. Such items create significant earnings volatility. We believe Normalized FFO provides a meaningful measure of our operating performance and more predictability regarding future earnings potential. Normalized FFO is a non-GAAP financial measure and should not be viewed as an alternative measurement of our operating performance to net income; therefore, it should not be compared to other REITs' equivalent to Normalized FFO. These estimates reflect management's view of current market conditions and incorporate certain economic and operational assumptions and projections. This annual guidance includes the continued repositioning of the portfolio based on the above assumptions. Actual results could differ from these estimates. Note that individual quarters may fluctuate on both a cash basis and an accrual basis due to lease commencements and expirations, the timing of repairs and maintenance, capital expenditures, capital markets activities, and one-time revenue or expense events. In addition, the Company's guidance is based on information available to management as of the date of this presentation. This guidance was given in conjunction with earnings, which were released on February 12, 2015, and is good only as of the date given.
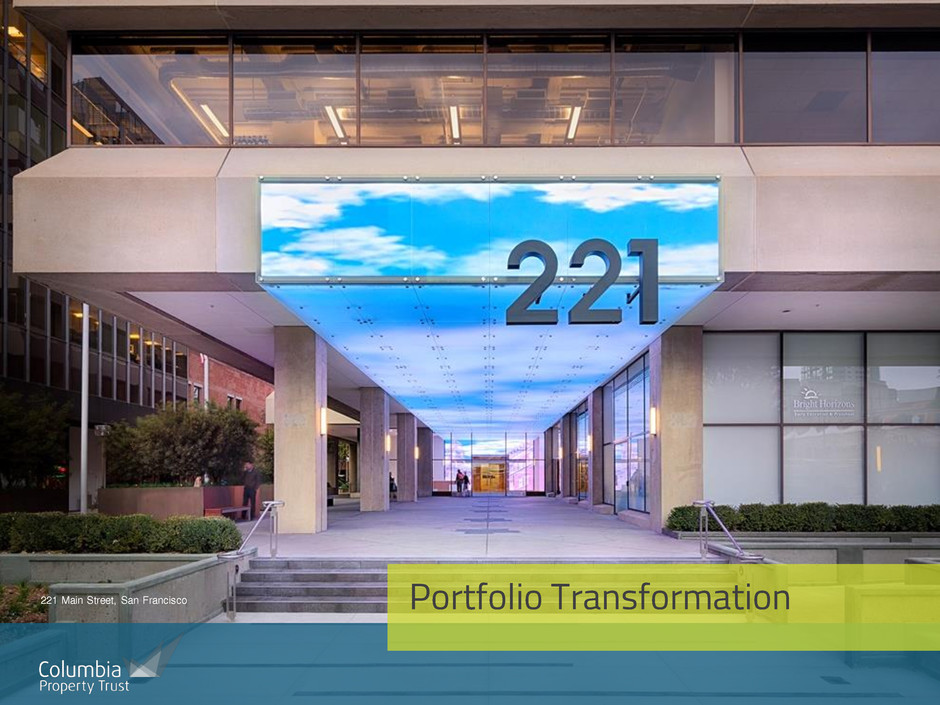
11 Portfolio Transformation 221 Main Street, San Francisco
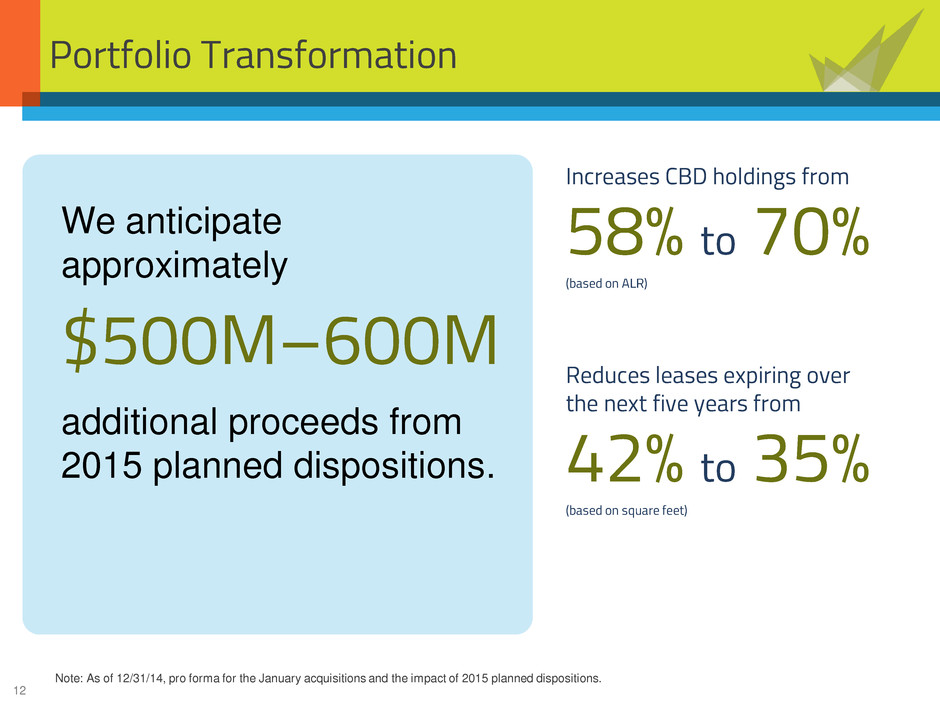
12 Reduces leases expiring over the next five years from 42% to 35% (based on square feet) Portfolio Transformation We anticipate approximately $500M–600M additional proceeds from 2015 planned dispositions. Increases CBD holdings from 58% to 70% (based on ALR) Note: As of 12/31/14, pro forma for the January acquisitions and the impact of 2015 planned dispositions.
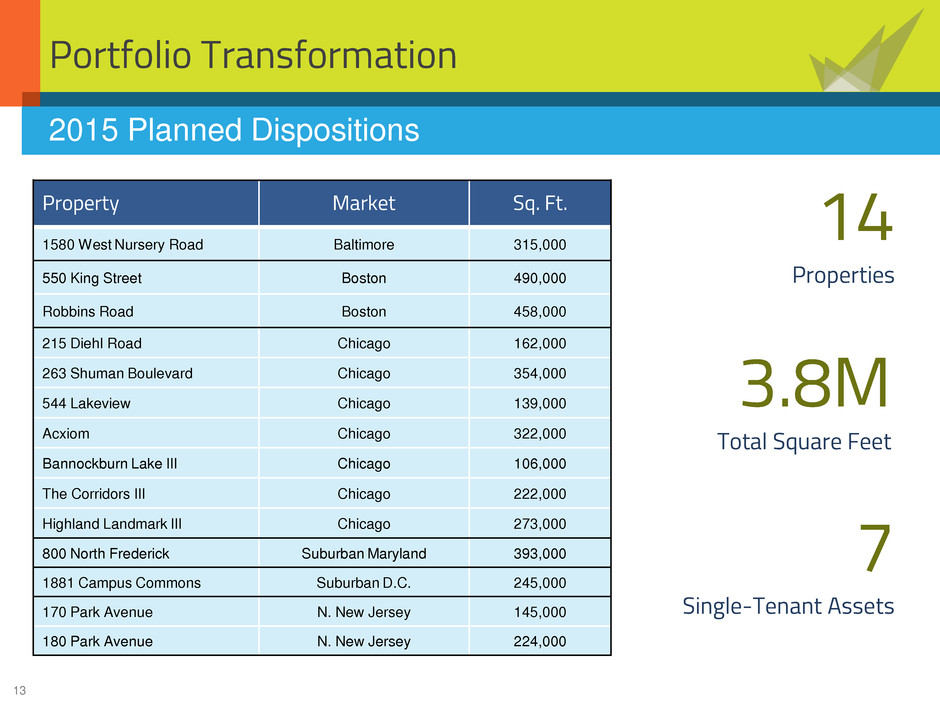
13 Portfolio Transformation Property Market Sq. Ft. 1580 West Nursery Road Baltimore 315,000 550 King Street Boston 490,000 Robbins Road Boston 458,000 215 Diehl Road Chicago 162,000 263 Shuman Boulevard Chicago 354,000 544 Lakeview Chicago 139,000 Acxiom Chicago 322,000 Bannockburn Lake III Chicago 106,000 The Corridors III Chicago 222,000 Highland Landmark III Chicago 273,000 800 North Frederick Suburban Maryland 393,000 1881 Campus Commons Suburban D.C. 245,000 170 Park Avenue N. New Jersey 145,000 180 Park Avenue N. New Jersey 224,000 2015 Planned Dispositions 14 Properties 7 Single-Tenant Assets 3.8M Total Square Feet
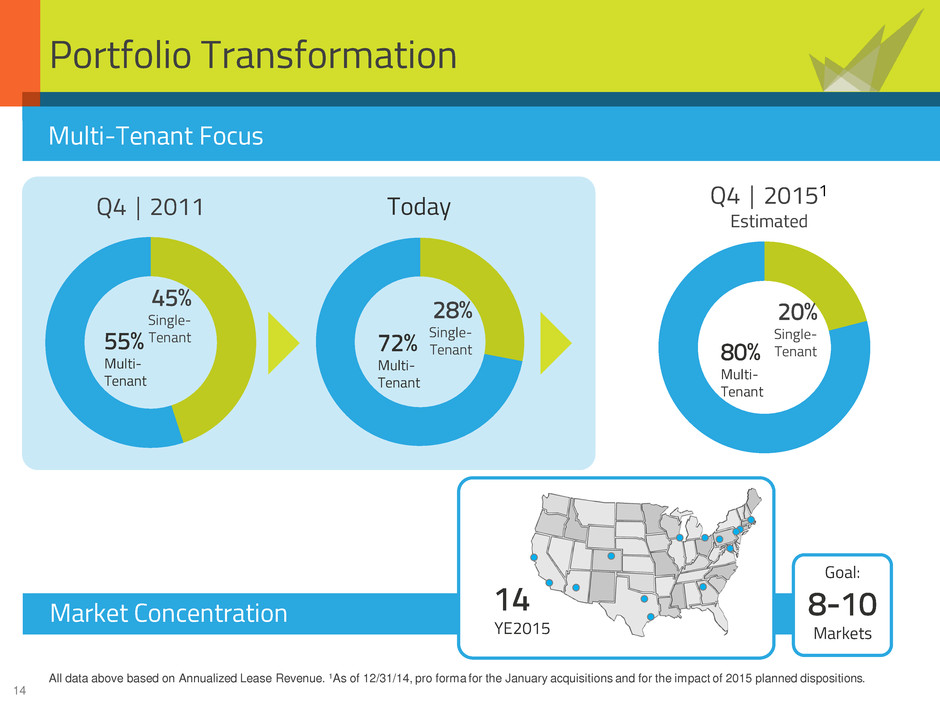
14 Market Concentration Portfolio Transformation Multi-Tenant Focus Single- Tenant Multi- Tenant Q4 │ 20151 Estimated Single- Tenant Multi- Tenant Today Single- Tenant Multi- Tenant Q4 │ 2011 YE2015 All data above based on Annualized Lease Revenue. 1As of 12/31/14, pro forma for the January acquisitions and for the impact of 2015 planned dispositions. Goal: Markets
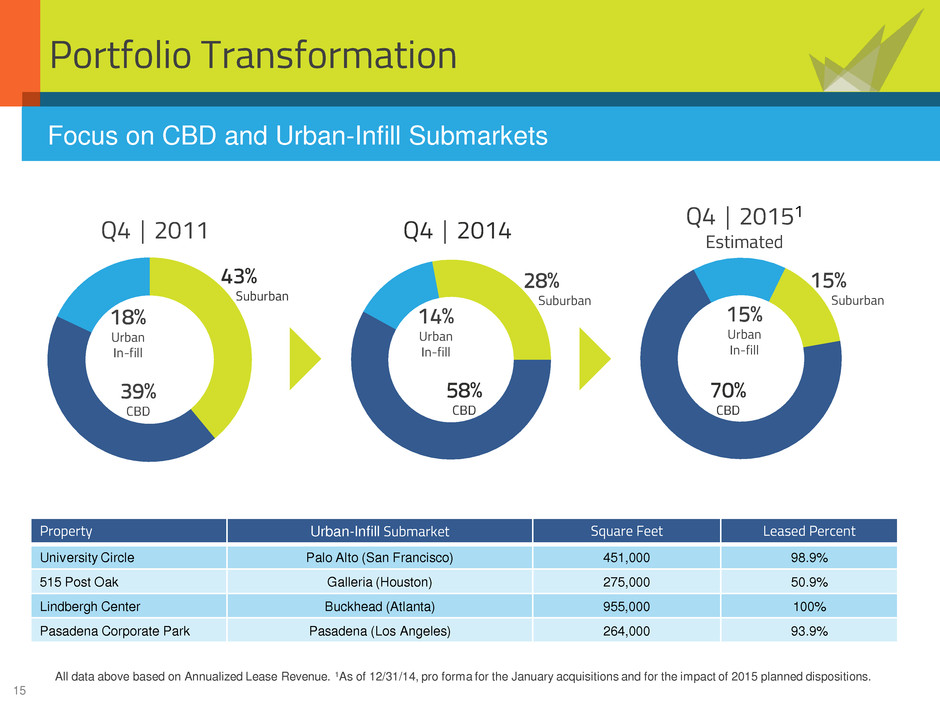
15 Focus on CBD and Urban-Infill Submarkets Portfolio Transformation CBD Suburban Q4 │ 2014 Q4 │ 2011 Suburban CBD Suburban CBD Property Urban-Infill Submarket Square Feet Leased Percent University Circle Palo Alto (San Francisco) 451,000 98.9% 515 Post Oak Galleria (Houston) 275,000 50.9% Lindbergh Center Buckhead (Atlanta) 955,000 100% Pasadena Corporate Park Pasadena (Los Angeles) 264,000 93.9% All data above based on Annualized Lease Revenue. 1As of 12/31/14, pro forma for the January acquisitions and for the impact of 2015 planned dispositions. Q4 │ 20151 Estimated Urban In-fill Urban In-fill Urban In-fill
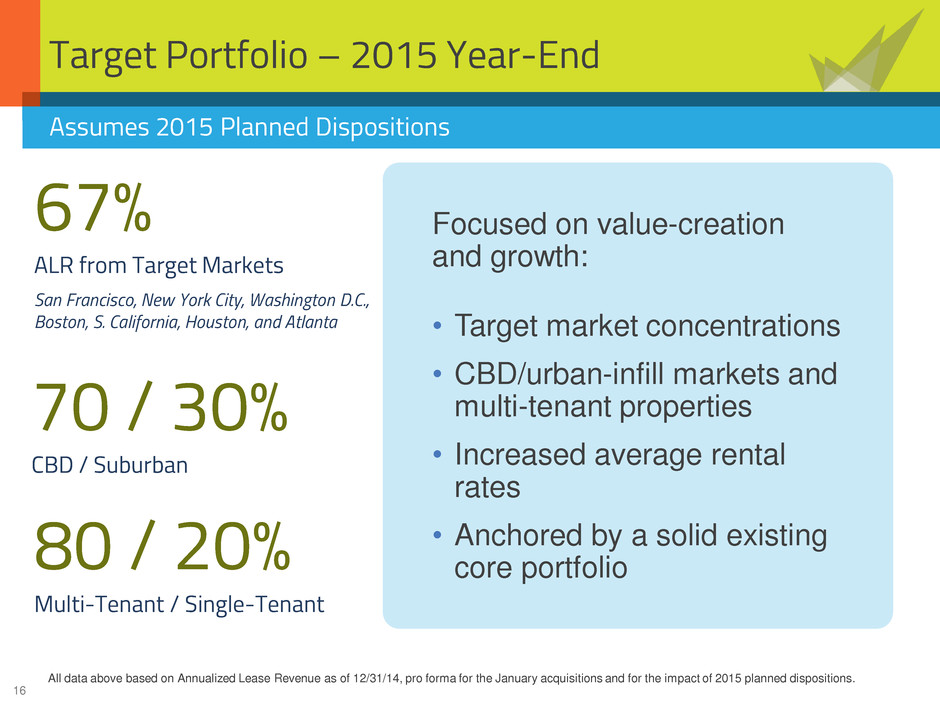
16 Target Portfolio – 2015 Year-End Focused on value-creation and growth: • Target market concentrations • CBD/urban-infill markets and multi-tenant properties • Increased average rental rates • Anchored by a solid existing core portfolio 67% ALR from Target Markets San Francisco, New York City, Washington D.C., Boston, S. California, Houston, and Atlanta 80 / 20% Multi-Tenant / Single-Tenant 70 / 30% CBD / Suburban Assumes 2015 Planned Dispositions All data above based on Annualized Lease Revenue as of 12/31/14, pro forma for the January acquisitions and for the impact of 2015 planned dispositions.
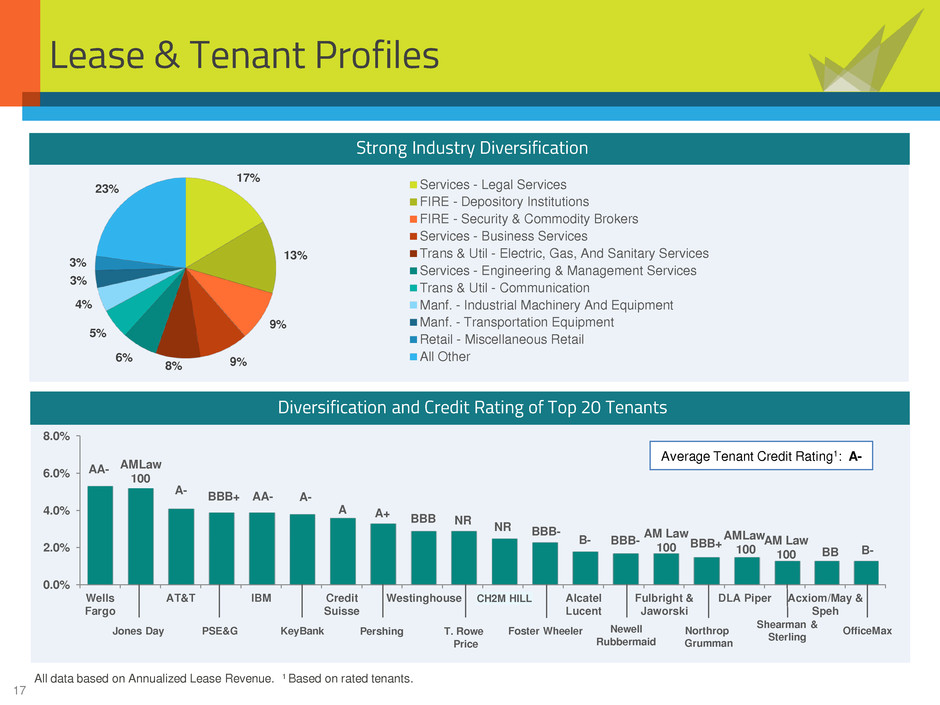
17 17% 13% 9% 9% 8% 6% 5% 4% 3% 3% 23% Services - Legal Services FIRE - Depository Institutions FIRE - Security & Commodity Brokers Services - Business Services Trans & Util - Electric, Gas, And Sanitary Services Services - Engineering & Management Services Trans & Util - Communication Manf. - Industrial Machinery And Equipment Manf. - Transportation Equipment Retail - Miscellaneous Retail All Other 0.0% 2.0% 4.0% 6.0% 8.0% Wells Fargo AT&T IBM Credit Suisse Westinghouse CH2M Hill Alcatel Lucent Fulbright & Jaworski DLA Piper Acxiom/May & Speh B- AA- Lease & Tenant Profiles A- AMLaw 100 BBB+ AA- A A+ NR A- NR BBB- B- BBB- BBB AM Law 100 Average Tenant Credit Rating1: A- BB Strong Industry Diversification Diversification and Credit Rating of Top 20 Tenants Jones Day PSE&G KeyBank Pershing T. Rowe Price Foster Wheeler Newell Rubbermaid Northrop Grumman Shearman & Sterling OfficeMax BBB+ AM Law 100 AMLaw 100 All data based on Annualized Lease Revenue. 1 Based on rated tenants. ILL

18 Leasing Activity 2011 2012 2013 2014 New Leases 614,826 887,197 587,127 359,239 Renewal Leases 1,837,017 1,941,302 1,187,125 740,583 Total Leases 2,451,843 2,828,499 1,774,252 1,099,822 % Portfolio Leased (SF) 10.8% 13.5% 10.8% 7.1% Average Lease Term1 6.5 Years 9.8 Years 10.2 Years 11.9 Years 1 Based on Annualized Lease Revenue. 2 Based on rated tenants.
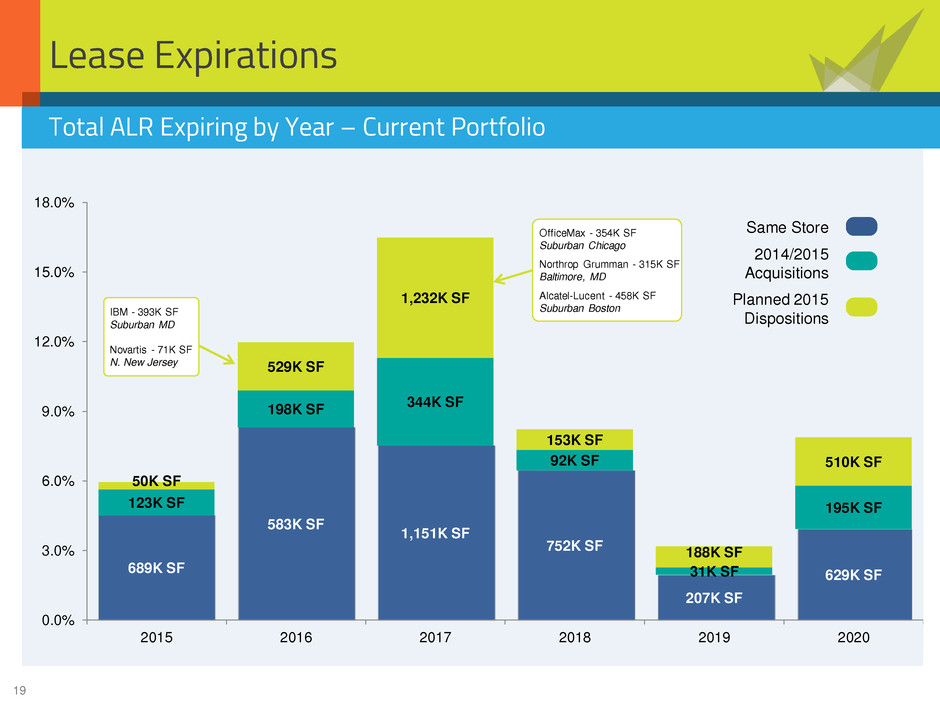
19 689K SF 583K SF 1,151K SF 752K SF 207K SF 629K SF 123K SF 198K SF 344K SF 92K SF 31K SF 195K SF 50K SF 529K SF 1,232K SF 153K SF 188K SF 510K SF 0.0% 3.0% 6.0% 9.0% 12.0% 15.0% 18.0% 2015 2016 2017 2018 2019 2020 Lease Expirations IBM - 393K SF Suburban MD Novartis - 71K SF N. New Jersey OfficeMax - 354K SF Suburban Chicago Northrop Grumman - 315K SF Baltimore, MD Alcatel-Lucent - 458K SF Suburban Boston Total ALR Expiring by Year – Current Portfolio Same Store 2014/2015 Acquisitions Planned 2015 Dispositions
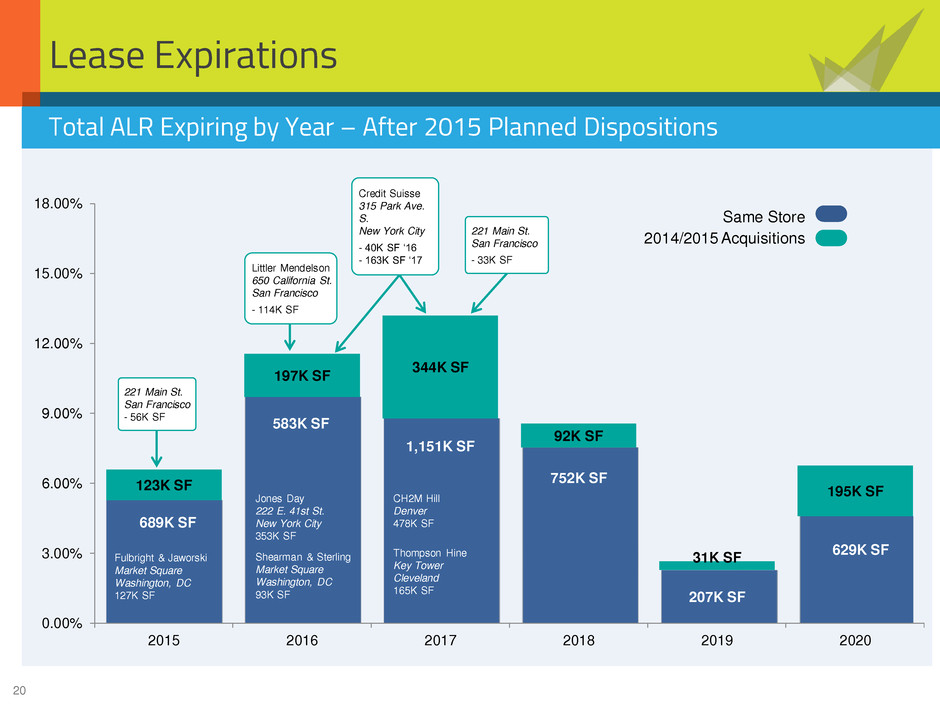
20 Lease Expirations 689K SF 583K SF 1,151K SF 752K SF 207K SF 629K SF 123K SF 197K SF 344K SF 92K SF 31K SF 195K SF 0.00% 3.00% 6.00% 9.00% 12.00% 15.00% 18.00% 2015 2016 2017 2018 2019 2020 Total ALR Expiring by Year – After 2015 Planned Dispositions Fulbright & Jaworski Market Square Washington, DC 127K SF Jones Day 222 E. 41st St. New York City 353K SF Shearman & Sterling Market Square Washington, DC 93K SF CH2M Hill Denver 478K SF Thompson Hine Key Tower Cleveland 165K SF 221 Main St. San Francisco - 33K SF Credit Suisse 315 Park Ave. S. New York City - 40K SF ‘16 - 163K SF ‘17 Littler Mendelson 650 California St. San Francisco - 114K SF 221 Main St. San Francisco - 56K SF Same Store 2014/2015 Acquisitions
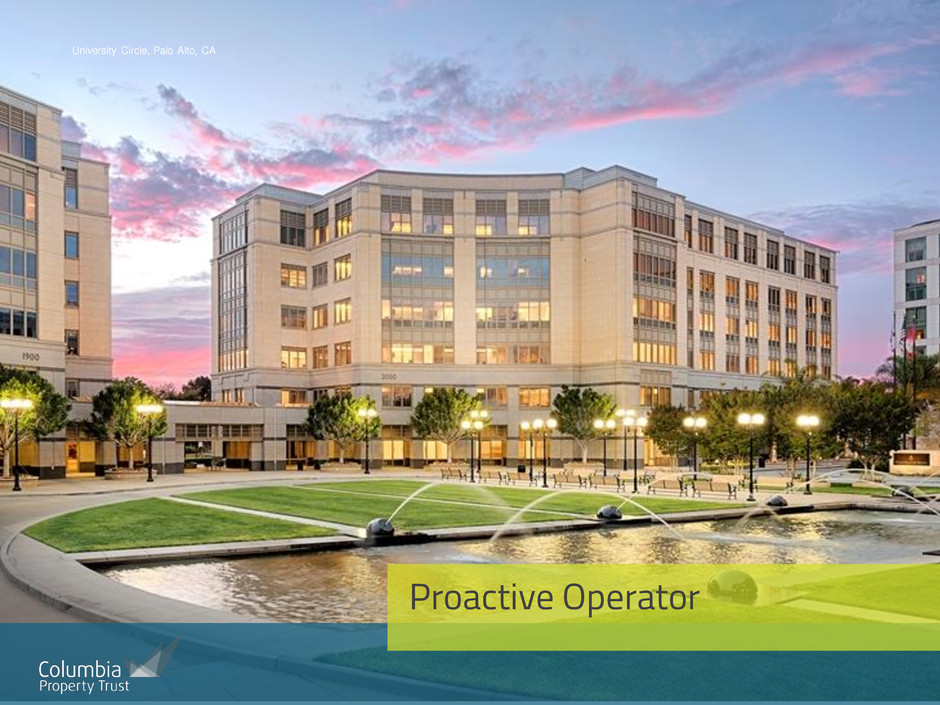
21 Proactive Operator University Circle, Palo Alto, CA

22 Key Leasing Accomplishments Retained KeyBank in 478K SF • 71% of prior space • Extended to 2030 • Gave back 198K SF (June 2015) Renewed PSEG in 824K SF • Extended from 2015 to 2030 • As part of renewal, Columbia gets (136K SF) in Sept. 2015 Proactive Lease Management Opportunistically Manage Expirations Key Tower Cleveland, OH Already leased 116K SF (over half of give-back) to BakerHostetler, from 2016 to 2031 80 Park Plaza Newark, NJ Rolled up rates on retained space, and have lease up opportunity on top five floors of property
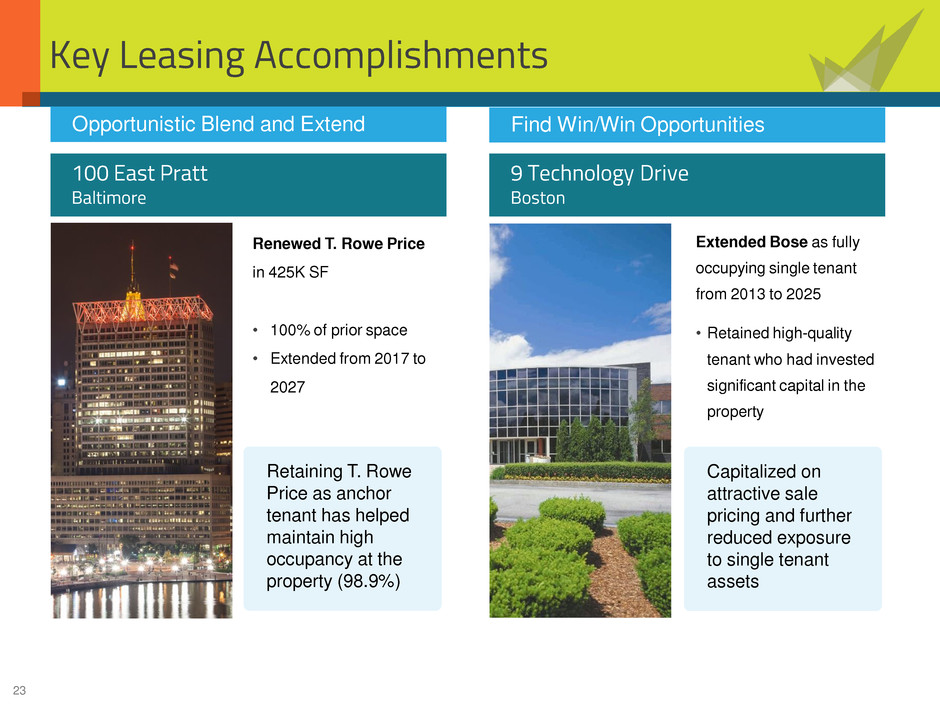
23 9 Technology Drive Boston 100 East Pratt Baltimore Key Leasing Accomplishments Renewed T. Rowe Price in 425K SF • 100% of prior space • Extended from 2017 to 2027 Find Win/Win Opportunities Opportunistic Blend and Extend Retaining T. Rowe Price as anchor tenant has helped maintain high occupancy at the property (98.9%) Extended Bose as fully occupying single tenant from 2013 to 2025 • Retained high-quality tenant who had invested significant capital in the property Capitalized on attractive sale pricing and further reduced exposure to single tenant assets

24 Key Leasing Accomplishments • Over 38% of existing tenants vacated between 2011 and 2013 • Remodeled vacant space to reposition property for a more diverse tenant roster 0% 25% 50% 75% 100% 2011 2012 2013 2014 Occupancy & Average Gross Rate (in-place) $70 / SF $68 / SF $76 / SF $77 / SF Capitalizing on Technology Demand University Circle Palo Alto, CA (San Francisco) Nearly all renewals/extensions were rate roll-ups, with average cash increase of over 20% from prior rents
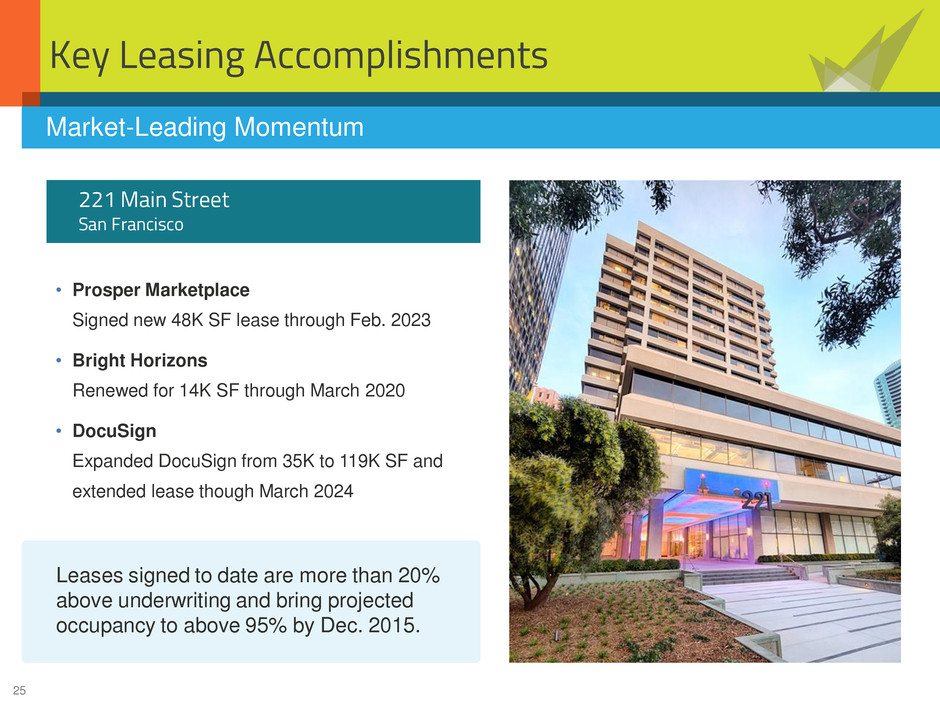
25 Key Leasing Accomplishments 221 Main Street San Francisco • Prosper Marketplace Signed new 48K SF lease through Feb. 2023 • Bright Horizons Renewed for 14K SF through March 2020 • DocuSign Expanded DocuSign from 35K to 119K SF and extended lease though March 2024 Market-Leading Momentum Leases signed to date are more than 20% above underwriting and bring projected occupancy to above 95% by Dec. 2015.

26 Strong and Flexible Balance Sheet 222 East 41st Street, New York City
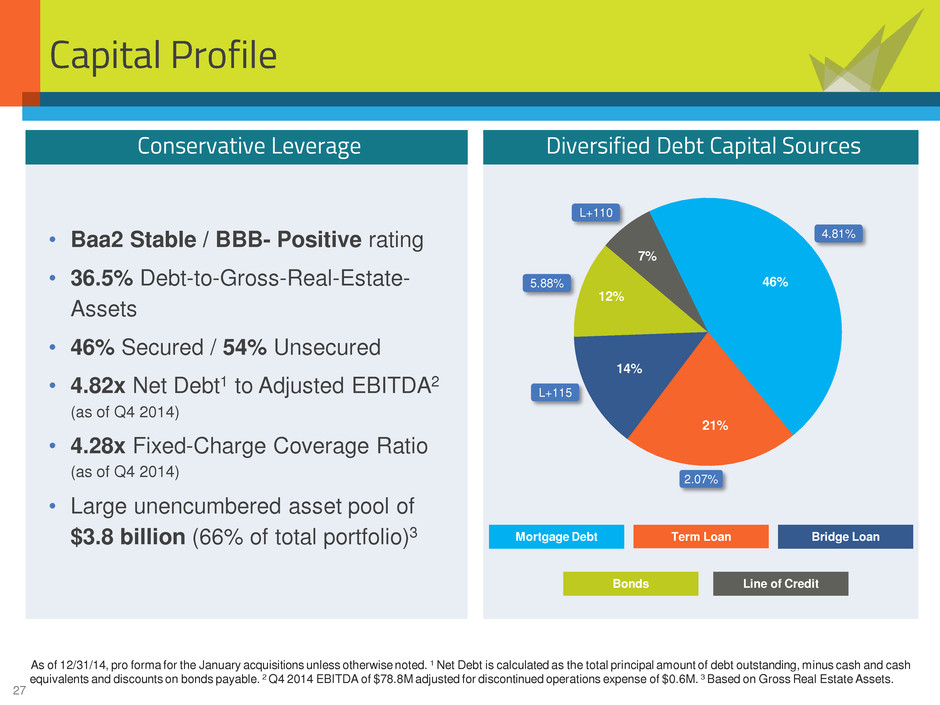
27 Capital Profile • Baa2 Stable / BBB- Positive rating • 36.5% Debt-to-Gross-Real-Estate- Assets • 46% Secured / 54% Unsecured • 4.82x Net Debt1 to Adjusted EBITDA2 (as of Q4 2014) • 4.28x Fixed-Charge Coverage Ratio (as of Q4 2014) • Large unencumbered asset pool of $3.8 billion (66% of total portfolio)3 Mortgage Debt Bonds Term Loan Line of Credit 46% 21% 14% 12% 7% Conservative Leverage Diversified Debt Capital Sources As of 12/31/14, pro forma for the January acquisitions unless otherwise noted. 1 Net Debt is calculated as the total principal amount of debt outstanding, minus cash and cash equivalents and discounts on bonds payable. 2 Q4 2014 EBITDA of $78.8M adjusted for discontinued operations expense of $0.6M. 3 Based on Gross Real Estate Assets. 5.88% 4.81% 2.07% L+110 L+115 Bridge Loan
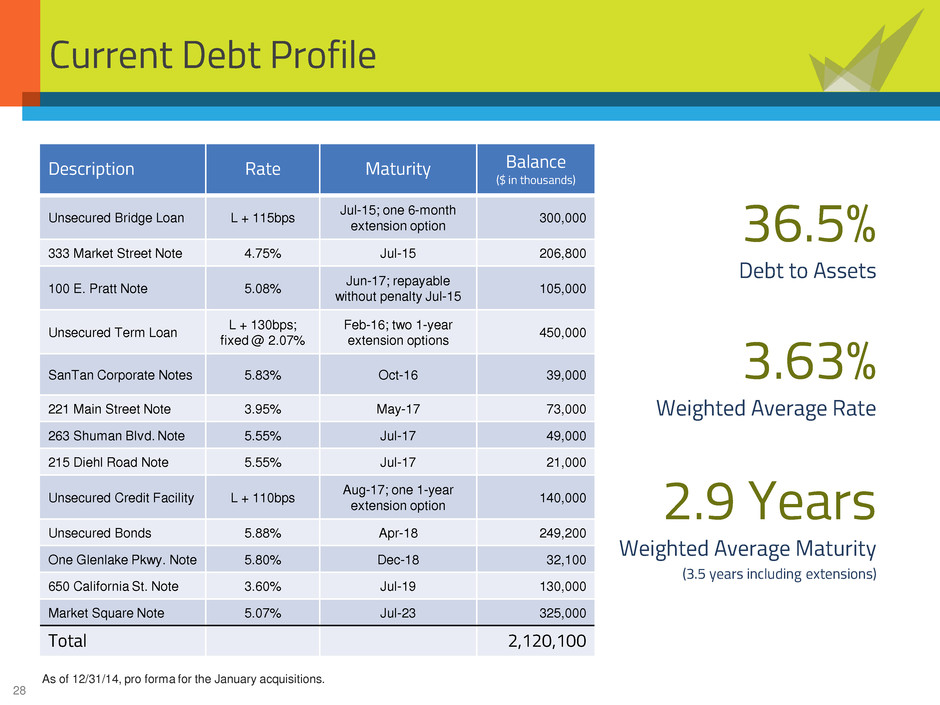
28 Current Debt Profile Description Rate Maturity Balance ($ in thousands) Unsecured Bridge Loan L + 115bps Jul-15; one 6-month extension option 300,000 333 Market Street Note 4.75% Jul-15 206,800 100 E. Pratt Note 5.08% Jun-17; repayable without penalty Jul-15 105,000 Unsecured Term Loan L + 130bps; fixed @ 2.07% Feb-16; two 1-year extension options 450,000 SanTan Corporate Notes 5.83% Oct-16 39,000 221 Main Street Note 3.95% May-17 73,000 263 Shuman Blvd. Note 5.55% Jul-17 49,000 215 Diehl Road Note 5.55% Jul-17 21,000 Unsecured Credit Facility L + 110bps Aug-17; one 1-year extension option 140,000 Unsecured Bonds 5.88% Apr-18 249,200 One Glenlake Pkwy. Note 5.80% Dec-18 32,100 650 California St. Note 3.60% Jul-19 130,000 Market Square Note 5.07% Jul-23 325,000 Total 2,120,100 As of 12/31/14, pro forma for the January acquisitions. 36.5% Debt to Assets 3.63% Weighted Average Rate 2.9 Years Weighted Average Maturity (3.5 years including extensions)
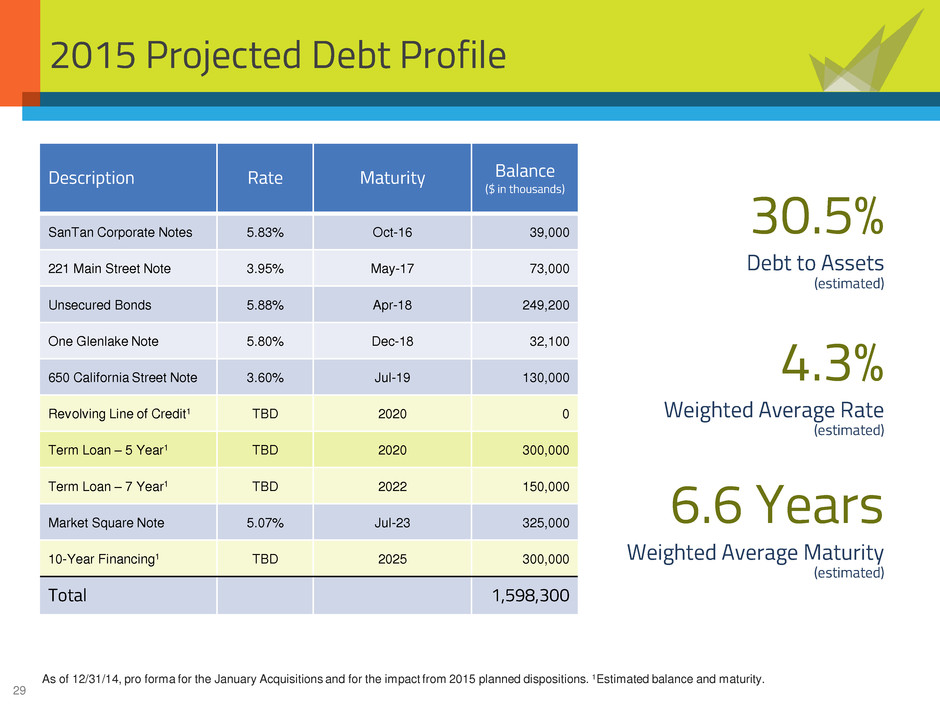
29 2015 Projected Debt Profile Description Rate Maturity Balance ($ in thousands) SanTan Corporate Notes 5.83% Oct-16 39,000 221 Main Street Note 3.95% May-17 73,000 Unsecured Bonds 5.88% Apr-18 249,200 One Glenlake Note 5.80% Dec-18 32,100 650 California Street Note 3.60% Jul-19 130,000 Revolving Line of Credit1 TBD 2020 0 Term Loan – 5 Year1 TBD 2020 300,000 Term Loan – 7 Year1 TBD 2022 150,000 Market Square Note 5.07% Jul-23 325,000 10-Year Financing1 TBD 2025 300,000 Total 1,598,300 As of 12/31/14, pro forma for the January Acquisitions and for the impact from 2015 planned dispositions. 1Estimated balance and maturity. 30.5% Debt to Assets (estimated) 4.3% Weighted Average Rate (estimated) 6.6 Years Weighted Average Maturity (estimated)
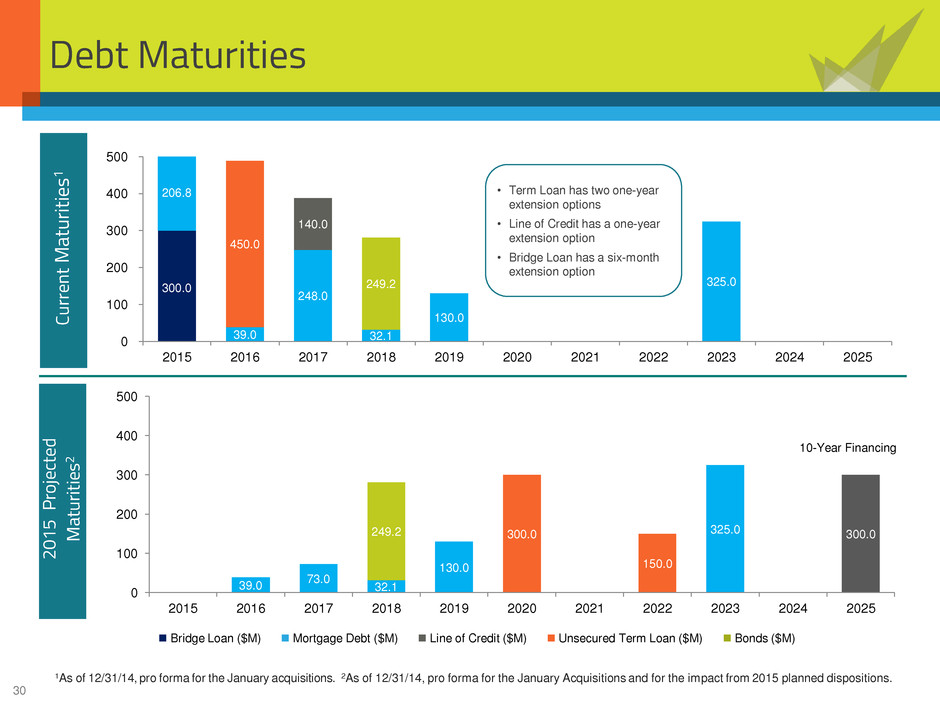
30 Debt Maturities 300.0 206.8 39.0 248.0 32.1 130.0 325.0 140.0 450.0 249.2 0 100 200 300 400 500 2015 2016 2017 2018 2019 2020 2021 2022 2023 2024 2025 1As of 12/31/14, pro forma for the January acquisitions. 2As of 12/31/14, pro forma for the January Acquisitions and for the impact from 2015 planned dispositions. • Term Loan has two one-year extension options • Line of Credit has a one-year extension option • Bridge Loan has a six-month extension option 39.0 73.0 32.1 130.0 325.0 300.0 150.0 249.2 300.0 0 100 200 300 400 500 2015 2016 2017 2018 2019 2020 2021 2022 2023 2024 2025 20 15 P ro je ct ed M at ur iti es 2 Cu rr en t M at ur iti es 1 Bridge Loan ($M) Mortgage Debt ($M) Line of Credit ($M) Unsecured Term Loan ($M) Bonds ($M) 10-Year Financing
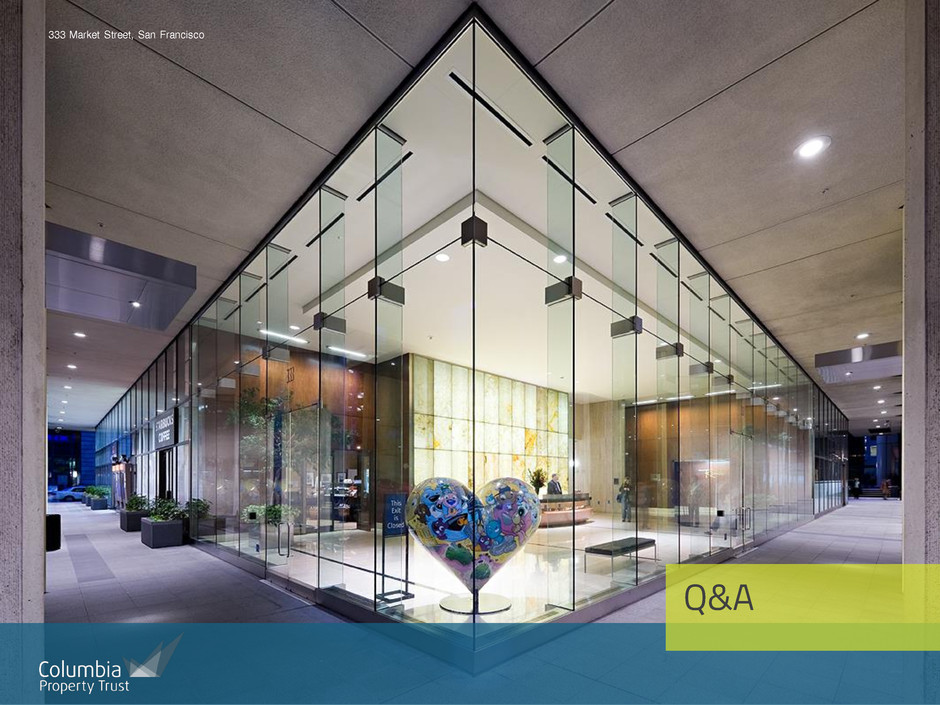
31 Q&A 333 Market Street, San Francisco
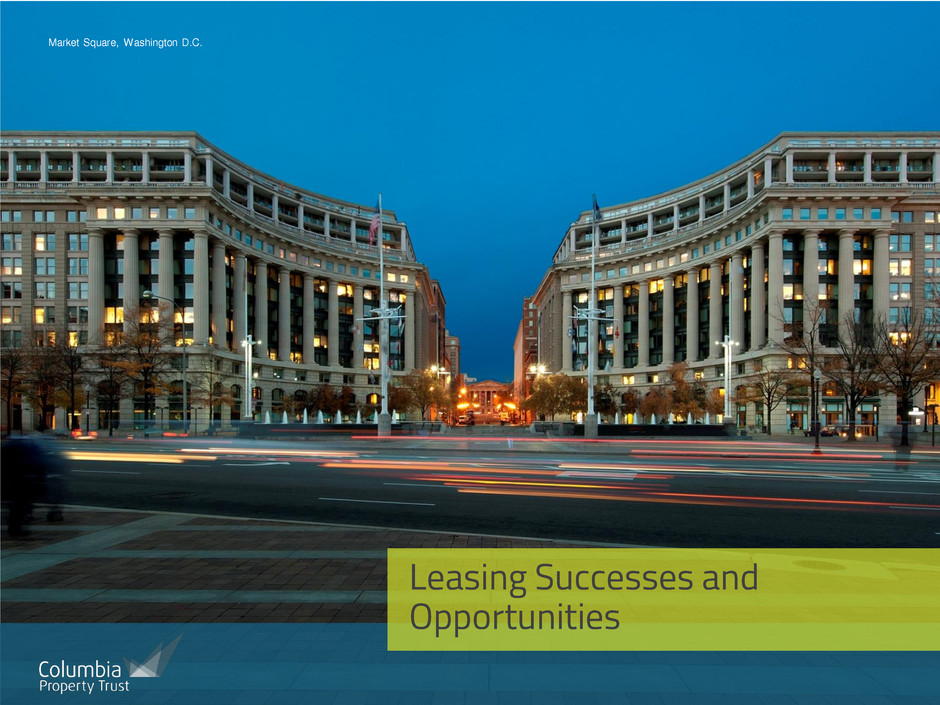
32 Leasing Successes and Opportunities Market Square, Washington D.C.
33 Proactive Operator • Leasing Accomplishments • Leasing Opportunities − Summary of 2015-2017 Major Expirations − 650 California Street, San Francisco − Market Square, Washington D.C. − 222 E. 41st Street, New York (Jones Day) − Other Major Expirations Leasing Overview
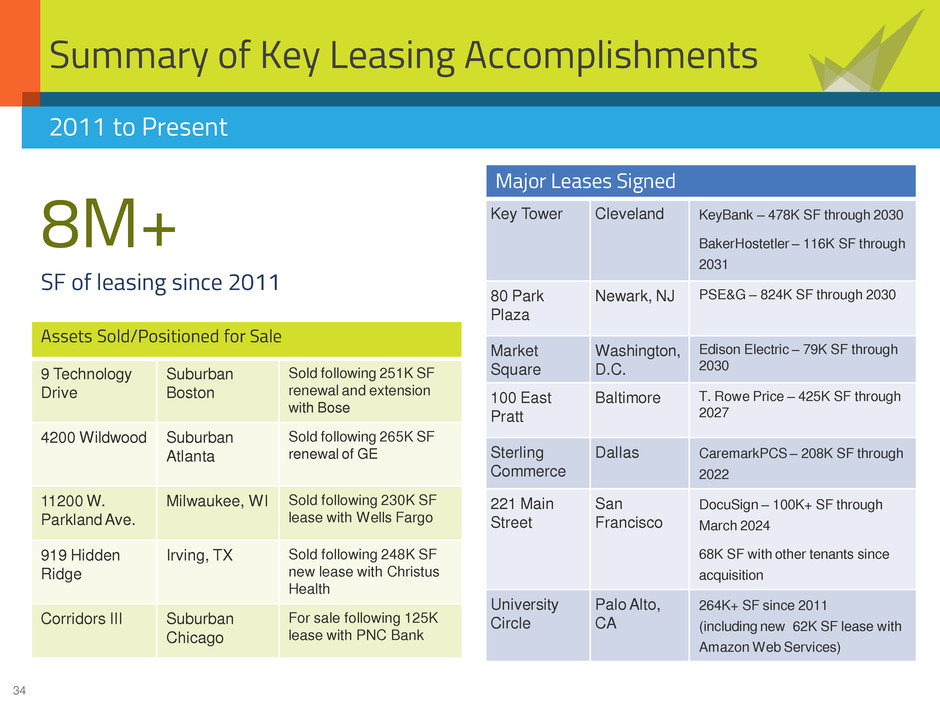
34 Summary of Key Leasing Accomplishments 2011 to Present 8M+ SF of leasing since 2011 Assets Sold/Positioned for Sale 9 Technology Drive Suburban Boston Sold following 251K SF renewal and extension with Bose 4200 Wildwood Suburban Atlanta Sold following 265K SF renewal of GE 11200 W. Parkland Ave. Milwaukee, WI Sold following 230K SF lease with Wells Fargo 919 Hidden Ridge Irving, TX Sold following 248K SF new lease with Christus Health Corridors III Suburban Chicago For sale following 125K lease with PNC Bank Major Leases Signed Key Tower Cleveland KeyBank – 478K SF through 2030 BakerHostetler – 116K SF through 2031 80 Park Plaza Newark, NJ PSE&G – 824K SF through 2030 Market Square Washington, D.C. Edison Electric – 79K SF through 2030 100 East Pratt Baltimore T. Rowe Price – 425K SF through 2027 Sterling Commerce Dallas CaremarkPCS – 208K SF through 2022 221 Main Street San Francisco DocuSign – 100K+ SF through March 2024 68K SF with other tenants since acquisition University Circle Palo Alto, CA 264K+ SF since 2011 (including new 62K SF lease with Amazon Web Services)
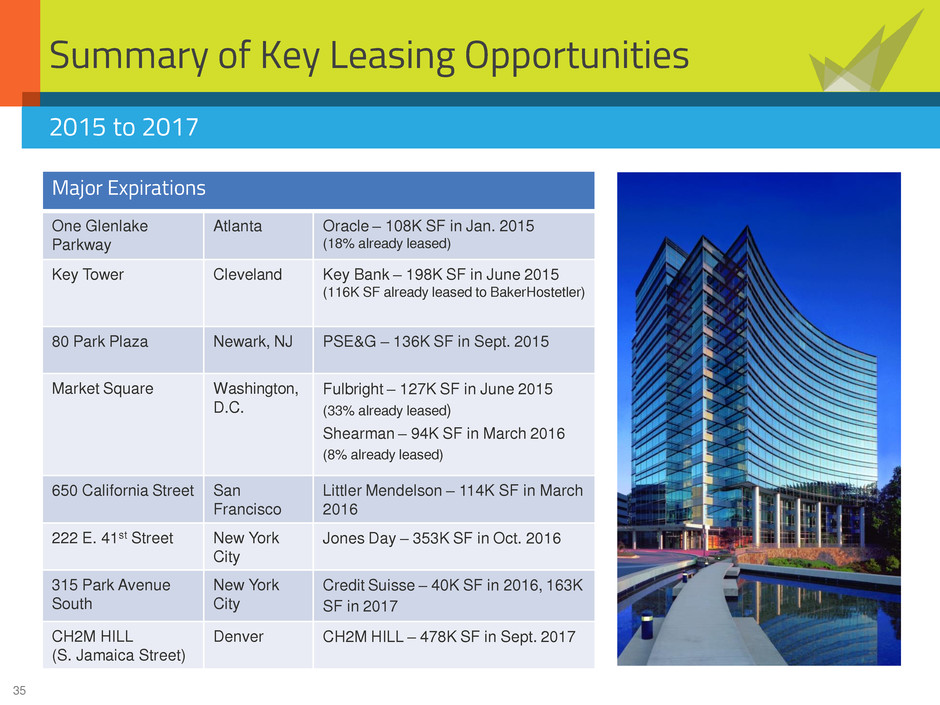
35 Summary of Key Leasing Opportunities Major Expirations One Glenlake Parkway Atlanta Oracle – 108K SF in Jan. 2015 (18% already leased) Key Tower Cleveland Key Bank – 198K SF in June 2015 (116K SF already leased to BakerHostetler) 80 Park Plaza Newark, NJ PSE&G – 136K SF in Sept. 2015 Market Square Washington, D.C. Fulbright – 127K SF in June 2015 (33% already leased) Shearman – 94K SF in March 2016 (8% already leased) 650 California Street San Francisco Littler Mendelson – 114K SF in March 2016 222 E. 41st Street New York City Jones Day – 353K SF in Oct. 2016 315 Park Avenue South New York City Credit Suisse – 40K SF in 2016, 163K SF in 2017 CH2M HILL (S. Jamaica Street) Denver CH2M HILL – 478K SF in Sept. 2017 2015 to 2017
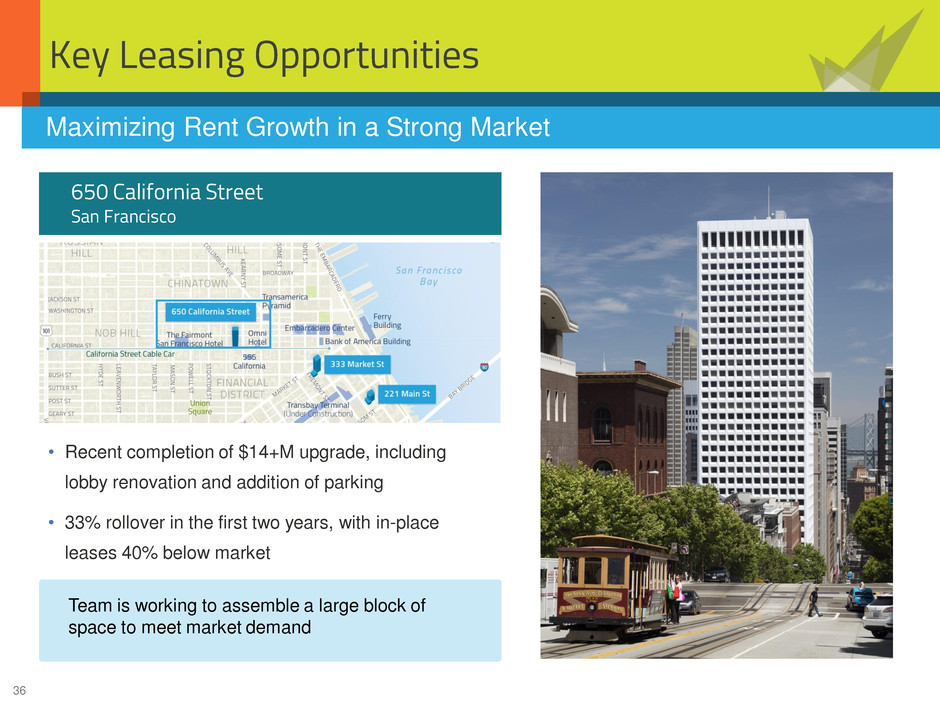
36 Key Leasing Opportunities • Recent completion of $14+M upgrade, including lobby renovation and addition of parking • 33% rollover in the first two years, with in-place leases 40% below market Maximizing Rent Growth in a Strong Market 650 California Street San Francisco Team is working to assemble a large block of space to meet market demand

37 Key Leasing Opportunities • Renewed and extended Edison Electric through 2030 (79K SF) • To date, have executed three leases back-filling over 20% of law firm space expiring in 2015 and 2016 Major Known Move-Outs Tenant Sq. Ft Expiration Back-Filled Fulbright & Jaworski 126,644 6/30/2015 33% Shearman & Sterling 92,884 3/31/2016 8% Proactively Leasing an Iconic Asset Market Square Washington, D.C.
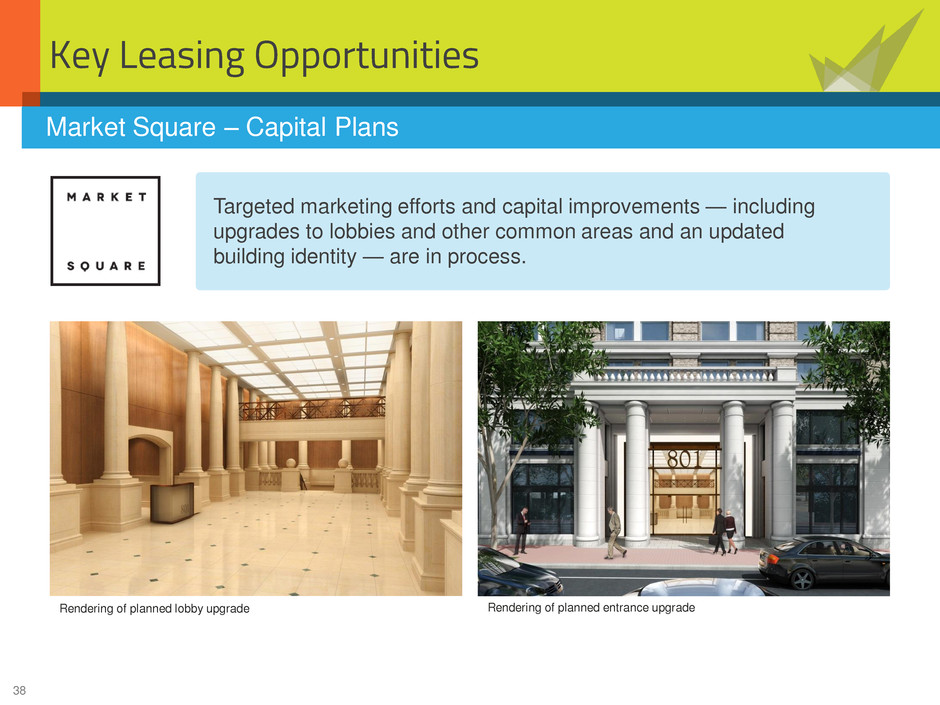
38 Key Leasing Opportunities Market Square – Capital Plans Targeted marketing efforts and capital improvements — including upgrades to lobbies and other common areas and an updated building identity — are in process. Rendering of planned lobby upgrade Rendering of planned entrance upgrade

39 Near-Term Leasing Opportunities One Glenlake Parkway Atlanta Oracle – 108K SF expired 1/2015 • Actively marketing Oracle’s space, with significant traffic • In Q4 2014, executed a lease with McDonald’s for 19K SF through 2022 Key Tower Cleveland KeyBank – 198K SF expiring 6/2015 • As part of renewal/extension, KeyBank gives back 198K SF in June 2015 • 116K SF of space already leased to BakerHostetler, beginning Jan. 2016 515 Post Oak Houston 51% leased with strong interest • Completed $8M renovation in 2012 to reposition property • In Q4 2014, executed new 10K SF lease with Randstad through 2020 CH2M HILL Headquarters Denver CH2M HILL – 478K SF expiring 9/2017 • Fully occupied by CH2M HILL as corporate headquarters • Discussing possible renewal and extension
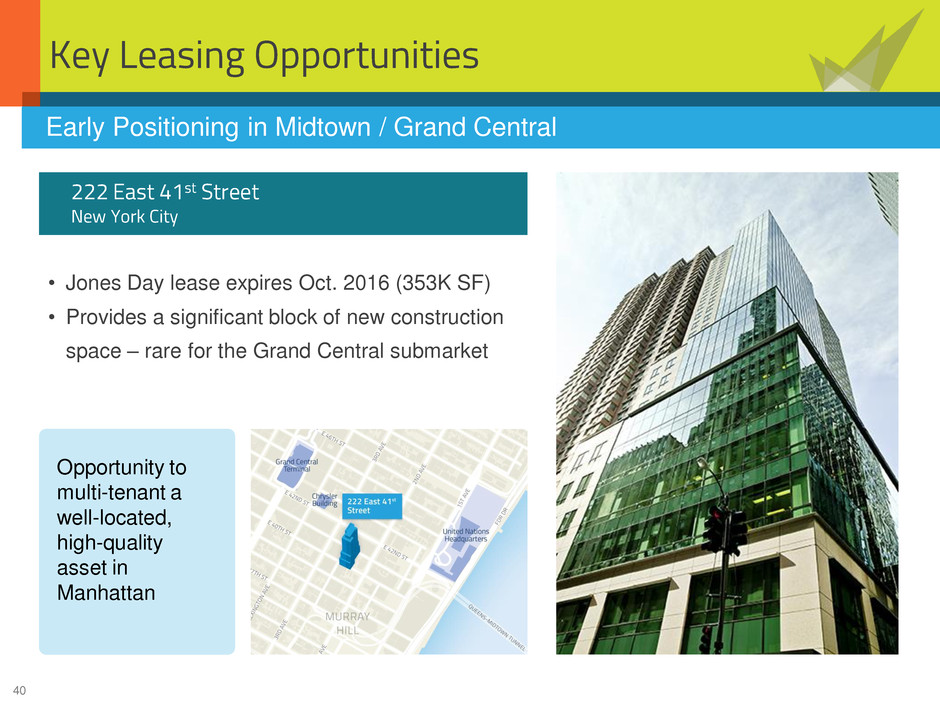
40 Key Leasing Opportunities • Jones Day lease expires Oct. 2016 (353K SF) • Provides a significant block of new construction space – rare for the Grand Central submarket Early Positioning in Midtown / Grand Central 222 East 41st Street New York City Opportunity to multi-tenant a well-located, high-quality asset in Manhattan

41 Already promoting soon-to-be- available space, with modest entrance, lobby and amenity upgrades, and a new marketing suite under construction Key Leasing Opportunities 222 East 41st Street – Capital Plans Staggered-size and virtually column-free floor plates offer multi-tenant flexibility Rendering of planned upgrades to lobby and entrance.
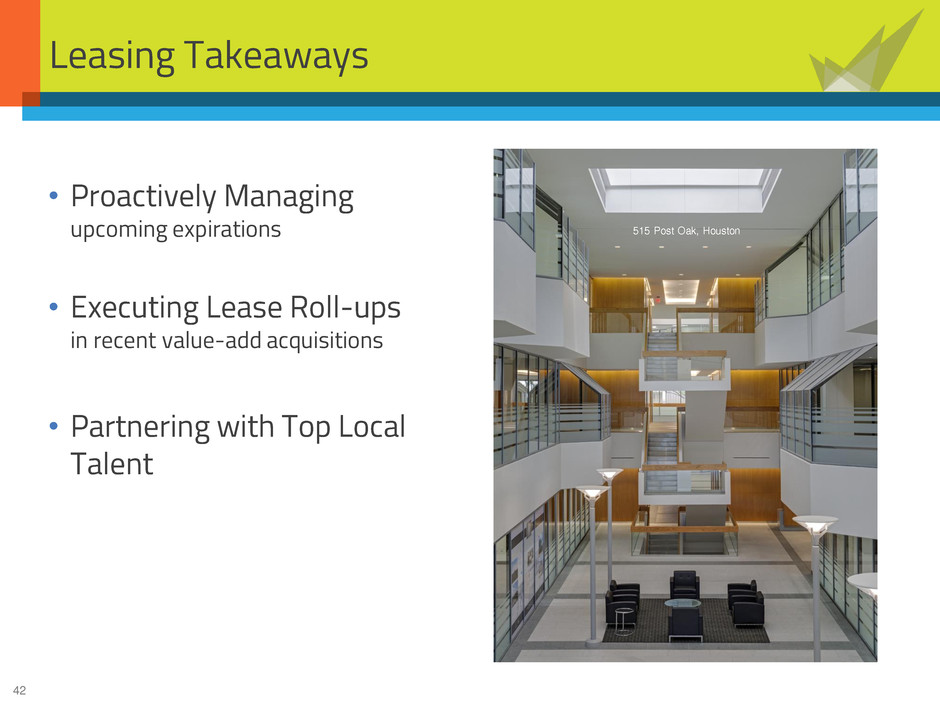
42 Leasing Takeaways • Proactively Managing upcoming expirations • Executing Lease Roll-ups in recent value-add acquisitions • Partnering with Top Local Talent 515 Post Oak, Houston
43 Q&A International Financial Tower, N. New Jersey
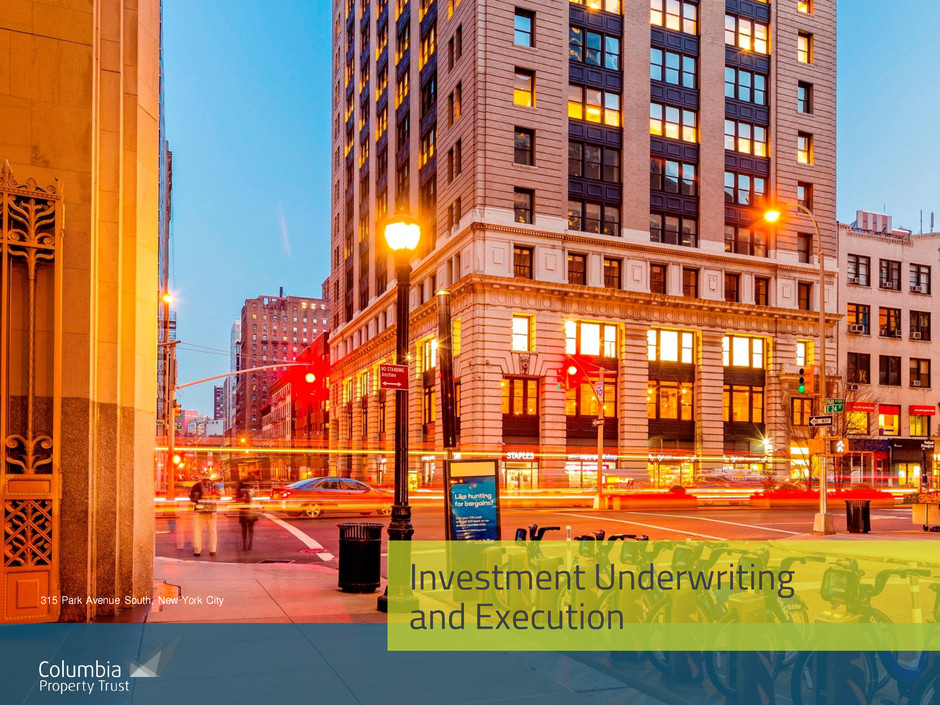
44 Investment Underwriting and Execution 315 Park Avenue South, New York City

45 Acquisition Strategy Overview • High-Barrier Gateway Markets Long-term demand growth and barriers to entry • CBD / Urban-Infill Submarkets Supply constraints, plus strong tenant and investor demand • Highly Competitive Assets Physical and locational attributes • Value-Add Near-term leasing and/or renovation opportunities • Goal: Deliver normalized yield profile 75-150 bps above core returns within 2 to 5 years 116 Huntington Avenue Target Investment Criteria
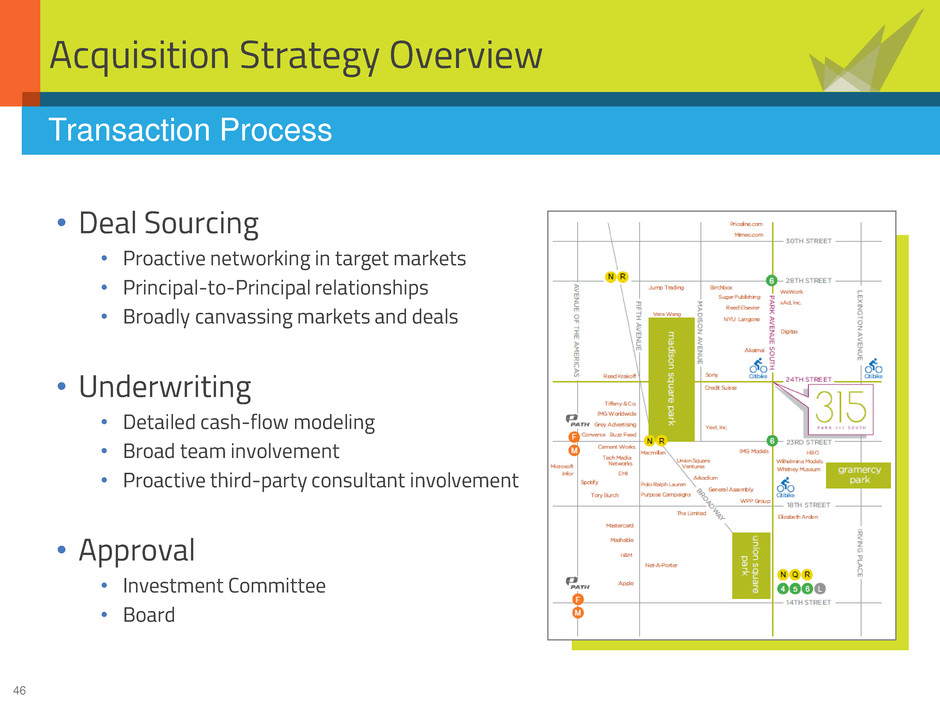
46 Acquisition Strategy Overview • Deal Sourcing • Proactive networking in target markets • Principal-to-Principal relationships • Broadly canvassing markets and deals • Underwriting • Detailed cash-flow modeling • Broad team involvement • Proactive third-party consultant involvement • Approval • Investment Committee • Board Transaction Process
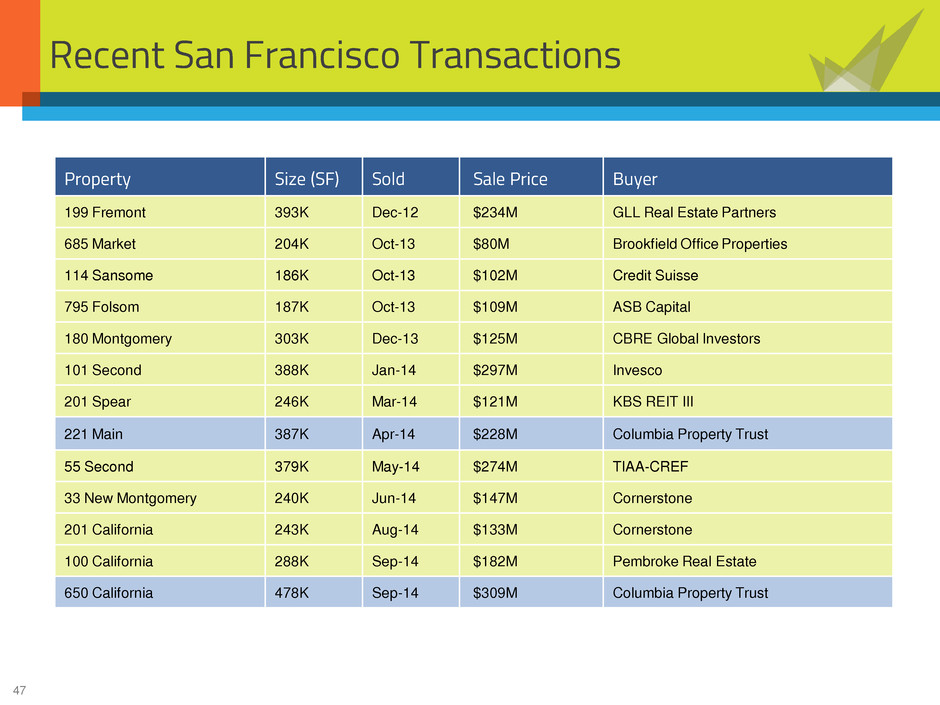
47 Recent San Francisco Transactions Property Size (SF) Sold Sale Price Buyer 199 Fremont 393K Dec-12 $234M GLL Real Estate Partners 685 Market 204K Oct-13 $80M Brookfield Office Properties 114 Sansome 186K Oct-13 $102M Credit Suisse 795 Folsom 187K Oct-13 $109M ASB Capital 180 Montgomery 303K Dec-13 $125M CBRE Global Investors 101 Second 388K Jan-14 $297M Invesco 201 Spear 246K Mar-14 $121M KBS REIT III 221 Main 387K Apr-14 $228M Columbia Property Trust 55 Second 379K May-14 $274M TIAA-CREF 33 New Montgomery 240K Jun-14 $147M Cornerstone 201 California 243K Aug-14 $133M Cornerstone 100 California 288K Sep-14 $182M Pembroke Real Estate 650 California 478K Sep-14 $309M Columbia Property Trust
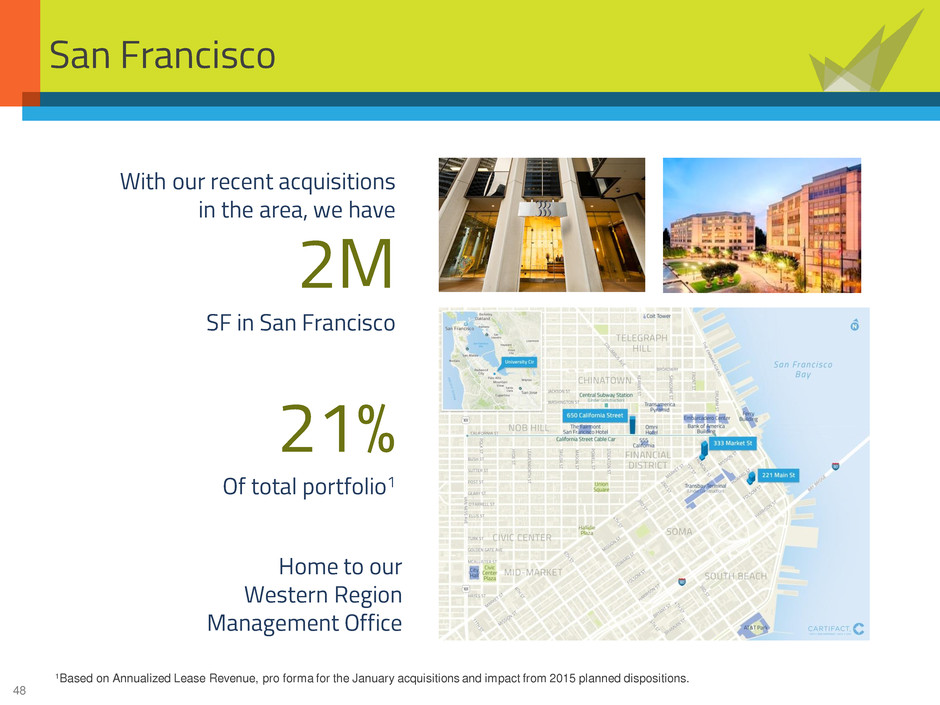
48 San Francisco 21% Of total portfolio1 With our recent acquisitions in the area, we have 2M SF in San Francisco Home to our Western Region Management Office 1Based on Annualized Lease Revenue, pro forma for the January acquisitions and impact from 2015 planned dispositions.
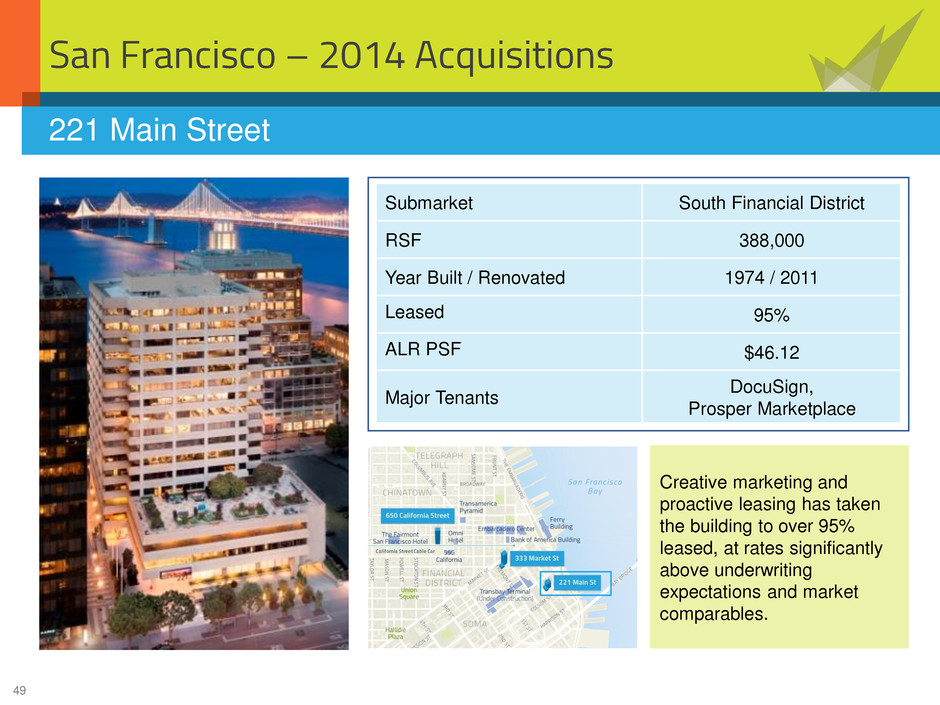
49 San Francisco – 2014 Acquisitions Submarket South Financial District RSF 388,000 Year Built / Renovated 1974 / 2011 Leased 95% ALR PSF $46.12 Major Tenants DocuSign, Prosper Marketplace 221 Main Street Creative marketing and proactive leasing has taken the building to over 95% leased, at rates significantly above underwriting expectations and market comparables. California Street Cable Car

50 San Francisco – 2014 Acquisitions 650 California Street Submarket North Financial District RSF 478,000 Year Built / Renovated 1964 / 2007 and 2013 Leased 88.5% ALR PSF $47.58 Major Tenants Littler Mendelson, Credit Suisse, Goodby Silverstein Our local team is working aggressively to maximize value from current vacancy and near-term roll-over. California Street Cable Car
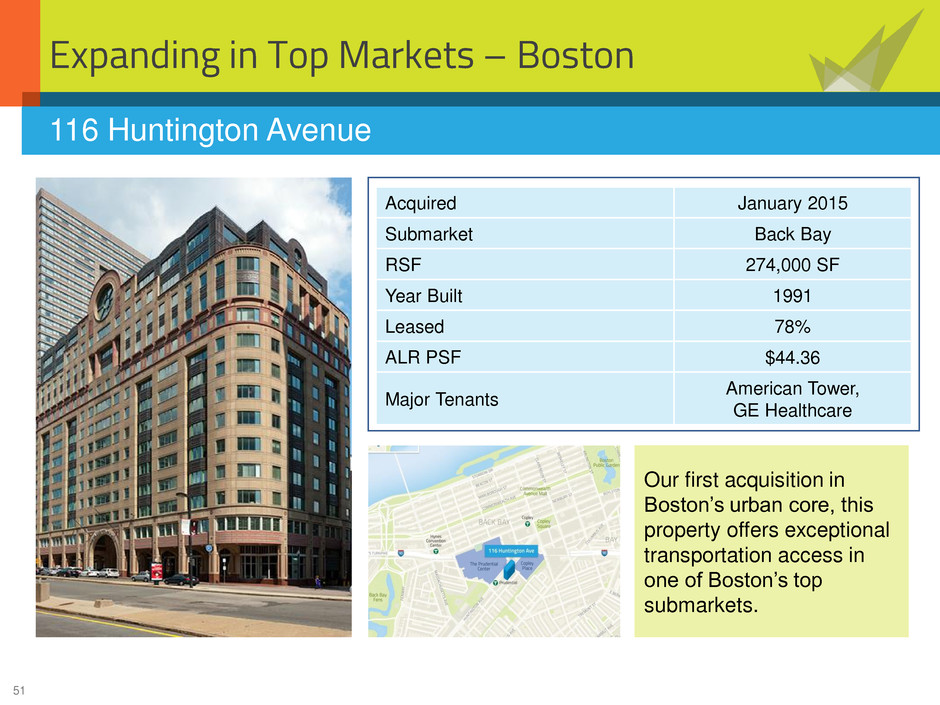
51 Expanding in Top Markets – Boston Acquired January 2015 Submarket Back Bay RSF 274,000 SF Year Built 1991 Leased 78% ALR PSF $44.36 Major Tenants American Tower, GE Healthcare 116 Huntington Avenue Our first acquisition in Boston’s urban core, this property offers exceptional transportation access in one of Boston’s top submarkets.
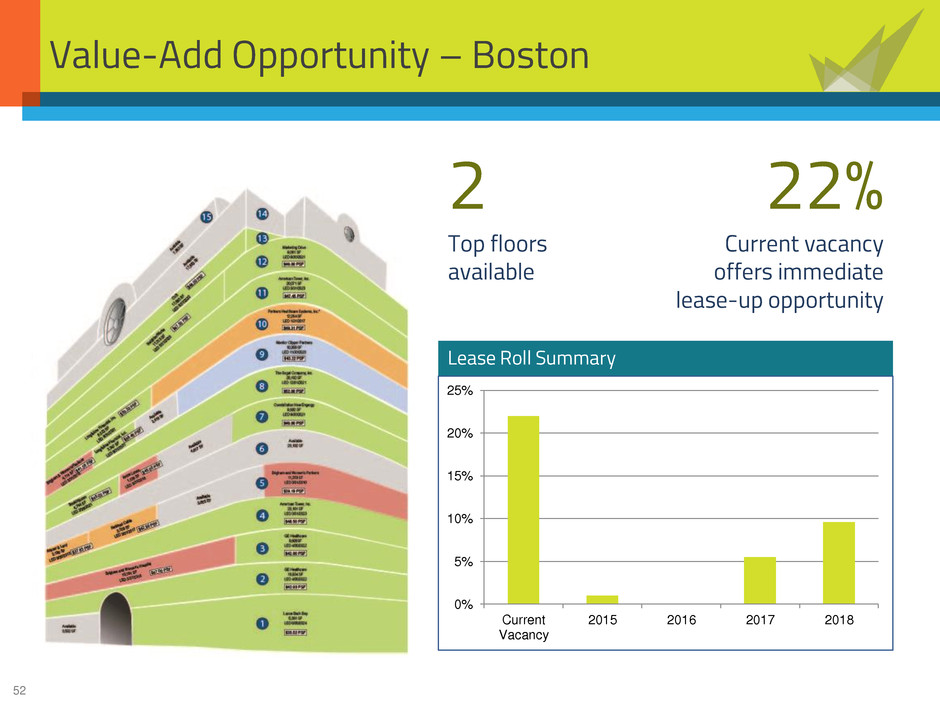
52 Value-Add Opportunity – Boston Lease Roll Summary 0% 5% 10% 15% 20% 25% Current Vacancy 2015 2016 2017 2018 22% Current vacancy offers immediate lease-up opportunity 2 Top floors available
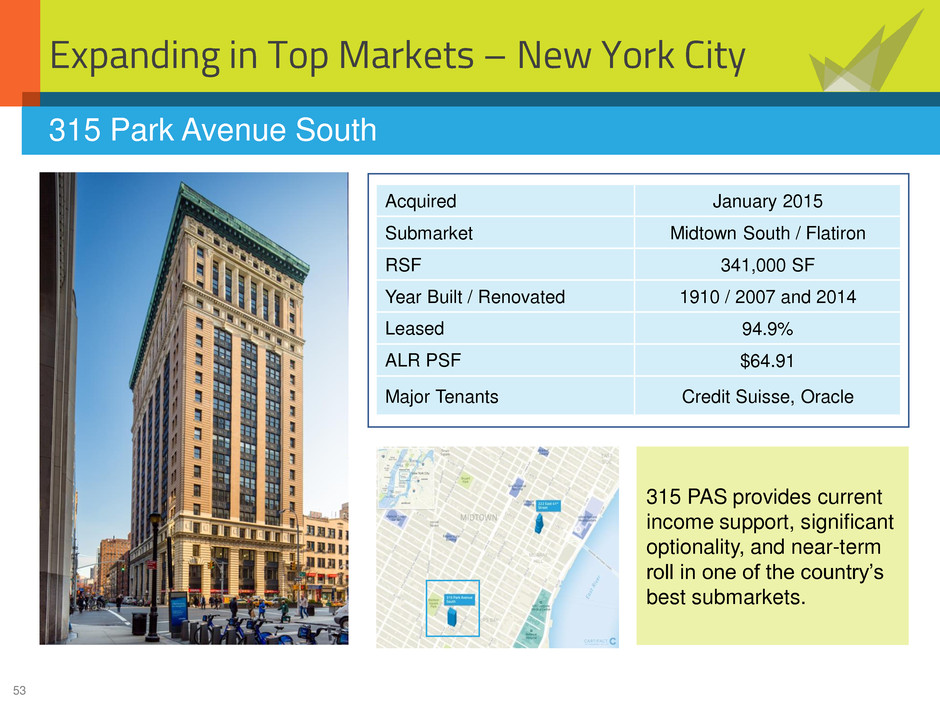
53 Expanding in Top Markets – New York City Acquired January 2015 Submarket Midtown South / Flatiron RSF 341,000 SF Year Built / Renovated 1910 / 2007 and 2014 Leased 94.9% ALR PSF $64.91 Major Tenants Credit Suisse, Oracle 315 Park Avenue South 315 PAS provides current income support, significant optionality, and near-term roll in one of the country’s best submarkets.
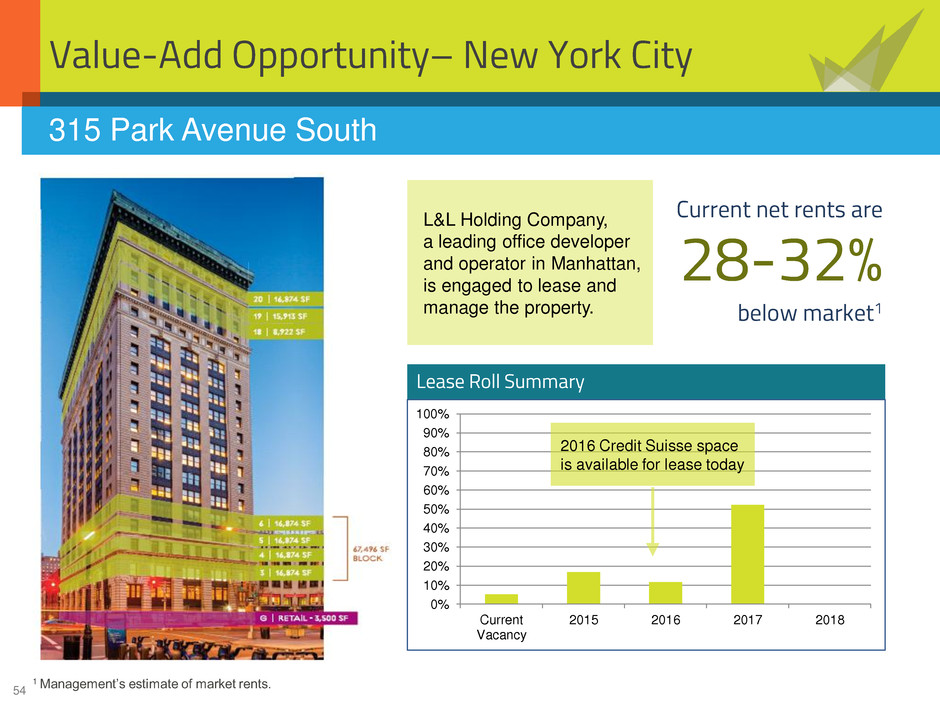
54 Value-Add Opportunity– New York City Lease Roll Summary 315 Park Avenue South 0% 10% 20% 30% 40% 50% 60% 70% 80% 90% 100% Current Vacancy 2015 2016 2017 2018 Current net rents are 28-32% below market1 1 Management’s estimate of market rents. 2016 Credit Suisse space is available for lease today L&L Holding Company, a leading office developer and operator in Manhattan, is engaged to lease and manage the property.
55 Investment Summary • Value-add • High-barrier markets • Regional platforms • Partnering with top local talent • Disciplined underwriting process

56 Q&A 650 California Street, San Francisco

57 For more information: Columbia Property Trust Investor Relations t 800.899.8411 e IR @ columbiapropertytrust.com 0017-CXPPRES1501 IC 116 Huntington Avenue, Boston


