Project Oak Tree
Presentation to the Special Committee of the Board

Thomas Weisel Partners
MERCHANT BANKING
Champions of Growth
April 4, 2006
Preamble
This presentation contains a summary of the analyses performed by Thomas Weisel Partners LLC (“TWP”) for the Special Committee of the Board of Directors of Oak Tree Incorporated (“Oak Tree”) for discussion of its proposed acquisition by Austin Ventures LP and its affiliated and related entities (“Austin Ventures”). In connection with performing such analyses, we reviewed certain relevant financial and operating data relating to Oak Tree made available to us from published sources and from the internal records of Oak Tree. We have not assumed any obligation to independently verify such information and have relied on it being accurate and complete in all material respects. The presentation is further subject to the limitations, qualifications and assumptions set forth in our form of opinion.
Our analysis is directed solely to Oak Tree’s Special Committee of the Board of Directors in connection with its consideration of Oak Tree’s discussions with Austin Ventures. Accordingly, this presentation may not be used or referred to by Oak Tree or quoted or disclosed to any person other than Oak Tree’s directors, executive officers and attorneys in any manner without our express written prior consent.
| Thomas Weisel Partners |
|
2
Introduction
TWP was engaged by Oak Tree in late June 2005 to explore potential strategic partners for the business
• TWP identified and contacted 18 strategic and 14 financial potential partners
Austin Ventures has submitted a proposal to acquire Oak Tree for $3.34 per share in an all cash transaction
• Represents a fully diluted equity value of $29.1 million
Overview of Oak Tree
• Provider of scalable infrastructure software for the wireless data market
• Component based product suite enables mobile operators to rapidly deploy flexible, open IP based network and data services
• Publicly traded on the NASDAQ (SVNX) and Toronto Stock Exchange (SVN)
• Customers include over 60 mobile operators including Vodafone, Telefonica
• Headquartered in Santa Barbara, CA; development offices in Toronto, Switzerland and India
• 110+ employees
Overview of Austin Ventures
• Over $3 billion under management across 9 funds
• Work with companies across every stage of the funding cycle – from initial seed investment to buyouts and recapitalizations
• Largest shareholder and creditor of Oak Tree
• Joe Aragona and Ben Scott are on the Board of Oak Tree
5
Process Summary
TWP and Oak Tree signed an engagement letter on June 28th, 2005
Oak Tree and TWP finalized an initial list of potential buyers after several iterative discussions and due diligence meetings
• Detailed discussion around rationale, approach, strategy and call script “tailored” for each buyer
Oak Tree pre-announced Q2-05 results on July 5th, 2005
• Stock fell 12%
• Given the weakness in the stock price and the impending summer slowdown, Oak Tree decided that it was not an appropriate time to initiate contact with potential buyers
Between August and October 2005, Oak Tree share price continued to drop
• Announced Q2 results on August 9th
• Announced termination of Sprint contract on September 30th
In October 2005, Austin Ventures verbally indicated that it may potentially be interested in submitting a proposal to acquire Oak Tree
• The Oak Tree Board formed a Special Committee to assess the M&A process
• The Special Committee instructed TWP to explore potential interest from other parties
6
TWP began contacting potential buyers in early November and continued the process through January 2006
• Initial list included 12 strategic and eight financial buyers
• List was expanded to include additional six strategic and six financial buyers
• Four strategic buyers were contacted on a “no names” basis for competitive reasons
• Austin Ventures and one additional buyer executed the NDA
• Oak Tree held management presentations with both signatories
Austin Ventures executed an NDA on November 2nd, 2005
• Oak Tree held a management presentation at Austin Ventures’ offices on November 7th, 2005
Austin Ventures submitted a preliminary written LOI on February 27th, 2006 with an intent to acquire Oak Tree for $3.07 per share
• Offer was 16% below closing price on February 27th
• The offer was publicly disclosed on February 27th
• TWP reinitiated contact with the initial buyer list along with three additional buyers
• One additional buyer executed an NDA and Oak Tree held a management presentation
On March 9th, 2006, Austin Ventures submitted a revised LOI, proposing to acquire Oak Tree for $3.34 per share
• Special committee of Oak Tree signed the revised LOI
• Limited exclusivity of four calendar weeks from date of signing
• Tentative signing of plan of arrangement and announcement anticipated on April 6th, 2006
7
Issues to Consider
• There are a number of factors to consider in evaluating Oak Tree’s current situation
Limited Cash Balance
• IMS strategy would need significant additional CapEx
• Additional financing, if possible, would be on significantly onerous terms
• Capital required for ongoing public company infrastructure costs including interest settlement on AV convert
Revenue Visibility
• Actual results for each of the last three quarters have been below management’s internal plan
• Preliminary Q1 2006 results appear to be below Board approved management plan
Competitive Concerns
• Oak Tree’s current scale creates structural competitive hurdles
• Recent loss of Sprint contract – 32% of total revenues in 2005
• Customer concentration issue – apart from Sprint, Oak Tree derives 37% of its revenue from Vodafone and Nokia
• Consolidation in the end market may exert further price pressure
Management Turnover
• VP of Sales, General Counsel and CFO have all turned over in the past few months
Lack of Visibility on Wall Street
• Limited Analyst coverage
• Extremely low institutional ownership
• Limited liquidity in the stock
• NASDAQ de-listing notice
9
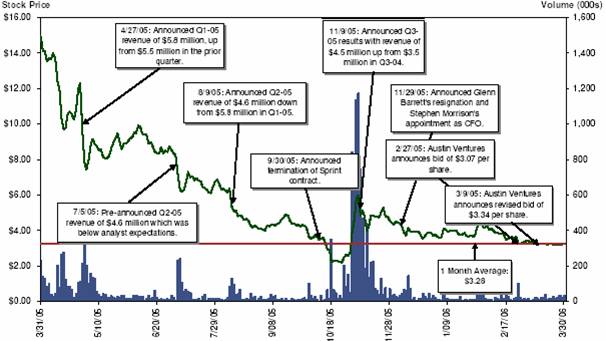
LTM Stock Price Performance
• Oak Tree’s stock has exhibited continuous weakness over the past twelve months
Trading Summary
Average |
| Current |
| 1 Month |
| 3 Months |
| 6 Months |
| 1 Year |
| |||||
Price |
| $ | 3.26 |
| $ | 3.28 |
| $ | 3.65 |
| $ | 3.78 |
| $ | 5.69 |
|
Volume (000s) (NASDAQ) |
| 10 |
| 19 |
| 22 |
| 30 |
| 65 |
| |||||
Volume (000s) (TSX) |
| 20 |
| 24 |
| 30 |
| 66 |
| 50 |
| |||||
Source: Factset Research Systems as of 3/31/06.
10
Wall Street Perspectives on Oak Tree
• Wall Street analysts support the revised offer by Austin Ventures after being initially negative
Oak Tree |
| |||||||||||||||||||||||||
Research |
| Revenues |
| EBITDA |
| GAAP EPS Estimates |
| |||||||||||||||||||
Bank |
| Analyst |
| Rating |
| Price Target |
| CY 06E |
| CY 07E |
| CY 06 |
| CY 07E |
| CY 06E |
| CY 07E |
| |||||||
Canaccord Adams |
| Misek |
| Tender |
| $ | 3.34 |
| $ | 15.5 |
| N.A. |
| N.A. |
| N.A. |
| N.A. |
| N.A. |
| |||||
Paradigm Capital |
| Richards |
| Neutral |
| 3.50 |
| 15.9 |
| 19.8 |
| (6.2 | ) | (3.0 | ) | (1.42 | ) | (0.78 | ) | |||||||
|
|
|
|
|
|
|
|
|
|
|
|
|
|
|
|
|
|
|
| |||||||
Mean |
|
|
|
|
|
|
| $ | 15.7 |
| $ | 19.8 |
| $ | (6.2 | ) | $ | (3.0 | ) | $ | (1.42 | ) | $ | (0.78 | ) | |
Median |
|
|
|
|
|
|
| $ | 15.7 |
| $ | 19.8 |
| $ | (6.2 | ) | $ | (3.0 | ) | $ | (1.42 | ) | $ | (0.78 | ) | |
|
|
|
|
|
|
|
|
|
|
|
|
|
|
|
|
|
|
|
| |||||||
Board Approved Management Plan (Stretch) |
| $ | 24.0 |
| N.A. |
| $ | 0.1 |
| N.A. |
| $ | (0.40 | ) | N.A. |
| ||||||||||
Board Approved Management Plan (High Probability) |
| $ | 18.1 |
| N.A. |
| $ | (4.1 | ) | N.A. |
| $ | (1.09 | ) | N.A. |
| ||||||||||
Canaccord Adams – 03/13/06 | “Austin Raises Offer” | Peter Misek |
• In our opinion, the latest Austin Ventures offer is an improvement that signifies Austin’s dedication to the deal, and the valuation is closer to current market valuations of the firm. The support for this transaction by Oak Tree’ Special Committee of independent directors indicates that the committee believes this is the best alternative for the firm at this time.
• With the increased offer price of US$3.34 being approximately 11% higher than our target price prior to the original offer, we recommend to shareholders to TENDER their holdings and institute a target price of US$3.34 based on this offer.
Paradigm Capital – 03/13/06 | “Oak Tree is Gone” | Barry Richards |
• Oak Tree announced that Austin Ventures had raised its bid from US$3.07 to US$3.34 and that the Board at Oak Tree had accepted the bid. The revised bid is a 9% increase but still falls below our $3.50 target price and below the pre-bid closing price US$3.64. Austin Ventures owns 10% of the stock outstanding, before converting its debenture, which increases that number to almost 40% of the stock. We believe AV needs about 50% of the votes from stock it doesn’t own and 66.7% of the total votes.
• Overall, we believe the bid is still low, but fully expect that AV will get the votes it needs to complete this transaction. Furthermore, we do not expect another bidder. We recommend that shareholders tender into this revised offer.
Canaccord Adams – 02/17/06 | “Revenue Concerns Persist” | Peter Misek |
• We remain concerned that Oak Tree’s top line, even excluding the Sprint contract loss, continues to decline. By our estimates, the company’s Q4 revenue (excluding Sprint) would have been relatively flat sequentially and down approximately 20% Y/Y. We believe that the likelihood of management being able to backfill the Sprint loss in a timely fashion is declining given the erosion in non-Sprint revenue we are seeing.
• We are maintaining our HOLD recommendation despite the weak Q4 results for three main reasons: Oak Tree is positioned in an attractive market that is poised for growth, the company has established relationships with large industry players like Vodafone, Ericsson and Nokia, and the company’s valuation at 1.4x EV/Sales is not overly excessive,
11
Historical Cash Balances | ($ in millions) |
• Oak Tree’s cash balance has continued to decrease since AV’s investment in June 2004
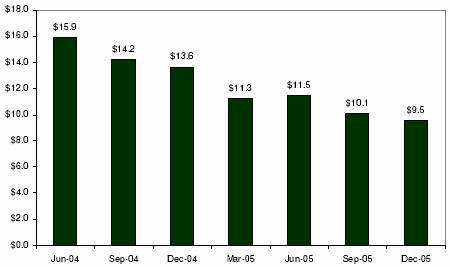
Source: Public Filings.
Note: Cash balances as of the end of quarter. Includes restricted cash.
12
Oak Tree Income Statement | ($ in millions, except per share data) |
|
| Wall Street |
| Management (Stretch) |
| Management (High Probability) |
| ||||||||||||||||||||||||||||||||
|
| FY05 |
| Mar-06 |
| Jun-06 |
| Sep-06 |
| Dec-06 |
| FY06 |
| FY07 |
| FY05 |
| Mar-06 |
| Jun-06 |
| Sep-06 |
| Dec-06 |
| FY06 |
| FY05 |
| Mar-06 |
| Jun-06 |
| Sep-06 |
| Dec-06 |
| FY06 |
|
|
|
|
|
|
|
|
|
|
|
|
|
|
|
|
|
|
|
|
|
|
|
|
|
|
|
|
|
|
|
|
|
|
|
|
|
|
|
|
|
Revenue |
| 18.3 |
| 3.7 |
| 3.9 |
| 4.0 |
| 4.4 |
| 15.9 |
| 19.8 |
| 18.3 |
| 4.0 |
| 5.5 |
| 6.5 |
| 8.0 |
| 24.0 |
| 18.3 |
| 3.9 |
| 3.9 |
| 4.7 |
| 5.6 |
| 18.1 |
|
% Y/Y growth |
| 21.2 | % | (37.1 | )% | (15.6 | )% | (10.3 | )% | 28.7 | % | (12.9 | )% | 24.2 | % | 21.2 | % | (31.0 | )% | 19.0 | % | 45.7 | % | 136.7 | % | 31.4 | % | 21.2 | % | (32.8 | )% | (15.6 | )% | 5.4 | % | 65.7 | % | (0.9 | )% |
|
|
|
|
|
|
|
|
|
|
|
|
|
|
|
|
|
|
|
|
|
|
|
|
|
|
|
|
|
|
|
|
|
|
|
|
|
|
|
|
Op. Ex. |
| 22.4 |
| 5.5 |
| 5.7 |
| 5.8 |
| 5.8 |
| 22.7 |
| 23.4 |
| 22.4 |
| 5.7 |
| 5.9 |
| 6.3 |
| 6.6 |
| 24.5 |
| 22.4 |
| 5.6 |
| 5.7 |
| 5.7 |
| 5.8 |
| 22.8 |
|
|
|
|
|
|
|
|
|
|
|
|
|
|
|
|
|
|
|
|
|
|
|
|
|
|
|
|
|
|
|
|
|
|
|
|
|
|
|
|
|
Op. Income |
| (4.2 | ) | (1.9 | ) | (1.8 | ) | (1.8 | ) | (1.5 | ) | (6.8 | ) | (3.6 | ) | (4.2 | ) | (1.7 | ) | (0.4 | ) | 0.2 |
| 1.4 |
| (0.5 | ) | (4.2 | ) | (1.7 | ) | (1.8 | ) | (1.0 | ) | (0.2 | ) | (4.7 | ) |
% of Revenue |
| (22.8 | )% | (50.7 | )% | (45.5 | )% | (43.8 | )% | (33.3 | )% | (42.9 | )% | (18.4 | )% | (22.8 | )% | (42.1 | )% | (7.4 | )% | 2.6 | % | 17.5 | % | (2.2 | )% | (22.8 | )% | (43.4 | )% | (45.3 | )% | (21.4 | )% | (3.5 | )% | (25.7 | )% |
|
|
|
|
|
|
|
|
|
|
|
|
|
|
|
|
|
|
|
|
|
|
|
|
|
|
|
|
|
|
|
|
|
|
|
|
|
|
|
|
Depreciation |
| 0.6 |
| 0.2 |
| 0.2 |
| 0.2 |
| 0.2 |
| 0.6 |
| 0.7 |
| 0.6 |
| 0.2 |
| 0.2 |
| 0.2 |
| 0.2 |
| 0.6 |
| 0.6 |
| 0.2 |
| 0.2 |
| 0.2 |
| 0.2 |
| 0.6 |
|
|
| 3.3 | % | 4.1 | % | 3.8 | % | 3.8 | % | 3.4 | % | 3.8 | % | 3.5 | % | 3.3 | % | 3.8 | % | 2.7 | % | 2.3 | % | 1.9 | % | 2.5 | % | 3.3 | % | 3.8 | % | 3.8 | % | 3.2 | % | 2.7 | % | 3.3 | % |
|
|
|
|
|
|
|
|
|
|
|
|
|
|
|
|
|
|
|
|
|
|
|
|
|
|
|
|
|
|
|
|
|
|
|
|
|
|
|
|
EBITDA |
| (3.6 | ) | (1.7 | ) | (1.6 | ) | (1.6 | ) | (1.3 | ) | (6.2 | ) | (3.0 | ) | (3.6 | ) | (1.5 | ) | (0.3 | ) | 0.3 |
| 1.6 |
| 0.1 |
| (3.6 | ) | (1.5 | ) | (1.6 | ) | (0.9 | ) | (0.0 | ) | (4.1 | ) |
|
| (19.6 | )% | (46.6 | )% | (41.7 | )% | (40.0 | )% | (29.9 | )% | (39.2 | )% | (14.9 | )% | (19.6 | )% | (38.4 | )% | (4.7 | )% | 4.9 | % | 19.4 | % | 0.3 | % | (19.6 | )% | (39.5 | )% | (41.5 | )% | (18.2 | )% | (0.8 | )% | (22.4 | )% |
|
|
|
|
|
|
|
|
|
|
|
|
|
|
|
|
|
|
|
|
|
|
|
|
|
|
|
|
|
|
|
|
|
|
|
|
|
|
|
|
Interest Expense |
| 0.3 |
| 0.2 |
| 0.2 |
| 0.2 |
| 0.2 |
| 0.8 |
| 0.2 |
| 0.3 |
| 0.2 |
| 0.2 |
| 0.2 |
| 0.2 |
| 0.8 |
| 0.3 |
| 0.2 |
| 0.2 |
| 0.2 |
| 0.2 |
| 0.9 |
|
|
|
|
|
|
|
|
|
|
|
|
|
|
|
|
|
|
|
|
|
|
|
|
|
|
|
|
|
|
|
|
|
|
|
|
|
|
|
|
|
Stock Comp/Other |
| 1.6 |
| 0.2 |
| 0.3 |
| 0.3 |
| 0.3 |
| 1.0 |
| 1.1 |
| 1.6 |
| 0.2 |
| 0.2 |
| 0.3 |
| 0.3 |
| 1.1 |
| 1.6 |
| 0.2 |
| 0.2 |
| 0.3 |
| 0.3 |
| 1.1 |
|
|
|
|
|
|
|
|
|
|
|
|
|
|
|
|
|
|
|
|
|
|
|
|
|
|
|
|
|
|
|
|
|
|
|
|
|
|
|
|
|
Pretax Income |
| (6.1 | ) | (2.3 | ) | (2.2 | ) | (2.2 | ) | (1.9 | ) | (8.6 | ) | (4.9 | ) | (4.5 | ) | (2.1 | ) | (0.9 | ) | (0.3 | ) | 0.9 |
| (2.4 | ) | (4.5 | ) | (2.1 | ) | (2.2 | ) | (1.5 | ) | (0.7 | ) | (6.6 | ) |
|
|
|
|
|
|
|
|
|
|
|
|
|
|
|
|
|
|
|
|
|
|
|
|
|
|
|
|
|
|
|
|
|
|
|
|
|
|
|
|
Income Tax |
| 0.0 |
| 0.0 |
| 0.0 |
| 0.0 |
| 0.0 |
| 0.0 |
| 0.0 |
| 0.0 |
| 0.0 |
| 0.0 |
| 0.0 |
| 0.0 |
| 0.0 |
| 0.0 |
| 0.0 |
| 0.0 |
| 0.0 |
| 0.0 |
| 0.0 |
|
|
|
|
|
|
|
|
|
|
|
|
|
|
|
|
|
|
|
|
|
|
|
|
|
|
|
|
|
|
|
|
|
|
|
|
|
|
|
|
|
GAAP Net Income |
| (6.1 | ) | (2.3 | ) | (2.2 | ) | (2.2 | ) | (1.9 | ) | (8.6 | ) | (4.9 | ) | (4.5 | ) | (2.1 | ) | (0.9 | ) | (0.3 | ) | 0.9 |
| (2.4 | ) | (4.5 | ) | (2.1 | ) | (2.2 | ) | (1.5 | ) | (0.7 | ) | (6.6 | ) |
|
|
|
|
|
|
|
|
|
|
|
|
|
|
|
|
|
|
|
|
|
|
|
|
|
|
|
|
|
|
|
|
|
|
|
|
|
|
|
|
Cash Net Income |
| (4.5 | ) | (2.1 | ) | (2.0 | ) | (2.0 | ) | (1.7 | ) | (7.6 | ) | (3.8 | ) | (3.0 | ) | (1.9 | ) | (0.6 | ) | (0.0 | ) | 1.2 |
| (1.3 | ) | (3.0 | ) | (1.9 | ) | (2.0 | ) | (1.2 | ) | (0.4 | ) | (5.6 | ) |
|
|
|
|
|
|
|
|
|
|
|
|
|
|
|
|
|
|
|
|
|
|
|
|
|
|
|
|
|
|
|
|
|
|
|
|
|
|
|
|
Shares Out (Basic) |
| 6.0 |
| 6.1 |
| 6.1 |
| 6.1 |
| 6.1 |
| 6.1 |
| 6.3 |
| 6.0 |
| 6.1 |
| 6.1 |
| 6.1 |
| 6.1 |
| 6.1 |
| 6.0 |
| 6.1 |
| 6.1 |
| 6.1 |
| 6.1 |
| 6.1 |
|
|
|
|
|
|
|
|
|
|
|
|
|
|
|
|
|
|
|
|
|
|
|
|
|
|
|
|
|
|
|
|
|
|
|
|
|
|
|
|
|
GAAP EPS |
| $ | (1.00 | ) | $ | (0.38 | ) | $ | (0.37 | ) | $ | (0.36 | ) | $ | (0.31 | ) | $ | (1.42 | ) | $ | (0.78 | ) | $ | (0.75 | ) | $ | (0.35 | ) | $ | (0.14 | ) | $ | (0.05 | ) | $ | 0.15 |
| $ | (0.40 | ) | $ | (0.75 | ) | $ | (0.35 | ) | $ | (0.37 | ) | $ | (0.25 | ) | $ | (0.12 | ) | $ | (1.09 | ) |
|
|
|
|
|
|
|
|
|
|
|
|
|
|
|
|
|
|
|
|
|
|
|
|
|
|
|
|
|
|
|
|
|
|
|
|
|
|
|
| |||||||||||||||||||
Cash EPS |
| $ | (0.75 | ) | $ | (0.34 | ) | $ | (0.33 | ) | $ | (0.32 | ) | $ | (0.27 | ) | $ | (1.25 | ) | $ | (0.61 | ) | $ | (0.49 | ) | $ | (0.31 | ) | $ | (0.10 | ) | $ | (0.01 | ) | $ | 0.19 |
| $ | (0.22 | ) | $ | (0.49 | ) | $ | (0.31 | ) | $ | (0.33 | ) | $ | (0.20 | ) | $ | (0.07 | ) | $ | (0.92 | ) |
Source: Oak Tree management and Paradigm Capital.
13
Projected Cash Flow | ($ in millions) |
• Oak Tree expects to utilize significant cash reserves to fund its growth initiatives
• Oak Tree will need additional financing in the near-term which may not be available at attractive terms
|
| Summary Cash Flow |
| |||||||||||||
|
| Plan |
| Plan |
| Plan |
| Plan |
| Plan |
| |||||
Stretch Plan |
| Q1 |
| Q2 |
| Q3 |
| Q4 |
| 2006 |
| |||||
|
|
|
|
|
|
|
|
|
|
|
| |||||
Forecasted Cash |
|
|
|
|
|
|
|
|
|
|
| |||||
Opening Balance |
| $ | 9.5 |
| $ | 6.9 |
| $ | 5.4 |
| $ | 4.7 |
| $ | 9.5 |
|
EBITDA |
| (1.5 | ) | (0.3 | ) | 0.3 |
| 1.6 |
| 0.1 |
| |||||
Capital |
| (0.1 | ) | (0.2 | ) | (0.1 | ) | (0.2 | ) | (0.6 | ) | |||||
Interest * |
| — |
| — |
| — |
| — |
| — |
| |||||
Working Capital Items |
| (1.0 | ) | (1.0 | ) | (0.9 | ) | (0.8 | ) | (3.7 | ) | |||||
|
|
|
|
|
|
|
|
|
|
|
| |||||
Ending Balance |
| $ | 6.9 |
| $ | 5.4 |
| $ | 4.7 |
| $ | 5.3 |
| $ | 5.3 |
|
* assumes paid in shares
|
| Summary Cash Flow |
| |||||||||||||
|
| Plan |
| Plan |
| Plan |
| Plan |
| Plan |
| |||||
High Probability Plan |
| Q1 |
| Q2 |
| Q3 |
| Q4 |
| 2006 |
| |||||
|
|
|
|
|
|
|
|
|
|
|
| |||||
Forecasted Cash |
|
|
|
|
|
|
|
|
|
|
| |||||
Opening Balance |
| $ | 9.5 |
| $ | 6.8 |
| $ | 5.0 |
| $ | 3.6 |
| $ | 9.5 |
|
EBITDA |
| (1.5 | ) | (1.6 | ) | (0.9 | ) | (0.0 | ) | (4.1 | ) | |||||
Capital |
| (0.1 | ) | (0.2 | ) | (0.1 | ) | (0.2 | ) | (0.6 | ) | |||||
Interest * |
| — |
| — |
| — |
| — |
| — |
| |||||
Working Capital Items |
| (1.0 | ) | — |
| (0.5 | ) | (0.5 | ) | (2.0 | ) | |||||
|
|
|
|
|
|
|
|
|
|
|
| |||||
Ending Balance |
| $ | 6.8 |
| $ | 5.0 |
| $ | 3.6 |
| $ | 2.8 |
| $ | 2.8 |
|
* assumes paid in shares
Source: Oak Tree management.
14
Valuation Summary | ($ in millions, except per share data) |
• The proposed offer price implies a fully diluted value of $29.1 million
|
|
|
| At Market |
| At Transaction |
| |||
Share Price |
|
|
| $ | 3.26 | (6) | $ | 3.34 |
| |
% below 52 Week High |
|
|
| 80 | % | 79 | % | |||
% above 52 Week Low |
|
|
| 56 | % | 60 | % | |||
Premium / (Discount) to Market |
|
|
|
|
| 2.5 | % | |||
Value |
|
|
|
|
|
|
| |||
Equity Value (Including options based on treasury stock and AV converts) |
|
|
| $ | 28.3 |
| $ | 29.1 |
| |
|
|
|
|
|
|
|
| |||
Plus: Total Debt (2) |
|
|
| 0.0 |
| 0.0 |
| |||
Less: Cash & Equivalents (3) |
|
|
| 4.7 |
| 4.7 |
| |||
|
|
|
|
|
|
|
| |||
Enterprise Value (4) |
|
|
| $ | 23.6 |
| $ | 24.4 |
| |
|
|
|
|
|
|
|
| |||
|
| Metric |
|
|
|
|
| |||
Multiples |
|
|
|
|
|
|
| |||
Enterprise Value / Revenues |
|
|
|
|
|
|
| |||
LTM (12/31/05) |
| $ | 18.3 |
| 1.3 | x | 1.3 | x | ||
CY 2006 E (5) |
| 15.7 |
| 1.5 | x | 1.6 | x | |||
CY 2006 E (7) |
| 18.1 |
| 1.3 | x | 1.3 | x | |||
CY 2006 E (8) |
| 24.0 |
| 1.0 | x | 1.0 | x | |||
|
|
|
|
|
|
|
| |||
|
| Metric |
|
|
|
|
| |||
Price / Earnings (5) |
|
|
|
|
|
|
| |||
CY 2006 E |
| $ | (0.94 | ) | N.M. |
| N.M. |
| ||
|
|
|
|
|
|
|
| |||
Premiums / Discounts |
|
|
|
|
|
|
| |||
% D from Average Stock Price |
|
|
|
|
|
|
| |||
1 Week |
| $ | 3.24 |
| 0.7 | % | 3.2 | % | ||
2 Weeks |
| 3.24 |
| 0.8 | % | 3.2 | % | |||
3 Weeks |
| 3.24 |
| 0.5 | % | 2.9 | % | |||
Since Q4 Earnings Announcement (Feb 17th) |
| 3.34 |
| (2.4 | )% | (0.0 | )% | |||
Feb 17th to Feb 27th (AV Announcement) |
| 3.58 |
| (9.0 | )% | (6.8 | )% | |||
1 Month |
| 3.28 |
| (0.5 | )% | 2.0 | % | |||
3 Months |
| 3.65 |
| (10.7 | )% | (8.5 | )% | |||
6 Months |
| 3.78 |
| (13.7 | )% | (11.6 | )% | |||
|
|
|
|
|
|
|
| |||
Equity Value Not Owned by AV and affiliates (excluding out of the money options and AV converts) |
| $ | 18.0 |
| $ | 18.5 |
| |||
(1) Diluted shares outstanding calculated using the treasury stock method for options and including converts from management dated 12/31/05.
(2) Debt consists of short and long term debt. In the money converts treated as equity.
(3) Assumes cash of $4.7 million based on Oak Tree Stretch Plan cash balance at breakeven in Q3-06 and full conversion of AV debt.
(4) Enterprise value equals equity value plus total debt net of cash and equivalents.
(5) First Call consensus estimates.
(6) Current stock price as of 3/31/2006.
(7) Management estimate (High Probability Plan).
(8) Management estimate (Stretch Plan).
16
Overview of Assumptions
• We have analyzed a number of quantitative methodologies that we deem relevant for this transaction
Selected public companies analysis
• Analysis of market valuations for relevant peer group of communications software companies
• Review of historical and projected trading multiples
• Multiples applied to Oak Tree’s projected operating results to determine the implied values and price per share
Selected transactions analysis
• Analysis of pricing of relevant software transactions between $10 million and $50 million in value since January 2005
• Review of historical and projected revenue multiples paid in precedent transactions
• Multiples applied to Oak Tree historical and projected revenue projections to determine implied values and price per share
Premiums paid analysis
• Analysis of premiums paid in technology “going private” transactions since January 2002
• Apply relevant price premiums to Oak Tree’s stock price to determine implied values
General Assumptions
• Net debt based on management projected net debt to reach break-even in Q3 2006
• Assumes no taxes
17
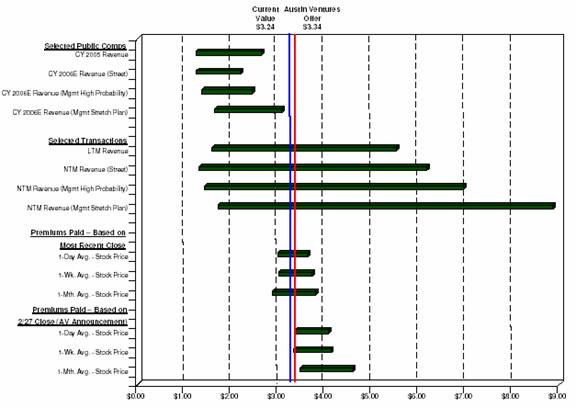
Summary Valuation
18
Valuation Detail |
| ($ in millions, except per share data) |
|
| Oak Tree |
| Valuation Multiples |
| Implied Agg. Value |
| Implied Eq. Value (3) |
| Implied Price Per Share |
| ||||||||||||||||
|
| Estimates |
| Low |
| - | Median |
| Low | - | High |
| Low | - | High |
| Low | - | High |
| |||||||
Selected Public Companies |
|
|
|
|
|
|
|
|
|
|
|
|
|
|
|
|
|
|
|
| |||||||
|
|
|
|
|
|
|
|
|
|
|
|
|
|
|
|
|
|
|
|
|
|
|
|
|
|
|
|
CY 2005 Revenue(1) |
| $ | 18.3 |
| 0.3 | x | - | 1.1 | x | $ | 6 | - | $ | 20 |
| $ | 10 | - | $ | 24 |
| $ | 1.18 | - | $ | 2.80 |
|
CY 2006E Revenue (Street) (2) |
| 15.7 |
| 0.4 | x | - | 1.0 | x | 6 | - | 16 |
| 10 | - | 20 |
| 1.19 | - | 2.33 |
| |||||||
|
|
|
|
|
|
|
|
|
|
|
|
|
|
|
|
|
|
|
|
| |||||||
CY 2006E Revenue (Mgmt High Probability) |
| $ | 18.1 |
| 0.4 | x | - | 1.0 | x | $ | 7 | - | $ | 18 |
| $ | 11 | - | $ | 23 |
| $ | 1.29 | - | $ | 2.61 |
|
CY 2006E Revenue (Mgmt Stretch Plan) |
| 24.0 |
| 0.4 | x | - | 1.0 | x | 9 | - | 24 |
| 13 | - | 28 |
| 1.54 | - | 3.28 |
| |||||||
|
|
|
|
|
|
|
|
|
|
|
|
|
|
|
|
|
|
|
|
| |||||||
Selected Transactions |
|
|
|
|
|
|
|
|
|
|
|
|
|
|
|
|
|
|
|
| |||||||
|
|
|
|
|
|
|
|
|
|
|
|
|
|
|
|
|
|
|
|
| |||||||
LTM Revenue (1) |
| $ | 18.3 |
| 0.5 | x | - | 2.4 | x | $ | 9 | - | $ | 45 |
| $ | 14 | - | $ | 49 |
| $ | 1.59 | - | $ | 5.52 |
|
|
|
|
|
|
|
|
|
|
|
|
|
|
|
|
|
|
|
|
|
|
|
|
|
|
|
|
|
NTM Revenue (Street) (2) |
| $ | 15.7 |
| 0.4 | x | - | 3.3 | x | $ | 7 | - | $ | 51 |
| $ | 11 | - | $ | 56 |
| $ | 1.31 | - | $ | 6.18 |
|
NTM Revenue (Mgmt High Probability) |
| 18.1 |
| 0.4 | x | - | 3.3 | x | 8 | - | 59 |
| 12 | - | 64 |
| 1.43 | - | 6.96 |
| |||||||
NTM Revenue (Mgmt Stretch Plan) |
| 24.0 |
| 0.4 | x |
| 3.3 | x | 10 |
| 78 |
| 15 |
| 83 |
| 1.72 | - | 8.87 |
| |||||||
|
|
|
|
|
|
|
|
|
|
|
|
|
|
|
|
|
|
|
|
| |||||||
Premiums Paid - Based on Latest Close |
|
|
|
|
|
|
|
|
|
|
|
|
|
|
|
|
|
|
|
| |||||||
|
|
|
|
|
|
|
|
|
|
|
|
|
|
|
|
|
|
|
|
| |||||||
One Day Average – Stock Price |
| $ | 3.26 |
| (7.6 | )% | - | 11.9 | % | $ | 21 | - | $ | 27 |
| $ | 26 | - | $ | 32 |
| $ | 3.01 | - | $ | 3.65 |
|
One Week Average – Stock Price |
| 3.24 |
| (7.4 | )% | - | 14.6 | % | 21 | - | 28 |
| 26 | - | 33 |
| 2.99 | - | 3.71 |
| |||||||
One Month Average – Stock Price |
| 3.65 |
| (11.7 | )% | - | 16.8 | % | 23 | - | 33 |
| 28 | - | 37 |
| 3.22 | - | 4.27 |
| |||||||
|
|
|
|
|
|
|
|
|
|
|
|
|
|
|
|
|
|
|
|
| |||||||
Premiums Paid - Based on 2/27 Close (AV Announcement) |
|
|
|
|
|
|
|
|
|
|
|
|
|
|
|
|
|
|
|
| |||||||
|
|
|
|
|
|
|
|
|
|
|
|
|
|
|
|
|
|
|
|
| |||||||
One Day Average – Stock Price |
| $ | 3.59 |
| (7.6 | )% | - | 11.9 | % | $ | 24 | - | $ | 30 |
| $ | 29 | - | $ | 35 |
| $ | 3.32 | - | $ | 4.02 |
|
One Week Average – Stock Price |
| 3.57 |
| (7.4 | )% | - | 14.6 | % | 24 | - | 31 |
| 29 | - | 36 |
| 3.31 | - | 4.09 |
| |||||||
One Month Average – Stock Price |
| 3.93 |
| (11.7 | )% | - | 16.8 | % | 26 | - | 36 |
| 30 | - | 41 |
| 3.47 | - | 4.60 |
| |||||||
|
|
|
|
|
|
|
|
|
|
|
|
|
|
|
|
|
|
|
|
| |||||||
Average Range |
|
|
|
|
|
|
|
| $ | 14 |
| $ | 35 |
| $ | 19 |
| $ | 40 |
| $ | 2.19 |
| $ | 4.49 |
| |
Note: Ranges based on low to median multiples. LTM period equals 12-months ended 12/31/05; NTM period, 12-months ended 12/31/06.
(1) Actual through 12/31/05.
(2) Source: Based on First Call consensus estimates as of 4/2/06.
(3) Assumes Oak Tree net debt of ($4.7) million based on Oak Tree Stretch Plan cash balance at breakeven in Q3-06 and full conversion of AV debt.
19
Comparable Companies Analysis |
| ($ in millions, except per share data) |
|
|
|
|
|
|
|
|
|
|
|
|
|
|
|
|
|
|
|
|
|
|
|
|
|
|
|
|
|
|
|
|
|
|
|
|
|
|
|
| Stock Price |
| Market Value |
| Rev. Growth |
| CY06 Margins |
| Valuation Multiples |
| ||||||||||||||||||||||||||
|
| Price |
| Above |
| Below |
| Equity |
| Net |
| Agg |
| Revenue |
| P/E |
| ||||||||||||||||||||
Company |
| 3/31/06 |
| Low |
| High |
| Value |
| Debt |
| Value |
| CY 06 |
| CY 07 |
| Gross |
| EBIT |
| CY 05 |
| CY 06 |
| CY 07 |
| CY 05 |
| CY 06 |
| CY 07 |
| ||||
|
|
|
|
|
|
|
|
|
|
|
|
|
|
|
|
|
|
|
|
|
|
|
|
|
|
|
|
|
|
|
|
|
| ||||
ACE*COMM |
| $ | 2.77 |
| 40 | % | 25 | % | $ | 50 |
| $ | 2 |
| $ | 52 |
| N.A. |
| N.A. |
| N.A. |
| N.A. |
| 2.2 | x | N.A. |
| N.A. |
| N.M. |
| N.A. |
| N.A. |
|
AsiaInfo |
| 5.00 |
| 42 | % | 19 | % | 231 |
| (149 | ) | 82 |
| N.A. |
| N.A. |
| N.A. |
| N.A. |
| 0.9 | x | N.A. |
| N.A. |
| N.M. |
| N.A. |
| N.A. |
| ||||
Boston Communications |
| 2.65 |
| 205 | % | 64 | % | 48 |
| (17 | ) | 32 |
| (16 | )% | N.A. |
| N.A. |
| N.A. |
| 0.3 | x | 0.4 | x | N.A. |
| N.M. |
| N.M. |
| N.A. |
| ||||
CallWave |
| 4.46 |
| 21 | % | 31 | % | 97 |
| (62 | ) | 35 |
| (19 | )% | N.A. |
| 59 | % | (13 | )% | 0.8 | x | 1.0 | x | N.A. |
| 24.8 | x | N.M. |
| N.A. |
| ||||
MetaSolv Software |
| 3.06 |
| 75 | % | 13 | % | 157 |
| (58 | ) | 99 |
| 9 | % | 11 | % | 57 | % | 5 | % | 1.1 | x | 1.0 | x | 0.9 | x | N.M. |
| 25.5 | x | 19.1 | x | ||||
NMS Communications |
| 3.75 |
| 49 | % | 14 | % | 200 |
| (62 | ) | 138 |
| 12 | % | 14 | % | 62 | % | 6 | % | 1.3 | x | 1.1 | x | 1.0 | x | 37.5 | x | 28.8 | x | 17.9 | x | ||||
TeleCommunication Systems |
| 2.56 |
| 33 | % | 20 | % | 102 |
| 7 |
| 109 |
| 9 | % | 12 | % | 43 | % | 1 | % | 1.1 | x | 1.0 | x | 0.9 | x | N.M. |
| 10.2 | x | 15.1 | x | ||||
|
|
|
|
|
|
|
|
|
|
|
|
|
|
|
|
|
|
|
|
|
|
|
|
|
|
|
|
|
|
|
|
|
| ||||
High |
|
|
| 205 | % | 64 | % |
|
|
|
|
|
| 12 | % | 14 | % | 62 | % | 6 | % | 2.2 | x | 1.1 | x | 1.0 | x | 37.5 | x | 28.8 | x | 19.1 | x | ||||
Overall 3rd Quartile |
|
|
| 62 | % | 28 | % |
|
|
|
|
|
| 9 | % | 13 | % | 60 | % | 6 | % | 1.2 | x | 1.0 | x | 0.9 | x | 34.3 | x | 27.2 | x | 18.5 | x | ||||
Overall Mean |
|
|
| 66 | % | 27 | % |
|
|
|
|
|
| (1 | )% | 12 | % | 55 | % | (0 | )% | 1.1 | x | 0.9 | x | 0.9 | x | 31.1 | x | 21.5 | x | 17.3 | x | ||||
Overall Median |
|
|
| 42 | % | 20 | % |
|
|
|
|
|
| 9 | % | 12 | % | 58 | % | 3 | % | 1.1 | x | 1.0 | x | 0.9 | x | 31.1 | x | 25.5 | x | 17.9 | x | ||||
Overall 1st Quartile |
|
|
| 37 | % | 17 | % |
|
|
|
|
|
| (16 | )% | 11 | % | 54 | % | (3 | )% | 0.8 | x | 1.0 | x | 0.9 | x | 28.0 | x | 17.9 | x | 16.5 | x | ||||
Low |
|
|
| 21 |
| 13 | % |
|
|
|
|
|
| (19 | )% | 11 | % | 43 | % | (13 | )% | 0.3 | x | 0.4 | x | 0.9 | x | 24.8 | x | 10.2 | x | 15.1 | x | ||||
|
|
|
|
|
|
|
|
|
|
|
|
|
|
|
|
|
|
|
|
|
|
|
|
|
|
|
|
|
|
|
|
|
| ||||
Oak Tree |
| $ | 3.26 |
| 56 | % | 78 | % | $ | 28 |
| $ | (10 | ) | $ | 19 |
| (14 | )% | 26 | % | N.A. |
| N.A. |
| 1.0 | x | 1.2 | x | 1.0 | x | N.M. |
| N.M. |
| N.M. |
|
Note: Data excludes all extraordinary items, nonrecurring charges and merger-related expenses.
Source: Revenue, EPS and Long Term Growth est. from First Call. Gross & EBIT margins from Wall Street research.
20
Selected Transactions Analysis ($10MM - $50MM)* |
| ($ in millions, except per share data) |
|
|
|
|
|
|
|
| Transaction Multiples |
| ||||
|
|
|
| Equity |
| Aggregate |
| LTM |
| NTM |
| ||
Date |
| Name |
| Value |
| Value |
| Revenue |
| Revenue |
| ||
3/19/06 |
| Wavecom/ |
| $ | 39 |
| $ | 39 |
| 0.5 | x | 0.4 | x |
|
| Sony Ericsson M2M Communications Business |
|
|
|
|
|
|
| ||||
|
| Target Description: Provider of wireless communications platforms for automotive, industrial and mobile professional applications |
| ||||||||||
|
|
|
|
|
|
|
|
|
|
|
| ||
2/15/06 |
| Macrovision/ |
| 35 |
| 35 |
| N.A. |
| 2.9 | x | ||
|
| eMeta |
|
|
|
|
|
|
|
|
| ||
|
| Target Description: Provider of software solutions that enamble companies to control and sell digital goods and services online |
| ||||||||||
|
|
|
|
|
|
|
|
|
|
|
| ||
1/19/06 |
| Progress Software/ |
| 32 |
| 32 |
| N.A. |
| 10.7 | x | ||
|
| Actional Corp. |
|
|
|
|
|
|
|
|
| ||
|
| Target Description: Provider of web services management software |
| ||||||||||
|
|
|
|
|
|
|
|
|
|
|
| ||
1/6/06 |
| Actuate/ |
| 17 |
| 17 |
| 1.7 | x | N.A. |
| ||
|
| Performancesoft |
|
|
|
|
|
|
|
|
| ||
|
| Target Description: Provider of performance management and dashboard software solutions and services |
| ||||||||||
|
|
|
|
|
|
|
|
|
|
|
| ||
12/1/05 |
| Digital River/ |
| 45 |
| 45 |
| 7.4 | x | 4.2 | x | ||
|
| Commerce5 |
|
|
|
|
|
|
|
|
| ||
|
| Target Description: Provider of outsourced e-commerce services |
|
|
| ||||||||
|
|
|
|
|
|
|
|
|
|
|
| ||
11/22/05 |
| Click Commerce/ |
| 20 |
| 20 |
| N.A. |
| 3.3 | x | ||
|
| Requisite Technology |
|
|
|
|
|
|
|
|
| ||
|
| Target Description: Provider of business software solutions for manufacturers |
|
| |||||||||
|
|
|
|
|
|
|
|
|
|
|
| ||
10/17/05 |
| CA/ |
| 50 |
| 50 |
| 2.5 | x | N.A. |
| ||
|
| iLumin |
|
|
|
|
|
|
|
|
| ||
|
| Target Description: Provider of email archiving software |
|
|
|
|
| ||||||
|
|
|
|
|
|
|
|
|
|
|
| ||
10/4/05 |
| Business Objects/ |
| 40 |
| 40 |
| 4.0 | x | N.A. |
| ||
|
| Infommersion |
|
|
|
|
|
|
|
|
| ||
|
| Target Description: Provider of information visualization and presentation software |
| ||||||||||
|
|
|
|
|
|
|
|
|
|
|
| ||
9/7/05 |
| F5 Networks/ |
| 43 |
| 43 |
| N.A. |
| 4.8 | x | ||
|
| Swan Labs |
|
|
|
|
|
|
|
|
| ||
|
| Target Description: Provider of WAN optimization technology |
|
|
| ||||||||
|
|
|
|
|
|
|
|
|
|
|
| ||
8/17/05 |
| Interwoven/ |
| 16 |
| 16 |
| 2.1 | x | N.A. |
| ||
|
| Scrittura |
|
|
|
|
|
|
|
|
| ||
|
| Target Description: Provider of automation technology and processing for financial services institutions |
| ||||||||||
|
|
|
|
|
|
|
|
|
|
|
| ||
8/16/05 |
| Phase Forward/ |
| 11 |
| 11 |
| 2.4 | x | N.A. |
| ||
|
| Lincoln Technologies |
|
|
|
|
|
|
|
|
| ||
|
| Target Description: Provider of clinical trial data solutions |
| ||||||||||
|
|
|
|
|
|
|
|
|
|
|
| ||
8/11/05 |
| Manhattan Associates/ |
| 50 |
| 50 |
| 2.5 | x | N.A. |
| ||
|
| Evant |
|
|
|
|
|
|
|
|
| ||
|
| Target Description: Provider of advanced supply chain management solutions |
| ||||||||||
|
|
|
|
|
|
|
|
|
|
|
| ||
8/3/05 |
| SumTotal/ |
| 48 |
| 48 |
| N.A. |
| 1.6 | x | ||
|
| Pathlore Software |
|
|
|
|
|
|
|
|
| ||
|
| Target Description: Provider of learning management solutions |
|
|
| ||||||||
*Since 1/1/2005.
Note: Multiples sourced from public filings
21
|
|
|
|
|
|
|
| Transaction Multiples |
| ||
|
|
|
| Equity |
| Aggregate |
| LTM |
| NTM |
|
Date |
| Name |
| Value |
| Value |
| Revenue |
| Revenue |
|
7/26/05 |
| Macrovision/ |
| 34 |
| 34 |
| N.A. |
| 2.5 | x |
|
| Trymedia |
|
|
|
|
|
|
|
|
|
|
| Target Description: Provider of a downloadable games distribution network |
| ||||||||
|
|
|
|
|
|
|
|
|
|
|
|
7/12/05 |
| NAVTEQ/ |
| 29 |
| 29 |
| 2.0 | x | N.A. |
|
|
| Picture Map Inc |
|
|
|
|
|
|
|
|
|
|
| Target Description: Provider of a comprehensive geographic database of South Korea |
| ||||||||
|
|
|
|
|
|
|
|
|
|
|
|
6/20/05 |
| Amdocs/ |
| 30 |
| 30 |
| N.A. |
| N.A. |
|
|
| Longshine |
|
|
|
|
|
|
|
|
|
|
| Provider of billing, customer care and settlement systems in China |
| ||||||||
|
|
|
|
|
|
|
|
|
|
|
|
4/12/05 |
| NICE Systems/ |
| 39 |
| 39 |
| N.A. |
| 0.9 | x |
|
| CRS |
|
|
|
|
|
|
|
|
|
|
| Target Description: Provider of recording platforms used by First Response teams |
| ||||||||
|
|
|
|
|
|
|
|
|
|
|
|
4/6/05 |
| Progress Software/ |
| 25 |
| 25 |
| N.A. |
| 6.3 | x |
|
| Apama |
|
|
|
|
|
|
|
|
|
|
| Target Description: Provider of event stream processing technology to financial firms |
| ||||||||
|
|
|
|
|
|
|
|
|
|
|
|
4/1/05 |
| Retalix/ |
| 34 |
| 34 |
| 1.6 | x | N.A. |
|
|
| TCI Solutions |
|
|
|
|
|
|
|
|
|
|
| Target Description: Provider of strategic pricing and inventory management solutions for the grocery industry |
| ||||||||
|
|
|
|
|
|
|
|
|
|
|
|
4/1/05 |
| Retalix/ |
| 44 |
| 44 |
| N.A. |
| N.A. |
|
|
| Integrated Distribution Systems |
|
|
|
|
|
|
|
|
|
|
| Target Description: Provider of enterprise resource planning solutions for the food retail supply chain |
| ||||||||
|
|
|
|
|
|
|
|
|
|
|
|
3/23/05 |
| BMC Software/ |
| 18 |
| 18 |
| N.A. |
| N.A. |
|
|
| OpenNetwork |
|
|
|
|
|
|
|
|
|
|
| Target Description: Provider of web access management products |
| ||||||||
|
|
|
|
|
|
|
|
|
|
|
|
2/8/05 |
| WebSideStory/ |
| 40 |
| 40 |
| N.A. |
| 3.8 | x |
|
| Avivo (Atomz) |
|
|
|
|
|
|
|
|
|
|
| Target Description: Provider of digital marketing services, focused on site-search and web content management |
| ||||||||
|
|
|
|
|
|
|
|
|
|
|
|
2/7/05 |
| Click Commerce/ |
| 30 |
| 35 |
| N.A. |
| N.A. |
|
|
| Optum Inc. |
|
|
|
|
|
|
|
|
|
|
| Provider of on-demand supply chain execution solutions |
| ||||||||
|
|
|
|
|
|
|
|
|
|
|
|
2/4/05 |
| Agile/ |
| 42 |
| 42 |
| 2.5 | x | N.A. |
|
|
| Cimmetry Systems |
|
|
|
|
|
|
|
|
|
|
| Target Description: Provider of collaborative visulization software |
| ||||||||
|
|
|
|
|
|
|
|
|
|
|
|
1/10/05 |
| BMC Software/ |
| 33 |
| 33 |
| N.A. |
| N.A. |
|
|
| Calendra |
|
|
|
|
|
|
|
|
|
|
| Target Description: Provider of directory management and workflow software |
| ||||||||
High |
| 7.4 | x | 10.7 | x |
3rd Quartile |
| 2.5 | x | 4.5 | x |
Median |
| 2.4 | x | 3.3 | x |
Mean |
| 2.7 | x | 3.8 | x |
1st Quartile |
| 1.8 | x | 2.1 | x |
Low |
| 0.5 | x | 0.4 | x |
*Since 1/1/2005.
Note: Multiples sourced from public filings
22
Premiums Paid Analysis (Since 1/1/2002) |
| ($ in millions) |
|
|
|
|
|
|
|
| Average |
| |||||
Announce |
|
|
|
|
| Equity (2) |
| % Stock Premium |
| |||||
Date |
| Target Name |
| Acquiror Name |
| Value ($mm) |
| 1 Day |
| 1 Week |
| 1 Month |
| |
|
|
|
|
|
|
|
|
|
|
|
|
|
| |
11/14/2005 |
| Enterasys Networks |
| The Gores Group |
| $ | 383 |
| 31.7 | % | 32.2 | % | 136.6 | % |
11/11/2005 |
| Serena Software |
| Silver Lake Partners |
| 1,026 |
| 1.5 | % | 4.2 | % | 14.0 | % | |
11/6/2005 |
| Geac Computer |
| Golden Gate Capital |
| 1,003 |
| 25.1 | % | 25.3 | % | 24.1 | % | |
8/9/2005 |
| Register.com (1) |
| Vector Capital |
| 197 |
| 21.1 | % | 19.6 | % | 27.3 | % | |
7/29/2005 |
| MDSI Mobile Data Solutions |
| Vista Equity Partners |
| 70 |
| 55.3 | % | 61.5 | % | 61.6 | % | |
7/5/2005 |
| Aspect Software |
| Concerto Software |
| 1,065 |
| 3.6 | % | 3.5 | % | 10.8 | % | |
5/16/2005 |
| iPayment |
| Investor Group |
| 800 |
| 20.4 | % | 14.6 | % | 4.8 | % | |
3/1/2005 |
| Blue Martini Software |
| Golden Gate Capital |
| 53 |
| 63.3 | % | 75.3 | % | 68.8 | % | |
1/27/2005 |
| Mapics |
| Infor Global Solutions |
| 347 |
| 9.7 | % | 13.3 | % | 16.8 | % | |
1/4/2005 |
| Tecnomatix Technologies |
| UGS |
| 229 |
| 11.9 | % | 14.3 | % | 25.9 | % | |
7/20/2004 |
| QRS |
| Investor Group |
| 109 |
| 7.5 | % | 25.6 | % | 14.9 | % | |
6/29/2004 |
| Catalyst International |
| ComVest Investment Partners |
| 20 |
| 92.3 | % | 88.0 | % | 82.0 | % | |
10/9/2003 |
| Firepond |
| Jaguar Technology Holdings |
| 12 |
| (7.6 | )% | (7.4 | )% | (11.7 | )% | |
10/7/2003 |
| Concerto Software |
| Golden Gate Capital |
| 141 |
| 28.9 | % | 30.6 | % | 28.5 | % | |
6/29/2003 |
| Information Resources |
| Investor Group |
| 91 |
| 3.1 | % | 4.2 | % | 3.6 | % | |
6/6/2003 |
| Corel |
| Vector Capital |
| 96 |
| 9.3 | % | 8.7 | % | 15.8 | % | |
6/5/2003 |
| Made2Manage Systems |
| Battery Ventures |
| 31 |
| 35.7 | % | 40.3 | % | 40.2 | % | |
5/30/2003 |
| Cysive |
| Investor Group |
| 75 |
| 0.6 | % | 0.2 | % | 5.2 | % | |
1/21/2003 |
| Resonate |
| Gores Technology Group |
| 53 |
| 7.1 | % | 8.1 | % | 14.1 | % | |
|
|
|
|
|
|
|
| Average |
| |||||
|
|
|
|
|
| Equity |
| % Stock Premium |
| |||||
|
|
|
| Transactions Since 1/1/02 |
| Value ($mm) |
| 1 Day |
| 1 Week |
| 1 Month |
| |
|
|
|
| High |
| $ | 1,065 |
| 92.3 | % | 88.0 | % | 136.6 | % |
|
|
|
| 3rd Quartile |
| 365 |
| 30.3 | % | 31.4 | % | 34.3 | % | |
|
|
|
| Mean |
| 305 |
| 22.1 | % | 24.3 | % | 30.7 | % | |
|
|
|
| Median |
| 109 |
| 11.9 | % | 14.6 | % | 16.8 | % | |
|
|
|
| 1st Quartile |
| 62 |
| 5.3 | % | 6.2 | % | 12.4 | % | |
|
|
|
| Low |
| 12 |
| (7.6 | )% | (7.4 | )% | (11.7 | )% | |
Note: Based on technology going private cash acquisitions >$10MM.
Source: Securities Data Corporation.
(1) Register.com premiums based on unaffected stock price on 6/9/2005.
(2) Equity Value of transaction excludes value of shares already held by the acquiror.
23