UNITED STATES
SECURITIES AND EXCHANGE COMMISSION
Washington, D.C. 20549
Form N-CSR
CERTIFIED SHAREHOLDER REPORT OF REGISTERED
MANAGEMENT INVESTMENT COMPANIES
Investment Company Act File Number: 811-21400
Eaton Vance Tax-Advantaged Dividend Income Fund
(Exact Name of Registrant as Specified in Charter)
Two International Place, Boston, Massachusetts 02110
(Address of Principal Executive Offices)
Maureen A. Gemma
Two International Place, Boston, Massachusetts 02110
(Name and Address of Agent for Services)
(617) 482-8260
(Registrant’s Telephone Number)
August 31
Date of Fiscal Year End
August 31, 2014
Date of Reporting Period
Item 1. Reports to Stockholders

Eaton Vance
Tax-Advantaged Dividend Income Fund (EVT)
Annual Report
August 31, 2014

Commodity Futures Trading Commission Registration. Effective December 31, 2012, the Commodity Futures Trading Commission (“CFTC”) adopted certain regulatory changes that subject registered investment companies and advisers to regulation by the CFTC if a fund invests more than a prescribed level of its assets in certain CFTC-regulated instruments (including futures, certain options and swap agreements) or markets itself as providing investment exposure to such instruments. The Fund has claimed an exclusion from the definition of the term “commodity pool operator” under the Commodity Exchange Act. Accordingly, neither the Fund nor the adviser with respect to the operation of the Fund is subject to CFTC regulation. Because of its management of other strategies, the Fund’s adviser is registered with the CFTC as a commodity pool operator and a commodity trading advisor.
Fund shares are not insured by the FDIC and are not deposits or other obligations of, or guaranteed by, any depository institution. Shares are subject to investment risks, including possible loss of principal invested.
Annual Report August 31, 2014
Eaton Vance
Tax-Advantaged Dividend Income Fund
Table of Contents
| | | | |
Management’s Discussion of Fund Performance | | | 2 | |
| |
Performance | | | 3 | |
| |
Fund Profile | | | 4 | |
| |
Endnotes and Additional Disclosures | | | 5 | |
| |
Financial Statements | | | 6 | |
| |
Report of Independent Registered Public Accounting Firm | | | 22 | |
| |
Federal Tax Information | | | 23 | |
| |
Annual Meeting of Shareholders | | | 24 | |
| |
Dividend Reinvestment Plan | | | 25 | |
| |
Board of Trustees’ Contract Approval | | | 27 | |
| |
Management and Organization | | | 30 | |
| |
Important Notices | | | 33 | |
Eaton Vance
Tax-Advantaged Dividend Income Fund
August 31, 2014
Management’s Discussion of Fund Performance1
Economic and Market Conditions
U.S. stocks delivered solid gains for the 12-month period ended August 31, 2014. Following a choppy start to the period, the market turned upward after a budget agreement in October 2013 ended the 16-day U.S. government shutdown. In December, when the U.S. Federal Reserve (the Fed) made its long-anticipated move to begin “tapering” economic stimulus, U.S. stocks put aside earlier fears of tapering and soared to record highs.
Harsh winter weather and geopolitical tensions weighed on the market in early 2014, but U.S. stocks subsequently resumed their advance amid signs of a gradually strengthening economy. The U.S. equity market generally climbed at a moderate pace through the spring of 2014, until the outbreak of hostilities in Iraq in June sent stocks sharply lower. But equities soon bounced back once the Fed reiterated its pledge to maintain low interest rates. U.S. stocks fell in late July 2014 amid mounting geopolitical and economic concerns, before rebounding in August — a month in which the market, as represented by the S&P 500 Index2, returned 4.00%.
The major U.S. stock indexes ended the 12-month period with strong performance. The S&P 500 Index advanced 25.25% for the period, while the Dow Jones Industrial Average gained 18.18%. The technology-laden NASDAQ Composite Index added 29.15%. Large-cap U.S. stocks (as measured by the Russell 1000 Index) generally fared better than their small-cap counterparts (as measured by the Russell 2000 Index) for the 12-month period. Within the large-cap space, growth stocks generally outpaced value stocks, while the reverse was true in the small-cap category.
Fund Performance
For the 12-month period ended August 31, 2014, Eaton Vance Tax-Advantaged Dividend Income Fund (the Fund) had a total return of 25.90% at net asset value (NAV), outperforming the Fund’s primary benchmark, the Russell 1000 Value Index (the Index), which returned 24.43% for the same period.
The Fund’s overall outperformance during the period, relative to its primary benchmark, was largely driven by the Fund’s use of leverage6. As of period-end on August 31, 2014, the Fund had leverage equal to 21.10% of the Fund’s aggregate net assets plus borrowings outstanding. Leverage has the
effect of magnifying the Fund’s exposure to its underlying investments in both up and down markets. Accordingly, leverage aided the Fund’s performance versus the Index during a period when equities generally performed strongly.
The Fund’s common stock allocation, as well as the Fund’s allocation to preferred securities (i.e., preferred stocks and corporate bonds and notes), underperformed the Index for the 12-month period and thus detracted from relative performance versus the Index.
Within the Fund’s common stock allocation, stock selection in the energy and industrials sectors, along with an underweight in the information technology sector, drove underperformance relative to the Index. In the energy sector, the Fund’s positions in Chevron Corp. and Italian energy firm Eni S.p.A. performed poorly, as world energy demand softened during the period. In the industrials sector, the Fund’s overweight in Danaher Corp., a weak performer during the period, and not owning General Dynamics, which rose sharply, hurt Fund performance versus the Index.
To increase its dividend yield, the Fund invested outside its U.S.-only benchmark in an effort to take advantage of higher yields overseas, particularly in some Western European countries, including Spain and Italy. However, a sluggish European economic recovery weighed on the region’s equity returns. As a result, the Fund’s European holdings dragged on performance versus the Index.
In contrast, stock selection in the materials, telecommunication services and health care sectors aided the performance of the Fund’s common stock allocation relative to the Index during the 12-month period.
As of August 31, 2014, the Fund had approximately 30% of its total investments in preferred securities. Although the Fund’s preferred security allocation underperformed the Index for the 12-month period, the Fund’s preferred security allocation outperformed the preferred market, as measured by the BofA Merrill Lynch Fixed Rate Preferred Securities Index. This outperformance was driven by a combination of factors: investments in some lower-rated, higher-yielding preferred issues; new preferred structures that performed well; and purchases of certain new issues that also performed strongly.
See Endnotes and Additional Disclosures in this report.
Past performance is no guarantee of future results. Returns are historical and are calculated by determining the percentage change in net asset value (NAV) or market price (as applicable) with all distributions reinvested and includes management fees and other expenses. Fund performance at market price will differ from its results at NAV due to factors such as changing per-ceptions about the Fund, market conditions, fluctuations in supply and demand for Fund shares, or changes in Fund distribu-tions. Investment return and principal value will fluctuate so that shares, when sold, may be worth more or less than their origi-nal cost. Performance less than one year is cumulative. Performance is for the stated time period only; due to market volatility, current Fund performance may be lower or higher than the quoted return. For performance as of the most recent month-end, please refer to eatonvance.com.
Eaton Vance
Tax-Advantaged Dividend Income Fund
August 31, 2014
Performance2,3
Portfolio Managers Edward J. Perkin, CFA, John D. Crowley, Walter A. Row III, CFA, CMT, Michael A. Allison, CFA and John H. Croft, CFA
| | | | | | | | | | | | | | | | |
| % Average Annual Total Returns | | Inception Date | | | One Year | | | Five Years | | | Ten Years | |
Fund at NAV | | | 09/30/2003 | | | | 25.90 | % | | | 17.02 | % | | | 8.89 | % |
Fund at Market Price | | | — | | | | 24.80 | | | | 16.69 | | | | 8.79 | |
Russell 1000 Value Index | | | — | | | | 24.43 | % | | | 16.61 | % | | | 8.23 | % |
BofA Merrill Lynch Fixed Rate Preferred Securities Index | | | — | | | | 12.86 | | | | 10.01 | | | | 2.75 | |
Blend of 70% Russell 1000 Value Index | | | — | | | | 20.97 | | | | 14.78 | | | | 6.88 | |
30% BofA Merrill Lynch Fixed Rate Preferred Securities Index | | | | | | | | | | | | | | | | |
| | | | |
| | | | | | | | | | | | | | | | |
| % Premium/Discount to NAV4 | | | | | | | | | | | | |
| | | | | | | | | | | | | | | –10.37 | % |
| | | | |
| | | | | | | | | | | | | | | | |
| Distributions5 | | | | | | | | | | | | |
Total Distributions per share for the period | | | | | | | | | | | | | | $ | 1.323 | |
Distribution Rate at NAV | | | | | | | | | | | | | | | 6.06 | % |
Distribution Rate at Market Price | | | | | | | | | | | | | | | 6.76 | % |
| | | | |
| | | | | | | | | | | | | | | | |
| % Total Leverage6 | | | | | | | | | | | | |
Borrowings | | | | | | | | | | | | | | | 21.10 | % |
See Endnotes and Additional Disclosures in this report.
Past performance is no guarantee of future results. Returns are historical and are calculated by determining the percentage change in net asset value (NAV) or market price (as applicable) with all distributions reinvested and includes management fees and other expenses. Fund performance at market price will differ from its results at NAV due to factors such as changing per-ceptions about the Fund, market conditions, fluctuations in supply and demand for Fund shares, or changes in Fund distribu-tions. Investment return and principal value will fluctuate so that shares, when sold, may be worth more or less than their origi-nal cost. Performance less than one year is cumulative. Performance is for the stated time period only; due to market volatility, current Fund performance may be lower or higher than the quoted return. For performance as of the most recent month-end, please refer to eatonvance.com.
Eaton Vance
Tax-Advantaged Dividend Income Fund
August 31, 2014
Fund Profile
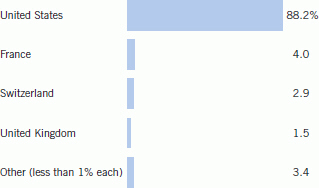
Country Allocation (% of total investments)
Top 10 Common Stock Holdings (% of total investments)
| | | | |
Chevron Corp. | | | 2.5 | % |
| |
Exxon Mobil Corp. | | | 2.3 | |
| |
Wells Fargo & Co. | | | 2.1 | |
| |
Pfizer, Inc. | | | 2.0 | |
| |
Merck & Co., Inc. | | | 2.0 | |
| |
Discover Financial Services | | | 1.7 | |
| |
General Electric Co. | | | 1.7 | |
| |
JPMorgan Chase & Co. | | | 1.6 | |
| |
Bank of America Corp. | | | 1.6 | |
| |
Caterpillar, Inc. | | | 1.6 | |
Total | | | 19.1 | % |
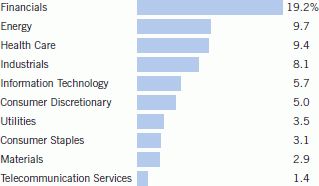
Common Stock Sector Allocation (% of total investments)
See Endnotes and Additional Disclosures in this report.
Eaton Vance
Tax-Advantaged Dividend Income Fund
August 31, 2014
Endnotes and Additional Disclosures
| 1 | The views expressed in this report are those of the portfolio manager(s) and are current only through the date stated at the top of this page. These views are subject to change at any time based upon market or other conditions, and Eaton Vance and the Fund(s) disclaim any responsibility to update such views. These views may not be relied upon as investment advice and, because investment decisions are based on many factors, may not be relied upon as an indication of trading intent on behalf of any Eaton Vance fund. This commentary may contain statements that are not historical facts, referred to as “forward looking statements”. The Fund’s actual future results may differ significantly from those stated in any forward looking statement, depending on factors such as changes in securities or financial markets or general economic conditions, the volume of sales and purchases of Fund shares, the continuation of investment advisory, administrative and service contracts, and other risks discussed from time to time in the Fund’s filings with the Securities and Exchange Commission. |
| 2 | Russell 1000 Value Index is an unmanaged index of U.S. large-cap value stocks. BofA Merrill Lynch Fixed Rate Preferred Securities Index is an unmanaged index of fixed-rate, preferred securities issued in the U.S. BofA Merrill Lynch® indices not for redistribution or other uses; provided “as is”, without warranties, and with no liability. Eaton Vance has prepared this report, BofAML does not endorse it, or guarantee, review, or endorse Eaton Vance’s products. S&P 500 Index is an unmanaged index of large-cap stocks commonly used as a measure of U.S. stock market performance. Dow Jones Industrial Average is a price-weighted average of 30 blue-chip stocks that are generally the leaders in their industry. NASDAQ Composite Index is a market capitalization-weighted index of all domestic and international securities listed on NASDAQ. Russell 1000 Index is an unmanaged index of 1,000 U.S. large-cap stocks. Russell 2000 Index is an unmanaged index of 2,000 U.S. small-cap stocks. Unless otherwise stated, index returns do not reflect the effect of any applicable sales charges, commissions, expenses, taxes or leverage, as applicable. It is not possible to invest directly in an index. |
| 3 | Performance results reflect the effects of leverage. Performance since inception for an index, if presented, is the performance since the Fund’s or oldest share class’ inception, as applicable. |
| 4 | The shares of the Fund often trade at a discount or premium from their net asset value. The discount or premium of the Fund may vary over time and may be higher or lower than what is quoted in this report. For up-to-date premium/discount information, please refer to http://eatonvance.com/closedend. |
| 5 | The Distribution Rate is based on the Fund’s last regular distribution per share in the period (annualized) divided by the Fund’s NAV or market price at the end of the period. The Fund’s distributions may be comprised of amounts characterized for federal income tax purposes as qualified and non-qualified ordinary dividends, capital gains and nondividend distributions, also known as return of capital. The Fund will determine the federal income tax character of distributions paid to a shareholder after the end of the calendar year. This is reported on the IRS form 1099-DIV and provided to the shareholder shortly after each year-end. For information about the tax character of distributions made in prior calendar years, please refer to Performance-Tax Character of Distributions on the Fund’s webpage available at eatonvance.com. The Fund’s distributions are determined by the investment adviser based on its current assessment of the Fund’s long-term return potential. As portfolio and market conditions change, the rate of distributions paid by the Fund could change. |
| 6 | Total leverage is shown as a percentage of the Fund’s aggregate net assets plus borrowings outstanding. The Fund employs leverage through borrowings. Use of leverage creates an opportunity for income, but creates risks including greater price volatility. The cost of borrowings rises and falls with changes in short-term interest rates. The Fund may be required to maintain prescribed asset coverage for its leverage and may be required to reduce its leverage at an inopportune time. |
| | Fund profile subject to change due to active management. |
Important Notice to Shareholders
| | Effective September 30, 2014, Edward Perkin and John Crowley joined the portfolio management team of the Fund. Mr. Perkin is Vice President and Chief Equity Investment Officer of Eaton Vance Management (EVM) and Mr. Crowley is a Vice President of EVM. Each co-manages other portfolios advised by EVM. |
Eaton Vance
Tax-Advantaged Dividend Income Fund
August 31, 2014
Portfolio of Investments
| | | | | | | | |
| Common Stocks — 85.7% | |
| | |
| | | | | | | | |
| Security | | Shares | | | Value | |
| | | | | | | | |
|
Aerospace & Defense — 2.2% | |
Boeing Co. (The) | | | 162,500 | | | $ | 20,605,000 | |
United Technologies Corp.(1) | | | 156,115 | | | | 16,857,298 | |
| | | | | | | | | |
| | | | | | $ | 37,462,298 | |
| | | | | | | | | |
| | |
Air Freight & Logistics — 1.5% | | | | | | | | |
C.H. Robinson Worldwide, Inc.(1) | | | 360,340 | | | $ | 24,596,808 | |
| | | | | | | | | |
| | | | | | $ | 24,596,808 | |
| | | | | | | | | |
| | |
Banks — 11.8% | | | | | | | | |
Bank of America Corp.(1) | | | 2,087,774 | | | $ | 33,592,284 | |
Citigroup, Inc.(1) | | | 633,660 | | | | 32,728,539 | |
JPMorgan Chase & Co.(1) | | | 577,970 | | | | 34,360,316 | |
PNC Financial Services Group, Inc. (The)(1) | | | 378,150 | | | | 32,048,212 | |
Regions Financial Corp.(1) | | | 2,033,070 | | | | 20,635,661 | |
Wells Fargo & Co.(1) | | | 864,330 | | | | 44,461,135 | |
| | | | | | | | | |
| | | | | | $ | 197,826,147 | |
| | | | | | | | | |
| | |
Capital Markets — 1.9% | | | | | | | | |
Goldman Sachs Group, Inc. (The) | | | 44,000 | | | $ | 7,880,840 | |
Morgan Stanley(1) | | | 672,908 | | | | 23,087,474 | |
| | | | | | | | | |
| | | | | | $ | 30,968,314 | |
| | | | | | | | | |
| | |
Chemicals — 2.7% | | | | | | | | |
CF Industries Holdings, Inc. | | | 41,209 | | | $ | 10,618,323 | |
E.I. du Pont de Nemours & Co. | | | 111,663 | | | | 7,382,041 | |
LyondellBasell Industries NV, Class A | | | 177,623 | | | | 20,311,190 | |
PPG Industries, Inc. | | | 36,719 | | | | 7,558,973 | |
| | | | | | | | | |
| | | | | | $ | 45,870,527 | |
| | | | | | | | | |
| | |
Communications Equipment — 1.3% | | | | | | | | |
Cisco Systems, Inc. | | | 898,860 | | | $ | 22,462,511 | |
| | | | | | | | | |
| | | | | | $ | 22,462,511 | |
| | | | | | | | | |
| | |
Consumer Finance — 2.2% | | | | | | | | |
Discover Financial Services(1) | | | 582,560 | | | $ | 36,334,267 | |
| | | | | | | | | |
| | | | | | $ | 36,334,267 | |
| | | | | | | | | |
| |
Diversified Telecommunication Services — 1.7% | | | | | |
AT&T, Inc. | | | 300,000 | | | $ | 10,488,000 | |
Verizon Communications, Inc. | | | 370,000 | | | | 18,433,400 | |
| | | | | | | | | |
| | | | | | $ | 28,921,400 | |
| | | | | | | | | |
| | | | | | | | |
| Security | | Shares | | | Value | |
| | | | | | | | |
| | |
Electric Utilities — 2.8% | | | | | | | | |
Edison International(1) | | | 376,959 | | | $ | 22,293,355 | |
NextEra Energy, Inc.(1) | | | 248,590 | | | | 24,473,686 | |
| | | | | | | | | |
| | | | | | $ | 46,767,041 | |
| | | | | | | | | |
| | |
Electrical Equipment — 1.0% | | | | | | | | |
Emerson Electric Co. | | | 271,620 | | | $ | 17,389,112 | |
| | | | | | | | | |
| | | | | | $ | 17,389,112 | |
| | | | | | | | | |
|
Electronic Equipment, Instruments & Components — 1.8% | |
Corning, Inc. | | | 1,466,700 | | | $ | 30,595,362 | |
| | | | | | | | | |
| | | | | | $ | 30,595,362 | |
| | | | | | | | | |
| | |
Energy Equipment & Services — 0.5% | | | | | | | | |
FMC Technologies, Inc.(2) | | | 135,844 | | | $ | 8,400,593 | |
| | | | | | | | | |
| | | | | | $ | 8,400,593 | |
| | | | | | | | | |
| | |
Food Products — 2.9% | | | | | | | | |
Hershey Co. (The) | | | 302,000 | | | $ | 27,608,840 | |
Mondelez International, Inc., Class A(1) | | | 584,541 | | | | 21,154,539 | |
| | | | | | | | | |
| | | | | | $ | 48,763,379 | |
| | | | | | | | | |
| | |
Health Care Equipment & Supplies — 2.7% | | | | | | | | |
Abbott Laboratories | | | 439,480 | | | $ | 18,563,635 | |
Covidien PLC(1) | | | 214,640 | | | | 18,637,191 | |
Medtronic, Inc. | | | 126,020 | | | | 8,046,377 | |
| | | | | | | | | |
| | | | | | $ | 45,247,203 | |
| | | | | | | | | |
| | |
Health Care Providers & Services — 1.2% | | | | | | | | |
UnitedHealth Group, Inc. | | | 231,749 | | | $ | 20,088,003 | |
| | | | | | | | | |
| | | | | | $ | 20,088,003 | |
| | | | | | | | | |
| | |
Household Durables — 0.6% | | | | | | | | |
Mohawk Industries, Inc.(2) | | | 64,376 | | | $ | 9,400,184 | |
| | | | | | | | | |
| | | | | | $ | 9,400,184 | |
| | | | | | | | | |
| | |
Industrial Conglomerates — 3.4% | | | | | | | | |
Danaher Corp. | | | 284,502 | | | $ | 21,795,698 | |
General Electric Co. | | | 1,349,429 | | | | 35,058,166 | |
| | | | | | | | | |
| | | | | | $ | 56,853,864 | |
| | | | | | | | | |
| | |
Insurance — 4.8% | | | | | | | | |
ACE, Ltd. | | | 179,222 | | | $ | 19,056,675 | |
Aflac, Inc.(1) | | | 388,370 | | | | 23,783,779 | |
| | | | |
| | 6 | | See Notes to Financial Statements. |
Eaton Vance
Tax-Advantaged Dividend Income Fund
August 31, 2014
Portfolio of Investments — continued
| | | | | | | | |
| Security | | Shares | | | Value | |
| | | | | | | | |
| | |
Insurance (continued) | | | | | | | | |
AXA SA | | | 701,031 | | | $ | 17,395,209 | |
MetLife, Inc. | | | 350,550 | | | | 19,189,107 | |
| | | | | | | | | |
| | | | | | $ | 79,424,770 | |
| | | | | | | | | |
| | |
Internet Software & Services — 1.4% | | | | | | | | |
Google, Inc., Class C(2) | | | 41,000 | | | $ | 23,435,600 | |
| | | | | | | | | |
| | | | | | $ | 23,435,600 | |
| | | | | | | | | |
| | |
Machinery — 2.0% | | | | | | | | |
Caterpillar, Inc. | | | 306,373 | | | $ | 33,416,103 | |
| | | | | | | | | |
| | | | | | $ | 33,416,103 | |
| | | | | | | | | |
| | |
Media — 3.3% | | | | | | | | |
Comcast Corp., Class A(1) | | | 411,578 | | | $ | 22,525,664 | |
Walt Disney Co. (The)(1) | | | 365,730 | | | | 32,871,812 | |
| | | | | | | | | |
| | | | | | $ | 55,397,476 | |
| | | | | | | | | |
| | |
Metals & Mining — 1.0% | | | | | | | | |
Freeport-McMoRan, Inc.(1) | | | 445,658 | | | $ | 16,208,582 | |
| | | | | | | | | |
| | | | | | $ | 16,208,582 | |
| | | | | | | | | |
| | |
Multi-Utilities — 1.6% | | | | | | | | |
Sempra Energy(1) | | | 252,610 | | | $ | 26,769,082 | |
| | | | | | | | | |
| | | | | | $ | 26,769,082 | |
| | | | | | | | | |
| | |
Oil, Gas & Consumable Fuels — 11.8% | | | | | | | | |
Chevron Corp.(1) | | | 400,505 | | | $ | 51,845,372 | |
ConocoPhillips | | | 408,966 | | | | 33,216,219 | |
Devon Energy Corp.(1) | | | 320,000 | | | | 24,134,400 | |
Exxon Mobil Corp.(1) | | | 487,362 | | | | 48,473,025 | |
Occidental Petroleum Corp.(1) | | | 181,610 | | | | 18,838,405 | |
Total SA | | | 306,521 | | | | 20,226,860 | |
| | | | | | | | | |
| | | | | | $ | 196,734,281 | |
| | | | | | | | | |
| | |
Pharmaceuticals — 7.9% | | | | | | | | |
Merck & Co., Inc.(1) | | | 711,124 | | | $ | 42,745,664 | |
Pfizer, Inc.(1) | | | 1,456,890 | | | | 42,817,997 | |
Roche Holding AG PC(1) | | | 95,760 | | | | 27,967,466 | |
Sanofi | | | 168,130 | | | | 18,425,766 | |
| | | | | | | | | |
| | | | | | $ | 131,956,893 | |
| | | | | | | | | |
| |
Real Estate Investment Trusts (REITs) — 3.2% | | | | | |
AvalonBay Communities, Inc.(1) | | | 119,580 | | | $ | 18,427,278 | |
Public Storage, Inc. | | | 132,870 | | | | 23,276,167 | |
| | | | | | | | |
| Security | | Shares | | | Value | |
| | | | | | | | |
| |
Real Estate Investment Trusts (REITs) (continued) | | | | | |
Simon Property Group, Inc. | | | 68,835 | | | $ | 11,704,015 | |
| | | | | | | | | |
| | | $ | 53,407,460 | |
| | | | | | | | | |
|
Specialty Retail — 2.5% | |
Home Depot, Inc. (The)(1) | | | 272,278 | | | $ | 25,457,993 | |
TJX Cos., Inc. (The) | | | 260,267 | | | | 15,514,516 | |
| | | | | | | | | |
| | | $ | 40,972,509 | |
| | | | | | | | | |
|
Technology Hardware, Storage & Peripherals — 2.7% | |
Apple, Inc. | | | 239,000 | | | $ | 24,497,500 | |
Hewlett-Packard Co. | | | 525,000 | | | | 19,950,000 | |
| | | | | | | | | |
| | | $ | 44,447,500 | |
| | | | | | | | | |
|
Thrifts & Mortgage Finance — 0.3% | |
Federal National Mortgage Association(2) | | | 1,475,459 | | | $ | 5,739,536 | |
| | | | | | | | | |
| | | $ | 5,739,536 | |
| | | | | | | | | |
|
Tobacco — 1.0% | |
Altria Group, Inc. | | | 384,917 | | | $ | 16,582,224 | |
| | | | | | | | | |
| | | $ | 16,582,224 | |
| | | | | | | | | |
| |
Total Common Stocks
(identified cost $1,128,531,067) | | | $ | 1,432,439,029 | |
| | | | | | | | | |
| | |
| Preferred Stocks — 28.1% | | | | | | | | |
| | |
| | | | | | | | |
| Security | | Shares | | | Value | |
| | |
Banks — 13.6% | | | | | | | | |
AgriBank FCB, 6.875% to 1/1/24(3) | | | 92,513 | | | $ | 9,838,184 | |
Banco Santander SA, 5.95% to 1/30/19(3)(4) | | | 1,270 | | | | 1,360,536 | |
Bank of America Corp., Series U,
5.20% to 6/1/23(3) | | | 4,520 | | | | 4,439,148 | |
Barclays Bank PLC, 8.25% to 12/15/18(3) | | | 11,340 | | | | 12,290,396 | |
Citigroup, Inc., Series K,
6.875% to 11/15/23(3) | | | 412,807 | | | | 11,175,718 | |
CoBank ACB, Series F,
6.25% to 10/1/22(3)(4) | | | 94,700 | | | | 9,857,683 | |
Deutsche Bank Contingent Capital Trust III, 7.60% | | | 204,580 | | | | 5,646,408 | |
Farm Credit Bank of Texas,
6.75% to 9/15/23(3)(4) | | | 13,800 | | | | 1,457,625 | |
Farm Credit Bank of Texas, Series 1, 10.00% | | | 8,678 | | | | 10,739,025 | |
First Tennessee Bank, 3.75%(4)(5) | | | 4,660 | | | | 3,452,332 | |
HSBC Capital Funding LP, Series 2, 10.176% to 6/30/30(1)(3)(4) | | | 4,737 | | | | 7,212,203 | |
JPMorgan Chase & Co., Series Q,
5.15% to 5/1/23(3) | | | 15,781 | | | | 15,730,959 | |
JPMorgan Chase & Co., Series R,
6.00% to 8/1/23(3) | | | 4,566 | | | | 4,730,376 | |
KeyCorp, Series A, 7.75% | | | 81,279 | | | | 10,647,549 | |
Lloyds Banking Group PLC,
6.657% to 5/21/37(1)(3)(4) | | | 12,213 | | | | 13,631,865 | |
| | | | |
| | 7 | | See Notes to Financial Statements. |
Eaton Vance
Tax-Advantaged Dividend Income Fund
August 31, 2014
Portfolio of Investments — continued
| | | | | | | | |
| Security | | Shares | | | Value | |
| | | | | | | | |
|
Banks (continued) | |
Regions Financial Corp., Series A, 6.375% | | | 471,632 | | | $ | 11,738,920 | |
Royal Bank of Scotland Group PLC, Series 1, 7.648% to 9/30/31(3) | | | 1,759 | | | | 2,141,216 | |
Royal Bank of Scotland Group PLC, Series S, 6.60% | | | 111,140 | | | | 2,781,834 | |
Societe Generale, 7.875% to 12/18/23(3)(4) | | | 8,465 | | | | 8,965,599 | |
Standard Chartered PLC,
7.014% to 7/30/37(1)(3)(4) | | | 135.97 | | | | 15,535,039 | |
SunTrust Banks, Inc., Series E, 5.875% | | | 330,358 | | | | 7,887,297 | |
Synovus Financial Corp., Series C,
7.875% to 8/1/18(3) | | | 50,429 | | | | 1,410,070 | |
Texas Capital Bancshares, Inc., 6.50% | | | 274,290 | | | | 6,720,105 | |
Texas Capital Bancshares, Inc., Series A, 6.50% | | | 47,100 | | | | 1,161,486 | |
Webster Financial Corp., Series E, 6.40% | | | 286,495 | | | | 7,063,907 | |
Wells Fargo & Co., Series L, 7.50% | | | 10,588 | | | | 12,874,690 | |
Wells Fargo & Co., Series T, 6.00% | | | 254,855 | | | | 6,364,366 | |
Zions Bancorporation, Series G, 6.30% to 3/15/23(3) | | | 343,260 | | | | 8,903,306 | |
Zions Bancorporation, Series I,
5.80% to 9/15/23 (3) | | | 7,234 | | | | 7,047,403 | |
Zions Bancorporation, Series J, 7.20% to 9/15/23(3) | | | 4,120 | | | | 4,528,036 | |
| | | | | | | | | |
| | | $ | 227,333,281 | |
| | | | | | | | | |
| | |
Capital Markets — 2.6% | | | | | | | | |
Affiliated Managers Group, Inc., 6.375% | | | 282,688 | | | $ | 7,223,103 | |
Bank of New York Mellon Corp. (The), 5.20% | | | 144,283 | | | | 3,451,249 | |
Goldman Sachs Group, Inc. (The), Series I, 5.95% | | | 171,000 | | | | 4,141,620 | |
Goldman Sachs Group, Inc. (The), Series J, 5.50% to 5/10/23(3) | | | 349,225 | | | | 8,549,028 | |
Morgan Stanley, Series G, 6.625% | | | 507,393 | | | | 12,981,650 | |
State Street Corp., Series D, 5.90% to 3/15/24(3) | | | 253,695 | | | | 6,617,000 | |
| | | | | | | | | |
| | | $ | 42,963,650 | |
| | | | | | | | | |
| | |
Consumer Finance — 1.9% | | | | | | | | |
Ally Financial, Inc., Series A, 8.50% to 5/15/16(3) | | | 187,367 | | | $ | 5,119,335 | |
Capital One Financial Corp., Series B, 6.00% | | | 593,826 | | | | 14,352,774 | |
Discover Financial Services, Series B, 6.50% | | | 506,044 | | | | 12,960,546 | |
| | | | | | | | | |
| | | $ | 32,432,655 | |
| | | | | | | | | |
| | |
Diversified Financial Services — 1.6% | | | | | | | | |
General Electric Capital Corp., Series B,
6.25% to 12/15/22(3) | | | 50.05 | | | $ | 5,663,876 | |
KKR Financial Holdings, LLC, Series A, 7.375% | | | 435,261 | | | | 11,291,323 | |
RBS Capital Funding Trust VII, Series G, 6.08% | | | 395,086 | | | | 9,600,590 | |
| | | | | | | | | |
| | | $ | 26,555,789 | |
| | | | | | | | | |
| | |
Electric Utilities — 1.9% | | | | | | | | |
AES Gener SA, 8.375% to 6/18/19(3)(4) | | | 7,010 | | | $ | 8,147,129 | |
Electricite de France SA, 5.25% to 1/29/23(3)(4) | | | 2,950 | | | | 3,067,447 | |
Entergy Arkansas, Inc., 4.90% | | | 96,455 | | | | 2,236,068 | |
| | | | | | | | |
| Security | | Shares | | | Value | |
| | | | | | | | |
| | |
Electric Utilities (continued) | | | | | | | | |
Entergy Arkansas, Inc., 6.45% | | | 308,409 | | | $ | 7,835,532 | |
Entergy Louisiana, LLC, 6.95% | | | 14,484 | | | | 1,450,664 | |
NextEra Energy Capital Holdings, Inc., Series G, 5.70% | | | 112,500 | | | | 2,763,281 | |
NextEra Energy Capital Holdings, Inc., Series I, 5.125% | | | 300,395 | | | | 6,642,484 | |
| | | | | | | | | |
| | | $ | 32,142,605 | |
| | | | | | | | | |
| | |
Food Products — 0.9% | | | | | | | | |
Dairy Farmers of America, 7.875%(4) | | | 94,450 | | | $ | 10,064,828 | |
Ocean Spray Cranberries, Inc., 6.25%(4) | | | 57,835 | | | | 5,252,141 | |
| | | | | | | | | |
| | | $ | 15,316,969 | |
| | | | | | | | | |
| | |
Insurance — 1.5% | | | | | | | | |
American Overseas Group, Ltd., Series A, 7.50% to 12/15/16(3) | | | 13,000 | | | $ | 5,200,812 | |
Aspen Insurance Holdings, Ltd.,
5.95% to 7/1/23(3) | | | 70,552 | | | | 1,820,947 | |
Aspen Insurance Holdings, Ltd.,
7.401% to 1/1/17(3) | | | 89,150 | | | | 2,402,593 | |
Endurance Specialty Holdings, Ltd., Series B, 7.50% | | | 185,750 | | | | 4,875,938 | |
Montpelier Re Holdings, Ltd., 8.875% | | | 359,613 | | | | 10,230,990 | |
| | | | | | | | | |
| | | $ | 24,531,280 | |
| | | | | | | | | |
| | |
Machinery — 1.0% | | | | | | | | |
Stanley Black & Decker, Inc., 5.75% | | | 644,724 | | | $ | 16,158,395 | |
| | | | | | | | | |
| | | $ | 16,158,395 | |
| | | | | | | | | |
| | |
Multi-Utilities — 0.2% | | | | | | | | |
DTE Energy Co., Series C, 5.25% | | | 144,047 | | | $ | 3,494,580 | |
| | | | | | | | | |
| | | $ | 3,494,580 | |
| | | | | | | | | |
| | |
Pipelines — 0.5% | | | | | | | | |
NuStar Logistics LP, 7.625% to 1/15/18(3) | | | 283,020 | | | $ | 7,653,285 | |
| | | | | | | | | |
| | | $ | 7,653,285 | |
| | | | | | | | | |
|
Real Estate Investment Trusts (REITs) — 1.5% | |
American Realty Capital Properties, Inc., Series F, 6.70% | | | 196,383 | | | $ | 4,642,494 | |
Cedar Realty Trust, Inc., Series B, 7.25% | | | 188,900 | | | | 4,816,950 | |
Chesapeake Lodging Trust, Series A, 7.75% | | | 73,431 | | | | 1,940,047 | |
DDR Corp., Series J, 6.50% | | | 250,000 | | | | 6,380,000 | |
DDR Corp., Series K, 6.25% | | | 129,500 | | | | 3,220,989 | |
Sunstone Hotel Investors, Inc., Series D, 8.00% | | | 120,774 | | | | 3,245,801 | |
Taubman Centers, Inc., Series K, 6.25% | | | 70,600 | | | | 1,765,000 | |
| | | | | | | | | |
| | | $ | 26,011,281 | |
| | | | | | | | | |
| | | | |
| | 8 | | See Notes to Financial Statements. |
Eaton Vance
Tax-Advantaged Dividend Income Fund
August 31, 2014
Portfolio of Investments — continued
| | | | | | | | |
| Security | | Shares | | | Value | |
| | | | | | | | |
| | |
Thrifts & Mortgage Finance — 0.9% | | | | | | | | |
Elmira Savings Bank FSB (The), 8.998% to 12/31/17(3) | | | 4,750 | | | $ | 4,560,000 | |
EverBank Financial Corp., Series A, 6.75% | | | 391,931 | | | | 9,857,065 | |
| | | | | | | | | |
| | | $ | 14,417,065 | |
| | | | | | | | | |
| |
Total Preferred Stocks
(identified cost $449,088,363) | | | $ | 469,010,835 | |
| | | | | | | | | |
| |
| Corporate Bonds & Notes — 9.8% | | | | | |
| | |
| | | | | | | | |
| Security | | Principal
Amount
(000’s omitted) | | | Value | |
| | | | | | | | |
| | |
Banks — 3.5% | | | | | | | | |
Banco do Brasil SA, 6.25% to 4/15/24, 10/29/49(3)(4) | | $ | 3,262 | | | $ | 2,625,910 | |
Caixa Economica Federal, 7.25% to 7/23/19, 7/23/24(3)(4) | | | 10,197 | | | | 10,406,038 | |
Credit Agricole SA, 7.875% to 1/23/24, 1/29/49(3)(4) | | | 12,885 | | | | 13,939,959 | |
Credit Suisse Group AG, 6.25% to 12/18/24, 12/29/49(3)(4) | | | 14,150 | | | | 14,121,700 | |
Groupe BPCE, 12.50% to 9/30/19, 8/29/49(1)(3)(4) | | | 5,691 | | | | 7,782,443 | |
Societe Generale SA, 8.25% to 11/29/2018, 9/29/49(3)(6) | | | 5,461 | | | | 5,859,107 | |
SunTrust Preferred Capital I, 4.00%, 6/29/49(5) | | | 5,100 | | | | 4,182,000 | |
| | | | | | | | | |
| | | $ | 58,917,157 | |
| | | | | | | | | |
| | |
Chemicals — 0.2% | | | | | | | | |
Sinochem Group,
5.00% to 11/2/18, 12/29/49(3)(4) | | $ | 2,350 | | | $ | 2,444,000 | |
| | | | | | | | | |
| | | $ | 2,444,000 | |
| | | | | | | | | |
| | |
Diversified Financial Services — 1.3% | | | | | | | | |
Odebrecht Oil & Gas Finance, Ltd., 7.00% to 6/17/24, 12/29/49(3)(4) | | $ | 6,905 | | | $ | 7,112,150 | |
Textron Financial Corp., 6.00% to 2/15/17, 2/15/67(1)(3)(4) | | | 16,261 | | | | 14,960,120 | |
| | | | | | | | | |
| | | $ | 22,072,270 | |
| | | | | | | | | |
|
Diversified Telecommunication Services — 0.5% | |
Koninklijke KPN NV, 7.00% to 3/28/23, 3/28/73(3)(4) | | $ | 8,049 | | | $ | 8,562,124 | |
| | | | | | | | | |
| | | $ | 8,562,124 | |
| | | | | | | | | |
| | |
Electric Utilities — 1.6% | | | | | | | | |
Enel SpA, 8.75% to 9/24/23, 9/24/73(3)(4) | | $ | 11,100 | | | $ | 13,098,000 | |
PPL Capital Funding, Inc., Series A, 6.70% to 3/30/17, 3/30/67(1)(3) | | | 13,510 | | | | 13,786,779 | |
| | | | | | | | | |
| | | $ | 26,884,779 | |
| | | | | | | | | |
| | | | | | | | |
| Security | | Principal
Amount
(000’s omitted) | | | Value | |
| | | | | | | | |
| | |
Insurance — 2.1% | | | | | | | | |
Allstate Corp. (The), Series B, 5.75% to 8/15/23, 8/15/53(3) | | $ | 1,237 | | | $ | 1,325,910 | |
MetLife, Inc.,
10.75% to 8/1/39, 8/1/69(1)(3) | | | 4,575 | | | | 7,434,375 | |
QBE Capital Funding II, LP, 6.797% to 6/1/17, 6/29/49(3)(4) | | | 3,685 | | | | 3,841,613 | |
QBE Capital Funding III, Ltd., 7.25% to 5/24/21, 5/24/41(1)(3)(4) | | | 6,719 | | | | 7,316,695 | |
XL Capital, Ltd., Series E, 6.50% to 4/15/17, 12/29/49(1)(3) | | | 16,287 | | | | 15,778,031 | |
| | | | | | | | | |
| | | $ | 35,696,624 | |
| | | | | | | | | |
| | |
Pipelines — 0.6% | | | | | | | | |
DCP Midstream, LLC,
5.85% to 5/21/23, 5/21/43(3)(4) | | $ | 9,687 | | | $ | 9,444,825 | |
| | | | | | | | | |
| | | $ | 9,444,825 | |
| | | | | | | | | |
| |
Total Corporate Bonds & Notes
(identified cost $148,949,732) | | | $ | 164,021,779 | |
| | | | | | | | | |
| |
| Short-Term Investments — 2.4% | | | | | |
| | |
| | | | | | | | |
| Description | | Interest
(000’s omitted) | | | Value | |
Eaton Vance Cash Reserves Fund, LLC, 0.13%(7) | | $ | 39,669 | | | $ | 39,668,793 | |
| | | | | | | | | |
| |
Total Short-Term Investments
(identified cost $39,668,793) | | | $ | 39,668,793 | |
| | | | | | | | | |
| |
Total Investments — 126.0%
(identified cost $1,766,237,955) | | | $ | 2,105,140,436 | |
| | | | | | | | | |
| |
Other Assets, Less Liabilities — (26.0)% | | | $ | (433,967,076 | ) |
| | | | | | | | | |
| |
Net Assets — 100.0% | | | $ | 1,671,173,360 | |
| | | | | | | | | |
The percentage shown for each investment category in the Portfolio of Investments is based on net assets.
| | | | |
| PC | | – | | Participation Certificate |
| (1) | Security has been segregated as collateral with the custodian for borrowings under the Committed Facility Agreement. |
| (2) | Non-income producing security. |
| (3) | Security converts to floating rate after the indicated fixed-rate coupon period. |
| (4) | Security exempt from registration pursuant to Rule 144A under the Securities Act of 1933. These securities may be sold in certain transactions (normally to qualified institutional buyers) and remain exempt from registration. At August 31, 2014, the aggregate value of these securities is $203,660,004 or 12.2% of the Fund’s net assets. |
| | | | |
| | 9 | | See Notes to Financial Statements. |
Eaton Vance
Tax-Advantaged Dividend Income Fund
August 31, 2014
Portfolio of Investments — continued
| (5) | Variable rate security. The stated interest rate represents the rate in effect at August 31, 2014. |
| (6) | Security exempt from registration under Regulation S of the Securities Act of 1933, which exempts from registration securities offered and sold outside the United States. Security may not be offered or sold in the United States except pursuant to an exemption from, or in a transaction not subject to, the registration requirements of the Securities Act of 1933. At August 31, 2014, the aggregate value of these securities is $5,859,107 or 0.4% of the Fund’s net assets. |
| (7) | Affiliated investment company, available to Eaton Vance portfolios and funds, which invests in high quality, U.S. dollar denominated money market instruments. The rate shown is the annualized seven-day yield as of August 31, 2014. |
| | | | | | | | |
| Country Concentration of Portfolio (based on country of risk) | |
| | |
| | | | | | | | |
| Country | | Percentage of Total Investments | | | Value | |
United States | | | 88.2 | % | | $ | 1,857,344,459 | |
France | | | 4.0 | | | | 83,629,344 | |
Switzerland | | | 2.9 | | | | 61,145,841 | |
United Kingdom | | | 1.5 | | | | 31,469,498 | |
Ireland | | | 0.9 | | | | 18,637,191 | |
Cayman Islands | | | 0.8 | | | | 15,778,031 | |
Italy | | | 0.6 | | | | 13,098,000 | |
Brazil | | | 0.6 | | | | 13,031,948 | |
Netherlands | | | 0.4 | | | | 8,562,124 | |
China | | | 0.1 | | | | 2,444,000 | |
| | |
Total Investments | | | 100.0 | % | | $ | 2,105,140,436 | |
| | |
| | | | |
| | 10 | | See Notes to Financial Statements. |
Eaton Vance
Tax-Advantaged Dividend Income Fund
August 31, 2014
Statement of Assets and Liabilities
| | | | |
| Assets | | August 31, 2014 | |
Unaffiliated investments, at value (identified cost, $1,726,569,162) | | $ | 2,065,471,643 | |
Affiliated investment, at value (identified cost, $39,668,793) | | | 39,668,793 | |
Cash | | | 54,525 | |
Foreign currency, at value (identified cost, $3,313,381) | | | 3,202,289 | |
Dividends and interest receivable | | | 8,139,872 | |
Interest receivable from affiliated investment | | | 2,994 | |
Receivable for investments sold | | | 1,044,864 | |
Tax reclaims receivable | | | 4,966,912 | |
Total assets | | $ | 2,122,551,892 | |
|
| Liabilities | |
Notes payable | | $ | 447,000,000 | |
Payable for investments purchased | | | 2,360,252 | |
Payable to affiliate: | | | | |
Investment adviser fee | | | 1,495,269 | |
Accrued expenses | | | 523,011 | |
Total liabilities | | $ | 451,378,532 | |
Net Assets | | $ | 1,671,173,360 | |
|
| Sources of Net Assets | |
Common shares, $0.01 par value, unlimited number of shares authorized, 72,835,900 shares issued and outstanding | | $ | 728,359 | |
Additional paid-in capital | | | 1,382,213,413 | |
Accumulated net realized loss | | | (71,860,872 | ) |
Accumulated undistributed net investment income | | | 20,894,738 | |
Net unrealized appreciation | | | 339,197,722 | |
Net Assets | | $ | 1,671,173,360 | |
|
| Net Asset Value | |
($1,671,173,360 ÷ 72,835,900 common shares issued and outstanding) | | $ | 22.94 | |
| | | | |
| | 11 | | See Notes to Financial Statements. |
Eaton Vance
Tax-Advantaged Dividend Income Fund
August 31, 2014
Statement of Operations
| | | | |
| Investment Income | | Year Ended August 31, 2014 | |
Dividends (net of foreign taxes, $2,318,739) | | $ | 115,765,121 | |
Interest (net of foreign taxes, $11,705) | | | 9,826,222 | |
Interest income allocated from affiliated investment | | | 38,615 | |
Expenses allocated from affiliated investment | | | (4,892 | ) |
Total investment income | | $ | 125,625,066 | |
|
| Expenses | |
Investment adviser fee | | $ | 17,029,175 | |
Trustees’ fees and expenses | | | 68,000 | |
Custodian fee | | | 534,741 | |
Transfer and dividend disbursing agent fees | | | 19,486 | |
Legal and accounting services | | | 95,643 | |
Printing and postage | | | 162,278 | |
Interest expense and fees | | | 3,445,541 | |
Miscellaneous | | | 171,108 | |
Total expenses | | $ | 21,525,972 | |
Deduct — | | | | |
Reduction of custodian fee | | $ | 655 | |
Total expense reductions | | $ | 655 | |
| |
Net expenses | | $ | 21,525,317 | |
| |
Net investment income | | $ | 104,099,749 | |
|
| Realized and Unrealized Gain (Loss) | |
Net realized gain (loss) — | | | | |
Investment transactions | | $ | 159,083,032 | |
Investment transactions allocated from affiliated investment | | | 267 | |
Proceeds from securities litigation settlements | | | 1,424,224 | |
Foreign currency and forward foreign currency exchange contract transactions | | | (2,072,624 | ) |
Net realized gain | | $ | 158,434,899 | |
Change in unrealized appreciation (depreciation) — | | | | |
Investments | | $ | 86,009,585 | |
Foreign currency and forward foreign currency exchange contracts | | | (1,009,332 | ) |
Net change in unrealized appreciation (depreciation) | | $ | 85,000,253 | |
| |
Net realized and unrealized gain | | $ | 243,435,152 | |
| |
Net increase in net assets from operations | | $ | 347,534,901 | |
| | | | |
| | 12 | | See Notes to Financial Statements. |
Eaton Vance
Tax-Advantaged Dividend Income Fund
August 31, 2014
Statements of Changes in Net Assets
| | | | | | | | |
| | | Year Ended August 31, | |
| Increase (Decrease) in Net Assets | | 2014 | | | 2013 | |
From operations — | | | | | | | | |
Net investment income | | $ | 104,099,749 | | | $ | 101,201,402 | |
Net realized gain from investment, foreign currency and forward foreign currency exchange contract transactions and proceeds from securities litigation settlements | | | 158,434,899 | | | | 75,567,436 | |
Net change in unrealized appreciation (depreciation) from investments, foreign currency and forward foreign currency exchange contracts | | | 85,000,253 | | | | 4,577,541 | |
Net increase in net assets from operations | | $ | 347,534,901 | | | $ | 181,346,379 | |
Distributions to shareholders — | | | | | | | | |
From net investment income | | $ | (96,376,462 | ) | | $ | (93,958,310 | ) |
Total distributions | | $ | (96,376,462 | ) | | $ | (93,958,310 | ) |
| | |
Net increase in net assets | | $ | 251,158,439 | | | $ | 87,388,069 | |
|
| Net Assets | |
At beginning of year | | $ | 1,420,014,921 | | | $ | 1,332,626,852 | |
At end of year | | $ | 1,671,173,360 | | | $ | 1,420,014,921 | |
|
Accumulated undistributed net investment income included in net assets | |
At end of year | | $ | 20,894,738 | | | $ | 13,155,214 | |
| | | | |
| | 13 | | See Notes to Financial Statements. |
Eaton Vance
Tax-Advantaged Dividend Income Fund
August 31, 2014
Statement of Cash Flows
| | | | |
| Cash Flows From Operating Activities | | Year Ended August 31, 2014 | |
Net increase in net assets from operations | | $ | 347,534,901 | |
Adjustments to reconcile net increase in net assets from operations to net cash provided by operating activities: | | | | |
Investments purchased | | | (1,385,172,274 | ) |
Investments sold | | | 1,399,613,979 | |
Increase in short-term investments, net | | | (23,737,883 | ) |
Net amortization/accretion of premium (discount) | | | 57,521 | |
Decrease in restricted cash | | | 1,476,000 | |
Decrease in dividends and interest receivable | | | 172,119 | |
Increase in interest receivable from affiliated investment | | | (1,316 | ) |
Decrease in receivable for open forward foreign currency exchange contracts | | | 950,637 | |
Decrease in tax reclaims receivable | | | 298,149 | |
Increase in payable to affiliate for investment adviser fee | | | 121,945 | |
Decrease in accrued expenses | | | (18,119 | ) |
Net change in unrealized (appreciation) depreciation from investments | | | (86,009,585 | ) |
Net realized gain from investments | | | (159,083,032 | ) |
Net cash provided by operating activities | | $ | 96,203,042 | |
|
| Cash Flows From Financing Activities | |
Distributions paid to common shareholders, net of reinvestments | | $ | (96,376,462 | ) |
Net cash used in financing activities | | $ | (96,376,462 | ) |
| |
Net decrease in cash* | | $ | (173,420 | ) |
| |
Cash at beginning of year(1) | | $ | 3,430,234 | |
| |
Cash at end of year(1) | | $ | 3,256,814 | |
|
| Supplemental disclosure of cash flow information: | |
Cash paid for interest and fees on borrowings | | $ | 3,456,900 | |
| (1) | Balance includes foreign currency, at value. |
| * | Includes net change in unrealized appreciation (depreciation) on foreign currency of $(53,527). |
| | | | |
| | 14 | | See Notes to Financial Statements. |
Eaton Vance
Tax-Advantaged Dividend Income Fund
August 31, 2014
Financial Highlights
Selected data for a common share outstanding during the periods stated
| | | | | | | | | | | | | | | | | | | | |
| | | Year Ended August 31, | |
| | | 2014 | | | 2013 | | | 2012 | | | 2011 | | | 2010 | |
Net asset value — Beginning of year (Common shares) | | $ | 19.500 | | | $ | 18.300 | | | $ | 16.780 | | | $ | 15.950 | | | $ | 15.320 | |
| | | | | |
| Income (Loss) From Operations | | | | | | | | | | | | | | | | | | | | |
Net investment income(1) | | $ | 1.429 | (2) | | $ | 1.389 | | | $ | 1.202 | | | $ | 1.354 | (3) | | $ | 1.331 | |
Net realized and unrealized gain | | | 3.334 | | | | 1.101 | | | | 1.608 | | | | 0.766 | | | | 0.589 | |
| | | | | |
Total income from operations | | $ | 4.763 | | | $ | 2.490 | | | $ | 2.810 | | | $ | 2.120 | | | $ | 1.920 | |
| | | | | |
| Less Distributions to Common Shareholders | | | | | | | | | | | | | | | | | | | | |
From net investment income | | $ | (1.323 | ) | | $ | (1.290 | ) | | $ | (1.290 | ) | | $ | (1.290 | ) | | $ | (1.290 | ) |
| | | | | |
Total distributions to common shareholders | | $ | (1.323 | ) | | $ | (1.290 | ) | | $ | (1.290 | ) | | $ | (1.290 | ) | | $ | (1.290 | ) |
| | | | | |
Net asset value — End of year (Common shares) | | $ | 22.940 | | | $ | 19.500 | | | $ | 18.300 | | | $ | 16.780 | | | $ | 15.950 | |
| | | | | |
Market value — End of year (Common shares) | | $ | 20.560 | | | $ | 17.630 | | | $ | 16.600 | | | $ | 15.160 | | | $ | 14.750 | |
| | | | | |
Total Investment Return on Net Asset Value(4) | | | 25.90 | % | | | 14.45 | % | | | 18.42 | % | | | 13.58 | % | | | 13.25 | % |
| | | | | |
Total Investment Return on Market Value(4) | | | 24.80 | % | | | 14.09 | % | | | 18.87 | % | | | 10.96 | % | | | 15.26 | % |
| | | | | |
| Ratios/Supplemental Data | | | | | | | | | | | | | | | | | | | | |
Net assets applicable to common shares, end of year (000’s omitted) | | $ | 1,671,173 | | | $ | 1,420,015 | | | $ | 1,332,627 | | | $ | 1,222,187 | | | $ | 1,161,717 | |
Ratios (as a percentage of average daily net assets applicable to common shares): | | | | | | | | | | | | | | | | | | | | |
Expenses excluding interest and fees(5) | | | 1.15 | % | | | 1.19 | % | | | 1.23 | % | | | 1.13 | % | | | 1.04 | % |
Interest and fee expense | | | 0.22 | % | | | 0.30 | % | | | 0.45 | % | | | 0.36 | % | | | 0.39 | % |
Total expenses(5) | | | 1.37 | % | | | 1.49 | % | | | 1.68 | % | | | 1.49 | % | | | 1.43 | % |
Net investment income | | | 6.63 | %(2) | | | 7.14 | % | | | 6.93 | % | | | 7.47 | %(3) | | | 8.09 | % |
Portfolio Turnover | | | 68 | % | | | 84 | % | | | 94 | % | | | 86 | % | | | 117 | % |
Senior Securities: | | | | | | | | | | | | | | | | | | | | |
Total notes payable outstanding (in 000’s) | | $ | 447,000 | | | $ | 447,000 | | | $ | 447,000 | | | $ | 447,000 | | | $ | 340,000 | |
Asset coverage per $1,000 of notes payable(6) | | $ | 4,739 | | | $ | 4,177 | | | $ | 3,981 | | | $ | 3,734 | | | $ | 4,417 | |
| (1) | Computed using average common shares outstanding. |
| (2) | Net investment income per share reflects special dividends which amounted to $0.501 per share. Excluding special dividends, the ratio of net investment income to average daily net assets applicable to common shares would have been 4.30%. |
| (3) | Net investment income per share reflects special dividends which amounted to $0.191 per share. Excluding special dividends, the ratio of net investment income to average daily net assets applicable to common shares would have been 6.41%. |
| (4) | Returns are historical and are calculated by determining the percentage change in net asset value or market value with all distributions reinvested. Distributions are assumed to be reinvested at prices obtained under the Fund’s dividend reinvestment plan. |
| (5) | Excludes the effect of custody fee credits, if any, of less than 0.005%. |
| (6) | Calculated by subtracting the Fund’s total liabilities (not including the notes payable) from the Fund’s total assets, and dividing the result by the notes payable balance in thousands. |
| | | | |
| | 15 | | See Notes to Financial Statements. |
Eaton Vance
Tax-Advantaged Dividend Income Fund
August 31, 2014
Notes to Financial Statements
1 Significant Accounting Policies
Eaton Vance Tax-Advantaged Dividend Income Fund (the Fund) is a Massachusetts business trust registered under the Investment Company Act of 1940, as amended (the 1940 Act), as a diversified, closed-end management investment company. The Fund’s investment objective is to provide a high level of after-tax total return consisting primarily of tax-advantaged dividend income and capital appreciation. The Fund pursues its objective by investing primarily in dividend-paying common and preferred stocks.
The following is a summary of significant accounting policies of the Fund. The policies are in conformity with accounting principles generally accepted in the United States of America.
A Investment Valuation — The following methodologies are used to determine the market value or fair value of investments.
Equity Securities. Equity securities listed on a U.S. securities exchange generally are valued at the last sale or closing price on the day of valuation or, if no sales took place on such date, at the mean between the closing bid and asked prices therefore on the exchange where such securities are principally traded. Equity securities listed on the NASDAQ Global or Global Select Market generally are valued at the NASDAQ official closing price. Unlisted or listed securities for which closing sales prices or closing quotations are not available are valued at the mean between the latest available bid and asked prices or, in the case of preferred equity securities that are not listed or traded in the over-the-counter market, by a third party pricing service that will use various techniques that consider factors including, but not limited to, prices or yields of securities with similar characteristics, benchmark yields, broker/dealer quotes, quotes of underlying common stock, issuer spreads, as well as industry and economic events. The value of preferred equity securities that are valued by a pricing service on a bond basis will be adjusted by an income factor, to be determined by the investment adviser, to reflect the next anticipated regular dividend.
Debt Obligations. Debt obligations (including short-term obligations with a remaining maturity of more than sixty days) are generally valued on the basis of valuations provided by third party pricing services, as derived from such services’ pricing models. Inputs to the models may include, but are not limited to, reported trades, executable bid and asked prices, broker/dealer quotations, prices or yields of securities with similar characteristics, interest rates, anticipated prepayments, benchmark curves or information pertaining to the issuer, as well as industry and economic events. The pricing services may use a matrix approach, which considers information regarding securities with similar characteristics to determine the valuation for a security. Short-term obligations purchased with a remaining maturity of sixty days or less are generally valued at amortized cost, which approximates market value.
Foreign Securities and Currencies. Foreign securities and currencies are valued in U.S. dollars, based on foreign currency exchange rate quotations supplied by a third party pricing service. The pricing service uses a proprietary model to determine the exchange rate. Inputs to the model include reported trades and implied bid/ask spreads. The daily valuation of exchange-traded foreign securities generally is determined as of the close of trading on the principal exchange on which such securities trade. Events occurring after the close of trading on foreign exchanges may result in adjustments to the valuation of foreign securities to more accurately reflect their fair value as of the close of regular trading on the New York Stock Exchange. When valuing foreign equity securities that meet certain criteria, the Fund’s Trustees have approved the use of a fair value service that values such securities to reflect market trading that occurs after the close of the applicable foreign markets of comparable securities or other instruments that have a strong correlation to the fair-valued securities.
Derivatives. Forward foreign currency exchange contracts are generally valued at the mean of the average bid and average asked prices that are reported by currency dealers to a third party pricing service at the valuation time. Such third party pricing service valuations are supplied for specific settlement periods and the Fund’s forward foreign currency exchange contracts are valued at an interpolated rate between the closest preceding and subsequent settlement period reported by the third party pricing service.
Affiliated Fund. The Fund may invest in Eaton Vance Cash Reserves Fund, LLC (Cash Reserves Fund), an affiliated investment company managed by Eaton Vance Management (EVM). The value of the Fund’s investment in Cash Reserves Fund reflects the Fund’s proportionate interest in its net assets. Cash Reserves Fund generally values its investment securities utilizing the amortized cost valuation technique in accordance with Rule 2a-7 under the 1940 Act. This technique involves initially valuing a portfolio security at its cost and thereafter assuming a constant amortization to maturity of any discount or premium. If amortized cost is determined not to approximate fair value, Cash Reserves Fund may value its investment securities in the same manner as debt obligations described above.
Fair Valuation. Investments for which valuations or market quotations are not readily available or are deemed unreliable are valued at fair value using methods determined in good faith by or at the direction of the Trustees of the Fund in a manner that fairly reflects the security’s value, or the amount that the Fund might reasonably expect to receive for the security upon its current sale in the ordinary course. Each such determination is based on a consideration of relevant factors, which are likely to vary from one pricing context to another. These factors may include, but are not limited to, the type of security, the existence of any contractual restrictions on the security’s disposition, the price and extent of public trading in similar securities of the issuer or of comparable companies or entities, quotations or relevant information obtained from broker/dealers or other market participants, information obtained from the issuer, analysts, and/or the appropriate stock exchange (for exchange-traded securities), an analysis of the company’s or entity’s financial condition, and an evaluation of the forces that influence the issuer and the market(s) in which the security is purchased and sold.
B Investment Transactions — Investment transactions for financial statement purposes are accounted for on a trade date basis. Realized gains and losses on investments sold are determined on the basis of identified cost.
C Income — Dividend income is recorded on the ex-dividend date for dividends received in cash and/or securities. However, if the ex-dividend date has passed, certain dividends from foreign securities are recorded as the Fund is informed of the ex-dividend date. Withholding taxes on foreign dividends and
Eaton Vance
Tax-Advantaged Dividend Income Fund
August 31, 2014
Notes to Financial Statements — continued
capital gains have been provided for in accordance with the Fund’s understanding of the applicable countries’ tax rules and rates. Interest income is recorded on the basis of interest accrued, adjusted for amortization of premium or accretion of discount.
D Federal Taxes — The Fund’s policy is to comply with the provisions of the Internal Revenue Code applicable to regulated investment companies and to distribute to shareholders each year substantially all of its net investment income, and all or substantially all of its net realized capital gains. Accordingly, no provision for federal income or excise tax is necessary.
At August 31, 2014, the Fund, for federal income tax purposes, had a capital loss carryforward of $50,826,719 which will reduce its taxable income arising from future net realized gains on investment transactions, if any, to the extent permitted by the Internal Revenue Code, and thus will reduce the amount of distributions to shareholders, which would otherwise be necessary to relieve the Fund of any liability for federal income or excise tax. Such capital loss carryforward will expire on August 31, 2018. In addition, such capital loss carryforward cannot be utilized prior to the utilization of new capital losses, if any, created after August 31, 2014.
During the year ended August 31, 2014, a capital loss carryforward of $161,028,290 was utilized to offset net realized gains by the Fund.
Additionally, at August 31, 2014, the Fund had a net capital loss of $20,833,378 attributable to security transactions incurred after October 31, 2013. This net capital loss is treated as arising on the first day of the Fund’s taxable year ending August 31, 2015.
As of August 31, 2014, the Fund had no uncertain tax positions that would require financial statement recognition, de-recognition, or disclosure. The Fund files a U.S. federal income tax return annually after its fiscal year-end, which is subject to examination by the Internal Revenue Service for a period of three years from the date of filing.
E Expense Reduction — State Street Bank and Trust Company (SSBT) serves as custodian of the Fund. Pursuant to the custodian agreement, SSBT receives a fee reduced by credits, which are determined based on the average daily cash balance the Fund maintains with SSBT. All credit balances, if any, used to reduce the Fund’s custodian fees are reported as a reduction of expenses in the Statement of Operations.
F Foreign Currency Translation — Investment valuations, other assets, and liabilities initially expressed in foreign currencies are translated each business day into U.S. dollars based upon current exchange rates. Purchases and sales of foreign investment securities and income and expenses denominated in foreign currencies are translated into U.S. dollars based upon currency exchange rates in effect on the respective dates of such transactions. Recognized gains or losses on investment transactions attributable to changes in foreign currency exchange rates are recorded for financial statement purposes as net realized gains and losses on investments. That portion of unrealized gains and losses on investments that results from fluctuations in foreign currency exchange rates is not separately disclosed.
G Use of Estimates — The preparation of the financial statements in conformity with accounting principles generally accepted in the United States of America requires management to make estimates and assumptions that affect the reported amounts of assets and liabilities at the date of the financial statements and the reported amounts of income and expense during the reporting period. Actual results could differ from those estimates.
H Indemnifications — Under the Fund’s organizational documents, its officers and Trustees may be indemnified against certain liabilities and expenses arising out of the performance of their duties to the Fund. Under Massachusetts law, if certain conditions prevail, shareholders of a Massachusetts business trust (such as the Fund) could be deemed to have personal liability for the obligations of the Fund. However, the Fund’s Declaration of Trust contains an express disclaimer of liability on the part of Fund shareholders and the By-laws provide that the Fund shall assume the defense on behalf of any Fund shareholders. Moreover, the By-laws also provide for indemnification out of Fund property of any shareholder held personally liable solely by reason of being or having been a shareholder for all loss or expense arising from such liability. Additionally, in the normal course of business, the Fund enters into agreements with service providers that may contain indemnification clauses. The Fund’s maximum exposure under these arrangements is unknown as this would involve future claims that may be made against the Fund that have not yet occurred.
I Forward Foreign Currency Exchange Contracts — The Fund may enter into forward foreign currency exchange contracts for the purchase or sale of a specific foreign currency at a fixed price on a future date. The forward foreign currency exchange contracts are adjusted by the daily exchange rate of the underlying currency and any gains or losses are recorded as unrealized until such time as the contracts have been closed. Risks may arise upon entering these contracts from the potential inability of counterparties to meet the terms of their contracts and from movements in the value of a foreign currency relative to the U.S. dollar.
J Statement of Cash Flows — The cash amount shown in the Statement of Cash Flows of the Fund is the amount included in the Fund’s Statement of Assets and Liabilities and represents the unrestricted cash on hand at its custodian and does not include any short-term investments.
2 Distributions to Shareholders
The Fund intends to make monthly distributions of net investment income to common shareholders. In addition, at least annually, the Fund intends to distribute all or substantially all of its net realized capital gains (reduced by available capital loss carryforwards from prior years). Distributions are recorded on the ex-dividend date. The Fund distinguishes between distributions on a tax basis and a financial reporting basis. Accounting principles generally accepted in the United States of America require that only distributions in excess of tax basis earnings and profits be reported in the financial statements as
Eaton Vance
Tax-Advantaged Dividend Income Fund
August 31, 2014
Notes to Financial Statements — continued
a return of capital. Permanent differences between book and tax accounting relating to distributions are reclassified to paid-in capital. For tax purposes, distributions from short-term capital gains are considered to be from ordinary income.
The tax character of distributions declared for the years ended August 31, 2014 and August 31, 2013 was as follows:
| | | | | | | | |
| | | Year Ended August 31, | |
| | | 2014 | | | 2013 | |
| | |
Distributions declared from: | | | | | | | | |
Ordinary income | | $ | 96,376,462 | | | $ | 93,958,310 | |
During the year ended August 31, 2014, accumulated net realized loss was increased by $16,237 and accumulated undistributed net investment income was increased by $16,237 due to differences between book and tax accounting, primarily for foreign currency gain (loss), premium amortization, accretion of market discount distributions from real estate investment trusts (REITs) and investments in partnerships. These reclassifications had no effect on the net assets or net asset value per share of the Fund.
As of August 31, 2014, the components of distributable earnings (accumulated losses) and unrealized appreciation (depreciation) on a tax basis were as follows:
| | | | |
Undistributed ordinary income | | $ | 20,637,953 | |
Capital loss carryforward and post October capital losses | | $ | (71,660,097 | ) |
Net unrealized appreciation | | $ | 339,253,733 | |
The differences between components of distributable earnings (accumulated losses) on a tax basis and the amounts reflected in the Statement of Assets and Liabilities are primarily due to investments in partnerships, distributions from REITs, premium amortization and accretion of market discount.
3 Investment Adviser Fee and Other Transactions with Affiliates
The investment adviser fee is earned by EVM as compensation for management and investment advisory services rendered to the Fund. Pursuant to the investment advisory agreement and subsequent fee reduction agreement, the fee is computed at an annual rate of 0.85% of the Fund’s average daily gross assets up to and including $1.5 billion, 0.83% over $1.5 billion up to and including $3 billion, and at reduced rates as daily gross assets exceed $3 billion and is payable monthly. Gross assets as referred to herein represent net assets plus obligations attributable to investment leverage. The fee reduction cannot be terminated without the consent of the Trustees and shareholders. For the year ended August 31, 2014, the Fund’s investment adviser fee amounted to $17,029,175 or 0.85% of the Fund’s average daily gross assets. EVM also serves as administrator of the Fund, but receives no compensation. The Fund invests its cash in Cash Reserves Fund. EVM does not currently receive a fee for advisory services provided to Cash Reserves Fund.
During the year ended August 31, 2014, EVM reimbursed the Fund $2,403 for a trading error. The effect of the loss incurred and the reimbursement by EVM of such amount had no impact on total return.
Trustees and officers of the Fund who are members of EVM’s organization receive remuneration for their services to the Fund out of the investment adviser fee. Trustees of the Fund who are not affiliated with EVM may elect to defer receipt of all or a percentage of their annual fees in accordance with the terms of the Trustees Deferred Compensation Plan. For the year ended August 31, 2014, no significant amounts have been deferred. Certain officers and Trustees of the Fund are officers of EVM.
4 Purchases and Sales of Investments
Purchases and sales of investments, other than short-term obligations, aggregated $1,338,135,826 and $1,366,136,569, respectively, for the year ended August 31, 2014.
5 Common Shares of Beneficial Interest
The Fund may issue common shares pursuant to its dividend reinvestment plan. There were no common shares issued by the Fund for the years ended August 31, 2014 and August 31, 2013.
Eaton Vance
Tax-Advantaged Dividend Income Fund
August 31, 2014
Notes to Financial Statements — continued
On November 11, 2013, the Board of Trustees of the Fund authorized the repurchase by the Fund of up to 10% of its then currently outstanding common shares in open-market transactions at a discount to net asset value. The repurchase program does not obligate the Fund to purchase a specific amount of shares. There were no repurchases of common shares by the Fund for the year ended August 31, 2014.
6 Federal Income Tax Basis of Investments
The cost and unrealized appreciation (depreciation) of investments of the Fund at August 31, 2014, as determined on a federal income tax basis, were as follows:
| | | | |
| |
Aggregate cost | | $ | 1,766,181,945 | |
| |
Gross unrealized appreciation | | $ | 352,444,434 | |
Gross unrealized depreciation | | | (13,485,943 | ) |
| |
Net unrealized appreciation | | $ | 338,958,491 | |
7 Financial Instruments
The Fund may trade in financial instruments with off-balance sheet risk in the normal course of its investing activities. These financial instruments may include forward foreign currency exchange contracts and may involve, to a varying degree, elements of risk in excess of the amounts recognized for financial statement purposes. The notional or contractual amounts of these instruments represent the investment the Fund has in particular classes of financial instruments and do not necessarily represent the amounts potentially subject to risk. The measurement of the risks associated with these instruments is meaningful only when all related and offsetting transactions are considered.
At August 31, 2014, there were no obligations outstanding under these financial instruments.
The Fund is subject to foreign exchange risk in the normal course of pursuing its investment objective. Because the Fund holds foreign currency denominated investments, the value of these investments and related receivables and payables may change due to future changes in foreign currency exchange rates. To hedge against this risk, the Fund entered into forward foreign currency exchange contracts.
The Fund enters into forward foreign currency exchange contracts that may contain provisions whereby the counterparty may terminate the contract under certain conditions, including but not limited to a decline in the Fund’s net assets below a certain level over a certain period of time, which would trigger a payment by the Fund for those derivatives in a liability position. At August 31, 2014 the Fund had no open derivatives with credit-related contingent features in a net liability position.
The over-the-counter (OTC) derivatives in which the Fund invests are subject to the risk that the counterparty to the contract fails to perform its obligations under the contract. To mitigate this risk, the Fund has entered into an International Swaps and Derivatives Association, Inc. Master Agreement (“ISDA Master Agreement”) or similar agreement with substantially all its derivative counterparties. An ISDA Master Agreement is a bilateral agreement between the Fund and a counterparty that governs certain OTC derivatives and typically contains, among other things, set-off provisions in the event of a default and/or termination event as defined under the relevant ISDA Master Agreement. Under an ISDA Master Agreement, the Fund may, under certain circumstances, offset with the counterparty certain derivative financial instruments’ payables and/or receivables with collateral held and/or posted and create one single net payment. The provisions of the ISDA Master Agreement typically permit a single net payment in the event of default including the bankruptcy or insolvency of the counterparty. However, bankruptcy or insolvency laws of a particular jurisdiction may impose restrictions on or prohibitions against the right of offset in bankruptcy or insolvency. Certain ISDA Master Agreements allow counterparties to OTC derivatives to terminate derivative contracts prior to maturity in the event the Fund’s net assets decline by a stated percentage or the Fund fails to meet the terms of its ISDA Master Agreement, which would cause the counterparty to accelerate payment by the Fund of any net liability owed to it.
The collateral requirements for derivatives traded under an ISDA Master Agreement are governed by a Credit Support Annex to the ISDA Master Agreement. Collateral requirements are determined at the close of business each day and are typically based on changes in market values for each transaction under an ISDA Master Agreement and netted into one amount for such agreement. Generally, the amount of collateral due from or to a counterparty is subject to a minimum transfer threshold amount before a transfer is required, which may vary by counterparty. Collateral pledged for the benefit of the Fund and/or counterparty is held in segregated accounts by the Fund’s custodian and cannot be sold, re-pledged, assigned or otherwise used while pledged. The portion of such collateral representing cash, if any, is reflected as restricted cash and, in the case of cash pledged by a counterparty for the benefit of the Fund, a corresponding liability on the Statement of Assets and Liabilities. Securities pledged by the Fund as collateral, if any, are identified as such in the Portfolio of Investments.
Eaton Vance
Tax-Advantaged Dividend Income Fund
August 31, 2014
Notes to Financial Statements — continued
The effect of derivative instruments (not considered to be hedging instruments for accounting disclosure purposes) on the Statement of Operations and whose primary underlying risk exposure is foreign exchange risk for the year ended August 31, 2014 was as follows:
| | | | | | | | |
| Derivative | | Realized Gain (Loss)
on Derivatives Recognized
in Income | | | Change in Unrealized
Appreciation (Depreciation) on
Derivatives Recognized in Income | |
| | |
Forward foreign currency exchange contracts | | $ | (1,725,003 | )(1) | | $ | (950,637 | )(2) |
| (1) | Statement of Operations location: Net realized gain (loss) – Foreign currency and forward foreign currency exchange contract transactions. |
| (2) | Statement of Operations location: Change in unrealized appreciation (depreciation) – Foreign currency and forward foreign currency exchange contracts. |
The average notional amount of forward foreign currency exchange contracts outstanding during the year ended August 31, 2014, which is indicative of the volume of this derivative type, was approximately $138,367,000.
8 Committed Facility Agreement
The Fund entered into a Committed Facility Agreement (the Agreement) with a major financial institution that allows it to borrow up to $525 million through December 25, 2014. Interest is charged at a rate above 1-month LIBOR and is payable monthly. The Fund is charged a commitment fee of 0.25% per annum on the unused portion of the commitment if outstanding borrowings are less than 85% of the borrowing limit. Under the terms of the Agreement, the Fund is required to satisfy certain collateral requirements and maintain a certain level of net assets. At August 31, 2014, the Fund had borrowings outstanding under the Agreement of $447 million at an interest rate of 0.76%. The carrying amount of the borrowings at August 31, 2014 approximated its fair value. If measured at fair value, borrowings under the Agreement would have been considered as Level 2 in the fair value hierarchy (see Note 10) at August 31, 2014. For the year ended August 31, 2014, the average borrowings under the agreement and the average interest rate (excluding fees) were $447 million and 0.78%, respectively.
9 Risks Associated with Foreign Investments
Investing in securities issued by companies whose principal business activities are outside the United States may involve significant risks not present in domestic investments. For example, there is generally less publicly available information about foreign companies, particularly those not subject to the disclosure and reporting requirements of the U.S. securities laws. Certain foreign issuers are generally not bound by uniform accounting, auditing, and financial reporting requirements and standards of practice comparable to those applicable to domestic issuers. Investments in foreign securities also involve the risk of possible adverse changes in investment or exchange control regulations, expropriation or confiscatory taxation, limitation on the removal of funds or other assets of the Fund, political or financial instability or diplomatic and other developments which could affect such investments. Foreign securities markets, while growing in volume and sophistication, are generally not as developed as those in the United States, and securities of some foreign issuers (particularly those located in developing countries) may be less liquid and more volatile than securities of comparable U.S. companies. In general, there is less overall governmental supervision and regulation of foreign securities markets, broker/dealers and issuers than in the United States.
10 Fair Value Measurements
Under generally accepted accounting principles for fair value measurements, a three-tier hierarchy to prioritize the assumptions, referred to as inputs, is used in valuation techniques to measure fair value. The three-tier hierarchy of inputs is summarized in the three broad levels listed below.
| Ÿ | | Level 1 – quoted prices in active markets for identical investments |
| Ÿ | | Level 2 – other significant observable inputs (including quoted prices for similar investments, interest rates, prepayment speeds, credit risk, etc.) |
| Ÿ | | Level 3 – significant unobservable inputs (including a fund’s own assumptions in determining the fair value of investments) |
In cases where the inputs used to measure fair value fall in different levels of the fair value hierarchy, the level disclosed is determined based on the lowest level input that is significant to the fair value measurement in its entirety. The inputs or methodology used for valuing securities are not necessarily an indication of the risk associated with investing in those securities.
Eaton Vance
Tax-Advantaged Dividend Income Fund
August 31, 2014
Notes to Financial Statements — continued
At August 31, 2014, the hierarchy of inputs used in valuing the Fund’s investments, which are carried at value, were as follows:
| | | | | | | | | | | | | | | | |
| Asset Description | | Level 1 | | | Level 2 | | | Level 3 | | | Total | |
| | | | |
Common Stocks | | | | | | | | | | | | | | | | |
Consumer Discretionary | | $ | 105,770,169 | | | $ | — | | | $ | — | | | $ | 105,770,169 | |
Consumer Staples | | | 65,345,603 | | | | — | | | | — | | | | 65,345,603 | |
Energy | | | 184,908,014 | | | | 20,226,860 | | | | — | | | | 205,134,874 | |
Financials | | | 386,305,285 | | | | 17,395,209 | | | | — | | | | 403,700,494 | |
Health Care | | | 150,898,867 | | | | 46,393,232 | | | | — | | | | 197,292,099 | |
Industrials | | | 169,718,185 | | | | — | | | | — | | | | 169,718,185 | |
Information Technology | | | 120,940,973 | | | | — | | | | — | | | | 120,940,973 | |
Materials | | | 62,079,109 | | | | — | | | | — | | | | 62,079,109 | |
Telecommunication Services | | | 28,921,400 | | | | — | | | | — | | | | 28,921,400 | |
Utilities | | | 73,536,123 | | | | — | | | | — | | | | 73,536,123 | |
| | | | |
Total Common Stocks | | $ | 1,348,423,728 | | | $ | 84,015,301 | * | | $ | — | | | $ | 1,432,439,029 | |
| | | | |
Preferred Stocks | | | | | | | | | | | | | | | | |
Consumer Staples | | $ | — | | | $ | 15,316,969 | | | $ | — | | | $ | 15,316,969 | |
Energy | | | — | | | | 7,653,285 | | | | — | | | | 7,653,285 | |
Financials | | | 130,541,212 | | | | 263,703,789 | | | | — | | | | 394,245,001 | |
Industrials | | | — | | | | 16,158,395 | | | | — | | | | 16,158,395 | |
Utilities | | | 3,494,580 | | | | 32,142,605 | | | | — | | | | 35,637,185 | |
| | | | |
Total Preferred Stocks | | $ | 134,035,792 | | | $ | 334,975,043 | | | $ | — | | | $ | 469,010,835 | |
| | | | |
Corporate Bonds & Notes | | $ | — | | | $ | 164,021,779 | | | $ | — | | | $ | 164,021,779 | |
Short-Term Investments | | | — | | | | 39,668,793 | | | | — | | | | 39,668,793 | |
| | | | |
Total Investments | | $ | 1,482,459,520 | | | $ | 622,680,916 | | | $ | — | | | $ | 2,105,140,436 | |
| * | Includes foreign equity securities whose values were adjusted to reflect market trading of comparable securities or other correlated instruments that occurred after the close of trading in their applicable foreign markets. |
The Fund held no investments or other financial instruments as of August 31, 2013 whose fair value was determined using Level 3 inputs. At August 31, 2014, the value of investments transferred between Level 1 and Level 2 during the year then ended was not significant.
Eaton Vance
Tax-Advantaged Dividend Income Fund
August 31, 2014
Report of Independent Registered Public Accounting Firm
To the Trustees and Shareholders of Eaton Vance Tax-Advantaged Dividend Income Fund:
We have audited the accompanying statement of assets and liabilities of Eaton Vance Tax-Advantaged Dividend Income Fund (the “Fund”), including the portfolio of investments, as of August 31, 2014, and the related statements of operations and cash flows for the year then ended, the statements of changes in net assets for each of the two years in the period then ended, and the financial highlights for each of the five years in the period then ended. These financial statements and financial highlights are the responsibility of the Fund’s management. Our responsibility is to express an opinion on these financial statements and financial highlights based on our audits.
We conducted our audits in accordance with the standards of the Public Company Accounting Oversight Board (United States). Those standards require that we plan and perform the audit to obtain reasonable assurance about whether the financial statements and financial highlights are free of material misstatement. The Fund is not required to have, nor were we engaged to perform, an audit of its internal control over financial reporting. Our audits included consideration of internal control over financial reporting as a basis for designing audit procedures that are appropriate in the circumstances, but not for the purpose of expressing an opinion on the effectiveness of the Fund’s internal control over financial reporting. Accordingly, we express no such opinion. An audit also includes examining, on a test basis, evidence supporting the amounts and disclosures in the financial statements, assessing the accounting principles used and significant estimates made by management, as well as evaluating the overall financial statement presentation. Our procedures included confirmation of securities owned as of August 31, 2014, by correspondence with the custodian and brokers; where replies were not received from brokers, we performed other auditing procedures. We believe that our audits provide a reasonable basis for our opinion.
In our opinion, such financial statements and financial highlights referred to above present fairly, in all material respects, the financial position of Eaton Vance Tax-Advantaged Dividend Income Fund as of August 31, 2014, the results of its operations and its cash flows for the year then ended, the changes in its net assets for each of the two years in the period then ended, and the financial highlights for each of the five years in the period then ended, in conformity with accounting principles generally accepted in the United States of America.
DELOITTE & TOUCHE LLP
Boston, Massachusetts
October 16, 2014
Eaton Vance
Tax-Advantaged Dividend Income Fund
August 31, 2014
Federal Tax Information (Unaudited)
The Form 1099-DIV you receive in February 2015 will show the tax status of all distributions paid to your account in calendar year 2014. Shareholders are advised to consult their own tax adviser with respect to the tax consequences of their investment in the Fund. As required by the Internal Revenue Code and/or regulations, shareholders must be notified regarding the status of qualified dividend income for individuals and the dividends received deduction for corporations.
Qualified Dividend Income. For the fiscal year ended August 31, 2014, the Fund designates approximately $113,427,186, or up to the maximum amount of such dividends allowable pursuant to the Internal Revenue Code, as qualified dividend income eligible for the reduced tax rate of 15%.
Dividends Received Deduction. Corporate shareholders are generally entitled to take the dividends received deduction on the portion of the Fund’s dividend distribution that qualifies under tax law. For the Fund’s fiscal 2014 ordinary income dividends, 51.69% qualifies for the corporate dividends received deduction.
Eaton Vance
Tax-Advantaged Dividend Income Fund
August 31, 2014
Annual Meeting of Shareholders (Unaudited)
The Fund held its Annual Meeting of Shareholders on June 19, 2014. The following action was taken by the shareholders:
Item 1: The election of Thomas E. Faust Jr., William H. Park and Harriett Tee Taggart as Class II Trustees of the Fund for a three-year term expiring in 2017.
| | | | | | | | |
Nominee for Trustee Elected by All Shareholders | | Number of Shares | |
| | For | | | Withheld | |
Thomas E. Faust Jr. | | | 63,366,902 | | | | 2,566,152 | |
William H. Park | | | 63,304,508 | | | | 2,628,546 | |
Harriett Tee Taggart | | | 63,089,205 | | | | 2,843,849 | |
Eaton Vance
Tax-Advantaged Dividend Income Fund
August 31, 2014
Dividend Reinvestment Plan
The Fund offers a dividend reinvestment plan (Plan) pursuant to which shareholders may elect to have distributions automatically reinvested in common shares (Shares) of the Fund. You may elect to participate in the Plan by completing the Dividend Reinvestment Plan Application Form. If you do not participate, you will receive all distributions in cash paid by check mailed directly to you by American Stock Transfer & Trust Company, LLC (AST) as dividend paying agent. On the distribution payment date, if the NAV per Share is equal to or less than the market price per Share plus estimated brokerage commissions, then new Shares will be issued. The number of Shares shall be determined by the greater of the NAV per Share or 95% of the market price. Otherwise, Shares generally will be purchased on the open market by AST, the Plan agent (Agent). Distributions subject to income tax (if any) are taxable whether or not Shares are reinvested.
If your Shares are in the name of a brokerage firm, bank, or other nominee, you can ask the firm or nominee to participate in the Plan on your behalf. If the nominee does not offer the Plan, you will need to request that the Fund’s transfer agent re-register your Shares in your name or you will not be able to participate.
The Agent’s service fee for handling distributions will be paid by the Fund. Plan participants will be charged their pro rata share of brokerage commissions on all open-market purchases.
Plan participants may withdraw from the Plan at any time by writing to the Agent at the address noted on the following page. If you withdraw, you will receive Shares in your name for all Shares credited to your account under the Plan. If a participant elects by written notice to the Agent to sell part or all of his or her Shares and remit the proceeds, the Agent is authorized to deduct a $5.00 fee plus brokerage commissions from the proceeds.
If you wish to participate in the Plan and your Shares are held in your own name, you may complete the form on the following page and deliver it to the Agent. Any inquiries regarding the Plan can be directed to the Agent at 1-866-439-6787.
Eaton Vance
Tax-Advantaged Dividend Income Fund
August 31, 2014
Application for Participation in Dividend Reinvestment Plan
This form is for shareholders who hold their common shares in their own names. If your common shares are held in the name of a brokerage firm, bank, or other nominee, you should contact your nominee to see if it will participate in the Plan on your behalf. If you wish to participate in the Plan, but your brokerage firm, bank, or nominee is unable to participate on your behalf, you should request that your common shares be re-registered in your own name which will enable your participation in the Plan.
The following authorization and appointment is given with the understanding that I may terminate it at any time by terminating my participation in the Plan as provided in the terms and conditions of the Plan.
Please print exact name on account:
Shareholder signature Date
Shareholder signature Date
Please sign exactly as your common shares are registered. All persons whose names appear on the share certificate must sign.
YOU SHOULD NOT RETURN THIS FORM IF YOU WISH TO RECEIVE YOUR DISTRIBUTIONS IN CASH. THIS IS NOT A PROXY.
This authorization form, when signed, should be mailed to the following address:
Eaton Vance Tax-Advantaged Dividend Income Fund
c/o American Stock Transfer & Trust Company, LLC
P.O. Box 922
Wall Street Station
New York, NY 10269-0560
Number of Employees
The Fund is organized as a Massachusetts business trust and is registered under the Investment Company Act of 1940, as amended, as a closed-end management investment company and has no employees.
Number of Shareholders
As of August 31, 2014, Fund records indicate that there are 73 registered shareholders and approximately 55,168 shareholders owning the Fund shares in street name, such as through brokers, banks, and financial intermediaries.
If you are a street name shareholder and wish to receive Fund reports directly, which contain important information about the Fund, please write or call:
Eaton Vance Distributors, Inc.
Two International Place
Boston, MA 02110
1-800-262-1122
New York Stock Exchange symbol
The New York Stock Exchange symbol is EVT.
Eaton Vance
Tax-Advantaged Dividend Income Fund
August 31, 2014
Board of Trustees’ Contract Approval
Overview of the Contract Review Process
The Investment Company Act of 1940, as amended (the “1940 Act”), provides, in substance, that each investment advisory agreement between a fund and its investment adviser will continue in effect from year to year only if its continuation is approved at least annually by the fund’s board of trustees, including by a vote of a majority of the trustees who are not “interested persons” of the fund (“Independent Trustees”), cast in person at a meeting called for the purpose of considering such approval.
At a meeting of the Boards of Trustees (each a “Board”) of the Eaton Vance group of mutual funds (the “Eaton Vance Funds”) held on April 28, 2014, the Board, including a majority of the Independent Trustees, voted to approve continuation of existing advisory and sub-advisory agreements for the Eaton Vance Funds for an additional one-year period. In voting its approval, the Board relied upon the affirmative recommendation of the Contract Review Committee of the Board, which is a committee comprised exclusively of Independent Trustees. Prior to making its recommendation, the Contract Review Committee reviewed information furnished by each adviser to the Eaton Vance Funds (including information specifically requested by the Board) for a series of meetings of the Contract Review Committee held between February and April 2014, as well as information considered throughout the year at meetings of the Board and its committees. Such information included, among other things, the following:
Information about Fees, Performance and Expenses
| Ÿ | | An independent report comparing the advisory and related fees paid by each fund with fees paid by comparable funds; |
| Ÿ | | An independent report comparing each fund’s total expense ratio and its components to comparable funds; |
| Ÿ | | An independent report comparing the investment performance of each fund (including, where relevant, yield data, Sharpe ratios and information ratios) to the investment performance of comparable funds over various time periods; |
| Ÿ | | Data regarding investment performance in comparison to benchmark indices and customized peer groups identified by the adviser in consultation with the Board; |
| Ÿ | | For each fund, comparative information concerning the fees charged and the services provided by each adviser in managing other accounts (including mutual funds, other collective investment funds and institutional accounts) using investment strategies and techniques similar to those used in managing such fund; |
| Ÿ | | Profitability analyses for each adviser with respect to each fund; |
Information about Portfolio Management and Trading
| Ÿ | | Descriptions of the investment management services provided to each fund, including the investment strategies and processes employed, and any changes in portfolio management processes and personnel; |
| Ÿ | | Information about the allocation of brokerage and the benefits received by each adviser as a result of brokerage allocation, including information concerning the acquisition of research through client commission arrangements and the fund’s policies with respect to “soft dollar” arrangements; |
| Ÿ | | Data relating to portfolio turnover rates of each fund; |
| Ÿ | | The procedures and processes used to determine the fair value of fund assets and actions taken to monitor and test the effectiveness of such procedures and processes; |
| Ÿ | | Information about each adviser’s processes for monitoring best execution of portfolio transactions, and other policies and practices of each adviser with respect to trading; |
Information about each Adviser
| Ÿ | | Reports detailing the financial results and condition of each adviser; |
| Ÿ | | Descriptions of the qualifications, education and experience of the individual investment professionals whose responsibilities include portfolio management and investment research for the funds, and information relating to their compensation and responsibilities with respect to managing other mutual funds and investment accounts; |
| Ÿ | | Copies of the Codes of Ethics of each adviser and its affiliates, together with information relating to compliance with and the administration of such codes; |
| Ÿ | | Copies of or descriptions of each adviser’s policies and procedures relating to proxy voting, the handling of corporate actions and class actions; |
| Ÿ | | Information concerning the resources devoted to compliance efforts undertaken by each adviser and its affiliates on behalf of the funds (including descriptions of various compliance programs) and their record of compliance with investment policies and restrictions, including policies with respect to market-timing, late trading and selective portfolio disclosure, and with policies on personal securities transactions; |
| Ÿ | | Descriptions of the business continuity and disaster recovery plans of each adviser and its affiliates; |
| Ÿ | | A description of Eaton Vance Management’s procedures for overseeing third party advisers and sub-advisers, including with respect to regulatory and compliance issues, investment management and other matters; |
Eaton Vance
Tax-Advantaged Dividend Income Fund
August 31, 2014
Board of Trustees’ Contract Approval — continued
Other Relevant Information
| Ÿ | | Information concerning the nature, cost and character of the administrative and other non-investment management services provided by Eaton Vance Management and its affiliates; |
| Ÿ | | Information concerning management of the relationship with the custodian, subcustodians and fund accountants by each adviser or the funds’ administrator; and |
| Ÿ | | The terms of each advisory agreement. |
Over the course of the twelve-month period ended April 30, 2014, with respect to one or more funds, the Board met nine times and the Contract Review Committee, the Audit Committee, the Governance Committee, the Portfolio Management Committee and the Compliance Reports and Regulatory Matters Committee, each of which is a Committee comprised solely of Independent Trustees, met seven, seventeen, eleven, six and ten times respectively. At such meetings, the Trustees participated in investment and performance reviews with the portfolio managers and other investment professionals of each adviser relating to each fund, and considered the investment and trading strategies used in pursuing each fund’s investment objective, including, where relevant, the use of derivative instruments, as well as processes for monitoring best execution of portfolio transactions and risk management techniques. The Board and its Committees also evaluated issues pertaining to industry and regulatory developments, compliance procedures, fund governance and other issues with respect to the funds, and received and participated in reports and presentations provided by Eaton Vance Management and other fund advisers with respect to such matters.
For funds that invest through one or more underlying portfolios, the Board considered similar information about the portfolio(s) when considering the approval of advisory agreements. In addition, in cases where the fund’s investment adviser has engaged a sub-adviser, the Board considered similar information about the sub-adviser when considering the approval of any sub-advisory agreement.
The Contract Review Committee was assisted throughout the contract review process by Goodwin Procter LLP, legal counsel for the Independent Trustees. The members of the Contract Review Committee relied upon the advice of such counsel and their own business judgment in determining the material factors to be considered in evaluating each advisory and sub-advisory agreement and the weight to be given to each such factor. The conclusions reached with respect to each advisory and sub-advisory agreement were based on a comprehensive evaluation of all the information provided and not any single factor. Moreover, each member of the Contract Review Committee may have placed varying emphasis on particular factors in reaching conclusions with respect to each advisory and sub-advisory agreement. In evaluating each advisory and sub-advisory agreement, including the specific fee structures and other terms of the agreements, the Contract Review Committee was informed by multiple years of analysis and discussion among the Independent Trustees and the Funds’ advisers and sub-advisers.
Results of the Process
Based on its consideration of the foregoing, and such other information as it deemed relevant, including the factors and conclusions described below, the Contract Review Committee concluded that the continuation of the investment advisory agreement of Eaton Vance Tax-Advantaged Dividend Income Fund (the “Fund”) with Eaton Vance Management (the “Adviser”), including its fee structure, is in the interests of shareholders and, therefore, the Contract Review Committee recommended to the Board approval of the agreement. The Board accepted the recommendation of the Contract Review Committee as well as the factors considered and conclusions reached by the Contract Review Committee with respect to the agreement. Accordingly, the Board, including a majority of the Independent Trustees, voted to approve continuation of the investment advisory agreement for the Fund.
Nature, Extent and Quality of Services
In considering whether to approve the investment advisory agreement of the Fund, the Board evaluated the nature, extent and quality of services provided to the Fund by the Adviser.
The Board considered the Adviser’s management capabilities and investment process with respect to the types of investments held by the Fund, including the education, experience and number of its investment professionals and other personnel who provide portfolio management, investment research, and similar services to the Fund, including recent changes to such personnel. In particular, the Board considered the abilities and experience of such investment personnel in analyzing special considerations relevant to investing in dividend-paying common and preferred stocks. The Board noted the Adviser’s in-house equity research capabilities and experience in managing funds that seek to maximize after-tax returns. The Board also took into account the resources dedicated to portfolio management and other services, including the compensation methods of the Adviser to recruit and retain investment personnel, and the time and attention devoted to the Fund by senior management.
The Board reviewed the compliance programs of the Adviser and relevant affiliates thereof. Among other matters, the Board considered compliance and reporting matters relating to personal trading by investment personnel, selective disclosure of portfolio holdings, late trading, frequent trading, portfolio valuation, business continuity and the allocation of investment opportunities. The Board also evaluated the responses of the Adviser and its affiliates to requests in recent years from regulatory authorities such as the Securities and Exchange Commission and the Financial Industry Regulatory Authority.
The Board considered shareholder and other administrative services provided or managed by Eaton Vance Management and its affiliates, including transfer agency and accounting services. The Board evaluated the benefits to shareholders of investing in a fund that is a part of a large family of funds.
Eaton Vance
Tax-Advantaged Dividend Income Fund
August 31, 2014
Board of Trustees’ Contract Approval — continued
After consideration of the foregoing factors, among others, the Board concluded that the nature, extent and quality of services provided by the Adviser, taken as a whole, are appropriate and consistent with the terms of the investment advisory agreement.
Fund Performance
The Board compared the Fund’s investment performance to a relevant universe of similarly managed funds identified by an independent data provider and appropriate benchmark indices. The Board reviewed comparative performance data for the one-, three-, five- and ten-year periods ended September 30, 2013 for the Fund. The Board noted that actions are being taken by the Adviser to improve Fund performance and concluded that additional time is required to evaluate the effectiveness of such actions.
Management Fees and Expenses
The Board reviewed contractual fee rates for investment advisory and administrative services payable by the Fund (referred to as “management fees”). As part of its review, the Board considered the management fees and the Fund’s total expense ratio for the year ended September 30, 2013, as compared to a group of similarly managed funds selected by an independent data provider. In considering the Fund’s total expense ratio and management fees, the Board noted the impact of the Fund’s use of leverage. The Board also considered factors that had an impact on Fund expense ratios, as identified by management in response to inquiries from the Contract Review Committee, as well as actions taken by management in recent years to reduce expenses at the fund complex level, including the negotiation of reduced fees for transfer agency and custody services.
After reviewing the foregoing information, and in light of the nature, extent and quality of the services provided by the Adviser, the Board concluded that the management fees charged for advisory and related services are reasonable.
Profitability
The Board reviewed the level of profits realized by the Adviser and relevant affiliates thereof in providing investment advisory and administrative services to the Fund and to all Eaton Vance Funds as a group. The Board considered the level of profits realized without regard to revenue sharing or other payments by the Adviser and its affiliates to third parties in respect of distribution services. The Board also considered other direct or indirect benefits received by the Adviser and its affiliates in connection with their relationships with the Fund, including the benefits of research services that may be available to the Adviser as a result of securities transactions effected for the Fund and other investment advisory clients.
The Board concluded that, in light of the foregoing factors and the nature, extent and quality of the services rendered, the profits realized by the Adviser and its affiliates are reasonable.
Economies of Scale
In reviewing management fees and profitability, the Board also considered the extent to which the Adviser and its affiliates, on the one hand, and the Fund, on the other hand, can expect to realize benefits from economies of scale as the assets of the Fund increase. The Board acknowledged the difficulty in accurately measuring the benefits resulting from the economies of scale with respect to the management of any specific fund or group of funds. The Board reviewed data summarizing the increases and decreases in the assets of the Fund and of all Eaton Vance Funds as a group over various time periods, and evaluated the extent to which the total expense ratio of the Fund and the profitability of the Adviser and its affiliates may have been affected by such increases or decreases. Based upon the foregoing, the Board concluded that the Fund currently shares in the benefits from economies of scale. The Board also concluded that, assuming reasonably foreseeable increases in the assets of the Fund, the structure of the advisory fee, which includes breakpoints at several asset levels, will allow the Fund to continue to benefit from economies of scale in the future.
Eaton Vance
Tax-Advantaged Dividend Income Fund
August 31, 2014
Management and Organization
Fund Management. The Trustees of Eaton Vance Tax-Advantaged Dividend Income Fund (the Fund) are responsible for the overall management and supervision of the Fund’s affairs. The Trustees and officers of the Fund are listed below. Except as indicated, each individual has held the office shown or other offices in the same company for the last five years. The “Noninterested Trustees” consist of those Trustees who are not “interested persons” of the Fund, as that term is defined under the 1940 Act. The business address of each Trustee and officer is Two International Place, Boston, Massachusetts 02110. As used below, “EVC” refers to Eaton Vance Corp., “EV” refers to Eaton Vance, Inc., “EVM” refers to Eaton Vance Management, “BMR” refers to Boston Management and Research and “EVD” refers to Eaton Vance Distributors, Inc. EVC and EV are the corporate parent and trustee, respectively, of EVM and BMR. EVD is a wholly-owned subsidiary of EVC. Each officer affiliated with Eaton Vance may hold a position with other Eaton Vance affiliates that is comparable to his or her position with EVM listed below. Each Trustee oversees 177 portfolios in the Eaton Vance Complex (including all master and feeder funds in a master feeder structure). Each officer serves as an officer of certain other Eaton Vance funds. Each Trustee serves for a three year term. Each officer serves until his or her successor is elected.
| | | | | | |
| Name and Year of Birth | | Position(s) with the Fund | | Term Expiring; Trustee Since(1) | | Principal Occupation(s) and Directorships During Past Five Years and Other Relevant Experience |
Interested Trustee | | | | | | |
| | | |
Thomas E. Faust Jr. 1958 | | Class II Trustee | | Until 2017. Trustee since 2007. | | Chairman, Chief Executive Officer and President of EVC, Director and President of EV, Chief Executive Officer and President of EVM and BMR, and Director of EVD. Trustee and/or officer of 177 registered investment companies. Mr. Faust is an interested person because of his positions with EVM, BMR, EVD, EVC and EV, which are affiliates of the Fund. Directorships in the Last Five Years.(2) Director of EVC and Hexavest Inc. |
| | | |
| | | | | | |
Noninterested Trustees | | | | | | |
| | | |
Scott E. Eston 1956 | | Class I Trustee | | Until 2016. Trustee since 2011. | | Private investor. Formerly held various positions at Grantham, Mayo, Van Otterloo and Co., L.L.C. (investment management firm) (1997-2009), including Chief Operating Officer (2002-2009), Chief Financial Officer (1997-2009) and Chairman of the Executive Committee (2002-2008); President and Principal Executive Officer, GMO Trust (open-end registered investment company) (2006-2009). Former Partner, Coopers and Lybrand L.L.P. (now PricewaterhouseCoopers) (public accounting firm) (1987-1997). Directorships in the Last Five Years.(2) None. |
| | | |
Cynthia E. Frost(3) 1961 | | Class I Trustee | | Until 2016. Trustee since 2014. | | Private investor. Formerly, Chief Investment Officer of Brown University (university endowment) (2000-2012); Portfolio Strategist for Duke Management Company (university endowment manager) (1995-2000); Managing Director, Cambridge Associates (1989-1995); Consultant, Bain and Company (1987-1989); Senior Equity Analyst, BA Investment Management Company (1983-1985). Directorships in the Last Five Years. None. |
| | | |
George J. Gorman(3) 1952 | | Class III Trustee | | Until 2015. Trustee since 2014. | | Principal at George J. Gorman LLC (consulting firm). Formerly, Senior Partner at Ernst & Young LLP (public accounting firm) (1974-2009). Directorships in the Last Five Years. Trustee of the Bank of America Money Market Funds Series Trust (2011-2014) and of the Ashmore Funds (2010-2014). |
| | | |
Valerie A. Mosley(4) 1960 | | Class I Trustee | | Until 2016. Trustee since 2014. | | Chairwoman and Chief Executive Officer of Valmo Ventures (a consulting and investment firm). Former Partner and Senior Vice President, Portfolio Manager and Investment Strategist at Wellington Management Company, LLP (investment management firm) (1992-2012). Former Chief Investment Officer, PG Corbin Asset Management (1990-1992). Formerly worked in institutional corporate bond sales at Kidder Peabody (1986-1990). Directorships in the Last Five Years.(2) Director of Dynex Capital, Inc. (mortgage REIT) (since 2013). |
| | | |
William H. Park 1947 | | Class II Trustee | | Until 2017. Trustee since 2003. | | Consultant and private investor. Formerly, Chief Financial Officer, Aveon Group L.P. (investment management firm) (2010-2011). Formerly, Vice Chairman, Commercial Industrial Finance Corp. (specialty finance company) (2006-2010). Formerly, President and Chief Executive Officer, Prizm Capital Management, LLC (investment management firm) (2002-2005). Formerly, Executive Vice President and Chief Financial Officer, United Asset Management Corporation (investment management firm) (1982-2001). Formerly, Senior Manager, Price Waterhouse (now PricewaterhouseCoopers) (an independent registered public accounting firm) (1972-1981). Directorships in the Last Five Years.(2) None. |
Eaton Vance
Tax-Advantaged Dividend Income Fund
August 31, 2014
Management and Organization — continued
| | | | | | |
| Name and Year of Birth | | Position(s) with the Fund | | Term Expiring; Trustee Since(1) | | Principal Occupation(s) and Directorships During Past Five Years and Other Relevant Experience |
Noninterested Trustees (continued) |
| | | |
Ronald A. Pearlman 1940 | | Class III Trustee | | Until 2015. Trustee since 2003. | | Lawyer and consultant. Formerly, Professor of Law, Georgetown University Law Center (1999-2014). Formerly, Partner, Covington & Burling LLP (law firm) (1991-2000). Formerly, Chief of Staff, Joint Committee on Taxation, U.S. Congress (1988-1990). Formerly, Deputy Assistant Secretary (Tax Policy) and Assistant Secretary (Tax Policy), U.S. Department of the Treasury (1983-1985). Directorships in the Last Five Years.(2) None. |
| | | |
Helen Frame Peters 1948 | | Class III Trustee | | Until 2015. Trustee since 2008. | | Professor of Finance, Carroll School of Management, Boston College. Formerly, Dean, Carroll School of Management, Boston College (2000-2002). Formerly, Chief Investment Officer, Fixed Income, Scudder Kemper Investments (investment management firm) (1998-1999). Formerly, Chief Investment Officer, Equity and Fixed Income, Colonial Management Associates (investment management firm) (1991-1998). Directorships in the Last Five Years.(2) Formerly, Director of BJ’s Wholesale Club, Inc. (wholesale club retailer) (2004-2011). Formerly, Trustee of SPDR Index Shares Funds and SPDR Series Trust (exchange traded funds) (2000-2009). Formerly, Director of Federal Home Loan Bank of Boston (a bank for banks) (2007-2009). |
| | | |
Harriett Tee Taggart 1948 | | Class II Trustee | | Until 2017 Trustee since 2011. | | Managing Director, Taggart Associates (a professional practice firm). Formerly, Partner and Senior Vice President, Wellington Management Company, LLP (investment management firm) (1983-2006). Directorships in the Last Five Years.(2) Director of Albemarle Corporation (chemicals manufacturer) (since 2007) and The Hanover Group (specialty property and casualty insurance company) (since 2009). Formerly, Director of Lubrizol Corporation (specialty chemicals) (2007-2011). |
| | | |
Ralph F. Verni 1943 | | Chairman of the Board and Class III Trustee | | Until 2015. Trustee since 2005 and Chairman since 2007. | | Consultant and private investor. Formerly, Chief Investment Officer (1982-1992), Chief Financial Officer (1988-1990) and Director (1982-1992), New England Life. Formerly, Chairperson, New England Mutual Funds (1982-1992). Formerly, President and Chief Executive Officer, State Street Management & Research (1992-2000). Formerly, Chairperson, State Street Research Mutual Funds (1992-2000). Formerly, Director, W.P. Carey, LLC (1998-2004) and First Pioneer Farm Credit Corp. (2002-2006). Directorships in the Last Five Years.(2) None. |
| | | |
| | | | | | |
Principal Officers who are not Trustees |
| Name and Year of Birth | | Position(s) with the Fund | | Officer
Since(5) | | Principal Occupation(s) During Past Five Years |
Walter A. Row, III 1957 | | President | | 2004 | | Vice President of EVM and BMR. |
| | | |
Maureen A. Gemma 1960 | | Vice President, Secretary and Chief Legal Officer | | 2005 | | Vice President of EVM and BMR. |
| | | |
James F. Kirchner 1967 | | Treasurer | | 2007 | | Vice President of EVM and BMR. |
| | | |
Paul M. O’Neil 1953 | | Chief Compliance Officer | | 2004 | | Vice President of EVM and BMR. |
| (1) | Year first appointed to serve as Trustee for a fund in the Eaton Vance family of funds. Each Trustee has served continuously since appointment unless indicated otherwise. Each Trustee holds office until the annual meeting for the year in which his or her term expires and until his or her successor is elected and qualified, subject to a prior death, resignation, retirement, disqualification or removal. |
| (2) | During their respective tenures, the Trustees (except for Ms. Frost and Mr. Gorman) also served as Board members of one or more of the following funds (which operated in the years noted): eUnitsTM 2 Year U.S. Market Participation Trust: Upside to Cap / Buffered Downside (launched in 2012 and terminated in 2014); eUnitsTM 2 Year U.S. Market Participation Trust II: Upside to Cap / Buffered Downside (launched in 2012 and terminated in 2014); Eaton Vance Credit Opportunities Fund (launched in 2005 and terminated in 2010); Eaton Vance Insured Florida Plus Municipal Bond Fund (launched in 2002 and terminated in |
Eaton Vance
Tax-Advantaged Dividend Income Fund
August 31, 2014
Management and Organization — continued
| | 2009); and Eaton Vance National Municipal Income Trust (launched in 1998 and terminated in 2009). However, Ms. Mosley did not serve as a Board member of eUnitsTM 2 Year U.S. Market Participation Trust: Upside to Cap / Buffered Downside (launched in 2012 and terminated in 2014). |
| (3) | Ms. Frost and Mr. Gorman began serving as Trustees effective May 29, 2014. |
| (4) | Ms. Mosley began serving as a Trustee effective January 1, 2014. |
| (5) | Year first elected to serve as officer of a fund in the Eaton Vance family of funds when the officer has served continuously. Otherwise, year of most recent election as an officer of a fund in the Eaton Vance family of funds. Titles may have changed since initial election. |
Eaton Vance Funds
IMPORTANT NOTICES
Privacy. The Eaton Vance organization is committed to ensuring your financial privacy. Each of the financial institutions identified below has in effect the following policy (“Privacy Policy”) with respect to nonpublic personal information about its customers:
| Ÿ | | Only such information received from you, through application forms or otherwise, and information about your Eaton Vance fund transactions will be collected. This may include information such as name, address, social security number, tax status, account balances and transactions. |
| Ÿ | | None of such information about you (or former customers) will be disclosed to anyone, except as permitted by law (which includes disclosure to employees necessary to service your account). In the normal course of servicing a customer’s account, Eaton Vance may share information with unaffiliated third parties that perform various required services such as transfer agents, custodians and broker-dealers. |
| Ÿ | | Policies and procedures (including physical, electronic and procedural safeguards) are in place that are designed to protect the confidentiality of such information. |
| Ÿ | | We reserve the right to change our Privacy Policy at any time upon proper notification to you. Customers may want to review our Privacy Policy periodically for changes by accessing the link on our homepage: www.eatonvance.com. |
Our pledge of privacy applies to the following entities within the Eaton Vance organization: the Eaton Vance Family of Funds, Eaton Vance Management, Eaton Vance Investment Counsel, Eaton Vance Distributors, Inc., Eaton Vance Trust Company, Eaton Vance Management’s Real Estate Investment Group and Boston Management and Research. In addition, our Privacy Policy applies only to those Eaton Vance customers who are individuals and who have a direct relationship with us. If a customer’s account (i.e., fund shares) is held in the name of a third-party financial advisor/broker-dealer, it is likely that only such advisor’s privacy policies apply to the customer. This notice supersedes all previously issued privacy disclosures. For more information about Eaton Vance’s Privacy Policy, please call 1-800-262-1122.
Delivery of Shareholder Documents. The Securities and Exchange Commission (SEC) permits funds to deliver only one copy of shareholder documents, including prospectuses, proxy statements and shareholder reports, to fund investors with multiple accounts at the same residential or post office box address. This practice is often called “householding” and it helps eliminate duplicate mailings to shareholders. Eaton Vance, or your financial advisor, may household the mailing of your documents indefinitely unless you instruct Eaton Vance, or your financial advisor, otherwise. If you would prefer that your Eaton Vance documents not be householded, please contact Eaton Vance at 1-800-262-1122, or contact your financial advisor. Your instructions that householding not apply to delivery of your Eaton Vance documents will be effective within 30 days of receipt by Eaton Vance or your financial advisor.
Portfolio Holdings. Each Eaton Vance Fund and its underlying Portfolio(s) (if applicable) will file a schedule of portfolio holdings on Form N-Q with the SEC for the first and third quarters of each fiscal year. The Form N-Q will be available on the Eaton Vance website at www.eatonvance.com, by calling Eaton Vance at 1-800-262-1122 or in the EDGAR database on the SEC’s website at www.sec.gov. Form N-Q may also be reviewed and copied at the SEC’s public reference room in Washington, D.C. (call 1-800-732-0330 for information on the operation of the public reference room).
Proxy Voting. From time to time, funds are required to vote proxies related to the securities held by the funds. The Eaton Vance Funds or their underlying Portfolios (if applicable) vote proxies according to a set of policies and procedures approved by the Funds’ and Portfolios’ Boards. You may obtain a description of these policies and procedures and information on how the Funds or Portfolios voted proxies relating to portfolio securities during the most recent 12-month period ended June 30, without charge, upon request, by calling 1-800-262-1122 and by accessing the SEC’s website at www.sec.gov.
Share Repurchase Program. The Fund’s Board of Trustees has approved a share repurchase program authorizing the Fund to repurchase up to 10% of its currently outstanding common shares in open-market transactions at a discount to net asset value. The repurchase program does not obligate the Fund to purchase a specific amount of shares. The Fund’s repurchase activity, including the number of shares purchased, average price and average discount to net asset value, is disclosed in the Fund’s annual and semi-annual reports to shareholders.
Additional Notice to Shareholders. If applicable, a Fund may also redeem or purchase its outstanding preferred shares in order to maintain compliance with regulatory requirements, borrowing or rating agency requirements or for other purposes as it deems appropriate or necessary.
Closed-End Fund Information. Eaton Vance closed-end funds make fund performance data and certain information about portfolio characteristics available on the Eaton Vance website shortly after the end of each month. Other information about the funds is available on the website. The funds’ net asset value per share is readily accessible on the Eaton Vance website. Portfolio holdings for the most recent month-end are also posted to the website approximately 30 days following the end of the month. This information is available at www.eatonvance.com on the fund information pages under “Individual Investors — Closed-End Funds”.
This Page Intentionally Left Blank
This Page Intentionally Left Blank
This Page Intentionally Left Blank
Investment Adviser and Administrator
Eaton Vance Management
Two International Place
Boston, MA 02110
Custodian
State Street Bank and Trust Company
State Street Financial Center, One Lincoln Street
Boston, MA 02111
Transfer Agent
American Stock Transfer & Trust Company, LLC
6201 15th Avenue
Brooklyn, NY 11219
Independent Registered Public Accounting Firm
Deloitte & Touche LLP
200 Berkeley Street
Boston, MA 02116-5022
Fund Offices
Two International Place
Boston, MA 02110
Item 2. Code of Ethics
The registrant has adopted a code of ethics applicable to its Principal Executive Officer, Principal Financial Officer and Principal Accounting Officer. The registrant undertakes to provide a copy of such code of ethics to any person upon request, without charge, by calling 1-800-262-1122.
Item 3. Audit Committee Financial Expert
The registrant’s Board has designated William H. Park, an independent trustee, as its audit committee financial expert. Mr. Park is a certified public accountant who is a consultant and private investor. Previously, he served as the Chief Financial Officer of Aveon Group, L.P. (an investment management firm), as the Vice Chairman of Commercial Industrial Finance Corp. (specialty finance company), as President and Chief Executive Officer of Prizm Capital Management, LLC (investment management firm), as Executive Vice President and Chief Financial Officer of United Asset Management Corporation (an institutional investment management firm) and as a Senior Manager at Price Waterhouse (now PricewaterhouseCoopers) (an independent registered public accounting firm).
Item 4. Principal Accountant Fees and Services
(a)-(d)
The following table presents the aggregate fees billed to the registrant for the registrant’s fiscal years ended August 31, 2013 and August 31, 2014 by the registrant’s principal accountant, Deloitte & Touche LLP (“D&T”), for professional services rendered for the audit of the registrant’s annual financial statements and fees billed for other services rendered by D&T during such periods.
| | | | | | | | |
Fiscal Years Ended | | 8/31/13 | | | 8/31/14 | |
Audit Fees | | $ | 60,600 | | | $ | 62,800 | |
Audit-Related Fees(1) | | $ | 0 | | | $ | 0 | |
Tax Fees(2) | | $ | 12,230 | | | $ | 13,900 | |
All Other Fees(3) | | $ | 0 | | | $ | 0 | |
| | | | | | | | |
Total | | $ | 72,830 | | | $ | 76,700 | |
| | | | | | | | |
| (1) | Audit-related fees consist of the aggregate fees billed for assurance and related services that are reasonably related to the performance of the audit of the registrant’s financial statements and are not reported under the category of audit fees. |
| (2) | Tax fees consist of the aggregate fees billed for professional services rendered by the principal accountant relating to tax compliance, tax advice, and tax planning and specifically include fees for tax return preparation and other related tax compliance/planning matters. |
| (3) | All other fees consist of the aggregate fees billed for products and services provided by the principal accountant other than audit, audit-related, and tax services. |
(e)(1) The registrant’s audit committee has adopted policies and procedures relating to the pre-approval of services provided by the registrant’s principal accountant (the “Pre-Approval Policies”). The Pre-Approval Policies establish a framework intended to assist the audit committee in the proper discharge of its pre-approval responsibilities. As a general matter, the Pre-Approval Policies (i) specify certain types of audit, audit-related, tax, and other services determined to be pre-approved by the audit committee; and (ii) delineate specific procedures governing the mechanics of the pre-approval process, including the approval and monitoring of audit and non-audit service fees. Unless a service is specifically pre-approved under the Pre-Approval Policies, it must be separately pre-approved by the audit committee.
The Pre-Approval Policies and the types of audit and non-audit services pre-approved therein must be reviewed and ratified by the registrant’s audit committee at least annually. The registrant’s audit committee maintains full responsibility for the appointment, compensation, and oversight of the work of the registrant’s principal accountant.
(e)(2) No services described in paragraphs (b)-(d) above were approved by the registrant’s audit committee pursuant to the “de minimis exception” set forth in Rule 2-01 (c)(7)(i)(C) of Regulation S-X.
(f) Not applicable.
(g) The following table presents (i) the aggregate non-audit fees (i.e., fees for audit-related, tax, and other services) billed for services rendered to the registrant by D&T for the registrant’s fiscal years ended August 31, 2013 and August 31, 2014; and (ii) the aggregate non-audit fees (i.e., fees for audit-related, tax, and other services) billed for services rendered to the Eaton Vance organization by D&T for the same time periods.
| | | | | | | | |
Fiscal Years Ended | | 8/31/13 | | | 8/31/14 | |
Registrant | | $ | 12,230 | | | $ | 13,900 | |
Eaton Vance(1) | | $ | 417,309 | | | $ | 256,315 | |
| (1) | Eaton Vance Management, a subsidiary of Eaton Vance Corp., acts as the registrant’s investment adviser and administrator. |
(h) The registrant’s audit committee has considered whether the provision by the registrant’s principal accountant of non-audit services to the registrant’s investment adviser and any entity controlling, controlled by, or under common control with the adviser that provides ongoing services to the registrant that were not pre-approved pursuant to Rule 2-01(c)(7)(ii) of Regulation S-X is compatible with maintaining the principal accountant’s independence.
Item 5. Audit Committee of Listed Registrants
The registrant has a separately-designated standing audit committee established in accordance with Section 3(a)(58)(A) of the Securities and Exchange Act of 1934, as amended. William H. Park (Chair), Scott E. Eston, Ronald A. Pearlman, Helen Frame Peters and Ralph F. Verni are the members of the registrant’s audit committee.
Item 6. Schedule of Investments
Please see schedule of investments contained in the Report to Stockholders included under Item 1 of this Form N-CSR.
Item 7. Disclosure of Proxy Voting Policies and Procedures for Closed-End Management Investment Companies
The Board of Trustees of the Trust has adopted a proxy voting policy and procedure (the “Fund Policy”), pursuant to which the Trustees have delegated proxy voting responsibility to the Fund’s investment adviser and adopted the investment adviser’s proxy voting policies and procedures (the “Policies”) which are described below. The Trustees will review the Fund’s proxy voting records from time to time and will annually consider approving the Policies for the upcoming year. In the event that a conflict of interest arises between the Fund’s shareholders and the investment adviser, the administrator, or any of their affiliates or any affiliate of the Fund, the investment adviser will generally refrain from voting the proxies related to the companies giving rise to such conflict until it consults with the Board’s Special Committee except as contemplated under the Fund Policy. The Board’s Special Committee will instruct the investment adviser on the appropriate course of action.
The Policies are designed to promote accountability of a company’s management to its shareholders and to align the interests of management with those shareholders. An independent proxy voting service (“Agent”), currently Institutional Shareholder Services, Inc., has been retained to assist in the voting of proxies through the provision of vote analysis, implementation and recordkeeping and disclosure
services. The investment adviser will generally vote proxies through the Agent. The Agent is required to vote all proxies and/or refer them back to the investment adviser pursuant to the Policies. It is generally the policy of the investment adviser to vote in accordance with the recommendation of the Agent. The Agent shall refer to the investment adviser proxies relating to mergers and restructurings, and the disposition of assets, termination, liquidation and mergers contained in mutual fund proxies. The investment adviser will normally vote against anti-takeover measures and other proposals designed to limit the ability of shareholders to act on possible transactions, except in the case of closed-end management investment companies. The investment adviser generally supports management on social and environmental proposals. The investment adviser may abstain from voting from time to time where it determines that the costs associated with voting a proxy outweighs the benefits derived from exercising the right to vote or the economic effect on shareholders interests or the value of the portfolio holding is indeterminable or insignificant.
In addition, the investment adviser will monitor situations that may result in a conflict of interest between the Fund’s shareholders and the investment adviser, the administrator, or any of their affiliates or any affiliate of the Fund by maintaining a list of significant existing and prospective corporate clients. The investment adviser’s personnel responsible for reviewing and voting proxies on behalf of the Fund will report any proxy received or expected to be received from a company included on that list to the personnel of the investment adviser identified in the Policies. If such personnel expects to instruct the Agent to vote such proxies in a manner inconsistent with the guidelines of the Policies or the recommendation of the Agent, the personnel will consult with members of senior management of the investment adviser to determine if a material conflict of interests exists. If it is determined that a material conflict does exist, the investment adviser will seek instruction on how to vote from the Special Committee.
Information on how the Fund voted proxies relating to portfolio securities during the most recent 12 month period ended June 30 is available (1) without charge, upon request, by calling 1-800-262-1122, and (2) on the Securities and Exchange Commission’s website at http://www.sec.gov.
Item 8. Portfolio Managers of Closed-End Management Investment Companies
Michael A. Allison, John H. Croft, John D. Crowley, Edward J. Perkin and Walter A. Row, III, and other Eaton Vance Management (“EVM” or “Eaton Vance”) investment professionals comprise the investment team responsible for the overall and day-to-day management of the Fund’s investments as well as allocations of the Fund’s assets between common and preferred stocks. Messrs. Allison, Croft, Crowley, Perkin and Row are the portfolio managers responsible for the day-to-day management of specific segments of the Fund’s investment portfolio.
Mr. Allison has been an EVM portfolio manager since 2006 and is a member of EVM’s Equity Strategy Committee. Mr. Croft has been an EVM portfolio manager since 2010. Mr. Crowley has been an EVM portfolio manager since 2003. Mr. Perkin has been an EVM portfolio manager since 2014 and is Chief Equity Investment Officer. Prior to joining EVM in 2014, Mr. Perkin was Chief Investment Officer, International and Emerging Markets Equity, and Managing Director, Portfolio Manager, Europe, EAFE and Global, at Goldman Sachs Asset Management. Mr. Row has been an EVM portfolio manager since 2004, is the Director of Structured Equity Portfolios at EVM and is a member of EVM’s Equity Strategy Committee. Messrs. Allison, Croft, Crowley, Perkin and Row are Vice Presidents of EVM. This information is provided as of the date of filing of this report.
The following table shows, as of the Fund’s most recent fiscal year end, the number of accounts each portfolio manager managed in each of the listed categories and the total assets (in millions of dollars) in the accounts managed within each category. The table also shows the number of accounts with respect to which the advisory fee is based on the performance of the account, if any, and the total assets (in millions of dollars) in those accounts.
| | | | | | | | | | | | |
| | | Number of
All
Accounts | | Total Assets of
All Accounts | | | Number of
Accounts
Paying a
Performance
Fee | | Total Assets of
Accounts Paying
a
Performance Fee | |
Michael A. Allison(1) | | | | | | | | | | | | |
Registered Investment Companies | | 12 | | $ | 22,059.6 | | | 0 | | $ | 0 | |
Other Pooled Investment Vehicles | | 14 | | $ | 8,942.4 | (2) | | 0 | | $ | 0 | |
Other Accounts | | 0 | | $ | 0 | | | 0 | | $ | 0 | |
| | | | |
John H. Croft | | | | | | | | | | | | |
Registered Investment Companies | | 5 | | $ | 1,596.9 | | | 0 | | $ | 0 | |
Other Pooled Investment Vehicles | | 0 | | $ | 0 | | | 0 | | $ | 0 | |
Other Accounts(3) | | 39 | | $ | 206.7 | | | 0 | | $ | 0 | |
| | | | |
John D. Crowley | | | | | | | | | | | | |
Registered Investment Companies | | 5 | | $ | 6,174.9 | | | 0 | | $ | 0 | |
Other Pooled Investment Vehicles | | 2 | | $ | 168.2 | | | 0 | | $ | 0 | |
Other Accounts(4) | | 50 | | $ | 3,286.8 | | | 0 | | $ | 0 | |
| | | | |
Edward J. Perkin | | | | | | | | | | | | |
Registered Investment Companies | | 5 | | $ | 6,174.9 | | | 0 | | $ | 0 | |
Other Pooled Investment Vehicles | | 2 | | $ | 168.2 | | | 0 | | $ | 0 | |
Other Accounts(4) | | 50 | | $ | 3,286.8 | | | 0 | | $ | 0 | |
| | | | |
Walter A. Row, III | | | | | | | | | | | | |
Registered Investment Companies | | 14 | | $ | 14,932.3 | | | 0 | | $ | 0 | |
Other Pooled Investment Vehicles | | 0 | | $ | 0 | | | 0 | | $ | 0 | |
Other Accounts | | 0 | | $ | 0 | | | 0 | | $ | 0 | |
| (1) | This portfolio manager serves as portfolio manager of one or more registered investment companies that invests or may invest in one or more underlying registered investment companies in the Eaton Vance family of funds or other pooled investment vehicles sponsored by Eaton Vance. The underlying investment companies may be managed by this portfolio manager or another portfolio manager(s). |
| (2) | Certain of these “Other Pooled Investment Vehicles” invest a substantial portion of their assets either in a registered investment company or in a separate pooled investment vehicle managed by this portfolio manager or another Eaton Vance portfolio manager. |
| (3) | For “Other Accounts” that are part of a wrap account program, the number of accounts cited includes the number of sponsors for which the portfolio manager provides management services rather than the number of individual customer accounts within each wrap account program. |
| (4) | For “Other Accounts” that are part of a wrap account program, the number of accounts cited includes the number of sponsors for which the portfolio manager provides management services rather than the number of individual customer accounts within each wrap account program. The amount of assets managed for “Other Accounts” include assets managed on a nondiscretionary or model basis. |
The following table shows the dollar range of Fund shares beneficially owned by each portfolio manager as of the Fund’s most recent fiscal year end.
| | |
Portfolio Manager | | Dollar Range of Equity
Securities
Owned in the Fund |
Michael A. Allison | | None |
| |
John H. Croft | | None |
John D. Crowley | | None |
Edward J. Perkin | | None |
Walter A. Row, III | | None |
Potential for Conflicts of Interest. It is possible that conflicts of interest may arise in connection with a portfolio manager’s management of a Fund’s investments on the one hand and the investments of other accounts for which the portfolio manager is responsible on the other. For example, a portfolio manager may have conflicts of interest in allocating management time, resources and investment opportunities among the Fund and other accounts he or she advises. In addition, due to differences in the investment strategies or restrictions between a Fund and the other accounts, a portfolio manager may take action with respect to another account that differs from the action taken with respect to the Fund. In some cases, another account managed by a portfolio manager may compensate EVM or the sub-adviser based on the performance of the securities held by that account. The existence of such a performance based fee may create additional conflicts of interest for the portfolio manager in the allocation of management time, resources and investment opportunities. Whenever conflicts of interest arise, the portfolio manager will endeavor to exercise his or her discretion in a manner that he or she believes is equitable to all interested persons. EVM and the sub-adviser have adopted several policies and procedures designed to address these potential conflicts including a code of ethics and policies which govern EVM’s and the sub-adviser’s trading practices, including among other things the aggregation and allocation of trades among clients, brokerage allocation, cross trades and best execution.
Compensation Structure for EVM
Compensation of EVM’s portfolio managers and other investment professionals has three primary components: (1) a base salary, (2) an annual cash bonus, and (3) annual stock-based compensation consisting of options to purchase shares of EVC’s nonvoting common stock and restricted shares of EVC’s nonvoting common stock. EVM’s investment professionals also receive certain retirement, insurance and other benefits that are broadly available to EVM’s employees. Compensation of EVM’s investment professionals is reviewed primarily on an annual basis. Cash bonuses, stock-based compensation awards, and adjustments in base salary are typically paid or put into effect at or shortly after the October 31st fiscal year end of EVC.
Method to Determine Compensation. EVM compensates its portfolio managers based primarily on the scale and complexity of their portfolio responsibilities and the total return performance of managed funds and accounts versus the benchmark(s) stated in the prospectus, as well as an appropriate peer group (as described below). In addition to rankings within peer groups of funds on the basis of absolute performance, consideration may also be given to relative risk-adjusted performance. Risk-adjusted performance measures include, but are not limited to, the Sharpe Ratio. Performance is normally based on periods ending on the September 30th preceding fiscal year end. Fund performance is normally evaluated primarily versus peer groups of funds as determined by Lipper Inc. and/or Morningstar, Inc. When a fund’s peer group as determined by Lipper or Morningstar is deemed by EVM’s management not to provide a fair comparison, performance may instead be evaluated primarily against a custom peer group or market index. In evaluating the performance of a fund and its manager, primary emphasis is normally placed on three-year performance, with secondary consideration of performance over longer and shorter periods. For funds that are tax-managed or otherwise have an objective of after-tax returns, performance is measured net of taxes. For other funds, performance is evaluated on a pre-tax basis. For funds with an investment objective other than total return (such as current income), consideration will also be given to the fund’s success in achieving its objective. For managers responsible for multiple funds and accounts, investment performance is evaluated on an aggregate basis, based on averages or weighted averages among managed funds and accounts. Funds and accounts that have performance-based advisory fees are not accorded disproportionate weightings in measuring aggregate portfolio manager performance.
The compensation of portfolio managers with other job responsibilities (such as heading an investment group or providing analytical support to other portfolios) will include consideration of the scope of such responsibilities and the managers’ performance in meeting them.
EVM seeks to compensate portfolio managers commensurate with their responsibilities and performance, and competitive with other firms within the investment management industry. EVM participates in investment-industry compensation surveys and utilizes survey data as a factor in determining salary, bonus and stock-based compensation levels for portfolio managers and other investment professionals. Salaries, bonuses and stock-based compensation are also influenced by the operating performance of EVM and its parent company. The overall annual cash bonus pool is based on a substantially fixed percentage of pre-bonus operating income. While the salaries of EVM’s portfolio managers are comparatively fixed, cash bonuses and stock-based compensation may fluctuate significantly from year to year, based on changes in manager performance and other factors as described herein. For a high performing portfolio manager, cash bonuses and stock-based compensation may represent a substantial portion of total compensation.
Item 9. Purchases of Equity Securities by Closed-End Management Investment Company and Affiliated Purchasers
No such purchases this period.
Item 10. Submission of Matters to a Vote of Security Holders
No material changes.
Item 11. Controls and Procedures
(a) It is the conclusion of the registrant’s principal executive officer and principal financial officer that the effectiveness of the registrant’s current disclosure controls and procedures (such disclosure controls and procedures having been evaluated within 90 days of the date of this filing) provide reasonable assurance that the information required to be disclosed by the registrant has been recorded, processed, summarized and reported within the time period specified in the Commission’s rules and forms and that the information required to be disclosed by the registrant has been accumulated and communicated to the registrant’s principal executive officer and principal financial officer in order to allow timely decisions regarding required disclosure.
(b) There have been no changes in the registrant’s internal controls over financial reporting during the second fiscal quarter of the period covered by this report that has materially affected, or is reasonably likely to materially affect, the registrant’s internal control over financial reporting.
Item 12. Exhibits
| | |
| (a)(1) | | Registrant’s Code of Ethics – Not applicable (please see Item 2). |
| |
| (a)(2)(i) | | Treasurer’s Section 302 certification. |
| |
| (a)(2)(ii) | | President’s Section 302 certification. |
| |
| (b) | | Combined Section 906 certification. |
Signatures
Pursuant to the requirements of the Securities Exchange Act of 1934 and the Investment Company Act of 1940, the registrant has duly caused this report to be signed on its behalf by the undersigned, thereunto duly authorized.
Eaton Vance Tax-Advantaged Dividend Income Fund
| | |
By: | | /s/ Walter A. Row, III |
| | Walter A. Row, III |
| | President |
| |
Date: | | October 9, 2014 |
Pursuant to the requirements of the Securities Exchange Act of 1934 and the Investment Company Act of 1940, this report has been signed below by the following persons on behalf of the registrant and in the capacities and on the dates indicated.
| | |
| By: | | /s/ James F. Kirchner |
| | James F. Kirchner |
| | Treasurer |
| |
| Date: | | October 9, 2014 |
| |
| By: | | /s/ Walter A. Row, III |
| | Walter A. Row, III |
| | President |
| |
| Date: | | October 9, 2014 |