UNITED STATES
SECURITIES AND EXCHANGE COMMISSION
Washington, D.C. 20549
Form N-CSR
CERTIFIED SHAREHOLDER REPORT OF REGISTERED
MANAGEMENT INVESTMENT COMPANIES
Investment Company Act File Number: 811-21400
Eaton Vance Tax-Advantaged Dividend Income Fund
(Exact Name of Registrant as Specified in Charter)
Two International Place, Boston, Massachusetts 02110
(Address of Principal Executive Offices)
Maureen A. Gemma
Two International Place, Boston, Massachusetts 02110
(Name and Address of Agent for Services)
(617) 482-8260
(Registrant’s Telephone Number)
August 31
Date of Fiscal Year End
August 31, 2018
Date of Reporting Period
Item 1. Reports to Stockholders

Eaton Vance
Tax-Advantaged Dividend Income Fund (EVT)
Annual Report
August 31, 2018

Commodity Futures Trading Commission Registration. Effective December 31, 2012, the Commodity Futures Trading Commission (“CFTC”) adopted certain regulatory changes that subject registered investment companies and advisers to regulation by the CFTC if a fund invests more than a prescribed level of its assets in certain CFTC-regulated instruments (including futures, certain options and swap agreements) or markets itself as providing investment exposure to such instruments. The Fund has claimed an exclusion from the definition of the term “commodity pool operator” under the Commodity Exchange Act. Accordingly, neither the Fund nor the adviser with respect to the operation of the Fund is subject to CFTC regulation. Because of its management of other strategies, the Fund’s adviser is registered with the CFTC as a commodity pool operator and a commodity trading advisor.
Managed Distribution Plan. Pursuant to an exemptive order issued by the Securities and Exchange Commission (Order), the Fund is authorized to distribute long-term capital gains to shareholders more frequently than once per year. Pursuant to the Order, the Fund’s Board of Trustees approved a Managed Distribution Plan (MDP) pursuant to which the Fund makes monthly cash distributions to common shareholders, stated in terms of a fixed amount per common share.
The Fund currently distributes monthly cash distributions equal to $0.1450 per share in accordance with the MDP. You should not draw any conclusions about the Fund’s investment performance from the amount of these distributions or from the terms of the MDP. The MDP will be subject to regular periodic review by the Fund’s Board of Trustees and the Board may amend or terminate the MDP at any time without prior notice to Fund shareholders. However, at this time there are no reasonably foreseeable circumstances that might cause the termination of the MDP.
The Fund may distribute more than its net investment income and net realized capital gains and, therefore, a distribution may include a return of capital. A return of capital distribution does not necessarily reflect the Fund’s investment performance and should not be confused with “yield” or “income.” With each distribution, the Fund will issue a notice to shareholders and a press release containing information about the amount and sources of the distribution and other related information. The amounts and sources of distributions contained in the notice and press release are only estimates and are not provided for tax purposes. The amounts and sources of the Fund’s distributions for tax purposes will be reported to shareholders on Form 1099-DIV for each calendar year.
Fund shares are not insured by the FDIC and are not deposits or other obligations of, or guaranteed by, any depository institution. Shares are subject to investment risks, including possible loss of principal invested.
Annual Report August 31, 2018
Eaton Vance
Tax-Advantaged Dividend Income Fund
Table of Contents
| | | | |
Management’s Discussion of Fund Performance | | | 2 | |
| |
Performance | | | 3 | |
| |
Fund Profile | | | 4 | |
| |
Endnotes and Additional Disclosures | | | 5 | |
| |
Financial Statements | | | 6 | |
| |
Report of Independent Registered Public Accounting Firm | | | 22 | |
| |
Federal Tax Information | | | 23 | |
| |
Annual Meeting of Shareholders | | | 24 | |
| |
Dividend Reinvestment Plan | | | 25 | |
| |
Board of Trustees’ Contract Approval | | | 27 | |
| |
Management and Organization | | | 30 | |
| |
Important Notices | | | 33 | |
Eaton Vance
Tax-Advantaged Dividend Income Fund
August 31, 2018
Management’s Discussion of Fund Performance1
Economic and Market Conditions
Powered by continued U.S. economic growth, stocks delivered strong double-digit returns for the 12-month period ended August 31, 2018.
U.S. stocks opened the period on the upswing, as investors anticipated and then cheered passage of the Republican tax reform package in December 2017. Sharp cuts in corporate taxes, a key element of the bill, raised corporate-profit expectations. Stocks also got a boost from positive U.S. economic data, including the jobless rate which fell to a 17-year low.
Stocks pulled back in February 2018 amid fears that rising rates would spur inflation and boost the appeal of fixed income investments at the expense of stocks. After a brief rebound, equity markets weakened anew in the spring of 2018, as investors confronted the prospect of a global trade war from President Trump’s imposition of broad new tariffs. The tariffs drew retaliatory action from impacted countries ranging from China and Canada, to the European Union.
Stocks bounced back in the final two months of the period. Technology stocks led the advance, overcoming an earlier setback from a wave of data-privacy scandals. U.S. economic indicators remained largely positive in the period, prompting the U.S. Federal Reserve to raise its benchmark interest rate three times over the 12-month span.
Overseas equity markets delivered mixed results in the period. After early strength aided by rising corporate profits, European stocks pulled back as trade war worries threatened the region’s economy. Similarly, after early gains, China entered a prolonged stock slump that reached bear market territory in late June 2018. Besides trade war fears, signs of slowing economic growth also weighed on Chinese stocks.
For the 12-month period ended August 31, 2018, all major U.S. stock indexes recorded double-digit gains. The blue-chip Dow Jones Industrial Average2 advanced 21.00%, while the broader U.S. equity market, as represented by the S&P 500 Index, rose 19.66%. The technology-laden NASDAQ Composite Index surged 27.45% in the period. Small-cap U.S. stocks, as measured by the Russell 2000® Index, outperformed their large-cap counterparts as measured by the S&P 500 Index during the period. Growth stocks as a group outpaced value stocks in both the large- and small-cap categories, as measured by the Russell growth and value indexes.
Fund Performance
For the 12-month period ended August 31, 2018, Eaton Vance Tax-Advantaged Dividend Income Fund (the Fund) had a total return of 17.79% at net asset value (NAV), outperforming the Fund’s primary benchmark, the Russell 1000® Value Index (the Index), which returned 12.47% for the same period.
The Fund’s common stock allocation outperformed the Index for the 12-month period. The use of leverage6 contributed to relative
performance versus the Index as well. The Fund’s allocation to preferred securities (i.e., preferred stocks, exchange-traded funds investing primarily in preferred stocks, and corporate bonds and notes with preferred characteristics), however, detracted from performance versus the Index.
Within the Fund’s common stock allocation, stock selection in all sectors contributed to relative performance. On a sector basis, top contributors included stock selection in the industrials and consumer discretionary sectors, as well as stock selection and an overweight position, relative to the Index, in the information technology sector. Within industrials, the Fund’s out-of-Index holding in freight forwarding and logistics provider C.H. Robinson Worldwide, Inc., performed strongly on a substantial rise in trucking rates during the period, driven by shortages in both drivers and trucking capacity. In consumer discretionary, the Fund purchased an out-of-Index position in athletic apparel retailer Lululemon Athletica, Inc., after its stock declined on operational and management concerns. The stock subsequently rose sharply on strong sales, particularly in the women’s workout wear category.
In contrast, a number of stocks detracted from results versus the Index. The Fund’s overweight position in tobacco company Philip Morris International, Inc., declined after the company reported strong sales of its electronic cigarette products in the Japanese market and then reversed itself within a few weeks. The stock was sold during the period. The Fund’s overweight holding in biotech firm Gilead Sciences, Inc., (Gilead) declined during the period as well. The market had expected that rising sales of Gilead’s new HIV drugs would compensate for slowing sales of its older hepatitis C products. When HIV drug sales did not ramp up as quickly as the market expected, Gilead’s stock price suffered.
The Fund’s use of leverage, as noted above, contributed to performance versus the Index. As of the 12-month period-end on August 31, 2018, the Fund had leverage equal to 20.19% of the Fund’s aggregate net assets plus borrowings outstanding. Leverage has the effect of magnifying the Fund’s exposure to its underlying investments in both up and down markets. Accordingly, leverage helped the Fund’s relative performance during a period in which value stocks as a group delivered positive returns.
For the 12-month period ended August 31, 2018, the Fund’s preferred security allocation underperformed both the Index and the overall preferred market, as measured by the ICE BofAML Fixed Rate Preferred Securities Index. Weak performance of lower rated holdings in the preferred allocation, especially those rated below investment grade, was a key driver of that relative underperformance.
See Endnotes and Additional Disclosures in this report.
Past performance is no guarantee of future results. Returns are historical and are calculated by determining the percentage change in net asset value (NAV) or market price (as applicable) with all distributions reinvested and include management fees and other expenses. Fund performance at market price will differ from its results at NAV due to factors such as changing perceptions about the Fund, market conditions, fluctuations in supply and demand for Fund shares, or changes in Fund distributions. Investment return and principal value will fluctuate so that shares, when sold, may be worth more or less than their original cost. Performance less than or equal to one year is cumulative. Performance is for the stated time period only; due to market volatility, current Fund performance may be lower or higher than the quoted return. For performance as of the most recent month-end, please refer to eatonvance.com.
Eaton Vance
Tax-Advantaged Dividend Income Fund
August 31, 2018
Performance2,3
Portfolio Managers Edward J. Perkin, CFA, Michael A. Allison, CFA, John H. Croft, CFA and Aaron S. Dunn, CFA
| | | | | | | | | | | | | | | | |
| % Average Annual Total Returns | | Inception Date | | | One Year | | | Five Years | | | Ten Years | |
Fund at NAV | | | 09/30/2003 | | | | 17.79 | % | | | 12.82 | % | | | 8.60 | % |
Fund at Market Price | | | — | | | | 20.98 | | | | 15.23 | | | | 10.23 | |
Russell 1000® Value Index | | | — | | | | 12.47 | % | | | 11.21 | % | | | 8.92 | % |
ICE BofAML Fixed Rate Preferred Securities Index | | | — | | | | 1.93 | | | | 7.17 | | | | 5.72 | |
Blended Index | | | — | | | | 9.31 | | | | 10.10 | | | | 8.27 | |
| | | | |
| | | | | | | | | | | | | | | | |
| % Premium/Discount to NAV4 | | | | | | | | | | | | |
| | | | | | | | | | | | | | | 0.49 | % |
| | | | |
| | | | | | | | | | | | | | | | |
| Distributions5 | | | | | | | | | | | | |
Total Distributions per share for the period | | | | | | | | | | | | | | $ | 1.740 | |
Distribution Rate at NAV | | | | | | | | | | | | | | | 7.18 | % |
Distribution Rate at Market Price | | | | | | | | | | | | | | | 7.14 | % |
| | | | |
| | | | | | | | | | | | | | | | |
| % Total Leverage6 | | | | | | | | | | | | |
Borrowings | | | | | | | | | | | | | | | 20.19 | % |
See Endnotes and Additional Disclosures in this report.
Past performance is no guarantee of future results. Returns are historical and are calculated by determining the percentage change in net asset value (NAV) or market price (as applicable) with all distributions reinvested and include management fees and other expenses. Fund performance at market price will differ from its results at NAV due to factors such as changing perceptions about the Fund, market conditions, fluctuations in supply and demand for Fund shares, or changes in Fund distributions. Investment return and principal value will fluctuate so that shares, when sold, may be worth more or less than their original cost. Performance less than or equal to one year is cumulative. Performance is for the stated time period only; due to market volatility, current Fund performance may be lower or higher than the quoted return. For performance as of the most recent month-end, please refer to eatonvance.com.
Eaton Vance
Tax-Advantaged Dividend Income Fund
August 31, 2018
Fund Profile
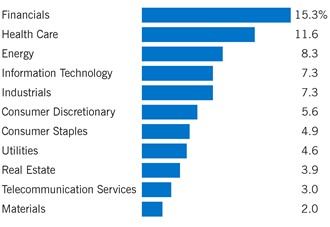
Common Stock Sector Allocation (% of total investments)
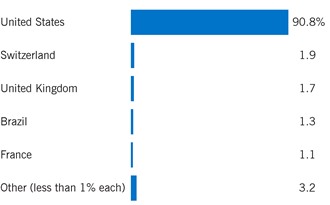
Country Allocation (% of total investments)8
Top 10 Holdings (% of total investments)7
| | | | |
JPMorgan Chase & Co. | | | 3.6 | % |
| |
Verizon Communications, Inc. | | | 3.0 | |
| |
Exxon Mobil Corp. | | | 2.8 | |
| |
Johnson & Johnson | | | 2.6 | |
| |
First Trust Preferred Securities and Income ETF | | | 2.3 | |
| |
ConocoPhillips | | | 2.0 | |
| |
Merck & Co., Inc. | | | 2.0 | |
| |
NextEra Energy, Inc. | | | 1.7 | |
| |
Alphabet, Inc., Class C | | | 1.6 | |
| |
QUALCOMM, Inc. | | | 1.5 | |
| |
Total | | | 23.1 | % |
See Endnotes and Additional Disclosures in this report.
Eaton Vance
Tax-Advantaged Dividend Income Fund
August 31, 2018
Endnotes and Additional Disclosures
| 1 | The views expressed in this report are those of the portfolio manager(s) and are current only through the date stated at the top of this page. These views are subject to change at any time based upon market or other conditions, and Eaton Vance and the Fund(s) disclaim any responsibility to update such views. These views may not be relied upon as investment advice and, because investment decisions are based on many factors, may not be relied upon as an indication of trading intent on behalf of any Eaton Vance fund. This commentary may contain statements that are not historical facts, referred to as “forward looking statements.” The Fund’s actual future results may differ significantly from those stated in any forward looking statement, depending on factors such as changes in securities or financial markets or general economic conditions, the volume of sales and purchases of Fund shares, the continuation of investment advisory, administrative and service contracts, and other risks discussed from time to time in the Fund’s filings with the Securities and Exchange Commission. |
| 2 | Dow Jones Industrial Average is a price-weighted average of 30 blue-chip stocks that are generally the leaders in their industry. S&P 500 Index is an unmanaged index of large-cap stocks commonly used as a measure of U.S. stock market performance. NASDAQ Composite Index is a market capitalization- weighted index of all domestic and international securities listed on NASDAQ. Source: Nasdaq, Inc. The information is provided by Nasdaq (with its affiliates, are referred to as the “Corporations”) and Nasdaq’s third party licensors on an “as is” basis and the Corporations make no guarantees and bear no liability of any kind with respect to the information or the Fund. Russell 2000® Index is an unmanaged index of 2,000 U.S. small-cap stocks. Russell1000® Value Index is an unmanaged index of U.S. large-cap value stocks. ICE BofAML Fixed Rate Preferred Securities Index is an unmanaged index of fixed-rate, preferred securities issued in the U.S. ICE® BofAML® indices are not for redistribution or other uses; provided “as is”, without warranties, and with no liability. Eaton Vance has prepared this report and ICE Data Indices, LLC does not endorse it, or guarantee, review, or endorse Eaton Vance’s products. BofAML® is a licensed registered trademark of Bank of America Corporation in the United States and other countries. The Blended Index consists of 70% Russell 1000® Value Index and 30% ICE BofAML Fixed Rate Preferred Securities Index. Unless otherwise stated, index returns do not reflect the effect of any applicable sales charges, commissions, expenses, taxes or leverage, as applicable. It is not possible to invest directly in an index. |
| 3 | Performance results reflect the effects of leverage. Performance since inception for an index, if presented, is the performance since the Fund’s or oldest share class’ inception, as applicable. |
| 4 | The shares of the Fund often trade at a discount or premium from their net asset value. The discount or premium of the Fund may vary over time and may be higher or lower than what is quoted in this report. For up-to-date premium/discount information, please refer to http://eatonvance.com/closedend. |
| 5 | The Distribution Rate is based on the Fund’s last regular distribution per share in the period (annualized) divided by the Fund’s NAV or market price at the end of the period. The Fund’s distributions may be comprised of amounts characterized for federal income tax purposes as qualified and non-qualified ordinary dividends, capital gains and nondividend distributions, also known as return of capital. For additional information about nondividend distributions, please refer to Eaton Vance Closed- End Fund Distribution Notices (19a) posted on our website, eatonvance.com. The Fund will determine the federal income tax character of distributions paid to a shareholder after the end of the calendar year. This is reported on the IRS form 1099-DIV and provided to the shareholder shortly after each year- end. For information about the tax character of distributions made in prior calendar years, please refer to Performance-Tax Character of Distributions on the Fund’s webpage available at eatonvance.com. The Fund’s distributions are determined by the investment adviser based on its current assessment of the Fund’s long-term return potential. Fund distributions may be affected by numerous factors including changes in Fund performance, the cost of financing for leverage, portfolio holdings, realized and projected returns, and other factors. As portfolio and market conditions change, the rate of distributions paid by the Fund could change. |
| 6 | Total leverage is shown as a percentage of the Fund’s aggregate net assets plus borrowings outstanding. The Fund employs leverage through borrowings. Use of leverage creates an opportunity for income, but creates risks including greater price volatility. The cost of borrowings rises and falls with changes in short-term interest rates. The Fund may be required to maintain prescribed asset coverage for its leverage and may be required to reduce its leverage at an inopportune time. |
| 7 | Excludes cash and cash equivalents. |
| 8 | The Fund may obtain exposure to certain market segments through investments in exchange-traded funds (ETFs). For purposes of the chart, the Fund’s investments in ETFs are included based on the portfolio composition of each ETF. |
| | Fund profile subject to change due to active management. |
| | Important Notice to Shareholders |
| | On June 12, 2018, the Board of Trustees of the Fund approved a change to the fiscal year-end of the Eaton Vance Tax-Advantaged Dividend Income Fund from August 31 to October 31. |
Eaton Vance
Tax-Advantaged Dividend Income Fund
August 31, 2018
Portfolio of Investments
| | | | | | | | |
| Common Stocks — 92.1%(1) | |
| Security | | Shares | | | Value | |
|
| Aerospace & Defense — 3.2% | |
Hexcel Corp. | | | 265,351 | | | $ | 17,545,008 | |
Textron, Inc. | | | 392,915 | | | | 27,122,922 | |
United Technologies Corp. | | | 96,528 | | | | 12,712,738 | |
| | | | | | | $ | 57,380,668 | |
|
| Air Freight & Logistics — 1.7% | |
C.H. Robinson Worldwide, Inc. | | | 306,321 | | | $ | 29,431,322 | |
| | | | | | | $ | 29,431,322 | |
|
| Banks — 12.6% | |
Bank of America Corp. | | | 690,089 | | | $ | 21,344,453 | |
JPMorgan Chase & Co. | | | 692,600 | | | | 79,358,108 | |
KeyCorp | | | 1,211,816 | | | | 25,532,963 | |
PNC Financial Services Group, Inc. (The) | | | 220,411 | | | | 31,637,795 | |
Sterling Bancorp | | | 338,122 | | | | 7,726,088 | |
U.S. Bancorp | | | 446,042 | | | | 24,135,332 | |
Wells Fargo & Co. | | | 552,342 | | | | 32,300,960 | |
| | | | | | | $ | 222,035,699 | |
|
| Beverages — 1.8% | |
Constellation Brands, Inc., Class A | | | 36,511 | | | $ | 7,601,590 | |
PepsiCo, Inc. | | | 211,964 | | | | 23,742,088 | |
| | | | | | | $ | 31,343,678 | |
|
| Biotechnology — 0.9% | |
Gilead Sciences, Inc. | | | 199,299 | | | $ | 15,092,913 | |
| | | | | | | $ | 15,092,913 | |
|
| Capital Markets — 4.3% | |
Charles Schwab Corp. (The) | | | 382,544 | | | $ | 19,429,410 | |
Credit Suisse Group AG | | | 933,303 | | | | 13,975,809 | |
E*TRADE Financial Corp.(2) | | | 216,062 | | | | 12,717,409 | |
Goldman Sachs Group, Inc. (The) | | | 78,472 | | | | 18,661,426 | |
Lazard, Ltd., Class A | | | 221,275 | | | | 10,652,179 | |
| | | | | | | $ | 75,436,233 | |
|
| Chemicals — 1.2% | |
DowDuPont, Inc. | | | 306,827 | | | $ | 21,517,777 | |
| | | | | | | $ | 21,517,777 | |
| | | | | | | | |
| Security | | Shares | | | Value | |
|
| Construction & Engineering — 0.5% | |
Abengoa S.A., Class A(2) | | | 571,132 | | | $ | 14,346 | |
Abengoa S.A., Class B(2) | | | 5,905,644 | | | | 68,358 | |
Fluor Corp. | | | 161,999 | | | | 9,300,362 | |
| | | | | | | $ | 9,383,066 | |
|
| Consumer Finance — 0.6% | |
Discover Financial Services | | | 139,141 | | | $ | 10,869,695 | |
| | | | | | | $ | 10,869,695 | |
|
| Containers & Packaging — 1.3% | |
Ball Corp. | | | 569,675 | | | $ | 23,857,989 | |
| | | | | | | $ | 23,857,989 | |
|
| Diversified Financial Services — 0.9% | |
Berkshire Hathaway, Inc., Class B(2) | | | 74,290 | | | $ | 15,505,809 | |
| | | | | | | $ | 15,505,809 | |
|
| Diversified Telecommunication Services — 3.8% | |
Verizon Communications, Inc. | | | 1,224,046 | | | $ | 66,551,381 | |
| | | | | | | $ | 66,551,381 | |
|
| Electric Utilities — 3.1% | |
Edison International | | | 266,823 | | | $ | 17,538,276 | |
NextEra Energy, Inc. | | | 220,083 | | | | 37,436,118 | |
| | | | | | | $ | 54,974,394 | |
|
| Electronic Equipment, Instruments & Components — 1.3% | |
FLIR Systems, Inc. | | | 354,761 | | | $ | 22,257,705 | |
| | | | | | | $ | 22,257,705 | |
|
| Energy Equipment & Services — 1.9% | |
Halliburton Co. | | | 555,695 | | | $ | 22,166,673 | |
Oceaneering International, Inc. | | | 411,344 | | | | 11,628,695 | |
| | | | | | | $ | 33,795,368 | |
|
| Equity Real Estate Investment Trusts (REITs) — 4.9% | |
AvalonBay Communities, Inc. | | | 169,616 | | | $ | 31,088,917 | |
Boston Properties, Inc. | | | 128,247 | | | | 16,729,821 | |
ProLogis, Inc. | | | 93,566 | | | | 6,285,739 | |
Public Storage | | | 34,333 | | | | 7,298,509 | |
Simon Property Group, Inc. | | | 134,678 | | | | 24,650,114 | |
| | | | | | | $ | 86,053,100 | |
| | | | |
| | 6 | | See Notes to Financial Statements. |
Eaton Vance
Tax-Advantaged Dividend Income Fund
August 31, 2018
Portfolio of Investments — continued
| | | | | | | | |
| Security | | Shares | | | Value | |
|
| Food Products — 2.3% | |
McCormick & Co., Inc. | | | 115,680 | | | $ | 14,446,118 | |
Mondelez International, Inc., Class A | | | 619,001 | | | | 26,443,723 | |
| | | | | | | $ | 40,889,841 | |
|
| Health Care Equipment & Supplies — 2.4% | |
Baxter International, Inc. | | | 278,171 | | | $ | 20,687,577 | |
Boston Scientific Corp.(2) | | | 587,120 | | | | 20,877,987 | |
| | | | | | | $ | 41,565,564 | |
|
| Health Care Providers & Services — 2.2% | |
Aetna, Inc. | | | 120,746 | | | $ | 24,181,801 | |
Anthem, Inc. | | | 57,857 | | | | 15,316,484 | |
| | | | | | | $ | 39,498,285 | |
|
| Hotels, Restaurants & Leisure — 0.7% | |
Starbucks Corp. | | | 232,013 | | | $ | 12,401,095 | |
| | | | | | | $ | 12,401,095 | |
|
| Household Products — 1.1% | |
Colgate-Palmolive Co. | | | 296,648 | | | $ | 19,700,394 | |
| | | | | | | $ | 19,700,394 | |
|
| Insurance — 0.8% | |
American Financial Group, Inc. | | | 119,735 | | | $ | 13,333,690 | |
| | | | | | | $ | 13,333,690 | |
|
| Internet Software & Services — 2.0% | |
Alphabet, Inc., Class C(2) | | | 29,601 | | | $ | 36,059,642 | |
| | | | | | | $ | 36,059,642 | |
|
| IT Services — 1.7% | |
Leidos Holdings, Inc. | | | 420,284 | | | $ | 29,743,499 | |
| | | | | | | $ | 29,743,499 | |
|
| Machinery — 2.2% | |
Gardner Denver Holdings, Inc.(2) | | | 462,530 | | | $ | 12,932,339 | |
Parker-Hannifin Corp. | | | 152,352 | | | | 26,753,011 | |
| | | | | | | $ | 39,685,350 | |
|
| Media — 1.2% | |
Walt Disney Co. (The) | | | 190,006 | | | $ | 21,284,472 | |
| | | | | | | $ | 21,284,472 | |
| | | | | | | | |
| Security | | Shares | | | Value | |
|
| Multi-Utilities — 2.6% | |
CMS Energy Corp. | | | 512,262 | | | $ | 25,223,781 | |
Sempra Energy | | | 176,700 | | | | 20,511,336 | |
| | | | | | | $ | 45,735,117 | |
|
| Oil, Gas & Consumable Fuels — 8.4% | |
ConocoPhillips | | | 611,127 | | | $ | 44,875,056 | |
EOG Resources, Inc. | | | 200,366 | | | | 23,689,272 | |
Exxon Mobil Corp. | | | 775,958 | | | | 62,208,553 | |
Phillips 66 | | | 150,083 | | | | 17,786,336 | |
| | | | | | | $ | 148,559,217 | |
|
| Personal Products — 0.9% | |
Estee Lauder Cos., Inc. (The), Class A | | | 118,857 | | | $ | 16,654,243 | |
| | | | | | | $ | 16,654,243 | |
|
| Pharmaceuticals — 9.0% | |
GlaxoSmithKline PLC ADR | | | 403,962 | | | $ | 16,360,461 | |
Johnson & Johnson | | | 433,039 | | | | 58,326,023 | |
Merck & Co., Inc. | | | 632,408 | | | | 43,376,865 | |
Pfizer, Inc. | | | 592,269 | | | | 24,591,009 | |
Zoetis, Inc. | | | 181,489 | | | | 16,442,903 | |
| | | | | | | $ | 159,097,261 | |
|
| Road & Rail — 1.4% | |
CSX Corp. | | | 325,155 | | | $ | 24,113,495 | |
| | | | | | | $ | 24,113,495 | |
|
| Semiconductors & Semiconductor Equipment — 2.9% | |
Intel Corp. | | | 390,592 | | | $ | 18,916,370 | |
QUALCOMM, Inc. | | | 478,456 | | | | 32,874,712 | |
| | | | | | | $ | 51,791,082 | |
|
| Specialty Retail — 2.2% | |
Home Depot, Inc. (The) | | | 71,127 | | | $ | 14,280,168 | |
TJX Cos., Inc. (The) | | | 149,720 | | | | 16,464,709 | |
Tractor Supply Co. | | | 94,837 | | | | 8,372,210 | |
| | | | | | | $ | 39,117,087 | |
|
| Technology Hardware, Storage & Peripherals — 1.2% | |
Apple, Inc. | | | 89,355 | | | $ | 20,339,879 | |
| | | | | | | $ | 20,339,879 | |
| | | | |
| | 7 | | See Notes to Financial Statements. |
Eaton Vance
Tax-Advantaged Dividend Income Fund
August 31, 2018
Portfolio of Investments — continued
| | | | | | | | |
| Security | | Shares | | | Value | |
|
| Textiles, Apparel & Luxury Goods — 2.9% | |
Lululemon Athletica, Inc.(2) | | | 120,793 | | | $ | 18,714,460 | |
Tapestry, Inc. | | | 294,717 | | | | 14,939,205 | |
VF Corp. | | | 197,518 | | | | 18,197,333 | |
| | | | | | | $ | 51,850,998 | |
| |
Total Common Stocks
(identified cost $1,252,912,562) | | | $ | 1,626,907,008 | |
|
| Preferred Stocks — 7.8%(1) | |
| Security | | Shares | | | Value | |
|
| Banks — 2.0% | |
AgriBank FCB, 6.875% to 1/1/24(3) | | | 92,513 | | | $ | 9,945,148 | |
CoBank ACB, Series F, 6.25% to 10/1/22(3) | | | 94,700 | | | | 9,896,150 | |
Farm Credit Bank of Texas, 6.75% to 9/15/23(3)(4) | | | 13,800 | | | | 1,483,500 | |
First Tennessee Bank NA, 3.75%, (3 mo. USD LIBOR + 0.85%, Floor 3.75%)(4)(5) | | | 4,660 | | | | 3,635,285 | |
IBERIABANK Corp., Series C, 6.60% to 5/1/26(3) | | | 168,770 | | | | 4,599,826 | |
Texas Capital Bancshares, Inc., 6.50% | | | 128,965 | | | | 3,301,504 | |
Wells Fargo & Co., Series Y, 5.625% | | | 104,075 | | | | 2,638,301 | |
| | | | | | | $ | 35,499,714 | |
|
| Electric Utilities — 1.9% | |
NextEra Energy Capital Holdings, Inc., Series I, 5.125% | | | 168,192 | | | $ | 4,208,164 | |
NextEra Energy Capital Holdings, Inc., Series K, 5.25% | | | 286,000 | | | | 7,109,960 | |
SCE Trust VI, 5.00% | | | 601,650 | | | | 14,042,511 | |
Southern Co. (The), 6.25% | | | 316,040 | | | | 8,236,002 | |
| | | | | | | $ | 33,596,637 | |
|
| Equity Real Estate Investment Trusts (REITs) — 1.3% | |
CBL & Associates Properties, Inc., Series D, 7.375% | | | 390,325 | | | $ | 7,142,948 | |
DDR Corp., Series A, 6.375% | | | 250,625 | | | | 6,385,925 | |
DDR Corp., Series K, 6.25% | | | 41,325 | | | | 1,017,835 | |
Spirit Realty Capital, Inc., Series A, 6.00% | | | 190,092 | | | | 4,552,703 | |
Vornado Realty Trust, Series K, 5.70% | | | 146,527 | | | | 3,752,556 | |
| | | | | | | $ | 22,851,967 | |
|
| Food Products — 0.8% | |
Dairy Farmers of America, Inc., 7.875%(4) | | | 94,450 | | | $ | 9,563,063 | |
Ocean Spray Cranberries, Inc., 6.25%(4) | | | 57,835 | | | | 5,132,856 | |
| | | | | | | $ | 14,695,919 | |
|
| Insurance — 0.3% | |
PartnerRe, Ltd., Series I, 5.875% | | | 212,421 | | | $ | 5,342,388 | |
| | | | | | | $ | 5,342,388 | |
| | | | | | | | |
| Security | | Shares | | | Value | |
|
| Machinery — 0.4% | |
Stanley Black & Decker, Inc., 5.75% | | | 310,219 | | | $ | 7,904,380 | |
| | | | | | | $ | 7,904,380 | |
|
| Multi-Utilities — 0.1% | |
DTE Energy Co., Series C, 5.25% | | | 59,547 | | | $ | 1,464,856 | |
| | | | | | | $ | 1,464,856 | |
|
| Oil, Gas & Consumable Fuels — 1.0% | |
NuStar Energy, L.P., Series B, 7.625% to 6/15/22(3) | | | 733,275 | | | $ | 17,070,642 | |
| | | | | | | $ | 17,070,642 | |
| |
Total Preferred Stocks
(identified cost $139,549,500) | | | $ | 138,426,503 | |
| | | | | | | | | | |
|
| Corporate Bonds & Notes — 21.1%(1) | |
| Security | | | | Principal
Amount
(000’s omitted) | | | Value | |
|
| Airlines — 0.2% | |
Azul Investments LLP, 5.875%, 10/26/24(4) | | | | $ | 2,895 | | | $ | 2,491,871 | |
| | | | | | | | | $ | 2,491,871 | |
|
| Automobiles — 0.4% | |
General Motors Financial Co., Inc., Series A, 5.75% to 9/30/27(3)(6) | | | | $ | 7,260 | | | $ | 7,083,037 | |
| | | | | | | | | $ | 7,083,037 | |
|
| Banks — 9.8% | |
Australia and New Zealand Banking Group, Ltd., 6.75% to 6/15/26(3)(4)(6) | | | | $ | 10,720 | | | $ | 11,148,800 | |
Banco Bilbao Vizcaya Argentaria S.A., 6.125% to 11/16/27(3)(6) | | | | | 7,700 | | | | 6,811,189 | |
Banco do Brasil S.A., 6.25% to 4/15/24(3)(4)(6) | | | | | 15,195 | | | | 11,490,459 | |
Banco Mercantil del Norte S.A./Grand Cayman, 7.625% to 1/6/28(3)(4)(6) | | | | | 5,475 | | | | 5,581,763 | |
Bank of America Corp., Series AA, 6.10% to 3/17/25(3)(6) | | | | | 12,530 | | | | 13,212,885 | |
Bank of America Corp., Series FF, 5.875% to 3/15/28(3)(6) | | | | | 5,250 | | | | 5,256,563 | |
Citigroup, Inc., Series M, 6.30% to 5/15/24(3)(6) | | | | | 3,755 | | | | 3,862,956 | |
Citigroup, Inc., Series T, 6.25% to 8/15/26(3)(6) | | | | | 8,470 | | | | 8,893,500 | |
Credit Agricole S.A., 7.875% to 1/23/24(3)(4)(6) | | | | | 11,085 | | | | 11,791,059 | |
Credit Suisse Group AG, 7.50% to
7/17/23(3)(4)(6) | | | | | 7,927 | | | | 8,216,335 | |
Farm Credit Bank of Texas, Series 3, 6.20% to 6/15/28(3)(4)(6) | | | | | 5,827 | | | | 5,928,972 | |
| | | | |
| | 8 | | See Notes to Financial Statements. |
Eaton Vance
Tax-Advantaged Dividend Income Fund
August 31, 2018
Portfolio of Investments — continued
| | | | | | | | | | |
| Security | | | | Principal
Amount
(000’s omitted) | | | Value | |
|
| Banks (continued) | |
JPMorgan Chase & Co., Series X, 6.10% to 10/1/24(3)(6) | | | | $ | 25,858 | | | $ | 26,956,965 | |
Lloyds Banking Group PLC, 7.50% to 6/27/24(3)(6) | | | | | 11,145 | | | | 11,605,088 | |
M&T Bank Corp., Series F, 5.125% to 11/1/26(3)(6) | | | | | 4,260 | | | | 4,244,025 | |
Royal Bank of Scotland Group PLC, 8.00% to 8/10/25(3)(6) | | | | | 8,348 | | | | 8,911,490 | |
Societe Generale S.A., 6.75% to
4/6/28(3)(4)(6) | | | | | 13,190 | | | | 12,497,525 | |
SunTrust Banks, Inc., Series H, 5.125% to 12/15/27(3)(6) | | | | | 3,890 | | | | 3,667,103 | |
UniCredit SpA, 8.00% to 6/3/24(3)(6)(7) | | | | | 12,790 | | | | 11,757,898 | |
Zions Bancorporation, Series I, 5.80% to 6/15/23(3)(6) | | | | | 1,243 | | | | 1,246,108 | |
| | | | | | | | | $ | 173,080,683 | |
|
| Capital Markets — 1.8% | |
Banco BTG Pactual S.A./Cayman Islands, 5.50%, 1/31/23(4) | | | | $ | 3,300 | | | $ | 3,077,250 | |
Banco BTG Pactual S.A./Cayman Islands, 5.75%, 9/28/22(4) | | | | | 4,825 | | | | 4,541,676 | |
Charles Schwab Corp. (The), Series F, 5.00% to 12/1/27(3)(6) | | | | | 10,430 | | | | 10,130,138 | |
UBS Group AG, 6.875% to 8/7/25(3)(6)(7) | | | | | 13,656 | | | | 13,984,577 | |
| | | | | | | | | $ | 31,733,641 | |
|
| Construction & Engineering — 0.0%(8) | |
Abengoa Abenewco 2 SAU, 1.50%, (1.50% Cash or 0.25% Cash and 1.25% PIK), 3/31/23(4) | | | | $ | 2,410 | | | $ | 174,733 | |
| | | | | | | | | $ | 174,733 | |
|
| Diversified Financial Services — 0.8% | |
Cadence Financial Corp.,
4.875%, 6/28/19(4) | | | | $ | 7,086 | | | $ | 7,124,462 | |
Textron Financial Corp., 4.049%, (3 mo. USD LIBOR + 1.735%), 2/15/67(4)(5) | | | | | 3,129 | | | | 2,808,278 | |
Unifin Financiera SAB de CV, 8.875% to 1/29/25(3)(4)(6) | | | | | 5,110 | | | | 4,829,001 | |
| | | | | | | | | $ | 14,761,741 | |
|
| Electric Utilities — 1.0% | |
AES Gener S.A., 8.375% to 6/18/19, 12/18/73(3)(4) | | | | $ | 11,310 | | | $ | 11,612,203 | |
Southern Co. (The), Series B, 5.50% to 3/15/22, 3/15/57(3) | | | | | 5,910 | | | | 6,043,963 | |
| | | | | | | | | $ | 17,656,166 | |
| | | | | | | | | | |
| Security | | | | Principal
Amount
(000’s omitted) | | | Value | |
|
| Energy Equipment & Services — 0.3% | |
Oceaneering International, Inc., 6.00%, 2/1/28 | | | | $ | 5,490 | | | $ | 5,457,468 | |
| | | | | | | | | $ | 5,457,468 | |
|
| Food Products — 1.0% | |
JBS Investments GmbH, 7.75%, 10/28/20(4) | | | | $ | 4,193 | | | $ | 4,275,854 | |
Land O’ Lakes, Inc., 8.00%(4)(6) | | | | | 12,295 | | | | 13,524,500 | |
| | | | | | | | | $ | 17,800,354 | |
|
| Gas Utilities — 0.3% | |
NiSource, Inc., 5.65% to 6/15/23(3)(4)(6) | | | | $ | 5,750 | | | $ | 5,829,063 | |
| | | | | | | | | $ | 5,829,063 | |
|
| Insurance — 0.3% | |
MetLife, Inc., 6.40%, 12/15/66 | | | | $ | 5,200 | | | $ | 5,564,000 | |
| | | | | | | | | $ | 5,564,000 | |
|
| Metals & Mining — 0.4% | |
BHP Billiton Finance USA, Ltd., 6.75% to 10/19/25, 10/19/75(3)(4) | | | | $ | 6,865 | | | $ | 7,551,500 | |
| | | | | | | | | $ | 7,551,500 | |
|
| Multi-Utilities — 1.0% | |
Centerpoint Energy, Inc., Series A, 6.125% to 9/1/23(3)(6) | | | | $ | 11,713 | | | $ | 11,947,260 | |
Dominion Resources, Inc., 5.75% to 10/1/24, 10/1/54(3) | | | | | 4,430 | | | | 4,640,425 | |
| | | | | | | | | $ | 16,587,685 | |
|
| Oil, Gas & Consumable Fuels — 1.6% | |
EnLink Midstream Partners, L.P., Series C, 6.00% to 12/15/22(3)(6) | | | | $ | 8,752 | | | $ | 8,072,552 | |
Enterprise Products Operating, LLC, Series E, 5.25% to 8/16/27, 8/16/77(3) | | | | | 10,985 | | | | 10,408,287 | |
Odebrecht Oil & Gas Finance, Ltd., 0.00%(4)(6) | | | | | 1 | | | | 7 | |
Plains All American Pipeline, L.P., Series B, 6.125% to 11/15/22(3)(6) | | | | | 10,360 | | | | 10,152,800 | |
| | | | | | | | | $ | 28,633,646 | |
|
| Pharmaceuticals — 0.6% | |
Teva Pharmaceutical Finance Netherlands III B.V., 6.00%, 4/15/24 | | | | $ | 9,565 | | | $ | 9,723,938 | |
| | | | | | | | | $ | 9,723,938 | |
| | | | |
| | 9 | | See Notes to Financial Statements. |
Eaton Vance
Tax-Advantaged Dividend Income Fund
August 31, 2018
Portfolio of Investments — continued
| | | | | | | | | | | | |
| Security | | | | | Principal
Amount
(000’s omitted) | | | Value | |
|
| Pipelines — 1.0% | |
Enbridge Energy Partners, L.P., 6.135%, (3 mo. USD LIBOR + 3.798%), 10/1/77(5) | | | | | | $ | 10,555 | | | $ | 10,613,386 | |
Energy Transfer Partners, L.P., Series A, 6.25% to 2/15/23(3)(6) | | | | | | | 7,524 | | | | 7,293,577 | |
| | | | | | | | | | | $ | 17,906,963 | |
|
| Toys, Games & Hobbies — 0.4% | |
Mattel, Inc., 6.75%, 12/31/25(4) | | | | | | $ | 7,460 | | | $ | 7,325,272 | |
| | | | | | | | | | | $ | 7,325,272 | |
|
| Transportation — 0.2% | |
JSL Europe S.A., 7.75%, 7/26/24(4) | | | | | | $ | 2,755 | | | $ | 2,448,534 | |
| | | | | | | | | | | $ | 2,448,534 | |
| | |
Total Corporate Bonds & Notes
(identified cost $378,294,774) | | | | | | | $ | 371,810,295 | |
| |
| Foreign Government Bonds — 0.1% | | | | | |
| Security | | | | | Principal
Amount
(000’s omitted) | | | Value | |
| | | |
| Argentina — 0.1% | | | | | | | | | |
Republic of Argentina,
7.50%, 4/22/26(1) | | | USD | | | | 2,600 | | | $ | 2,152,826 | |
| | | | | | | | | | | $ | 2,152,826 | |
| |
Total Foreign Government Bonds
(identified cost $2,308,373) | | | $ | 2,152,826 | |
| |
| Exchange-Traded Funds — 2.9% | | | | | |
| Security | | | | | Shares | | | Value | |
|
| Equity Funds — 2.9% | |
First Trust Preferred Securities and Income ETF(1) | | | | | | | 2,680,555 | | | $ | 51,734,711 | |
| |
Total Exchange-Traded Funds
(identified cost $53,916,261) | | | $ | 51,734,711 | |
| | | | | | | | | | | | |
| Short-Term Investments — 0.7% | | | | | |
| Description | | Units | | | Value | |
Eaton Vance Cash Reserves Fund, LLC,
2.14%(9) | | | 12,608,286 | | | $ | 12,609,547 | |
| |
Total Short-Term Investments
(identified cost $12,608,545) | | | $ | 12,609,547 | |
| |
Total Investments — 124.7%
(identified cost $1,839,590,015) | | | $ | 2,203,640,890 | |
| |
Other Assets, Less Liabilities — (24.7)% | | | $ | (436,490,558 | ) |
| |
Net Assets — 100.0% | | | $ | 1,767,150,332 | |
The percentage shown for each investment category in the Portfolio of Investments is based on net assets.
| (1) | Security (or a portion thereof) has been segregated as collateral with the custodian for borrowings under the Credit Agreement. |
| (2) | Non-income producing security. |
| (3) | Security converts to floating rate after the indicated fixed-rate coupon period. |
| (4) | Security exempt from registration pursuant to Rule 144A under the Securities Act of 1933, as amended. These securities may be sold in certain transactions in reliance on an exemption from registration (normally to qualified institutional buyers). At August 31, 2018, the aggregate value of these securities is $164,083,821 or 9.3% of the Fund’s net assets. |
| (5) | Variable rate security. The stated dividend/interest rate represents the rate in effect at August 31, 2018. |
| (6) | Perpetual security with no stated maturity date but may be subject to calls by the issuer. |
| (7) | Security exempt from registration under Regulation S of the Securities Act of 1933, which exempts from registration securities offered and sold outside the United States. Security may not be offered or sold in the United States except pursuant to an exemption from, or in a transaction not subject to, the registration requirements of the Securities Act of 1933. At August 31, 2018, the aggregate value of these securities is $25,742,475 or 1.5% of the Fund’s net assets. |
| (8) | Amount is less than 0.05%. |
| (9) | Affiliated investment company, available to Eaton Vance portfolios and funds, which invests in high quality, U.S. dollar denominated money market instruments. The rate shown is the annualized seven-day yield as of August 31, 2018. |
| | | | |
| | 10 | | See Notes to Financial Statements. |
Eaton Vance
Tax-Advantaged Dividend Income Fund
August 31, 2018
Portfolio of Investments — continued
| | | | | | | | |
| Country Concentration of Portfolio | |
| Country | | Percentage of
Total Investments | | | Value | |
United States | | | 88.5 | % | | $ | 1,949,469,241 | |
Switzerland | | | 1.9 | | | | 41,519,109 | |
United Kingdom | | | 1.7 | | | | 36,877,039 | |
Brazil | | | 1.3 | | | | 28,325,651 | |
France | | | 1.1 | | | | 24,288,584 | |
Australia | | | 0.9 | | | | 18,700,300 | |
Italy | | | 0.5 | | | | 11,757,898 | |
Chile | | | 0.5 | | | | 11,612,203 | |
Mexico | | | 0.5 | | | | 10,410,764 | |
Israel | | | 0.4 | | | | 9,723,938 | |
Spain | | | 0.3 | | | | 7,068,626 | |
Argentina | | | 0.1 | | | | 2,152,826 | |
Exchange-Traded Funds | | | 2.3 | | | | 51,734,711 | |
Total Investments | | | 100.0 | % | | $ | 2,203,640,890 | |
Abbreviations:
| | | | |
| ADR | | – | | American Depositary Receipt |
| LIBOR | | – | | London Interbank Offered Rate |
| PIK | | – | | Payment In Kind |
| USD | | – | | United States Dollar |
| | | | |
| | 11 | | See Notes to Financial Statements. |
Eaton Vance
Tax-Advantaged Dividend Income Fund
August 31, 2018
Statement of Assets and Liabilities
| | | | |
| Assets | | August 31, 2018 | |
Unaffiliated investments, at value (identified cost, $1,826,981,470) | | $ | 2,191,031,343 | |
Affiliated investment, at value (identified cost, $12,608,545) | | | 12,609,547 | |
Dividends and interest receivable | | | 10,843,202 | |
Dividends receivable from affiliated investment | | | 18,934 | |
Receivable from the transfer agent | | | 502,775 | |
Tax reclaims receivable | | | 1,081,172 | |
Total assets | | $ | 2,216,086,973 | |
|
| Liabilities | |
Notes payable | | $ | 447,000,000 | |
Payable to affiliate: | | | | |
Investment adviser fee | | | 1,577,837 | |
Accrued expenses | | | 358,804 | |
Total liabilities | | $ | 448,936,641 | |
Net Assets | | $ | 1,767,150,332 | |
|
| Sources of Net Assets | |
Common shares, $0.01 par value, unlimited number of shares authorized, 72,882,477 shares issued and outstanding | | $ | 728,825 | |
Additional paid-in capital | | | 1,383,310,404 | |
Accumulated undistributed net investment income | | | 19,846,767 | |
Accumulated distributions in excess of net realized gain | | | (773,941 | ) |
Net unrealized appreciation | | | 364,038,277 | |
Net Assets | | $ | 1,767,150,332 | |
| |
| Net Asset Value | | | | |
($1,767,150,332 ÷ 72,882,477 common shares issued and outstanding) | | $ | 24.25 | |
| | | | |
| | 12 | | See Notes to Financial Statements. |
Eaton Vance
Tax-Advantaged Dividend Income Fund
August 31, 2018
Statement of Operations
| | | | |
| Investment Income | | Year Ended
August 31, 2018 | |
Dividends (net of foreign taxes, $177,504) | | $ | 49,174,498 | |
Interest (net of foreign taxes, $2,269) | | | 21,397,371 | |
Dividends from affiliated investment | | | 220,973 | |
Total investment income | | $ | 70,792,842 | |
| |
| Expenses | | | | |
Investment adviser fee | | $ | 18,123,298 | |
Trustees’ fees and expenses | | | 91,965 | |
Custodian fee | | | 487,277 | |
Transfer and dividend disbursing agent fees | | | 19,615 | |
Legal and accounting services | | | 156,325 | |
Printing and postage | | | 425,120 | |
Interest expense and fees | | | 10,445,077 | |
Miscellaneous | | | 89,637 | |
Total expenses | | $ | 29,838,314 | |
| |
Net investment income | | $ | 40,954,528 | |
| |
| Realized and Unrealized Gain (Loss) | | | | |
Net realized gain (loss) — | | | | |
Investment transactions | | $ | 105,457,844 | |
Investment transactions — affiliated investment | | | (1,074 | ) |
Proceeds from securities litigation settlements | | | 82,566 | |
Foreign currency transactions | | | 9,567 | |
Net realized gain | | $ | 105,548,903 | |
Change in unrealized appreciation (depreciation) — | | | | |
Investments | | $ | 128,784,690 | |
Investments — affiliated investment | | | 1,002 | |
Foreign currency | | | (102,205 | ) |
Net change in unrealized appreciation (depreciation) | | $ | 128,683,487 | |
| |
Net realized and unrealized gain | | $ | 234,232,390 | |
| |
Net increase in net assets from operations | | $ | 275,186,918 | |
| | | | |
| | 13 | | See Notes to Financial Statements. |
Eaton Vance
Tax-Advantaged Dividend Income Fund
August 31, 2018
Statements of Changes in Net Assets
| | | | | | | | |
| | | Year Ended August 31, | |
| Increase (Decrease) in Net Assets | | 2018 | | | 2017 | |
From operations — | | | | | | | | |
Net investment income | | $ | 40,954,528 | | | $ | 60,034,755 | |
Net realized gain | | | 105,548,903 | | | | 46,625,554 | |
Net change in unrealized appreciation (depreciation) | | | 128,683,487 | | | | 63,982,383 | |
Net increase in net assets from operations | | $ | 275,186,918 | | | $ | 170,642,692 | |
Distributions to shareholders — | | | | | | | | |
From net investment income | | $ | (34,189,693 | ) | | $ | (62,879,090 | ) |
From net realized gain | | | (92,551,664 | ) | | | (63,855,375 | ) |
Total distributions | | $ | (126,741,357 | ) | | $ | (126,734,465 | ) |
Capital share transactions — | | | | | | | | |
Reinvestment of distributions to common shareholders | | $ | 1,099,555 | | | $ | — | |
Net increase in net assets from capital share transactions | | $ | 1,099,555 | | | $ | — | |
| | |
Net increase in net assets | | $ | 149,545,116 | | | $ | 43,908,227 | |
|
| Net Assets | |
At beginning of year | | $ | 1,617,605,216 | | | $ | 1,573,696,989 | |
At end of year | | $ | 1,767,150,332 | | | $ | 1,617,605,216 | |
|
Accumulated undistributed net investment income
included in net assets | |
At end of year | | $ | 19,846,767 | | | $ | 17,964,597 | |
| | | | |
| | 14 | | See Notes to Financial Statements. |
Eaton Vance
Tax-Advantaged Dividend Income Fund
August 31, 2018
Statement of Cash Flows
| | | | |
| Cash Flows From Operating Activities | | Year Ended
August 31, 2018 | |
Net increase in net assets from operations | | $ | 275,186,918 | |
Adjustments to reconcile net increase in net assets from operations to net cash provided by operating activities: | | | | |
Investments purchased | | | (1,233,769,938 | ) |
Investments sold | | | 1,328,872,053 | |
Increase in short-term investments, net | | | (12,609,619 | ) |
Net amortization/accretion of premium (discount) | | | (156,662 | ) |
Decrease in dividends and interest receivable | | | 253,293 | |
Increase in dividends receivable from affiliated investment | | | (12,931 | ) |
Increase in receivable from the transfer agent | | | (502,775 | ) |
Decrease in tax reclaims receivable | | | 2,652,699 | |
Increase in payable to affiliate for investment adviser fee | | | 94,867 | |
Decrease in accrued expenses | | | (15,097 | ) |
Net change in unrealized (appreciation) depreciation from investments | | | (128,785,692 | ) |
Net realized gain from investments | | | (105,456,770 | ) |
Net cash provided by operating activities | | $ | 125,750,346 | |
|
| Cash Flows From Financing Activities | |
Cash distributions paid | | $ | (125,641,802 | ) |
Decrease in due to custodian | | | (108,568 | ) |
Net cash used in financing activities | | $ | (125,750,370 | ) |
| |
Net decrease in cash* | | $ | (24 | ) |
| |
Cash at beginning of year(1) | | $ | 24 | |
| |
Cash at end of year | | $ | — | |
|
| Supplemental disclosure of cash flow information: | |
Noncash financing activities not included herein consist of: | | | | |
Reinvestment of dividends and distributions | | $ | 1,099,555 | |
Cash paid for interest and fees on borrowings | | $ | 10,423,365 | |
| * | Includes net change in unrealized appreciation (depreciation) on foreign currency of $(5). |
| (1) | Balance includes foreign currency, at value. |
| | | | |
| | 15 | | See Notes to Financial Statements. |
Eaton Vance
Tax-Advantaged Dividend Income Fund
August 31, 2018
Financial Highlights
| | | | | | | | | | | | | | | | | | | | |
| | | Year Ended August 31, | |
| | | 2018 | | | 2017 | | | 2016 | | | 2015 | | | 2014 | |
Net asset value — Beginning of year | | $ | 22.210 | | | $ | 21.610 | | | $ | 21.220 | | | $ | 22.940 | | | $ | 19.500 | |
| | | | | |
| Income (Loss) From Operations | | | | | | | | | | | | | | | | | | | | |
Net investment income(1) | | $ | 0.562 | | | $ | 0.824 | | | $ | 0.743 | | | $ | 0.808 | | | $ | 1.429 | (2) |
Net realized and unrealized gain (loss) | | | 3.218 | | | | 1.516 | | | | 1.387 | | | | (1.080 | ) | | | 3.334 | |
| | | | | |
Total income (loss) from operations | | $ | 3.780 | | | $ | 2.340 | | | $ | 2.130 | | | $ | (0.272 | ) | | $ | 4.763 | |
| | | | | |
| Less Distributions | | | | | | | | | | | | | | | | | | | | |
From net investment income | | $ | (0.469 | ) | | $ | (0.863 | ) | | $ | (0.733 | ) | | $ | (1.085 | ) | | $ | (1.323 | ) |
From net realized gain | | | (1.271 | ) | | | (0.877 | ) | | | (1.007 | ) | | | (0.363 | ) | | | — | |
| | | | | |
Total distributions | | $ | (1.740 | ) | | $ | (1.740 | ) | | $ | (1.740 | ) | | $ | (1.448 | ) | | $ | (1.323 | ) |
| | | | | |
Net asset value — End of year | | $ | 24.250 | | | $ | 22.210 | | | $ | 21.610 | | | $ | 21.220 | | | $ | 22.940 | |
| | | | | |
Market value — End of year | | $ | 24.370 | | | $ | 21.730 | | | $ | 20.880 | | | $ | 19.290 | | | $ | 20.560 | |
| | | | | |
Total Investment Return on Net Asset Value(3) | | | 17.79 | % | | | 11.57 | % | | | 11.25 | % | | | (0.67 | )% | | | 25.90 | % |
| | | | | |
Total Investment Return on Market Value(3) | | | 20.98 | % | | | 12.97 | % | | | 18.24 | % | | | 0.76 | % | | | 24.80 | % |
| | | | | |
| Ratios/Supplemental Data | | | | | | | | | | | | | | | | | | | | |
Net assets, end of year (000’s omitted) | | $ | 1,767,150 | | | $ | 1,617,605 | | | $ | 1,573,697 | | | $ | 1,545,306 | | | $ | 1,671,173 | |
Ratios (as a percentage of average daily net assets): | | | | | | | | | | | | | | | | | | | | |
Expenses excluding interest and fees(4) | | | 1.14 | % | | | 1.16 | % | | | 1.18 | % | | | 1.14 | % | | | 1.15 | % |
Interest and fee expense | | | 0.61 | % | | | 0.46 | % | | | 0.29 | % | | | 0.21 | % | | | 0.22 | % |
Total expenses(4) | | | 1.75 | % | | | 1.62 | % | | | 1.47 | % | | | 1.35 | % | | | 1.37 | % |
Net investment income | | | 2.41 | % | | | 3.75 | % | | | 3.53 | % | | | 3.57 | % | | | 6.63 | %(2) |
Portfolio Turnover | | | 58 | % | | | 85 | % | | | 91 | % | | | 99 | % | | | 68 | % |
Senior Securities: | | | | | | | | | | | | | | | | | | | | |
Total notes payable outstanding (in 000’s) | | $ | 447,000 | | | $ | 447,000 | | | $ | 447,000 | | | $ | 447,000 | | | $ | 447,000 | |
Asset coverage per $1,000 of notes payable(5) | | $ | 4,953 | | | $ | 4,619 | | | $ | 4,521 | | | $ | 4,457 | | | $ | 4,739 | |
| (1) | Computed using average common shares outstanding. |
| (2) | Net investment income per share includes special dividends which amounted to $0.501 per share. Excluding special dividends, the ratio of net investment income to average daily net assets would have been 4.30%. |
| (3) | Returns are historical and are calculated by determining the percentage change in net asset value or market value with all distributions reinvested. Distributions are assumed to be reinvested at prices obtained under the Fund’s dividend reinvestment plan. |
| (4) | Excludes the effect of custody fee credits, if any, of less than 0.005%. Effective September 1, 2015, custody fee credits, which were earned on cash deposit balances, were discontinued by the custodian. |
| (5) | Calculated by subtracting the Fund’s total liabilities (not including the notes payable) from the Fund’s total assets, and dividing the result by the notes payable balance in thousands. |
| | | | |
| | 16 | | See Notes to Financial Statements. |
Eaton Vance
Tax-Advantaged Dividend Income Fund
August 31, 2018
Notes to Financial Statements
1 Significant Accounting Policies
Eaton Vance Tax-Advantaged Dividend Income Fund (the Fund) is a Massachusetts business trust registered under the Investment Company Act of 1940, as amended (the 1940 Act), as a diversified, closed-end management investment company. The Fund’s investment objective is to provide a high level of after-tax total return consisting primarily of tax-advantaged dividend income and capital appreciation. The Fund pursues its objective by investing primarily in dividend-paying common and preferred stocks.
The following is a summary of significant accounting policies of the Fund. The policies are in conformity with accounting principles generally accepted in the United States of America (U.S. GAAP). The Fund is an investment company and follows accounting and reporting guidance in the Financial Accounting Standards Board (FASB) Accounting Standards Codification Topic 946.
A Investment Valuation — The following methodologies are used to determine the market value or fair value of investments.
Equity Securities. Equity securities listed on a U.S. securities exchange generally are valued at the last sale or closing price on the day of valuation or, if no sales took place on such date, at the mean between the closing bid and asked prices therefore on the exchange where such securities are principally traded. Equity securities listed on the NASDAQ Global or Global Select Market generally are valued at the NASDAQ official closing price. Unlisted or listed securities for which closing sales prices or closing quotations are not available are valued at the mean between the latest available bid and asked prices or, in the case of preferred equity securities that are not listed or traded in the over-the-counter market, by a third party pricing service that uses various techniques that consider factors including, but not limited to, prices or yields of securities with similar characteristics, benchmark yields, broker/dealer quotes, quotes of underlying common stock, issuer spreads, as well as industry and economic events.
Debt Obligations. Debt obligations are generally valued on the basis of valuations provided by third party pricing services, as derived from such services’ pricing models. Inputs to the models may include, but are not limited to, reported trades, executable bid and asked prices, broker/dealer quotations, prices or yields of securities with similar characteristics, interest rates, anticipated prepayments, benchmark curves or information pertaining to the issuer, as well as industry and economic events. The pricing services may use a matrix approach, which considers information regarding securities with similar characteristics to determine the valuation for a security. Short-term obligations purchased with a remaining maturity of sixty days or less for which a valuation from a third party pricing service is not readily available may be valued at amortized cost, which approximates fair value.
Foreign Securities and Currencies. Foreign securities and currencies are valued in U.S. dollars, based on foreign currency exchange rate quotations supplied by a third party pricing service. The pricing service uses a proprietary model to determine the exchange rate. Inputs to the model include reported trades and implied bid/ask spreads. The daily valuation of exchange-traded foreign securities generally is determined as of the close of trading on the principal exchange on which such securities trade. Events occurring after the close of trading on foreign exchanges may result in adjustments to the valuation of foreign securities to more accurately reflect their fair value as of the close of regular trading on the New York Stock Exchange. When valuing foreign equity securities that meet certain criteria, the Fund’s Trustees have approved the use of a fair value service that values such securities to reflect market trading that occurs after the close of the applicable foreign markets of comparable securities or other instruments that have a strong correlation to the fair-valued securities.
Affiliated Fund. The Fund may invest in Eaton Vance Cash Reserves Fund, LLC (Cash Reserves Fund), an affiliated investment company managed by Eaton Vance Management (EVM). While Cash Reserves Fund is not a registered money market mutual fund, it conducts all of its investment activities in accordance with the requirements of Rule 2a-7 under the 1940 Act. Investments in Cash Reserves Fund are valued at the closing net asset value per unit on the valuation day. Cash Reserves Fund generally values its investment securities based on available market quotations provided by a third party pricing service.
Fair Valuation. Investments for which valuations or market quotations are not readily available or are deemed unreliable are valued at fair value using methods determined in good faith by or at the direction of the Trustees of the Fund in a manner that fairly reflects the security’s value, or the amount that the Fund might reasonably expect to receive for the security upon its current sale in the ordinary course. Each such determination is based on a consideration of relevant factors, which are likely to vary from one pricing context to another. These factors may include, but are not limited to, the type of security, the existence of any contractual restrictions on the security’s disposition, the price and extent of public trading in similar securities of the issuer or of comparable companies or entities, quotations or relevant information obtained from broker/dealers or other market participants, information obtained from the issuer, analysts, and/or the appropriate stock exchange (for exchange-traded securities), an analysis of the company’s or entity’s financial condition, and an evaluation of the forces that influence the issuer and the market(s) in which the security is purchased and sold.
B Investment Transactions — Investment transactions for financial statement purposes are accounted for on a trade date basis. Realized gains and losses on investments sold are determined on the basis of identified cost.
C Income — Dividend income is recorded on the ex-dividend date for dividends received in cash and/or securities. However, if the ex-dividend date has passed, certain dividends from foreign securities are recorded as the Fund is informed of the ex-dividend date. Withholding taxes on foreign dividends, interest and capital gains have been provided for in accordance with the Fund’s understanding of the applicable countries’ tax rules and rates. In consideration of recent decisions rendered by European courts, the Fund has filed additional tax reclaims for previously withheld taxes on dividends earned in certain European Union countries. These filings are subject to various administrative and judicial proceedings within these countries. During the year ended August 31, 2018, the Fund recorded no income for reclaims of previously withheld dividend taxes and approximately $177,000 of previously recorded income for dividend tax reclaims is unpaid and included in Tax reclaims receivable in the Statement of Assets and Liabilities. No other amounts for additional tax reclaims are reflected in the financial statements due to the uncertainty as to the ultimate resolution of proceedings, the likelihood of
Eaton Vance
Tax-Advantaged Dividend Income Fund
August 31, 2018
Notes to Financial Statements — continued
receipt of these reclaims, and the potential timing of payment. Interest income is recorded on the basis of interest accrued, adjusted for amortization of premium or accretion of discount. Distributions from investment companies are recorded as dividend income, capital gains or return of capital based on the nature of the distribution.
D ��Federal Taxes — The Fund’s policy is to comply with the provisions of the Internal Revenue Code applicable to regulated investment companies and to distribute to shareholders each year substantially all of its net investment income, and all or substantially all of its net realized capital gains. Accordingly, no provision for federal income or excise tax is necessary.
As of August 31, 2018, the Fund had no uncertain tax positions that would require financial statement recognition, de-recognition, or disclosure. The Fund files a U.S. federal income tax return annually after its fiscal year-end, which is subject to examination by the Internal Revenue Service for a period of three years from the date of filing.
E Foreign Currency Translation — Investment valuations, other assets, and liabilities initially expressed in foreign currencies are translated each business day into U.S. dollars based upon current exchange rates. Purchases and sales of foreign investment securities and income and expenses denominated in foreign currencies are translated into U.S. dollars based upon currency exchange rates in effect on the respective dates of such transactions. Recognized gains or losses on investment transactions attributable to changes in foreign currency exchange rates are recorded for financial statement purposes as net realized gains and losses on investments. That portion of unrealized gains and losses on investments that results from fluctuations in foreign currency exchange rates is not separately disclosed.
F Use of Estimates — The preparation of the financial statements in conformity with U.S. GAAP requires management to make estimates and assumptions that affect the reported amounts of assets and liabilities at the date of the financial statements and the reported amounts of income and expense during the reporting period. Actual results could differ from those estimates.
G Indemnifications — Under the Fund’s organizational documents, its officers and Trustees may be indemnified against certain liabilities and expenses arising out of the performance of their duties to the Fund. Under Massachusetts law, if certain conditions prevail, shareholders of a Massachusetts business trust (such as the Fund) could be deemed to have personal liability for the obligations of the Fund. However, the Fund’s Declaration of Trust contains an express disclaimer of liability on the part of Fund shareholders and the By-laws provide that the Fund shall assume the defense on behalf of any Fund shareholders. Moreover, the By-laws also provide for indemnification out of Fund property of any shareholder held personally liable solely by reason of being or having been a shareholder for all loss or expense arising from such liability. Additionally, in the normal course of business, the Fund enters into agreements with service providers that may contain indemnification clauses. The Fund’s maximum exposure under these arrangements is unknown as this would involve future claims that may be made against the Fund that have not yet occurred.
H Statement of Cash Flows — The cash amount shown in the Statement of Cash Flows of the Fund is the amount included in the Fund’s Statement of Assets and Liabilities and represents the unrestricted cash on hand at its custodian and does not include any short-term investments.
2 Distributions to Shareholders and Income Tax Information
Subject to its Managed Distribution Plan, the Fund intends to make monthly distributions from its net investment income, net capital gain (which is the excess of net long-term capital gain over net short-term capital loss) and other sources. The Fund intends to distribute all or substantially all of its net realized capital gains. Distributions are recorded on the ex-dividend date. Distributions to shareholders are determined in accordance with income tax regulations, which may differ from U.S. GAAP. As required by U.S. GAAP, only distributions in excess of tax basis earnings and profits are reported in the financial statements as a return of capital. Permanent differences between book and tax accounting relating to distributions are reclassified to paid-in capital. For tax purposes, distributions from short-term capital gains are considered to be from ordinary income. Distributions in any year may include a return of capital component.
The tax character of distributions declared for the years ended August 31, 2018 and August 31, 2017 was as follows:
| | | | | | | | |
| | | Year Ended August 31, | |
| | | 2018 | | | 2017 | |
| | |
Distributions declared from: | | | | | | | | |
Ordinary income | | $ | 34,189,693 | | | $ | 62,879,090 | |
Long-term capital gains | | $ | 92,551,664 | | | $ | 63,855,375 | |
During the year ended August 31, 2018, accumulated distributions in excess of net realized gain was decreased by $4,884,763, accumulated undistributed net investment income was decreased by $4,882,665 and paid-in capital was decreased by $2,098 due to differences between book and tax accounting, primarily for foreign currency gain (loss), premium amortization, accretion of market discount, distributions from real estate investment trusts, investments in partnerships and preferred securities. These reclassifications had no effect on the net assets or net asset value per share of the Fund.
Eaton Vance
Tax-Advantaged Dividend Income Fund
August 31, 2018
Notes to Financial Statements — continued
As of August 31, 2018, the components of distributable earnings (accumulated losses) on a tax basis were as follows:
| | | | |
Undistributed ordinary income | | $ | 17,265,548 | |
Net unrealized appreciation | | $ | 365,845,555 | |
The differences between components of distributable earnings (accumulated losses) on a tax basis and the amounts reflected in the Statement of Assets and Liabilities are primarily due to wash sales, investments in partnerships, premium amortization, accretion of market discount and preferred securities.
The cost and unrealized appreciation (depreciation) of investments of the Fund at August 31, 2018, as determined on a federal income tax basis, were as follows:
| | | | |
| |
Aggregate cost | | $ | 1,837,782,737 | |
| |
Gross unrealized appreciation | | $ | 391,413,819 | |
Gross unrealized depreciation | | | (25,555,666 | ) |
| |
Net unrealized appreciation | | $ | 365,858,153 | |
3 Investment Adviser Fee and Other Transactions with Affiliates
The investment adviser fee is earned by EVM as compensation for management and investment advisory services rendered to the Fund. Pursuant to the investment advisory agreement and subsequent fee reduction agreement, the fee is computed at an annual rate of 0.85% of the Fund’s average daily gross assets up to and including $1.5 billion, 0.83% over $1.5 billion up to and including $3 billion, and at reduced rates as daily gross assets exceed $3 billion, and is payable monthly. Gross assets as referred to herein represent net assets plus obligations attributable to investment leverage. The fee reduction cannot be terminated without the consent of a majority of Trustees and a majority of shareholders. For the year ended August 31, 2018, the Fund’s investment adviser fee amounted to $18,123,298 or 0.84% of the Fund’s average daily gross assets. The Fund invests its cash in Cash Reserves Fund. EVM does not currently receive a fee for advisory services provided to Cash Reserves Fund. EVM also serves as administrator of the Fund, but receives no compensation.
Trustees and officers of the Fund who are members of EVM’s organization receive remuneration for their services to the Fund out of the investment adviser fee. Trustees of the Fund who are not affiliated with EVM may elect to defer receipt of all or a percentage of their annual fees in accordance with the terms of the Trustees Deferred Compensation Plan. For the year ended August 31, 2018, no significant amounts have been deferred. Certain officers and Trustees of the Fund are officers of EVM.
4 Purchases and Sales of Investments
Purchases and sales of investments, other than short-term obligations, aggregated $1,226,496,774 and $1,321,301,274, respectively, for the year ended August 31, 2018.
5 Common Shares of Beneficial Interest
The Fund may issue common shares pursuant to its dividend reinvestment plan. Common shares issued by the Fund pursuant to its dividend reinvestment plan for the year ended August 31, 2018 were 46,577. There were no common shares issued by the Fund for the year ended August 31, 2017.
On November 11, 2013, the Board of Trustees of the Fund authorized the repurchase by the Fund of up to 10% of its then currently outstanding common shares in open-market transactions at a discount to net asset value. The repurchase program does not obligate the Fund to purchase a specific amount of shares. There were no repurchases of common shares by the Fund for the years ended August 31, 2018 and August 31, 2017.
6 Credit Agreement
Effective August 30, 2017, the Fund entered into a Credit Agreement (the Agreement) with a major financial institution that allows it to borrow up to $524 million over a rolling 179 calendar day period through August 30, 2019. Interest is charged at a rate above 1-month LIBOR and is payable monthly. The Fund is charged a commitment fee of 0.30% per annum on the unused portion of the commitment if outstanding borrowings are less than 80% of the borrowing limit. Under the terms of the Agreement, the Fund is required to satisfy certain collateral requirements and maintain a certain level of net assets. At August 31, 2018, the Fund had borrowings outstanding under the Agreement of $447 million at an interest rate of 2.76%. The carrying amount of the
Eaton Vance
Tax-Advantaged Dividend Income Fund
August 31, 2018
Notes to Financial Statements — continued
borrowings at August 31, 2018 approximated its fair value. If measured at fair value, borrowings under the Agreement would have been considered as Level 2 in the fair value hierarchy (see Note 8) at August 31, 2018. For the year ended August 31, 2018, the average borrowings under the Agreement and the average interest rate (excluding fees) were $447 million and 2.34%, respectively.
7 Risks Associated with Foreign Investments
Investing in securities issued by companies whose principal business activities are outside the United States may involve significant risks not present in domestic investments. For example, there is generally less publicly available information about foreign companies, particularly those not subject to the disclosure and reporting requirements of the U.S. securities laws. Certain foreign issuers are generally not bound by uniform accounting, auditing, and financial reporting requirements and standards of practice comparable to those applicable to domestic issuers. Investments in foreign securities also involve the risk of possible adverse changes in investment or exchange control regulations, expropriation or confiscatory taxation, limitation on the removal of funds or other assets of the Fund, political or financial instability or diplomatic and other developments which could affect such investments. Foreign securities markets, while growing in volume and sophistication, are generally not as developed as those in the United States, and securities of some foreign issuers (particularly those located in developing countries) may be less liquid and more volatile than securities of comparable U.S. companies. In general, there is less overall governmental supervision and regulation of foreign securities markets, broker/dealers and issuers than in the United States.
8 Fair Value Measurements
Under generally accepted accounting principles for fair value measurements, a three-tier hierarchy to prioritize the assumptions, referred to as inputs, is used in valuation techniques to measure fair value. The three-tier hierarchy of inputs is summarized in the three broad levels listed below.
| • | | Level 1 – quoted prices in active markets for identical investments |
| • | | Level 2 – other significant observable inputs (including quoted prices for similar investments, interest rates, prepayment speeds, credit risk, etc.) |
| • | | Level 3 – significant unobservable inputs (including a fund’s own assumptions in determining the fair value of investments) |
In cases where the inputs used to measure fair value fall in different levels of the fair value hierarchy, the level disclosed is determined based on the lowest level input that is significant to the fair value measurement in its entirety. The inputs or methodology used for valuing securities are not necessarily an indication of the risk associated with investing in those securities.
Eaton Vance
Tax-Advantaged Dividend Income Fund
August 31, 2018
Notes to Financial Statements — continued
At August 31, 2018, the hierarchy of inputs used in valuing the Fund’s investments, which are carried at value, were as follows:
| | | | | | | | | | | | | | | | |
| Asset Description | | Level 1 | | | Level 2 | | | Level 3 | | | Total | |
| | | | |
Common Stocks | | | | | | | | | | | | | | | | |
Consumer Discretionary | | $ | 124,653,652 | | | $ | — | | | $ | — | | | $ | 124,653,652 | |
Consumer Staples | | | 108,588,156 | | | | — | | | | — | | | | 108,588,156 | |
Energy | | | 182,354,585 | | | | — | | | | — | | | | 182,354,585 | |
Financials | | | 323,205,317 | | | | 13,975,809 | | | | — | | | | 337,181,126 | |
Health Care | | | 255,254,023 | | | | — | | | | — | | | | 255,254,023 | |
Industrials | | | 159,911,197 | | | | 82,704 | | | | — | | | | 159,993,901 | |
Information Technology | | | 160,191,807 | | | | — | | | | — | | | | 160,191,807 | |
Materials | | | 45,375,766 | | | | — | | | | — | | | | 45,375,766 | |
Real Estate | | | 86,053,100 | | | | — | | | | — | | | | 86,053,100 | |
Telecommunication Services | | | 66,551,381 | | | | — | | | | — | | | | 66,551,381 | |
Utilities | | | 100,709,511 | | | | — | | | | — | | | | 100,709,511 | |
| | | | |
Total Common Stocks | | $ | 1,612,848,495 | | | $ | 14,058,513 | * | | $ | — | | | $ | 1,626,907,008 | |
Preferred Stocks | | | | | | | | | | | | | | | | |
Consumer Staples | | $ | — | | | $ | 14,695,919 | | | $ | — | | | $ | 14,695,919 | |
Energy | | | 17,070,642 | | | | — | | | | — | | | | 17,070,642 | |
Financials | | | 15,882,019 | | | | 24,960,083 | | | | — | | | | 40,842,102 | |
Industrials | | | 7,904,380 | | | | — | | | | — | | | | 7,904,380 | |
Real Estate | | | 22,851,967 | | | | — | | | | — | | | | 22,851,967 | |
Utilities | | | 35,061,493 | | | | — | | | | — | | | | 35,061,493 | |
| | | | |
Total Preferred Stocks | | $ | 98,770,501 | | | $ | 39,656,002 | | | $ | — | | | $ | 138,426,503 | |
Corporate Bonds & Notes | | $ | — | | | $ | 371,810,295 | | | $ | — | | | $ | 371,810,295 | |
Foreign Government Bonds | | | — | | | | 2,152,826 | | | | — | | | | 2,152,826 | |
Exchange-Traded Funds | | | 51,734,711 | | | | — | | | | — | | | | 51,734,711 | |
Short-Term Investments | | | — | | | | 12,609,547 | | | | — | | | | 12,609,547 | |
| | | | |
Total Investments | | $ | 1,763,353,707 | | | $ | 440,287,183 | | | $ | — | | | $ | 2,203,640,890 | |
| * | Includes foreign equity securities whose values were adjusted to reflect market trading of comparable securities or other correlated instruments that occurred after the close of trading in their applicable foreign markets. |
Level 3 investments at the beginning and/or end of the period in relation to net assets were not significant and accordingly, a reconciliation of Level 3 assets for the year ended August 31, 2018 is not presented.
9 Change in Fiscal Year-End
Effective August 31, 2018, the fiscal year-end of the Fund changed from August 31 to October 31.
Eaton Vance
Tax-Advantaged Dividend Income Fund
August 31, 2018
Report of Independent Registered Public Accounting Firm
To the Trustees and Shareholders of Eaton Vance Tax-Advantaged Dividend Income Fund:
Opinion on the Financial Statements and Financial Highlights
We have audited the accompanying statement of assets and liabilities of Eaton Vance Tax-Advantaged Dividend Income Fund (the “Fund”), including the portfolio of investments, as of August 31, 2018, the related statements of operations and cash flows for the year then ended, the statements of changes in net assets for each of the two years in the period then ended, the financial highlights for each of the five years in the period then ended, and the related notes. In our opinion, the financial statements and financial highlights present fairly, in all material respects, the financial position of the Fund as of August 31, 2018, and the results of its operations and its cash flows for the year then ended, the changes in its net assets for each of the two years in the period then ended, and the financial highlights for each of the five years in the period then ended in conformity with accounting principles generally accepted in the United States of America.
Basis for Opinion
These financial statements and financial highlights are the responsibility of the Fund’s management. Our responsibility is to express an opinion on the Fund’s financial statements and financial highlights based on our audits. We are a public accounting firm registered with the Public Company Accounting Oversight Board (United States) (PCAOB) and are required to be independent with respect to the Fund in accordance with the U.S. federal securities laws and the applicable rules and regulations of the Securities and Exchange Commission and the PCAOB.
We conducted our audits in accordance with the standards of the PCAOB. Those standards require that we plan and perform the audit to obtain reasonable assurance about whether the financial statements and financial highlights are free of material misstatement, whether due to error or fraud. The Fund is not required to have, nor were we engaged to perform, an audit of its internal control over financial reporting. As part of our audits we are required to obtain an understanding of internal control over financial reporting but not for the purpose of expressing an opinion on the effectiveness of the Fund’s internal control over financial reporting. Accordingly, we express no such opinion.
Our audits included performing procedures to assess the risks of material misstatement of the financial statements and financial highlights, whether due to error or fraud, and performing procedures that respond to those risks. Such procedures included examining, on a test basis, evidence regarding the amounts and disclosures in the financial statements and financial highlights. Our audits also included evaluating the accounting principles used and significant estimates made by management, as well as evaluating the overall presentation of the financial statements and financial highlights. Our procedures included confirmation of securities owned as of August 31, 2018, by correspondence with the custodian and brokers; when replies were not received from brokers, we performed other auditing procedures. We believe that our audits provide a reasonable basis for our opinion.
/s/ Deloitte & Touche LLP
Boston, Massachusetts
October 17, 2018
We have served as the auditor of one or more Eaton Vance investment companies since 1959.
Eaton Vance
Tax-Advantaged Dividend Income Fund
August 31, 2018
Federal Tax Information (Unaudited)
The Form 1099-DIV you receive in February 2019 will show the tax status of all distributions paid to your account in calendar year 2018. Shareholders are advised to consult their own tax adviser with respect to the tax consequences of their investment in the Fund. As required by the Internal Revenue Code and/or regulations, shareholders must be notified regarding the status of qualified dividend income for individuals, the dividends received deduction for corporations and capital gains dividends.
Qualified Dividend Income. For the fiscal year ended August 31, 2018, the Fund designates approximately $51,839,604, or up to the maximum amount of such dividends allowable pursuant to the Internal Revenue Code, as qualified dividend income eligible for the reduced tax rate of 15%.
Dividends Received Deduction. Corporate shareholders are generally entitled to take the dividends received deduction on the portion of the Fund’s dividend distribution that qualifies under tax law. For the Fund’s fiscal 2018 ordinary income dividends, 93.61% qualifies for the corporate dividends received deduction.
Capital Gains Dividends. The Fund hereby designates as a capital gain dividend with respect to the taxable year ended August 31, 2018, $90,089,919 or, if subsequently determined to be different, the net capital gain of such year.
Eaton Vance
Tax-Advantaged Dividend Income Fund
August 31, 2018
Annual Meeting of Shareholders (Unaudited)
The Fund held its Annual Meeting of Shareholders on June 14, 2018. The following action was taken by the shareholders:
Item 1: The election of Mark R. Fetting, George J. Gorman and Helen Frame Peters as Class III Trustees of the Fund for a three-year term expiring in 2021.
| | | | | | | | |
Nominee for Trustee Elected by All Shareholders | | Number of Shares | |
| | For | | | Withheld | |
Mark R. Fetting | | | 67,849,104 | | | | 1,155,333 | |
George J. Gorman | | | 67,868,852 | | | | 1,135,585 | |
Helen Frame Peters | | | 67,345,749 | | | | 1,658,688 | |
Eaton Vance
Tax-Advantaged Dividend Income Fund
August 31, 2018
Dividend Reinvestment Plan
The Fund offers a dividend reinvestment plan (Plan) pursuant to which shareholders may elect to have distributions automatically reinvested in common shares (Shares) of the Fund. You may elect to participate in the Plan by completing the Dividend Reinvestment Plan Application Form. If you do not participate, you will receive all distributions in cash paid by check mailed directly to you by American Stock Transfer & Trust Company, LLC (AST) as dividend paying agent. On the distribution payment date, if the NAV per Share is equal to or less than the market price per Share plus estimated brokerage commissions, then new Shares will be issued. The number of Shares shall be determined by the greater of the NAV per Share or 95% of the market price. Otherwise, Shares generally will be purchased on the open market by AST, the Plan agent (Agent). Distributions subject to income tax (if any) are taxable whether or not Shares are reinvested.
If your Shares are in the name of a brokerage firm, bank, or other nominee, you can ask the firm or nominee to participate in the Plan on your behalf. If the nominee does not offer the Plan, you will need to request that the Fund’s transfer agent re-register your Shares in your name or you will not be able to participate.
The Agent’s service fee for handling distributions will be paid by the Fund. Plan participants will be charged their pro rata share of brokerage commissions on all open-market purchases.
Plan participants may withdraw from the Plan at any time by writing to the Agent at the address noted on the following page. If you withdraw, you will receive Shares in your name for all Shares credited to your account under the Plan. If a participant elects by written notice to the Agent to sell part or all of his or her Shares and remit the proceeds, the Agent is authorized to deduct a $5.00 fee plus brokerage commissions from the proceeds.
If you wish to participate in the Plan and your Shares are held in your own name, you may complete the form on the following page and deliver it to the Agent. Any inquiries regarding the Plan can be directed to the Agent at 1-866-439-6787.
Eaton Vance
Tax-Advantaged Dividend Income Fund
August 31, 2018
Application for Participation in Dividend Reinvestment Plan
This form is for shareholders who hold their common shares in their own names. If your common shares are held in the name of a brokerage firm, bank, or other nominee, you should contact your nominee to see if it will participate in the Plan on your behalf. If you wish to participate in the Plan, but your brokerage firm, bank, or nominee is unable to participate on your behalf, you should request that your common shares be re-registered in your own name which will enable your participation in the Plan.
The following authorization and appointment is given with the understanding that I may terminate it at any time by terminating my participation in the Plan as provided in the terms and conditions of the Plan.
Please print exact name on account
Shareholder signature Date
Shareholder signature Date
Please sign exactly as your common shares are registered. All persons whose names appear on the share certificate must sign.
YOU SHOULD NOT RETURN THIS FORM IF YOU WISH TO RECEIVE YOUR DISTRIBUTIONS IN CASH. THIS IS NOT A PROXY.
This authorization form, when signed, should be mailed to the following address:
Eaton Vance Tax-Advantaged Dividend Income Fund
c/o American Stock Transfer & Trust Company, LLC
P.O. Box 922
Wall Street Station
New York, NY 10269-0560
Eaton Vance
Tax-Advantaged Dividend Income Fund
August 31, 2018
Board of Trustees’ Contract Approval
Overview of the Contract Review Process
The Investment Company Act of 1940, as amended (the “1940 Act”), provides, in substance, that each investment advisory agreement between a fund and its investment adviser will continue in effect from year to year only if its continuation is approved at least annually by the fund’s board of trustees, including by a vote of a majority of the trustees who are not “interested persons” of the fund (“Independent Trustees”), cast in person at a meeting called for the purpose of considering such approval.
At a meeting of the Boards of Trustees (each a “Board”) of the registered investment companies advised by either Eaton Vance Management or its affiliate, Boston Management and Research, (the “Eaton Vance Funds”) held on April 24, 2018, the Board, including a majority of the Independent Trustees, voted to approve continuation of existing investment advisory and sub-advisory agreements for the Eaton Vance Funds for an additional one-year period. In voting its approval, the Board relied upon the affirmative recommendation of its Contract Review Committee, which is a committee comprised exclusively of Independent Trustees. Prior to making its recommendation, the Contract Review Committee reviewed information furnished by each adviser to the Eaton Vance Funds (including information specifically requested by the Board) for a series of meetings of the Contract Review Committee held between February and April 2018. The Contract Review Committee also considered information received at prior meetings of the Board and its committees, as relevant to its annual evaluation of the investment advisory and sub-advisory agreements.
The information that the Board considered included, among other things, the following (for funds that invest through one or more underlying portfolio(s), references to “each fund” in this section may include information that was considered at the portfolio-level):
Information about Fees, Performance and Expenses
| • | | A report from an independent data provider comparing the advisory and related fees paid by each fund with fees paid by comparable funds as identified by the independent data provider (“comparable funds”); |
| • | | A report from an independent data provider comparing each fund’s total expense ratio and its components to comparable funds; |
| • | | A report from an independent data provider comparing the investment performance of each fund (including, where relevant, yield data, Sharpe ratios and information ratios) to the investment performance of comparable funds over various time periods; |
| • | | Data regarding investment performance in comparison to benchmark indices, as well as customized groups of peer funds and blended indices identified by the adviser in consultation with the Board; |
| • | | For each fund, comparative information concerning the fees charged and the services provided by each adviser in managing other accounts (including mutual funds, other collective investment funds and institutional accounts) using investment strategies and techniques similar to those used in managing such fund; |
| • | | Profitability analyses for each adviser with respect to each fund; |
Information about Portfolio Management and Trading
| • | | Descriptions of the investment management services provided to each fund, including the fund’s investment strategies and policies; |
| • | | The procedures and processes used to determine the fair value of fund assets and actions taken to monitor and test the effectiveness of such procedures and processes; |
| • | | Information about each adviser’s policies and practices with respect to trading, including each adviser’s processes for monitoring best execution of portfolio transactions; |
| • | | Information about the allocation of brokerage transactions and the benefits received by each adviser as a result of brokerage allocation, including information concerning the acquisition of research through client commission arrangements and policies with respect to “soft dollars”; |
| • | | Data relating to portfolio turnover rates of each fund; |
Information about each Adviser
| • | | Reports detailing the financial results and condition of each adviser; |
| • | | Descriptions of the qualifications, education and experience of the individual investment professionals whose responsibilities include portfolio management and investment research for the funds, and information relating to their responsibilities with respect to managing other mutual funds and investment accounts; |
| • | | The Code of Ethics of each adviser and its affiliates, together with information relating to compliance with and the administration of such codes; |
| • | | Policies and procedures relating to proxy voting and the handling of corporate actions and class actions; |
| • | | Information concerning the resources devoted to compliance efforts undertaken by each adviser and its affiliates (including descriptions of various compliance programs) and their record of compliance; |
| • | | Information concerning the business continuity and disaster recovery plans of each adviser and its affiliates; |
| • | | A description of Eaton Vance Management’s procedures for overseeing third party advisers and sub-advisers, including with respect to regulatory and compliance issues, investment management and other matters; |
Eaton Vance
Tax-Advantaged Dividend Income Fund
August 31, 2018
Board of Trustees’ Contract Approval — continued
Other Relevant Information
| • | | Information concerning the nature, cost and character of the administrative and other non-investment advisory services provided by Eaton Vance Management and its affiliates; |
| • | | Information concerning management of the relationship with the custodian, subcustodians and fund accountants by each adviser or the funds’ administrator; and |
| • | | The terms of each investment advisory agreement. |
Over the course of the twelve-month period ended April 30, 2018, with respect to one or more funds, the Board met seven times and the Contract Review Committee, the Audit Committee, the Governance Committee, the Portfolio Management Committee and the Compliance Reports and Regulatory Matters Committee, each of which is a Committee comprised solely of Independent Trustees, met seven, thirteen, six, eight and nine times, respectively. At such meetings, the Trustees participated in investment and performance reviews with the portfolio managers and other investment professionals of each investment adviser relating to each fund, and considered various investment and trading strategies used in pursuing each fund’s investment objective, such as the use of derivative instruments, as well as risk management techniques. The Board and its Committees also evaluated issues pertaining to industry and regulatory developments, compliance procedures, fund governance and other issues with respect to the funds, and received and participated in reports and presentations provided by Eaton Vance Management and other fund advisers with respect to such matters. In addition to the formal meetings of the Board and its Committees, the Independent Trustees hold regular teleconferences in between meetings to discuss, among other topics, matters relating to the continuation of investment advisory and sub-advisory agreements.
For funds that invest through one or more underlying portfolios, the Board considered similar information about the portfolio(s) when considering the approval of investment advisory agreements. In addition, in cases where the fund’s investment adviser has engaged a sub-adviser, the Board considered similar information about the sub-adviser when considering the approval of any sub-advisory agreement.
The Contract Review Committee was assisted throughout the contract review process by Goodwin Procter LLP, independent legal counsel for the Independent Trustees. The members of the Contract Review Committee relied upon the advice of such counsel and their own business judgment in determining the material factors to be considered in evaluating each investment advisory and sub-advisory agreement and the weight to be given to each such factor. The conclusions reached with respect to each investment advisory and sub-advisory agreement were based on a comprehensive evaluation of all the information provided and not any single factor. Moreover, each member of the Contract Review Committee may have placed varying emphasis on particular factors in reaching conclusions with respect to each investment advisory and sub-advisory agreement. In evaluating each investment advisory and sub-advisory agreement, including the specific fee structures and other terms of the agreements, the Contract Review Committee was informed by multiple years of analysis and discussion among the Independent Trustees and the Eaton Vance Funds’ advisers and sub-advisers.
Results of the Process
Based on its consideration of the foregoing, and such other information as it deemed relevant, including the factors and conclusions described below, the Contract Review Committee concluded that the continuation of the investment advisory agreement of Eaton Vance Tax-Advantaged Dividend Income Fund (the “Fund”) with Eaton Vance Management (the “Adviser”), including its fee structure, is in the interests of shareholders and, therefore, the Contract Review Committee recommended to the Board approval of the agreement. The Board accepted the recommendation of the Contract Review Committee based on the material factors considered and conclusions reached by the Contract Review Committee with respect to the agreement. Accordingly, the Board, including a majority of the Independent Trustees, voted to approve continuation of the investment advisory agreement for the Fund.
Nature, Extent and Quality of Services
In considering whether to approve the investment advisory agreement of the Fund, the Board evaluated the nature, extent and quality of services provided to the Fund by the Adviser.
The Board considered the Adviser’s management capabilities and investment process with respect to the types of investments held by the Fund, including the education, experience and number of its investment professionals and other personnel who provide portfolio management, investment research, and similar services to the Fund, including recent changes to such personnel. In particular, the Board considered the abilities and experience of the Adviser’s investment professionals in analyzing special considerations relevant to investing in dividend-paying common and preferred stocks. The Board considered the Adviser’s in-house equity research capabilities and experience in managing funds that seek to maximize after-tax returns. The Board also took into account the resources dedicated to portfolio management and other services, as well as the compensation methods of the Adviser and other factors, such as the reputation and resources of the Adviser to recruit and retain highly qualified research, advisory and supervisory investment professionals. In addition, the Board considered the time and attention devoted to the Eaton Vance Funds, including the Fund, by senior management, as well as the infrastructure, operational capabilities and support staff in place to assist in the portfolio management and operations of the Fund, including the provision of administrative services. The Board also considered the business-related and other risks to which the Adviser or its affiliates may be subject in managing the Fund.
Eaton Vance
Tax-Advantaged Dividend Income Fund
August 31, 2018
Board of Trustees’ Contract Approval — continued
The Board considered the compliance programs of the Adviser and relevant affiliates thereof. Among other matters, the Board considered compliance and reporting matters relating to personal trading by investment professionals, selective disclosure of portfolio holdings, late trading, frequent trading, portfolio valuation, business continuity and the allocation of investment opportunities. The Board also considered the responses of the Adviser and its affiliates to requests in recent years from regulatory authorities such as the Securities and Exchange Commission and the Financial Industry Regulatory Authority.
The Board considered shareholder and other administrative services provided or managed by Eaton Vance Management and its affiliates, including transfer agency and accounting services. The Board evaluated the benefits to shareholders of investing in a fund that is a part of a large fund complex offering exposure to a variety of asset classes and investment disciplines.
After consideration of the foregoing factors, among others, the Board concluded that the nature, extent and quality of services provided by the Adviser, taken as a whole, are appropriate and consistent with the terms of the investment advisory agreement.
Fund Performance
The Board compared the Fund’s investment performance to that of comparable funds and appropriate benchmark indices. The Board’s review included comparative performance data for the one-, three-, five- and ten-year periods ended September 30, 2017 for the Fund. In this regard, the Board noted that the performance of the Fund was higher than the median performance of the Fund’s peer group for the three-year period. The Board also noted that the performance of the Fund was higher than its secondary and blended benchmark indexes and lower than its primary benchmark index for the three-year period. The Board concluded that the performance of the Fund was satisfactory.
Management Fees and Expenses
The Board considered contractual fee rates payable by the Fund for advisory and administrative services (referred to collectively as “management fees”). As part of its review, the Board considered the Fund’s management fees and total expense ratio for the one year period ended September 30, 2017, as compared to those of comparable funds, before and after giving effect to any undertaking to waive fees or reimburse expenses. The Board also received and considered information about the services offered and the fee rates charged by the Adviser to other types of clients with investment objectives and strategies that are substantially similar to and/or managed in a similar investment style as the Fund. In this regard, the Board received information about the differences in the nature and scope of services the Adviser provides to the Fund as compared to other types of clients and the material differences in compliance, reporting and other legal burdens and risks to the Adviser as between the Fund and other types of clients. The Board also considered factors that had an impact on Fund expense ratios relative to comparable funds.
After considering the foregoing information, and in light of the nature, extent and quality of the services provided by the Adviser, the Board concluded that the management fees charged for advisory and related services are reasonable.
Profitability and Other “Fall-Out” Benefits
The Board considered the level of profits realized by the Adviser and relevant affiliates thereof in providing investment advisory and administrative services to the Fund and to all Eaton Vance Funds as a group. The Board considered the level of profits realized without regard to marketing support or other payments by the Adviser and its affiliates to third parties in respect of distribution services. The Board also considered other direct or indirect fall-out benefits received by the Adviser and its affiliates in connection with their relationships with the Fund, including the benefits of research services that may be available to the Adviser as a result of securities transactions effected for the Fund and other investment advisory clients.
The Board concluded that, in light of the foregoing factors and the nature, extent and quality of the services rendered, the profits realized by the Adviser and its affiliates are deemed not to be excessive.
Economies of Scale
In reviewing management fees and profitability, the Board also considered the extent to which the Adviser and its affiliates, on the one hand, and the Fund, on the other hand, can expect to realize benefits from economies of scale as the assets of the Fund increase. The Board acknowledged the difficulty in accurately measuring the benefits resulting from economies of scale, if any, with respect to the management of any specific fund or group of funds. The Board reviewed data summarizing the increases and decreases in the assets of the Fund and of all Eaton Vance Funds as a group over various time periods, and evaluated the extent to which the total expense ratio of the Fund and the profitability of the Adviser and its affiliates may have been affected by such increases or decreases. Based upon the foregoing, the Board concluded that the Fund currently shares in any benefits from economies of scale. The Board also concluded that, assuming reasonably foreseeable increases in the assets of the Fund, the structure of the advisory fee, which includes breakpoints at several asset levels, will allow the Fund to continue to benefit from any economies of scale in the future.
Eaton Vance
Tax-Advantaged Dividend Income Fund
August 31, 2018
Management and Organization
Fund Management. The Trustees of Eaton Vance Tax-Advantaged Dividend Income Fund (the Fund) are responsible for the overall management and supervision of the Fund’s affairs. The Trustees and officers of the Fund are listed below. Except as indicated, each individual has held the office shown or other offices in the same company for the last five years. The “Noninterested Trustees” consist of those Trustees who are not “interested persons” of the Fund, as that term is defined under the 1940 Act. The business address of each Trustee and officer is Two International Place, Boston, Massachusetts 02110. As used below, “EVC” refers to Eaton Vance Corp., “EV” refers to Eaton Vance, Inc., “EVM” refers to Eaton Vance Management, “BMR” refers to Boston Management and Research and “EVD” refers to Eaton Vance Distributors, Inc. EVC and EV are the corporate parent and trustee, respectively, of EVM and BMR. EVD is a wholly-owned subsidiary of EVC. Each officer affiliated with Eaton Vance may hold a position with other Eaton Vance affiliates that is comparable to his or her position with EVM listed below. Each Trustee oversees 174 portfolios in the Eaton Vance Complex (including all master and feeder funds in a master feeder structure). Each officer serves as an officer of certain other Eaton Vance funds. Each Trustee serves for a three year term. Each officer serves until his or her successor is elected.
| | | | | | |
| Name and Year of Birth | | Position(s) with the Fund | | Term Expiring; Trustee Since(1) | | Principal Occupation(s) and Directorships During Past Five Years and Other Relevant Experience |
| Interested Trustee |
| | | |
Thomas E. Faust Jr. 1958 | | Class II Trustee | | Until 2020. Trustee since 2007. | | Chairman, Chief Executive Officer and President of EVC, Director and President of EV, Chief Executive Officer and President of EVM and BMR, and Director of EVD. Trustee and/or officer of 174 registered investment companies. Mr. Faust is an interested person because of his positions with EVM, BMR, EVD, EVC and EV, which are affiliates of the Trust. Directorships in the Last Five Years.(2) Director of EVC and Hexavest Inc. (investment management firm). |
|
| Noninterested Trustees |
| | | |
Mark R. Fetting 1954 | | Class III Trustee | | Until 2021. Trustee since 2016. | | Private investor. Formerly held various positions at Legg Mason, Inc. (investment management firm) (2000-2012), including President, Chief Executive Officer, Director and Chairman (2008-2012), Senior Executive Vice President (2004-2008) and Executive Vice President (2001-2004). Formerly, President of Legg Mason family of funds (2001-2008). Formerly, Division President and Senior Officer of Prudential Financial Group, Inc. and related companies (investment management firm) (1991-2000). Directorships in the Last Five Years. None |
| | | |
Cynthia E. Frost 1961 | | Class I Trustee | | Until 2019. Trustee since 2014. | | Private investor. Formerly, Chief Investment Officer of Brown University (university endowment) (2000-2012); Formerly, Portfolio Strategist for Duke Management Company (university endowment manager) (1995-2000); Formerly, Managing Director, Cambridge Associates (investment consulting company) (1989-1995); Formerly, Consultant, Bain and Company (management consulting firm) (1987-1989); Formerly, Senior Equity Analyst, BA Investment Management Company (1983-1985). Directorships in the Last Five Years. None. |
| | | |
George J. Gorman 1952 | | Class III Trustee | | Until 2021. Trustee since 2014. | | Principal at George J. Gorman LLC (consulting firm). Formerly, Senior Partner at Ernst & Young LLP (a registered public accounting firm) (1974-2009). Directorships in the Last Five Years. Formerly, Trustee of the BofA Funds Series Trust (11 funds) (2011-2014) and of the Ashmore Funds (9 funds) (2010-2014). |
| | | |
Valerie A. Mosley 1960 | | Class I Trustee | | Until 2019. Trustee since 2014. | | Chairwoman and Chief Executive Officer of Valmo Ventures (a consulting and investment firm). Former Partner and Senior Vice President, Portfolio Manager and Investment Strategist at Wellington Management Company, LLP (investment management firm) (1992-2012). Former Chief Investment Officer, PG Corbin Asset Management (1990-1992). Formerly worked in institutional corporate bond sales at Kidder Peabody (1986-1990). Directorships in the Last Five Years.(2) Director of Dynex Capital, Inc. (mortgage REIT) (since 2013). |
Eaton Vance
Tax-Advantaged Dividend Income Fund
August 31, 2018
Management and Organization — continued
| | | | | | |
| Name and Year of Birth | | Position(s) with the Fund | | Term Expiring; Trustee Since(1) | | Principal Occupation(s) and Directorships During Past Five Years and Other Relevant Experience |
| Noninterested Trustees (continued) |
| | | |
William H. Park 1947 | | Chairperson of the Board and Class II Trustee | | Until 2020. Chairperson of the Board since 2016 and Trustee since 2003. | | Private investor. Formerly, Consultant (management and transactional) (2012-2014). Formerly, Chief Financial Officer, Aveon Group L.P. (investment management firm) (2010-2011). Formerly, Vice Chairman, Commercial Industrial Finance Corp. (specialty finance company) (2006-2010). Formerly, President and Chief Executive Officer, Prizm Capital Management, LLC (investment management firm) (2002-2005). Formerly, Executive Vice President and Chief Financial Officer, United Asset Management Corporation (investment management firm) (1982-2001). Formerly, Senior Manager, Price Waterhouse (now PricewaterhouseCoopers) (a registered public accounting firm) (1972-1981). Directorships in the Last Five Years.(2) None. |
| | | |
Helen Frame Peters 1948 | | Class III Trustee | | Until 2021. Trustee since 2008. | | Professor of Finance, Carroll School of Management, Boston College. Formerly, Dean, Carroll School of Management, Boston College (2000-2002). Formerly, Chief Investment Officer, Fixed Income, Scudder Kemper Investments (investment management firm) (1998-1999). Formerly, Chief Investment Officer, Equity and Fixed Income, Colonial Management Associates (investment management firm) (1991-1998). Directorships in the Last Five Years.(2) None. |
| | | |
Keith Quinton(3) 1958 | | Class I Trustee | | Until 2019. Trustee since 2018. | | Independent Investment Committee Member at New Hampshire Retirement System (since 2017). Advisory Committee member at Northfield Information Services, Inc. (risk management analytics provider) (since 2016). Formerly, Portfolio Manager and Senior Quantitative Analyst at Fidelity Investments (investment management firm) (2001-2014). Directorships in the Last Five Years. Director of New Hampshire Municipal Bond Bank (since 2016). |
| | | |
Marcus L. Smith(3) 1966 | | Class III Trustee | | Until 2021. Trustee since 2018. | | Member of Posse Boston Advisory Board (foundation) (since 2015); Trustee at University of Mount Union (since 2008). Formerly, Portfolio Manager at MFS Investment Management (investment management firm) (1994-2017). Directorships in the Last Five Years. Director of MSCI Inc. (global provider of investment decision support tools) (since 2017). Director of DCT Industrial Trust Inc. (logistics real estate company) (since 2017). |
| | | |
Susan J. Sutherland 1957 | | Class I Trustee | | Until 2019. Trustee since 2015. | | Private investor. Formerly, Associate, Counsel and Partner at Skadden, Arps, Slate, Meagher & Flom LLP (law firm) (1982-2013). Directorships in the Last Five Years. Formerly, Director of Montpelier Re Holdings Ltd. (global provider of customized insurance and reinsurance products) (2013-2015). |
| | | |
Harriett Tee Taggart 1948 | | Class II Trustee | | Until 2020 Trustee since 2011. | | Managing Director, Taggart Associates (a professional practice firm). Formerly, Partner and Senior Vice President, Wellington Management Company, LLP (investment management firm) (1983-2006). Ms. Taggart has apprised the Board of Trustees that she intends to retire as a Trustee of all Eaton Vance Funds effective December 31, 2018. Directorships in the Last Five Years.(2) Director of Albemarle Corporation (chemicals manufacturer) (since 2007) and The Hanover Group (specialty property and casualty insurance company) (since 2009). |
| | | |
Scott E. Wennerholm 1959 | | Class II Trustee | | Until 2020. Trustee since 2016. | | Formerly, Trustee at Wheelock College (postsecondary institution) (2012-2018). Formerly, Consultant at GF Parish Group (executive recruiting firm) (2016-2017). Formerly, Chief Operating Officer and Executive Vice President at BNY Mellon Asset Management (investment management firm) (2005-2011). Formerly, Chief Operating Officer and Chief Financial Officer at Natixis Global Asset Management (investment management firm) (1997-2004). Formerly, Vice President at Fidelity Investments Institutional Services (investment management firm) (1994-1997). Directorships in the Last Five Years. None |
Eaton Vance
Tax-Advantaged Dividend Income Fund
August 31, 2018
Management and Organization — continued
| | | | | | |
| Name and Year of Birth | | Position(s) with the Fund | | Officer Since(4) | | Principal Occupation(s) During Past Five Years |
| Principal Officers who are not Trustees |
| | | |
Edward J. Perkin 1972 | | President | | 2014 | | Vice President and Chief Equity Investment Officer of EVM and BMR. Prior to joining EVM in 2014, Mr. Perkin was Chief Investment Officer, International and Emerging Markets Equity, and Managing Director, Portfolio Manager, Europe, EAFE and Global, at Goldman Sachs Asset Management. Also Vice President of Calvert Research and Management (“CRM”). |
| | | |
Maureen A. Gemma 1960 | | Vice President, Secretary and Chief Legal Officer | | 2005 | | Vice President of EVM and BMR. Also Vice President of CRM. |
| | | |
James F. Kirchner 1967 | | Treasurer | | 2007 | | Vice President of EVM and BMR. Also Vice President of CRM. |
| | | |
Richard F. Froio 1968 | | Chief Compliance Officer | | 2017 | | Vice President of EVM and BMR since 2017. Formerly Deputy Chief Compliance Officer (Adviser/Funds) and Chief Compliance Officer (Distribution) at PIMCO (2012-2017) and Managing Director at BlackRock/Barclays Global Investors (2009-2012). |
| (1) | Year first appointed to serve as Trustee for a fund in the Eaton Vance family of funds. Each Trustee has served continuously since appointment unless indicated otherwise. Each Trustee holds office until the annual meeting for the year in which his or her term expires and until his or her successor is elected and qualified, subject to a prior death, resignation, retirement, disqualification or removal. |
| (2) | During their respective tenures, the Trustees (except for Mmes. Frost and Sutherland and Messrs. Fetting, Gorman, Quinton, Smith and Wennerholm) also served as Board members of one or more of the following funds (which operated in the years noted): eUnitsTM 2 Year U.S. Market Participation Trust: Upside to Cap / Buffered Downside (launched in 2012 and terminated in 2014); and eUnitsTM 2 Year U.S. Market Participation Trust II: Upside to Cap / Buffered Downside (launched in 2012 and terminated in 2014). However, Ms. Mosley did not serve as a Board member of eUnitsTM 2 Year U.S. Market Participation Trust: Upside to Cap / Buffered Downside (launched in 2012 and terminated in 2014). |
| (3) | Messrs. Quinton and Smith began serving as Trustees effective October 1, 2018. |
| (4) | Year first elected to serve as officer of a fund in the Eaton Vance family of funds when the officer has served continuously. Otherwise, year of most recent election as an officer of a fund in the Eaton Vance family of funds. Titles may have changed since initial election. |
Eaton Vance Funds
IMPORTANT NOTICES
Privacy. The Eaton Vance organization is committed to ensuring your financial privacy. Each of the financial institutions identified below has in effect the following policy (“Privacy Policy”) with respect to nonpublic personal information about its customers:
| • | | Only such information received from you, through application forms or otherwise, and information about your Eaton Vance fund transactions will be collected. This may include information such as name, address, social security number, tax status, account balances and transactions. |
| • | | None of such information about you (or former customers) will be disclosed to anyone, except as permitted by law (which includes disclosure to employees necessary to service your account). In the normal course of servicing a customer’s account, Eaton Vance may share information with unaffiliated third parties that perform various required services such as transfer agents, custodians and broker-dealers. |
| • | | Policies and procedures (including physical, electronic and procedural safeguards) are in place that are designed to protect the confidentiality of such information. |
| • | | We reserve the right to change our Privacy Policy at any time upon proper notification to you. Customers may want to review our Privacy Policy periodically for changes by accessing the link on our homepage: www.eatonvance.com. |
Our pledge of privacy applies to the following entities within the Eaton Vance organization: the Eaton Vance Family of Funds, Eaton Vance Management, Eaton Vance Investment Counsel, Eaton Vance Distributors, Inc., Eaton Vance Trust Company, Eaton Vance Management (International) Limited, Eaton Vance Advisers International Ltd., Eaton Vance Management’s Real Estate Investment Group and Boston Management and Research. In addition, our Privacy Policy applies only to those Eaton Vance customers who are individuals and who have a direct relationship with us. If a customer’s account (i.e., fund shares) is held in the name of a third-party financial advisor/broker-dealer, it is likely that only such advisor’s privacy policies apply to the customer. This notice supersedes all previously issued privacy disclosures. For more information about Eaton Vance’s Privacy Policy, please call 1-800-262-1122.
Delivery of Shareholder Documents. The Securities and Exchange Commission (SEC) permits funds to deliver only one copy of shareholder documents, including prospectuses, proxy statements and shareholder reports, to fund investors with multiple accounts at the same residential or post office box address. This practice is often called “householding” and it helps eliminate duplicate mailings to shareholders. American Stock Transfer & Trust Company, LLC (“AST”), the closed-end funds transfer agent, or your financial advisor, may household the mailing of your documents indefinitely unless you instruct AST, or your financial advisor, otherwise. If you would prefer that your Eaton Vance documents not be householded, please contact AST or your financial advisor. Your instructions that householding not apply to delivery of your Eaton Vance documents will typically be effective within 30 days of receipt by AST or your financial advisor.
Portfolio Holdings. Each Eaton Vance Fund and its underlying Portfolio(s) (if applicable) will file a schedule of portfolio holdings on Form N-Q with the SEC for the first and third quarters of each fiscal year. The Form N-Q will be available on the Eaton Vance website at www.eatonvance.com, by calling Eaton Vance at 1-800-262-1122 or in the EDGAR database on the SEC’s website at www.sec.gov. Form N-Q may also be reviewed and copied at the SEC’s public reference room in Washington, D.C. (call 1-800-732-0330 for information on the operation of the public reference room).
Proxy Voting. From time to time, funds are required to vote proxies related to the securities held by the funds. The Eaton Vance Funds or their underlying Portfolios (if applicable) vote proxies according to a set of policies and procedures approved by the Funds’ and Portfolios’ Boards. You may obtain a description of these policies and procedures and information on how the Funds or Portfolios voted proxies relating to portfolio securities during the most recent 12-month period ended June 30, without charge, upon request, by calling 1-800-262-1122 and by accessing the SEC’s website at www.sec.gov.
Share Repurchase Program. The Fund’s Board of Trustees has approved a share repurchase program authorizing the Fund to repurchase up to 10% of its outstanding common shares as of the approved date in open-market transactions at a discount to net asset value. The repurchase program does not obligate the Fund to purchase a specific amount of shares. The Fund’s repurchase activity, including the number of shares purchased, average price and average discount to net asset value, is disclosed in the Fund’s annual and semi-annual reports to shareholders.
Additional Notice to Shareholders. If applicable, a Fund may also redeem or purchase its outstanding preferred shares in order to maintain compliance with regulatory requirements, borrowing or rating agency requirements or for other purposes as it deems appropriate or necessary.
Closed-End Fund Information. Eaton Vance closed-end funds make fund performance data and certain information about portfolio characteristics available on the Eaton Vance website shortly after the end of each month. Other information about the funds is available on the website. The funds’ net asset value per share is readily accessible on the Eaton Vance website. Portfolio holdings for the most recent month-end are also posted to the website approximately 30 days following the end of the month. This information is available at www.eatonvance.com on the fund information pages under “Individual Investors — Closed-End Funds”.
This Page Intentionally Left Blank
This Page Intentionally Left Blank
This Page Intentionally Left Blank
Investment Adviser and Administrator
Eaton Vance Management
Two International Place
Boston, MA 02110
Custodian
State Street Bank and Trust Company
State Street Financial Center, One Lincoln Street
Boston, MA 02111
Transfer Agent
American Stock Transfer & Trust Company, LLC
6201 15th Avenue
Brooklyn, NY 11219
Independent Registered Public Accounting Firm
Deloitte & Touche LLP
200 Berkeley Street
Boston, MA 02116-5022
Fund Offices
Two International Place
Boston, MA 02110

2004 8.31.18
Item 2. Code of Ethics
The registrant has adopted a code of ethics applicable to its Principal Executive Officer, Principal Financial Officer and Principal Accounting Officer. The registrant undertakes to provide a copy of such code of ethics to any person upon request, without charge, by calling 1-800-262-1122. The registrant has not amended the code of ethics as described in Form N-CSR during the period covered by this report. The registrant has not granted any waiver, including an implicit waiver, from a provision of the code of ethics as described in Form N-CSR during the period covered by this report.
Item 3. Audit Committee Financial Expert
The registrant’s Board has designated George J. Gorman and William H. Park, each an independent trustee, as audit committee financial experts. Mr. Gorman is a certified public accountant who is the Principal at George J. Gorman LLC (a consulting firm). Previously, Mr. Gorman served in various capacities at Ernst & Young LLP (a registered public accounting firm), including as Senior Partner. Mr. Gorman also has experience serving as
an independent trustee and audit committee financial expert of other mutual fund complexes. Mr. Park is a certified public accountant who is a private investor. Previously, he served as a consultant, as the Chief Financial Officer of Aveon Group, L.P. (an investment management firm), as the Vice Chairman of Commercial Industrial Finance Corp. (specialty finance company), as President and Chief Executive Officer of Prizm Capital Management, LLC (investment management firm), as Executive Vice President and Chief Financial Officer of United Asset Management Corporation (an institutional investment management firm) and as a Senior Manager at Price Waterhouse (now PricewaterhouseCoopers) (a registered public accounting firm).
Item 4. Principal Accountant Fees and Services
(a)-(d)
The following table presents the aggregate fees billed to the registrant for the registrant’s fiscal years ended August 31, 2017 and August 31, 2018 by the registrant’s principal accountant, Deloitte & Touche LLP (“D&T”), for professional services rendered for the audit of the registrant’s annual financial statements and fees billed for other services rendered by D&T during such periods.
| | | | | | | | |
Fiscal Years Ended | | 8/31/17 | | | 8/31/18 | |
Audit Fees | | $ | 62,850 | | | $ | 64,425 | |
Audit-Related Fees(1) | | $ | 0 | | | $ | 0 | |
Tax Fees(2) | | $ | 14,667 | | | $ | 16,667 | |
All Other Fees(3) | | $ | 0 | | | $ | 0 | |
| | | | | | | | |
Total | | $ | 77,517 | | | $ | 81,092 | |
| | | | | | | | |
| (1) | Audit-related fees consist of the aggregate fees billed for assurance and related services that are reasonably related to the performance of the audit of the registrant’s financial statements and are not reported under the category of audit fees. |
| (2) | Tax fees consist of the aggregate fees billed for professional services rendered by the principal accountant relating to tax compliance, tax advice, and tax planning and specifically include fees for tax return preparation and other related tax compliance/planning matters. |
| (3) | All other fees consist of the aggregate fees billed for products and services provided by the principal accountant other than audit, audit-related, and tax services. |
(e)(1) The registrant’s audit committee has adopted policies and procedures relating to the pre-approval of services provided by the registrant’s principal accountant (the “Pre-Approval Policies”). The Pre-Approval Policies establish a framework intended to assist the audit committee in the proper discharge of its pre-approval responsibilities. As a general matter, the Pre-Approval Policies (i) specify certain types of audit, audit-related, tax, and other services determined to be pre-approved by the audit committee; and (ii) delineate specific procedures governing the mechanics of the pre-approval process, including the approval and monitoring of audit and non-audit service fees. Unless a service is specifically pre-approved under the Pre-Approval Policies, it must be separately pre-approved by the audit committee.
The Pre-Approval Policies and the types of audit and non-audit services pre-approved therein must be reviewed and ratified by the registrant’s audit committee at least annually. The registrant’s audit committee maintains full responsibility for the appointment, compensation, and oversight of the work of the registrant’s principal accountant.
(e)(2) No services described in paragraphs (b)-(d) above were approved by the registrant’s audit committee pursuant to the “de minimis exception” set forth in Rule 2-01 (c)(7)(i)(C) of Regulation S-X.
(f) Not applicable.
(g) The following table presents (i) the aggregate non-audit fees (i.e., fees for audit-related, tax, and other services) billed for services rendered to the registrant by D&T for the registrant’s fiscal years ended August 31, 2017 and August 31, 2018; and (ii) the aggregate non-audit fees (i.e., fees for audit-related, tax, and other services) billed for services rendered to the Eaton Vance organization by D&T for the same time periods.
| | | | | | | | |
Fiscal Years Ended | | 8/31/17 | | | 8/31/18 | |
Registrant | | $ | 14,667 | | | $ | 16,667 | |
Eaton Vance(1) | | $ | 148,018 | | | $ | 74,355 | |
| (1) | Eaton Vance Management, a subsidiary of Eaton Vance Corp., acts as the registrant’s investment adviser and administrator. |
(h) The registrant’s audit committee has considered whether the provision by the registrant’s principal accountant of non-audit services to the registrant’s investment adviser and any entity controlling, controlled by, or under common control with the adviser that provides ongoing services to the registrant that were not pre-approved pursuant to Rule 2-01(c)(7)(ii) of Regulation S-X is compatible with maintaining the principal accountant’s independence.
Item 5. Audit Committee of Listed Registrants
The registrant has a separately-designated standing audit committee established in accordance with Section 3(a)(58)(A) of the Securities and Exchange Act of 1934, as amended. George J. Gorman (Chair), Valerie A. Moseley, William H. Park and Scott E. Wennerholm are the members of the registrant’s audit committee.
Item 6. Schedule of Investments
Please see schedule of investments contained in the Report to Stockholders included under Item 1 of this Form N-CSR.
Item 7. Disclosure of Proxy Voting Policies and Procedures for Closed-End Management Investment Companies
The Board of Trustees of the Trust has adopted a proxy voting policy and procedure (the “Fund Policy”), pursuant to which the Trustees have delegated proxy voting responsibility to the Fund’s investment adviser and adopted the investment adviser’s proxy voting policies and procedures (the “Policies”) which are described below. The Trustees will review the Fund’s proxy voting records from time to time and will annually consider approving the Policies for the upcoming year. In the event that a conflict of interest arises between the Fund’s shareholders and the investment adviser, the administrator, or any of their affiliates or any affiliate of the Fund, the investment adviser will generally refrain from voting the proxies related to the companies giving rise to such conflict until it consults with the Board’s Special Committee except as contemplated under the Fund Policy. The Board’s Special Committee will instruct the investment adviser on the appropriate course of action.
The Policies are designed to promote accountability of a company’s management to its shareholders and to align the interests of management with those shareholders. An independent proxy voting service (“Agent”), currently Institutional Shareholder Services, Inc., has been retained to assist in the voting of proxies through the provision of vote analysis, implementation and recordkeeping and disclosure services. The investment adviser will generally vote proxies through the Agent. The Agent is required to vote all proxies and/or refer them back
to the investment adviser pursuant to the Policies. It is generally the policy of the investment adviser to vote in accordance with the recommendation of the Agent. The Agent shall refer to the investment adviser proxies relating to mergers and restructurings, and the disposition of assets, termination, liquidation and mergers contained in mutual fund proxies. The investment adviser will normally vote against anti-takeover measures and other proposals designed to limit the ability of shareholders to act on possible transactions, except in the case of closed-end management investment companies. The investment adviser generally supports management on social and environmental proposals. The investment adviser may abstain from voting from time to time where it determines that the costs associated with voting a proxy outweighs the benefits derived from exercising the right to vote or the economic effect on shareholders interests or the value of the portfolio holding is indeterminable or insignificant.
In addition, the investment adviser will monitor situations that may result in a conflict of interest between the Fund’s shareholders and the investment adviser, the administrator, or any of their affiliates or any affiliate of the Fund by maintaining a list of significant existing and prospective corporate clients. The investment adviser’s personnel responsible for reviewing and voting proxies on behalf of the Fund will report any proxy received or expected to be received from a company included on that list to the personnel of the investment adviser identified in the Policies. If such personnel expects to instruct the Agent to vote such proxies in a manner inconsistent with the guidelines of the Policies or the recommendation of the Agent, the personnel will consult with members of senior management of the investment adviser to determine if a material conflict of interests exists. If it is determined that a material conflict does exist, the investment adviser will seek instruction on how to vote from the Special Committee.
Information on how the Fund voted proxies relating to portfolio securities during the most recent 12 month period ended June 30 is available (1) without charge, upon request, by calling 1-800-262-1122, and (2) on the Securities and Exchange Commission’s website at http://www.sec.gov.
Item 8. Portfolio Managers of Closed-End Management Investment Companies
Michael A. Allison, John H. Croft, John D. Crowley, Edward J. Perkin and Walter A. Row, III, and other Eaton Vance Management (“EVM” or “Eaton Vance”) investment professionals comprise the investment team responsible for the overall and day-to-day management of the Fund’s investments as well as allocations of the Fund’s assets between common and preferred stocks. Messrs. Allison, Croft, Crowley, Perkin and Row are the portfolio managers responsible for the day-to-day management of specific segments of the Fund’s investment portfolio.
Mr. Allison has been an EVM portfolio manager since 2006 and is a member of EVM’s Equity Strategy Committee. Mr. Croft has been an EVM portfolio manager since 2010. Mr. Crowley has been an EVM portfolio manager since 2003. Mr. Perkin has been an EVM portfolio manager since 2014 and is Chief Equity Investment Officer. Prior to joining EVM in 2014, Mr. Perkin was Chief Investment Officer, International and Emerging Markets Equity, and Managing Director, Portfolio Manager, Europe, EAFE and Global, at Goldman Sachs Asset Management. Mr. Row has been an EVM portfolio manager since 2004, is the Director of Structured Equity Portfolios at EVM and is a member of EVM’s Equity Strategy Committee. Messrs. Allison, Croft, Crowley, Perkin and Row are Vice Presidents of EVM. This information is provided as of the date of filing of this report.
The following table shows, as of the Fund’s most recent fiscal year end, the number of accounts each portfolio manager managed in each of the listed categories and the total assets (in millions of dollars) in the accounts managed within each category. The table also shows the number of accounts with respect to which the advisory fee is based on the performance of the account, if any, and the total assets (in millions of dollars) in those accounts.
| | | | | | | | | | | | | | | | |
| | | Number of
All Accounts | | | Total Assets of
All Accounts | | | Number of
Accounts
Paying a
Performance Fee | | | Total Assets of
Accounts Paying a
Performance Fee | |
Michael A. Allison(1) | | | | | | | | | | | | | | | | |
Registered Investment Companies | | | 12 | | | $ | 22,059.6 | | | | 0 | | | $ | 0 | |
Other Pooled Investment Vehicles | | | 14 | | | $ | 8,942.4 | (2) | | | 0 | | | $ | 0 | |
Other Accounts | | | 0 | | | $ | 0 | | | | 0 | | | $ | 0 | |
| | | | |
John H. Croft | | | | | | | | | | | | | | | | |
Registered Investment Companies | | | 5 | | | $ | 1,596.9 | | | | 0 | | | $ | 0 | |
Other Pooled Investment Vehicles | | | 0 | | | $ | 0 | | | | 0 | | | $ | 0 | |
Other Accounts(3) | | | 39 | | | $ | 206.7 | | | | 0 | | | $ | 0 | |
| | | | |
John D. Crowley | | | | | | | | | | | | | | | | |
Registered Investment Companies | | | 5 | | | $ | 6,174.9 | | | | 0 | | | $ | 0 | |
Other Pooled Investment Vehicles | | | 2 | | | $ | 168.2 | | | | 0 | | | $ | 0 | |
Other Accounts(4) | | | 50 | | | $ | 3,286.8 | | | | 0 | | | $ | 0 | |
| | | | |
Edward J. Perkin | | | | | | | | | | | | | | | | |
Registered Investment Companies | | | 5 | | | $ | 6,174.9 | | | | 0 | | | $ | 0 | |
Other Pooled Investment Vehicles | | | 2 | | | $ | 168.2 | | | | 0 | | | $ | 0 | |
Other Accounts(4) | | | 50 | | | $ | 3,286.8 | | | | 0 | | | $ | 0 | |
| | | | |
Walter A. Row, III | | | | | | | | | | | | | | | | |
Registered Investment Companies | | | 14 | | | $ | 14,932.3 | | | | 0 | | | $ | 0 | |
Other Pooled Investment Vehicles | | | 0 | | | $ | 0 | | | | 0 | | | $ | 0 | |
Other Accounts | | | 0 | | | $ | 0 | | | | 0 | | | $ | 0 | |
| (1) | This portfolio manager serves as portfolio manager of one or more registered investment companies that invests or may invest in one or more underlying registered investment companies in the Eaton Vance family of funds or other pooled investment vehicles sponsored by Eaton Vance. The underlying investment companies may be managed by this portfolio manager or another portfolio manager(s). |
| (2) | Certain of these “Other Pooled Investment Vehicles” invest a substantial portion of their assets either in a registered investment company or in a separate pooled investment vehicle managed by this portfolio manager or another Eaton Vance portfolio manager. |
| (3) | For “Other Accounts” that are part of a wrap account program, the number of accounts cited includes the number of sponsors for which the portfolio manager provides management services rather than the number of individual customer accounts within each wrap account program. |
| (4) | For “Other Accounts” that are part of a wrap account program, the number of accounts cited includes the number of sponsors for which the portfolio manager provides management services rather than the number of individual customer accounts within each wrap account program. The amount of assets managed for “Other Accounts” include assets managed on a nondiscretionary or model basis. |
The following table shows the dollar range of Fund shares beneficially owned by each portfolio manager as of the Fund’s most recent fiscal year end.
| | | | |
Portfolio Manager | | Dollar Range of Equity
Securities
Owned in the Fund | |
Michael A. Allison | | | None | |
John H. Croft | | | None | |
John D. Crowley | | | None | |
Edward J. Perkin | | | None | |
Walter A. Row, III | | | None | |
Potential for Conflicts of Interest. It is possible that conflicts of interest may arise in connection with a portfolio manager’s management of a Fund’s investments on the one hand and the investments of other accounts for which the portfolio manager is responsible on the other. For example, a portfolio manager may have conflicts of interest in allocating management time, resources and investment opportunities among the Fund and other accounts he or she advises. In addition, due to differences in the investment strategies or restrictions between a Fund and the other accounts, a portfolio manager may take action with respect to another account that differs from the action taken with respect to the Fund. In some cases, another account managed by a portfolio manager may compensate EVM or the sub-adviser based on the performance of the securities held by that account. The existence of such a performance based fee may create additional conflicts of interest for the portfolio manager in the allocation of management time, resources and investment opportunities. Whenever conflicts of interest arise, the portfolio manager will endeavor to exercise his or her discretion in a manner that he or she believes is equitable to all interested persons. EVM and the sub-adviser have adopted several policies and procedures designed to address these potential conflicts including a code of ethics and policies which govern EVM’s and the sub-adviser’s trading practices, including among other things the aggregation and allocation of trades among clients, brokerage allocation, cross trades and best execution.
Compensation Structure for EVM
Compensation of EVM’s portfolio managers and other investment professionals has three primary components: (1) a base salary, (2) an annual cash bonus, and (3) annual stock-based compensation consisting of options to purchase shares of EVC’s nonvoting common stock and restricted shares of EVC’s nonvoting common stock. EVM’s investment professionals also receive certain retirement, insurance and other benefits that are broadly available to EVM’s employees. Compensation of EVM’s investment professionals is reviewed primarily on an annual basis. Cash bonuses, stock-based compensation awards, and adjustments in base salary are typically paid or put into effect at or shortly after the October 31st fiscal year end of EVC.
Method to Determine Compensation. EVM compensates its portfolio managers based primarily on the scale and complexity of their portfolio responsibilities and the total return performance of managed funds and accounts versus the benchmark(s) stated in the prospectus, as well as an appropriate peer group (as described below). In addition to rankings within peer groups of funds on the basis of absolute performance, consideration may also be given to relative risk-adjusted performance. Risk-adjusted performance measures include, but are not limited to, the Sharpe Ratio. Performance is normally based on periods ending on the September 30th preceding fiscal year end. Fund performance is normally evaluated primarily versus peer groups of funds as determined by Lipper Inc. and/or Morningstar, Inc. When a fund’s peer group as determined by Lipper or Morningstar is deemed by EVM’s management not to provide a fair comparison, performance may instead be evaluated primarily against a custom peer group or market index. In evaluating the performance of a fund and
its manager, primary emphasis is normally placed on three-year performance, with secondary consideration of performance over longer and shorter periods. For funds that are tax-managed or otherwise have an objective of after-tax returns, performance is measured net of taxes. For other funds, performance is evaluated on a pre-tax basis. For funds with an investment objective other than total return (such as current income), consideration will also be given to the fund’s success in achieving its objective. For managers responsible for multiple funds and accounts, investment performance is evaluated on an aggregate basis, based on averages or weighted averages among managed funds and accounts. Funds and accounts that have performance-based advisory fees are not accorded disproportionate weightings in measuring aggregate portfolio manager performance.
The compensation of portfolio managers with other job responsibilities (such as heading an investment group or providing analytical support to other portfolios) will include consideration of the scope of such responsibilities and the managers’ performance in meeting them.
EVM seeks to compensate portfolio managers commensurate with their responsibilities and performance, and competitive with other firms within the investment management industry. EVM participates in investment-industry compensation surveys and utilizes survey data as a factor in determining salary, bonus and stock-based compensation levels for portfolio managers and other investment professionals. Salaries, bonuses and stock-based compensation are also influenced by the operating performance of EVM and its parent company. The overall annual cash bonus pool is based on a substantially fixed percentage of pre-bonus operating income. While the salaries of EVM’s portfolio managers are comparatively fixed, cash bonuses and stock-based compensation may fluctuate significantly from year to year, based on changes in manager performance and other factors as described herein. For a high performing portfolio manager, cash bonuses and stock-based compensation may represent a substantial portion of total compensation.
Item 9. Purchases of Equity Securities by Closed-End Management Investment Company and Affiliated Purchasers
No such purchases this period.
Item 10. Submission of Matters to a Vote of Security Holders
No material changes.
Item 11. Controls and Procedures
(a) It is the conclusion of the registrant’s principal executive officer and principal financial officer that the effectiveness of the registrant’s current disclosure controls and procedures (such disclosure controls and procedures having been evaluated within 90 days of the date of this filing) provide reasonable assurance that the information required to be disclosed by the registrant has been recorded, processed, summarized and reported within the time period specified in the Commission’s rules and forms and that the information required to be disclosed by the registrant has been accumulated and communicated to the registrant’s principal executive officer and principal financial officer in order to allow timely decisions regarding required disclosure.
(b) There have been no changes in the registrant’s internal controls over financial reporting during the second fiscal quarter of the period covered by this report that has materially affected, or is reasonably likely to materially affect, the registrant’s internal control over financial reporting.
Item 12. Disclosure of Securities Lending Activities for Closed-End Management Investment Companies
The Fund does not engage in securities lending.
Item 13. Exhibits
| | |
| |
| (a)(1) | | Registrant’s Code of Ethics – Not applicable (please see Item 2). |
| |
| (a)(2)(i) | | Treasurer’s Section 302 certification. |
| |
| (a)(2)(ii) | | President’s Section 302 certification. |
| |
| (b) | | Combined Section 906 certification. |
| |
| (c) | | Registrant’s notices to shareholders pursuant to Registrant’s exemptive order granting an exemption from Section 19(b) of the 1940 Act and Rule 19b-1 thereunder regarding distributions paid pursuant to the Registrant’s Managed Distribution Plan. |
Signatures
Pursuant to the requirements of the Securities Exchange Act of 1934 and the Investment Company Act of 1940, the registrant has duly caused this report to be signed on its behalf by the undersigned, thereunto duly authorized.
Eaton Vance Tax-Advantaged Dividend Income Fund
| | |
| By: | | /s/ Edward J. Perkin |
| | Edward J. Perkin |
| | President |
| |
| Date: | | October 22, 2018 |
Pursuant to the requirements of the Securities Exchange Act of 1934 and the Investment Company Act of 1940, this report has been signed below by the following persons on behalf of the registrant and in the capacities and on the dates indicated.
| | |
| By: | | /s/ James F. Kirchner |
| | James F. Kirchner |
| | Treasurer |
| |
| Date: | | October 22, 2018 |
| |
| By: | | /s/ Edward J. Perkin |
| | Edward J. Perkin |
| | President |
| |
| Date: | | October 22, 2018 |