Howard Weil Energy Conference March 2009
Disclosure Statement Other Placeholder: Safe-Harbor Statement -- Except for the historical information contained herein, the matters set forth in this presentation are “forward-looking statements” within the meaning of Section 27A of the Securities Act of 1933, as amended, and Section 21E of the Securities Exchange Act of 1934, as amended. The company intends that all such statements be subject to the “safe-harbor” provisions of those Acts. Many important risks, factors and conditions may cause the company’s actual results to differ materially from those discussed in any such forward-looking statement. These risks include, but are not limited to, estimates or forecasts of reserves, estimates or forecasts of production, future commodity prices, exchange rates, interest rates, geological and political risks, drilling risks, product demand, transportation restrictions, the ability of Cano Petroleum, Inc. to obtain additional capital, and other risks and uncertainties described in the company’s filings with the Securities and Exchange Commission. The historical results achieved by the company are not necessarily indicative of its future prospects. The company undertakes no obligation to publicly update or revise any forward-looking statements, whether as a result of new information, future events or otherwise. Cautionary Notes to Investors – The Securities and Exchange Commission (SEC) permits oil and gas companies, in their filings with the SEC, to disclose only proved reserves that a company has demonstrated by actual production or conclusive formation tests to be economically and legally producible under existing economic and operating conditions. Cano uses “non-proved reserves” in this presentation, which the SEC’s guidelines strictly prohibit it from including in filings with the SEC. Investors are urged to also consider closely the disclosures in Cano’s Form 10-K for the fiscal year ended June 30, 2008 and Form 10-Q for the period ended December 31, 2008, available from Cano by calling 877.698.0900. These forms also can be obtained from the SEC at www.sec.gov . PV10 Calculations of Reserve Values are based on the SEC price deck for June 30, 2008 (Cano’s fiscal year end) of $140.00 per bbl and $13.15 per mcf, are calculated “before tax” and consider the anticipated costs to develop and produce. 2
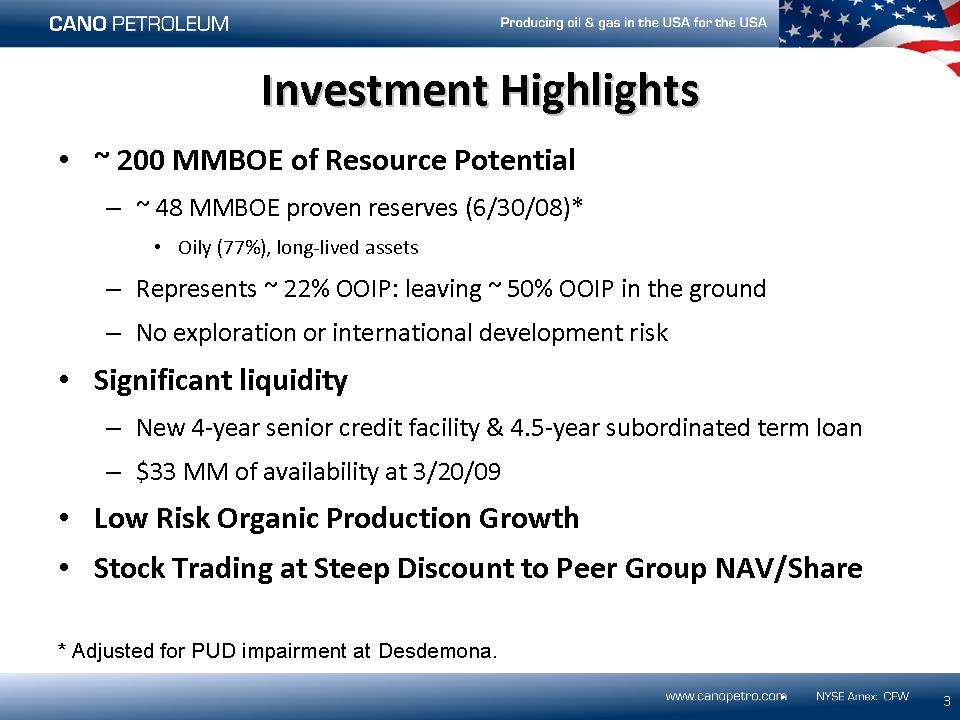
Other Placeholder: ~ 200 MMBOE of Resource Potential ~ 48 MMBOE proven reserves (6/30/08)* Oily (77%), long-lived assets Represents ~ 22% OOIP: leaving ~ 50% OOIP in the ground No exploration or international development risk Significant liquidity New 4-year senior credit facility & 4.5-year subordinated term loan $33 MM of availability at 3/20/09 Low Risk Organic Production Growth Stock Trading at Steep Discount to Peer Group NAV/Share Investment Highlights 3 * Adjusted for PUD impairment at Desdemona.
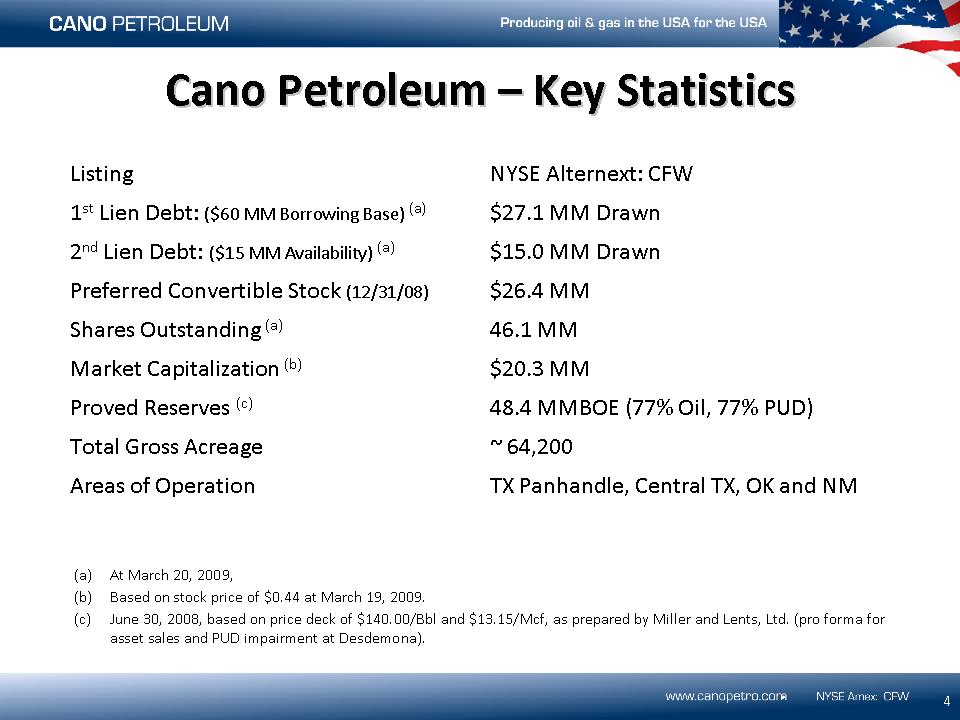
Listing NYSE Alternext: CFW 1st Lien Debt: ($60 MM Borrowing Base) (a) $27.1 MM Drawn 2nd Lien Debt: ($15 MM Availability) (a) $15.0 MM Drawn Preferred Convertible Stock (12/31/08) $26.4 MM Shares Outstanding (a) 46.1 MM Market Capitalization (b) $20.3 MM Proved Reserves (c) 48.4 MMBOE (77% Oil, 77% PUD) Total Gross Acreage ~ 64,200 Areas of Operation TX Panhandle, Central TX, OK and NM (a) At March 20, 2009, (b) Based on stock price of $0.44 at March 19, 2009. (c) June 30, 2008, based on price deck of $140.00/Bbl and $13.15/Mcf, as prepared by Miller and Lents, Ltd. (pro forma for asset sales and PUD impairment at Desdemona). Cano Petroleum – Key Statistics 4
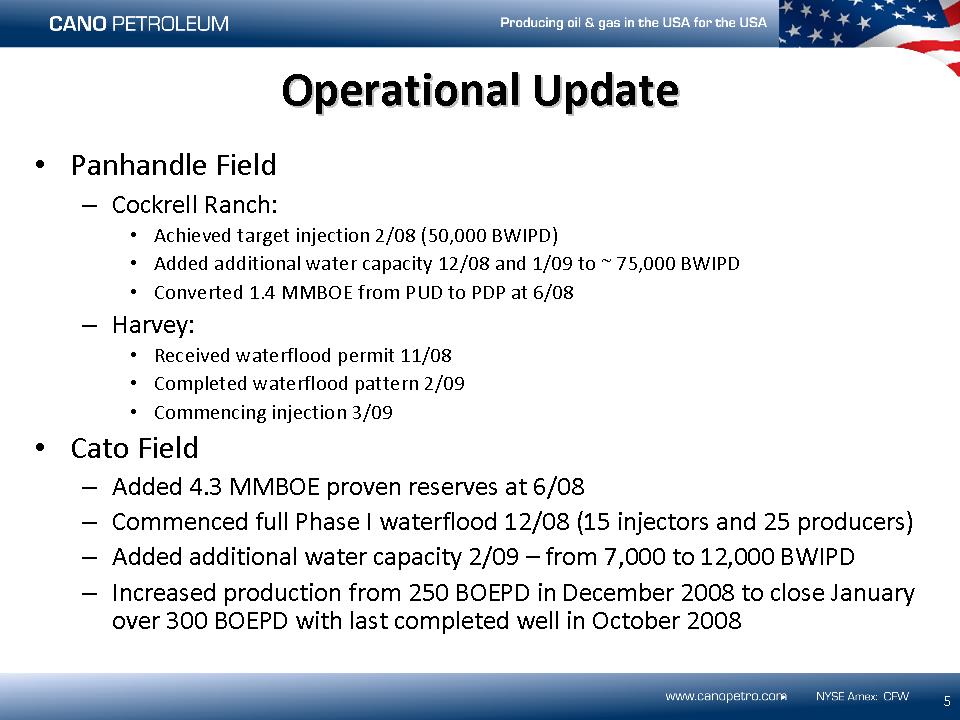
Panhandle Field Cockrell Ranch: Achieved target injection 2/08 (50,000 BWIPD) Added additional water capacity 12/08 and 1/09 to ~ 75,000 BWIPD Converted 1.4 MMBOE from PUD to PDP at 6/08 Harvey: Received waterflood permit 11/08 Completed waterflood pattern 2/09 Commencing injection 3/09 Cato Field Added 4.3 MMBOE proven reserves at 6/08 Commenced full Phase I waterflood 12/08 (15 injectors and 25 producers) Added additional water capacity 2/09 – from 7,000 to 12,000 BWIPD Increased production from 250 BOEPD in December 2008 to close January over 300 BOEPD with last completed well in October 2008 Operational Update 5
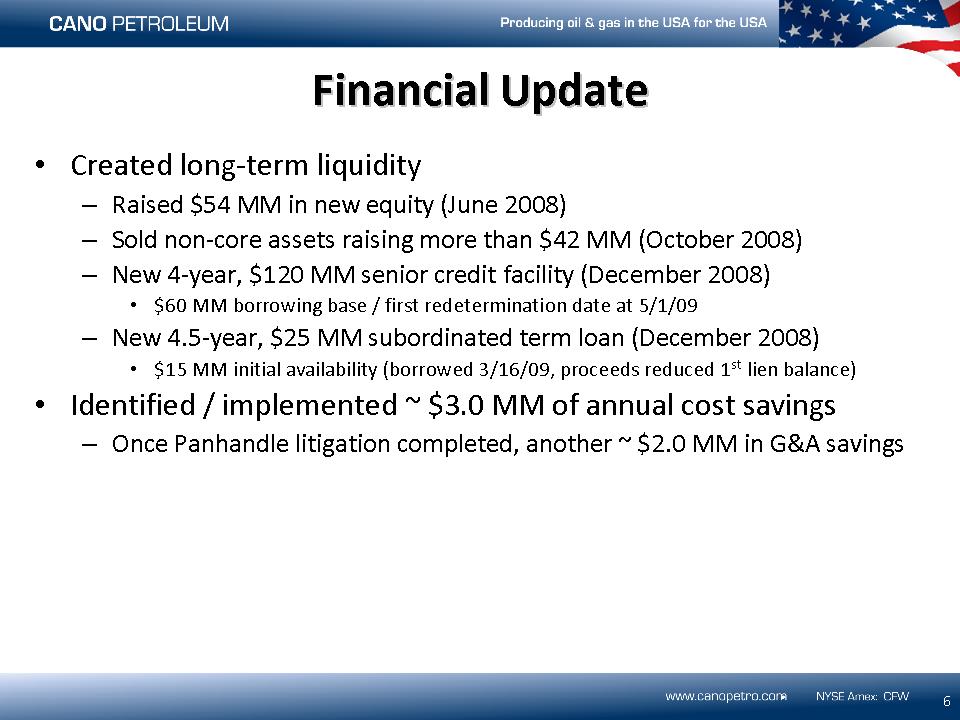
Created long-term liquidity Raised $54 MM in new equity (June 2008) Sold non-core assets raising more than $42 MM (October 2008) New 4-year, $120 MM senior credit facility (December 2008) $60 MM borrowing base / first redetermination date at 5/1/09 New 4.5-year, $25 MM subordinated term loan (December 2008) $15 MM initial availability (borrowed 3/16/09, proceeds reduced 1st lien balance) Identified / implemented ~ $3.0 MM of annual cost savings Once Panhandle litigation completed, another ~ $2.0 MM in G&A savings Financial Update 6
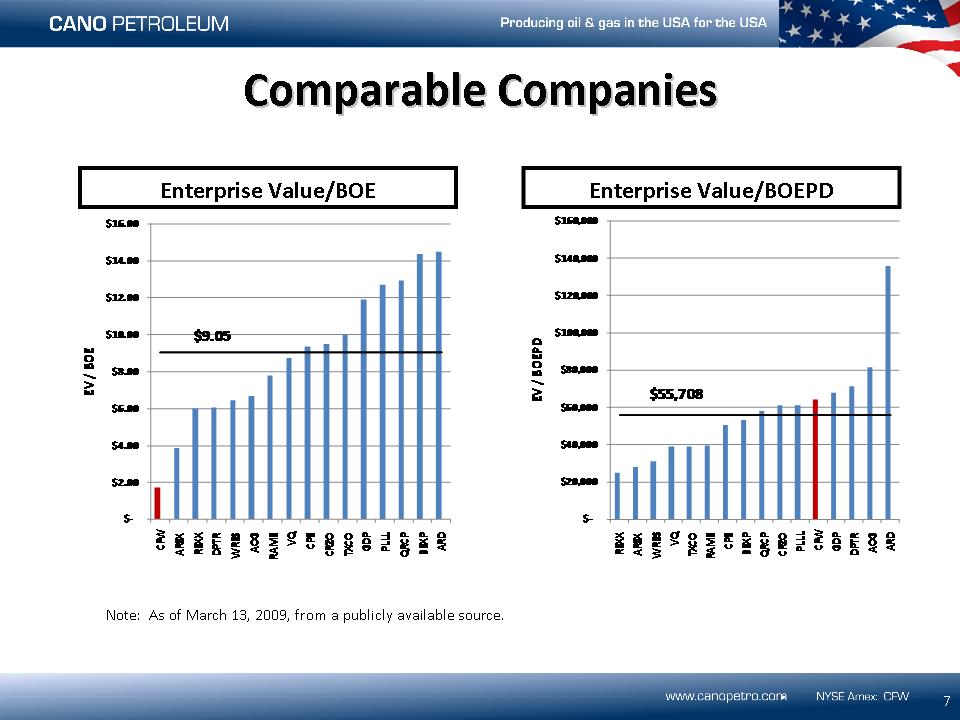
Comparable Companies 7 Enterprise Value/BOE Enterprise Value/BOEPD Note: As of March 13, 2009, from a publicly available source. Median Median
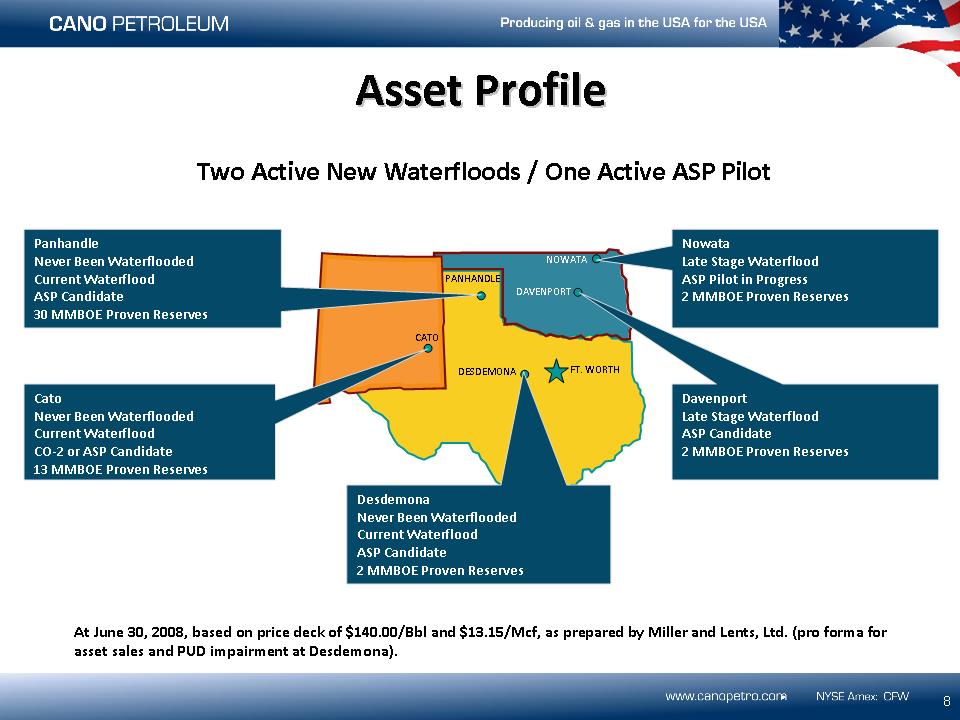
FT. WORTH DAVENPORT NOWATA Desdemona Never Been Waterflooded Current Waterflood ASP Candidate 2 MMBOE Proven Reserves Davenport Late Stage Waterflood ASP Candidate 2 MMBOE Proven Reserves Asset Profile 8 Two Active New Waterfloods / One Active ASP Pilot Nowata Late Stage Waterflood ASP Pilot in Progress 2 MMBOE Proven Reserves Cato Never Been Waterflooded Current Waterflood CO-2 or ASP Candidate 13 MMBOE Proven Reserves CATO DESDEMONA Panhandle Never Been Waterflooded Current Waterflood ASP Candidate 30 MMBOE Proven Reserves PANHANDLE At June 30, 2008, based on price deck of $140.00/Bbl and $13.15/Mcf, as prepared by Miller and Lents, Ltd. (pro forma for asset sales and PUD impairment at Desdemona).
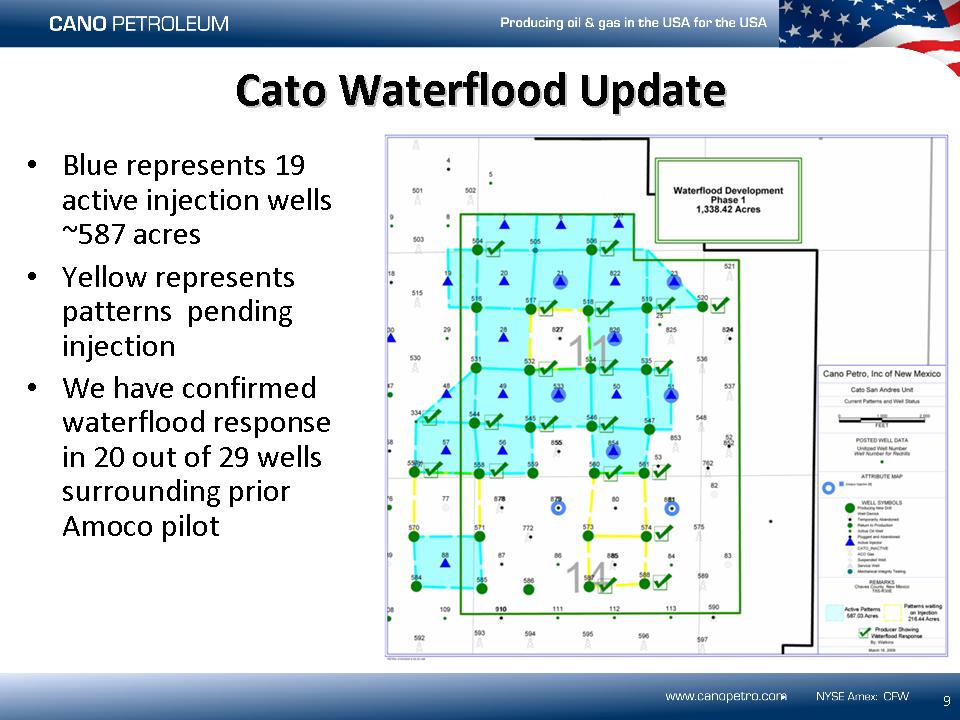
Blue represents 19 active injection wells ~587 acres Yellow represents patterns pending injection We have confirmed waterflood response in 20 out of 29 wells surrounding prior Amoco pilot Cato Waterflood Update 9
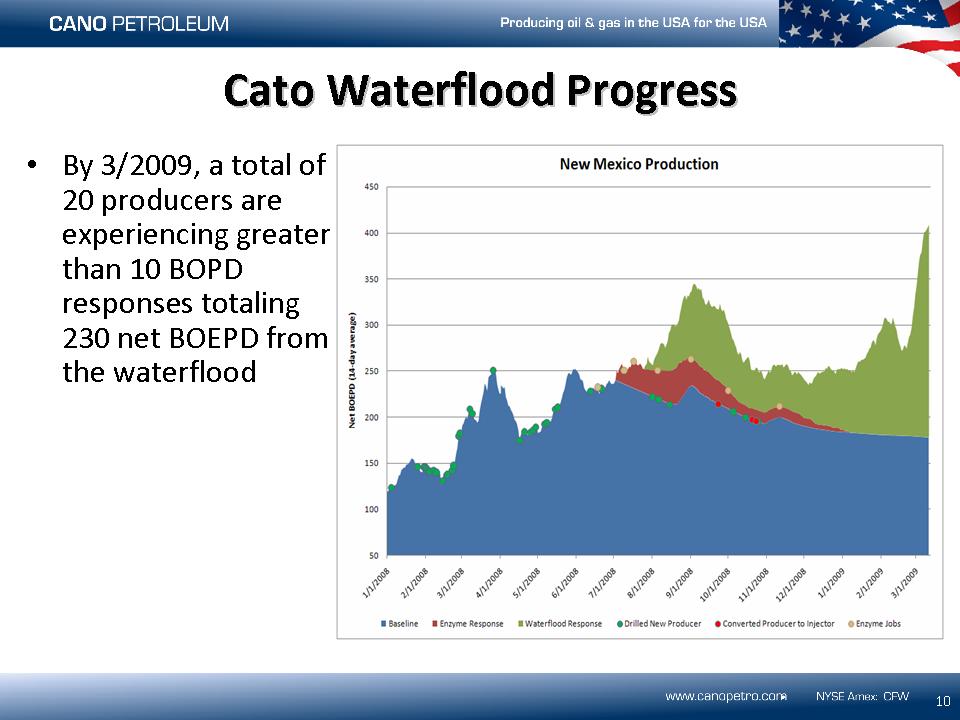
Cato Waterflood Progress 10 By 3/2009, a total of 20 producers are experiencing greater than 10 BOPD responses totaling 230 net BOEPD from the waterflood
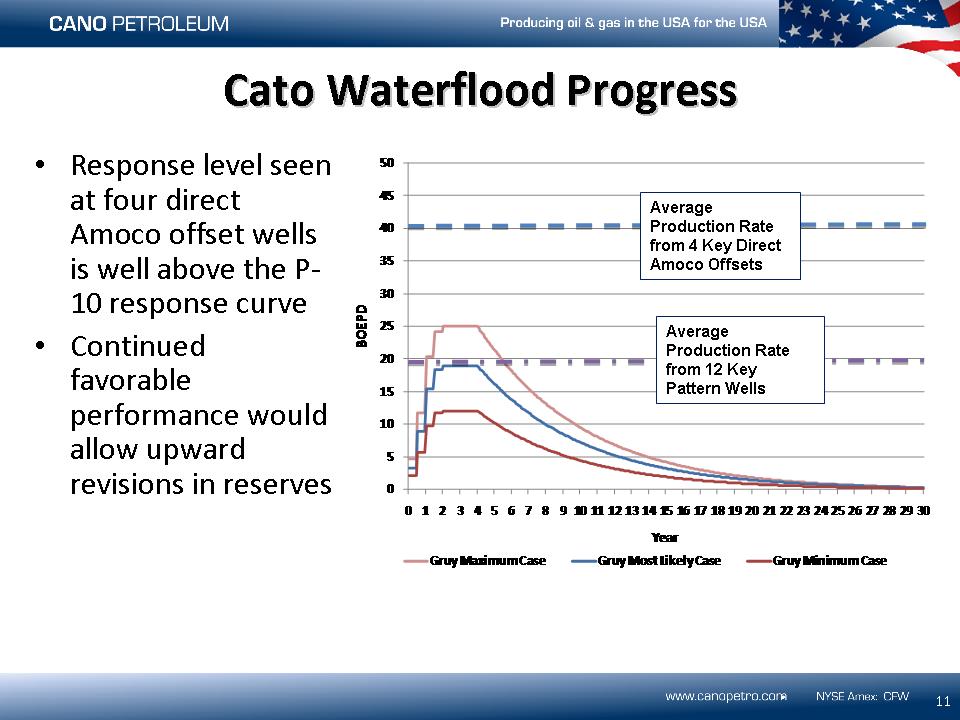
Response level seen at four direct Amoco offset wells is well above the P-10 response curve Continued favorable performance would allow upward revisions in reserves Cato Waterflood Progress 11 Average Production Rate from 4 Key Direct Amoco Offsets Average Production Rate from 12 Key Pattern Wells
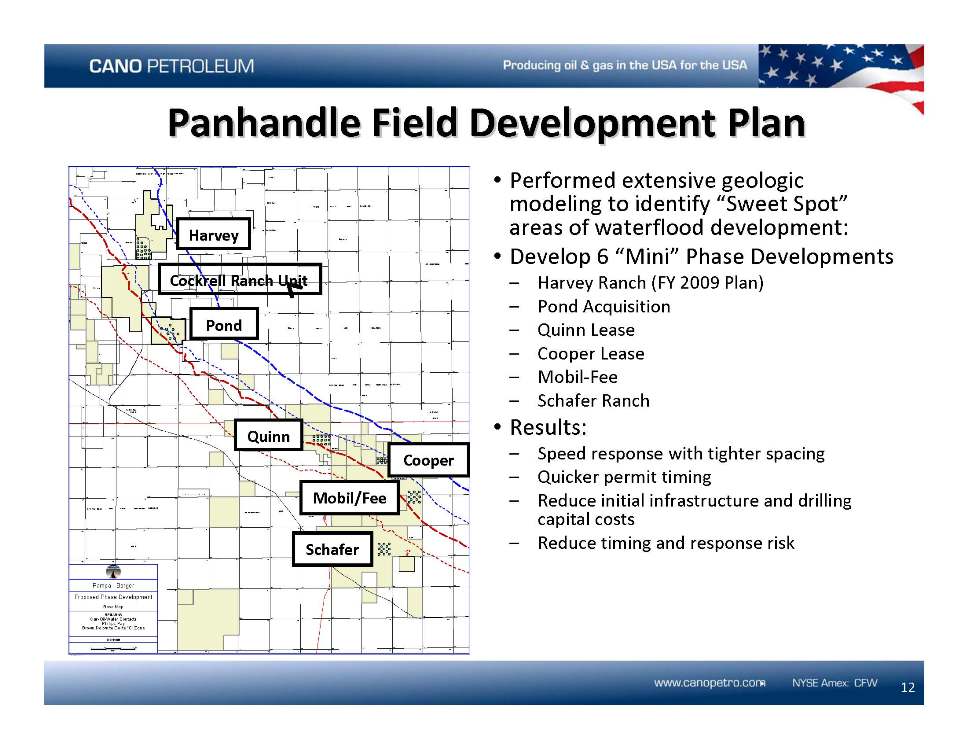
12 Panhandle Field Development Plan Performed extensive geologic modeling to identify “Sweet Spot” areas of waterflood development: Develop 6 “Mini” Phase Developments Harvey Ranch (FY 2009 Plan) Pond Acquisition Quinn Lease Cooper Lease Mobil-Fee Schafer Ranch Results: Speed response with tighter spacing Quicker permit timing Reduce initial infrastructure and drilling capital costs Reduce timing and response risk Harvey Pond Quinn Cooper Mobil/Fee Schafer Cockrell Ranch Unit
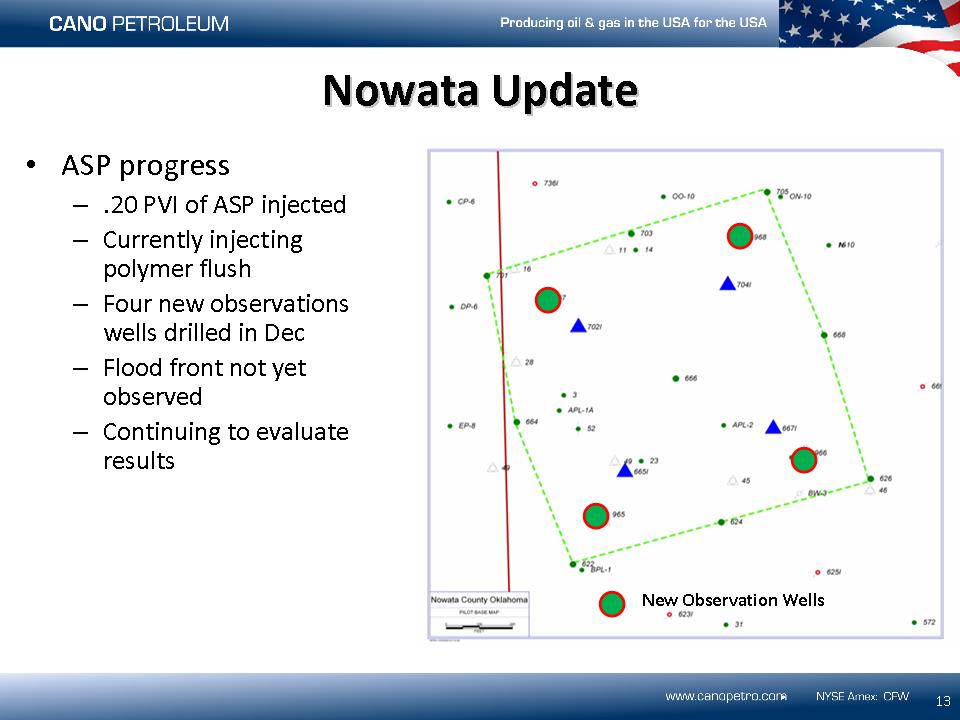
Nowata Update 13 ASP progress .20 PVI of ASP injected Currently injecting polymer flush Four new observations wells drilled in Dec Flood front not yet observed Continuing to evaluate results New Observation Wells
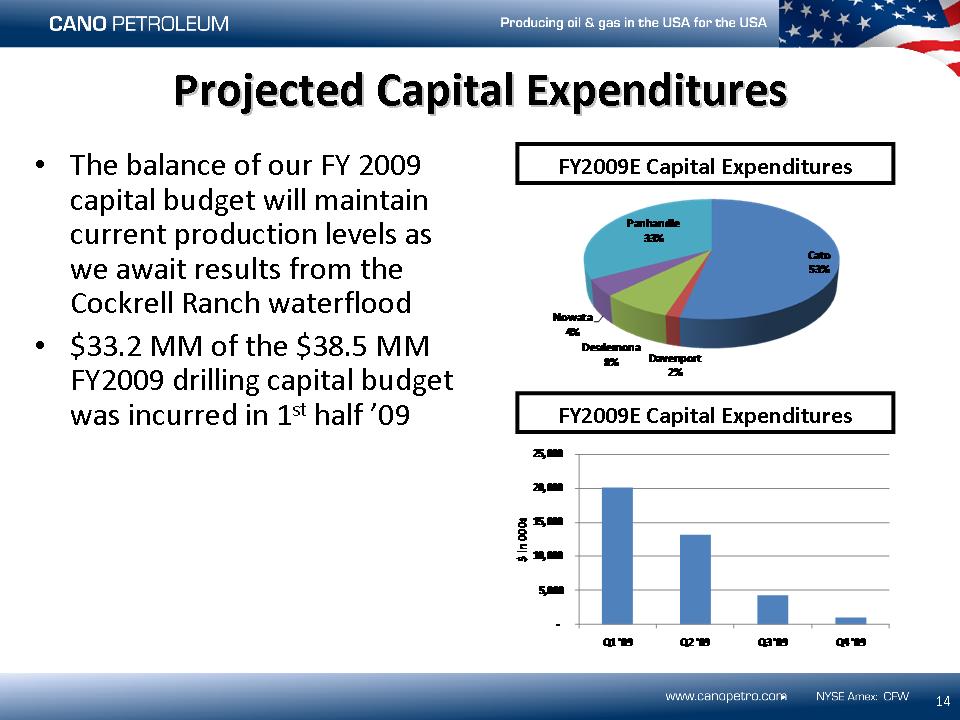
The balance of our FY 2009 capital budget will maintain current production levels as we await results from the Cockrell Ranch waterflood $33.2 MM of the $38.5 MM FY2009 drilling capital budget was incurred in 1st half ’09 Projected Capital Expenditures 14 FY2009E Capital Expenditures FY2009E Capital Expenditures
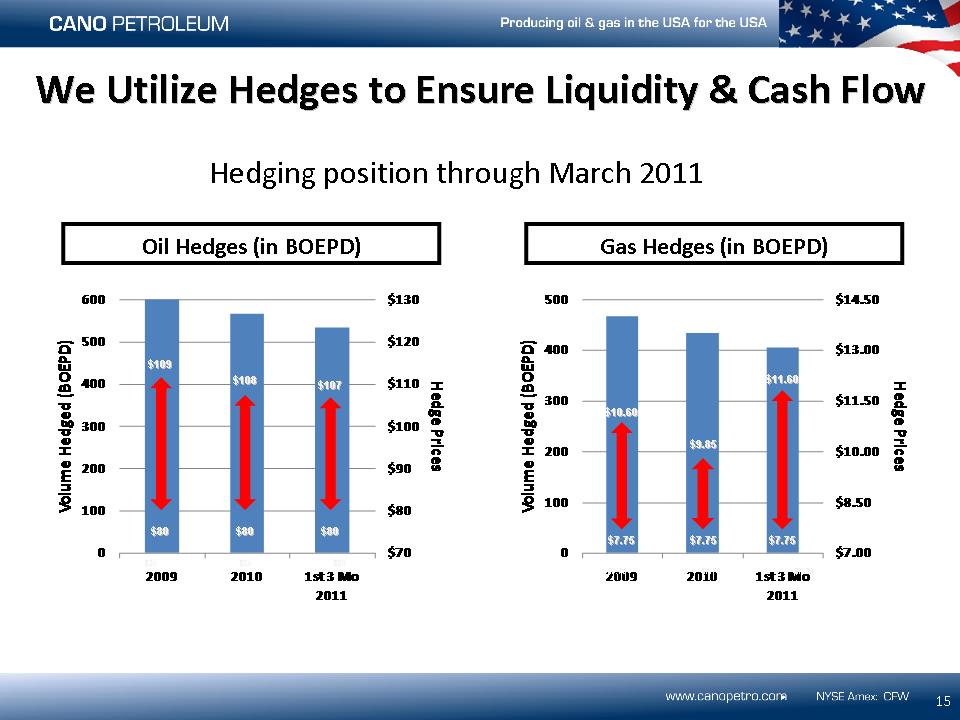
Hedging position through March 2011 We Utilize Hedges to Ensure Liquidity & Cash Flow 15 Oil Hedges (in BOEPD) Gas Hedges (in BOEPD) $80 $80 $80 $109 $108 $107 $7.75 $7.75 $7.75 $80 $80 $80 $7.75 $7.75 $7.75 $10.60 $11.60 $9.85
Organically grow PDP reserves approximately 20% per year Continue waterflood / ASP / tertiary development Maintain healthy balance sheet / liquidity Be opportunistic Company Strategy 16
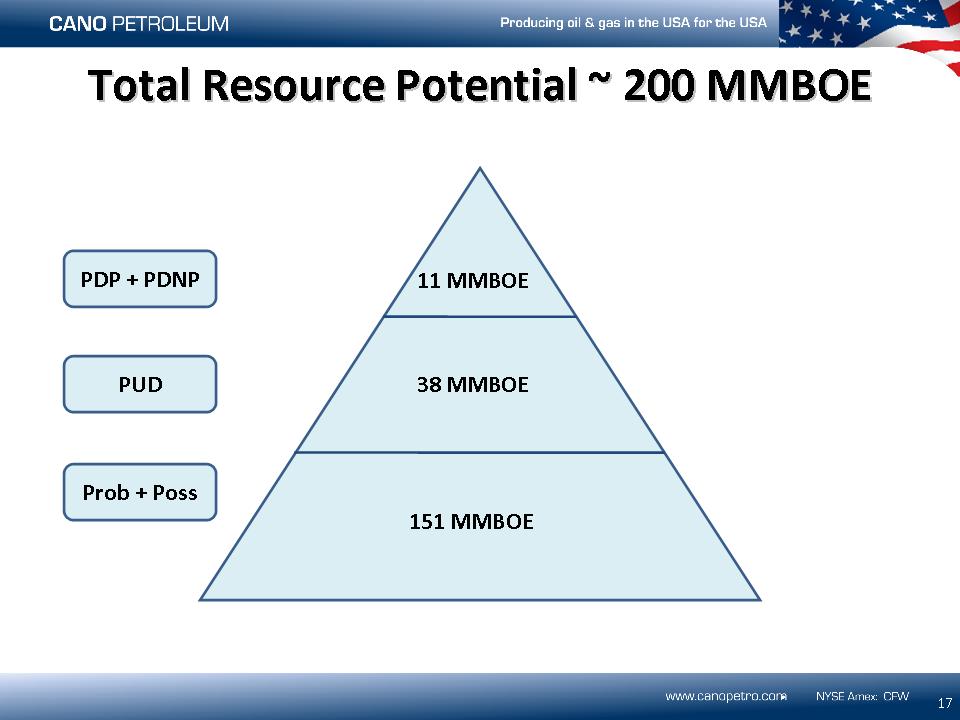
17 Total Resource Potential ~ 200 MMBOE PDP + PDNP PUD Prob + Poss 11 MMBOE 38 MMBOE 151 MMBOE
© Cano Petroleum Inc., 2009