UNITED STATES
SECURITIES AND EXCHANGE COMMISSION
Washington, D.C. 20549
FORM N-CSR
CERTIFIED SHAREHOLDER REPORT OF REGISTERED
MANAGEMENT INVESTMENT COMPANIES
Investment Company Act file number
811-21403
Western Asset Inflation-Linked Income Fund
(Exact name of registrant as specified in charter)
620 Eighth Avenue, 47th Floor, New York, NY 10018
(Address of principal executive offices) (Zip code)
Marc A. De Oliveira
Franklin Templeton
100 First Stamford Place
Stamford, CT 06902
(Name and address of agent for service)
Registrant’s telephone number, including area code:
1-888-777-0102
Date of fiscal year end: November 30
Date of reporting period: May 31, 2024
| ITEM 1. | REPORT TO STOCKHOLDERS. |
The Semi-Annual Report to Stockholders is filed herewith.
Semi-Annual ReportMay 31, 2024
WESTERN ASSET
INFLATION-LINKED INCOME FUND (WIA)
Managed Distribution Policy: The Fund’s Board of Trustees (the “Board”) has authorized a managed distribution plan pursuant to which the Fund makes monthly distributions to shareholders at a fixed rate of $0.0500 per common share, which rate may be adjusted from time to time by the Fund’s Board (the “Plan”). The Plan is intended to provide shareholders with a constant, but not guaranteed, fixed minimum rate of distribution each month. The Fund is managed with a goal of generating as much of the distribution as possible from net ordinary income and short-term capital gains that is consistent with the Fund’s investment strategy and risk profile. To the extent that sufficient distributable income is not available on a monthly basis, the Fund will distribute long-term capital gains and/or return of capital in order to maintain its managed distribution rate. A return of capital may occur, for example, when some or all of the money that was invested in the Fund is paid back to shareholders. A return of capital distribution does not necessarily reflect the Fund’s investment performance and should not be confused with “yield” or “income”. Even though the Fund may realize current year capital gains, such gains may be offset, in whole or in part, by the Fund’s capital loss carryovers from prior years.
The Board may amend the terms of the Plan or terminate the Plan at any time without prior notice to the Fund’s shareholders, however, at this time there are no reasonably foreseeable circumstances that might cause the termination of the Plan. The amendment or termination of the Plan could have an adverse effect on the market price of the Fund’s common shares. The Plan is subject to the periodic review by the Board to determine if an adjustment should be made.
Shareholders should not draw any conclusions about the Fund’s investment performance from the amount of the current distribution or from the terms of the Fund’s Plan. The Fund will send a Form 1099-DIV to shareholders for the calendar year that will describe how to
report the Fund’s distributions for federal income tax purposes.
Fund objectives
The Fund’s primary investment objective is to provide current income. Capital appreciation, when consistent with current income, is a secondary investment objective.
Under normal market conditions and at the time of purchase, the Fund will invest at least 80% of its total managed assets in inflation-linked securities and at least 60% of its total managed assets in U.S. Treasury Inflation Protected Securities (“TIPS”). The Fund may also invest up to 40% of its total managed assets in non-U.S. dollar investments.
Letter from the president | |
| |
| |
| |
| |
| |
| |
| |
| |
| |
| |
| |
| |
Western Asset Inflation-Linked Income Fund
Letter from the president
Dear Shareholder,
We are pleased to provide the semi-annual report of Western Asset Inflation-Linked Income Fund for the six-month reporting period ended May 31, 2024. Please read on for Fund performance information during the Fund’s reporting period.
Special shareholder notices
Effective March 1, 2024, the portfolio management team responsible for the day-to-day oversight of the Fund became as follows: Michael Buchanan, Ken Leech, John Bellows, Chia-Liang (CL) Lian and Frederick Marki.
Effective May 1, 2024, the portfolio management team responsible for the day-to-day oversight of the Fund became as follows: Michael Buchanan, Ken Leech, Chia-Liang (CL) Lian and Frederick Marki.
Effective June 3, 2024, Chia-Liang (CL) Lian no longer serves as a member of the Fund’s portfolio management team.
As always, we remain committed to providing you with excellent service and a full spectrum of investment choices. We also remain committed to supplementing the support you receive from your financial advisor. One way we accomplish this is through our website, www.franklintempleton.com. Here you can gain immediate access to market and investment information, including:
•
Fund prices and performance,
•
Market insights and commentaries from our portfolio managers, and
•
A host of educational resources.
Western Asset Inflation-Linked Income Fund
Letter from the president (cont’d)
We look forward to helping you meet your financial goals.
Jane Trust, CFA
President and Chief Executive Officer
Western Asset Inflation-Linked Income Fund
(This page intentionally left blank.)
For the six months ended May 31, 2024, Western Asset Inflation-Linked Income Fund returned 3.72% based on its net asset value (NAV)i and 5.08% based on its New York Stock Exchange (NYSE) market price per share. The Fund’s unmanaged benchmarks, the Bloomberg U.S. Government Inflation-Linked 1-10 Year Indexii and the Bloomberg U.S. Government Inflation-Linked All Maturities Indexiii, returned 2.73% and 2.64%, respectively, for the same period. The Bloomberg World Government Inflation-Linked All Maturities Indexiv and the Fund’s Custom Benchmarkv returned 2.08% and 2.68%, respectively, over the same time frame.
The Fund has adopted a managed distribution policy. Pursuant to this policy, the Fund intends to make regular monthly distributions to common shareholders at a fixed rate per common share, which rate may be adjusted from time to time by the Fund’s Board of Trustees. This policy has no impact on the Fund’s investment strategy and may reduce the Fund’s NAV. The Fund’s investment adviser believes the policy helps maintain the Fund’s competitiveness and may benefit the Fund’s market price and premium/discount to the Fund’s NAV.
During the six-month period, the Fund made distributions to shareholders totaling $0.30 per share. As of May 31, 2024, the Fund estimates that all of the distributions were sourced from net investment income.* The performance table shows the Fund’s six-month total return based on its NAV and market price as of May 31, 2024. Past performance is no guarantee of future results.
Performance Snapshot as of May 31, 2024 (unaudited) |
| |
| |
| |
All figures represent past performance and are not a guarantee of future results. Performance figures for periods shorter than one year represent cumulative figures and are not annualized.
** Total returns are based on changes in NAV or market price, respectively. Returns reflect the deduction of all Fund expenses, including management fees, operating expenses, and other Fund expenses. Returns do not reflect the deduction of brokerage commissions or taxes that investors may pay on distributions or the sale of shares.
† Total return assumes the reinvestment of all distributions, including returns of capital, if any, at NAV.
‡ Total return assumes the reinvestment of all distributions, including returns of capital, if any, in additional shares in accordance with the Fund’s Dividend Reinvestment Plan.
*
These estimates are not for tax purposes. The Fund will issue a Form 1099 with final composition of the distributions for tax purposes after year-end. A return of capital is not taxable and results in a reduction in the tax basis of a shareholder’s investment. For more information about a distribution’s composition, please refer to the Fund’s distribution press release or, if applicable, the Section 19 notice located in the press release section of our website, www.franklintempleton.com.
Western Asset Inflation-Linked Income Fund
Performance review (cont’d)
Looking for additional information?
The Fund is traded under the symbol “WIA” and its closing market price is available in most newspapers under the NYSE listings. The daily NAV is available online under the symbol “XWIAX” on most financial websites. Barron’s and The Wall Street Journal’s Monday edition both carry closed-end fund tables that provide additional information. In addition, the Fund issues a quarterly press release that can be found on most major financial websites as well as www.franklintempleton.com.
In a continuing effort to provide information concerning the Fund, shareholders may call 1-888-777-0102 (toll free), Monday through Friday from 8:00 a.m. to 5:30 p.m. Eastern Time, for the Fund’s current NAV, market price and other information.
Thank you for your investment in the Western Asset Inflation-Linked Income Fund. As always, we appreciate that you have chosen us to manage your assets and we remain focused on achieving the Fund’s investment goals.
Sincerely,
Jane Trust, CFA
President and Chief Executive Officer
RISKS: The Fund is a diversified closed-end management investment company designed primarily as a long-term investment and not as a trading vehicle. The Fund is not intended to be a complete investment program and, due to the uncertainty inherent in all investments, there can be no assurance that the Fund will achieve its investment objectives. The Fund’s common shares are traded on the NYSE. Similar to stocks, the Fund’s share price will fluctuate with market conditions and, at the time of sale, may be worth more or less than the original investment. Shares of closed-end funds often trade at a discount to their net asset value. Diversification does not assure against market loss. Bonds are subject to a variety of risks, including interest rate, credit and inflation risks. As interest rates rise, bond prices fall, reducing the value of a fixed income investment’s price. The Fund is subject to the additional risks associated with inflation protected securities, including liquidity risk, prepayment risk, extension risk and deflation risk. Investments in foreign companies, including emerging markets, involve risks beyond those inherent solely in domestic investments. Leverage may cause a fund to be more volatile than if the fund had not been leveraged, which may increase the risk of investment loss. Derivatives, such as options, futures, forwards and swaps, can be illiquid, create counterparty risk, may disproportionately increase losses, and may have a potentially large impact on Fund performance. To the extent that the Fund invests in asset-backed, mortgage-backed or mortgage-related securities, its exposure to prepayment and extension risks may be greater than if it
Western Asset Inflation-Linked Income Fund
invested in other fixed income securities. International investments are subject to currency fluctuations, as well as social, economic and political risks. These risks are magnified in emerging markets. Emerging market countries tend to have economic, political and legal systems that are less developed and are less stable than those of more developed countries.
An investment in the Fund is subject to the following additional risks. Lower grade securities, or equivalent unrated securities, which are commonly known as “junk bonds,” typically entail greater potential price volatility and may be less liquid than higher-rated securities. The Fund may have to apply a greater degree of judgment in establishing a price for lower grade securities for purposes of valuing fund shares. Changes in economic conditions or developments regarding the individual issuer are more likely to cause price volatility and weaken the capacity of such securities to make principal and interest payments than is the case for higher grade securities. Lower grade securities are regarded as having predominantly speculative characteristics with respect to the issuer’s capacity to pay interest and repay principal. These securities may also be more susceptible to real or perceived adverse economic and competitive industry conditions than higher rated securities. Lower grade and unrated securities are generally issued by less creditworthy issuers that may have a larger amount of outstanding debt relative to their assets than issuers of higher grade securities. In the event of an issuer’s bankruptcy, claims of other creditors may have priority over the claims of lower grade security holders, leaving few or no assets available to repay lower grade security holders. The Fund may incur expenses to the extent necessary to seek recovery upon default or to negotiate new terms with a defaulting issuer. Lower grade securities frequently have redemption features that permit an issuer to repurchase the security from the Fund before it matures. If the issuer redeems lower grade securities, the Fund may have to invest the proceeds in securities with lower yields and may lose income. Lower grade and unrated securities involve the risk that the Fund’s investment adviser may not accurately evaluate the security’s comparative rating. Analysis of the creditworthiness of issuers of lower grade and unrated securities may be more complex than for issuers of higher quality securities. To the extent that the Fund holds lower grade and/or unrated securities, the Fund’s success in achieving its investment objectives may depend more heavily on the Fund’s investment adviser’s credit analysis than if the Fund held exclusively higher-quality and rated securities. If changes in the currency exchange rates do not occur as anticipated, the Fund may lose money on currency transactions. The Fund’s ability to use currency transactions successfully depends on a number of factors, including the currency transactions being available at prices that are not too costly, the availability of liquid markets and the ability of the Fund to accurately predict the direction of changes in currency exchange rates. Currency exchange rates may be volatile. Currency transactions are subject to counterparty risk, which is the risk that the other party in the transaction will not fulfill its contractual obligation. The Fund may gain exposure to the commodities markets by investing a portion of its assets in a wholly-owned subsidiary, Western Asset Inflation-Linked Income Fund CFC (the “Subsidiary”), organized under the laws of the Cayman Islands. The Fund and the Subsidiary are deemed “commodity pools” and the investment adviser is considered a “commodity pool operator” with respect to the Fund under the Commodity Exchange Act. The investment adviser, directly or through its affiliates, is therefore subject to dual regulation by the Securities and Exchange Commission (the “SEC”) and the Commodity Futures Trading Commission (the “CFTC”).
Western Asset Inflation-Linked Income Fund
Performance review (cont’d)
The regulatory requirements governing the use of commodity futures (which include futures on broad-based securities indexes, interest rate futures and currency futures), options on commodity futures, certain swaps or certain other investments could change at any time. Investments by the Fund in commodity-linked derivatives may subject the Fund to greater volatility than investments in traditional securities. The value of commodity-linked derivatives may be affected by changes in overall market movements, commodity index volatility, prolonged or intense speculation by investors, changes in interest rates or factors affecting a particular industry or commodity, such as drought, floods, other weather phenomena, livestock disease, embargoes, tariffs and international economic, political and regulatory developments. By investing in the Subsidiary, the Fund is indirectly exposed to the risks associated with the Subsidiary’s investments. The investments held by the Subsidiary are generally similar to those that are permitted to be held by the Fund and are subject to the same risks that apply to similar investments if held directly by the Fund. The Subsidiary is not registered as an investment company and is not subject to all of the investor protections of the Investment Company Act of 1940 (the “1940 Act”).
Changes in the laws of the United States and/or the Cayman Islands could adversely affect the Fund. For example, the Cayman Islands does not currently impose any income, corporate or capital gains tax, estate duty, inheritance tax, gift tax or withholding tax on the Subsidiary. If Cayman Islands law changes such that the Subsidiary must pay Cayman Islands taxes, shareholders would likely suffer decreased investment returns. The Fund’s exposure to commodities markets, including through the Subsidiary, may be limited by its intention to qualify as a regulated investment company for U.S. federal income tax purposes and may interfere with its ability to qualify as such. The market values of securities or other assets will fluctuate, sometimes sharply and unpredictably, due to changes in general market conditions, overall economic trends or events, governmental actions or intervention, actions taken by the U.S. Federal Reserve or foreign central banks, market disruptions caused by trade disputes or other factors, political developments, armed conflicts, economic sanctions and countermeasures in response to sanctions, major cybersecurity events, investor sentiment, the global and domestic effects of a pandemic, and other factors that may or may not be related to the issuer of the security or other asset. The Fund may also invest in money market funds, including funds affiliated with the Fund’s investment adviser.
This material is not intended as a recommendation or as investment advice of any kind, including in connection with rollovers, transfers, and distributions. Such material is not provided in a fiduciary capacity, may not be relied upon for or in connection with the making of investment decisions, and does not constitute a solicitation of an offer to buy or sell securities. All content has been provided for informational or educational purposes only and is not intended to be and should not be construed as legal or tax advice and/or a legal opinion. Always consult a financial, tax and/or legal professional regarding your specific situation.
All investments are subject to risk including the possible loss of principal. Past performance is no guarantee of future results. All index performance reflects no deduction for fees, expenses or taxes. Please note that an investor cannot invest directly in an index.
Western Asset Inflation-Linked Income Fund
i
Net asset value (NAV) is calculated by subtracting total liabilities, including liabilities associated with financial leverage (if any), from the closing value of all securities held by the Fund (plus all other assets) and dividing the result (total net assets) by the total number of the common shares outstanding. The NAV fluctuates with changes in the market prices of securities in which the Fund has invested. However, the price at which an investor may buy or sell shares of the Fund is the Fund’s market price as determined by supply of and demand for the Fund’s shares.
ii
The Bloomberg U.S. Government Inflation-Linked 1-10 Year Index measures the performance of the intermediate U.S. Treasury Inflation-Protected Securities (TIPS) market.
iii
The Bloomberg U.S. Government Inflation-Linked All Maturities Index measures the performance of the U.S. TIPS market. The index includes TIPS with one or more years remaining maturity with total outstanding issue size of $500 million or more.
iv
The Bloomberg World Government Inflation-Linked All Maturities Index measures the performance of the major government inflation-linked bond markets.
v
The Custom Benchmark is comprised of 90% Bloomberg U.S. Government Inflation-Linked All Maturities Index and 10% Bloomberg U.S. Credit Index. The Bloomberg U.S. Credit Index is an index composed of corporate and non-corporate debt issues that are investment grade (rated Baa3/BBB- or higher).
Important data provider notices and terms available at www.franklintempletondatasources.com.
Western Asset Inflation-Linked Income Fund
(This page intentionally left blank.)
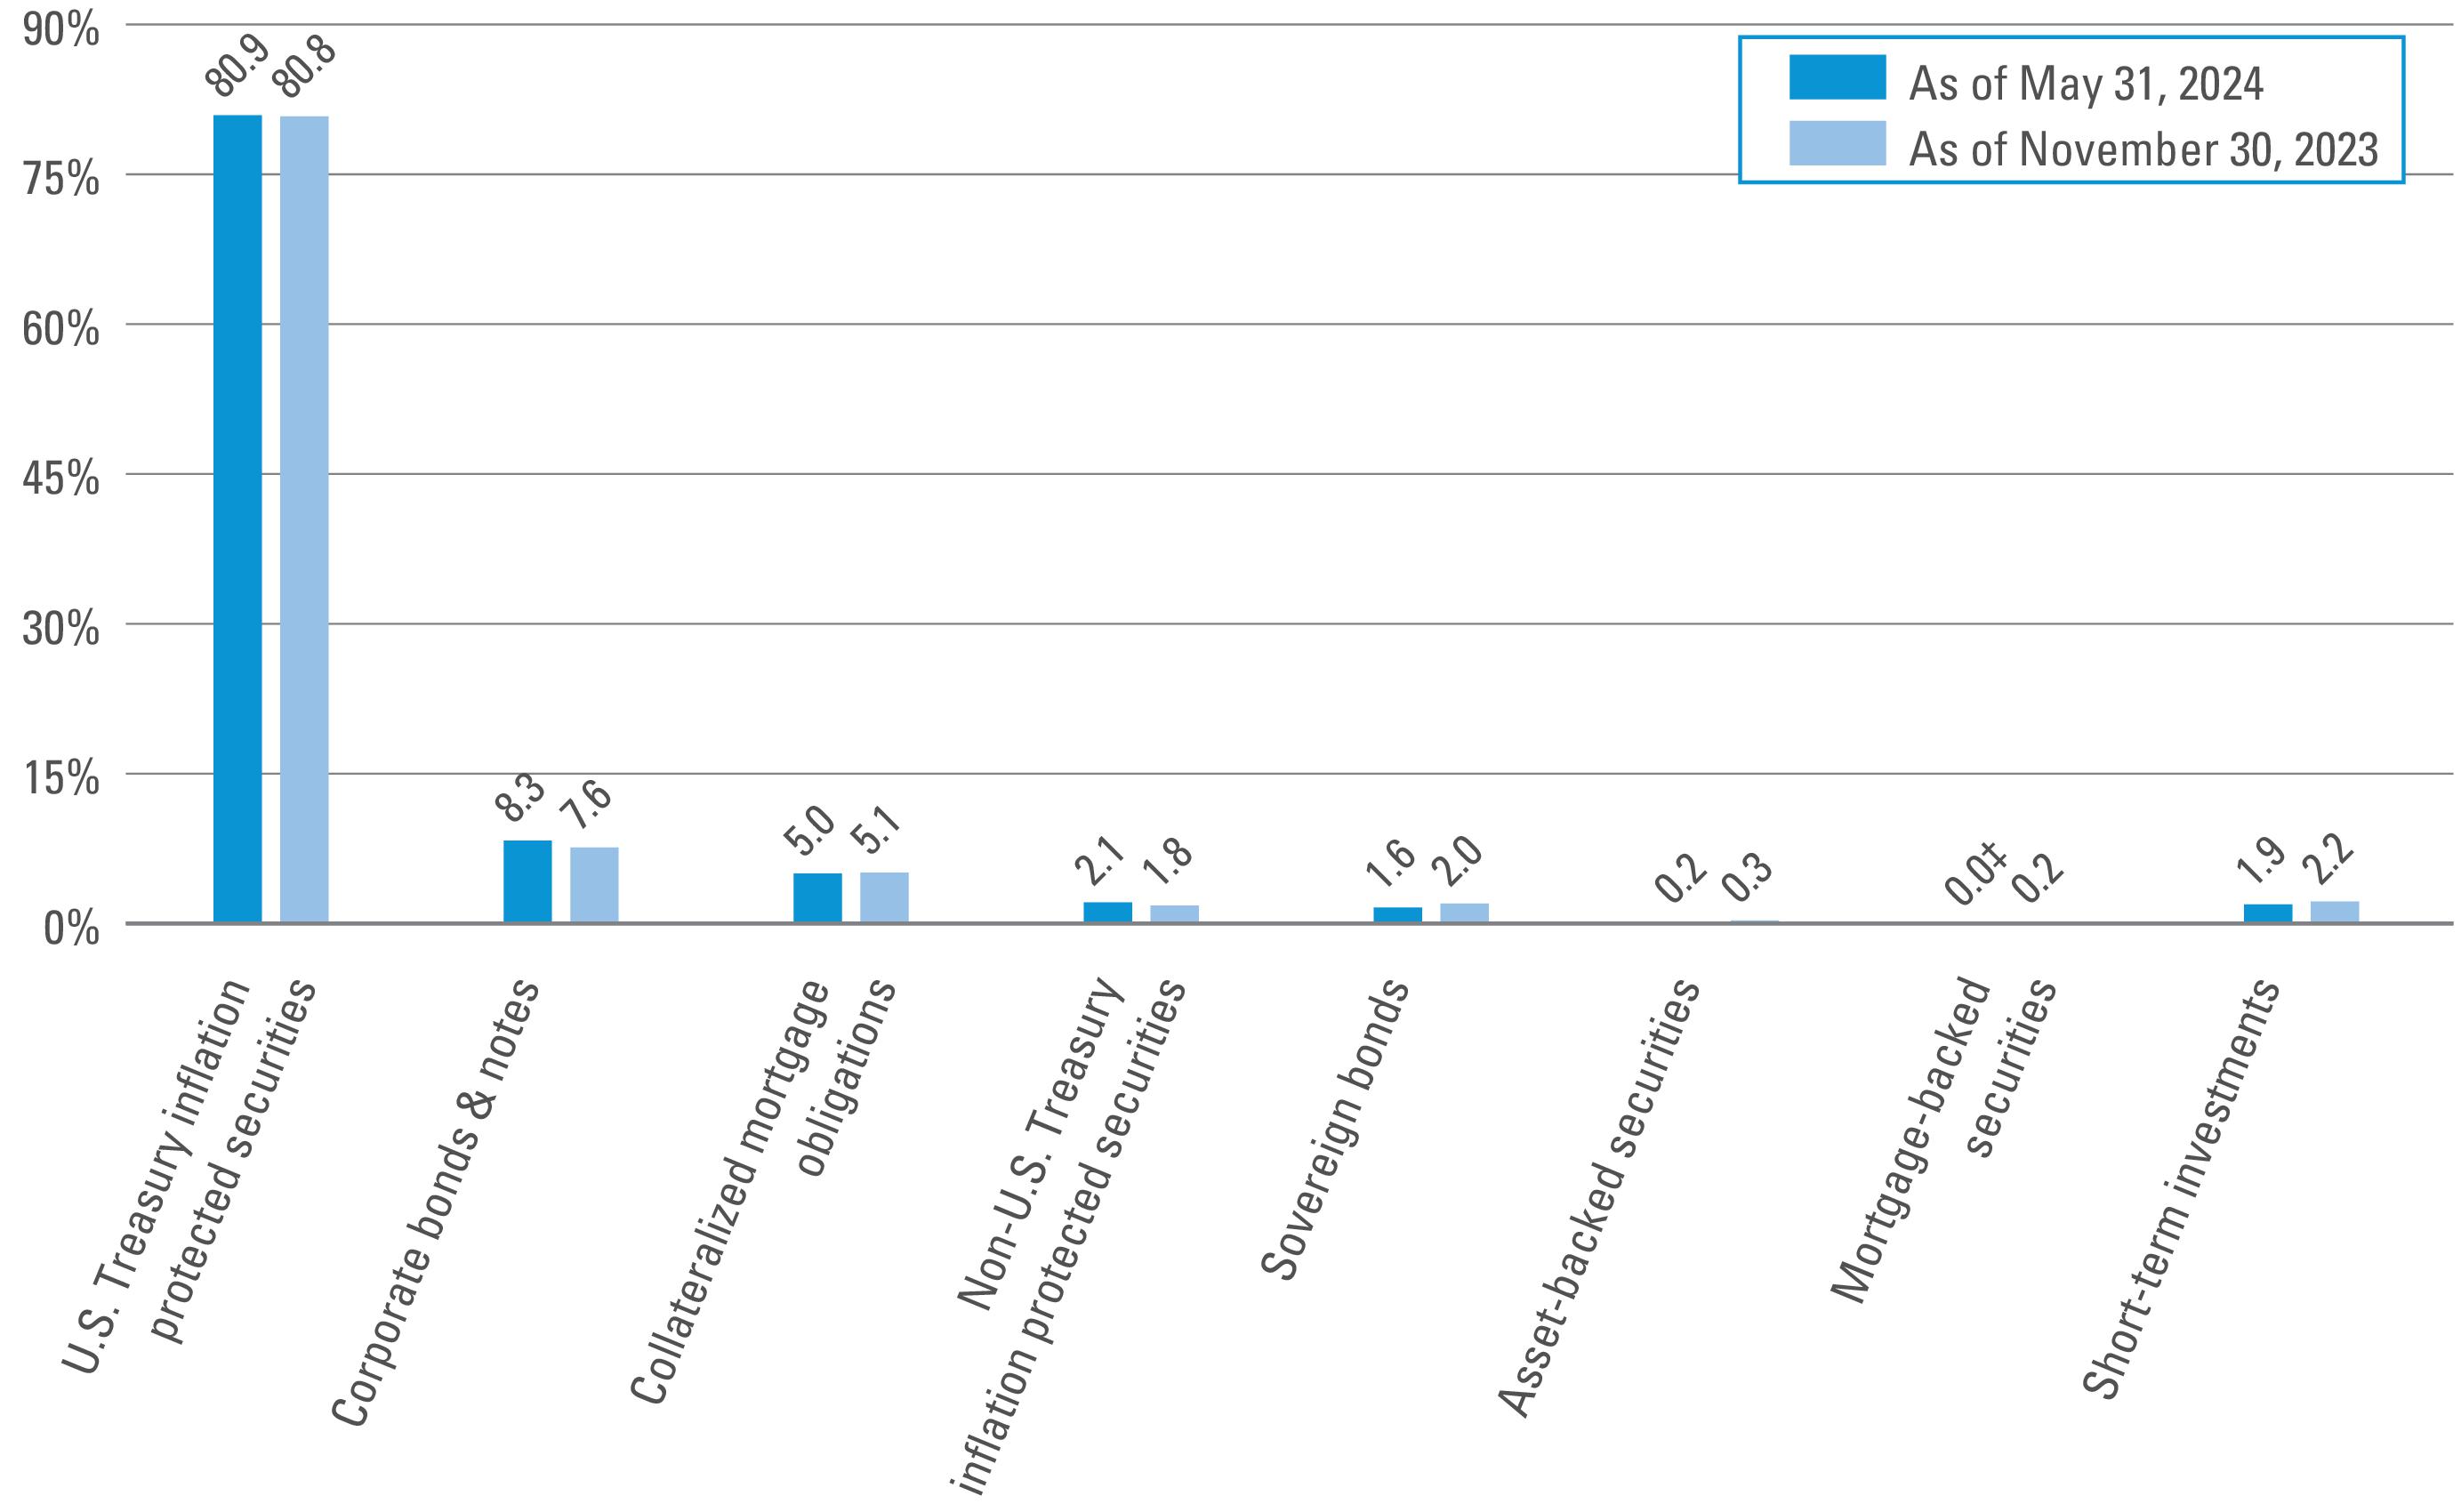
Fund at a glance† (unaudited)
Investment breakdown (%) as a percent of total investments
†
The bar graph above represents the composition of the Fund’s investments as of May 31, 2024 and November 30, 2023 and does not include derivatives, such as futures contracts, forward foreign currency contracts and swap contracts. The Fund is actively managed. As a result, the composition of the Fund’s investments is subject to change at any time.
‡
Represents less than 0.1%.
Western Asset Inflation-Linked Income Fund 2024 Semi-Annual Report
Consolidated schedule of investments (unaudited)May 31, 2024 Western Asset Inflation-Linked Income Fund
(Percentages shown based on Fund net assets)
| | | | | |
U.S. Treasury Inflation Protected Securities — 131.7% |
U.S. Treasury Bonds, Inflation Indexed | | | | |
U.S. Treasury Bonds, Inflation Indexed | | | | |
U.S. Treasury Bonds, Inflation Indexed | | | | |
U.S. Treasury Bonds, Inflation Indexed | | | | |
U.S. Treasury Bonds, Inflation Indexed | | | | |
U.S. Treasury Bonds, Inflation Indexed | | | | |
U.S. Treasury Bonds, Inflation Indexed | | | | |
U.S. Treasury Bonds, Inflation Indexed | | | | |
U.S. Treasury Bonds, Inflation Indexed | | | | |
U.S. Treasury Bonds, Inflation Indexed | | | | |
U.S. Treasury Bonds, Inflation Indexed | | | | |
U.S. Treasury Bonds, Inflation Indexed | | | | |
U.S. Treasury Notes, Inflation Indexed | | | | |
U.S. Treasury Notes, Inflation Indexed | | | | |
U.S. Treasury Notes, Inflation Indexed | | | | |
U.S. Treasury Notes, Inflation Indexed | | | | |
U.S. Treasury Notes, Inflation Indexed | | | | |
U.S. Treasury Notes, Inflation Indexed | | | | |
U.S. Treasury Notes, Inflation Indexed | | | | |
U.S. Treasury Notes, Inflation Indexed | | | | |
U.S. Treasury Notes, Inflation Indexed | | | | |
U.S. Treasury Notes, Inflation Indexed | | | | |
U.S. Treasury Notes, Inflation Indexed | | | | |
U.S. Treasury Notes, Inflation Indexed | | | | |
U.S. Treasury Notes, Inflation Indexed | | | | |
|
Total U.S. Treasury Inflation Protected Securities (Cost — $304,335,975) | |
Corporate Bonds & Notes — 13.4% |
Communication Services — 0.0%†† |
Wireless Telecommunication Services — 0.0%†† |
T-Mobile USA Inc., Senior Notes | | | | |
|
Consumer Discretionary — 0.7% |
Hotels, Restaurants & Leisure — 0.7% |
Sands China Ltd., Senior Notes | | | | |
Sands China Ltd., Senior Notes | | | | |
Sands China Ltd., Senior Notes | | | | |
Sands China Ltd., Senior Notes | | | | |
|
Total Consumer Discretionary | |
See Notes to Consolidated Financial Statements.
Western Asset Inflation-Linked Income Fund 2024 Semi-Annual Report
Western Asset Inflation-Linked Income Fund
(Percentages shown based on Fund net assets)
| | | | | |
|
|
Energy Equipment & Services — 0.0%†† |
Halliburton Co., Senior Notes | | | | |
Oil, Gas & Consumable Fuels — 6.3% |
Apache Corp., Senior Notes | | | | |
BP Capital Markets America Inc., Senior Notes | | | | |
Chevron USA Inc., Senior Notes | | | | |
Columbia Pipelines Holding Co. LLC, Senior Notes | | | | |
Energy Transfer LP, Senior Notes | | | | |
Enterprise Products Operating LLC, Senior Notes | | | | |
EOG Resources Inc., Senior Notes | | | | |
EOG Resources Inc., Senior Notes | | | | |
| | | | |
Exxon Mobil Corp., Senior Notes | | | | |
Exxon Mobil Corp., Senior Notes | | | | |
Occidental Petroleum Corp., Senior Notes | | | | |
Occidental Petroleum Corp., Senior Notes | | | | |
Occidental Petroleum Corp., Senior Notes | | | | |
| | | | |
Petrobras Global Finance BV, Senior Notes | | | | |
QazaqGaz NC JSC, Senior Notes | | | | |
Targa Resources Corp., Senior Notes | | | | |
Williams Cos. Inc., Senior Notes | | | | |
| | | | |
Total Oil, Gas & Consumable Fuels | |
|
| |
|
|
JPMorgan Chase & Co., Senior Notes (3.109% to 4/22/50 then SOFR + 2.440%) | | | | |
Wells Fargo & Co., Senior Notes (5.013% to 4/4/50 then 3 mo. Term SOFR + 4.502%) | | | | |
| |
Financial Services — 0.4% |
ILFC E-Capital Trust II, Ltd. GTD (3 mo. Term SOFR + 2.062%) | | | | |
|
| |
See Notes to Consolidated Financial Statements.
Western Asset Inflation-Linked Income Fund 2024 Semi-Annual Report
Consolidated schedule of investments (unaudited) (cont’d)May 31, 2024 Western Asset Inflation-Linked Income Fund
(Percentages shown based on Fund net assets)
| | | | | |
|
|
|
Bausch Health Americas Inc., Senior Notes | | | | |
Bausch Health Americas Inc., Senior Notes | | | | |
|
| |
|
Aerospace & Defense — 1.0% |
General Dynamics Corp., Senior Notes | | | | |
General Dynamics Corp., Senior Notes | | | | |
|
| |
Information Technology — 0.1% |
Semiconductors & Semiconductor Equipment — 0.1% |
Broadcom Inc., Senior Notes | | | | |
|
|
|
Anglo American Capital PLC, Senior Notes | | | | |
Antofagasta PLC, Senior Notes | | | | |
Barrick North America Finance LLC, Senior Notes | | | | |
BHP Billiton Finance USA Ltd., Senior Notes | | | | |
Glencore Finance Canada Ltd., Senior Notes | | | | |
Glencore Funding LLC, Senior Notes | | | | |
Glencore Funding LLC, Senior Notes | | | | |
Southern Copper Corp., Senior Notes | | | | |
Yamana Gold Inc., Senior Notes | | | | |
|
| |
Total Corporate Bonds & Notes (Cost — $32,781,188) | |
Collateralized Mortgage Obligations(g) — 8.1% |
Alternative Loan Trust, 2007-12T1 A3 | | | | |
Angel Oak Mortgage Trust, 2023-1 A1 | | | | |
| | | | |
Benchmark Mortgage Trust, 2021-B29 XA, IO | | | | |
BHMS, 2018-ATLS D (1 mo. Term SOFR + 2.547%) | | | | |
BX Commercial Mortgage Trust, 2022-LP2 G (1 mo. Term SOFR + 4.106%) | | | | |
BX Commercial Mortgage Trust, 2023-VLT2 A (1 mo. Term SOFR + 2.281%) | | | | |
BX Trust, 2021-ARIA D (1 mo. Term SOFR + 2.010%) | | | | |
See Notes to Consolidated Financial Statements.
Western Asset Inflation-Linked Income Fund 2024 Semi-Annual Report
Western Asset Inflation-Linked Income Fund
(Percentages shown based on Fund net assets)
| | | | | |
Collateralized Mortgage Obligations(g) — continued |
| | | | |
BXMT Ltd., 2020-FL2 A (1 mo. Term SOFR + 1.014%) | | | | |
CD Mortgage Trust, 2017-CD5 A4 | | | | |
Chase Mortgage Finance Trust, 2007-A1 2A3 | | | | |
Citigroup Commercial Mortgage Trust, 2016-C3 A3 | | | | |
Citigroup Commercial Mortgage Trust, 2023- SMRT A | | | | |
| | | | |
| | | | |
Federal Home Loan Mortgage Corp. (FHLMC) Multifamily Structured Pass-Through Certificates, K115 X1, IO | | | | |
Federal Home Loan Mortgage Corp. (FHLMC) REMIC, 4057 UI, IO | | | | |
Federal Home Loan Mortgage Corp. (FHLMC) REMIC, 4085 IO, IO | | | | |
Federal Home Loan Mortgage Corp. (FHLMC) REMIC, Structured Agency Credit Risk Debt Notes, 2020-DNA1 B1 (30 Day Average SOFR + 2.414%) | | | | |
Federal Home Loan Mortgage Corp. (FHLMC) REMIC, Structured Agency Credit Risk Debt Notes, 2022-DNA3 M1B (30 Day Average SOFR + 2.900%) | | | | |
Federal Home Loan Mortgage Corp. (FHLMC) REMIC, Structured Agency Credit Risk Debt Notes, 2022-DNA4 M1B (30 Day Average SOFR + 3.350%) | | | | |
Federal Home Loan Mortgage Corp. (FHLMC) REMIC, Structured Agency Credit Risk Debt Notes, 2024-DNA1 M2 (30 Day Average SOFR + 1.950%) | | | | |
Federal Home Loan Mortgage Corp. (FHLMC) REMIC, Structured Agency Credit Risk Debt Notes, 2024-DNA2 A1 (30 Day Average SOFR + 1.250%) | | | | |
Federal Home Loan Mortgage Corp. (FHLMC) Seasoned Credit Risk Transfer Trust, 2019-1 M | | | | |
See Notes to Consolidated Financial Statements.
Western Asset Inflation-Linked Income Fund 2024 Semi-Annual Report
Consolidated schedule of investments (unaudited) (cont’d)May 31, 2024 Western Asset Inflation-Linked Income Fund
(Percentages shown based on Fund net assets)
| | | | | |
Collateralized Mortgage Obligations(g) — continued |
Federal National Mortgage Association (FNMA) — CAS, 2017-C07 1B1 (30 Day Average SOFR + 4.114%) | | | | |
Federal National Mortgage Association (FNMA) — CAS, 2019-R03 1B1 (30 Day Average SOFR + 4.214%) | | | | |
Federal National Mortgage Association (FNMA) — CAS, 2019-R05 1B1 (30 Day Average SOFR + 4.214%) | | | | |
Federal National Mortgage Association (FNMA) — CAS, 2020-R01 1B1 (30 Day Average SOFR + 3.364%) | | | | |
Federal National Mortgage Association (FNMA) — CAS, 2021-R01 1B1 (30 Day Average SOFR + 3.100%) | | | | |
Federal National Mortgage Association (FNMA) — CAS, 2022-R07 1M1 (30 Day Average SOFR + 2.950%) | | | | |
Federal National Mortgage Association (FNMA) — CAS, 2024-R02 1M2 (30 Day Average SOFR + 1.800%) | | | | |
Government National Mortgage Association (GNMA), 2011-142 IO, IO | | | | |
Government National Mortgage Association (GNMA), 2012-44 IO, IO | | | | |
Government National Mortgage Association (GNMA), 2012-112 IO, IO | | | | |
Government National Mortgage Association (GNMA), 2012-152 IO, IO | | | | |
Government National Mortgage Association (GNMA), 2014-47 IA, IO | | | | |
Government National Mortgage Association (GNMA), 2014-50 IO, IO | | | | |
Government National Mortgage Association (GNMA), 2014-169 IO, IO | | | | |
Government National Mortgage Association (GNMA), 2015-101 IO, IO | | | | |
Government National Mortgage Association (GNMA), 2015-183 IO, IO | | | | |
GSR Mortgage Loan Trust, 2004-11 1A1 | | | | |
See Notes to Consolidated Financial Statements.
Western Asset Inflation-Linked Income Fund 2024 Semi-Annual Report
Western Asset Inflation-Linked Income Fund
(Percentages shown based on Fund net assets)
| | | | | |
Collateralized Mortgage Obligations(g) — continued |
Hawaii Hotel Trust, 2019-MAUI F (1 mo. Term SOFR + 2.797%) | | | | |
Home RE Ltd., 2023-1 M2 (30 Day Average SOFR + 6.000%) | | | | |
JPMorgan Chase Commercial Mortgage Securities Trust, 2020-NNN GFX | | | | |
MHC Commercial Mortgage Trust, 2021-MHC A (1 mo. Term SOFR + 0.915%) | | | | |
MRCD Mortgage Trust, 2019-PARK A | | | | |
New Residential Mortgage Loan Trust, 2014-1A A | | | | |
PRKCM Trust, 2021-AFC1 A1 | | | | |
PRKCM Trust, 2023-AFC1 A1 | | | | |
| | | | |
SREIT Trust, 2021-PALM B (1 mo. Term SOFR + 0.924%) | | | | |
Towd Point Mortgage Trust, 2015-2 1B3 | | | | |
Towd Point Mortgage Trust, 2020-2 A1A | | | | |
Towd Point Mortgage Trust, 2020-2 M1B | | | | |
Verus Securitization Trust, 2023-8 B1 | | | | |
|
Total Collateralized Mortgage Obligations (Cost — $20,894,074) | |
Non-U.S. Treasury Inflation Protected Securities — 3.4% |
|
Brazil Notas do Tesouro Nacional Serie B, Notes | | | | |
Brazil Notas do Tesouro Nacional Serie B, Notes | | | | |
| |
|
United Kingdom Inflation-Linked Gilt, Bonds | | | | |
|
Uruguay Government International Bond, Senior Notes | | | | |
|
Total Non-U.S. Treasury Inflation Protected Securities (Cost — $8,822,005) | |
|
|
Brazil Notas do Tesouro Nacional Serie F, Notes | | | | |
See Notes to Consolidated Financial Statements.
Western Asset Inflation-Linked Income Fund 2024 Semi-Annual Report
Consolidated schedule of investments (unaudited) (cont’d)May 31, 2024 Western Asset Inflation-Linked Income Fund
(Percentages shown based on Fund net assets)
| | | | | |
|
|
Bonos de la Tesoreria de la Republica en pesos, Bonds | | | | |
|
| | | | |
Mexico Government International Bond, Senior Notes | | | | |
| |
|
Nigeria Government International Bond, Senior Notes | | | | |
|
Inter-American Development Bank, Senior Notes | | | | |
|
Total Sovereign Bonds (Cost — $7,086,050) | |
Asset-Backed Securities — 0.4% |
Countrywide Home Equity Loan Trust, 2005-C 2A (1 mo. Term SOFR + 0.294%) | | | | |
Countrywide Home Equity Loan Trust, 2006-I 2A (1 mo. Term SOFR + 0.254%) | | | | |
Morgan Stanley ABS Capital Inc. Trust, 2004- HE7 M1 (1 mo. Term SOFR + 1.014%) | | | | |
|
Total Asset-Backed Securities (Cost — $875,724) | |
Mortgage-Backed Securities — 0.1% |
|
Federal Home Loan Mortgage Corp. (FHLMC) | | | | |
|
Federal National Mortgage Association (FNMA) | | | | |
|
Total Mortgage-Backed Securities (Cost — $163,025) | |
Total Investments before Short-Term Investments (Cost — $374,958,041) | |
| | | | | |
Short-Term Investments — 3.1% |
Western Asset Premier Institutional Government Reserves, Premium Shares (Cost — $6,715,804) | | | | |
Total Investments — 162.9% (Cost — $381,673,845) | |
Liabilities in Excess of Other Assets — (62.9)% | |
Total Net Assets — 100.0% | |
See Notes to Consolidated Financial Statements.
Western Asset Inflation-Linked Income Fund 2024 Semi-Annual Report
Western Asset Inflation-Linked Income Fund
| Face amount denominated in U.S. dollars, unless otherwise noted. |
| Represents less than 0.1%. |
| All or a portion of this security is held by the counterparty as collateral for open reverse repurchase agreements. |
| All or a portion of this security is held at the broker as collateral for open centrally cleared swap contracts. |
| All or a portion of this security is held at the broker as collateral for open futures contracts. |
| Security is exempt from registration under Rule 144A of the Securities Act of 1933. This security may be resold in transactions that are exempt from registration, normally to qualified institutional buyers. This security has been deemed liquid pursuant to guidelines approved by the Board of Trustees. |
| Security is exempt from registration under Regulation S of the Securities Act of 1933. Regulation S applies to securities offerings that are made outside of the United States and do not involve direct selling efforts in the United States. This security has been deemed liquid pursuant to guidelines approved by the Board of Trustees. |
| Variable rate security. Interest rate disclosed is as of the most recent information available. Certain variable rate securities are not based on a published reference rate and spread but are determined by the issuer or agent and are based on current market conditions. These securities do not indicate a reference rate and spread in their description above. |
| Collateralized mortgage obligations are secured by an underlying pool of mortgages or mortgage pass-through certificates that are structured to direct payments on underlying collateral to different series or classes of the obligations. The interest rate may change positively or inversely in relation to one or more interest rates, financial indices or other financial indicators and may be subject to an upper and/or lower limit. |
| Rate shown is one-day yield as of the end of the reporting period. |
| In this instance, as defined in the Investment Company Act of 1940, an “Affiliated Company” represents Fund ownership of at least 5% of the outstanding voting securities of an issuer, or a company which is under common ownership or control with the Fund. At May 31, 2024, the total market value of investments in Affiliated Companies was $6,715,804 and the cost was $6,715,804 (Note 8). |
Abbreviation(s) used in this schedule: |
| | |
| | Connecticut Avenue Securities |
| | |
| | |
| | |
| | |
| | |
| | |
| | |
| | |
| | Real Estate Mortgage Investment Conduit |
| | Secured Overnight Financing Rate |
| | |
See Notes to Consolidated Financial Statements.
Western Asset Inflation-Linked Income Fund 2024 Semi-Annual Report
Consolidated schedule of investments (unaudited) (cont’d)May 31, 2024 Western Asset Inflation-Linked Income Fund
At May 31, 2024, the Fund had the following open reverse repurchase agreements:
| | | | Face Amount
of Reverse
Repurchase
Agreements | Asset Class
of Collateral* | |
| | | | | U.S. Treasury Inflation Protected Securities
Cash | |
| | | | | U.S. Treasury Inflation Protected Securities
Cash | |
| | | | | U.S. Treasury Inflation Protected Securities
Cash | |
| | | | | | |
| Refer to the Consolidated Schedule of Investments for positions held at the counterparty as collateral for reverse repurchase agreements. |
| Including accrued interest. |
At May 31, 2024, the Fund had the following open futures contracts:
| | | | | Unrealized
Appreciation
(Depreciation) |
| | | | | |
| | | | | |
| | | | | |
| | | | | |
| | | | | |
| | | | | |
U.S. Treasury 10-Year Notes | | | | | |
U.S. Treasury Long-Term Bonds | | | | | |
U.S. Treasury Ultra Long-Term Bonds | | | | | |
| | | | | |
Net unrealized appreciation on open futures contracts | |
At May 31, 2024, the Fund had the following open forward foreign currency contracts:
| | | | Unrealized
Appreciation
(Depreciation) |
| | | | | | |
See Notes to Consolidated Financial Statements.
Western Asset Inflation-Linked Income Fund 2024 Semi-Annual Report
Western Asset Inflation-Linked Income Fund
| | | | Unrealized Appreciation (Depreciation) |
| | | | | | |
| | | | | | |
| | | | | | |
| | | | | | |
| | | | | | |
| | | | | | |
| | | | | | |
| | | | | | |
| | | | | | |
| | | | | | |
| | | | | | |
| | | | Morgan Stanley & Co. Inc. | | |
| | | | Morgan Stanley & Co. Inc. | | |
| | | | Morgan Stanley & Co. Inc. | | |
Net unrealized depreciation on open forward foreign currency contracts | |
Abbreviation(s) used in this table: |
| | |
| | |
| | |
| | |
| | |
| | |
| | |
| | |
| | |
| | |
| | |
At May 31, 2024, the Fund had the following open swap contracts:
CENTRALLY CLEARED CREDIT DEFAULT SWAPS ON CREDIT INDICES — SELL PROTECTION1 |
| | | Periodic
Payments
Received by
| | Upfront
Premiums
Paid
(Received) | |
Markit CDX.NA.HY.42 Index | | | | | | |
Markit CDX.NA.IG.42 Index | | | | | | |
| | | | | | |
See Notes to Consolidated Financial Statements.
Western Asset Inflation-Linked Income Fund 2024 Semi-Annual Report
Consolidated schedule of investments (unaudited) (cont’d)May 31, 2024 Western Asset Inflation-Linked Income Fund
|
| | | | Periodic
Payments
Received by
| | Upfront
Premiums
Paid
(Received) | |
| | | Daily SOFR
Compound +
1.100% quarterly | | | | |
| If the Fund is a seller of protection and a credit event occurs, as defined under the terms of that particular swap agreement, the Fund will either (i) pay to the buyer of protection an amount equal to the notional amount of the swap and take delivery of the referenced obligation or underlying securities comprising the referenced index or (ii) pay a net settlement amount in the form of cash or securities equal to the notional amount of the swap less the recovery value of the referenced obligation or underlying securities comprising the referenced index. |
| The maximum potential amount the Fund could be required to pay as a seller of credit protection or receive as a buyer of credit protection if a credit event occurs as defined under the terms of that particular swap agreement. |
| The quoted market prices and resulting values for credit default swap agreements on asset-backed securities and credit indices serve as an indicator of the current status of the payment/performance risk and represent the likelihood of an expected loss (or profit) for the credit derivative had the notional amount of the swap agreement been closed/sold as of the period end. Decreasing market values (sell protection) or increasing market values (buy protection), when compared to the notional amount of the swap, represent a deterioration of the referenced entity’s credit soundness and a greater likelihood or risk of default or other credit event occurring as defined under the terms of the agreement. |
| Percentage shown is an annual percentage rate. |
| Periodic payments made/received by the Fund are based on the total return of the referenced entity. |
| Custom emerging markets debt basket is comprised of 31 bonds in the Sovereign Frontier sector. |
Reference rate(s) and their value(s) as of period end used in this table:
Abbreviation(s) used in this table: |
| | Western Asset Management Emerging Markets Frontier Custom Basket |
| | Secured Overnight Financing Rate |
See Notes to Consolidated Financial Statements.
Western Asset Inflation-Linked Income Fund 2024 Semi-Annual Report
Consolidated statement of assets and liabilities (unaudited)May 31, 2024
| |
Investments in unaffiliated securities, at value (Cost — $374,958,041) | |
Investments in affiliated securities, at value (Cost — $6,715,804) | |
Foreign currency, at value (Cost — $602,343) | |
Receivable for securities sold | |
Deposits with brokers for open reverse repurchase agreements | |
| |
Deposits with brokers for centrally cleared swap contracts | |
Deposits with brokers for open futures contracts | |
Unrealized appreciation on forward foreign currency contracts | |
Foreign currency collateral for open futures contracts, at value (Cost — $129,156) | |
Deposits with brokers for OTC derivatives | |
Dividends receivable from affiliated investments | |
Receivable from brokers — net variation margin on centrally cleared swap contracts | |
| |
| |
| |
Payable for open reverse repurchase agreements (Note 3) | |
| |
Unrealized depreciation on forward foreign currency contracts | |
Payable to brokers — net variation margin on open futures contracts | |
Investment management fee payable | |
OTC swaps, at value (premiums paid — $0) | |
Administration fee payable | |
Payable for open OTC swap contracts | |
| |
| |
| |
| |
| |
Common shares, no par value, unlimited number of shares authorized, 23,322,256 shares issued and outstanding | |
Total distributable earnings (loss) | |
| |
| |
| |
See Notes to Consolidated Financial Statements.
Western Asset Inflation-Linked Income Fund 2024 Semi-Annual Report
Consolidated statement of operations (unaudited)For the Six Months Ended May 31, 2024
| |
| |
Dividends from affiliated investments | |
| |
| |
Interest expense (Note 3) | |
Investment management fee (Note 2) | |
Administration fees (Note 2) | |
| |
| |
| |
| |
| |
| |
Stock exchange listing fees | |
| |
| |
| |
| |
| |
Less: Fee waivers and/or expense reimbursements (Note 2) | |
| |
| |
Realized and Unrealized Gain (Loss) on Investments, Futures Contracts, Swap Contracts, Forward Foreign Currency Contracts and Foreign Currency Transactions (Notes 1, 3 and 4): |
Net Realized Gain (Loss) From: | |
Investment transactions in unaffiliated securities | |
| |
| |
Forward foreign currency contracts | |
Foreign currency transactions | |
| |
Change in Net Unrealized Appreciation (Depreciation) From: | |
Investments in unaffiliated securities | |
| |
| |
Forward foreign currency contracts | |
| |
Change in Net Unrealized Appreciation (Depreciation) | |
Net Gain on Investments, Futures Contracts, Swap Contracts, Forward Foreign Currency Contracts and Foreign Currency Transactions | |
Increase in Net Assets From Operations | |
See Notes to Consolidated Financial Statements.
Western Asset Inflation-Linked Income Fund 2024 Semi-Annual Report
Consolidated statements of changes in net assets
For the Six Months Ended May 31, 2024 (unaudited)
and the Year Ended November 30, 2023 | | |
| | |
| | |
| | |
Change in net unrealized appreciation (depreciation) | | |
Increase (Decrease) in Net Assets From Operations | | |
Distributions to Shareholders From (Note 1): | | |
Total distributable earnings | | |
Decrease in Net Assets From Distributions to Shareholders | | |
Increase (Decrease) in Net Assets | | |
| | |
| | |
| | |
See Notes to Consolidated Financial Statements.
Western Asset Inflation-Linked Income Fund 2024 Semi-Annual Report
Consolidated statement of cash flows (unaudited)For the Six Months Ended May 31, 2024
Increase (Decrease) in Cash: | |
Cash Flows from Operating Activities: | |
Net increase in net assets resulting from operations | |
Adjustments to reconcile net increase in net assets resulting from operations to net cash provided (used) by operating activities: | |
Purchases of portfolio securities | |
Sales of portfolio securities | |
Net purchases, sales and maturities of short-term investments | |
| |
Net amortization of premium (accretion of discount) | |
Securities litigation proceeds | |
Increase in receivable for securities sold | |
Increase in interest receivable | |
Increase in receivable from brokers — net variation margin on centrally cleared swap contracts | |
Increase in prepaid expenses | |
Decrease in dividends receivable from affiliated investments | |
Increase in investment management fee payable | |
Decrease in Trustees’ fees payable | |
Increase in administration fee payable | |
Increase in interest expense payable | |
Decrease in accrued expenses | |
Increase in payable to brokers — net variation margin on futures contracts | |
Increase in payable for open OTC swap contracts | |
Net realized loss on investments | |
Change in net unrealized appreciation (depreciation) of investments, OTC swap contracts and forward foreign currency contracts | |
Net Cash Provided in Operating Activities* | |
Cash Flows from Financing Activities: | |
Distributions paid on common stock | |
Increase in payable for open reverse repurchase agreements | |
Net Cash Used by Financing Activities | |
Net Increase in Cash and Restricted Cash | |
Cash and restricted cash at beginning of period | |
Cash and restricted cash at end of period | |
| Included in operating expenses is $2,120,151 paid for interest on borrowings. |
See Notes to Consolidated Financial Statements.
Western Asset Inflation-Linked Income Fund 2024 Semi-Annual Report
The following table provides a reconciliation of cash (including foreign currency) and restricted cash reported within the Consolidated Statement of Assets and Liabilities that sums to the total of such amounts shown on the
Consolidated Statement of Cash Flows.
| |
| |
| |
Total cash and restricted cash shown in the Consolidated Statement of Cash Flows | |
Restricted cash consists of cash that has been segregated to cover the Fund’s collateral or margin obligations under derivative contracts and for reverse repurchase agreements. It is separately reported on the Consolidated Statement of Assets and Liabilities as Deposits with brokers.
See Notes to Consolidated Financial Statements.
Western Asset Inflation-Linked Income Fund 2024 Semi-Annual Report
Consolidated financial highlights
For a share of common stock outstanding throughout each year ended November 30,
unless otherwise noted: |
| | | | | | |
Net asset value, beginning of period | | | | | | |
Income (loss) from operations: |
| | | | | | |
Net realized and unrealized gain (loss) | | | | | | |
Total income (loss) from operations | | | | | | |
| | | | | | |
| | | | | | |
| | | | | | |
| | | | | | |
Anti-dilutive impact of tender offer | | | | | | |
Net asset value, end of period | | | | | | |
Market price, end of period | | | | | | |
Total return, based on NAV5,6 | | | | | | |
Total return, based on Market Price7 | | | | | | |
Net assets, end of period (millions) | | | | | | |
Ratios to average net assets: |
| | | | | | |
| | | | | | |
| | | | | | |
| | | | | | |
| Per share amounts have been calculated using the average shares method. |
| For the six months ended May 31, 2024 (unaudited). |
| The actual source of the Fund’s current fiscal year distributions may be from net investment income, realized capital gains, return of capital or a combination thereof. Shareholders will be informed of the tax characteristics of the distributions after the close of the fiscal year. |
| The tender offer was completed at a price of $13.99 for 5,830,564 shares and $81,569,590 for the year ended November 30, 2021. |
| Performance figures may reflect compensating balance arrangements, fee waivers and/or expense reimbursements. In the absence of compensating balance arrangements, fee waivers and/or expense reimbursements, the total return would have been lower. Past performance is no guarantee of future results. Total returns for periods of less than one year are not annualized. |
| The total return calculation assumes that distributions are reinvested at NAV. Past performance is no guarantee of future results. Total returns for periods of less than one year are not annualized. |
| The total return calculation assumes that distributions are reinvested in accordance with the Fund’s dividend reinvestment plan. Past performance is no guarantee of future results. Total returns for periods of less than one year are not annualized. |
| |
| The investment adviser has agreed to waive the Fund’s management fee to an extent sufficient to offset the net management fee payable in connection with any investment in an affiliated money market fund. |
| Reflects fee waivers and/or expense reimbursements. |
See Notes to Consolidated Financial Statements.
Western Asset Inflation-Linked Income Fund 2024 Semi-Annual Report
Notes to consolidated financial statements (unaudited)
1. Organization and significant accounting policies
Western Asset Inflation-Linked Income Fund (the “Fund”) is registered under the Investment Company Act of 1940, as amended (“1940 Act”), as a diversified, closed-end management investment company. The Fund commenced operations on September 26, 2003.
The Fund’s primary investment objective is to provide current income for its shareholders. Capital appreciation, when consistent with current income, is a secondary investment objective. Under normal market conditions and at the time of purchase, the Fund will invest at least 80% of its total managed assets in inflation-linked securities and at least 60% of its total managed assets in U.S. Treasury Inflation Protected Securities (“TIPS”). The Fund may also invest up to 40% of its total managed assets in non-U.S. dollar investments. The Fund can invest no more than 10% of its total managed assets in securities rated below investment grade at the time of purchase (or, if unrated, assets of comparable quality as determined by management). If a security is rated by multiple nationally recognized statistical rating organizations (“NRSROs”) and receives different ratings, the Fund will treat the security as being rated in the highest rating category received from an NRSRO.
The Fund may gain exposure to the commodities markets by investing a portion of its assets in a wholly-owned subsidiary, Western Asset Inflation-Linked Income Fund CFC (the “Subsidiary”), organized under the laws of the Cayman Islands. Among other investments, the Subsidiary may invest in commodity-linked instruments. The Fund may invest up to 25% of its total assets in the Subsidiary; although 10% of total managed assets may be utilized for commodity-related strategies. These financial statements are consolidated financial statements of the Fund and the Subsidiary. All interfund transactions have been eliminated in consolidation.
The Fund follows the accounting and reporting guidance in Financial Accounting Standards Board (“FASB”) Accounting Standards Codification Topic 946, Financial Services – Investment Companies (“ASC 946”). The following are significant accounting policies consistently followed by the Fund and are in conformity with U.S. generally accepted accounting principles (“GAAP”), including, but not limited to, ASC 946. Estimates and assumptions are required to be made regarding assets, liabilities and changes in net assets resulting from operations when financial statements are prepared. Changes in the economic environment, financial markets and any other parameters used in determining these estimates could cause actual results to differ. Subsequent events have been evaluated through the date the financial statements were issued.
(a) Investment valuation. The valuations for fixed income securities (which may include, but are not limited to, corporate, government, municipal, mortgage-backed, collateralized mortgage obligations and asset-backed securities) and certain derivative instruments are typically the prices supplied by independent third party pricing services, which may use market prices or broker/dealer quotations or a variety of valuation techniques and methodologies. The independent third party pricing services typically use inputs that are observable such as issuer details, interest rates, yield curves, prepayment speeds, credit risks/spreads, default rates and quoted prices for similar securities. Investments in open-end funds are valued at the closing net asset value per share of each fund on the day of valuation. Futures contracts are valued daily at the settlement price established by the board of trade or exchange on which they are traded. Equity securities for which market quotations are available are valued at the last reported sales price or official closing price
Western Asset Inflation-Linked Income Fund 2024 Semi-Annual Report
Notes to consolidated financial statements (unaudited) (cont’d)
on the primary market or exchange on which they trade. When the Fund holds securities or other assets that are denominated in a foreign currency, the Fund will normally use the currency exchange rates as of 4:00 p.m. (Eastern Time). If independent third party pricing services are unable to supply prices for a portfolio investment, or if the prices supplied are deemed by the adviser to be unreliable, the market price may be determined by the adviser using quotations from one or more broker/dealers or at the transaction price if the security has recently been purchased and no value has yet been obtained from a pricing service or pricing broker. When reliable prices are not readily available, such as when the value of a security has been significantly affected by events after the close of the exchange or market on which the security is principally traded, but before the Fund calculates its net asset value, the Fund values these securities as determined in accordance with procedures approved by the Fund’s Board of Trustees.
Pursuant to policies adopted by the Board of Trustees, the Fund’s adviser has been designated as the valuation designee and is responsible for the oversight of the daily valuation process. The Fund’s adviser is assisted by the Global Fund Valuation Committee (the “Valuation Committee”). The Valuation Committee is responsible for making fair value determinations, evaluating the effectiveness of the Fund’s pricing policies, and reporting to the Fund’s adviser and the Board of Trustees. When determining the reliability of third party pricing information for investments owned by the Fund, the Valuation Committee, among other things, conducts due diligence reviews of pricing vendors, monitors the daily change in prices and reviews transactions among market participants.
The Valuation Committee will consider pricing methodologies it deems relevant and appropriate when making fair value determinations. Examples of possible methodologies include, but are not limited to, multiple of earnings; discount from market of a similar freely traded security; discounted cash-flow analysis; book value or a multiple thereof; risk premium/yield analysis; yield to maturity; and/or fundamental investment analysis. The Valuation Committee will also consider factors it deems relevant and appropriate in light of the facts and circumstances. Examples of possible factors include, but are not limited to, the type of security; the issuer’s financial statements; the purchase price of the security; the discount from market value of unrestricted securities of the same class at the time of purchase; analysts’ research and observations from financial institutions; information regarding any transactions or offers with respect to the security; the existence of merger proposals or tender offers affecting the security; the price and extent of public trading in similar securities of the issuer or comparable companies; and the existence of a shelf registration for restricted securities.
For each portfolio security that has been fair valued pursuant to the policies adopted by the Board of Trustees, the fair value price is compared against the last available and next available market quotations. The Valuation Committee reviews the results of such back testing monthly and fair valuation occurrences are reported to the Board of Trustees quarterly.
The Fund uses valuation techniques to measure fair value that are consistent with the market approach and/or income approach, depending on the type of security and the particular circumstance. The market approach uses prices and other relevant information
Western Asset Inflation-Linked Income Fund 2024 Semi-Annual Report
generated by market transactions involving identical or comparable securities. The income approach uses valuation techniques to discount estimated future cash flows to present value.
GAAP establishes a disclosure hierarchy that categorizes the inputs to valuation techniques used to value assets and liabilities at measurement date. These inputs are summarized in the three broad levels listed below:
•
Level 1 — unadjusted quoted prices in active markets for identical investments
•
Level 2 — other significant observable inputs (including quoted prices for similar investments, interest rates, prepayment speeds, credit risk, etc.)
•
Level 3 — significant unobservable inputs (including the Fund’s own assumptions in determining the fair value of investments)
The inputs or methodologies used to value securities are not necessarily an indication of the risk associated with investing in those securities.
The following is a summary of the inputs used in valuing the Fund’s assets and liabilities carried at fair value:
|
| | Other Significant
Observable Inputs
(Level 2) | Significant
Unobservable
Inputs
(Level 3) | |
| | | | |
U.S. Treasury Inflation Protected Securities | | | | |
| | | | |
Collateralized Mortgage Obligations | | | | |
Non-U.S. Treasury Inflation Protected Securities | | | | |
| | | | |
| | | | |
Mortgage-Backed Securities | | | | |
Total Long-Term Investments | | | | |
| | | | |
| | | | |
Western Asset Inflation-Linked Income Fund 2024 Semi-Annual Report
Notes to consolidated financial statements (unaudited) (cont’d)
|
| | Other Significant Observable Inputs (Level 2) | Significant Unobservable Inputs (Level 3) | |
Other Financial Instruments: | | | | |
| | | | |
Forward Foreign Currency Contracts†† | | | | |
Centrally Cleared Credit Default Swaps on Credit Indices — Sell Protection†† | | | | |
Total Other Financial Instruments | | | | |
| | | | |
|
| | Other Significant
Observable Inputs
(Level 2) | Significant
Unobservable
Inputs
(Level 3) | |
Other Financial Instruments: | | | | |
| | | | |
Forward Foreign Currency Contracts†† | | | | |
| | | | |
| | | | |
| See Consolidated Schedule of Investments for additional detailed categorizations. |
| Reflects the unrealized appreciation (depreciation) of the instruments. |
(b) Futures contracts. The Fund uses futures contracts generally to gain exposure to, or hedge against, changes in interest rates or gain exposure to, or hedge against, changes in certain asset classes. A futures contract represents a commitment for the future purchase or sale of an asset at a specified price on a specified date.
Upon entering into a futures contract, the Fund is required to deposit cash or securities with a broker in an amount equal to a certain percentage of the contract amount. This is known as the ‘‘initial margin’’ and subsequent payments (‘‘variation margin’’) are made or received by the Fund each day, depending on the daily fluctuation in the value of the contract. For certain futures, including foreign denominated futures, variation margin is not settled daily, but is recorded as a net variation margin payable or receivable. The daily changes in contract value are recorded as unrealized appreciation or depreciation in the Consolidated Statement of Operations and the Fund recognizes a realized gain or loss when the contract is closed.
Futures contracts involve, to varying degrees, risk of loss in excess of the amounts reflected in the financial statements. In addition, there is the risk that the Fund may not be able to enter into a closing transaction because of an illiquid secondary market.
Western Asset Inflation-Linked Income Fund 2024 Semi-Annual Report
(c) Forward foreign currency contracts. The Fund enters into a forward foreign currency contract to hedge against foreign currency exchange rate risk on its non-U.S. dollar denominated securities or to facilitate settlement of a foreign currency denominated portfolio transaction. A forward foreign currency contract is an agreement between two parties to buy and sell a currency at a set price with delivery and settlement at a future date. The contract is marked-to-market daily and the change in value is recorded by the Fund as an unrealized gain or loss. When a forward foreign currency contract is closed, through either delivery or offset by entering into another forward foreign currency contract, the Fund recognizes a realized gain or loss equal to the difference between the value of the contract at the time it was opened and the value of the contract at the time it is closed.
Non-deliverable forward foreign currency exchange contracts are settled with the counterparty in cash without the delivery of foreign currency.
Forward foreign currency contracts involve elements of market risk in excess of the amounts reflected on the Consolidated Statement of Assets and Liabilities. The Fund bears the risk of an unfavorable change in the foreign exchange rate underlying the forward foreign currency contract. Risks may also arise upon entering into these contracts from the potential inability of the counterparties to meet the terms of their contracts.
(d) Swap agreements. The Fund invests in swaps for the purpose of managing its exposure to interest rate, credit or market risk, or for other purposes, including to increase the Fund’s return. The use of swaps involves risks that are different from those associated with other portfolio transactions. Swap agreements are privately negotiated in the over-the-counter market and may be entered into as a bilateral contract (“OTC Swaps”) or centrally cleared (“Centrally Cleared Swaps”). Unlike Centrally Cleared Swaps, the Fund has credit exposure to the counterparties of OTC Swaps.
In a Centrally Cleared Swap, immediately following execution of the swap, the swap agreement is submitted to a clearinghouse or central counterparty (the “CCP”) and the CCP becomes the ultimate counterparty of the swap agreement. The Fund is required to interface with the CCP through a broker, acting in an agency capacity. All payments are settled with the CCP through the broker. Upon entering into a Centrally Cleared Swap, the Fund is required to deposit initial margin with the broker in the form of cash or securities.
Swap contracts are marked-to-market daily and changes in value are recorded as unrealized appreciation (depreciation). The daily change in valuation of Centrally Cleared Swaps, if any, is recorded as a net receivable or payable for variation margin on the Consolidated Statement of Assets and Liabilities. Gains or losses are realized upon termination of the swap agreement. Collateral, in the form of restricted cash or securities, may be required to be held in segregated accounts with the Fund’s custodian in compliance with the terms of the swap contracts. Securities posted as collateral for swap contracts are identified in the Consolidated Schedule of Investments and restricted cash, if any, is identified on the Consolidated Statement of Assets and Liabilities. Risks may exceed amounts recorded in the Consolidated Statement of Assets and Liabilities. These risks include changes in the returns of the underlying instruments, failure of the counterparties to perform under the contracts’ terms, and the possible lack of liquidity with respect to the swap agreements.
Western Asset Inflation-Linked Income Fund 2024 Semi-Annual Report
Notes to consolidated financial statements (unaudited) (cont’d)
OTC Swap payments received or made at the beginning of the measurement period are reflected as a premium or deposit, respectively, on the Consolidated Statement of Assets and Liabilities. These upfront payments are amortized over the life of the swap and are recognized as realized gain or loss in the Consolidated Statement of Operations. Net periodic payments received or paid by the Fund are recognized as a realized gain or loss in the Consolidated Statement of Operations.
The Fund’s maximum exposure in the event of a defined credit event on a credit default swap to sell protection is the notional amount. As of May 31, 2024, the total notional value of all credit default swaps to sell protection was $49,057,000. This amount would be offset by the value of the swap’s reference entity, upfront premiums received on the swap and any amounts received from the settlement of a credit default swap where the Fund bought protection for the same referenced security/entity.
For average notional amounts of swaps held during the six months ended May 31, 2024, see Note 4.
The Fund enters into credit default swap (“CDS”) contracts for investment purposes, to manage its credit risk or to add leverage. CDS agreements involve one party making a stream of payments to another party in exchange for the right to receive a specified return in the event of a default by a third party, typically corporate or sovereign issuers, on a specified obligation, or in the event of a write-down, principal shortfall, interest shortfall or default of all or part of the referenced entities comprising a credit index. The Fund may use a CDS to provide protection against defaults of the issuers (i.e., to reduce risk where the Fund has exposure to an issuer) or to take an active long or short position with respect to the likelihood of a particular issuer’s default. As a seller of protection, the Fund generally receives an upfront payment or a stream of payments throughout the term of the swap provided that there is no credit event. If the Fund is a seller of protection and a credit event occurs, as defined under the terms of that particular swap agreement, the maximum potential amount of future payments (undiscounted) that the Fund could be required to make under a CDS agreement would be an amount equal to the notional amount of the agreement. These amounts of potential payments will be partially offset by any recovery of values from the respective referenced obligations. As a seller of protection, the Fund effectively adds leverage to its portfolio because, in addition to its total net assets, the Fund is subject to investment exposure on the notional amount of the swap. As a buyer of protection, the Fund generally receives an amount up to the notional value of the swap if a credit event occurs.
Implied spreads are the theoretical prices a lender receives for credit default protection. When spreads rise, market perceived credit risk rises and when spreads fall, market perceived credit risk falls. The implied credit spread of a particular referenced entity reflects the cost of buying/selling protection and may include upfront payments required to enter into the agreement. Wider credit spreads and decreasing market values, when compared to the notional amount of the swap, represent a deterioration of the referenced entity’s credit soundness and a greater likelihood or risk of default or other credit event occurring as defined under the terms of the agreement. Credit spreads utilized in determining the period end market value of CDS agreements on corporate or sovereign issues are disclosed in the
Western Asset Inflation-Linked Income Fund 2024 Semi-Annual Report
Consolidated Schedule of Investments and serve as an indicator of the current status of the payment/performance risk and represent the likelihood or risk of default for credit derivatives. For CDS agreements on asset-backed securities and credit indices, the quoted market prices and resulting values, particularly in relation to the notional amount of the contract as well as the annual payment rate, serve as an indication of the current status of the payment/performance risk.
The Fund’s maximum risk of loss from counterparty risk, as the protection buyer, is the fair value of the contract (this risk is mitigated by the posting of collateral by the counterparty to the Fund to cover the Fund’s exposure to the counterparty). As the protection seller, the Fund’s maximum risk is the notional amount of the contract. CDS are considered to have credit risk-related contingent features since they require payment by the protection seller to the protection buyer upon the occurrence of a defined credit event.
Entering into a CDS agreement involves, to varying degrees, elements of credit, market and documentation risk in excess of the related amounts recognized on the Consolidated Statement of Assets and Liabilities. Such risks involve the possibility that there will be no liquid market for these agreements, that the counterparty to the agreement may default on its obligation to perform or disagree as to the meaning of the contractual terms in the agreement, and that there will be unfavorable changes in net interest rates.
The Fund enters into total return swaps for investment purposes. Total return swaps are agreements to exchange the return generated by one instrument for the return generated by another instrument. For example, the agreement to pay a predetermined or fixed interest rate in exchange for a market-linked return based on a notional amount. To the extent the total return of a referenced index or instrument exceeds the offsetting interest obligation, the Fund will receive a payment from the counterparty. To the extent it is less, the Fund will make a payment to the counterparty.
(e) Stripped securities. The Fund may invest in ‘‘Stripped Securities,’’ a term used collectively for components, or strips, of fixed income securities. Stripped Securities can be principal only securities (“PO”), which are debt obligations that have been stripped of unmatured interest coupons, or interest only securities (“IO”), which are unmatured interest coupons that have been stripped from debt obligations. The market value of Stripped Securities will fluctuate in response to changes in economic conditions, rates of pre-payment, interest rates and the market’s perception of the securities. However, fluctuations in response to interest rates may be greater in Stripped Securities than for debt obligations of comparable maturities that pay interest currently. The amount of fluctuation may increase with a longer period of maturity.
The yield to maturity on IO’s is sensitive to the rate of principal repayments (including prepayments) on the related underlying debt obligation and principal payments may have a material effect on yield to maturity. If the underlying debt obligation experiences greater than anticipated prepayments of principal, the Fund may not fully recoup its initial investment in IO’s.
(f) Reverse repurchase agreements. The Fund may enter into reverse repurchase agreements. Under the terms of a typical reverse repurchase agreement, a fund sells a
Western Asset Inflation-Linked Income Fund 2024 Semi-Annual Report
Notes to consolidated financial statements (unaudited) (cont’d)
security subject to an obligation to repurchase the security from the buyer at an agreed upon time and price. In the event the buyer of securities under a reverse repurchase agreement files for bankruptcy or becomes insolvent, the Fund’s use of the proceeds of the agreement may be restricted pending a determination by the counterparty, or its trustee or receiver, whether to enforce the Fund’s obligation to repurchase the securities. In entering into reverse repurchase agreements, the Fund will pledge cash, U.S. government securities or other liquid debt obligations at least equal in value to its obligations with respect to reverse repurchase agreements or will take other actions permitted by law to cover its obligations. If the market value of the collateral declines during the period, the Fund may be required to post additional collateral to cover its obligation. Cash collateral that has been pledged to cover obligations of the Fund under reverse repurchase agreements, if any, will be reported separately in the Consolidated Statement of Assets and Liabilities. Securities pledged as collateral are noted in the Consolidated Schedule of Investments. Interest payments made on reverse repurchase agreements are recognized as a component of “Interest expense” on the Consolidated Statement of Operations. In periods of increased demand for the security, the Fund may receive a fee for use of the security by the counterparty, which may result in interest income to the Fund.
(g) Inflation-indexed bonds. Inflation-indexed bonds are fixed income securities whose principal value or interest rate is periodically adjusted according to the rate of inflation. As the index measuring inflation changes, the principal value or interest rate of inflation-indexed bonds will be adjusted accordingly. Inflation adjustments to the principal amount of inflation-indexed bonds are reflected as an increase or decrease to investment income on the Consolidated Statement of Operations. Repayment of the original bond principal upon maturity (as adjusted for inflation) is guaranteed in the case of U.S. Treasury inflation-indexed bonds. For bonds that do not provide a similar guarantee, the adjusted principal value of the bond repaid at maturity may be less than the original principal.
(h) Cash flow information. The Fund invests in securities and distributes dividends from net investment income and net realized gains, which are paid in cash and may be reinvested at the discretion of shareholders. These activities are reported in the Consolidated Statements of Changes in Net Assets and additional information on cash receipts and cash payments is presented in the Consolidated Statement of Cash Flows.
(i) Foreign currency translation. Investment securities and other assets and liabilities denominated in foreign currencies are translated into U.S. dollar amounts based upon prevailing exchange rates on the date of valuation. Purchases and sales of investment securities and income and expense items denominated in foreign currencies are translated into U.S. dollar amounts based upon prevailing exchange rates on the respective dates of such transactions.
The Fund does not isolate that portion of the results of operations resulting from fluctuations in foreign exchange rates on investments from the fluctuations arising from changes in market prices of securities held. Such fluctuations are included with the net realized and unrealized gain or loss on investments.
Net realized foreign exchange gains or losses arise from sales of foreign currencies, including gains and losses on forward foreign currency contracts, currency gains or losses realized between the trade and settlement dates on securities transactions, and the
Western Asset Inflation-Linked Income Fund 2024 Semi-Annual Report
difference between the amounts of dividends, interest, and foreign withholding taxes recorded on the Fund’s books and the U.S. dollar equivalent of the amounts actually received or paid. Net unrealized foreign exchange gains and losses arise from changes in the values of assets and liabilities, other than investments in securities, on the date of valuation, resulting from changes in exchange rates.
Foreign security and currency transactions may involve certain considerations and risks not typically associated with those of U.S. dollar denominated transactions as a result of, among other factors, the possibility of lower levels of governmental supervision and regulation of foreign securities markets and the possibility of political or economic instability.
(j) Credit and market risk. The Fund invests in high-yield and emerging market instruments that are subject to certain credit and market risks. The yields of high-yield and emerging market debt obligations reflect, among other things, perceived credit and market risks. The Fund’s investments in securities rated below investment grade typically involve risks not associated with higher rated securities including, among others, greater risk related to timely and ultimate payment of interest and principal, greater market price volatility and less liquid secondary market trading. The consequences of political, social, economic or diplomatic changes may have disruptive effects on the market prices of investments held by the Fund. The Fund’s investments in non-U.S. dollar denominated securities may also result in foreign currency losses caused by devaluations and exchange rate fluctuations.
Investments in securities that are collateralized by real estate mortgages are subject to certain credit and liquidity risks. When market conditions result in an increase in default rates of the underlying mortgages and the foreclosure values of underlying real estate properties are materially below the outstanding amount of these underlying mortgages, collection of the full amount of accrued interest and principal on these investments may be doubtful. Such market conditions may significantly impair the value and liquidity of these investments and may result in a lack of correlation between their credit ratings and values.
(k) Foreign investment risks. The Fund’s investments in foreign securities may involve risks not present in domestic investments. Since securities may be denominated in foreign currencies, may require settlement in foreign currencies or may pay interest or dividends in foreign currencies, changes in the relationship of these foreign currencies to the U.S. dollar can significantly affect the value of the investments and earnings of the Fund. Foreign investments may also subject the Fund to foreign government exchange restrictions, expropriation, taxation or other political, social or economic developments, all of which affect the market and/or credit risk of the investments.
(l) Counterparty risk and credit-risk-related contingent features of derivative instruments. The Fund may invest in certain securities or engage in other transactions, where the Fund is exposed to counterparty credit risk in addition to broader market risks. The Fund may invest in securities of issuers, which may also be considered counterparties as trading partners in other transactions. This may increase the risk of loss in the event of default or bankruptcy by the counterparty or if the counterparty otherwise fails to meet its contractual obligations. The Fund’s investment adviser attempts to mitigate counterparty risk by (i) periodically assessing the creditworthiness of its trading partners, (ii) monitoring
Western Asset Inflation-Linked Income Fund 2024 Semi-Annual Report
Notes to consolidated financial statements (unaudited) (cont’d)
and/or limiting the amount of its net exposure to each individual counterparty based on its assessment and (iii) requiring collateral from the counterparty for certain transactions. Market events and changes in overall economic conditions may impact the assessment of such counterparty risk by the investment adviser. In addition, declines in the values of underlying collateral received may expose the Fund to increased risk of loss.
With exchange traded and centrally cleared derivatives, there is less counterparty risk to the Fund since the exchange or clearinghouse, as counterparty to such instruments, guarantees against a possible default. The clearinghouse stands between the buyer and the seller of the contract; therefore, the credit risk is limited to failure of the clearinghouse. While offset rights may exist under applicable law, the Fund does not have a contractual right of offset against a clearing broker or clearinghouse in the event of a default of the clearing broker or clearinghouse.
The Fund has entered into master agreements, such as an International Swaps and Derivatives Association, Inc. Master Agreement (“ISDA Master Agreement”) or similar agreement, with certain of its derivative counterparties that govern over-the-counter (“OTC”) derivatives and provide for general obligations, representations, agreements, collateral posting terms, netting provisions in the event of default or termination and credit related contingent features. The credit related contingent features include, but are not limited to, a percentage decrease in the Fund’s net assets or net asset value per share over a specified period of time. If these credit related contingent features were triggered, the derivatives counterparty could terminate the positions and demand payment or require additional collateral.
Under an ISDA Master Agreement, the Fund may, under certain circumstances, offset with the counterparty certain derivative financial instruments’ payables and/or receivables with collateral held and/or posted and create one single net payment. However, absent an event of default by the counterparty or a termination of the agreement, the terms of the ISDA Master Agreements do not result in an offset of reported amounts of financial assets and financial liabilities in the Consolidated Statement of Assets and Liabilities across transactions between the Fund and the applicable counterparty. The enforceability of the right to offset may vary by jurisdiction.
Collateral requirements differ by type of derivative. Collateral or margin requirements are set by the broker or exchange clearinghouse for exchange traded derivatives while collateral terms are contract specific for OTC traded derivatives. Cash collateral that has been pledged to cover obligations of the Fund under derivative contracts, if any, will be reported separately in the Consolidated Statement of Assets and Liabilities. Securities pledged as collateral, if any, for the same purpose are noted in the Consolidated Schedule of Investments.
As of May 31, 2024, the Fund held forward foreign currency contracts and OTC total return swaps with credit related contingent features which had a liability position of $336,848. If a contingent feature in the master agreements would have been triggered, the Fund would have been required to pay this amount to its derivatives counterparties. As of May 31, 2024, the Fund had posted with its counterparties cash and/or securities as collateral to cover the net liability of these derivatives amounting to $100,000 which could be used to reduce the required payment.
Western Asset Inflation-Linked Income Fund 2024 Semi-Annual Report
(m) Security transactions and investment income. Security transactions are accounted for on a trade date basis. Interest income (including interest income from payment-in-kind securities) is recorded on the accrual basis. Amortization of premiums and accretion of discounts on debt securities are recorded to interest income over the lives of the respective securities, except for premiums on certain callable debt securities, which are amortized to the earliest call date. Paydown gains and losses on mortgage- and asset-backed securities are recorded as adjustments to interest income. Dividend income is recorded on the ex-dividend date for dividends received in cash and/or securities. Foreign dividend income is recorded on the ex-dividend date or as soon as practicable after the Fund determines the existence of a dividend declaration after exercising reasonable due diligence. The cost of investments sold is determined by use of the specific identification method. To the extent any issuer defaults or a credit event occurs that impacts the issuer, the Fund may halt any additional interest income accruals and consider the realizability of interest accrued up to the date of default or credit event.
(n) Distributions to shareholders. Distributions from net investment income of the Fund, if any, are declared and paid on a monthly basis. Distributions of net realized gains, if any, are declared at least annually. Pursuant to its Managed Distribution Policy, the Fund intends to make regular monthly distributions to shareholders at a fixed rate per common share, which rate may be adjusted from time to time by the Fund’s Board of Trustees. The actual source of the Fund’s monthly distributions may be from net investment income, realized capital gains, return of capital or a combination thereof. Under the Fund’s Managed Distribution Policy, if, for any monthly distribution, the value of the Fund’s net investment income and net realized capital gain is less than the amount of the distribution, the difference will be distributed from the Fund’s net assets (and may constitute a “return of capital”). Shareholders will be informed of the tax characteristics of the distributions after the close of the 2024 fiscal year. The Board of Trustees may modify, terminate or suspend the Managed Distribution Policy at any time, including when certain events would make part of the return of capital taxable to shareholders. Any such modification, termination or suspension could have an adverse effect on the market price of the Fund’s shares. Distributions to shareholders of the Fund are recorded on the ex-dividend date and are determined in accordance with income tax regulations, which may differ from GAAP.
(o) Compensating balance arrangements. The Fund has an arrangement with its custodian bank whereby a portion of the custodian’s fees is paid indirectly by credits earned on the Fund’s cash on deposit with the bank.
(p) Federal and other taxes. It is the Fund’s policy to comply with the federal income and excise tax requirements of the Internal Revenue Code of 1986 (the “Code”), as amended, applicable to regulated investment companies. Accordingly, the Fund intends to distribute its taxable income and net realized gains, if any, to shareholders in accordance with timing requirements imposed by the Code. Therefore, no federal or state income tax provision is required in the Fund’s financial statements.
However, due to the timing of when distributions are made by the Fund, the Fund may be subject to an excise tax of 4% of the amount by which 98% of the Fund’s annual taxable income and 98.2% of net realized gains exceed the distributions from such taxable income and realized gains for the calendar year.
Western Asset Inflation-Linked Income Fund 2024 Semi-Annual Report
Notes to consolidated financial statements (unaudited) (cont’d)
Management has analyzed the Fund’s tax positions taken on income tax returns for all open tax years and has concluded that as of November 30, 2023, no provision for income tax is required in the Fund’s financial statements. The Fund’s federal and state income and federal excise tax returns for tax years for which the applicable statutes of limitations have not expired are subject to examination by the Internal Revenue Service and state departments of revenue.
(q) Reclassification. GAAP requires that certain components of net assets be reclassified to reflect permanent differences between financial and tax reporting. These reclassifications have no effect on net assets or net asset value per share.
2. Investment management agreement and other transactions with affiliates
The Fund has entered into an Investment Management Agreement with Western Asset Management Company, LLC (“Western Asset” or the “Investment Adviser”), which provides for payment of a monthly fee computed at the annual rate of 0.35% of the Fund’s average weekly assets. “Average weekly assets” means the average weekly value of the total assets of the Fund (including any assets attributable to leverage) minus accrued liabilities (other than liabilities representing leverage). For purposes of calculating “average weekly assets,” liabilities associated with any instrument or transactions used by the Investment Adviser to leverage the Fund’s portfolio (whether or not such instruments or transactions are treated as derivative instruments or transactions) are not considered a liability.
During periods when the Fund is using leverage, the fee paid to the Investment Adviser for advisory services will be higher than if the Fund did not use leverage because the fee paid will be calculated on the basis of the Fund’s average weekly assets, which includes the assets attributable to leverage.
Western Asset Management Company Pte. Ltd. (“Western Asset Singapore”), Western Asset Management Company Limited (“Western Asset London”) and Western Asset Management Company Ltd (“Western Asset Japan” and together with Western Asset Singapore and Western Asset London, the “Non-U.S. Advisers”) are also the Fund’s investment advisers. Western Asset Singapore, Western Asset London and Western Asset Japan provide certain advisory services to the Fund relating to currency transactions and investment in non-U.S. denominated securities. Western Asset Singapore, Western Asset London and Western Asset Japan do not receive any compensation from the Fund.
Franklin Templeton Fund Adviser, LLC (“FTFA” or the “Administrator”), an affiliate of the Investment Adviser, provides certain administrative, accounting, shareholder servicing and corporate secretarial and related functions pursuant to an Administrative Services Agreement with the Fund. The Fund pays the Administrator a monthly fee at the annual rate of 0.05% of the Fund’s average weekly assets.
The Investment Adviser has agreed to waive the Fund’s management fee to an extent sufficient to offset the net management fee payable in connection with any investment in an affiliated money market fund (the “affiliated money market fund waiver”).
During the six months ended May 31, 2024, fees waived and/or expenses reimbursed amounted to $2,750, all of which was an affiliated money market fund waiver.
Western Asset Inflation-Linked Income Fund 2024 Semi-Annual Report
Western Asset, Western Asset Singapore, Western Asset London, Western Asset Japan and FTFA are indirect, wholly-owned subsidiaries of Franklin Resources, Inc.
During the six months ended May 31, 2024, the aggregate cost of purchases and proceeds from sales of investments (excluding short-term investments) and U.S. Government & Agency Obligations were as follows:
| | U.S. Government &
Agency Obligations |
| | |
| | |
At May 31, 2024, the aggregate cost of investments and the aggregate gross unrealized appreciation and depreciation of investments for federal income tax purposes were substantially as follows:
| Cost/Premiums
Paid (Received) | Gross
Unrealized
Appreciation | Gross
Unrealized
Depreciation | Net
Unrealized
Appreciation
(Depreciation) |
| | | | |
| | | | |
Forward foreign currency contracts | | | | |
| | | | |
Transactions in reverse repurchase agreements for the Fund during the six months ended May 31, 2024 were as follows:
| Weighted Average
Interest Rate* | Maximum Amount
Outstanding |
| | |
* Averages based on the number of days that the Fund had reverse repurchase agreements outstanding. |
Interest rates on reverse repurchase agreements ranged from 5.480% to 5.540% during the six months ended May 31, 2024. Interest expense incurred on reverse repurchase agreements totaled $3,929,405.
Western Asset Inflation-Linked Income Fund 2024 Semi-Annual Report
Notes to consolidated financial statements (unaudited) (cont’d)
4. Derivative instruments and hedging activities
Below is a table, grouped by derivative type, that provides information about the fair value and the location of derivatives within the Consolidated Statement of Assets and Liabilities at May 31, 2024.
|
| | | | | |
| | | | | |
Forward foreign currency contracts | | | | | |
Centrally cleared swap contracts3 | | | | | |
| | | | | |
|
| | | | |
| | | | |
Forward foreign currency contracts | | | | |
| | | | |
| | | | |
| Generally, the balance sheet location for asset derivatives is receivables/net unrealized appreciation and for liability derivatives is payables/net unrealized depreciation. |
| Includes cumulative unrealized appreciation (depreciation) of futures contracts as reported in the Consolidated Schedule of Investments. Only net variation margin is reported within the receivables and/or payables on the Consolidated Statement of Assets and Liabilities. |
| Includes cumulative unrealized appreciation (depreciation) of centrally cleared swap contracts as reported in the Consolidated Schedule of Investments. Only net variation margin is reported within the receivables and/or payables on the Consolidated Statement of Assets and Liabilities. |
| Values include premiums paid (received) on swap contracts which are shown separately in the Consolidated Statement of Assets and Liabilities. |
The following tables provide information about the effect of derivatives and hedging activities on the Fund’s Consolidated Statement of Operations for the six months ended May 31, 2024. The first table provides additional detail about the amounts and sources of gains (losses) realized on derivatives during the period. The second table provides additional information about the change in net unrealized appreciation (depreciation) resulting from the Fund’s derivatives and hedging activities during the period.
AMOUNT OF NET REALIZED GAIN (LOSS) ON DERIVATIVES RECOGNIZED |
| | | | | |
| | | | | |
| | | | | |
Forward foreign currency contracts | | | | | |
| | | | | |
Western Asset Inflation-Linked Income Fund 2024 Semi-Annual Report
CHANGE IN NET UNREALIZED APPRECIATION (DEPRECIATION) ON DERIVATIVES RECOGNIZED |
| | | | | |
| | | | | |
| | | | | |
Forward foreign currency contracts | | | | | |
| | | | | |
During the six months ended May 31, 2024, the volume of derivative activity for the Fund was as follows:
| |
Futures contracts (to buy) | |
Futures contracts (to sell) | |
Forward foreign currency contracts (to buy) | |
Forward foreign currency contracts (to sell) | |
| |
Credit default swap contracts (sell protection) | |
Total return swap contracts | |
The following table presents the Fund’s OTC derivative assets and liabilities by counterparty net of amounts available for offset under an ISDA Master Agreement and net of the related collateral pledged (received) by the Fund as of May 31, 2024.
| Gross Assets
Subject to
Master
| Gross
Liabilities
Subject to
Master
| Net Assets
(Liabilities)
Subject to
Master
Agreements | | |
| | | | | |
| | | | | |
| | | | | |
| | | | | |
| | | | | |
Morgan Stanley & Co. Inc. | | | | | |
| | | | | |
| Absent an event of default or early termination, derivative assets and liabilities are presented gross and not offset in the Consolidated Statement of Assets and Liabilities. |
| Gross amounts are not offset in the Consolidated Statement of Assets and Liabilities. |
| In some instances, the actual collateral received and/or pledged may be more than the amount shown here due to overcollateralization. |
| Net amount may also include forward foreign currency exchange contracts that are not required to be collateralized. |
| Represents the net amount receivable (payable) from (to) the counterparty in the event of default. |
Western Asset Inflation-Linked Income Fund 2024 Semi-Annual Report
Notes to consolidated financial statements (unaudited) (cont’d)
5. Tender offer
On November 24, 2020, the Fund announced that the Fund’s Board of Trustees had approved a cash tender offer for up to 20% of the Fund’s outstanding common shares (the “Shares”) at a price per Share equal to 99% of the Fund’s net asset value per Share as of the business day immediately following the expiration date of the tender offer. On November 25, 2020, the Fund commenced its tender offer. On December 28, 2020, the tender offer expired. Pursuant to the terms of the tender offer, the Fund repurchased Shares tendered and accepted in the tender offer in exchange for cash. On December 30, 2020, the Fund announced the final results of the tender offer. A total of 20,871,974 Shares were duly tendered and not withdrawn. Because the number of Shares tendered exceeded 5,830,564 Shares, the tender offer was oversubscribed. Therefore, in accordance with the terms and conditions specified in the tender offer, the Fund purchased Shares from all tendering shareholders on a pro rata basis, disregarding fractions. Payment for such shares was made on December 31, 2020. The purchase price of properly tendered Shares was $13.99 per Share, equal to 99% of the per Share net asset value of $14.13 as of the close of the regular trading session on the New York Stock Exchange on December 29, 2020. Shares that were not tendered remain outstanding.
6. Distributions subsequent to May 31, 2024
The following distributions have been declared by the Fund’s Board of Trustees and are payable subsequent to the period end of this report:
7. Share repurchase program
On March 2, 2016, the Fund announced that the Fund’s Board of Trustees (the “Board”) had authorized the Fund to repurchase in the open market up to approximately 10% of the Fund’s outstanding common shares when the Fund’s shares are trading at a discount to net asset value. The Board has directed management of the Fund to repurchase the Fund’s common shares at such times and in such amounts as management reasonably believes may enhance shareholder value. The Fund is under no obligation to purchase shares at any specific discount levels or in any specific amounts. During the six months ended May 31, 2024, and the year ended November 30, 2023, the Fund did not repurchase any shares.
8. Transactions with affiliated company
As defined by the 1940 Act, an affiliated company is one in which the Fund owns 5% or more of the outstanding voting securities, or a company which is under common ownership or control with the Fund. The following company was considered an affiliated company for
Western Asset Inflation-Linked Income Fund 2024 Semi-Annual Report
all or some portion of the six months ended May 31, 2024. The following transactions were effected in such company for the six months ended May 31, 2024.
| Affiliate
Value at
November 30,
2023 | | |
| | | |
Western Asset Premier Institutional Government Reserves, Premium Shares | | | | | |
| | | Net Increase
(Decrease) in
Unrealized
Appreciation
(Depreciation) | Affiliate
Value at
May 31,
2024 |
Western Asset Premier Institutional Government Reserves, Premium Shares | | | | |
9. Deferred capital losses
As of November 30, 2023, the Fund had deferred capital losses of $56,154,127, which have no expiration date, that will be available to offset future taxable capital gains.
Western Asset Inflation-Linked Income Fund 2024 Semi-Annual Report
Board approval of management andsubadvisory agreements (unaudited) The Executive and Contracts Committee of the Board of Trustees (the “Executive and Contracts Committee”) considered the Investment Management Agreement between the Fund and Western Asset Management Company, LLC (“Western Asset”) and the following subadvisory agreements with respect to the Fund (collectively, the “Agreements”) (i) a subadvisory agreement between Western Asset and Western Asset Management Company Limited (“WAML”) with respect to the Fund, (ii) a subadvisory agreement between Western Asset and Western Asset Management Company Pte. Ltd. in Singapore (“Western Singapore”) with respect to the Fund, and (iii) a subadvisory agreement between Western Asset and Western Asset Management Company Ltd in Japan (“Western Japan,” and together with Western Singapore and WAML, the “Non-U.S. Advisers,” and together with Western Asset, the “Advisers”) with respect to the Fund at a meeting held on April 30, 2024. At an in-person meeting held on May 16, 2024, the Executive and Contracts Committee reported to the full Board of Trustees their considerations and recommendation with respect to the Agreements, and the Board of Trustees, including a majority of the Independent Trustees, considered and approved renewal of the Agreements.
The Trustees noted that although Western Asset’s business is operated through separate legal entities, such as the Non-U.S. Advisers, senior investment personnel at Western Asset have supervisory oversight responsibility over the investment decisions made by the Non-U.S. Advisers. Therefore, in connection with their deliberations noted below, the Trustees primarily focused on the information provided by Western Asset when considering the approval of the Agreements between Western Asset and the Non-U.S. Advisers.
In arriving at their decision to approve the renewal of the Agreements, the Trustees met with representatives of the Advisers, including relevant investment advisory personnel; considered a variety of information prepared by the Advisers, materials provided by Broadridge and advice and materials provided by counsel to the Independent Trustees; reviewed performance and expense information for peer groups of comparable funds and certain other comparable products available from Western Asset or affiliates of Western Asset, including separate accounts managed by Western Asset; and requested and reviewed additional information as necessary. These reviews were in addition to information obtained by the Trustees at their regular quarterly meetings (and various committee meetings) with respect to the Fund’s performance and other relevant matters, such as information on public trading in the Fund’s shares and differences between the Fund’s share price and net asset value per share, and related discussions with the Advisers’ personnel. The information received and considered by the Board both in conjunction with the May meeting and at prior meetings was both written and oral.
As part of their review, the Trustees examined the Advisers’ ability to provide high quality investment management services to the Fund. The Trustees considered the investment philosophy and research and decision-making processes of the Advisers; the experience of
Western Asset Inflation-Linked Income Fund
their key advisory personnel responsible for management of the Fund; the ability of the Advisers to attract and retain capable research and advisory personnel; the risks to the Advisers associated with sponsoring the Fund (such as entrepreneurial, operational, reputational, litigation and regulatory risk), as well as the Advisers’ risk management processes); the capability and integrity of the Advisers’ senior management and staff; and the level of skill required to manage the Fund. In addition, the Trustees reviewed the quality of the Advisers’ services with respect to regulatory compliance and compliance with the investment policies of the Fund, and conditions that might affect the Advisers’ ability to provide high quality services to the Fund in the future, including their business reputations, financial conditions and operational stabilities. Based on the foregoing, the Trustees concluded that the Advisers’ investment process, research capabilities and philosophy were well suited to the Fund given its investment objectives and policies, and that the Advisers would be able to meet any reasonably foreseeable obligations under the Agreements.
The Board reviewed the qualifications, backgrounds and responsibilities of the Advisers’ senior personnel and the team of investment professionals primarily responsible for the day-to-day portfolio management of the Fund. The Board also considered, based on its knowledge of the Advisers and their affiliates, the financial resources of Franklin Resources, Inc., the parent organization of the Advisers. The Board recognized the importance of having a fund manager with significant resources.
In reviewing the quality of the services provided to the Fund, the Trustees also reviewed a comparison of the performance of the Fund to the performance of a group of closed-end bond funds and the Bloomberg U.S. Government Inflation-Linked 1-10 Year Index (the “Index”). The Trustees noted that the performance of the Fund trailed the performance of its peer group average for the 3-year period ended December 31, 2023, was approximately equal to the performance of its peer group average for the 5-year period ended December 31, 2023, and exceeded the performance of its peer group average for the 1- and 10-year periods ended December 31, 2023. The Board noted that the Fund’s performance exceeded the performance of the Index for the 1-year period ended December 31, 2023, trailed the performance of the Index for the 3- and 5-year periods ended December 31, 2023, and approximately equaled the performance of the Index for the 10-year period ended December 31, 2023. The Trustees considered the factors involved in the Fund’s performance relative to the performance of the Index and peer group. The Board noted the information provided by Broadridge and management regarding the limited number of closed-end BBB-rated corporate debt Treasury Inflation-Protected Securities (TIPS) funds available. The Trustees concluded that the Advisers’ management of the Fund would continue to be in the best interests of the shareholders.
The Trustees also considered the management fee and total expenses payable by the Fund. They reviewed information concerning management fees paid to investment advisers of
Western Asset Inflation-Linked Income Fund
Board approval of management andsubadvisory agreements (unaudited) (cont’d) similarly managed funds as well as fees paid by Western Asset’s other clients, including separate accounts managed by Western Asset. The Trustees also noted that the Fund does not pay any management fees directly to any of the Non-U.S. Advisers because Western Asset pays the Non-U.S. Advisers for services provided to the Fund out of the management fee Western Asset receives from the Fund. The Trustees noted that, when measured as a percentage of net assets (including assets attributable to leverage) for its most recently completed fiscal year, the Fund’s advisory fee paid to Western Asset was below the median of the advisory fees paid by funds in its peer group and that the Fund’s total expenses were above the median in its peer group. The Trustees also noted that, when measured as a percentage of net assets (net of leverage) for its most recently completed fiscal year, the Fund’s advisory fee paid to Western Asset was below the median of the advisory fees of the funds in its peer group and that the Fund’s total expenses were above the median of the total expenses of the funds in its peer group. The Trustees noted that Western Asset manages one other account with a similar investment strategy to the Fund and it has the same management fee rate as the Fund. The Trustees further noted that Western Asset does not manage open-end funds or separate accounts with similar investment strategies to the Fund, although they noted that the management fee paid by the Fund was higher than the average of the fees paid by clients of Western Asset for certain other accounts (“Other Accounts”). The Trustees noted that the administrative and operational responsibilities undertaken and associated risks incurred by Western Asset with respect to the Fund were also relatively higher and that the Fund’s investment strategy included certain asset classes and other features not included in the Other Accounts. In light of the forgoing, the Trustees concluded that the difference in management fees paid by the Fund from those paid to Western Asset with respect to the Other Accounts was reasonable.
The Trustees further evaluated the benefits of the advisory relationship to the Advisers, including, among others, the profitability of the relationship to the Advisers; the direct and indirect benefits that the Advisers may receive from their relationships with the Fund, including the “fallout benefits,” such as reputational value derived from serving as investment adviser to the Fund; and the affiliation between the Advisers and Franklin Templeton Fund Adviser, LLC (formerly known as Legg Mason Partners Fund Advisor, LLC), the Fund’s administrator, and certain other service providers for the Fund. In that connection, the Board considered that the ancillary benefits that the Advisers receive were reasonable. The Trustees noted that Western Asset does not have soft dollar arrangements.
Finally, the Trustees considered, in light of the profitability information provided by Western Asset, the extent to which economies of scale would be realized by the Advisers as the assets of the Fund grow. The Trustees concluded that because the Fund is a closed-end fund and does not make a continuous offer of its securities, the Fund’s size was relatively fixed and it would be unlikely that the Advisers would realize economies of scale from the Fund’s growth.
Western Asset Inflation-Linked Income Fund
In their deliberations with respect to these matters, the Independent Trustees were advised by their independent counsel, who is independent, within the meaning of the Securities and Exchange Commission rules regarding the independence of counsel, of the Advisers. The Independent Trustees weighed the foregoing matters in light of the advice given to them by their independent counsel as to the law applicable to the review of investment advisory contracts. In arriving at a decision, the Trustees, including the Independent Trustees, did not identify any single matter as all-important or controlling, and each Trustee may have attributed different weight to the various factors in evaluating the Agreements. The foregoing summary does not detail all the matters considered. The Trustees judged the terms and conditions of the Agreements, including the investment advisory fees, in light of all of the surrounding circumstances.
Based upon their review, the Trustees, including all of the Independent Trustees, determined, in the exercise of their business judgment, that they were satisfied with the quality of investment advisory services being provided by the Advisers; that the fees to be paid to the Advisers under the Agreements were fair and reasonable given the scope and quality of the services rendered by the Advisers; and that approval of the Agreements was in the best interest of the Fund and its shareholders.
Western Asset Inflation-Linked Income Fund
Additional shareholder information (unaudited)
Results of annual meeting of shareholders
The Annual Meeting of Shareholders of Western Asset Inflation-Linked Income Fund was held on May 22, 2024, for the purpose of considering and voting upon the proposals presented at the Meeting. The following table provides information concerning the matters voted upon at the Meeting:
At the Meeting, Messrs. Siart and Taylor and Ms. Studenmund were each duly elected by the shareholders to serve as Class III Trustees of the Fund until the 2027 Annual Meeting of Shareholders, or until their successors have been duly elected and qualified or until their resignation or are otherwise removed.
At May 31, 2024, in addition to Messrs. Siart and Taylor and Ms. Studenmund, the other Trustees of the Fund were as follows: Robert Abeles, Jr., Jane F. Dasher, Anita L. DeFrantz, Susan B. Kerley, Michael Larson, Ronald L. Olson, Avedick B. Poladian and Jane Trust.
Western Asset Inflation-Linked Income Fund
Dividend reinvestment plan (unaudited)
The Fund and Computershare Inc. (“Agent”), as the Transfer Agent and Registrar of WIA, offer a convenient way to add shares of WIA to your account. WIA offers to all common shareholders a Dividend Reinvestment Plan (“Plan”). Under the Plan, cash distributions (e.g., dividends and capital gains) on the common shares are automatically invested in shares of WIA unless the shareholder elects otherwise by contacting the Agent at the address set forth below.
As a participant in the Dividend Reinvestment Plan, you will automatically receive your dividend or net capital gains distribution in newly issued shares of WIA, if the market price of the shares on the date of the distribution is at or above the net asset value (NAV) of the shares, minus estimated brokerage commissions that would be incurred upon the purchase of common shares on the open market. The number of shares to be issued to you will be determined by dividing the amount of the cash distribution to which you are entitled (net of any applicable withholding taxes) by the greater of the NAV per share on such date or 95% of the market price of a share on such date. If the market price of a share on such distribution date is below the NAV, less estimated brokerage commissions that would be incurred upon the purchase of common shares on the open market, the Agent will, as agent for the participants, buy shares of WIA through a broker on the open market. All common shares acquired on your behalf through the Plan will be automatically credited to an account maintained on the books of the Agent.
Additional information regarding the plan
WIA will pay all costs applicable to the Plan, except for brokerage commissions for open market purchases by the Agent under the Plan, which will be charged to participants. All shares acquired through the Plan receive voting rights and are eligible for any share split, share dividend, or other rights accruing to shareholders that the Board of Trustees may declare.
You may terminate participation in the Plan at any time by giving notice to the Agent. Such termination will be effective prior to the record date next succeeding the receipt of such instructions or by a later date of termination specified in such instructions. Upon termination, a participant will receive a certificate for the full shares credited to his or her account or may request the sale of all or part of such shares. Fractional shares credited to a terminating account will be paid for in cash at the current market price at the time of termination.
Dividends and other distributions invested in additional shares under the Plan are subject to income tax just as if they had been received in cash. After year end, dividends paid on the accumulated shares will be included in the Form 1099-DIV information return to the Internal Revenue Service and only one Form 1099-DIV will be sent to participants each year.
Inquiries regarding the Plan, as well as notices of termination, should be directed to Computershare Inc., P.O. Box 43006 Providence, RI 02940-3078. Investor Relations telephone number 1-888-888-0151.
Western Asset Inflation-Linked Income Fund
(This page intentionally left blank.)
(This page intentionally left blank.)
(This page intentionally left blank.)
(This page intentionally left blank.)
(This page intentionally left blank.)
(This page intentionally left blank.)
(This page intentionally left blank.)
Western Asset
Inflation-Linked Income Fund
Trustees
William E.B. Siart
Chairman
Jane Trust
President and Chief Executive Officer
Christopher Berarducci
Treasurer and Principal Financial
Officer
Ted P. Becker
Chief Compliance Officer
Marc A. De Oliveira
Secretary and Chief Legal Officer
Thomas C. Mandia
Senior Vice President
Jeanne M. Kelly
Senior Vice President
Western Asset Inflation-Linked Income Fund
620 Eighth Avenue
47th Floor
New York, NY 10018
Western Asset Management Company, LLC
Western Asset Management Company Limited
Western Asset Management Company Pte. Ltd.
Western Asset Management Company Ltd
Franklin Templeton Fund Adviser, LLC
The Bank of New York Mellon
Computershare Inc.
P.O. Box 43006
Providence, RI 02940-3078
Independent registered public accounting firm
PricewaterhouseCoopers LLP
Baltimore, MD 21202
Ropes & Gray LLP
1211 Avenue of the Americas
New York, NY 10036
New York Stock Exchange Symbol
Franklin Templeton Funds Privacy and Security Notice
Your Privacy and the Security of Your Personal Information is Very Important to Us
This Privacy and Security Notice (the “Privacy Notice”) addresses the Funds’ privacy and data protection practices with respect to nonpublic personal information the Fund receives. The Legg Mason Funds include the Western Asset Money Market Funds (Funds) sold by the Funds’ distributor, Franklin Distributors, LLC, as well as Legg Mason-sponsored closed-end funds. The provisions of this Privacy Notice apply to your information both while you are a shareholder and after you are no longer invested with the Funds.
The Type of Nonpublic Personal Information the Funds Collect About You
The Funds collect and maintain nonpublic personal information about you in connection with your shareholder account. Such information may include, but is not limited to:
•
Personal information included on applications or other forms;
•
Account balances, transactions, and mutual fund holdings and positions;
•
Bank account information, legal documents, and identity verification documentation; and
•
Online account access user IDs, passwords, security challenge question responses.
How the Funds Use Nonpublic Personal Information About You
The Funds do not sell or share your nonpublic personal information with third parties or with affiliates for their marketing purposes, unless you have authorized the Funds to do so. The Funds do not disclose any nonpublic personal information about you except as may be required to perform transactions or services you have authorized or as permitted or required by law. The Funds may disclose information about you to:
•
Employees, agents, and affiliates on a “need to know” basis to enable the Funds to conduct ordinary business or to comply with obligations to government regulators;
•
Service providers, including the Funds’ affiliates, who assist the Funds as part of the ordinary course of business (such as printing, mailing services, or processing or servicing your account with us) or otherwise perform services on the Funds’ behalf, including companies that may perform statistical analysis, market research and marketing services solely for the Funds;
•
Permit access to transfer, whether in the United States or countries outside of the United States to such Funds’ employees, agents and affiliates and service providers as required to enable the Funds to conduct ordinary business, or to comply with obligations to government regulators;
•
The Funds’ representatives such as legal counsel, accountants and auditors to enable the Funds to conduct ordinary business, or to comply with obligations to government regulators;
•
Fiduciaries or representatives acting on your behalf, such as an IRA custodian or trustee of a grantor trust.
NOT PART OF THE SEMI-ANNUAL REPORT
Franklin Templeton Funds Privacy and Security Notice (cont’d) Except as otherwise permitted by applicable law, companies acting on the Funds’ behalf, including those outside the United States, are contractually obligated to keep nonpublic personal information the Funds provide to them confidential and to use the information the Funds share only to provide the services the Funds ask them to perform.
The Funds may disclose nonpublic personal information about you when necessary to enforce their rights or protect against fraud, or as permitted or required by applicable law, such as in connection with a law enforcement or regulatory request, subpoena, or similar legal process. In the event of a corporate action or in the event a Fund service provider changes, the Funds may be required to disclose your nonpublic personal information to third parties. While it is the Funds’ practice to obtain protections for disclosed information in these types of transactions, the Funds cannot guarantee their privacy policy will remain unchanged.
Keeping You Informed of the Funds’ Privacy and Security Practices
The Funds will notify you annually of their privacy policy as required by federal law. While the Funds reserve the right to modify this policy at any time, they will notify you promptly if this privacy policy changes.
The Funds’ Security Practices
The Funds maintain appropriate physical, electronic and procedural safeguards designed to guard your nonpublic personal information. The Funds’ internal data security policies restrict access to your nonpublic personal information to authorized employees, who may use your nonpublic personal information for Fund business purposes only.
Although the Funds strive to protect your nonpublic personal information, they cannot ensure or warrant the security of any information you provide or transmit to them, and you do so at your own risk. In the event of a breach of the confidentiality or security of your nonpublic personal information, the Funds will attempt to notify you as necessary so you can take appropriate protective steps. If you have consented to the Funds using electronic communications or electronic delivery of statements, they may notify you under such circumstances using the most current email address you have on record with them.
In order for the Funds to provide effective service to you, keeping your account information accurate is very important. If you believe that your account information is incomplete, not accurate or not current, if you have questions about the Funds’ privacy practices, or our use of your nonpublic personal information, write the Funds using the contact information on your account statements, email the Funds by clicking on the Contact Us section of the Funds’ website at www.franklintempleton.com, or contact the Funds at 1-877-721-1926 for the Western Asset Money Market Funds or 1-888-777-0102 for the Legg Mason-sponsored closed-end funds. For additional information related to certain state privacy rights, please visit https://www.franklintempleton.com/help/privacy-policy.
NOT PART OF THE SEMI-ANNUAL REPORT
Western Asset Inflation-Linked Income Fund
Western Asset Inflation-Linked Income Fund
620 Eighth Avenue
47th Floor
New York, NY 10018
Notice is hereby given in accordance with Section 23(c) of the Investment Company Act of 1940, as amended, that from time to time the Fund may purchase, at market prices, its common shares.
The Fund files its complete schedule of portfolio holdings with the Securities and Exchange Commission (“SEC”) for the first and third quarters of each fiscal year as an exhibit to its reports on Form N-PORT. The Fund’s Forms N-PORT are available on the SEC’s website at www.sec.gov. To obtain information on Form N-PORT, shareholders can call the Fund at 1-888-777-0102.
Information on how the Fund voted proxies relating to portfolio securities during the prior 12-month period ended June 30th of each year and a description of the policies and procedures that the Fund uses to determine how to vote proxies related to portfolio transactions are available (1) without charge, upon request, by calling 1-888-777-0102, (2) at www.franklintempleton.com and (3) on the SEC’s website at www.sec.gov.
Quarterly performance, semi-annual and annual reports, current net asset value and other information regarding the Fund may be found on Franklin Templeton’s website, which can be accessed at www.franklintempleton.com. Any reference to Franklin Templeton’s website in this report is intended to allow investors public access to information regarding the Fund and does not, and is not intended to, incorporate Franklin Templeton’s website in this report.
This report is transmitted to the shareholders of Western Asset Inflation-Linked Income Fund for their information. This is not a prospectus, circular or representation intended for use in the purchase of shares of the Fund or any securities mentioned in this report.
Computershare Inc.
P.O. Box 43006
Providence, RI 02940-3078
Not applicable.
| ITEM 3. | AUDIT COMMITTEE FINANCIAL EXPERT. |
Not applicable.
| ITEM 4. | PRINCIPAL ACCOUNTANT FEES AND SERVICES. |
Not applicable.
| ITEM 5. | AUDIT COMMITTEE OF LISTED REGISTRANTS. |
Not applicable.
| ITEM 6. | SCHEDULE OF INVESTMENTS. |
Included herein under Item 1.
| ITEM 7. | FINANCIAL STATEMENTS AND FINANCIAL HIGHLIGHTS FOR OPEN-END MANAGEMENT INVESTMENT COMPANIES. |
Not applicable.
| ITEM 8. | CHANGES IN AND DISAGREEMENTS WITH ACCOUNTANTS FOR OPEN-END MANAGEMENT INVESTMENT COMPANIES. |
Not applicable.
| ITEM 9. | PROXY DISCLOSURES FOR OPEN-END MANAGEMENT INVESTMENT COMPANIES. |
Not applicable.
| ITEM 10. | REMUNERATION PAID TO DIRECTORS, OFFICERS, AND OTHERS OF OPEN-END MANAGEMENT INVESTMENT COMPANIES. |
Not applicable.
| ITEM 11. | STATEMENT REGARDING BASIS FOR APPROVAL OF INVESTMENT ADVISORY CONTRACT. |
Not applicable.
| ITEM 12. | DISCLOSURE OF PROXY VOTING POLICIES AND PROCEDURES FOR CLOSED-END MANAGEMENT INVESTMENT COMPANIES. |
Not applicable.
| ITEM 13. | PORTFOLIO MANAGERS OF CLOSED-END MANAGEMENT INVESTMENT COMPANIES. |
Effective June 3, 2024, the individuals responsible for day-to-day portfolio management, development of investment strategy, oversight and coordination of the Fund are Michael Buchanan, Ken Leech and Frederick Marki.. These investment professionals, all of whom are employed by Western Asset Management Company work together with a broader investment management team.
| ITEM 14. | PURCHASES OF EQUITY SECURITIES BY CLOSED-END MANAGEMENT INVESTMENT COMPANY AND AFFILIATED PURCHASERS. |
Not applicable.
| ITEM 15. | SUBMISSION OF MATTERS TO A VOTE OF SECURITY HOLDERS. |
Not applicable.
| ITEM 16. | CONTROLS AND PROCEDURES. |
| (a) | The registrant’s principal executive officer and principal financial officer have concluded that the registrant’s disclosure controls and procedures (as defined in Rule 30a- 3(c) under the Investment Company Act of 1940, as amended (the “1940 Act”)) are effective as of a date within 90 days of the filing date of this report that includes the disclosure required by this paragraph, based on their evaluation of the disclosure controls and procedures required by Rule 30a-3(b) under the 1940 Act and 15d-15(b) under the Securities Exchange Act of 1934. |
| (b) | There were no changes in the registrant’s internal control over financial reporting (as defined in Rule 30a-3(d) under the 1940 Act) that occurred during the period covered by this report that have materially affected, or are likely to materially affect the registrant’s internal control over financial reporting. |
| ITEM 17. | DISCLOSURE OF SECURITIES LENDING ACTIVITIES FOR CLOSED-END MANAGEMENT INVESTMENT COMPANIES. |
Not applicable
| ITEM 18. | RECOVERY OF ERRONEOUSLY AWARDED COMPENSATION. |
| | (a) (1) | Not applicable. |
| | Exhibit 99.CODE ETH |
SIGNATURES
Pursuant to the requirements of the Securities Exchange Act of 1934 and the Investment Company Act of 1940, the registrant has duly caused this Report to be signed on its behalf by the undersigned, there unto duly authorized.
Western Asset Inflation-Linked Income Fund
| By: | /s/ Jane Trust | |
| | Jane Trust | |
| | President | |
| | | |
| Date: | July 25, 2024 | |
Pursuant to the requirements of the Securities Exchange Act of 1934 and the Investment Company Act of 1940, this report has been signed below by the following persons on behalf of the registrant and in the capacities and on the dates indicated.
| By: | /s/ Jane Trust | |
| | Jane Trust | |
| | President | |
| | | |
| Date: | July 25, 2024 | |
| By: | /s/ Christopher Berarducci | |
| | Christopher Berarducci | |
| | Principal Financial Officer | |
| | | |
| Date: | July 25, 2024 | |